Article

UAV Propeller Rotational Speed Measurement through FMCW Radars †

Information Engineering Department, Università Politecnica delle Marche, Via Brecce Bianche 12, 60131 Ancona, Italy
*
Author to whom correspondence should be addressed.
This paper is an extended version of our paper published in Proceedings of the 2022 IEEE 9th International Workshop on Metrology for AeroSpace (MetroAeroSpace), Pisa, Italy, 27–29 June 2022.
Remote Sens. 2023, 15(1), 270; https://doi.org/10.3390/rs15010270
Submission received: 30 November 2022 / Revised: 21 December 2022 / Accepted: 28 December 2022 / Published: 2 January 2023

Abstract

:
The growing number of civil applications in which Unmanned Aerial Vehicles (UAVs) are involved can create many concerns for airspace security and surveillance. Gathering as much information as possible about a drone can be crucial to apply proper countermeasures if a potentially dangerous situation is detected. Of course, the presence of a UAV can be detected by radar, but it is possible to extend the system capabilities to obtain additional information. For example, in the case in which the UAV is equipped with propellers, the radar-measured rotational speed could be important information to classify the type of UAV or to reveal if it is carrying some possibly harmful payload. In addition, the rotational speed measured through radar could be used for different purposes, such as to detect a drone manumission, to estimate its maximum payload, or for predictive maintenance of the drone. Measuring the propellers’ rotational speed with radar systems is a critical task, as the Doppler generated by the rotation can be very high, and it is very difficult to find commercial radar systems in the market able to handle such a high Doppler. Another problem is caused by the typically very small Radar Cross-Section (RCS) of the propellers, which makes their detection even more difficult. In the literature, common detection techniques are based on the measurement of the Doppler effect produced by the propellers to derive their rotational speed, but due to the very limited capabilities of commercial sensors, this approach can be applied only at very low values of the rotational speed. In this work, a different approach based on a Frequency-Modulated Continuous Wave (FMCW) radar is proposed, which exploits the vibration of the UAV generated by the rotation of the propellers. The phenomenon and how the sensor can detect it will be presented, which is joined with a performance analysis comparing different estimation techniques for the indirect measurement of the propellers’ speed to evaluate the potential benefits of the proposed approach.

1. Introduction

The industry of drones, also known as Unmanned Aerial Vehicles (UAVs), has rapidly grown in recent years, as drones make various applications easier, such as commercial delivery or mapping search and rescue operations [1,2,3]. UAVs are extensively used also in research, especially in contexts where they can speed up massive data collection and reduce the workload of the research teams. Advances in the field of drone technology, such as efficient algorithms to avoid obstacles and increased battery lifetime, joined with optimized structural design, allow to control the UAV beyond the visual line of sight, enabling the autopilot-based control and navigation functionalities not only in military scenarios but also for civil applications [4]. Unfortunately, however, as with any other kind of technology, drones may represent a potential threat to the community or the environment because of intentional illicit use or unintentional events that may happen. Ensuring the safety of the air space in the presence of drones is the biggest problem due to the risk of injuries that drones can bring to the general public. The potential use of UAVs for terrorist attacks against infrastructures and soft targets is a growing concern for those in charge of keeping cities and outdoor spaces safe, being drone technology nowadays globally available. On the other hand, even when used for benefit, drone-related accidents may happen: the drone can be a victim of jamming, or someone can try to override the control of the legitimate pilot [5,6,7,8].
Among the possible methods and techniques to detect drones and gather information about their characteristics and flight dynamics, radar signals can be used both for detection and classification purposes [9]. By exploiting the radar technology, it is possible not only to measure the drones’ velocity or distance but also to estimate their physical dimensions, for example by measuring their Radar Cross-Section (RCS) [10,11]. Additionally, the micro-Doppler component of the radar signal reflected by a drone can be properly extracted and processed to detect and classify different types of UAVs [12] as well as their characteristics (such as physical dimensions, number and type of drone propellers), eventually supported by the help of Machine Learning (ML) algorithms [13,14,15,16]. Measuring the propeller’s rotational speed of a radar-detected UAV can provide useful information to better understand the characteristics of the drone being detected. This is a very challenging task, and different approaches have been proposed to solve it. In [17], the authors present a method based on the analysis of the Doppler produced by the propellers, and they suggest the same technique can also allow us to measure the propeller’s length. The proposed method is very interesting, but the radar system used is a Continuous Wave Radar, and due to the fact that more than one single target can be present in the reference scenario, the approach can be very difficult to use in practical applications. Even in [18], a technique to measure the propeller’s dimensions and speed is proposed, which is based on the use not of a radar system but of a Lidar system. The problem with this method is the low speed of the propeller under test, which is equal to four rounds per second (corresponding to 240 rounds per minute (RPM)). A different approach is based on optical cameras: the image processing method proposed in [19] aims to extract the rotational speed of the propellers. In this case, the limitation of the method is related to the maximum allowable distance of the target, which is constrained, in its turn, by the technical characteristics of the camera optical sensor.
Radar-based detection is one of the best options to measure the propellers’ rotational speed if the UAV is far away from the sensor, and recent works developed and extended this approach from a static target to a moving one [20,21]. As a matter of fact, for drones equipped with propellers, information about their rotational speed may help in understanding if the UAV is carrying some kind of potentially harmful load. This is an important task if the radar system is employed to monitor the air space and detect any threats, as armed drones can be used in terrorist attacks or military situations. To this aim, in [15], the authors try to analyze the micro-Doppler effect generated by the propellers’ rotation to understand whether the detected UAV is carrying some weight or payload.
Differently from the mentioned approach, this paper presents a radar-based processing method to indirectly measure the propeller’s speed by analyzing the phase of the beat signal generated by the propeller vibration and propagating to the drone chassis. Laboratory experiments have been carried out to test the proposed approach, and the obtained results are promising.
The rest of the paper is organized as follows. Section 2 briefly presents how to measure and detect vibrations with a radar sensor, and in Section 3, the proposed experimental setup and signal processing technique applied to the radar signal are described. Section 4 and Section 5 presents the performed experimental activity and the obtained results, and finally, Section 6 provides some conclusive remarks and highlights possible future research developments.

2. Vibration Detection with Radar

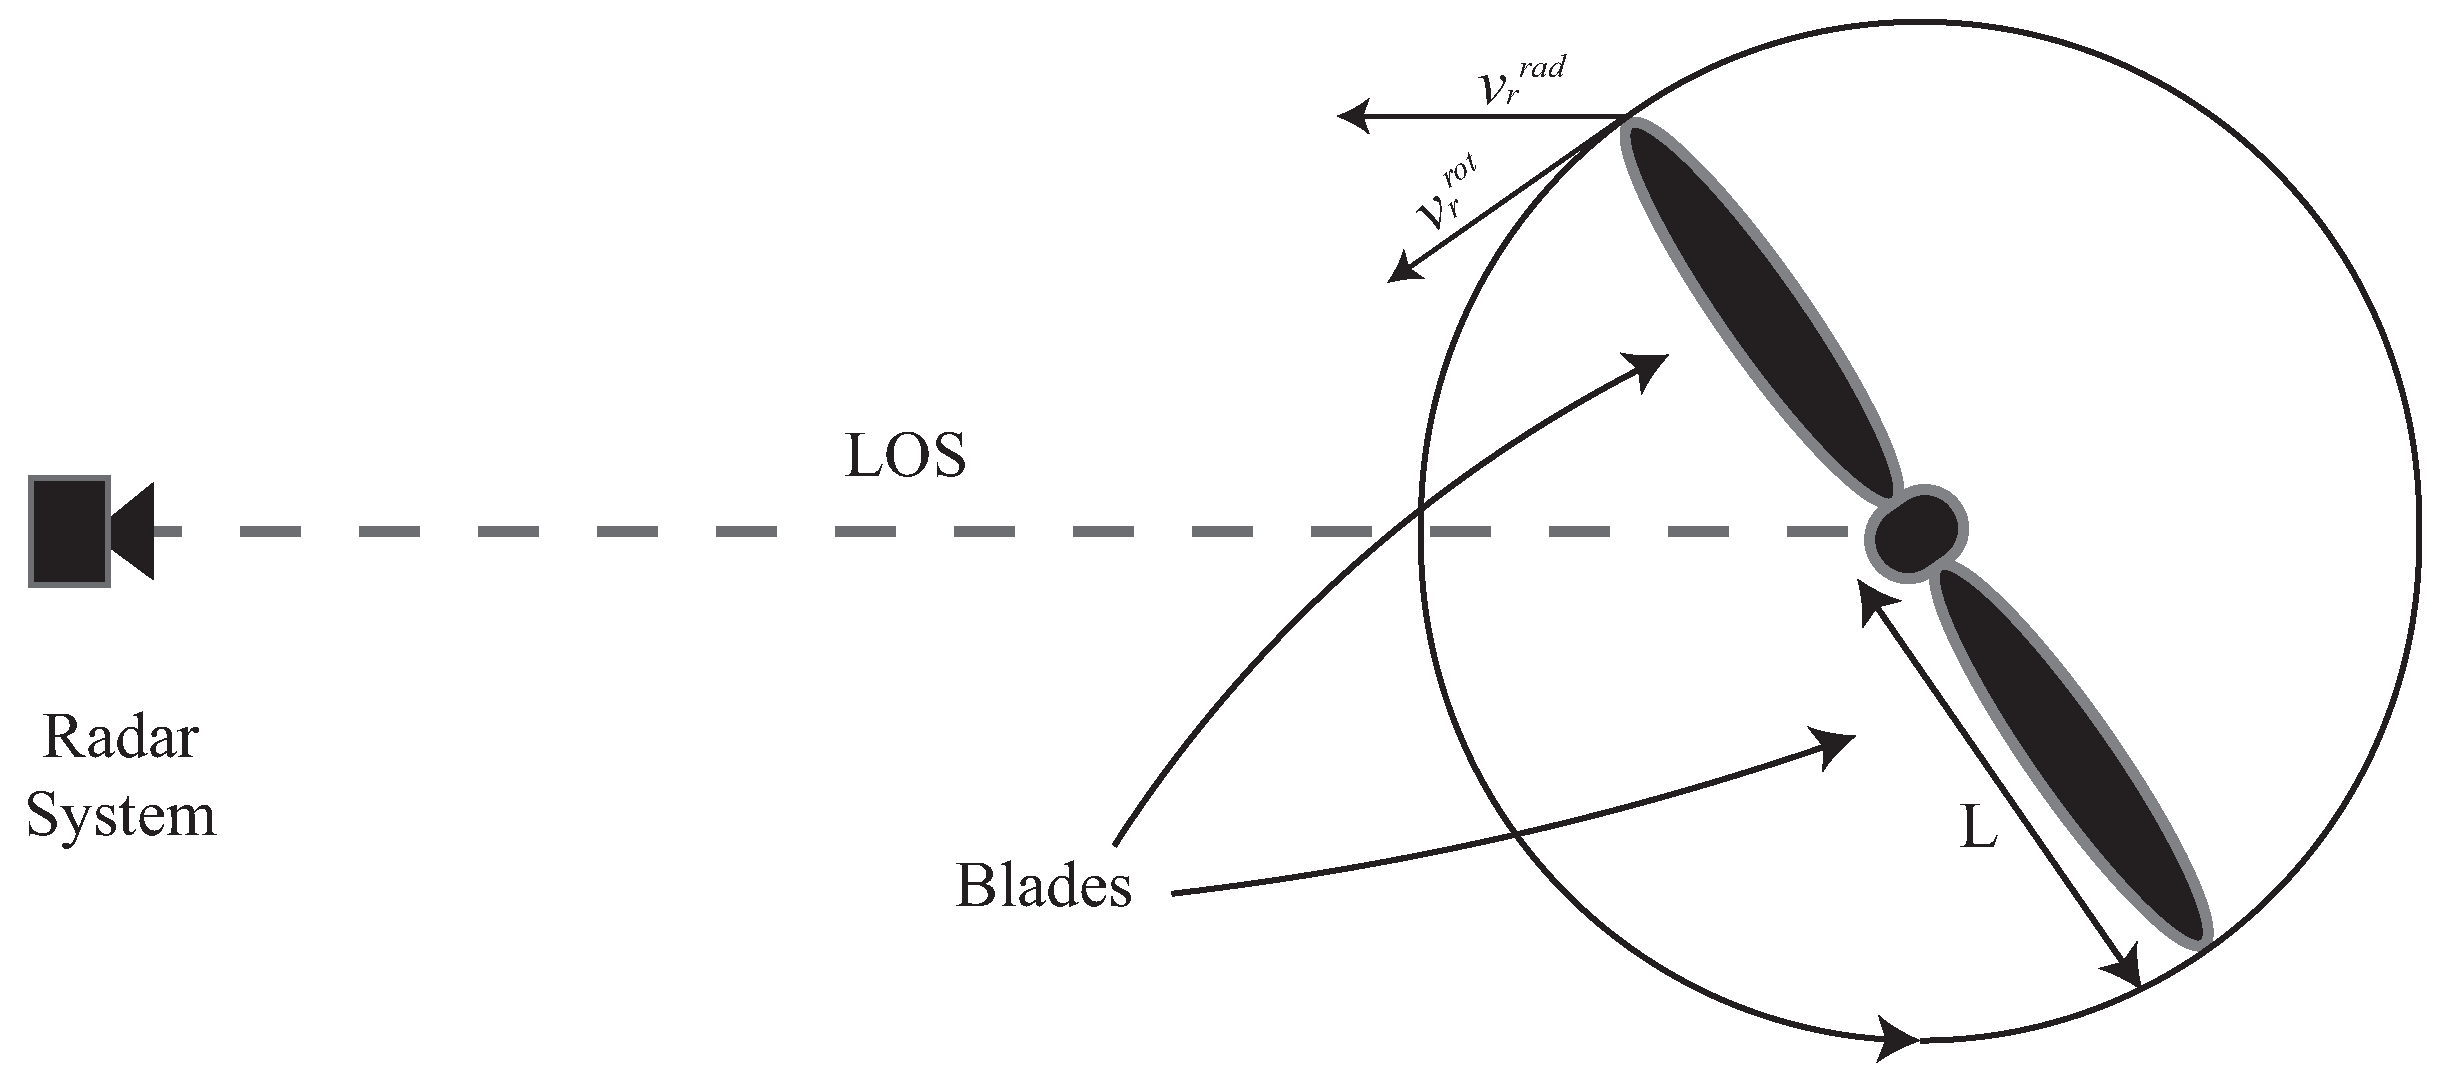
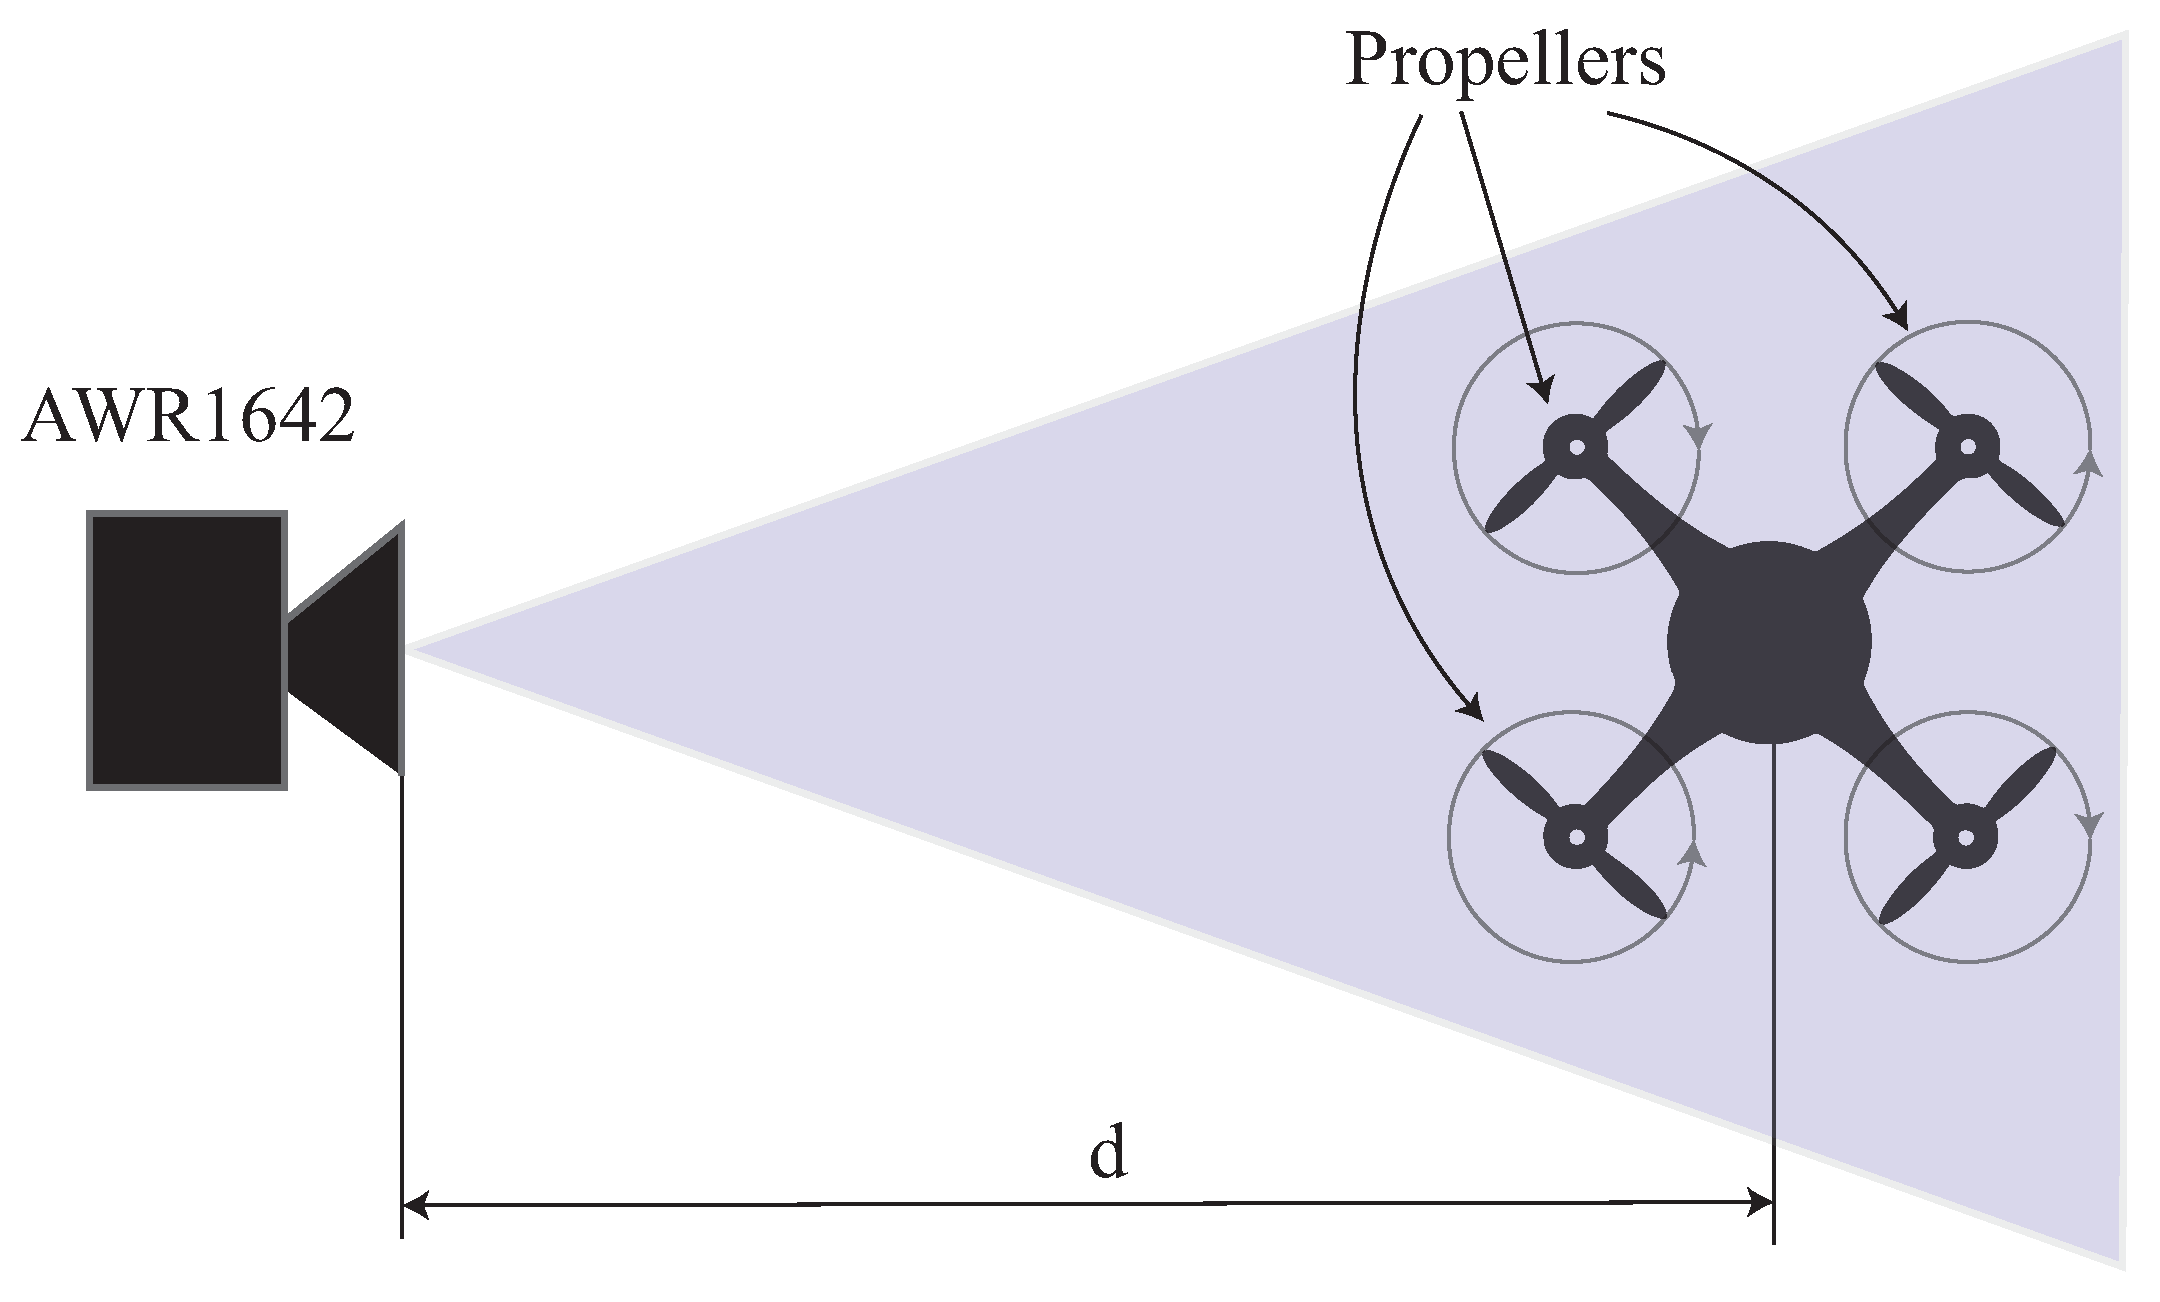
Measuring the rotational speed of a propeller is a very difficult task to perform with the common Doppler approach. A simple scheme of how to implement this operation by exploiting the Doppler effect is depicted in Figure 1.
Assuming that the propeller merely rotates and does not translate, the only Doppler component produced by the rotation is the micro-Doppler one. The Doppler shift produced by the rotation of the propeller is directly related to the rotational speed; by measuring the former term, it is possible to obtain the latter, but to this aim, the length of the propeller L is a necessary piece of information [22]. For a better understanding of radar characteristics that can be exploited to measure the rotational speed, some analyses based on real components of commercial drones can be performed.
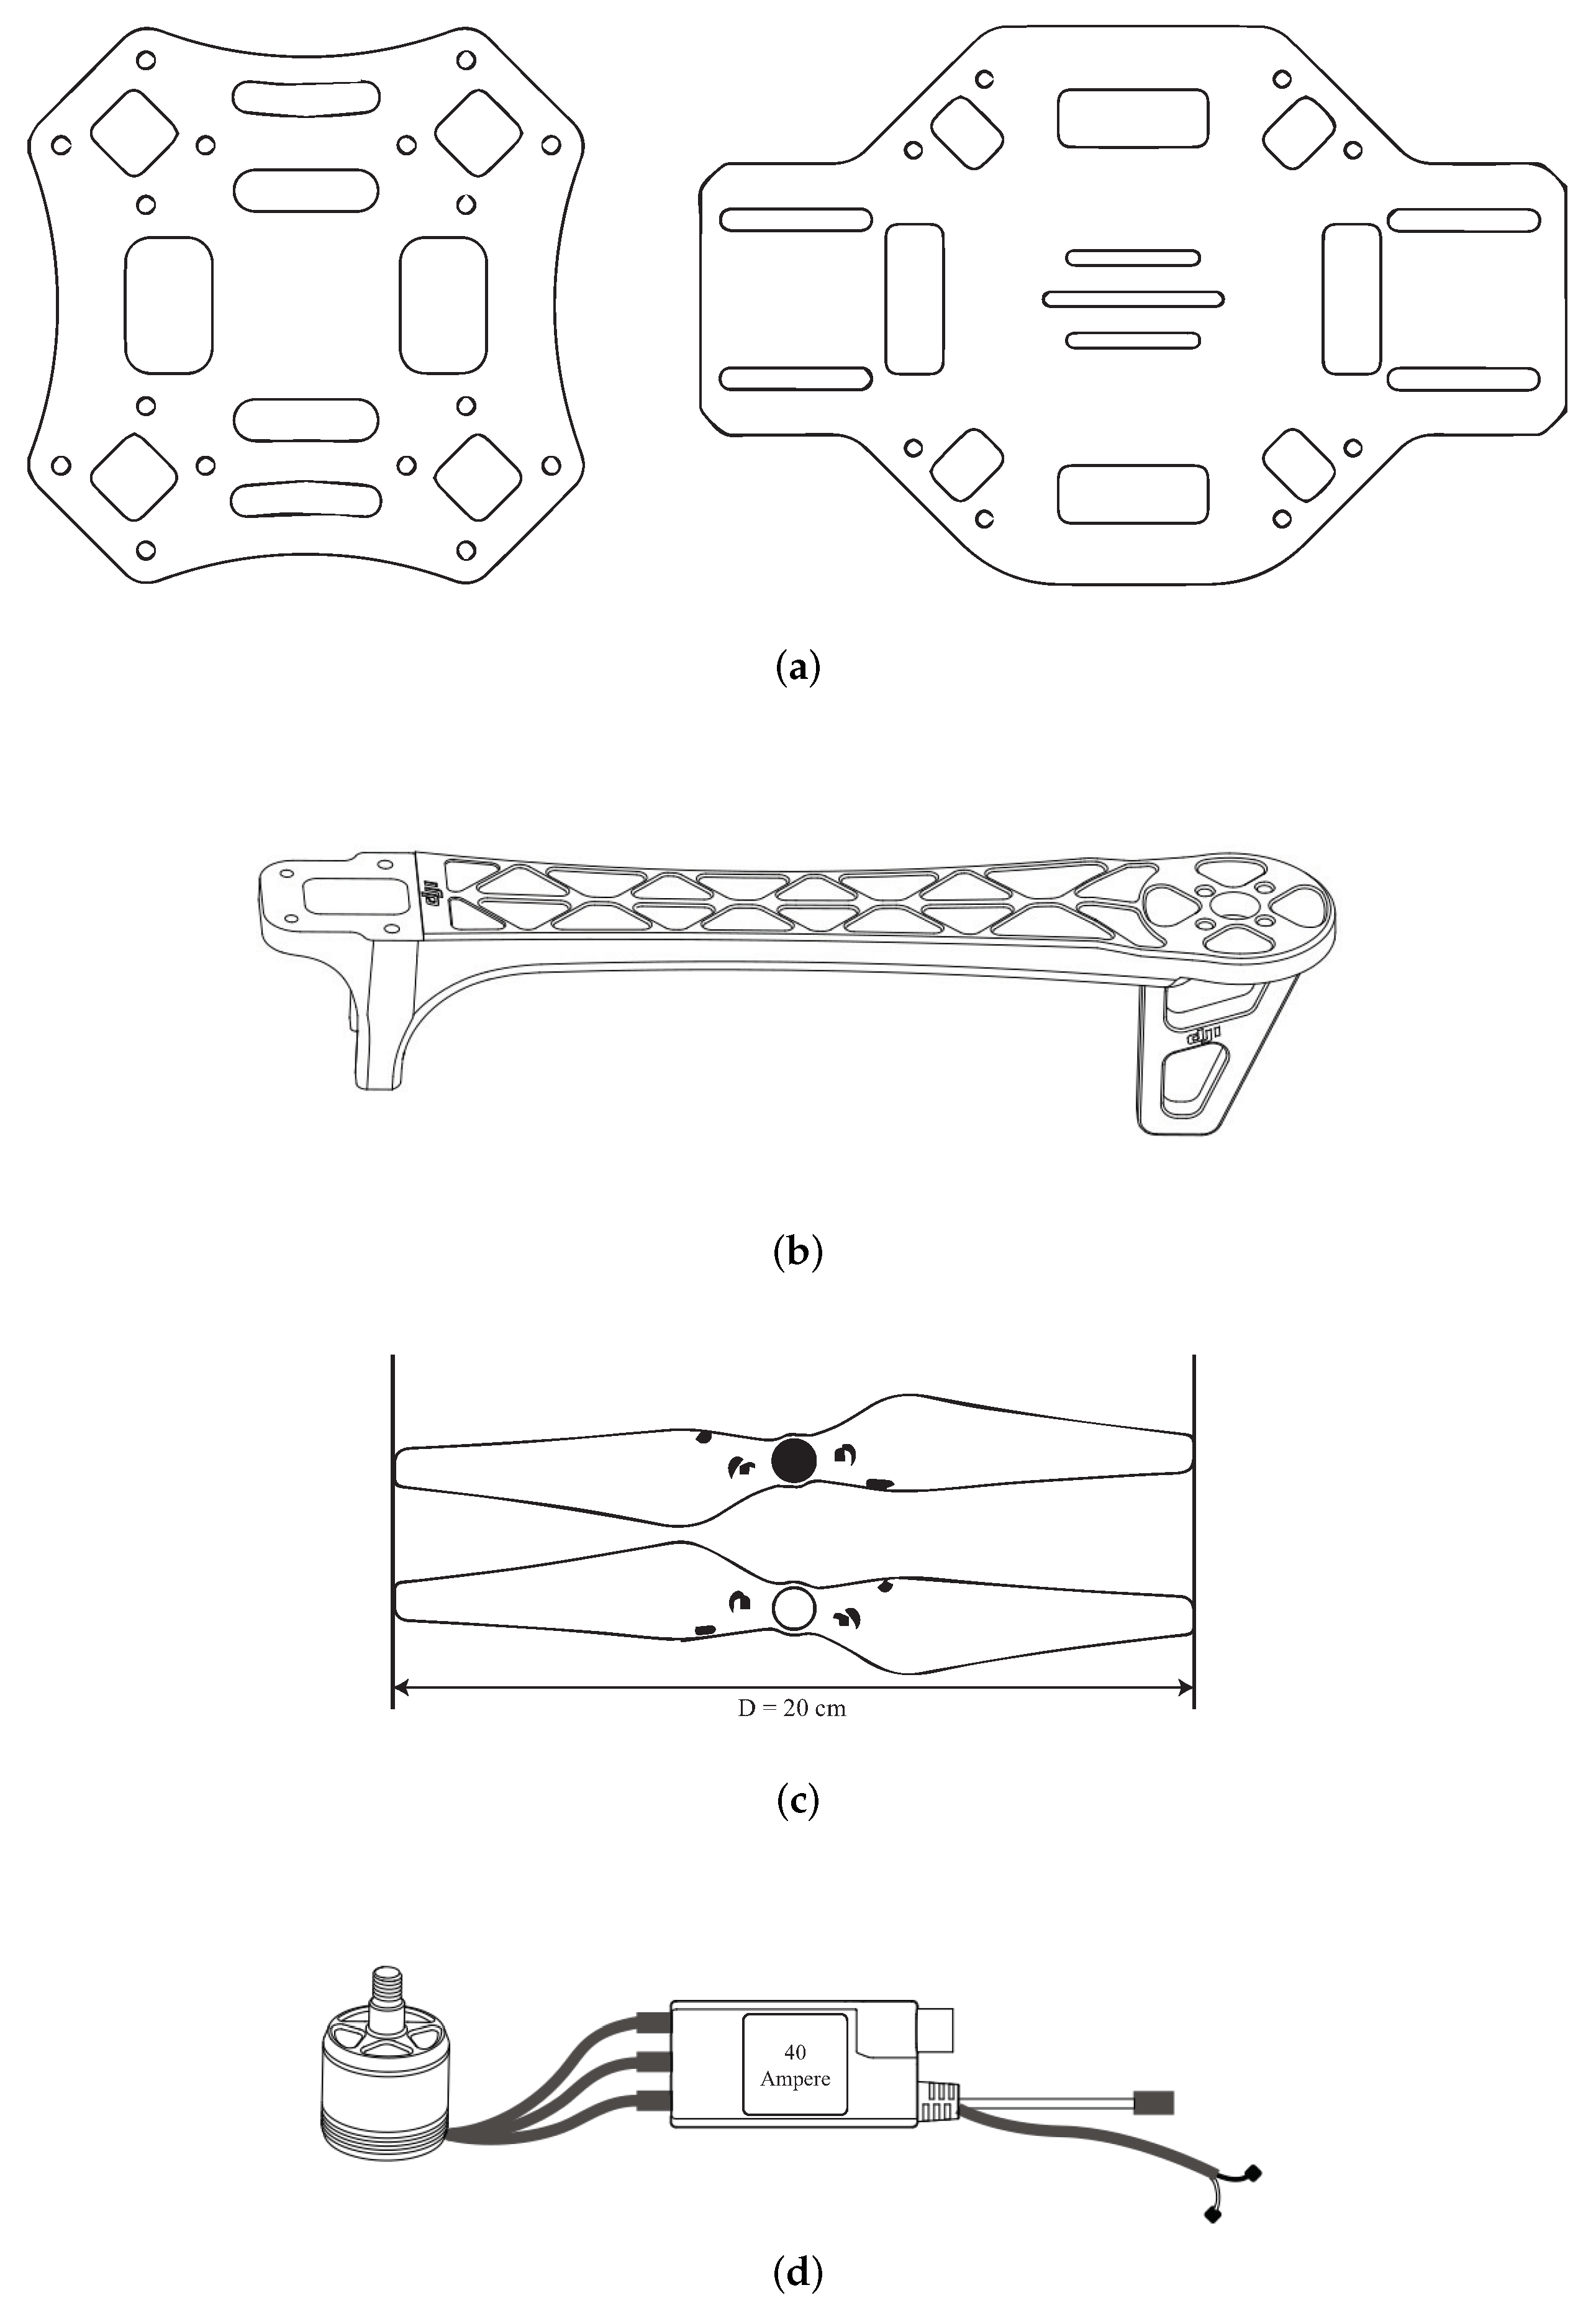
The frame of the drone used in this work has a longitudinal dimension of 45 cm, and the two-blades propellers have a 20 cm long diameter. The drone is equipped with four motors featuring K v = 1000 RPM/V, meaning that they can rotate at 1000 Rounds Per Minute (RPM) for each 1 V of supplied battery voltage. In this case, an 11 V battery is used, so a maximum rotational speed of 11,000 RPM can be obtained. From these values, it is possible to compute the maximum Doppler shift generated by the propellers as follows:
| f d | = 2 λ · v r r a d = 4 f c L v R P M π c · 60
where f d is the maximum Doppler shift given in Hz, v r r a d is the radial velocity measured in m/s, λ represents the radar signal wavelength measured in m, L is half the diameter of the propellers given in m, c is the speed of light in m/s, and v R P M is the rotational velocity expressed in RPM. For example, if we consider a propeller with a diameter of 20 cm at 11,100 RPM, the Doppler shift is f d = 58,100 Hz. To measure this rotational velocity, the radar sensor needs a Pulse Repetition Interval (PRI) shorter than 8.6 ns. This is very difficult to achieve with a commercial system, and it becomes possible only in the case where the propeller rotates at much lower speed [23].
To reveal and measure the propellers’ rotational speed, it is possible to exploit the effects of vibrations and the features they provide to the radar signals. Monitoring propellers’ vibrations is an important task for a UAV designer; vibrations can be generated by an unbalanced propeller and can affect the performance of the UAV. However, vibrations are not only caused by structural defects, but they are intrinsic to the propeller rotation. For this reason, huge efforts are made to design propellers featuring very small vibrations or advanced control systems that aim to reduce their impact on the drone performance [24,25,
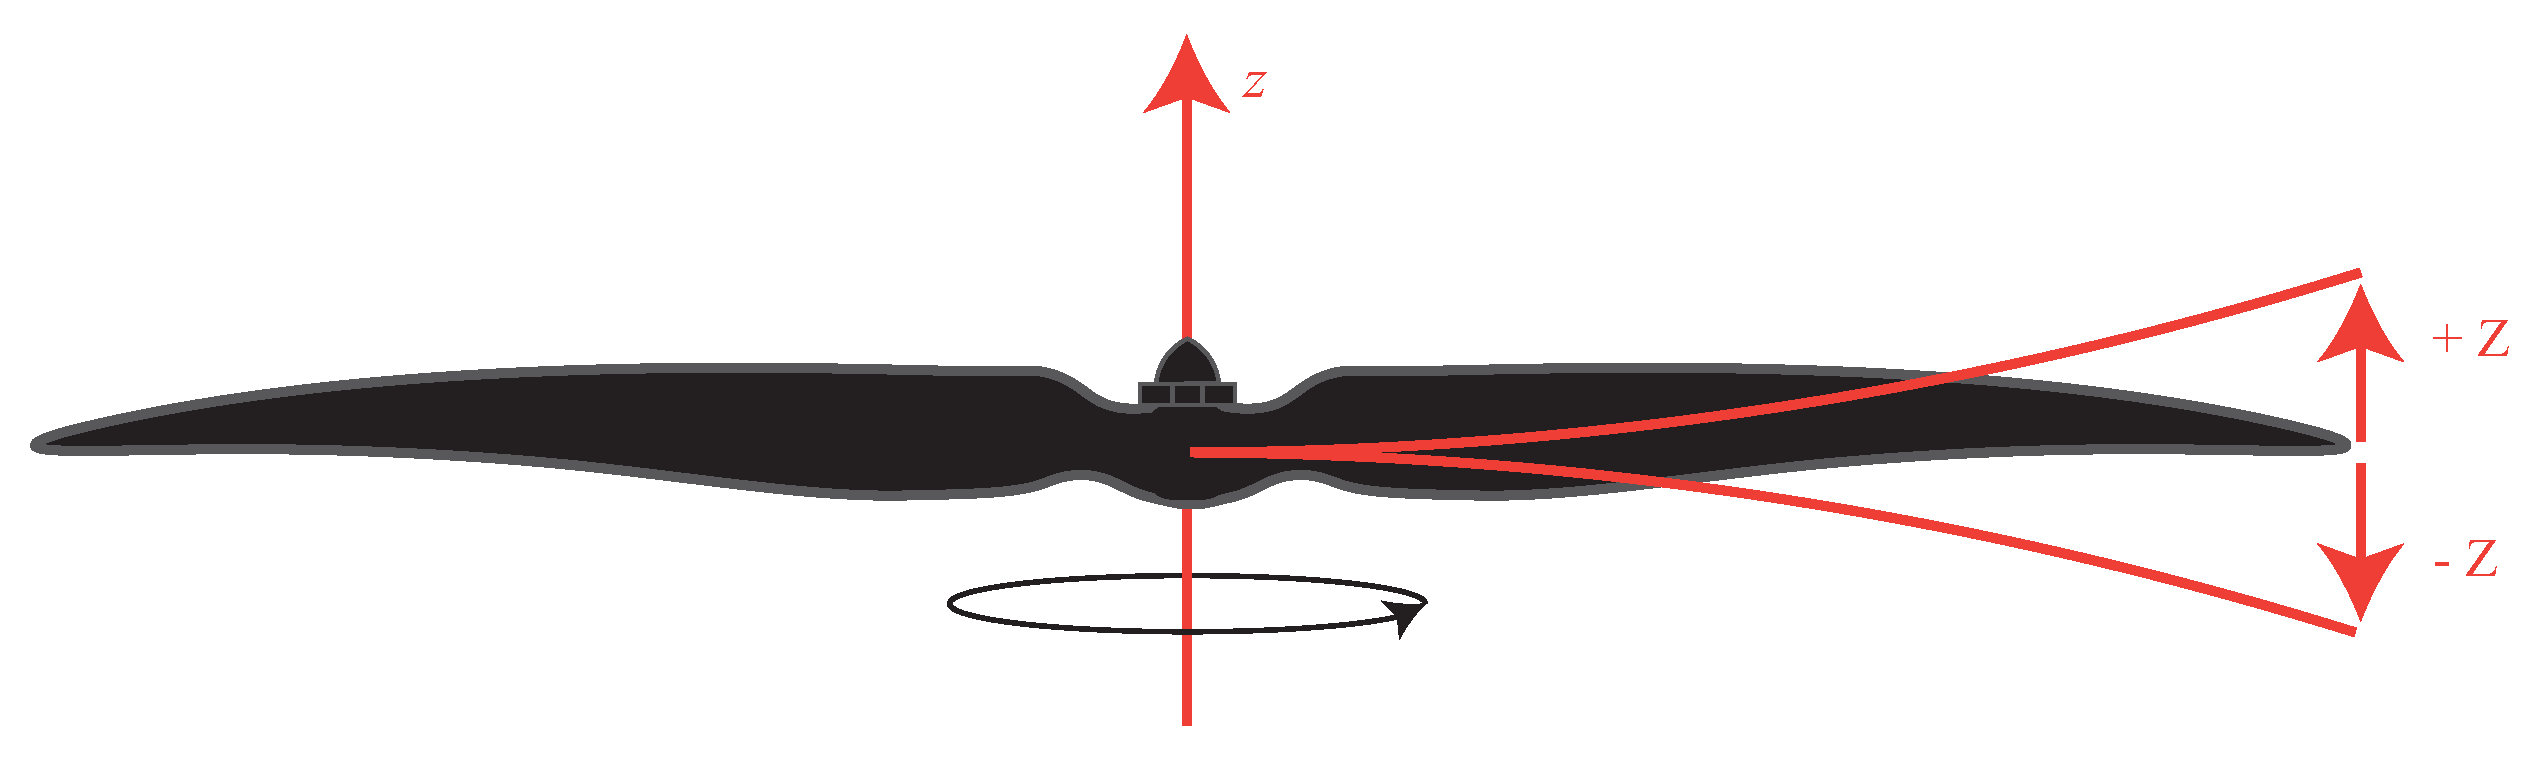
26]. The effect of a propeller vibration is depicted in Figure 2, where z is the reference axis, and + Z and Z is the propeller displacement, due to its vibration along the direction orthogonal to the rotation plane.
Despite being a big problem for drones, from the radar system point of view, the vibration of the propeller is a phenomenon that can be leveraged to indirectly measure the propeller’s rotational speed. In fact, propellers’ vibrations propagate to the whole drone chassis, and it is possible to try to measure its resulting displacement and relate it to the type and number of propellers the drone is equipped with. Assuming that the system is not ideal, the vibration induced by the propeller on the chassis will not only be along the z-axis (see Figure 2), but there will be a component also in the direction radial to the pointing direction of the radar system. This component, if detected, can be correlated to the rotation speed of the propellers and consequently used to measure its value.
To understand how to perform the process described above with a radar sensor, it is possible to start from a setup where a generic vibrating target is present in the detection field of the radar. In this case, the sensor can not only detect the target but also measure its vibration-related displacement. No matter what type of radar is used, this effect is always present if the target has moving parts, such as the propellers of a UAV, or if the target itself vibrates [27]. In fact, the micro-Doppler effect is exploited in different application fields from target classification to vibration measurement. For example, it is exploited to measure vital parameters of a person or to monitor the health conditions of a building or infrastructure [28,29,30,
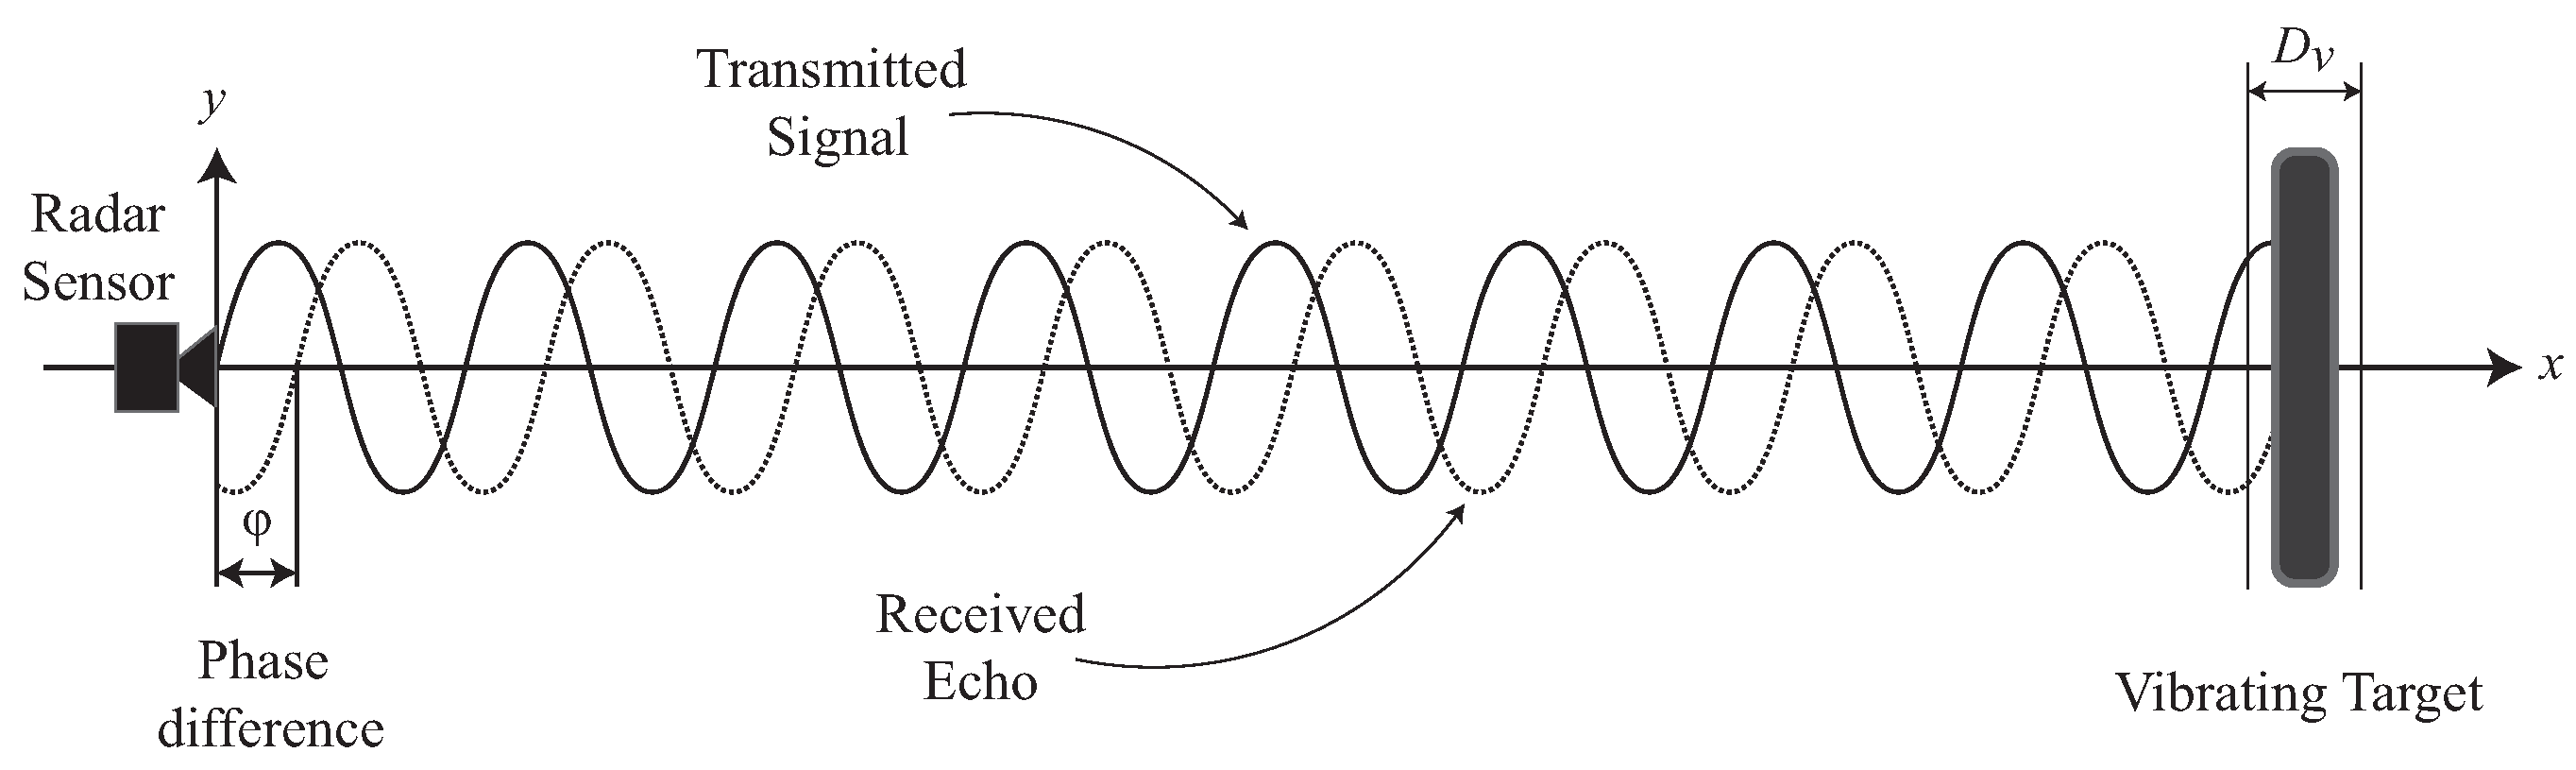
31]. The model of the micro-Doppler effect of a vibrating target can be derived from the classical Doppler formulation: it is presented in [32,33,34] and schematized in Figure 3.
In general, vibrations of a target take place not only along the radial direction of the radar wave-front, but this is the only direction along which the sensor can detect vibrations. As a consequence, a vibration of the drone chassis generated by one or more propellers can be detected only through its radial component. As such, for the sake of simplicity, only the radial component of the target vibration is considered in the model. Such a component can be identified by two parameters: the main vibration frequency f v , and the displacement D v . The frequency is composed by several terms, but in order to simplify the model, only a single term will be considered. The evolution of displacement over time can be therefore written as:
D ( t ) = D v · sin ( 2 π f v t )
By naming the distance between the radar and the target as R 0 , the range distance can vary according to the law R ( t ) = R 0 + D ( t ) , so the received signal can be written as:
s ( t ) = ρ · exp j 2 π f 0 t + 4 π R ( t ) λ = ρ · exp j 2 π f 0 t + Ψ ( t )
where ρ is the backscattering coefficient, f 0 is the carrier frequency, λ is the wavelength and Ψ ( t ) is the phase term. For a propeller, ρ is a very small value, so the radar system needs a specific design to be able to work with such a reduced RCS [35]. This is an additional reason motivating the development of other methods to measure the propeller speed. The term R ( t ) can be replaced in Equation (3), obtaining the resulting s ( t ) as:
s ( t ) = ρ · exp j 2 π f 0 t + 4 π R 0 λ + 4 π λ D v sin ( 2 π f v t )
Equation (4) includes two terms: the main distance R 0 and the displacement vibration of the target. To extract the micro-Doppler effect related to the vibration, it is possible to replace 2 π f v with ω v , and the micro-Doppler takes the form:
s m D ( t ) = 4 π D v λ sin ( ω v t )
The generated micro-Doppler vibration frequency can be exploited to detect the propeller’s rotational speed.

3. Proposed Setup and Methodology

This section presents the measurement setup used to validate the developed signal processing technique. The proposed methodology is related to the use of a Frequency-Modulated Continuous Wave (FMCW) automotive radar, which is the type of technology applied in this work. Since the sensor used is not designed for aerial surveillance, the setup is relative to the detection capabilities of the sensor involved.

3.1. Measurement Setup

The radar employed in this work is the Texas Instruments AWR1642 [36], as shown in Figure 4. This is an FMCW radar designed for the automotive market, using a working bandwidth from 76 to 81 GHz. The frequency range is divided in two operational sub-bands: from 76 to 81 GHz for short-range applications, and from 76 to 77 GHz for long-range applications. The automotive application for which this specific radar is designed also requires angular position detection of the target. For this reason, the radar is equipped with two transmitters and two receivers so that Multiple In Multiple Out (MIMO) technology can be implemented.
The sensor is designed to directly provide the computation results of the Digital Signal Processor (DSP) on the output ports. These are the Controller Area Network (CAN) and the Universal Asynchronous Receiver–Transmitter (UART) ports, and from each of them, it is possible to read the position and the velocity of the revealed targets. Since in this work, the proposed technique is based on the raw samples output from the Analog-to-Digital Converters (ADCs), a second Field-Programmable Gate Array (FPGA) board, namely a DCA 1000 EVM [37], is connected to the Low-Voltage Differential Signaling (LVDS) bus. At this point, the raw samples of the beat signals can be stored on a computer for offline data processing. This particular type of FMCW radar transmits chirp signals grouped by frame. It is possible to transmit a configurable number of chirps within each frame, and each frame can be used to compute the range-Doppler map from which the distance and velocity of the target can be obtained. This modulation scheme is also used in systems sometimes known as Pulsed Linear Frequency Continuous Wave radars, as they only transmit up-chirps separated by a certain waiting time. Principles of FMCW radars are reported in [38,39]. The considered device can be configured to fit different performance figures: for example, to monitor different velocities or range distances of the targets. To these aims, it is possible to change many parameters of the chirps transmitted by the sensor. In Figure 5, these parameters are explained by a graphical representation.
A description of the parameters can be summarized as follows:
  • Idle Time: the time required for the ramp generator to return to its original state;
  • ADC Valid Start Time: idle time used to remove data at the very beginning of the ramp. This way, we can improve system linearity and reduce distortion in the beat signal;
  • ADC Sampling Time: the amount of time during which ADC samples the beat signal;
  • Used Radar Bandwidth: the effective radar bandwidth once the initial part of the ramp has been removed.
It is interesting to highlight some of the implementation characteristics of the device. The ADC starts to collect the samples at the end of the ADC Valid Start Time and samples the beat signal for a time, namely the ADC Sampling Time, which depends on the number of samples used inside each chirp, and on the sampling frequency. So, the ADC Sampling Time can be written as follows:
ADC Sampling Time = f s a m p l i n g · n s a m p l e s
where f s a m p l i n g is the sampling frequency of the ADCs, n s a m p l e s is the number of samples collected, and both parameters are configurable by the user. This operating mode means that the real bandwidth of the chirp, which is called Used Radar Bandwidth in the figure, is always less than the maximum obtainable Total Radar Bandwidth.
The radar transmits a series of chirps: the start frequency is 77 GHz and the stop frequency depends on the radar configuration, but it can reach a maximum of 81 GHz. Frames are used to organize chirps transmission; each frame can contain at least 1 chirp up to a maximum of 255. In this work, a frame with a single chirp is used. The AWR1642 is also a MIMO radar, so it is possible to exploit also the angular discrimination of the target to improve the performance of the proposed technique [40,41,42].
The sensor board and the FPGA board are connected together by a 60-pin ribbon cable. By means of two USB cables, the boards are then connected to a computer, where the configuration User Interface (UI) and the processing scripts are executed. By these cables, the configuration parameters, as well as the start acquisition command, are sent from the UI to the boards. During the acquisition, the raw samples of the beat signal are sent from the FPGA to the computer over User Datagram Protocol (UDP) packets. Both the boards use a power supply of 5 V. The connection scheme is reported in Figure 6.
The measurement setup consists of the radar system and a non-commercial drone assembled in our laboratory, so that it is possible to have total control of the drone characteristics, such as changing the number and type of propellers, and their rotational speed. The frame of the drone is a DJI F450 equipped with four motor slots, so that it is possible to change the part of the setup related to the drone. The frame has a wheelbase of length equal to 45 cm, that is made of plastic material for the harms, and conductive metal and plastic for the center part. The other components used to assembly the drone are:
  • Four motors with K v = 1000 RPM/V;
  • Four 20 cm-long propellers;
  • A 11 V LiPo battery;
  • An Arduino-based flight controller;
  • A 40 A Electronic Speed Controller (ESC) driver;
  • A 2.4 GHz radio controller.
All these items are depicted in Figure 7. With such configuration, the maximum rotational speed of the propeller is 11,000 RPM, so a maximum vibration frequency of 183.333 Hz can be obtained.
In all test cases, the drone and the radar system stand on tripods positioned at more or less the same height, since the radar system is designed to detect objects on its azimuth and the radiation diagram along the elevation is 40 degrees at −3 dB. It would be also possible to simulate a tilted position of the drone since the tripods are adjustable on three axes. Both the systems are not moving, so they stand at the same distance during all the time needed for the measurements. A top view of the measurement setup is depicted in Figure 8.
The choice of radar configuration parameters represents a trade-off between the focus of the work and the physical characteristics of the sensor. The configuration is determined by the measurement area, the length of the drone chassis, and the maximum frequency value of the vibrations. As stated before, parameters such as Idle Time and ADC Valid Start Time are related to the proper functioning of the sensor. The values of the parameters used in this work are reported in Table 1: t p e r i o d i c i t y represents the pulse repetition interval, n c h i r p T o t is the total number of transmitted chirps, n A D C S a m p l e s is the number of samples used inside each transmitted chirp and f S a m p l i n g is the sampling frequency of the analog-to-digital converters. The last two parameters affect the Used Radar Bandwidth, since the actual time in which the beat signal is sampled depends on the number of samples and on the sampling time.
With this choice of parameters, the maximum range of detectable targets is 4.285 m with a resolution of 0.067 m. The maximum detectable vibration frequency can be computed as:
f m a x V i b = 1 t p e r i o d i c i t y = 512 Hz
where t p e r i o d i c i t y is the frame duration. The sensor transmits chirps grouped by frame and since a value of the vibration signal is collected at each transmitted chirp, only one chirp is transmitted within a frame. The sampling frequency can then be calculated as shown in Equation (7).

3.2. Proposed Radar Signal Processing Technique

The processing of the raw samples provided by the radar board starts with their reorganization. The sensor has four receiver lines; a beat signal is sampled by each of them, and the samples are stored on a computer. To obtain the propeller’s rotational speed (in RPM), the data must be rearranged into a data cube in which the samples of each chirp are stored along the so-called Fast-Time, the different chirps are stored along the Slow-Time, and such a matrix can be obtained for each receiving line. This way, a data cube is obtained for each frame. In this work, only one chirp per frame is transmitted, and the data cube can be considered for the total acquisition time [43].
In general, a radar sensor is able to detect small vibrations, but the technique that allows to do that changes from one radar type to another. With FMCW radars, the vibration can be extracted from the phase of the beat signal [44]. In the specific case of the sensor used in this work, only up-chirps will be transmitted. Up-chirps are intended as chirps with a frequency slope that can be only positive, so from one transmission to another, the signal frequency always starts from f s t a r t and not from f s t o p , as it happens in general in FMCW radars where up-chirp and down-chirp are transmitted consecutively, realizing a continuous wave. A single chirp can be modeled as:
s T ( t ) = exp j 2 π f 0 t + π B T t 2 + ϕ 0
where f 0 is the starting frequency, t is the Fast-Time, ϕ 0 is the signal phase, B is the bandwidth, and T is the chirp time. The back-scattered signal can be written as:
s R ( t ) = ρ · exp j 2 π f 0 ( t τ ) + π B T ( t τ ) 2 + ϕ 0
where τ is the travel delay from the transmitting time, which is related to the distance according to:
τ = 2 R ( t ) c = 2 [ R 0 + x ( t ) ] c
The beat signal sampled from the ADCs is obtained by multiplying the transmitted and the received signal as:
s b ( t ) ρ · exp j ( 2 π B T τ t + 2 π f 0 τ )
The term τ 2 from Equation (9) turns out to be much smaller than τ t and x ( t ) . For this reason, we can approximate Equation (11) to a simpler form. Such a signal can also be written in terms of Fast-Time (t) and Slow-Time ( i T ) [44] as:
s b ( i T + t ) ρ · exp j 4 π B T R 0 c t + 4 π f 0 R 0 c + ( 4 π B T t c + 4 π f 0 c ) x ( i T ) ρ · exp j ( 2 π f b t + Ψ i )
The sensor can measure the vibration of an object because this information is contained in the phase signal. The temporal evolution of this parameter can be seen as a vibration signal which can be also converted into displacement. The relationship between phase and displacement is given by:
Ψ i = 4 π R 0 λ 0 + 4 π x ( i T ) λ c
where R 0 is the target distance from the radar source, x ( i T ) is the displacement signal, and λ 0 and λ c are the wavelengths of the initial chirp and the central chirp, respectively.
The minimum detectable phase is:
Δ Ψ = λ c 4 π Δ x
where Δ x is the minimum target displacement able to generate a phase variation.
More than a target may be present in the measurement area, so the beat signals are composed of many terms, each one related to a detected target. The beat signal can be modeled as a sum along the range–azimuth ( R , Θ ) plane according to [34]:
s b ( R , Θ ) = r = 1 R m θ = 1 θ n s b r θ
where R m is the number of range bins in the range direction and θ n is the number of angular bins, which depends on the angular resolution of the radar and the MIMO configuration.
Following the theoretical relationships developed up to this point, the raw samples are stored inside a global data cube. To obtain the range–angular detection map, a bi-dimensional Fast Fourier Transform (FFT) is computed. An example can be found in Figure 9.
Once the position of the target is clearly identified in the map, it is possible to extract the phase information by selecting the bins where the target stands and extracting a vector along the Slow-Time, as illustrated in Figure 10.
The phase information can be used to calculate the propellers’ speed by computing the FFT. Since the signal in this application case suffers from a lot of noise, the MUltiple SIgnal Classification (MUSIC) algorithm can be applied to mitigate this effect [42,45,46,47]. The MUSIC algorithm is a technique applied in radar systems to improve their angular detection capabilities. The algorithm can be applied to calculate the so-called pseudo-spectrum of the signal, which leads to a simpler detection of the main harmonic components, and in the application under study, it makes it simpler to detect the propeller’s speed. Starting from the vibration signal x ( i T ) , the same can be written as a sum of r sinusoidal components:
x ( i T ) = k = 1 r A k · x k ( i T ) + w ( i T )
where x k is the single component, w ( i T ) is the noise and A k is the amplitude. The term x ( i T ) can be called x ˜ for the sake of simplicity and written in a discrete form as:
x ˜ ( n ) = A ( n ) · S ( n ) + W ( n ) , W I T H n = 0 , , M
where M is the number of samples of the signal, while a ( n k ) and A ( n ) are defined as:
a ( n k ) = [ 1 , e j ω k , e j ( M 1 ) ω k ] T
A ( n ) = [ a ( n 1 ) , a ( n 2 ) , , a ( n r ) ]
When the signals are uncorrelated with the noise, the total signal covariance matrix has two components: namely, the signal covariance matrix and the noise covariance matrix:
R E { x ˜ ( n ) x ˜ * ( n ) } = A P A H + σ n 2 I
being P = E { s s H } the signal covariance matrix. It is possible to decompose R as [48]:
R = U Σ U H = [ U s , U n ] · Σ 0 0 σ n 2 I M r · U s H U n H
where U n is the noise subspace and U s is the signal subspace. The pseudo-spectrum can be computed as:
P ( n ) = 1 a H ( n ) U n U n H a ( n )
To understand the improvement brought by this second approach, Figure 11 shows an example of application of this technique to the front axis of the drone with a two-propellers stand. By looking at Figure 11, the signal peaks are easily detectable, and both the vibration frequencies are clearly identifiable. Multiplying the frequency value corresponding to the peak by the number of seconds in a minute, it is possible to convert it into the rotational speed value expressed in RPMs.

4. Experimental Test and Results

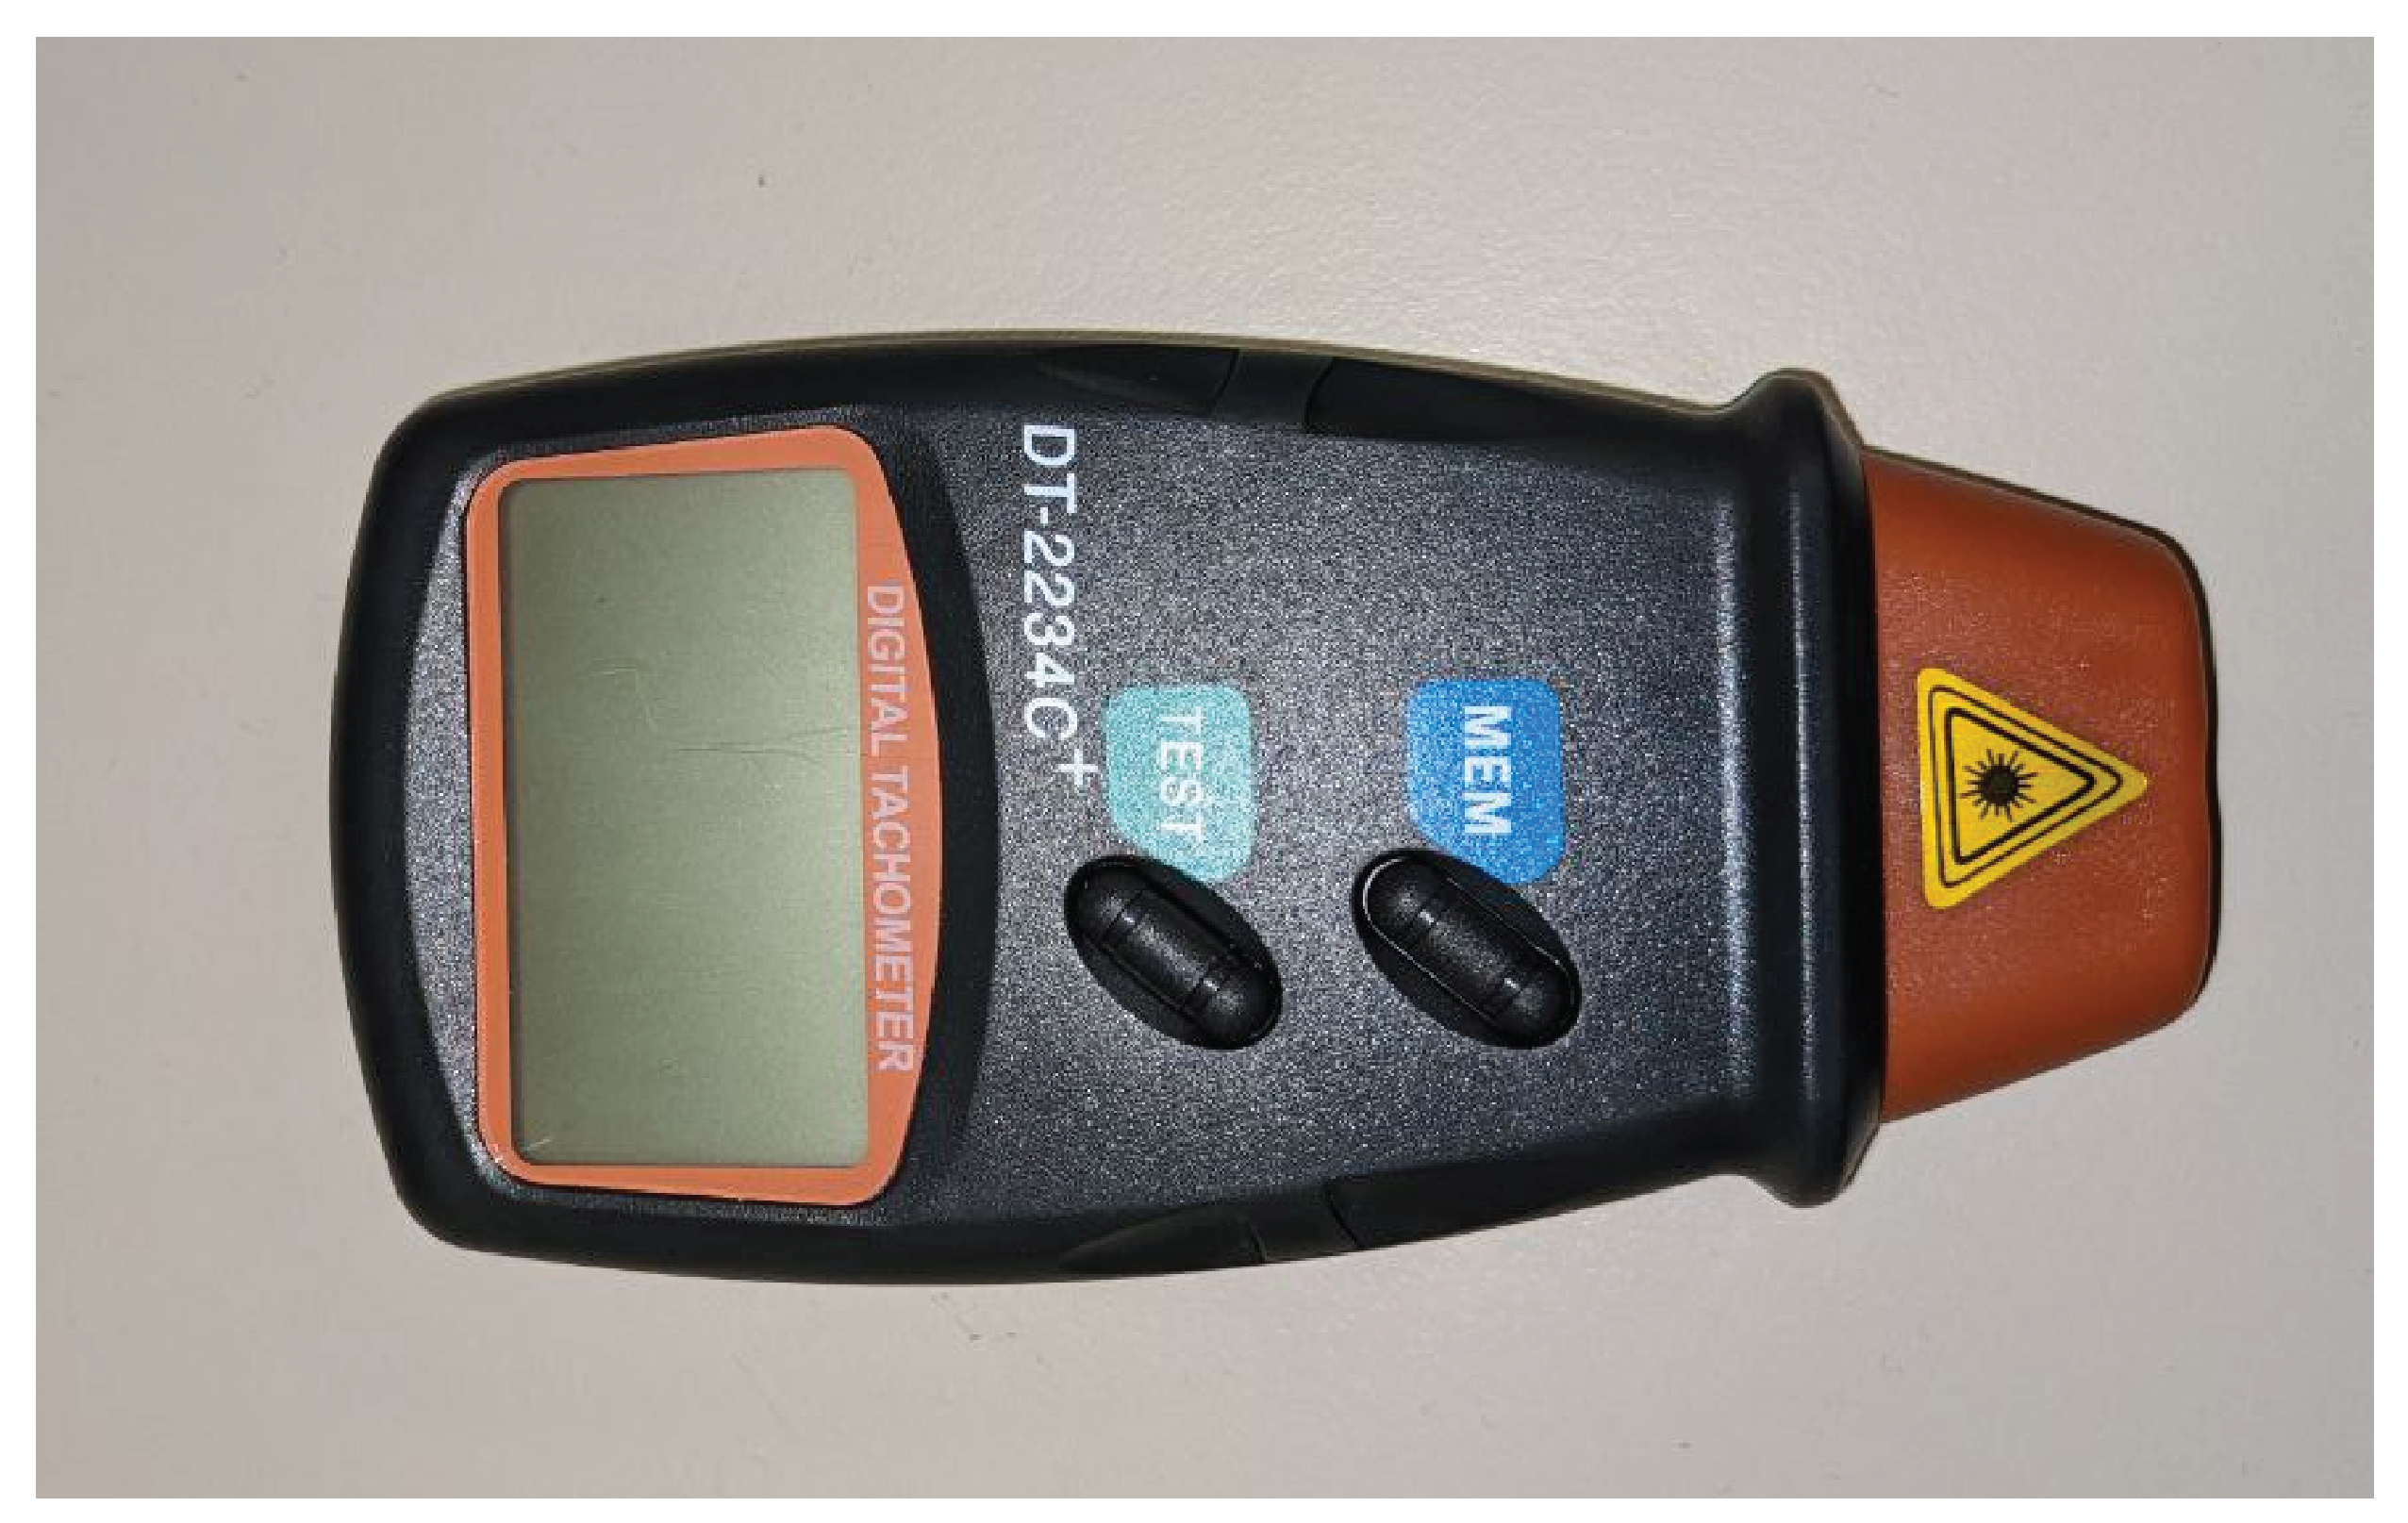
Several tests are performed to carry out the measurement of the propellers’ speed. To run the tests, propellers are covered with aluminum tape in order to improve their RCS. This is necessary because the radar system used, specifically designed for automotive applications, is not aimed to detect objects with such a small RCS. The test is conducted at different rotational speeds kept constant, and it is simultaneously measured by a reference digital laser tachometer, namely the DT2234C+ [49], shown in Figure 12.
The laser tachometer has a measurement input range of [2.5; 99,999] RPM with a resolution equal to 0.1 RPM in the range [2.5; 999.9] RPM and equal to 1 RPM in the range [1000; 99,999] RPM. The value measured by the laser tachometer does not directly provide the propeller speed: since the blades are covered with the aluminum tape, they are both detected by the device, so to properly convert the measured value of rotational speed (given in RPM) to the frequency measured by the radar (in Hz), the following calculation must be performed:
f R a d a r ( Hz ) = T a c h o m e t e r [ RPM ] n b l a d e s · 60
where f R a d a r is the rotational frequency, n b l a d e s is the number of blades of the propeller, and T a c h o m e t e r [ RPM ] is the value measured by the tachometer.
The results obtained with the FFT and MUSIC approaches are reported in Table 2 and 
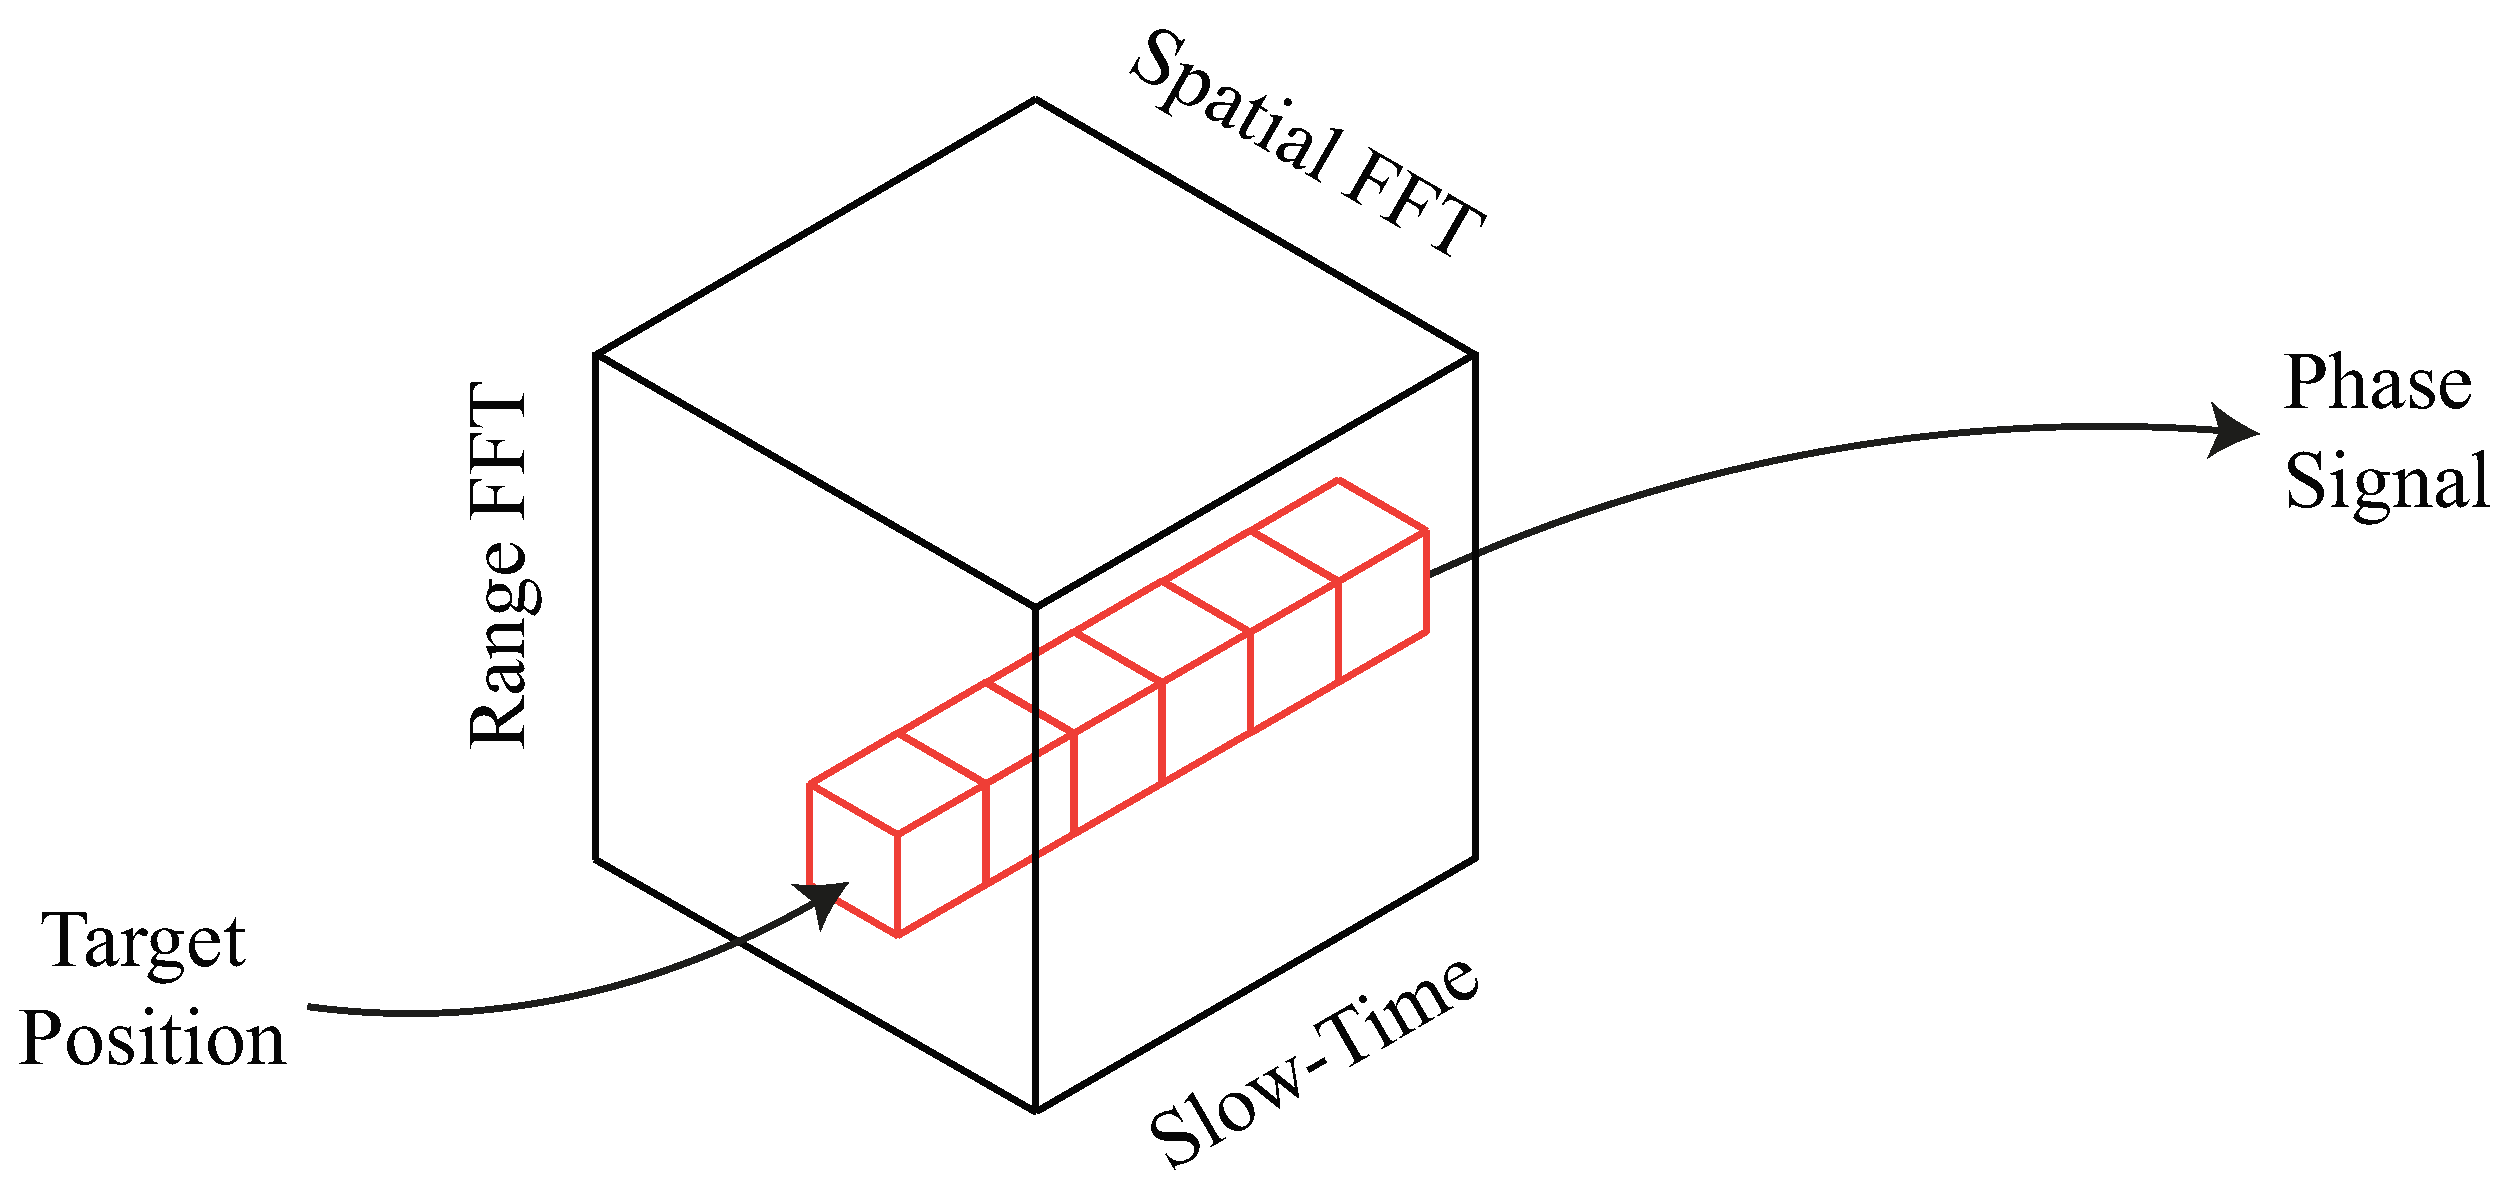
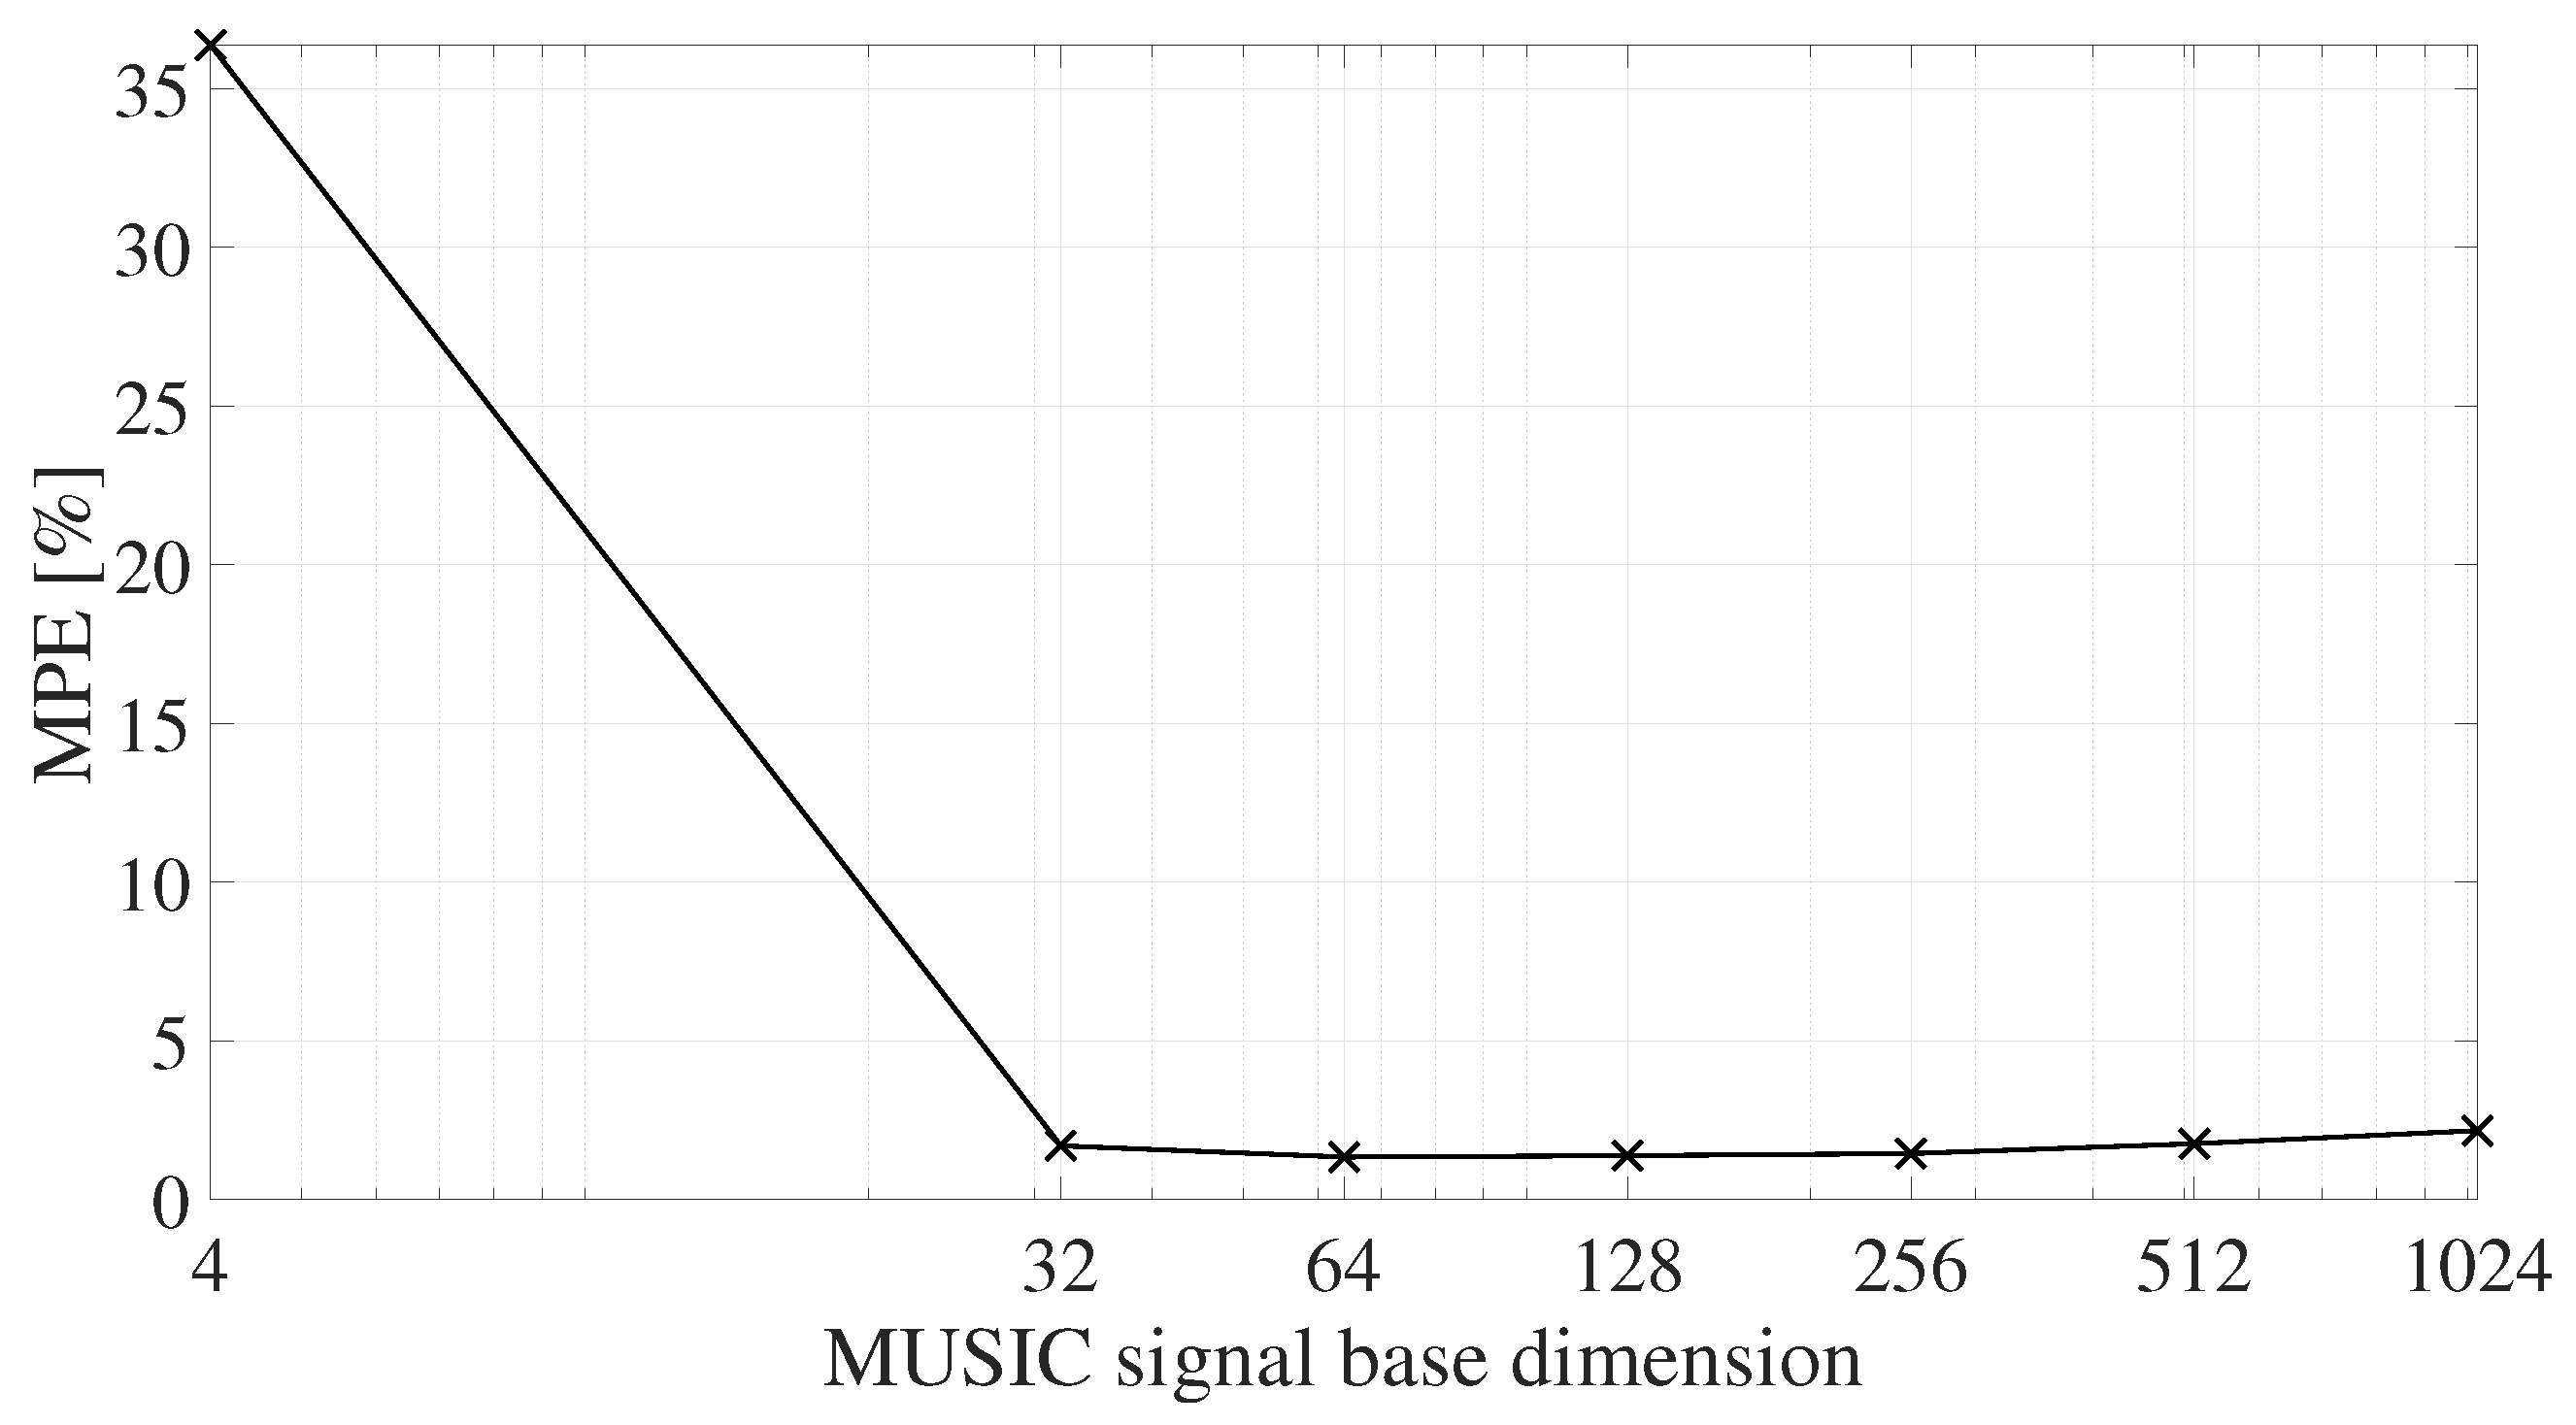
Table 3, respectively. The angular and range bins used to obtain the position of the target are chosen by considering the center of the UAV’s chassis, at angular bin “1” and range bin “25”; the front axis is located at angular bin “1” and range bin “22”; and the rear axis is located at angular bin “1” and range bin “28”. These values are determined by the frontal position of the drone to the radar sensor and by the 45 cm-long wheelbase of the chassis. To be applied, the MUSIC algorithm needs the dimension of the signal subspace as input. This dimension is in general of the same order as the number of main components searched within the original signal. In general, this parameter is very difficult to select, since the number of main signal components cannot be known a priori. For this reason, numerous tests were carried out with different values of the signal base dimension, and the best result in terms of minimum percentage error was obtained with a dimension of sixty-four. All results obtained with the FFT and MUSIC techniques are reported in Appendix A.
The last rows of Table 2 and 
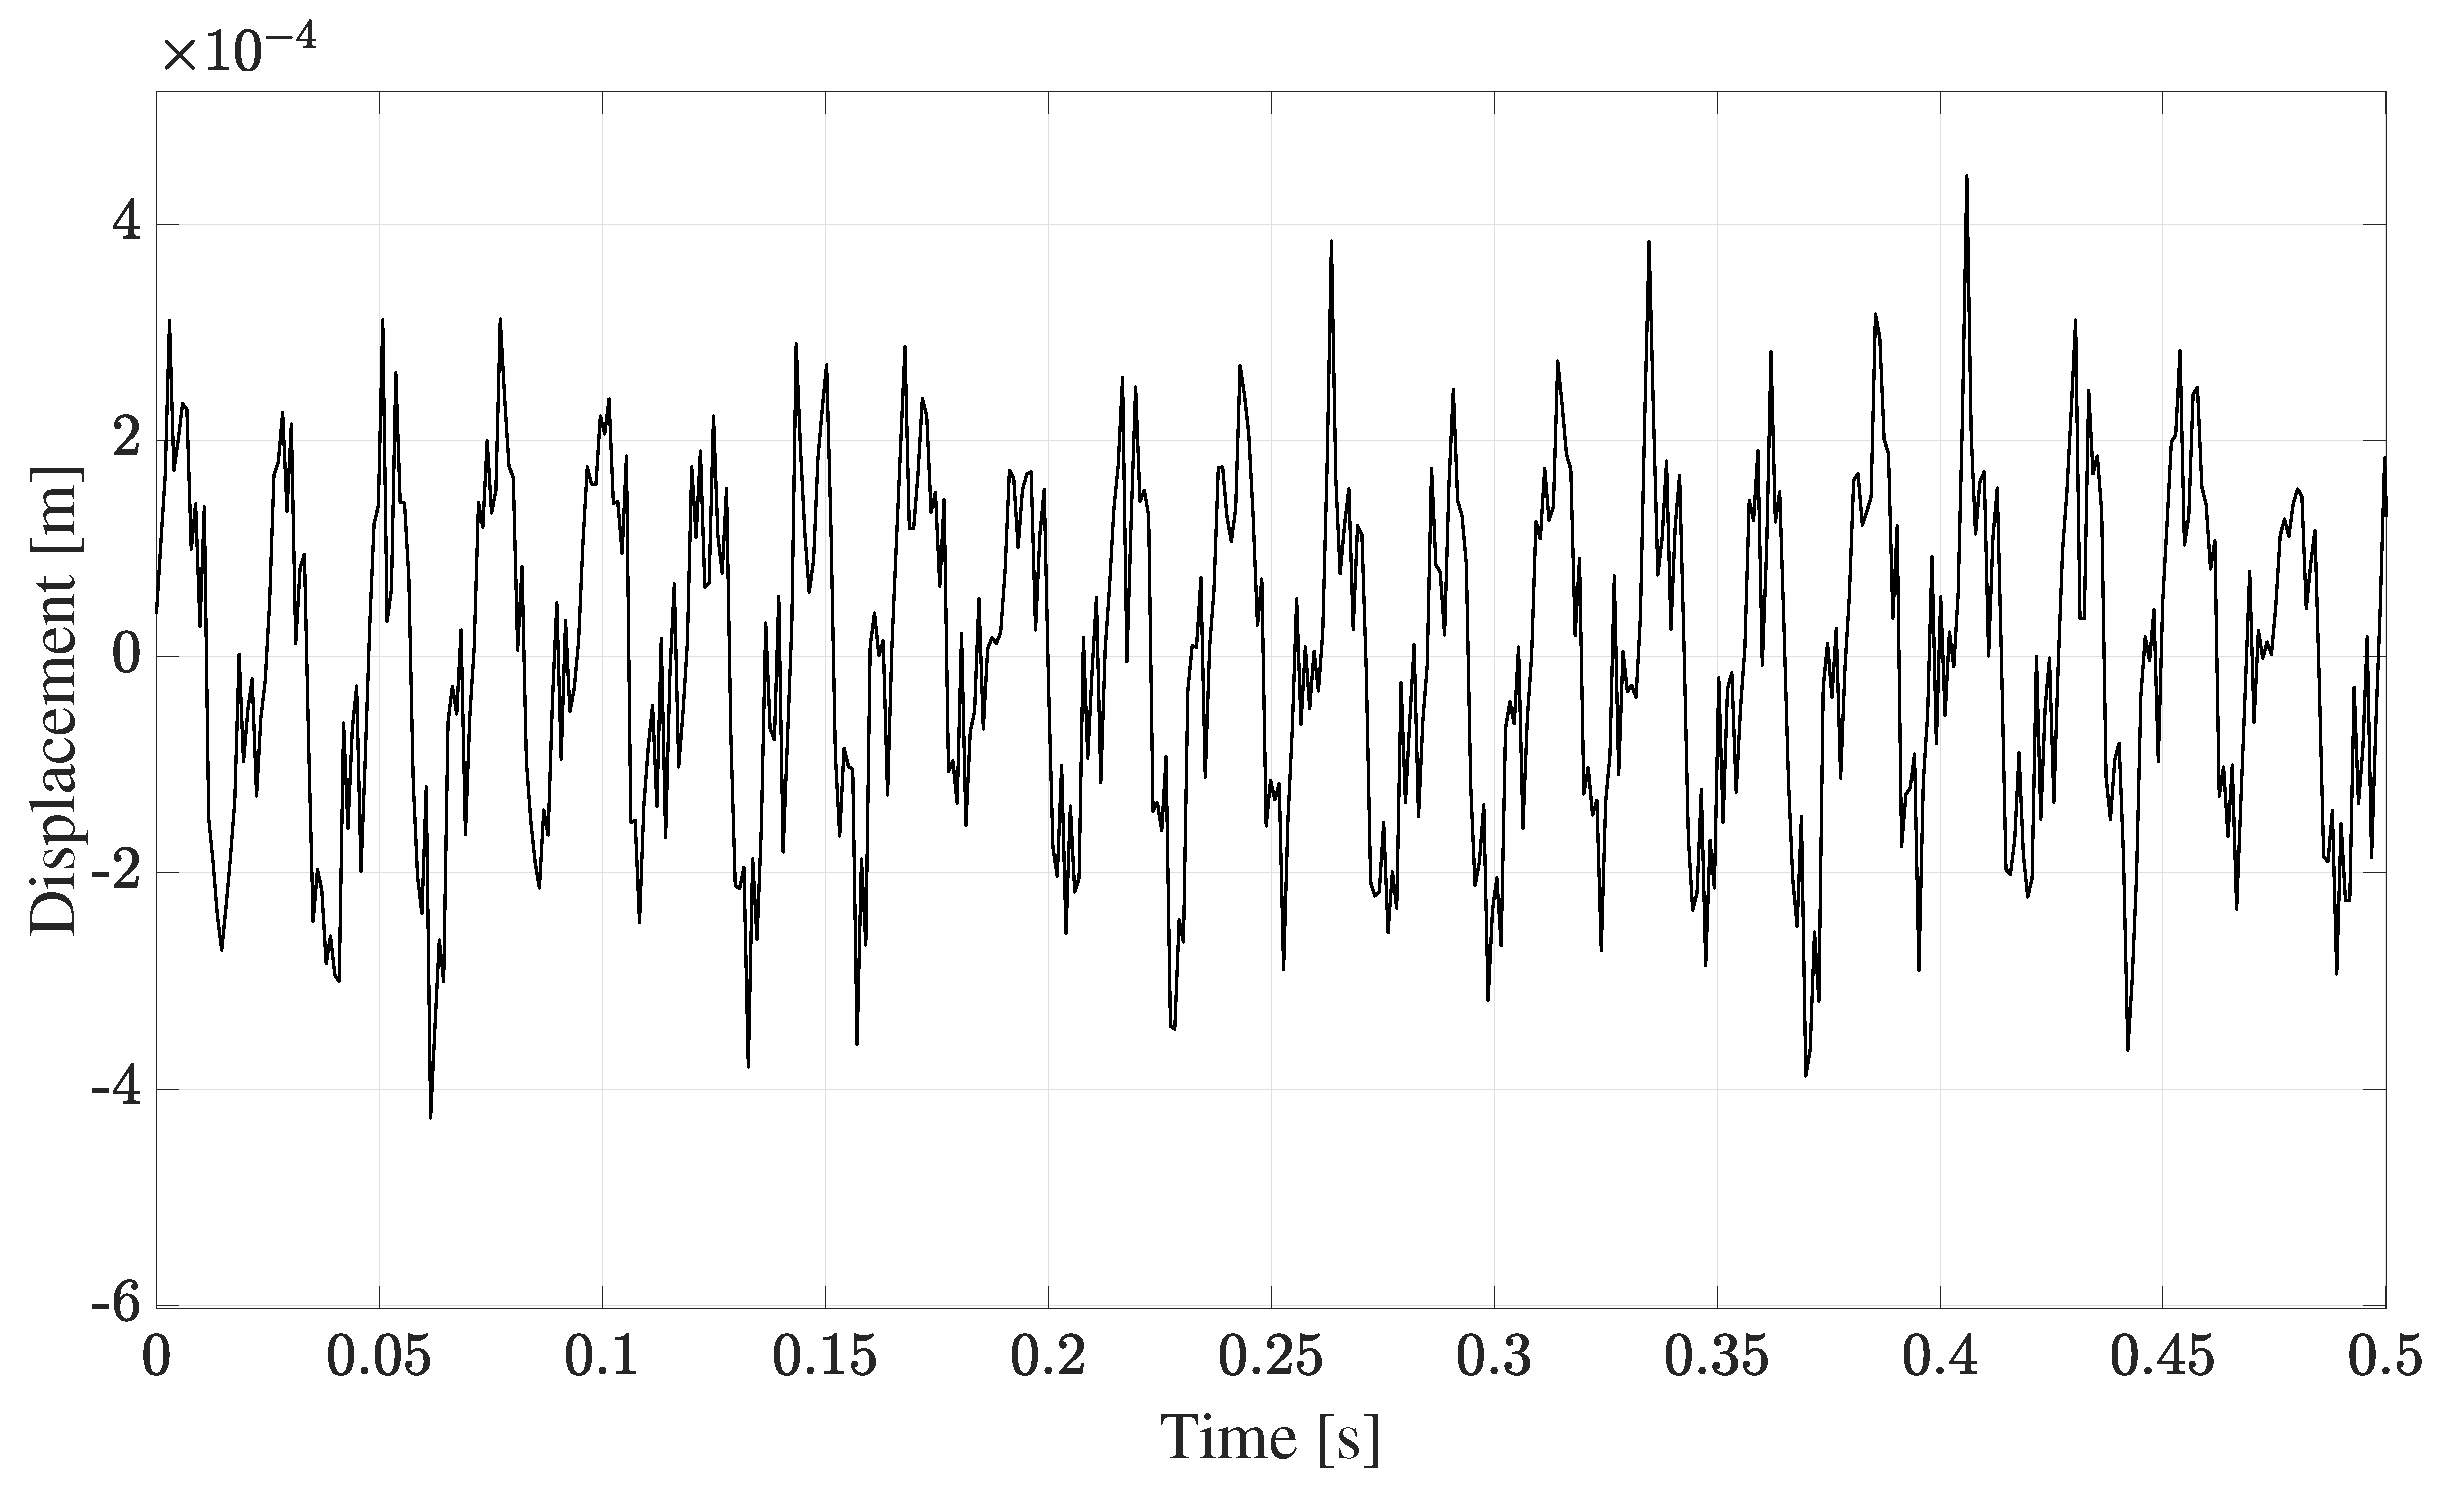
Table 3 are related to a test in which the drone chassis is tilted in front along the pitch axis. The FFT and the MUSIC computation are made on all the 51,200 samples of the extracted vibration signal. With the configuration parameters chosen, the acquisition has a time duration of 49.971 s. In general, with radar systems, the length of the acquisition window is crucial to provide the extracted information in a short time (ideally, in quasi-real time). In this case, performing the analysis on all the vibration signal samples acquired on a quite long time window has the sole purpose of testing the approach with the maximum possible frequency resolution. Reducing the number of signal samples will provide the rotational speed value in less time but with reduced measurement performance. As an example, if the computation of the FFT is made over all the signal samples, the frequency resolution for the setup chosen is 0.01 Hz, while with fewer samples, for example 5120, collected on a shorter time window, the resolution would amount to 0.1 Hz. This can reduce the accuracy in the evaluation of the calculated peak frequency, which would result in increased uncertainty of the measured propellers’ rotational speed. To mitigate this problem, since one of the goals of this work is to understand the measurement capabilities of the proposed approach, all vibration signal samples are used for computation in the frequency analysis, as the rotational conditions of the propellers are controlled and kept stationary during the acquisition.
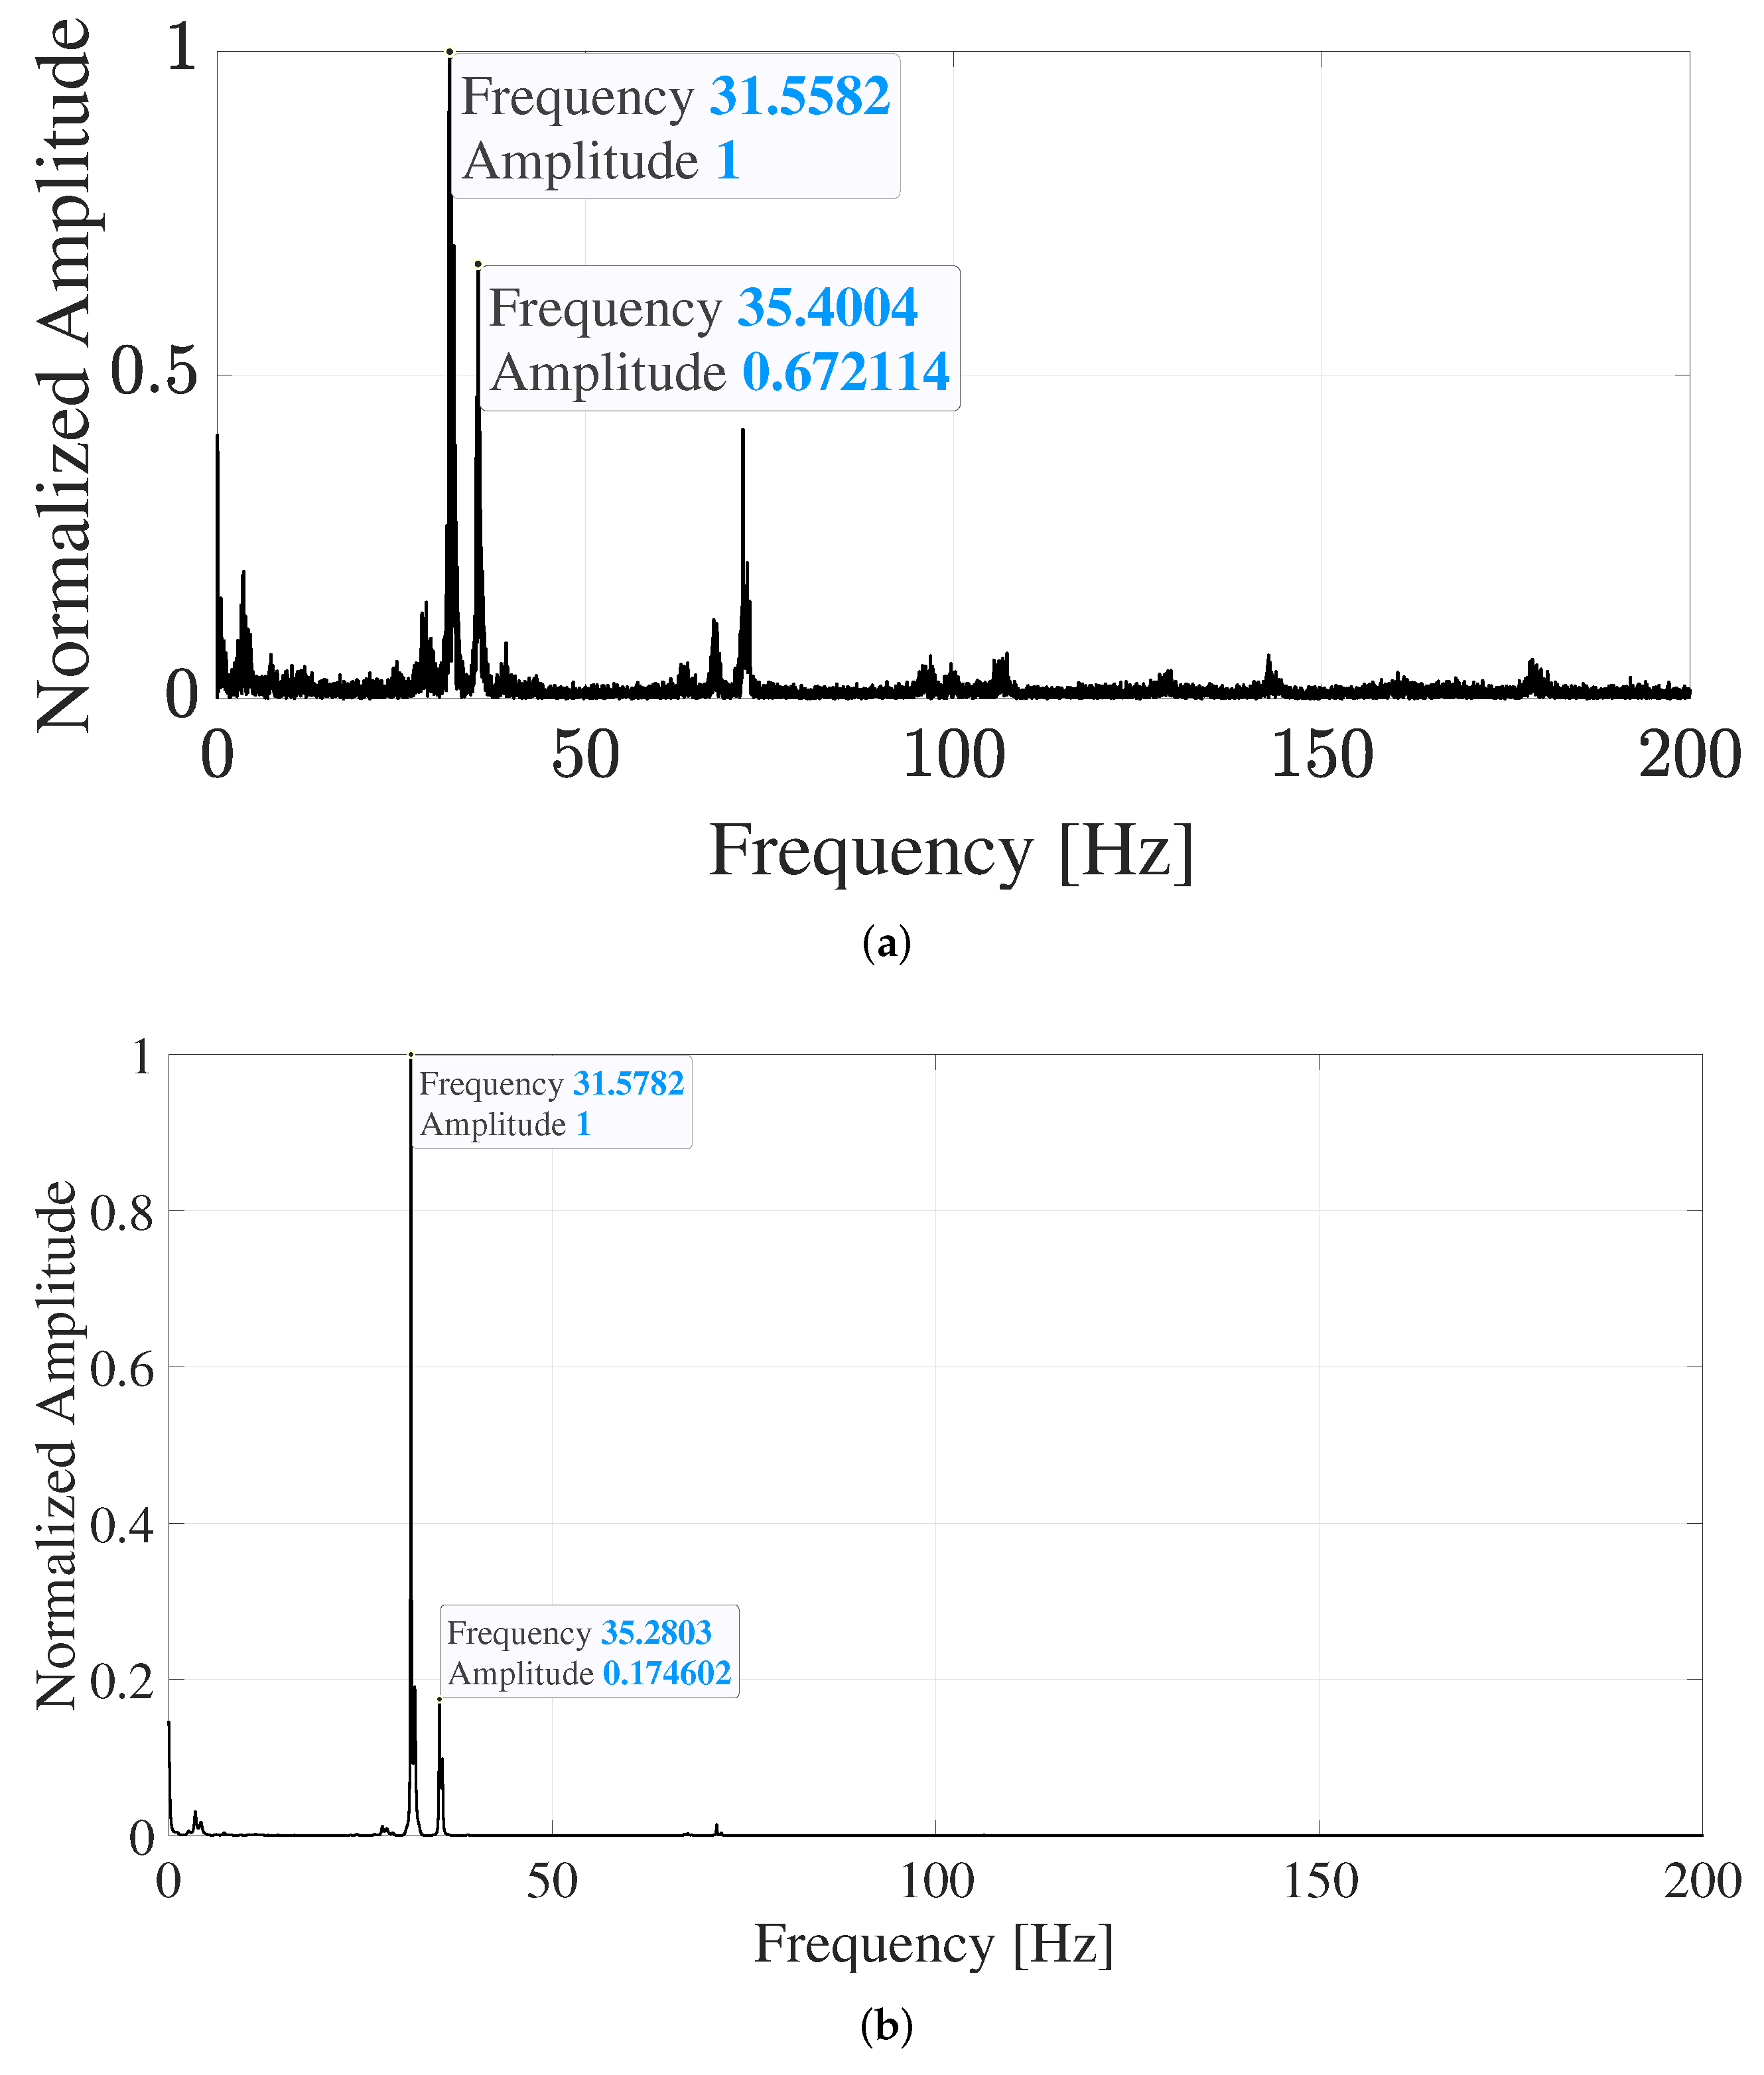
The two highest peaks within the signal spectrum and the signal pseudo-spectrum are selected to obtain the results. An example of the temporal evolution of the vibration displacement signal is illustrated in Figure 13.
It is possible to quantify the difference between the reference rotational speed provided by the laser tachometer and the proposed radar-based approach by computing the Mean Percentage Error (MPE) [50] defined as follows:
MPE = 1 N i = 1 N T a c h o m e t e r i E q u i v a l e n t M e a s u r e d i T a c h o m e t e r i · 100 [ % ]
where N is the number of measured values. As regards the FFT-based technique, the MPE is 1.08%, and for the MUSIC-based technique, it is 1.34%. The MPE obtained with the MUSIC technique is slightly higher than the MPE obtained with FFT, but in the latter case, the detection of the peaks is more difficult to perform, since the spectrum of the vibration signal is noisier. The variation of the MUSIC MPE obtained for different values of the signal basis dimension is given in Figure 14.

5. Discussion

In general, the FFT approach can be applied to UAVs with more propellers per axis. To denoise the signal, the application of a proper filter could be considered, but tuning the filter parameters in a specific frequency range, without any information about the UAV, could be extremely difficult. The adoption of the MUSIC algorithm removes much noise from the vibration signal spectrum, thus supporting decisions taken based on the resulting pseudo-spectrum. This approach will preserve the main harmonics of the signal without knowing their frequency in advance, which would be necessary to design a proper filter. While the application of the MUSIC algorithm simplifies detection, it worsens the measurement performance evaluated in terms of the defined MPE. However, this could be an acceptable trade-off considering that in the presence of a very noisy FFT, a peak due to the noise and not to the signal could be selected, thus further worsening performance.
In comparison with the results obtained by other recent approaches, such as those presented in [51], the proposed method is able to estimate the propellers’ rotational speed even when the range resolution is larger than the length of the propeller’s blade. In fact, as described in Section 1, the capability of the sensor to measure the displacement is related to the wavelength of the transmitted signal and not to the range resolution. Moreover, the approach proposed in [51] remains purely theoretical, while the validity of the method proposed in this work is confirmed by experimental tests.

6. Conclusions

In this work, a novel approach to indirectly measure the rotational speed of UAV propellers has been proposed. In general, the rotation of these components generates vibrations on the drone chassis, and the frequency of these vibrations is related to the rotation speed. Since radar sensors can detect vibrations happening along their radial direction, the aim of this work was to investigate the possibility to exploit this sensor capability for the indirect measurement of the propellers’ rotational speed. The feasibility of the proposed signal processing technique has been proved by experiments, and the vibration frequencies extracted with the radar sensor are in line with the values of the propellers’ rotational speed given in RPM and measured by a reference instrument. The MUSIC algorithm has been applied to improve peak detection in the spectra of noisy vibration signals, despite worsening a little the attainable MPE. As the automotive radar sensor considered can discriminate the target position within the measurement area, the approach herein presented can be extended to the case of multiple UAVs. In conclusion, the proposed technique achieves very good performance and can be further developed and improved. The setup used does not involve a moving drone in airspace, and further tests in a different context, for example considering longer distances and a flying drone, or different kind of UAVs equipped with propellers, will be conducted to further investigate and extend what has been achieved so far.

Author Contributions

Conceptualization, G.C.; methodology, G.C. and L.S.; software, G.C.; formal analysis, G.I.; investigation, G.C.; resources, G.C. and E.G.; data curation, G.C. and G.I.; writing—original draft preparation, G.C.; writing—review and editing, G.I., L.S. and S.S.; visualization, S.S.; supervision, E.G.; project administration, E.G.; funding acquisition, E.G. All authors have read and agreed to the published version of the manuscript.

Funding

The research activity presented in this paper was supported by the POR MARCHE FESR project “Marche Innovation and Research fAcilities for Connected and sustainable Living Environments (MIRACLE)”—CUP B28I19000330007 and by the financial program DM MiSE 5 Marzo 2018 project “ChAALenge”—F/180016/01-05/X43.

Data Availability Statement

The data presented in this study are available on request from the corresponding author.

Conflicts of Interest

The authors declare no conflict of interest.

Abbreviations

The following abbreviations are used in this manuscript:
ADCAnalog-to-Digital Converter
CANController Area Network
DSPDigital Signal Processor
FFTFast Fourier Transform
FMCWFrequency-Modulated Continuous Wave
FPGAField-Programmable Gate Array
LVDSLow-Voltage Differential Signaling
MIMOMultiple In Multiple Out
MLMachine Learning
MPEMean Percentage Error
MUSICMUltiple SIgnal Classification
PRIPulse Repetition Interval
RCSRadar Cross-Section
RPMRounds Per Minute
UARTUniversal Asynchronous Receiver–Transmitter
UAVUnmanned Aerial Vehicle
UDPUser Datagram Protocol

Appendix A

Table A1. Results obtained with a MUSIC signal subspace of four.
No. PropellersTachometer Front (RPM)Tachometer Rear (RPM)Radar-Measured MUSIC Rotational Frequency (Hz) FrontRadar-Measured MUSIC Rotational Frequency (Hz) RearEquivalent Rotational Speed Radar Front (RPM)Equivalent Rotational Speed Radar Rear (RPM)
15400/48.388/5806/
17100/58.874/7065/
25000550043.505/5220/
43800, 43003800, 430039.743, /36.601, /4769, /4392, /
4 Tilted3800, 43003800, 430034.480, /40.423, /4137, /4851, /
Table A2. Results obtained with a MUSIC signal subspace of thirty two.
No. PropellersTachometer Front (RPM)Tachometer Rear (RPM)Radar-Measured MUSIC Rotational Frequency (Hz) FrontRadar-Measured MUSIC Rotational Frequency (Hz) RearEquivalent Rotational Speed Radar Front (RPM)Equivalent Rotational Speed Radar Rear (RPM)
15400/45.006/5400/
17100/58.654/7038/
25000550041.76444.46650125336
43800, 43003800, 430032.599, 35.30032.739, 35.2003912, 42363929, 4202
4 Tilted3800, 43003800, 430031.978, 34.78031.118, 35.6603837, 41733734, 4279
Table A3. Results obtained with a MUSIC signal subspace of one hundred and twenty eight.
No. PropellersTachometer Front (RPM)Tachometer Rear (RPM)Radar-Measured MUSIC Rotational Frequency (Hz) FrontRadar-Measured MUSIC Rotational Frequency (Hz) RearEquivalent Rotational Speed Radar Front (RPM)Equivalent Rotational Speed Radar Rear (RPM)
15400/44.986/5398/
17100/58.734/7048/
25000550041.78445.54650145465
43800, 43003800, 430032.579, 36.36132.358, 34.1003909, 43633883, 4092
4 Tilted3800, 43003800, 430032.299, 35.62031.958, 35.8303876, 42743835, 4299
Table A4. Results obtained with a MUSIC signal subspace of two hundred and fifty six.
No. PropellersTachometer Front (RPM)Tachometer Rear (RPM)Radar-Measured MUSIC Rotational Frequency (Hz) FrontRadar-Measured MUSIC Rotational Frequency (Hz) RearEquivalent Rotational Speed Radar Front (RPM)Equivalent Rotational Speed Radar Rear (RPM)
15400/44.986/5398/
17100/58.734/7048/
25000550041.78445.54650145465
43800, 43003800, 430032.599, 36.36132.339, 34.1003912, 43633880, 4092
4 Tilted3800, 43003800, 430032.299, 35.62031.818, 35.5003876, 42743818, 4260
Table A5. Results obtained with a MUSIC signal subspace of five hundred twelve.
No. PropellersTachometer Front (RPM)Tachometer Rear (RPM)Radar-Measured MUSIC Rotational Frequency [Hz) FrontRadar-Measured MUSIC Rotational Frequency (Hz) RearEquivalent Rotational Speed Radar Front (RPM)Equivalent Rotational Speed Radar Rear (RPM)
15400/45.026/5403/
17100/58.454/7014/
25000550041.82445.56650195468
43800, 43003800, 430032.799, 34.22032.779, 34.2793936, 41063933, 4113
4 Tilted3800, 43003800, 430032.359, 35.76031.498, 35.8203883, 42913780, 4298
Table A6. Results obtained with a MUSIC signal subspace of one thousand and twenty-four.
No. PropellersTachometer Front (RPM)Tachometer Rear (RPM)Radar-Measured MUSIC Rotational Frequency (Hz) FrontRadar-Measured MUSIC Rotational Frequency (Hz) RearEquivalent Rotational Speed Radar Front (RPM)Equivalent Rotational Speed Radar Rear (RPM)
15400/45.026/5403/
17100/58.574/7029/
25000550041.86445.40650235448
43800, 43003800, 430032.739, 34.45933.739, 34.1403928, 41354046, 4096
4 Tilted3800, 43003800, 430032.479, 35.78039.399, 35.8603897, 42933888, 4303

References

  1. Mukhamediev, R.I.; Symagulov, A.; Kuchin, Y.; Zaitseva, E.; Bekbotayeva, A.; Yakunin, K.; Assanov, I.; Levashenko, V.; Popova, Y.; Akzhalova, A.; et al. Review of Some Applications of Unmanned Aerial Vehicles Technology in the Resource-Rich Country. Appl. Sci. 2021, 11, 10171. [Google Scholar] [CrossRef]
  2. Rahman, A.; Sakif, S.; Sikder, N.; Masud, M.; Aljuaid, H.; Bairagi, A.K. Unmanned Aerial Vehicle Assisted Forest Fire Detection Using Deep Convolutional Neural Network. Intell. Autom. Soft Comput. 2023, 35, 3259–3277. [Google Scholar] [CrossRef]
  3. Liang, X.; Yu, H.; Zhang, Z.; Liu, H.; Fang, Y.; Han, J. Unmanned Aerial Transportation System with Flexible Connection between the Quadrotor and the Payload: Modeling, Controller Design and Experimental Validation. IEEE Trans. Ind. Electron. 2023, 70, 1870–1882. [Google Scholar] [CrossRef]
  4. Idrissi, M.; Salami, M.; Annaz, F. A Review of Quadrotor Unmanned Aerial Vehicles: Applications, Architectural Design and Control Algorithms. J. Intell. Robot. Syst. 2022, 104, 22. [Google Scholar] [CrossRef]
  5. Chamola, V.; Kotesh, P.; Agarwal, A.; Naren; Gupta, N.; Guizani, M. A comprehensive review of unmanned aerial vehicle attacks and neutralization techniques. Ad Hoc Netw. 2021, 111, 102324. [Google Scholar] [CrossRef]
  6. Chaari, M.Z.; Al-Maadeed, S. The game of drones/weapons makers’ war on drones. In Unmanned Aerial Systems; Elsevier: Amsterdam, The Netherlands, 2021; pp. 465–493. [Google Scholar]
  7. Feng, Z.; Guan, N.; Lv, M.; Liu, W.; Deng, Q.; Liu, X.; Yi, W. Efficient drone hijacking detection using two-step GA-XGBoost. J. Syst. Archit. 2020, 103, 101694. [Google Scholar] [CrossRef]
  8. Ciattaglia, G.; Senigagliesi, L.; Alidori, D.; Cipriani, L.; Iadarola, G.; Spinsante, S.; Gambi, E. Drone classification using mmWave micro-Doppler radar measurements. In Proceedings of the 2022 IEEE 9th International Workshop on Metrology for AeroSpace (MetroAeroSpace), Pisa, Italy, 27–29 June 2022; pp. 259–264. [Google Scholar]
  9. Taha, B.; Shoufan, A. Machine learning-based drone detection and classification: State-of-the-art in research. IEEE Access 2019, 7, 138669–138682. [Google Scholar] [CrossRef]
  10. Patel, J.S.; Fioranelli, F.; Anderson, D. Review of radar classification and RCS characterisation techniques for small UAVs or drones. IET Radar Sonar Navig. 2018, 12, 911–919. [Google Scholar] [CrossRef]
  11. Balal, N.; Richter, Y.; Pinhasi, Y. Identifying low-RCS targets using micro-Doppler high-resolution radar in the millimeter waves. In Proceedings of the 2020 14th European Conference on Antennas and Propagation (EuCAP), Copenhagen, Denmark, 15–20 March 2020; pp. 1–5. [Google Scholar]
  12. Matsuda, T.; Yataka, R.; Gocho, M.; Tanaka, T. Micro-Doppler Analysis under Various Aspect Angles for Small UAV Classification. In Proceedings of the 2019 IEEE Asia-Pacific Microwave Conference (APMC), Singapore, 10–13 December 2019; pp. 102–104. [Google Scholar] [CrossRef]
  13. Leonardi, M.; Ligresti, G.; Piracci, E. Drones Classification by the Use of a Multifunctional Radar and Micro-Doppler Analysis. Drones 2022, 6, 124. [Google Scholar] [CrossRef]
  14. Kim, B.K.; Kang, H.S.; Park, S.O. Drone classification using convolutional neural networks with merged Doppler images. IEEE Geosci. Remote Sens. Lett. 2016, 14, 38–42. [Google Scholar] [CrossRef]
  15. Ritchie, M.; Fioranelli, F.; Borrion, H.; Griffiths, H. Multistatic micro-Doppler radar feature extraction for classification of unloaded/loaded micro-drones. IET Radar Sonar Navig. 2017, 11, 116–124. [Google Scholar] [CrossRef] [Green Version]
  16. Kumawat, H.C.; Chakraborty, M.; Raj, A.A.B. DIAT-RadSATNet—A Novel Lightweight DCNN Architecture for Micro-Doppler-Based Small Unmanned Aerial Vehicle (SUAV) Targets’ Detection and Classification. IEEE Trans. Instrum. Meas. 2022, 71, 8504011. [Google Scholar] [CrossRef]
  17. Singh, A.K.; Kim, Y.H. Automatic measurement of blade length and rotation rate of drone using W-band micro-Doppler radar. IEEE Sensors J. 2017, 18, 1895–1902. [Google Scholar] [CrossRef]
  18. Zhang, Y.; Li, D.; Han, Y.; Yang, Z.; Dai, X.; Guo, X.; Zhang, J. A New Estimation Method for Rotor Size of UAV Based on Peak Time-Shift Effect in Micro-Doppler Lidar. Front. Phys. 2022, 10, 865240. [Google Scholar] [CrossRef]
  19. Dizeu, F.B.D.; Picard, M.; Drouin, M.A.; Gagn, G. Extracting Unambiguous Drone Signature Using High-Speed Camera. IEEE Access 2022, 10, 45317–45336. [Google Scholar] [CrossRef]
  20. Piotrowsky, L.; Pohl, N. Spatially resolved fast-time vibrometry using ultrawideband FMCW radar systems. IEEE Trans. Microw. Theory Tech. 2020, 69, 1082–1095. [Google Scholar] [CrossRef]
  21. Rodenbeck, C.T.; Beun, J.B.; Raj, R.G.; Lipps, R.D. Vibrometry and sound reproduction of acoustic sources on moving platforms using millimeter wave pulse-Doppler radar. IEEE Access 2020, 8, 27676–27686. [Google Scholar] [CrossRef]
  22. Klaer, P.; Huang, A.; Sévigny, P.; Rajan, S.; Pant, S.; Patnaik, P.; Balaji, B. An investigation of rotary drone HERM line spectrum under manoeuvering conditions. Sensors 2020, 20, 5940. [Google Scholar] [CrossRef]
  23. Gannon, Z.; Tahmoush, D. Measuring UAV propeller length using micro-Doppler signatures. In Proceedings of the 2020 IEEE International Radar Conference (RADAR), Washington, DC, USA, 28–30 April 2020; pp. 1019–1022. [Google Scholar]
  24. Kuantama, E.; Moldovan, O.G.; Ţarcă, I.; Vesselényi, T.; Ţarcă, R. Analysis of quadcopter propeller vibration based on laser vibrometer. J. Low Freq. Noise Vib. Act. Control 2021, 40, 239–251. [Google Scholar] [CrossRef]
  25. Ghalamchi, B.; Mueller, M. Vibration-based propeller fault diagnosis for multicopters. In Proceedings of the 2018 International Conference on Unmanned Aircraft Systems (ICUAS), Dallas, TX, USA, 12–15 June 2018; pp. 1041–1047. [Google Scholar]
  26. Ahmad, F.; Bhandari, A.; Kumar, P.; Patil, P.P. Modeling and Mechanical Vibration characteristics analysis of a Quadcopter Propeller using FEA. IOP Conf. Ser. Mater. Sci. Eng. 2019, 577, 012022. [Google Scholar] [CrossRef]
  27. Chen, V.C.; Li, F.; Ho, S.S.; Wechsler, H. Micro-Doppler effect in radar: Phenomenon, model, and simulation study. IEEE Trans. Aerosp. Electron. Syst. 2006, 42, 2–21. [Google Scholar] [CrossRef]
  28. Monserrat, O.; Crosetto, M.; Luzi, G. A review of ground-based SAR interferometry for deformation measurement. ISPRS J. Photogramm. Remote Sens. 2014, 93, 40–48. [Google Scholar] [CrossRef] [Green Version]
  29. Casagli, N.; Catani, F.; Del Ventisette, C.; Luzi, G. Monitoring, prediction, and early warning using ground-based radar interferometry. Landslides 2010, 7, 291–301. [Google Scholar] [CrossRef]
  30. Li, C.; Lubecke, V.M.; Boric-Lubecke, O.; Lin, J. A review on recent advances in Doppler radar sensors for noncontact healthcare monitoring. IEEE Trans. Microw. Theory Tech. 2013, 61, 2046–2060. [Google Scholar] [CrossRef]
  31. Li, C.; Cummings, J.; Lam, J.; Graves, E.; Wu, W. Radar remote monitoring of vital signs. IEEE Microw. Mag. 2009, 10, 47–56. [Google Scholar] [CrossRef]
  32. Clemente, C.; Balleri, A.; Woodbridge, K.; Soraghan, J.J. Developments in target micro-Doppler signatures analysis: Radar imaging, ultrasound and through-the-wall radar. EURASIP J. Adv. Signal Process. 2013, 2013, 47. [Google Scholar] [CrossRef] [Green Version]
  33. Chen, V.C.; Tahmoush, D.; Miceli, W.J. Radar Micro-Doppler Signatures; Institution of Engineering and Technology: London, UK, 2014. [Google Scholar]
  34. Ciattaglia, G.; De Santis, A.; Disha, D.; Spinsante, S.; Castellini, P.; Gambi, E. Performance evaluation of vibrational measurements through mmwave automotive radars. Remote Sens. 2020, 13, 98. [Google Scholar] [CrossRef]
  35. Pető, T.; Bilicz, S.; Szűcs, L.; Gyimóthy, S.; Pávó, J. The radar cross section of small propellers on unmanned aerial vehicles. In Proceedings of the 2016 10th European Conference on Antennas and Propagation (EuCAP), Davos, Switzerland, 10–15 April 2016; pp. 1–4. [Google Scholar]
  36. AWR1642, Single-Chip 76-GHz to 81-GHz Automotive Radar Sensor Integrating DSP and MCU. Available online: https://www.ti.com/product/AWR1642 (accessed on 25 November 2022).
  37. DCA1000EVM, Real-Time Data-Capture Adapter for Radar Sensing Evaluation Module. Available online: https://www.ti.com/tool/DCA1000EVM (accessed on 25 November 2022).
  38. Patole, S.M.; Torlak, M.; Wang, D.; Ali, M. Automotive radars: A review of signal processing techniques. IEEE Signal Process. Mag. 2017, 34, 22–35. [Google Scholar] [CrossRef]
  39. Magosi, Z.F.; Li, H.; Rosenberger, P.; Wan, L.; Eichberger, A. A Survey on Modelling of Automotive Radar Sensors for Virtual Test and Validation of Automated Driving. Sensors 2022, 22, 5693. [Google Scholar] [CrossRef]
  40. Li, J.; Stoica, P. MIMO radar with colocated antennas. IEEE Signal Process. Mag. 2007, 24, 106–114. [Google Scholar] [CrossRef]
  41. Li, J.; Stoica, P. MIMO Radar Signal Processing; John Wiley & Sons: Hoboken, NJ, USA, 2008. [Google Scholar]
  42. Zhang, X.; Xu, L.; Xu, L.; Xu, D. Direction of departure (DOD) and direction of arrival (DOA) estimation in MIMO radar with reduced-dimension MUSIC. IEEE Commun. Lett. 2010, 14, 1161–1163. [Google Scholar] [CrossRef]
  43. Gamba, J. Radar Signal Processing for Autonomous Driving; Springer: Singapore, 2020. [Google Scholar]
  44. Xiong, Y.; Peng, Z.; Xing, G.; Zhang, W.; Meng, G. Accurate and robust displacement measurement for FMCW radar vibration monitoring. IEEE Sens. J. 2017, 18, 1131–1139. [Google Scholar] [CrossRef]
  45. Yamamoto, K.; Toyoda, K.; Ohtsuki, T. MUSIC-based non-contact heart rate estimation with adaptive window size setting. In Proceedings of the 2019 41st Annual International Conference of the IEEE Engineering in Medicine and Biology Society (EMBC), Berlin, Germany, 23–27 July 2019; pp. 6073–6076. [Google Scholar]
  46. Li, R.; Li, K.; Zhao, C. Application of multiple signal classification algorithm to frequency estimation in coherent dual-frequency lidar. In Proceedings of the 2017 International Conference on Optical Instruments and Technology: Advanced Laser Technology and Applications, Beijing, China, 28–30 October 2017; SPIE: Bellingham, WA, USA, 2018; Volume 10619, pp. 54–59. [Google Scholar]
  47. Agarwal, K.; Macháň, R. Multiple signal classification algorithm for super-resolution fluorescence microscopy. Nat. Commun. 2016, 7, 13752. [Google Scholar] [CrossRef] [PubMed] [Green Version]
  48. Li, T.; Tang, Y. Frequency estimation based on modulation FFT and MUSIC algorithm. In Proceedings of the 2010 First International Conference on Pervasive Computing, Signal Processing and Applications, Harbin, China, 17–19 September 2010; pp. 525–528. [Google Scholar]
  49. DT2234C+ Digital Tachometer. Available online: https://www.vectus.com.br/wp-content/uploads/2018/04/datasheet-VECDT-2234C.pdf (accessed on 25 November 2022).
  50. Boyle, J.; Le Padellec, R.; Ireland, D. Statewide validation of a patient admissions prediction tool. In Proceedings of the 2010 Annual International Conference of the IEEE Engineering in Medicine and Biology, Buenos Aires, Argentina, 31 August–4 September 2010; pp. 3887–3890. [Google Scholar]
  51. Mao, T.; Li, Z.; Zhu, K.; Zhang, Y.; Sun, H. Radar backscattering modelling and micro-motion parameter estimation method for quadcopter. IET Radar Sonar Navig. 2022, 16, 161–169. [Google Scholar] [CrossRef]
Figure 1. Simple scheme of a propeller’s speed measurement with radar. The length of the propeller is two times L, which represents the length of a blade.
Remotesensing 15 00270 g001
Figure 2. Propeller displacement due to vibration.
Remotesensing 15 00270 g002
Figure 3. Working principle of radar vibrometry: the head of the radar transmits the signal and because of the target vibration, the received echo exhibits a phase delay ψ . The x-axis represents the range, and the y-axis represents the cross-range. D v is the target displacement along the radial direction of the target vibration.
Remotesensing 15 00270 g003
Figure 4. The Texas Instruments AWR1642 radar used in this work.
Remotesensing 15 00270 g004
Figure 5. Graphical representation of the main parameters related to the radar signal chirps.
Remotesensing 15 00270 g005
Figure 6. Connection scheme of the radar board, the FPGA board, and the computer.
Remotesensing 15 00270 g006
Figure 7. Components used to build the UAV: (a) central part of the chassis, (b) arms of the chassis where the motors are lodged, (c) propellers, and (d) 40 A ESC driver connected to the motors featuring K v = 1000 RPM/V.
Remotesensing 15 00270 g007
Figure 8. Top-view representation of the experimental setup. The drone and the radar are positioned on two different tripods at a distance d = 1.673 m.
Remotesensing 15 00270 g008
Figure 9. Range-angular detection map.
Remotesensing 15 00270 g009
Figure 10. Radar signal processing flowchart.
Remotesensing 15 00270 g010
Figure 11. Example of vibration frequency computed with (a) FFT and (b) MUSIC with a subspace dimension equal to 512. Both spectra are normalized in amplitude to be easily comparable.
Remotesensing 15 00270 g011
Figure 12. The digital laser tachometer DT2234C+ used in this work.
Remotesensing 15 00270 g012
Figure 13. Displacement signal obtained from the proposed signal processing technique.
Remotesensing 15 00270 g013
Figure 14. Mean Percentage Error of the MUSIC processing for different values of the signal subspace dimension.
Remotesensing 15 00270 g014
Table 1. Radar Parameters.
Radar ParameterValue
Idle Time100 μs
ADC Valid Start Time6 μs
ADC Sampling Time63 μs
Used Radar Bandwidth2.240 GHz
t p e r i o d i c i t y 976 μ s
n c h i r p T o t 51,200
n A D C S a m p l e s 128
f S a m p l i n g 4 MHz
Table 2. Results obtained from the laser tachometer and the FFT technique.
No. PropellersTachometer Front (RPM]Tachometer Rear (RPM)Radar-Measured FFT Rotational Frequency (Hz) FrontRadar-Measured FFT Rotational Frequency (Hz) RearEquivalent Rotational Speed Radar Front (RPM)Equivalent Rotational Speed Radar Rear (RPM)
15400/45.006/5400/
17100/58.293/6995/
25000550041.88445.40650265448
43800, 43003800, 430032.138, 34.40031.558, 35.7003856, 41283786, 4284
4 Tilted3800, 43003800, 430032.299, 35.54031.758, 35.7203890, 42643810, 4286
Table 3. Results obtained from the laser tachometer and the MUSIC algorithm.
No. PropellersTachometer Front (RPM)Tachometer Rear (RPM)Radar-Measured MUSIC Rotational Frequency (Hz) FrontRadar-Measured MUSIC Rotational Frequency (Hz) RearEquivalent Rotational Speed Radar Front (RPM)Equivalent Rotational Speed Radar Rear (RPM)
15400/44.986/5398/
17100/58.734/7048/
25000550041.78445.54650145465
43800, 43003800, 430032.599, 36.36132.339, 34.1003912, 43633880, 4092
4 Tilted3800, 43003800, 430032.299, 35.62031.818, 35.5003876, 42743818, 4260
Disclaimer/Publisher’s Note: The statements, opinions and data contained in all publications are solely those of the individual author(s) and contributor(s) and not of MDPI and/or the editor(s). MDPI and/or the editor(s) disclaim responsibility for any injury to people or property resulting from any ideas, methods, instructions or products referred to in the content.

