

Integrated Geophysical Imaging and Remote Sensing for Enhancing Geological Interpretation of Landslides with Uncertainty Estimation—A Case Study from Cisiec, Poland
 , , , , and
Abstract
:1. Introduction
2. Materials and Methods
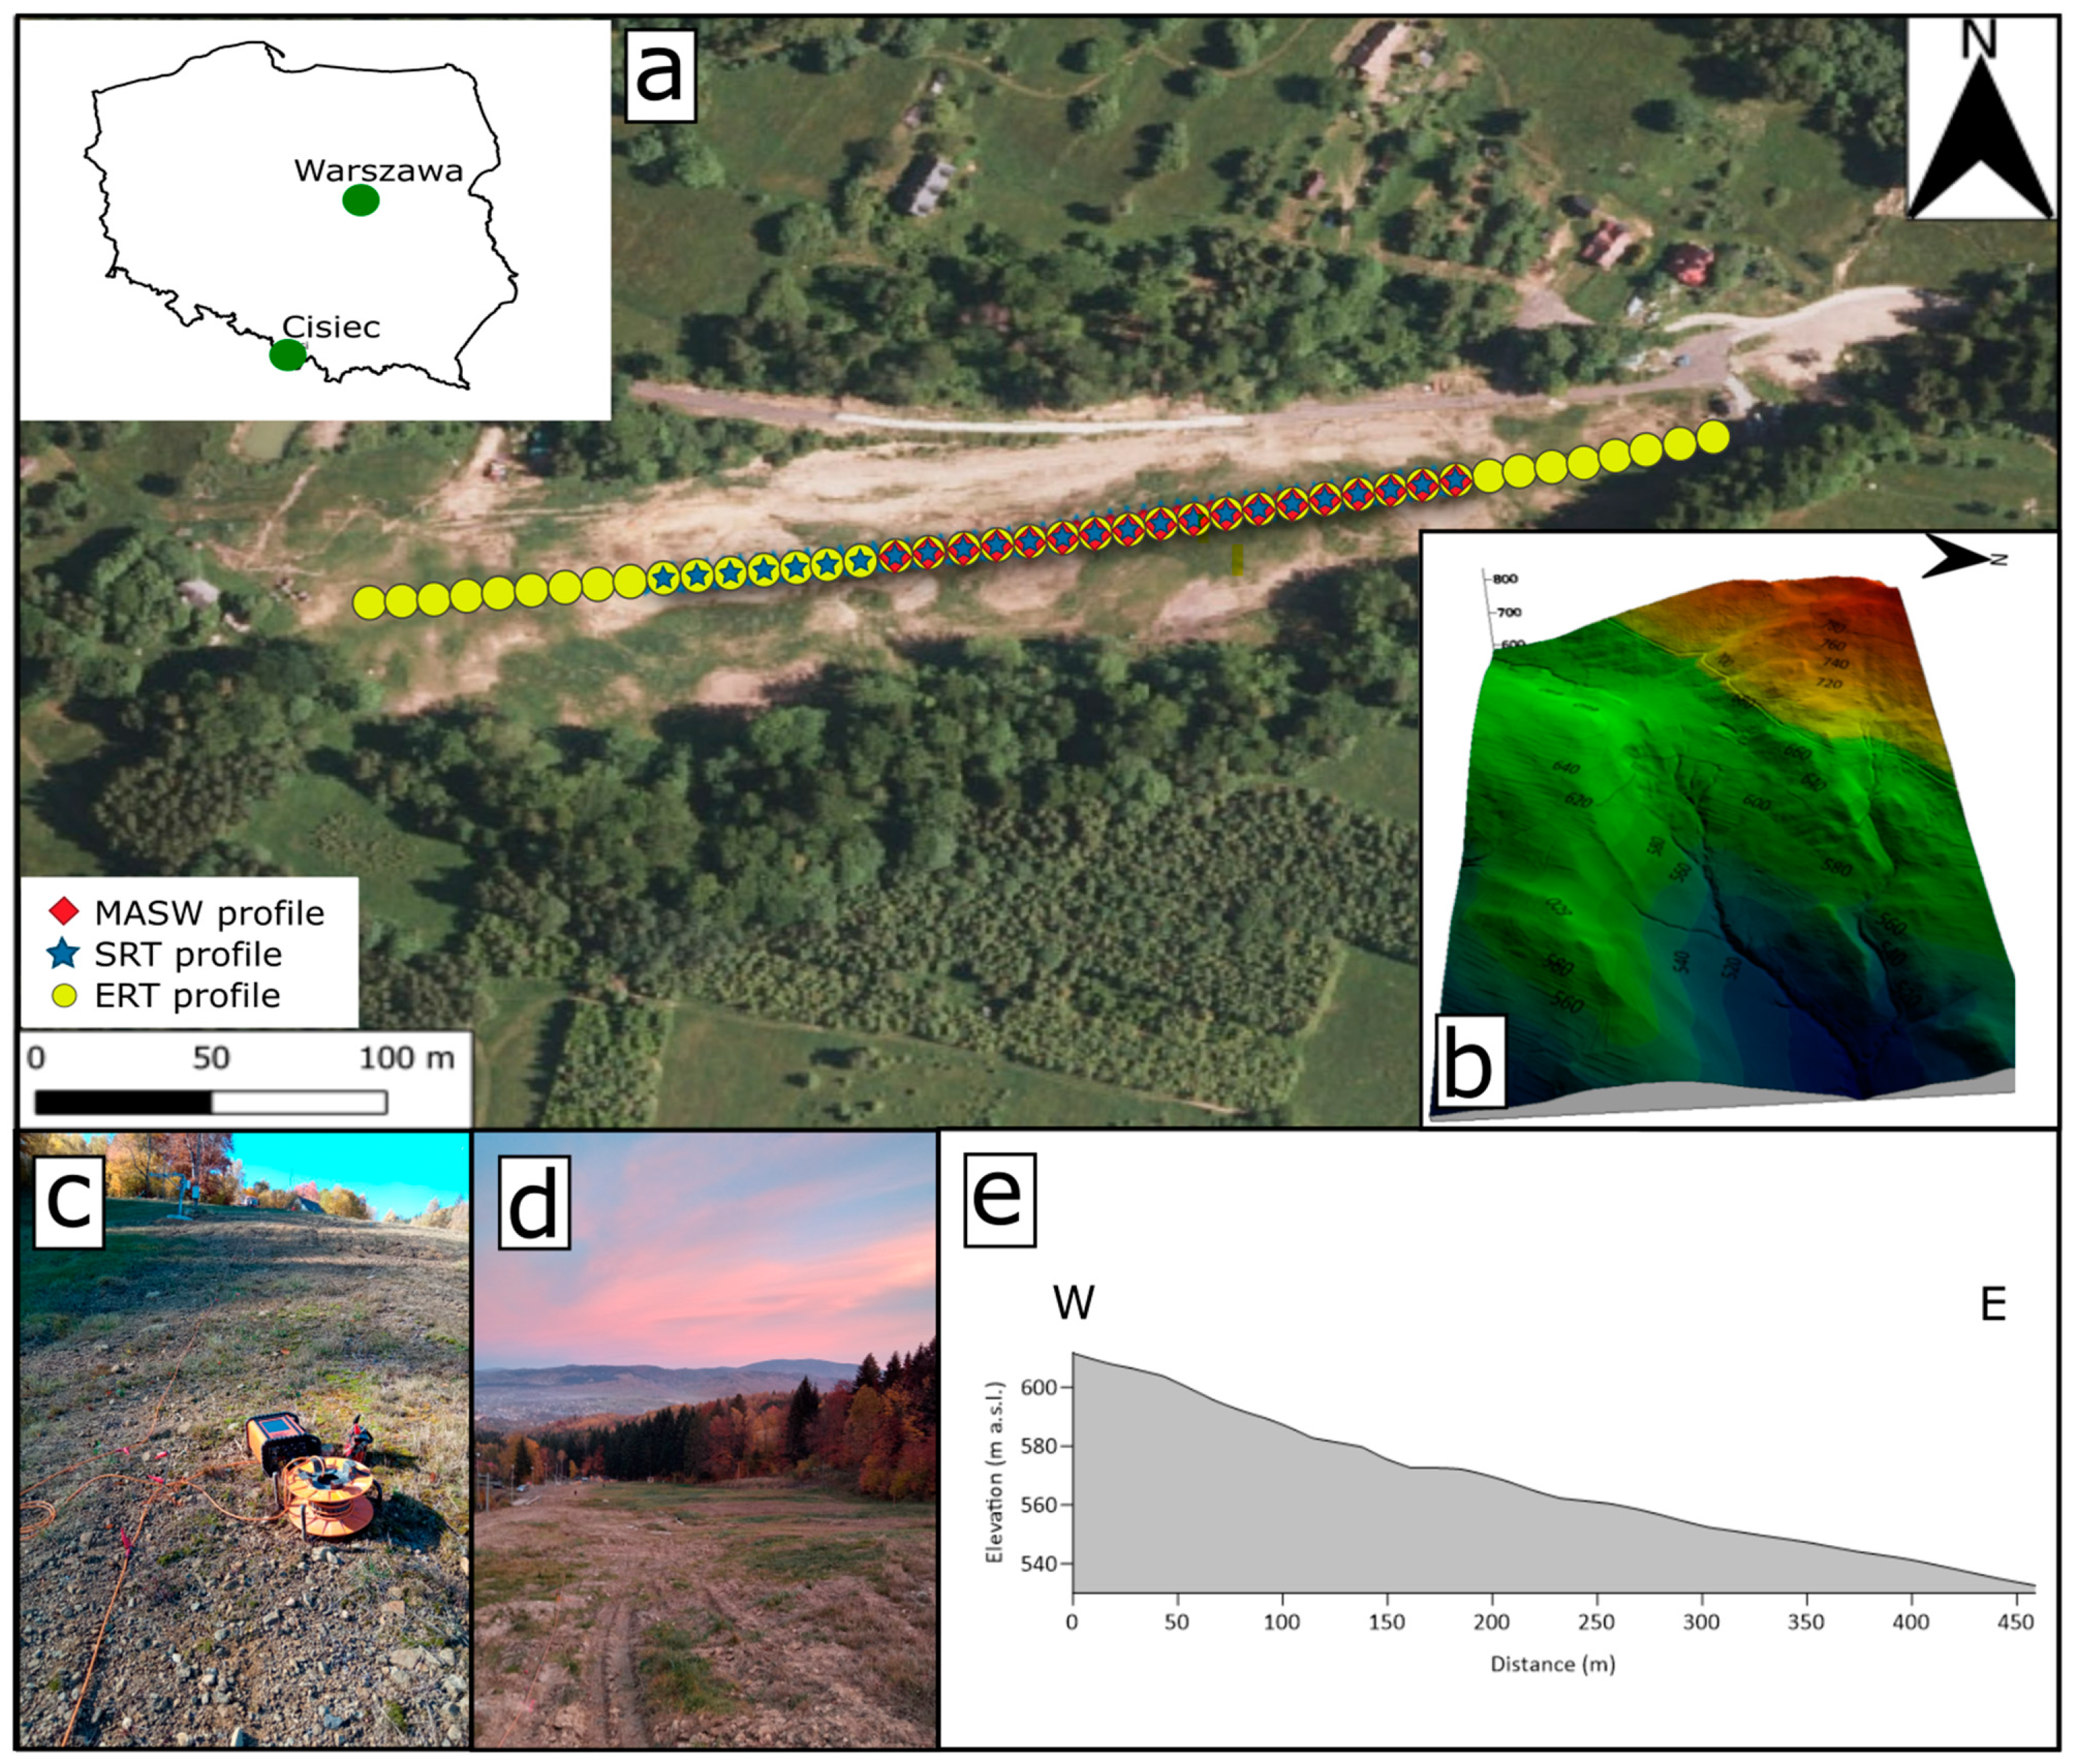
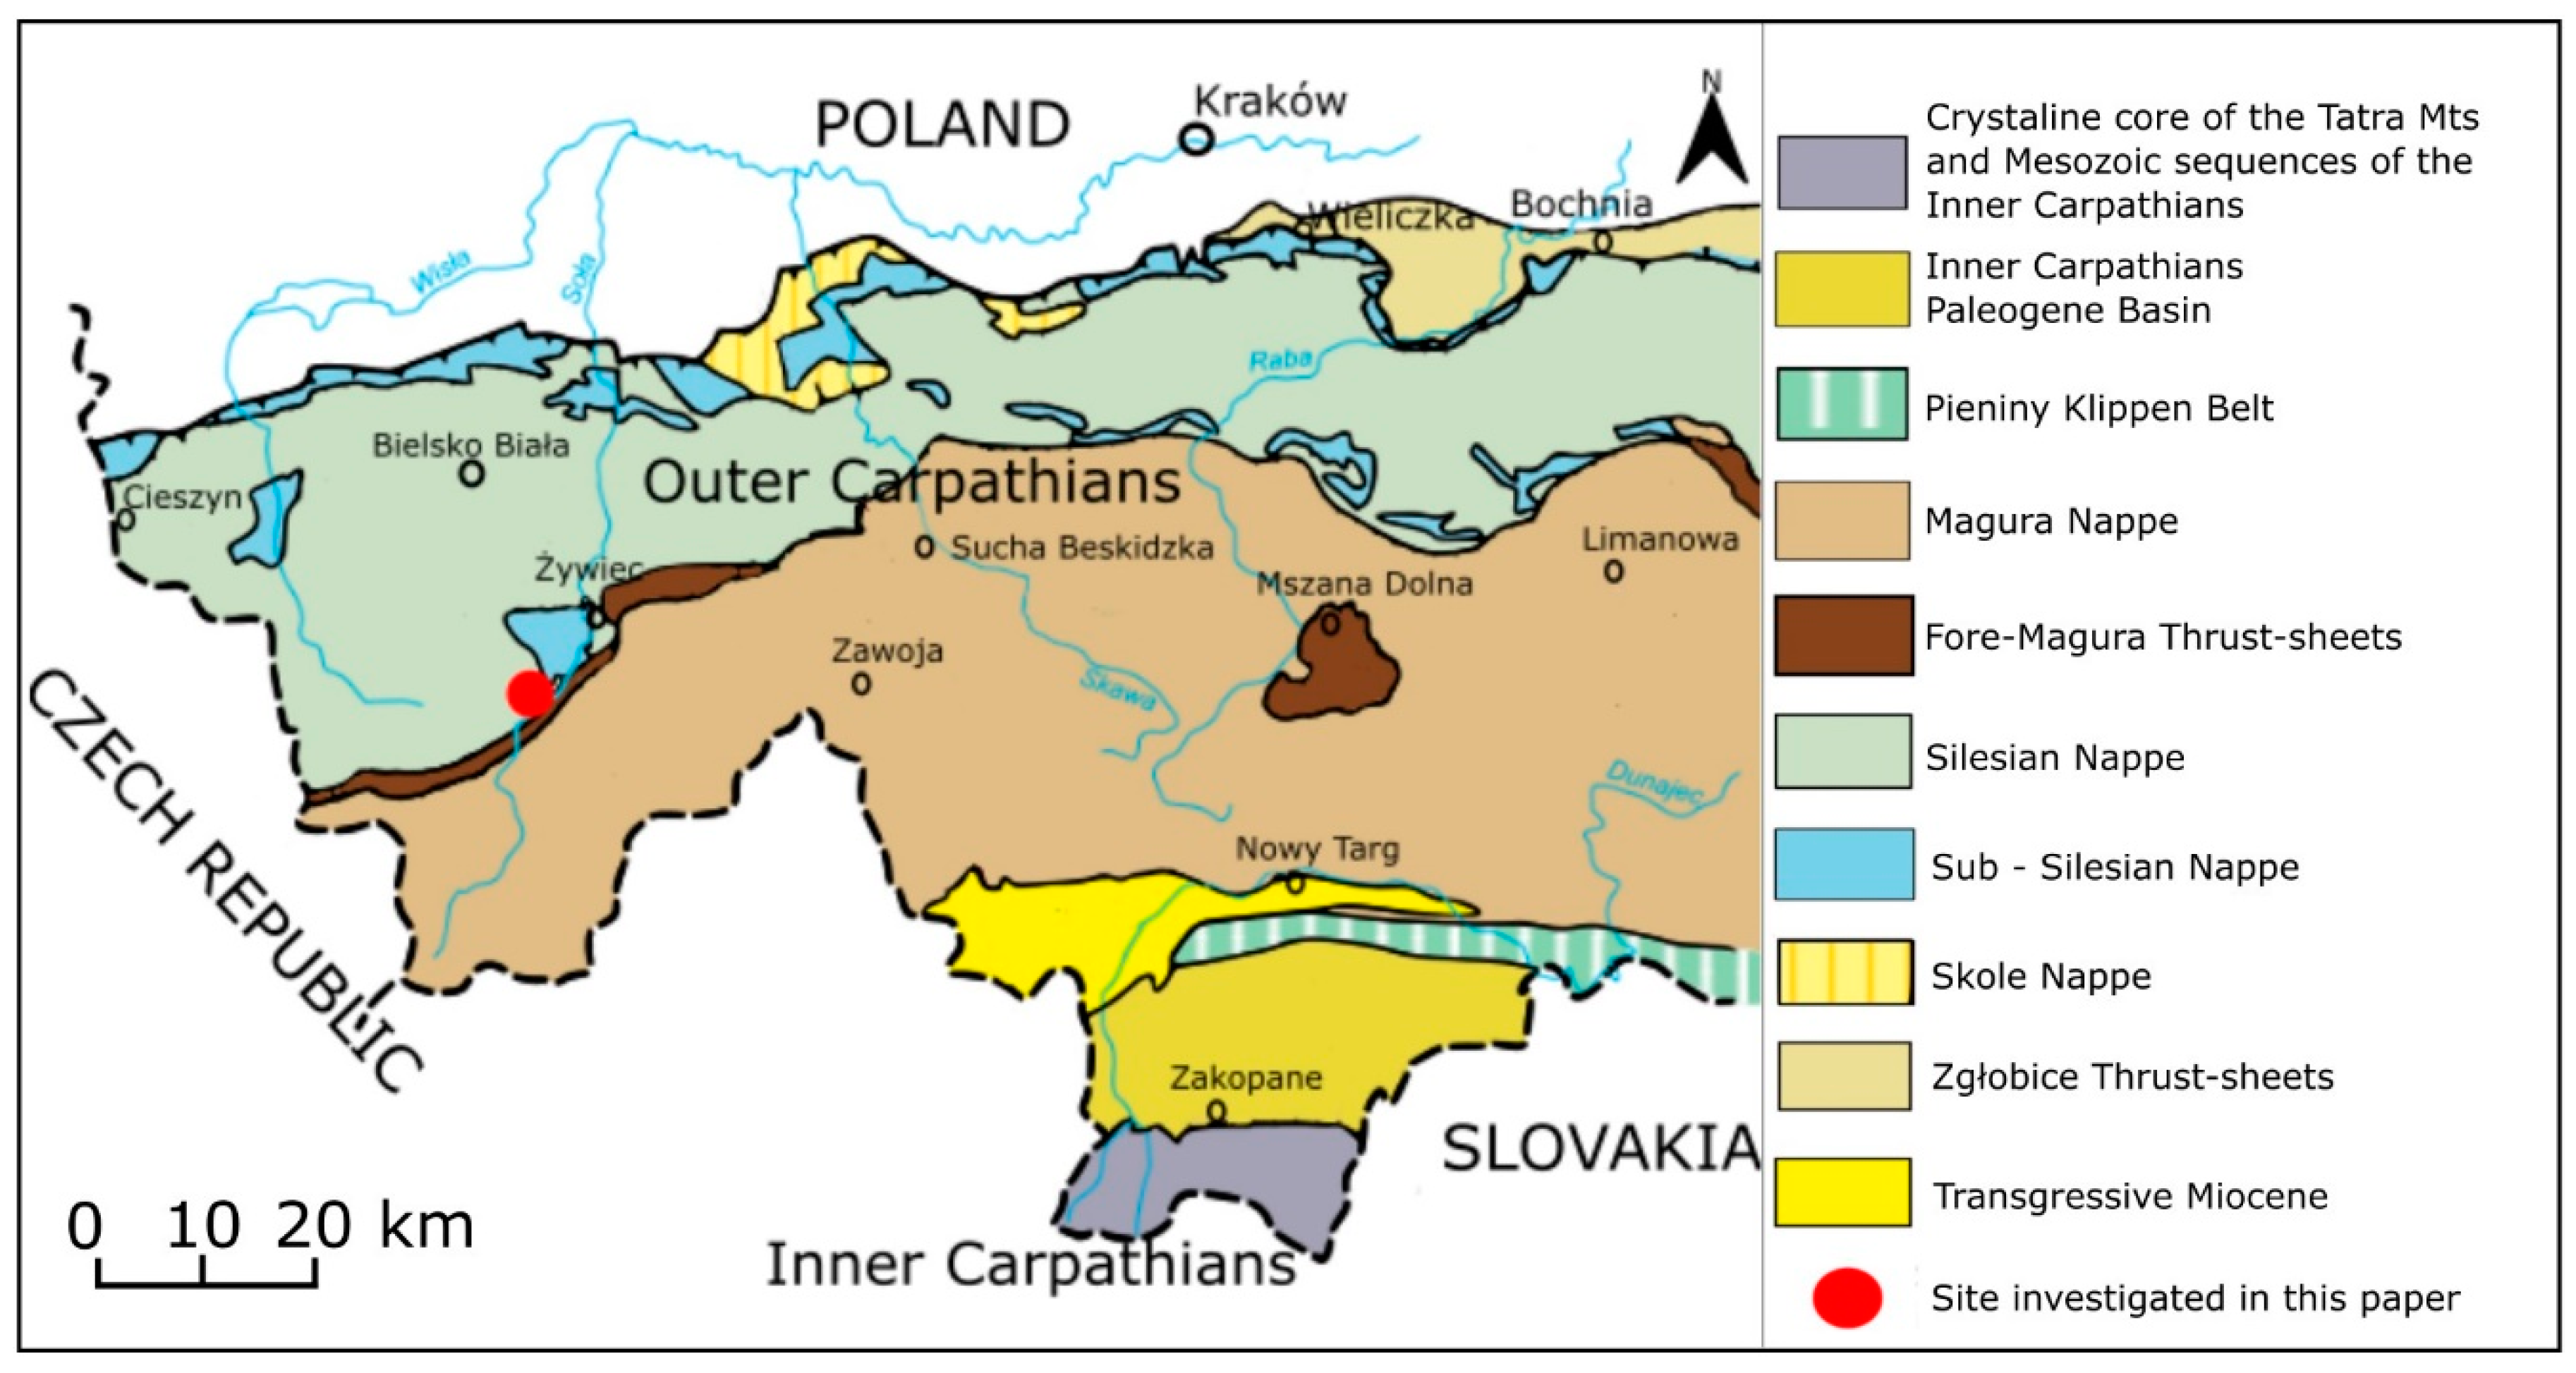
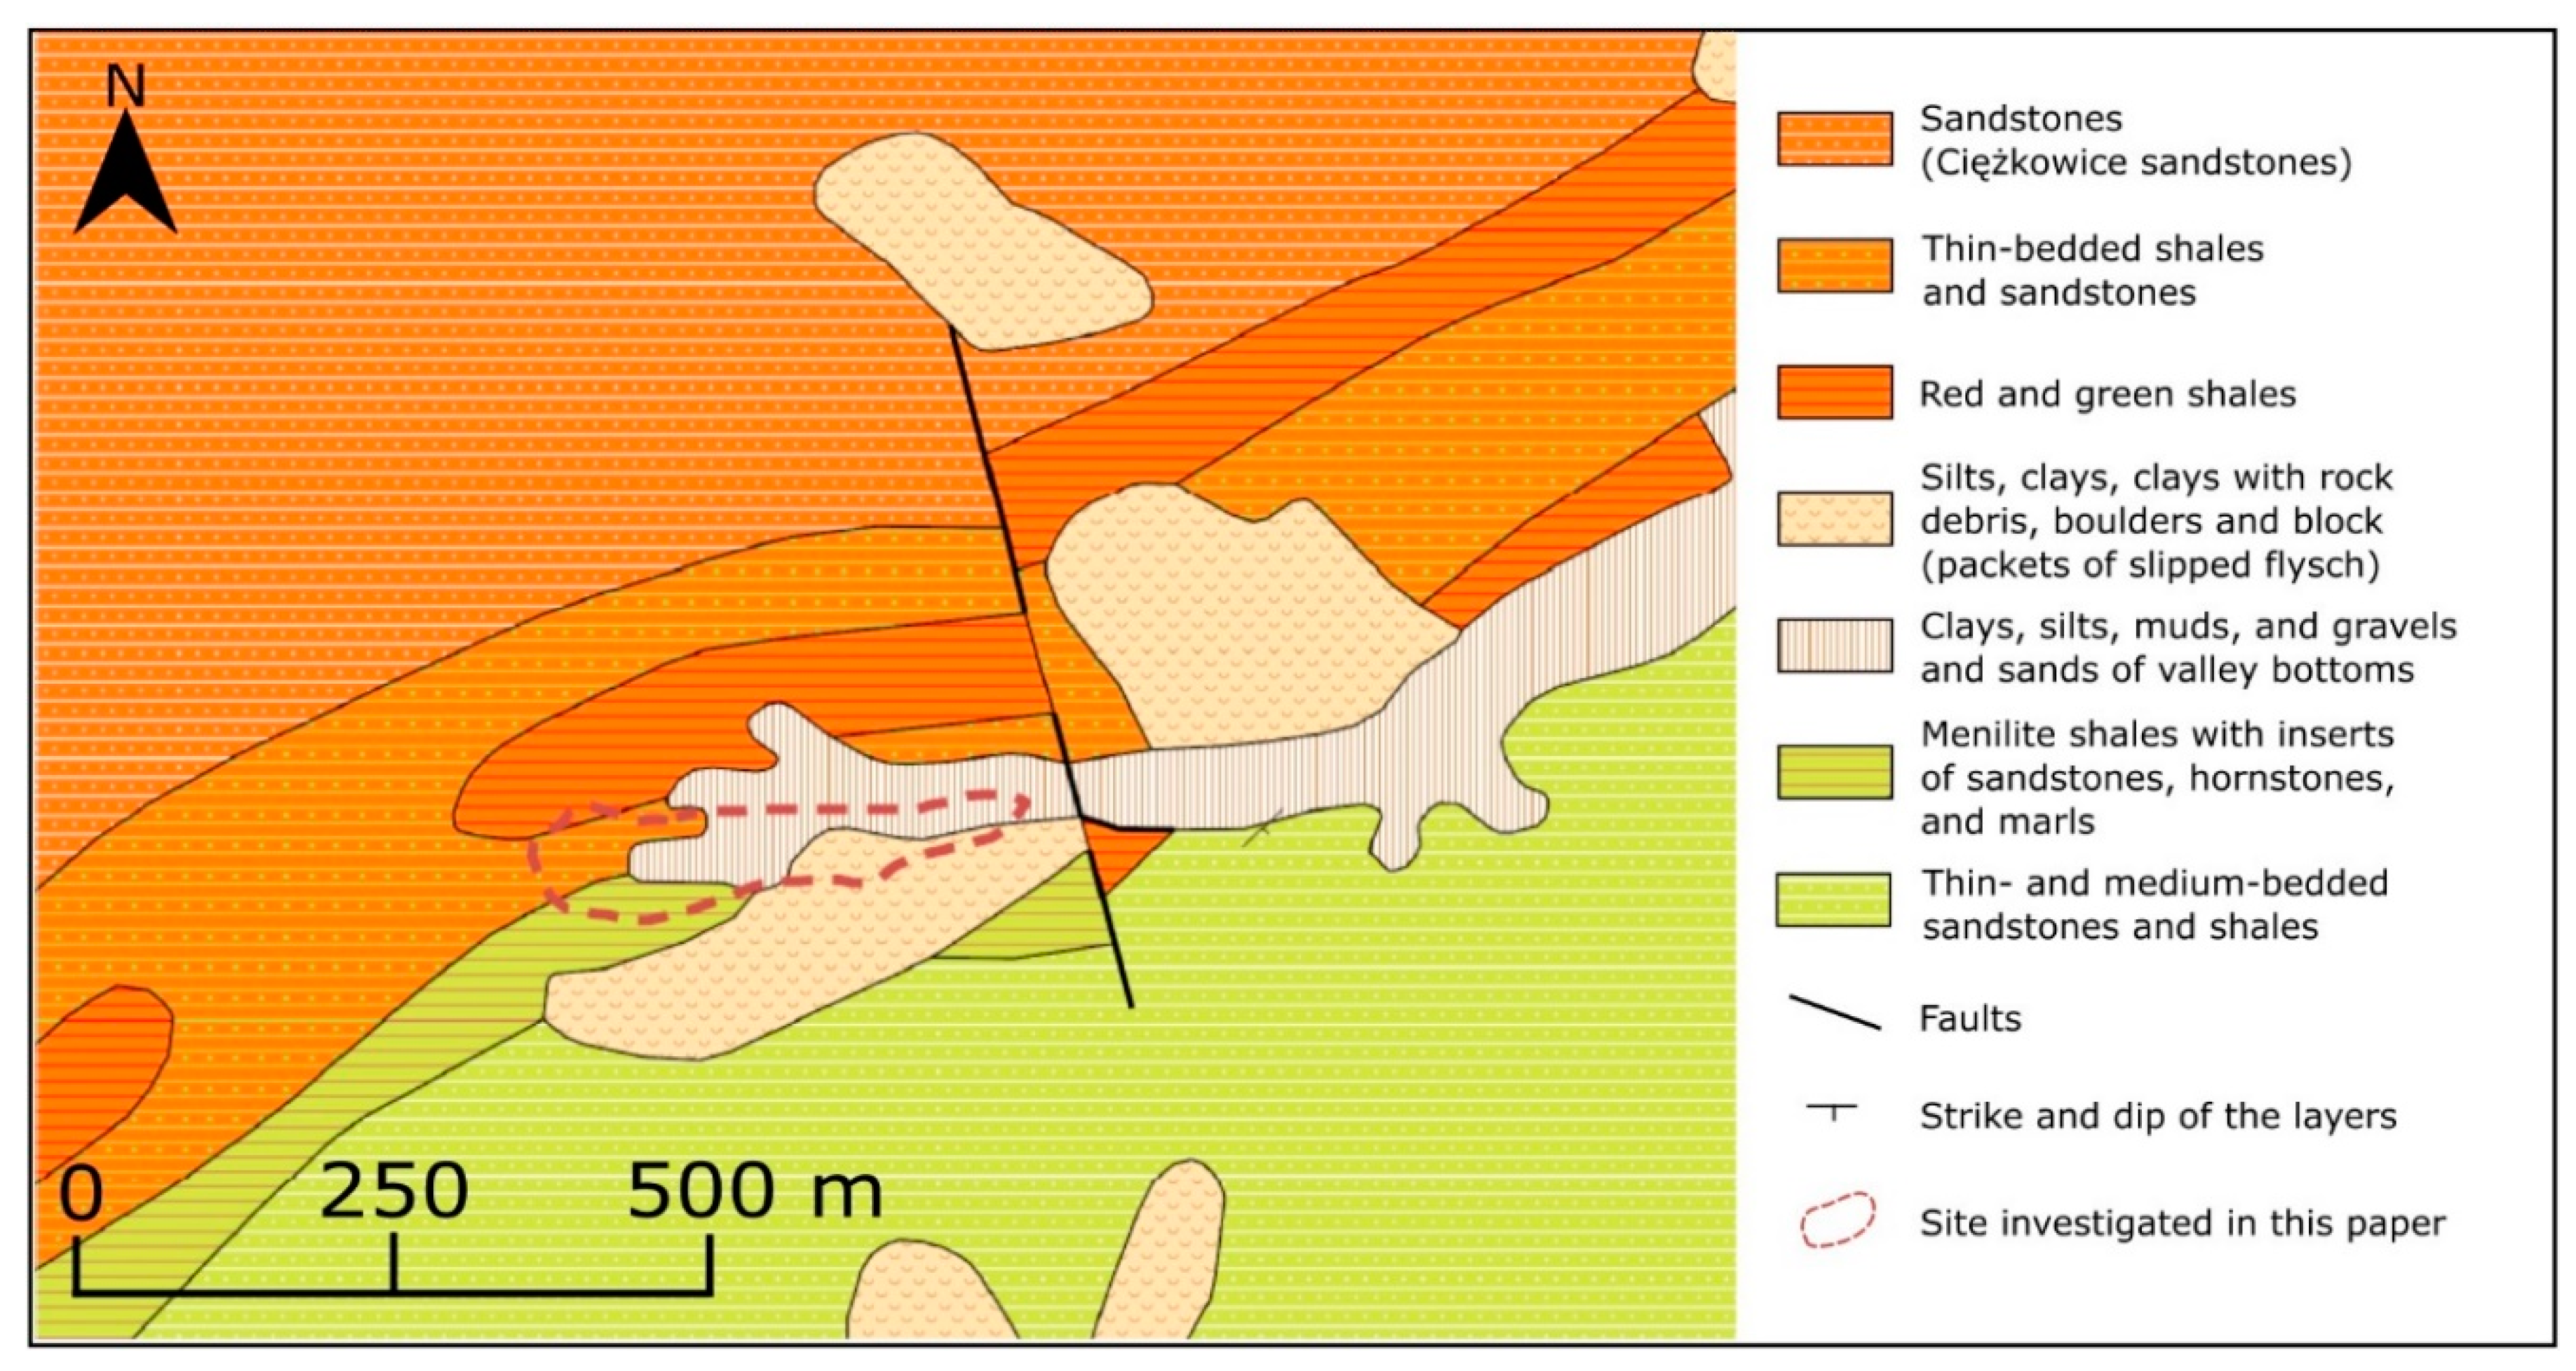
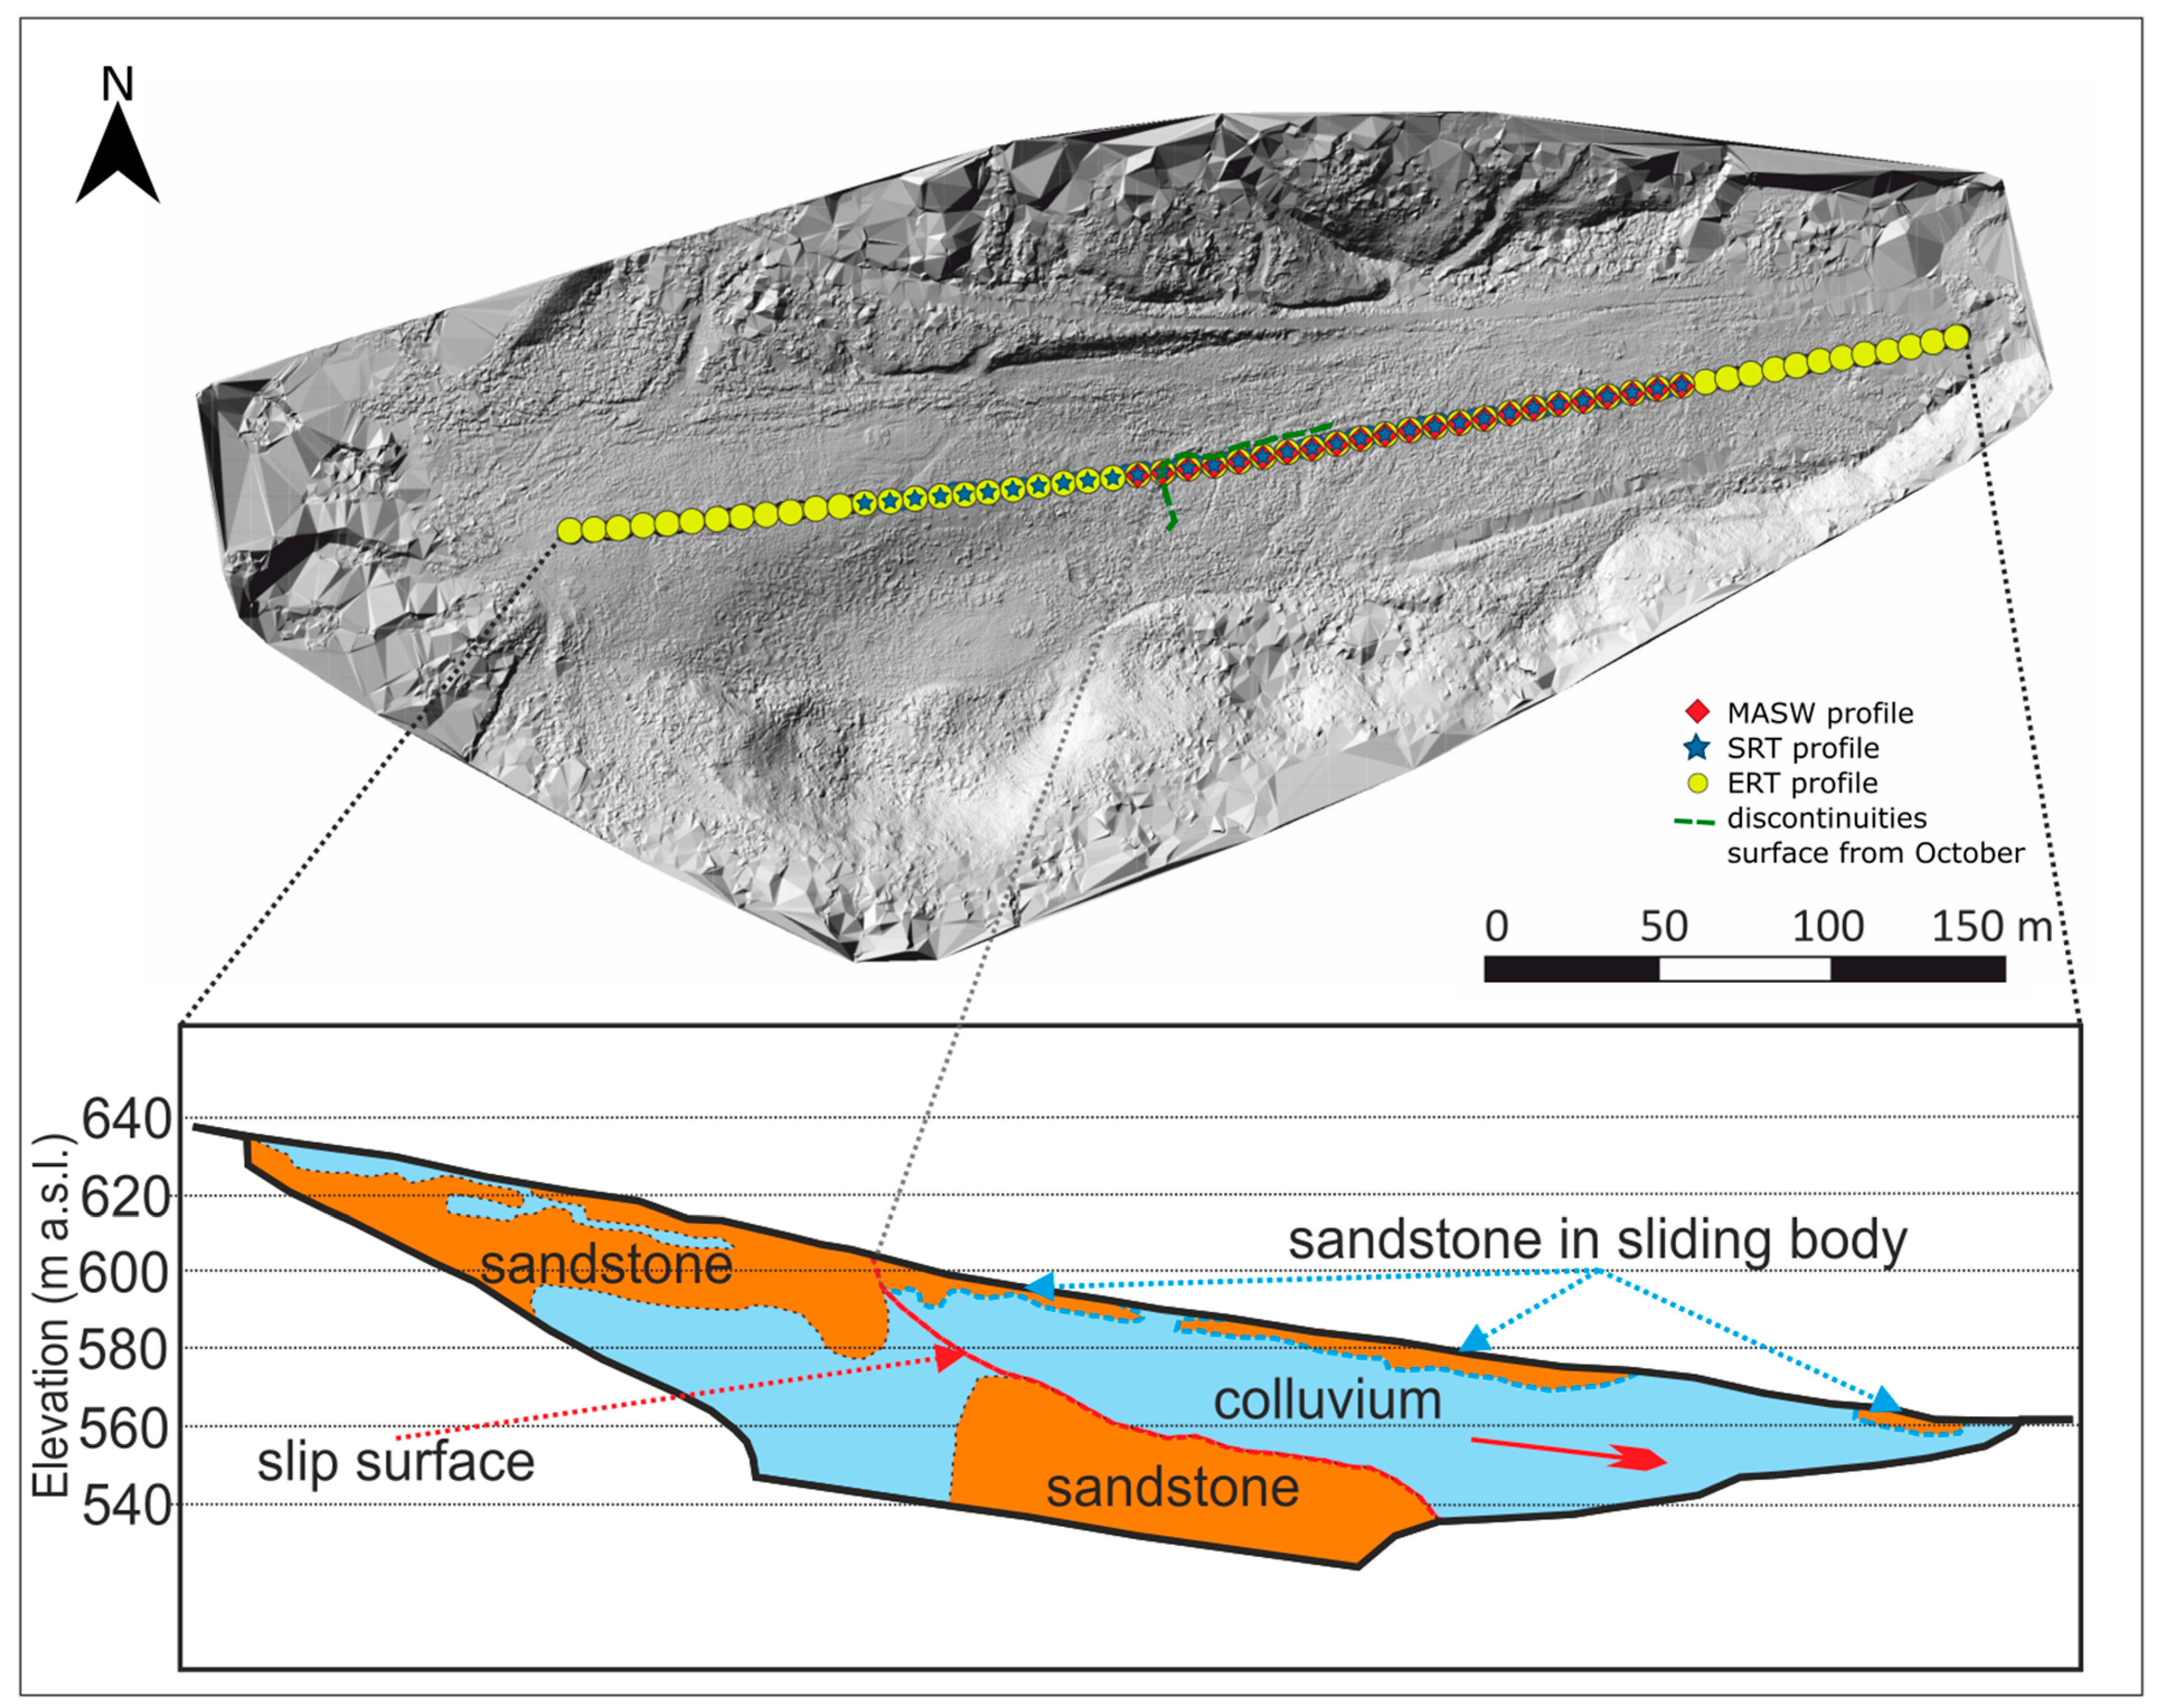
2.1. Study Area
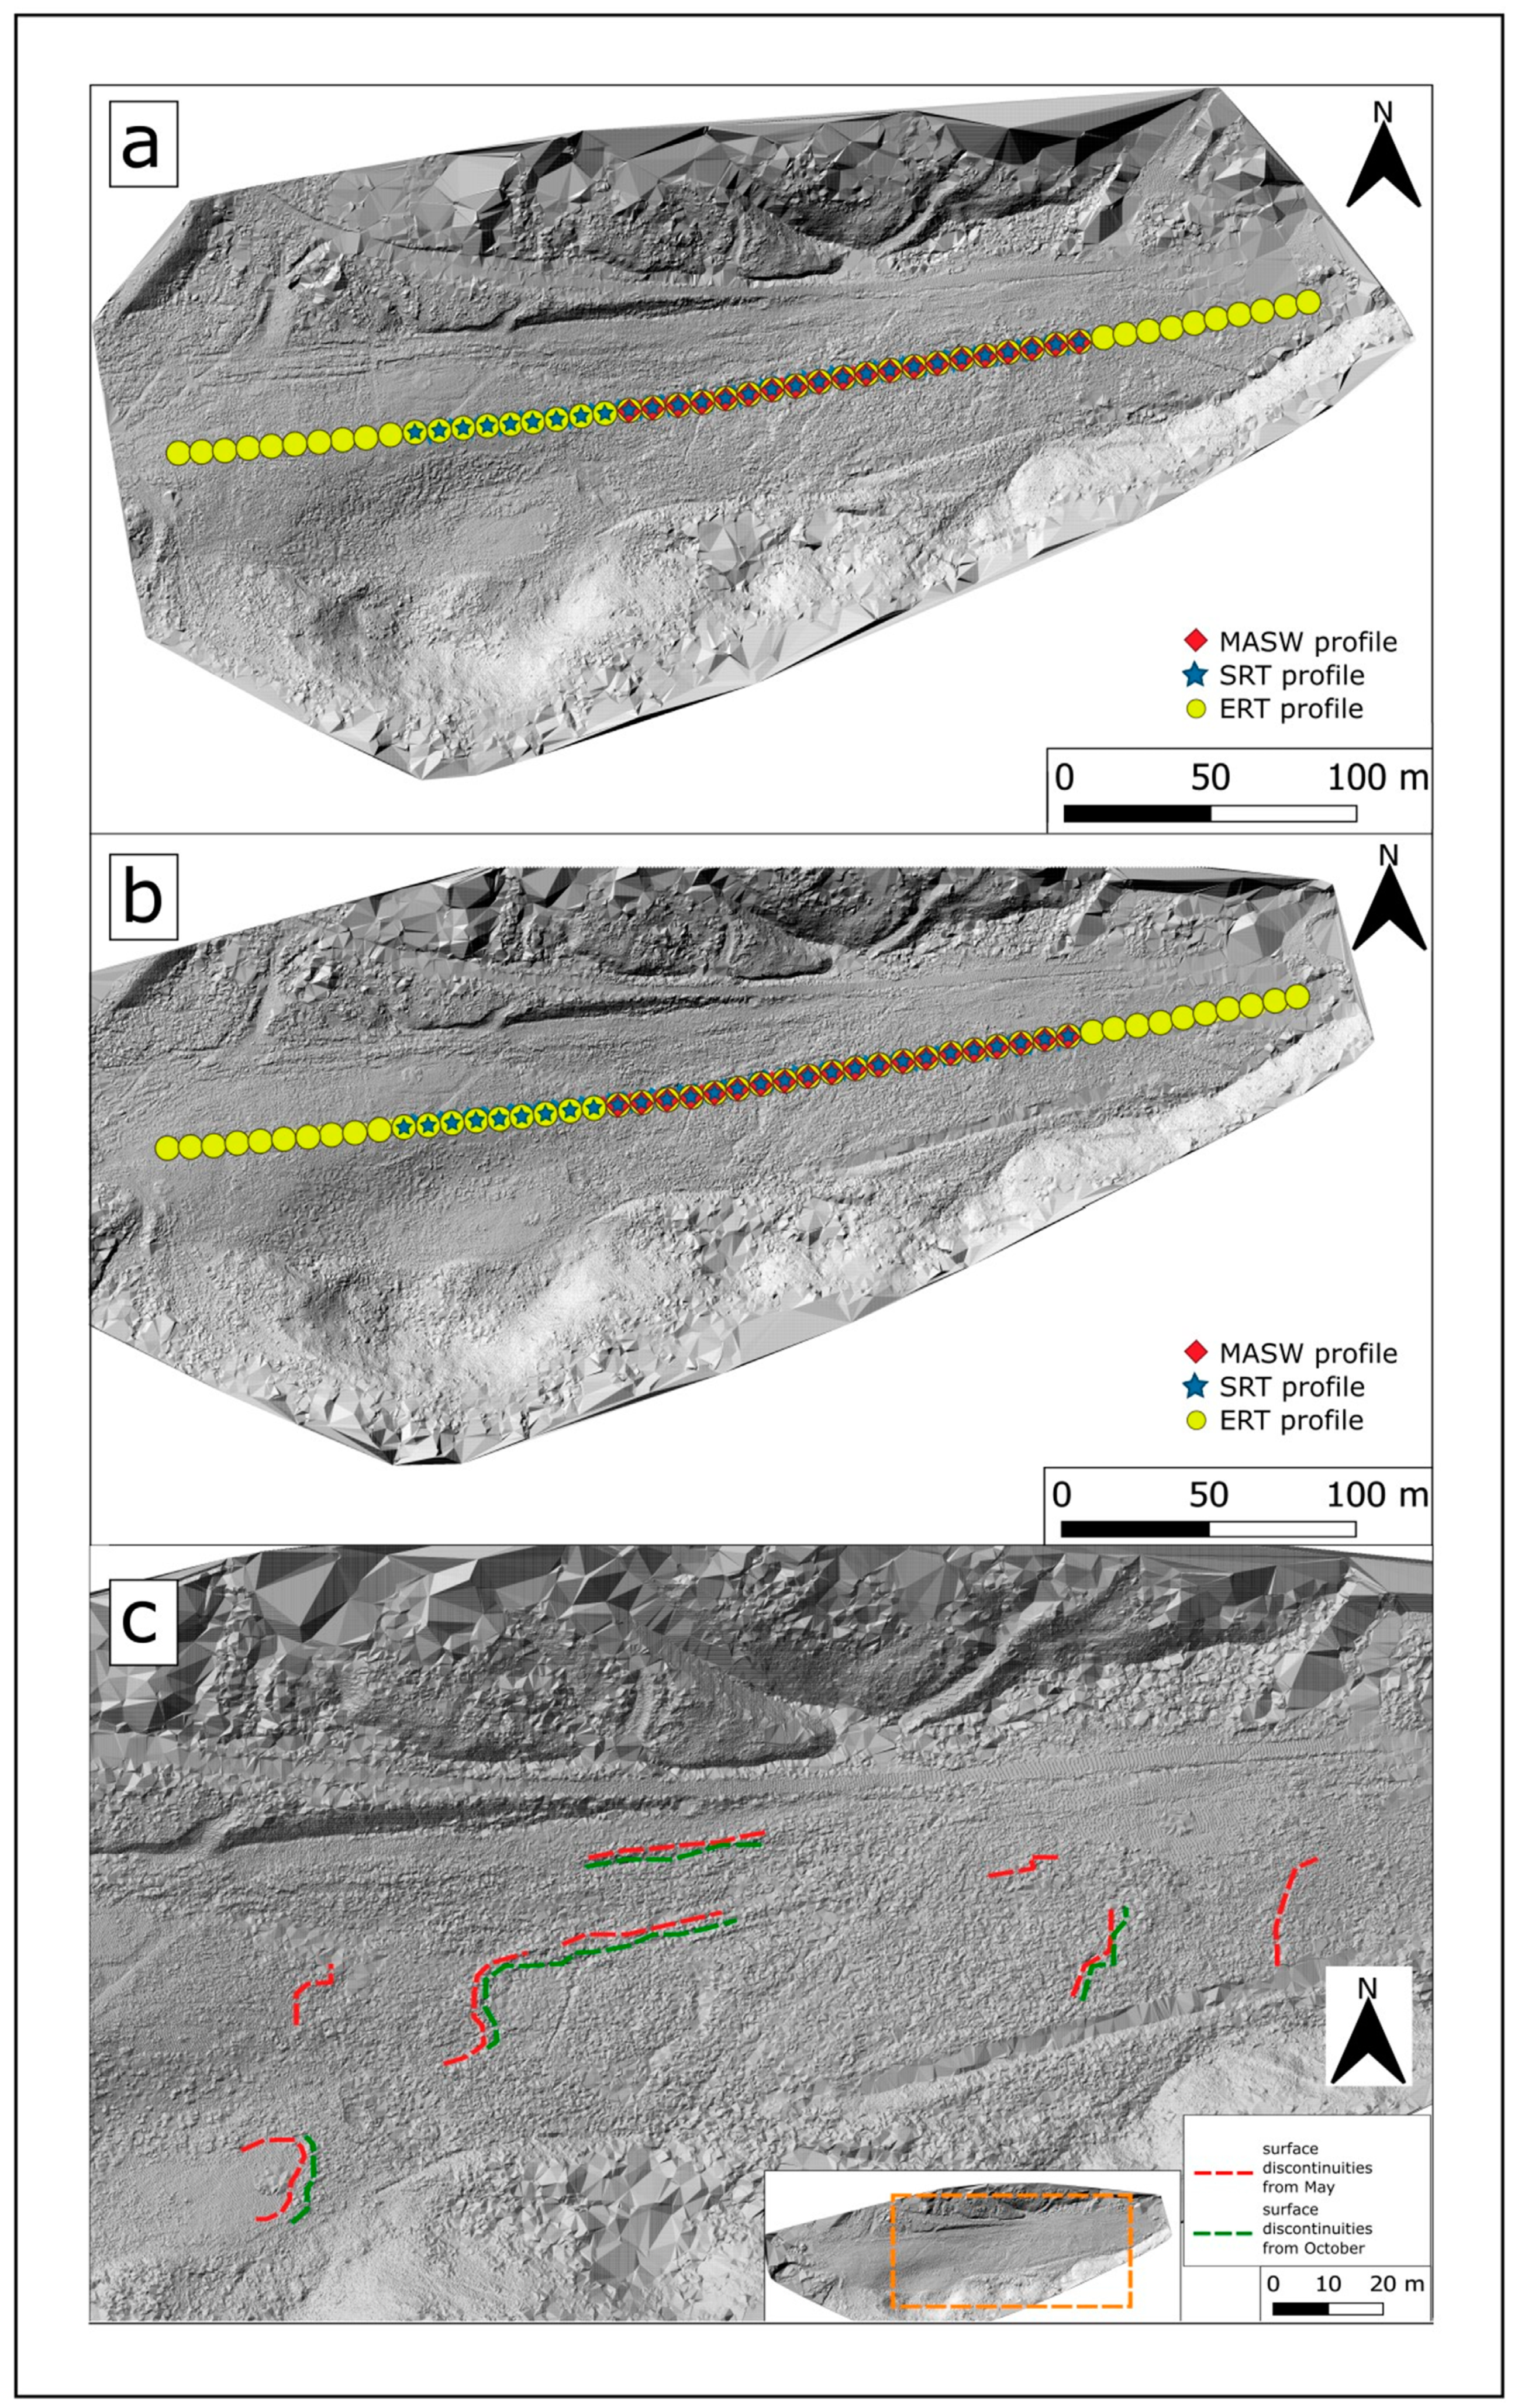
2.2. Fieldworks
2.3. Data Processing
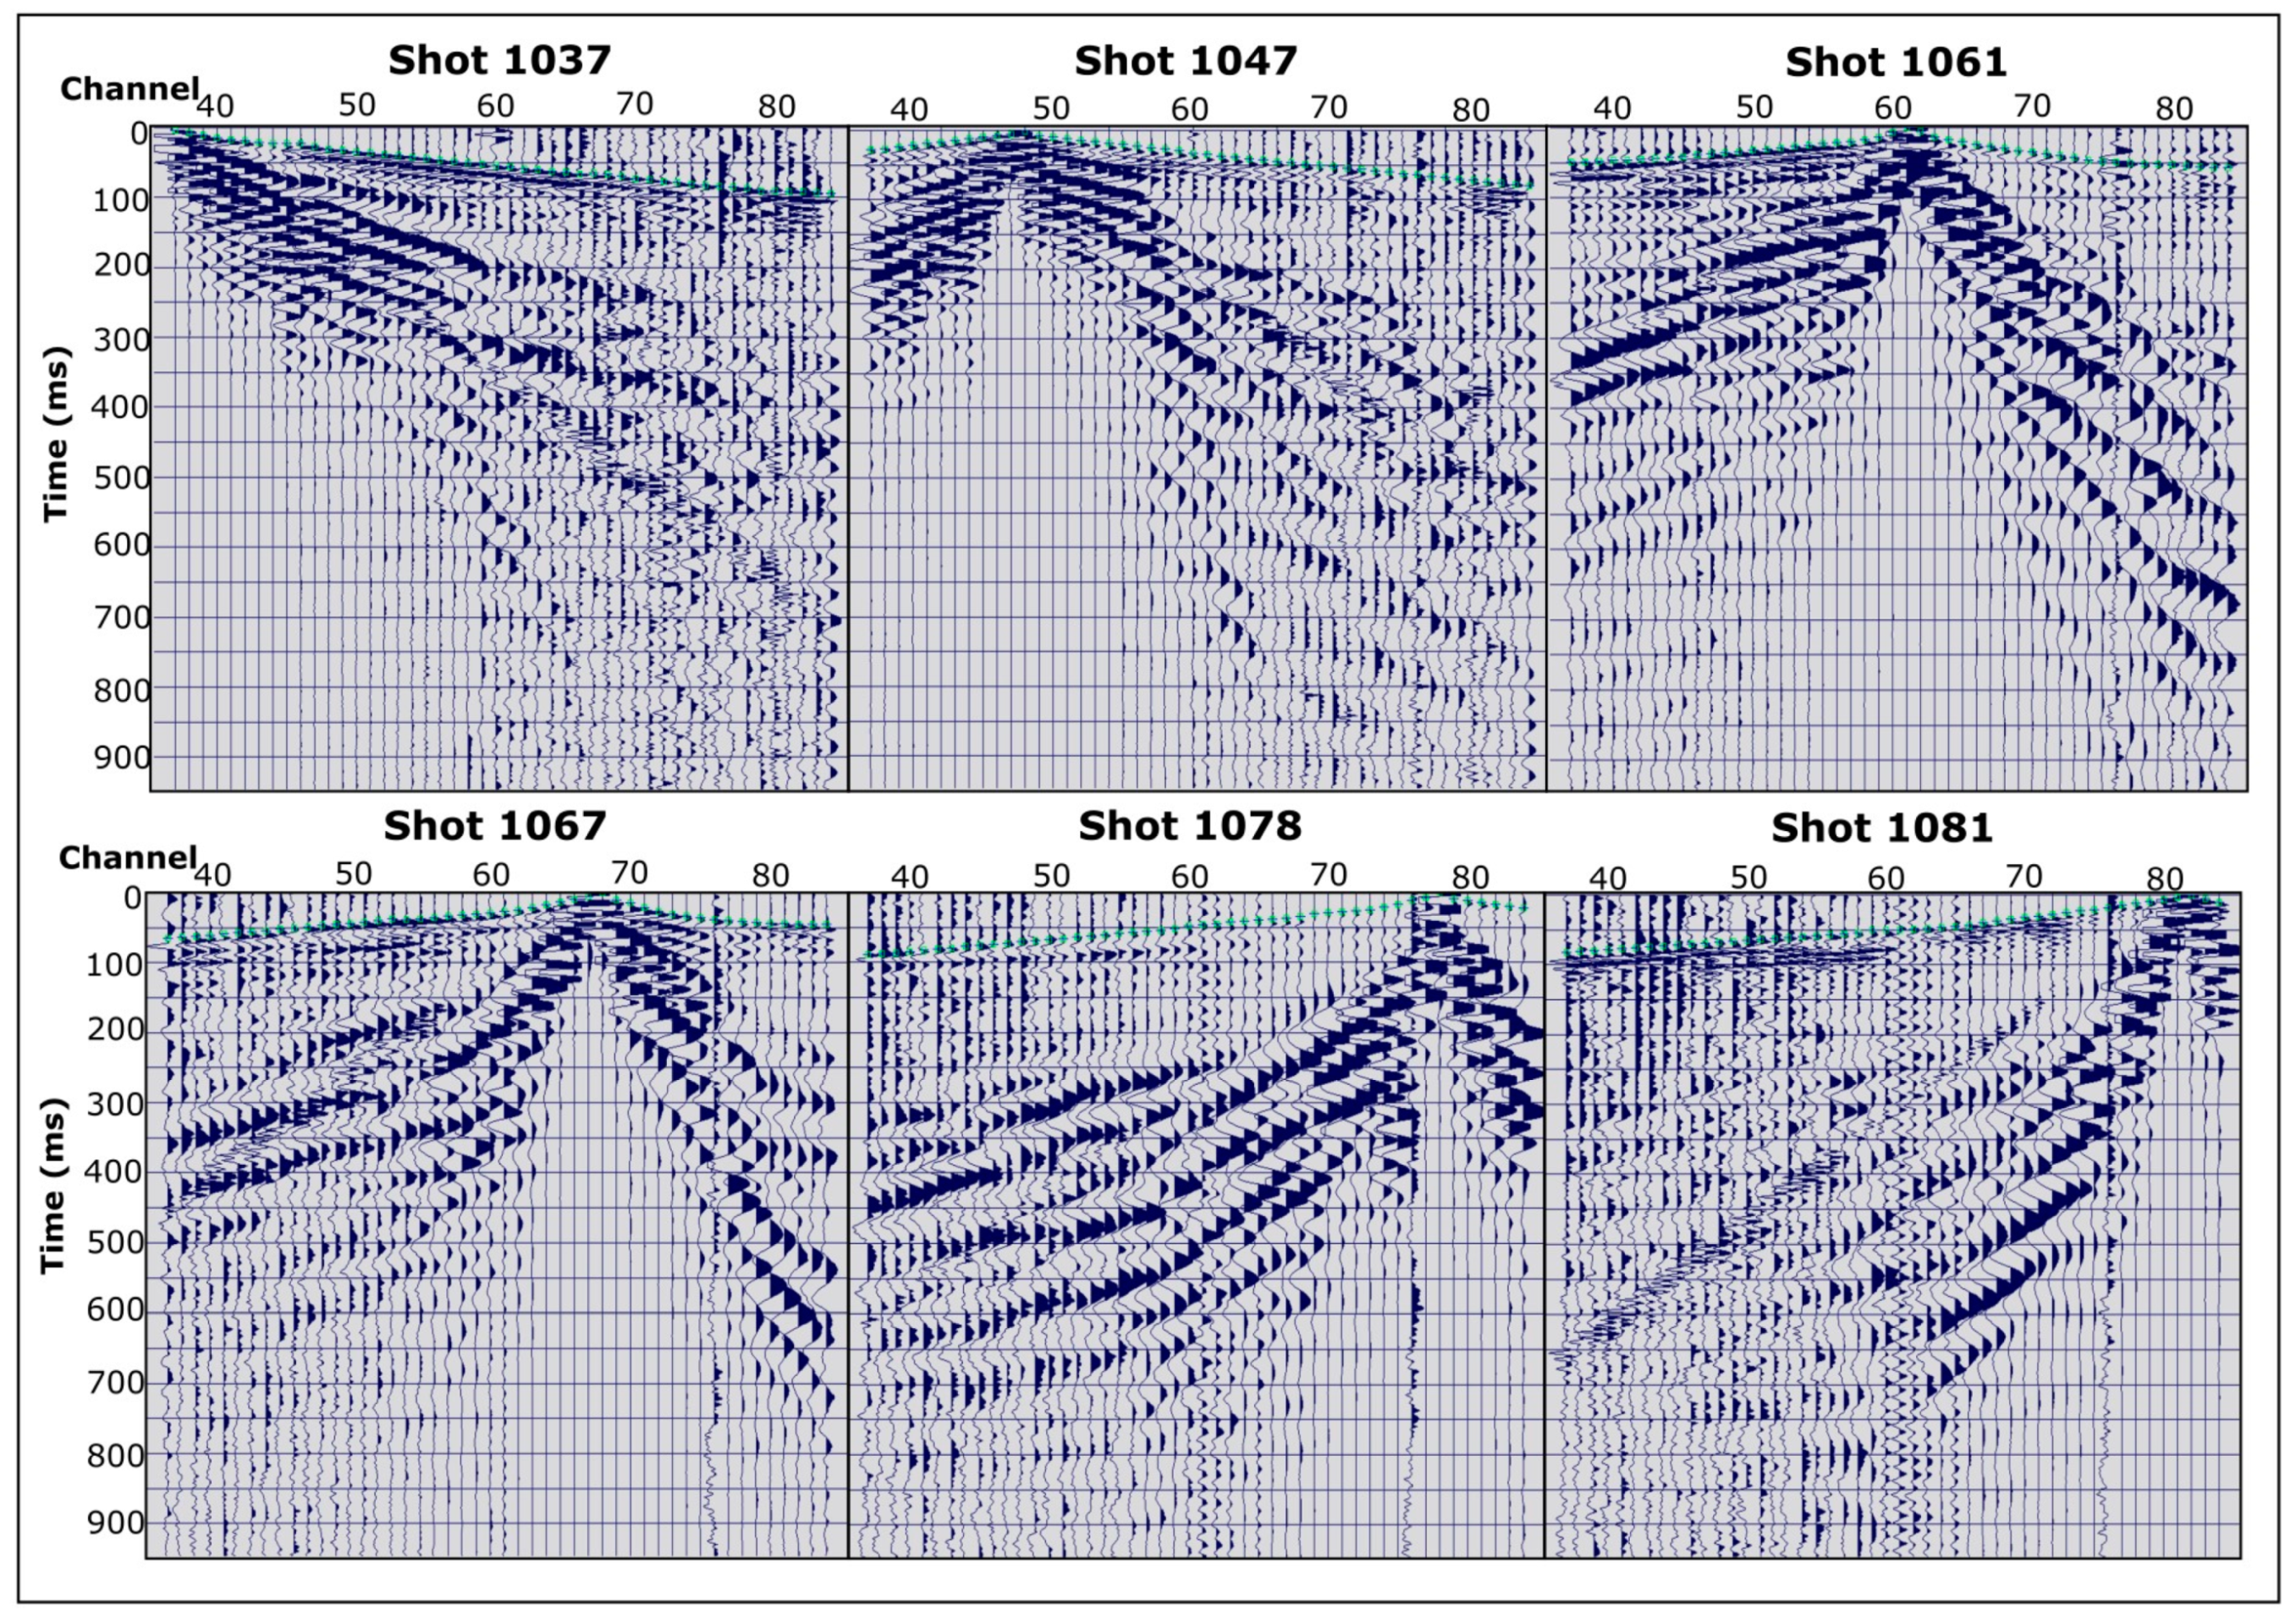
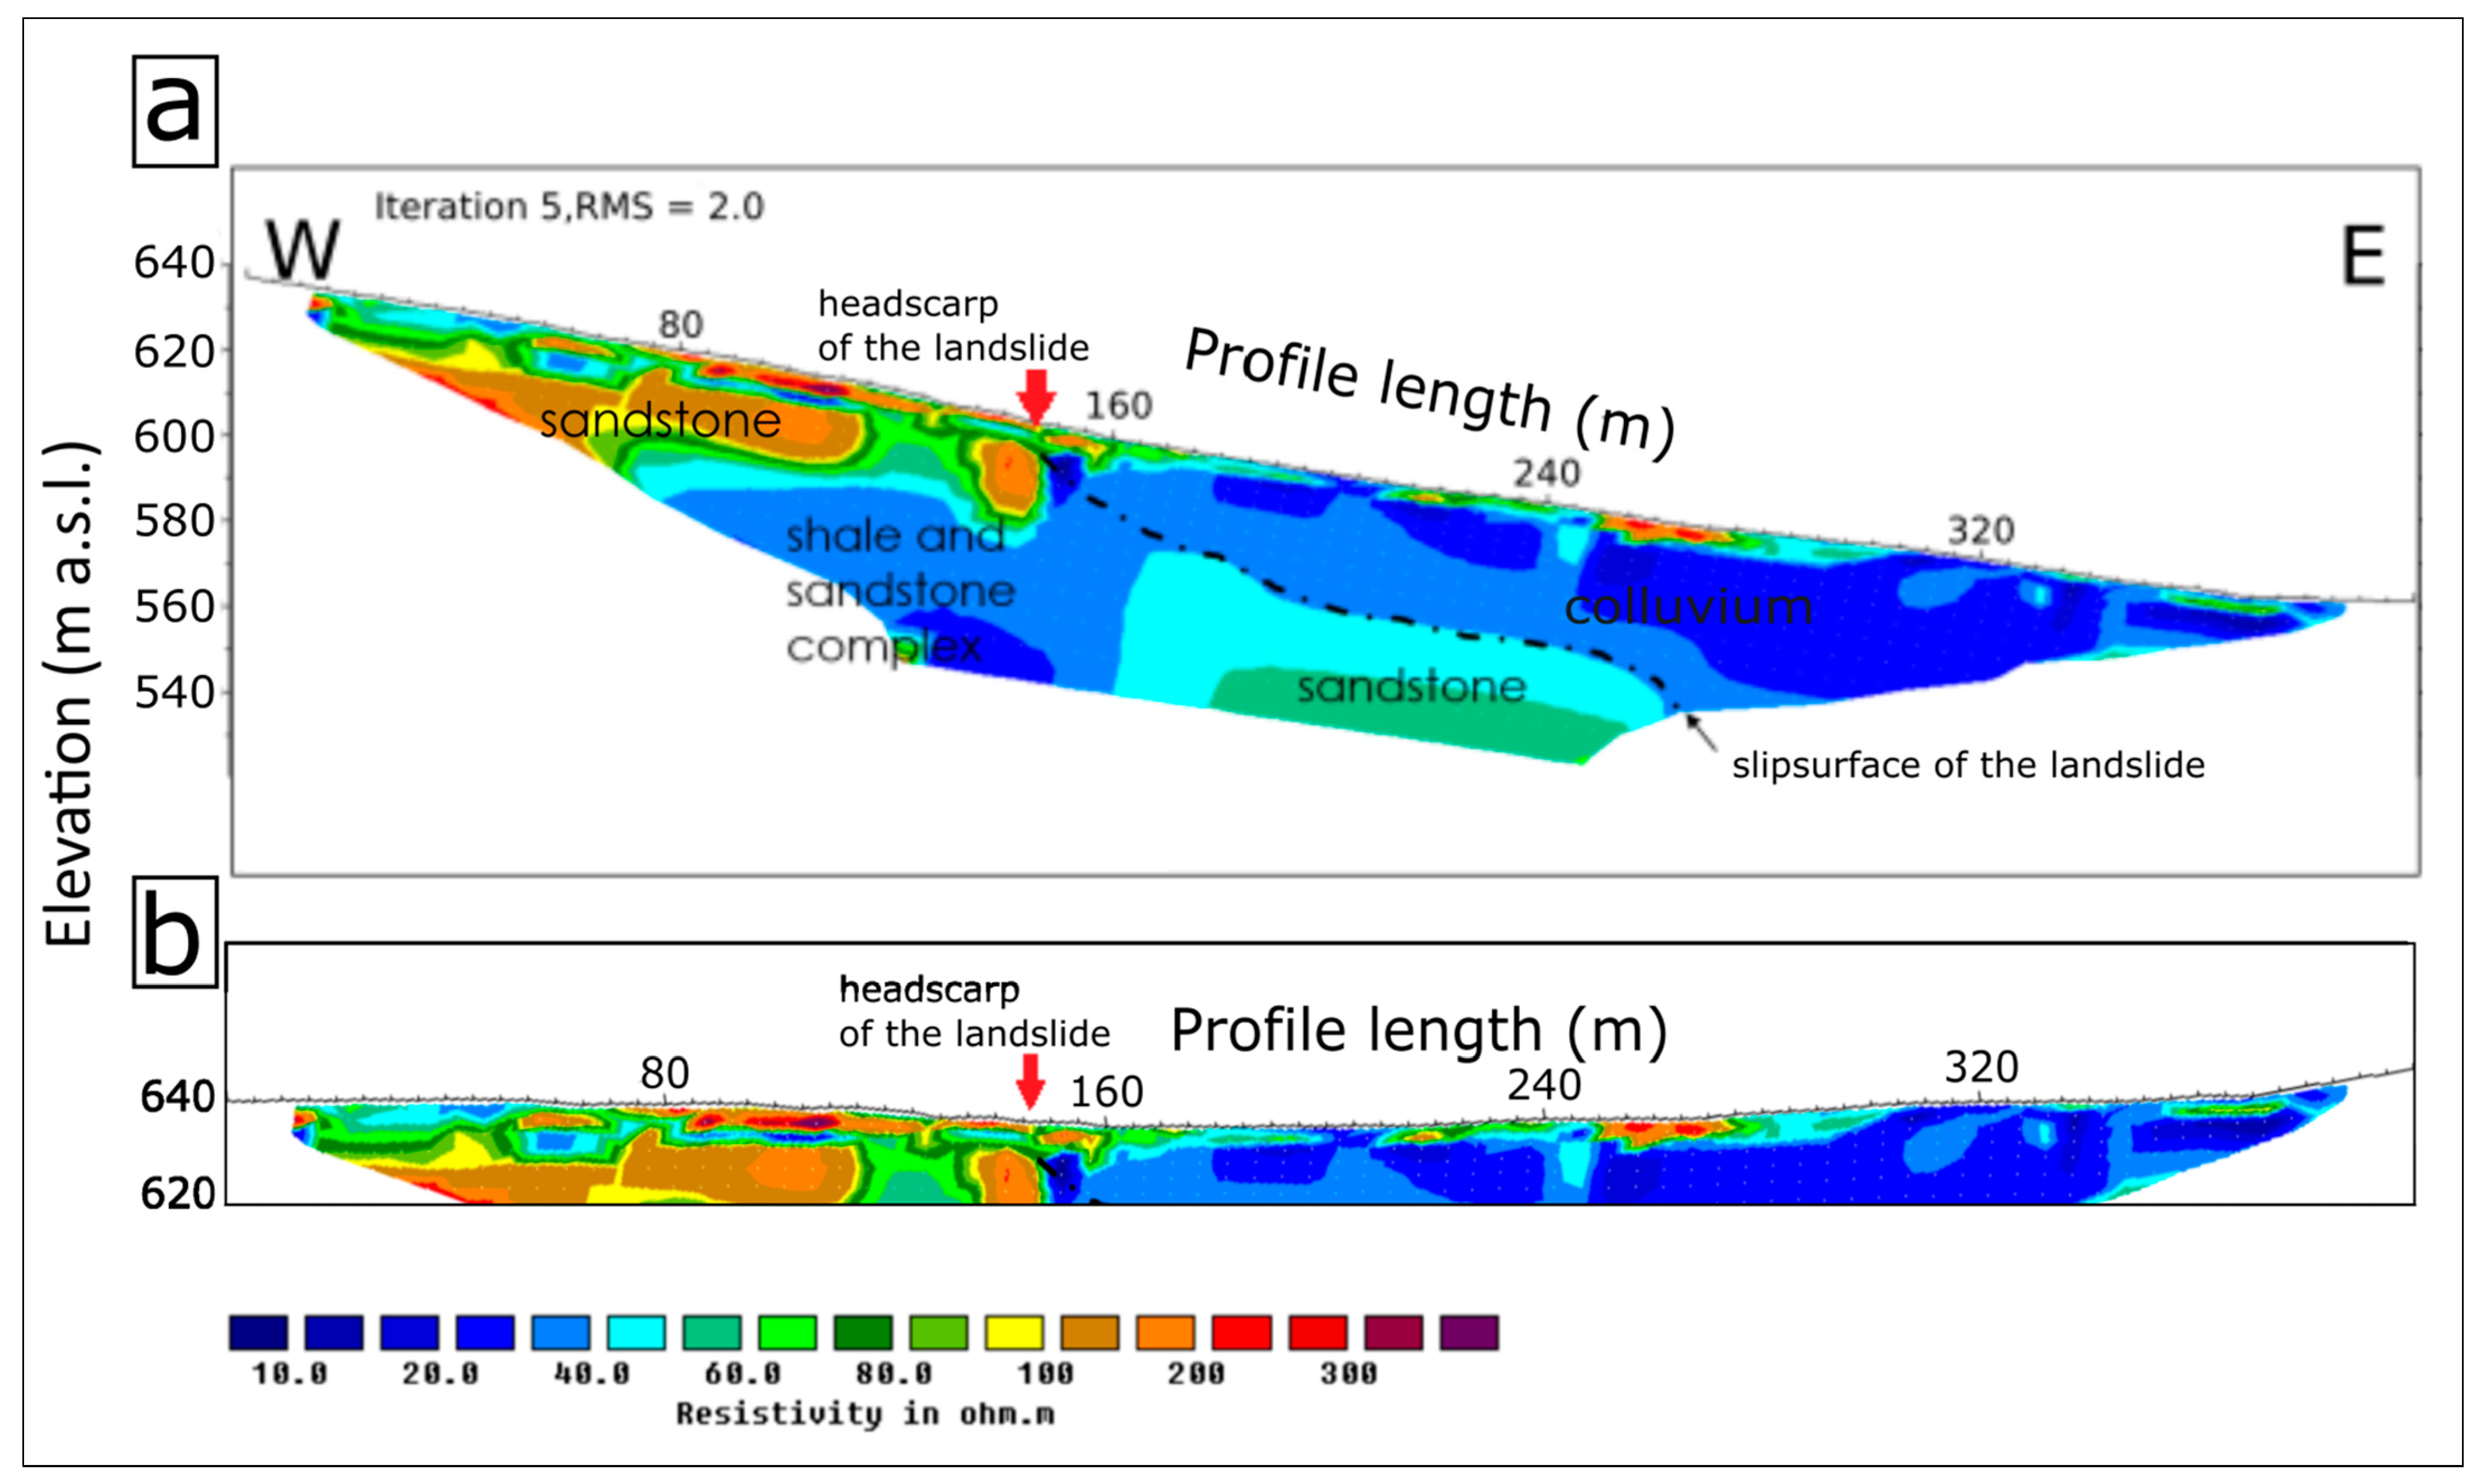
2.3.1. Electrical Resistivity Tomography
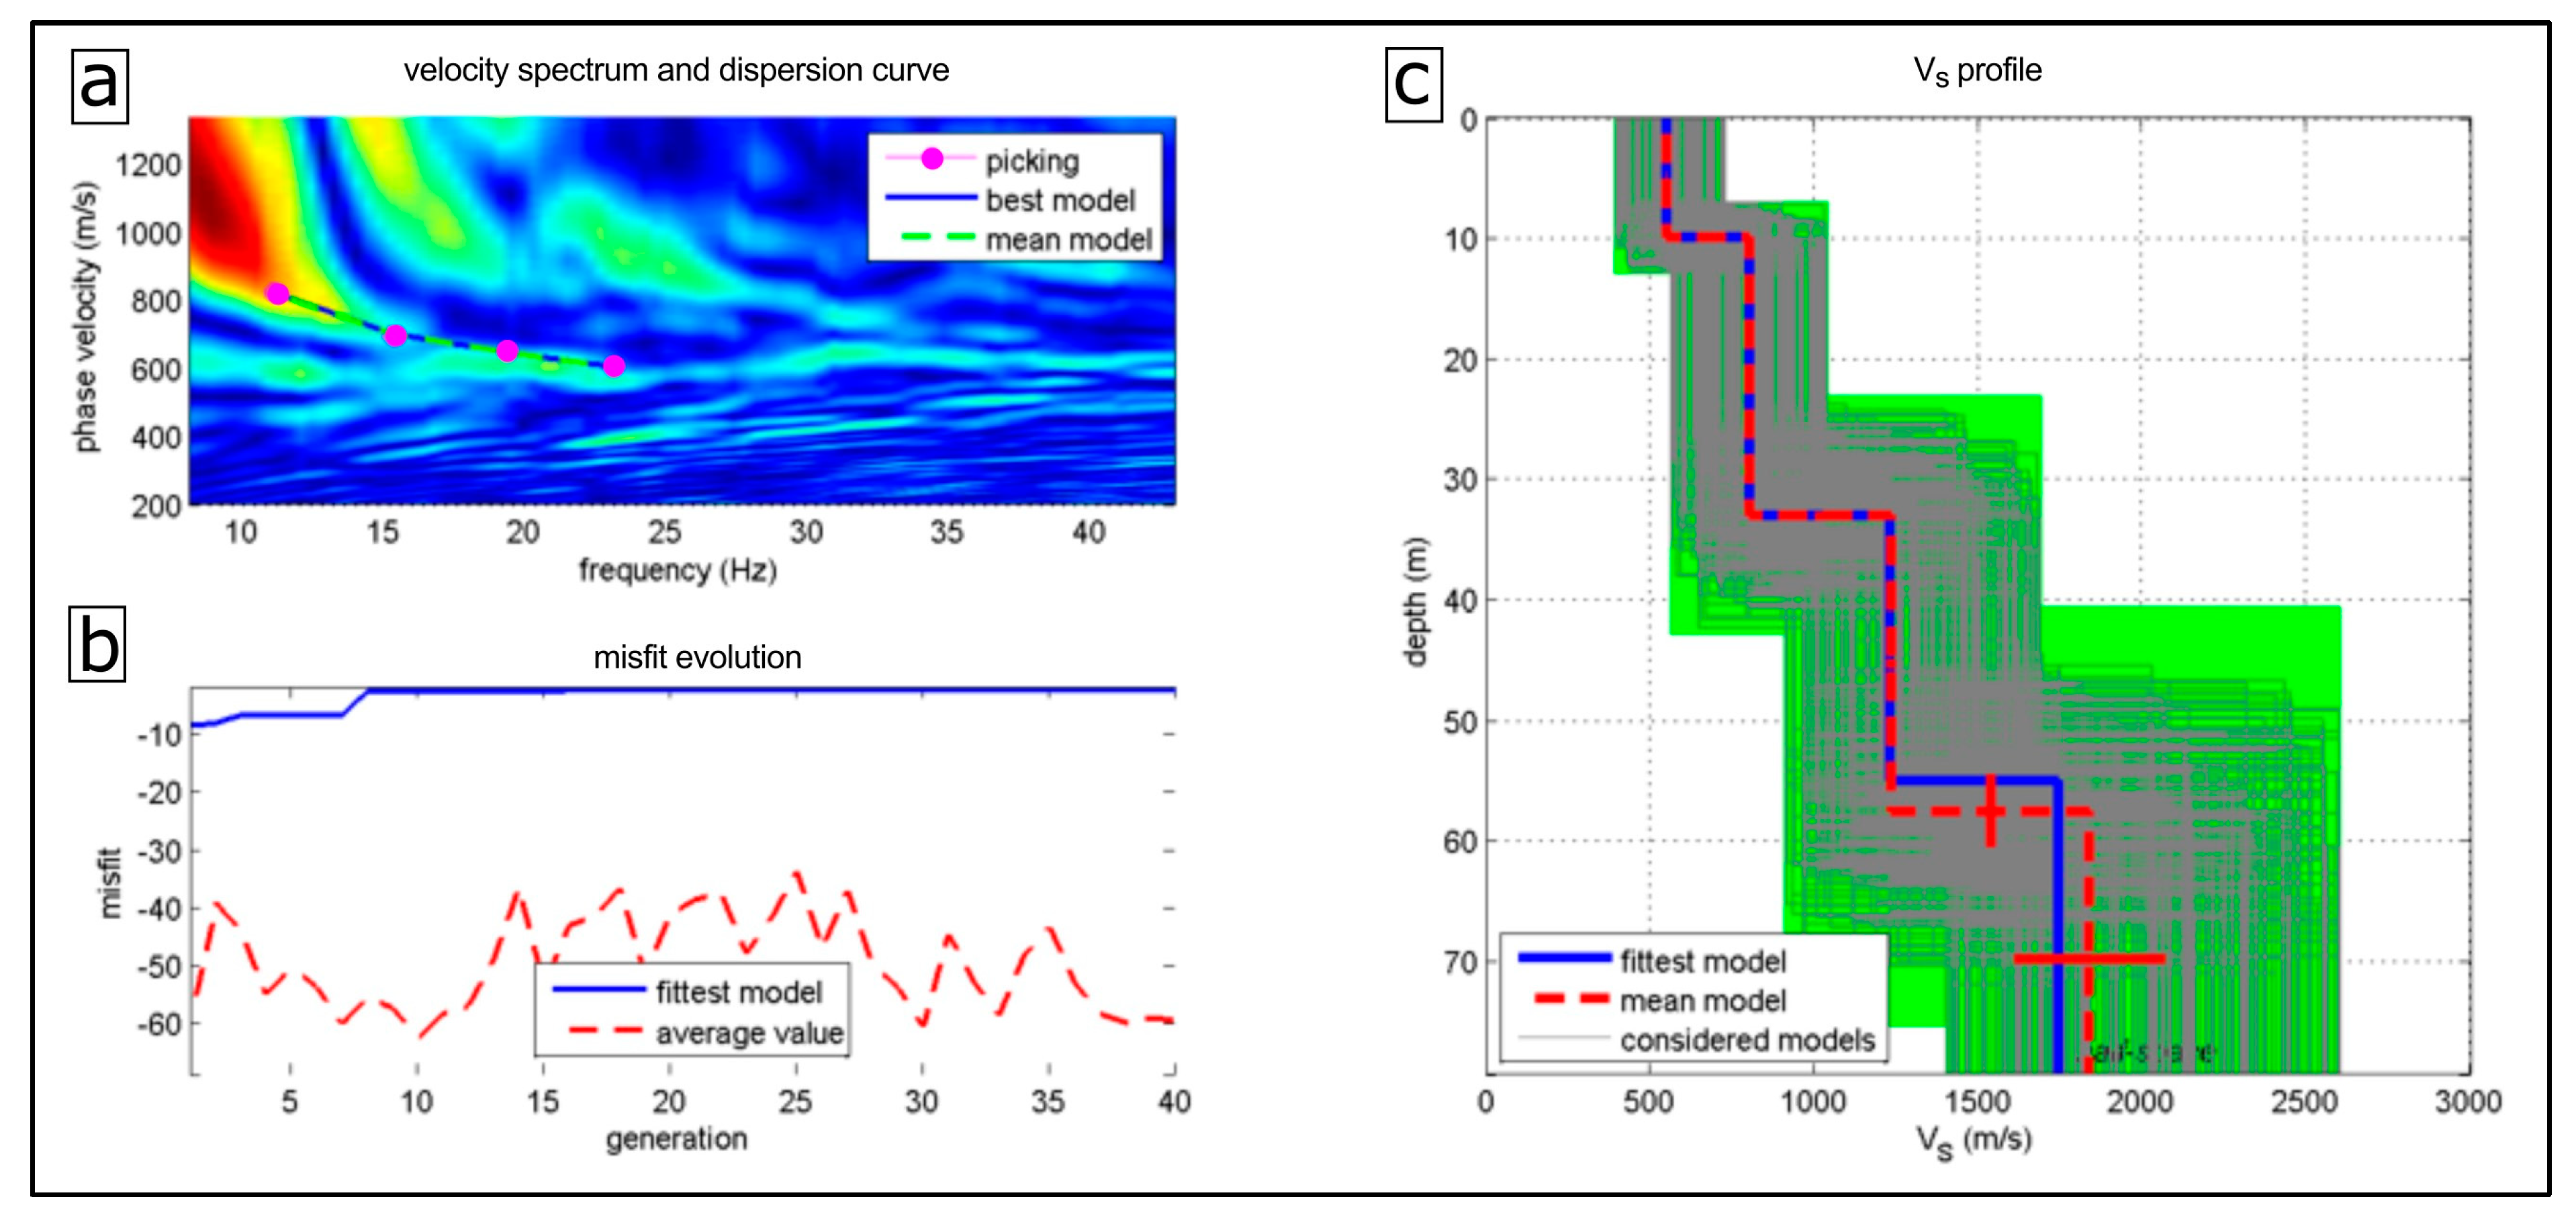
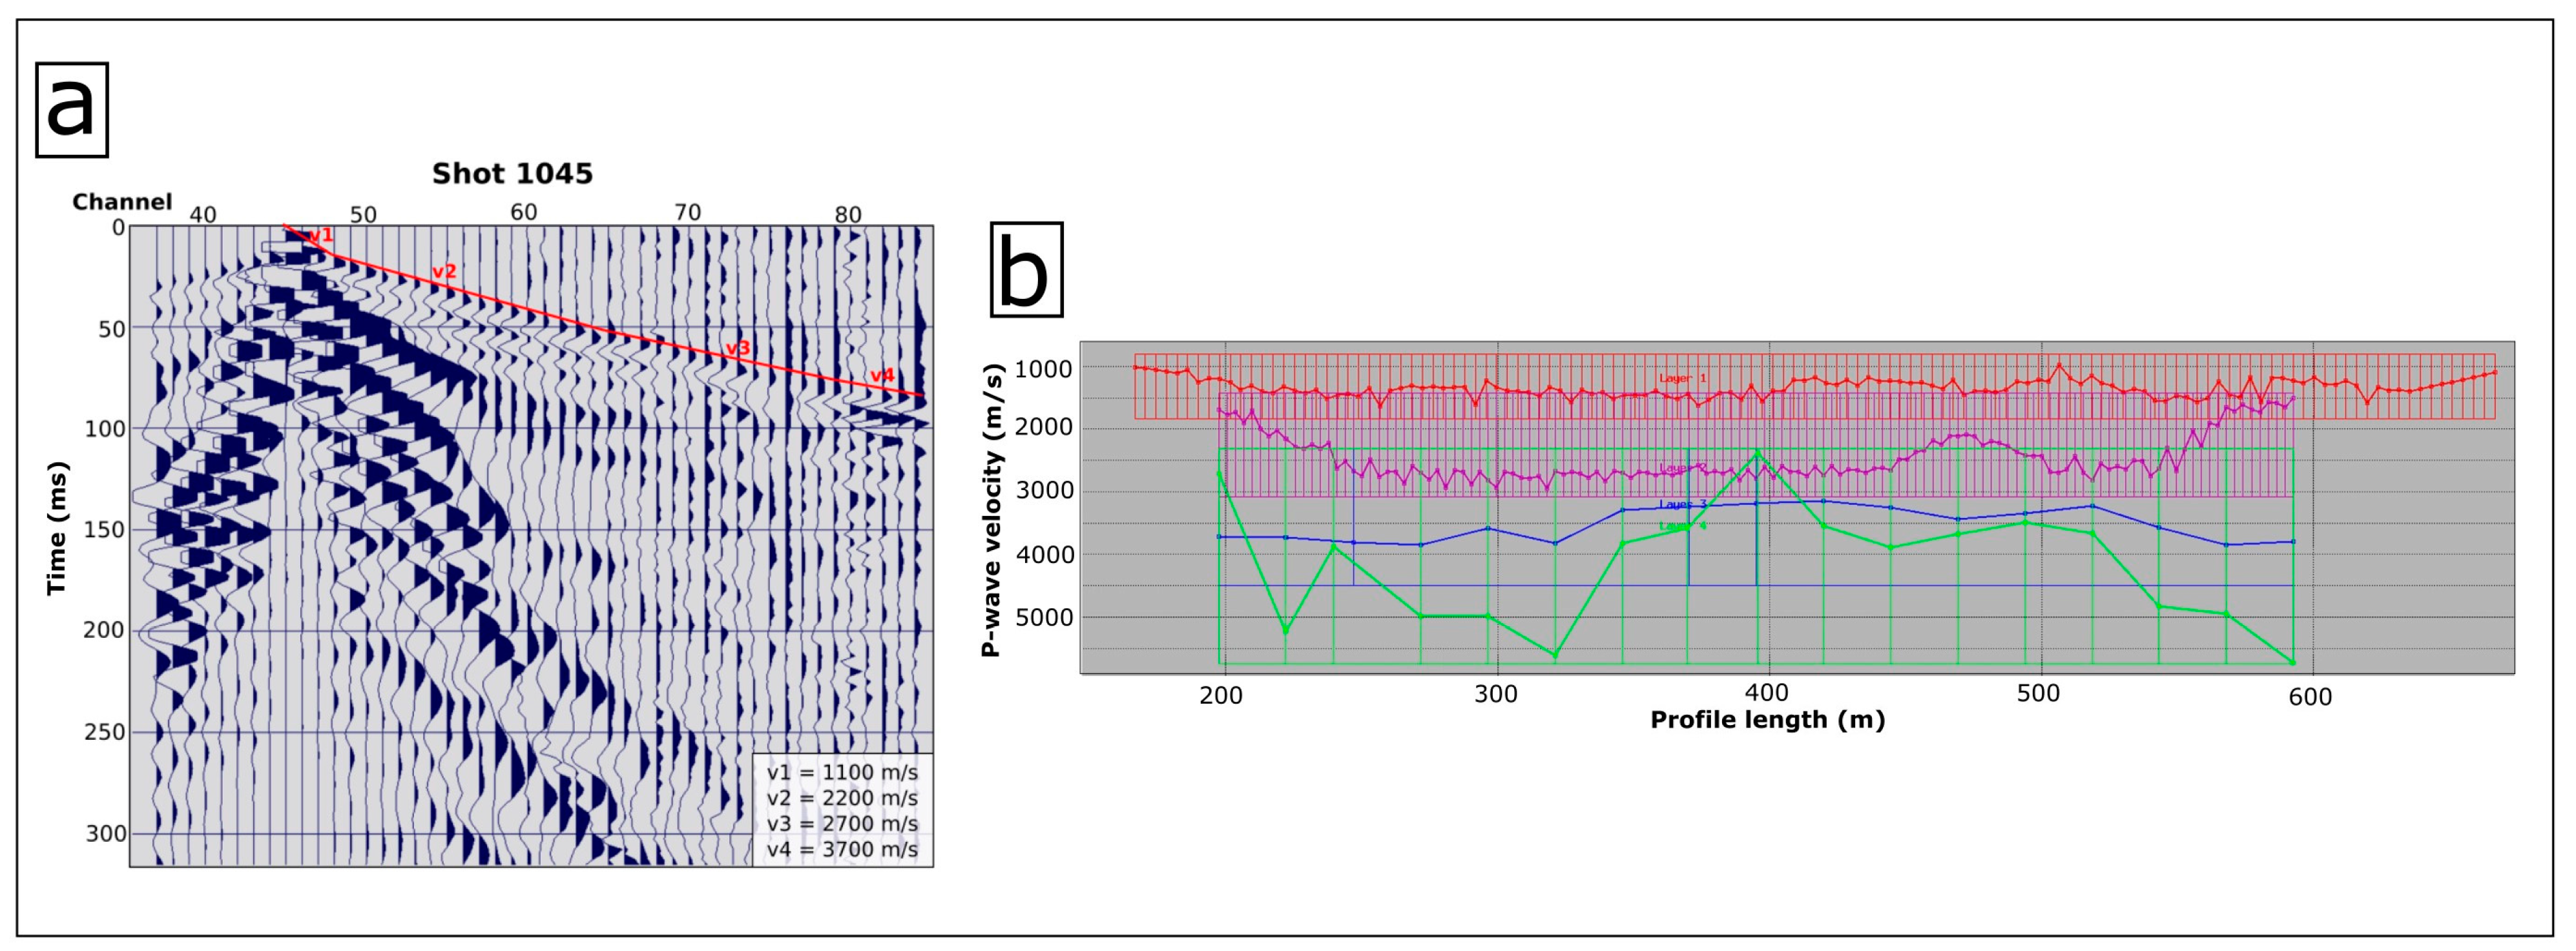
2.3.2. Multi-Channel Analysis of Surface Waves
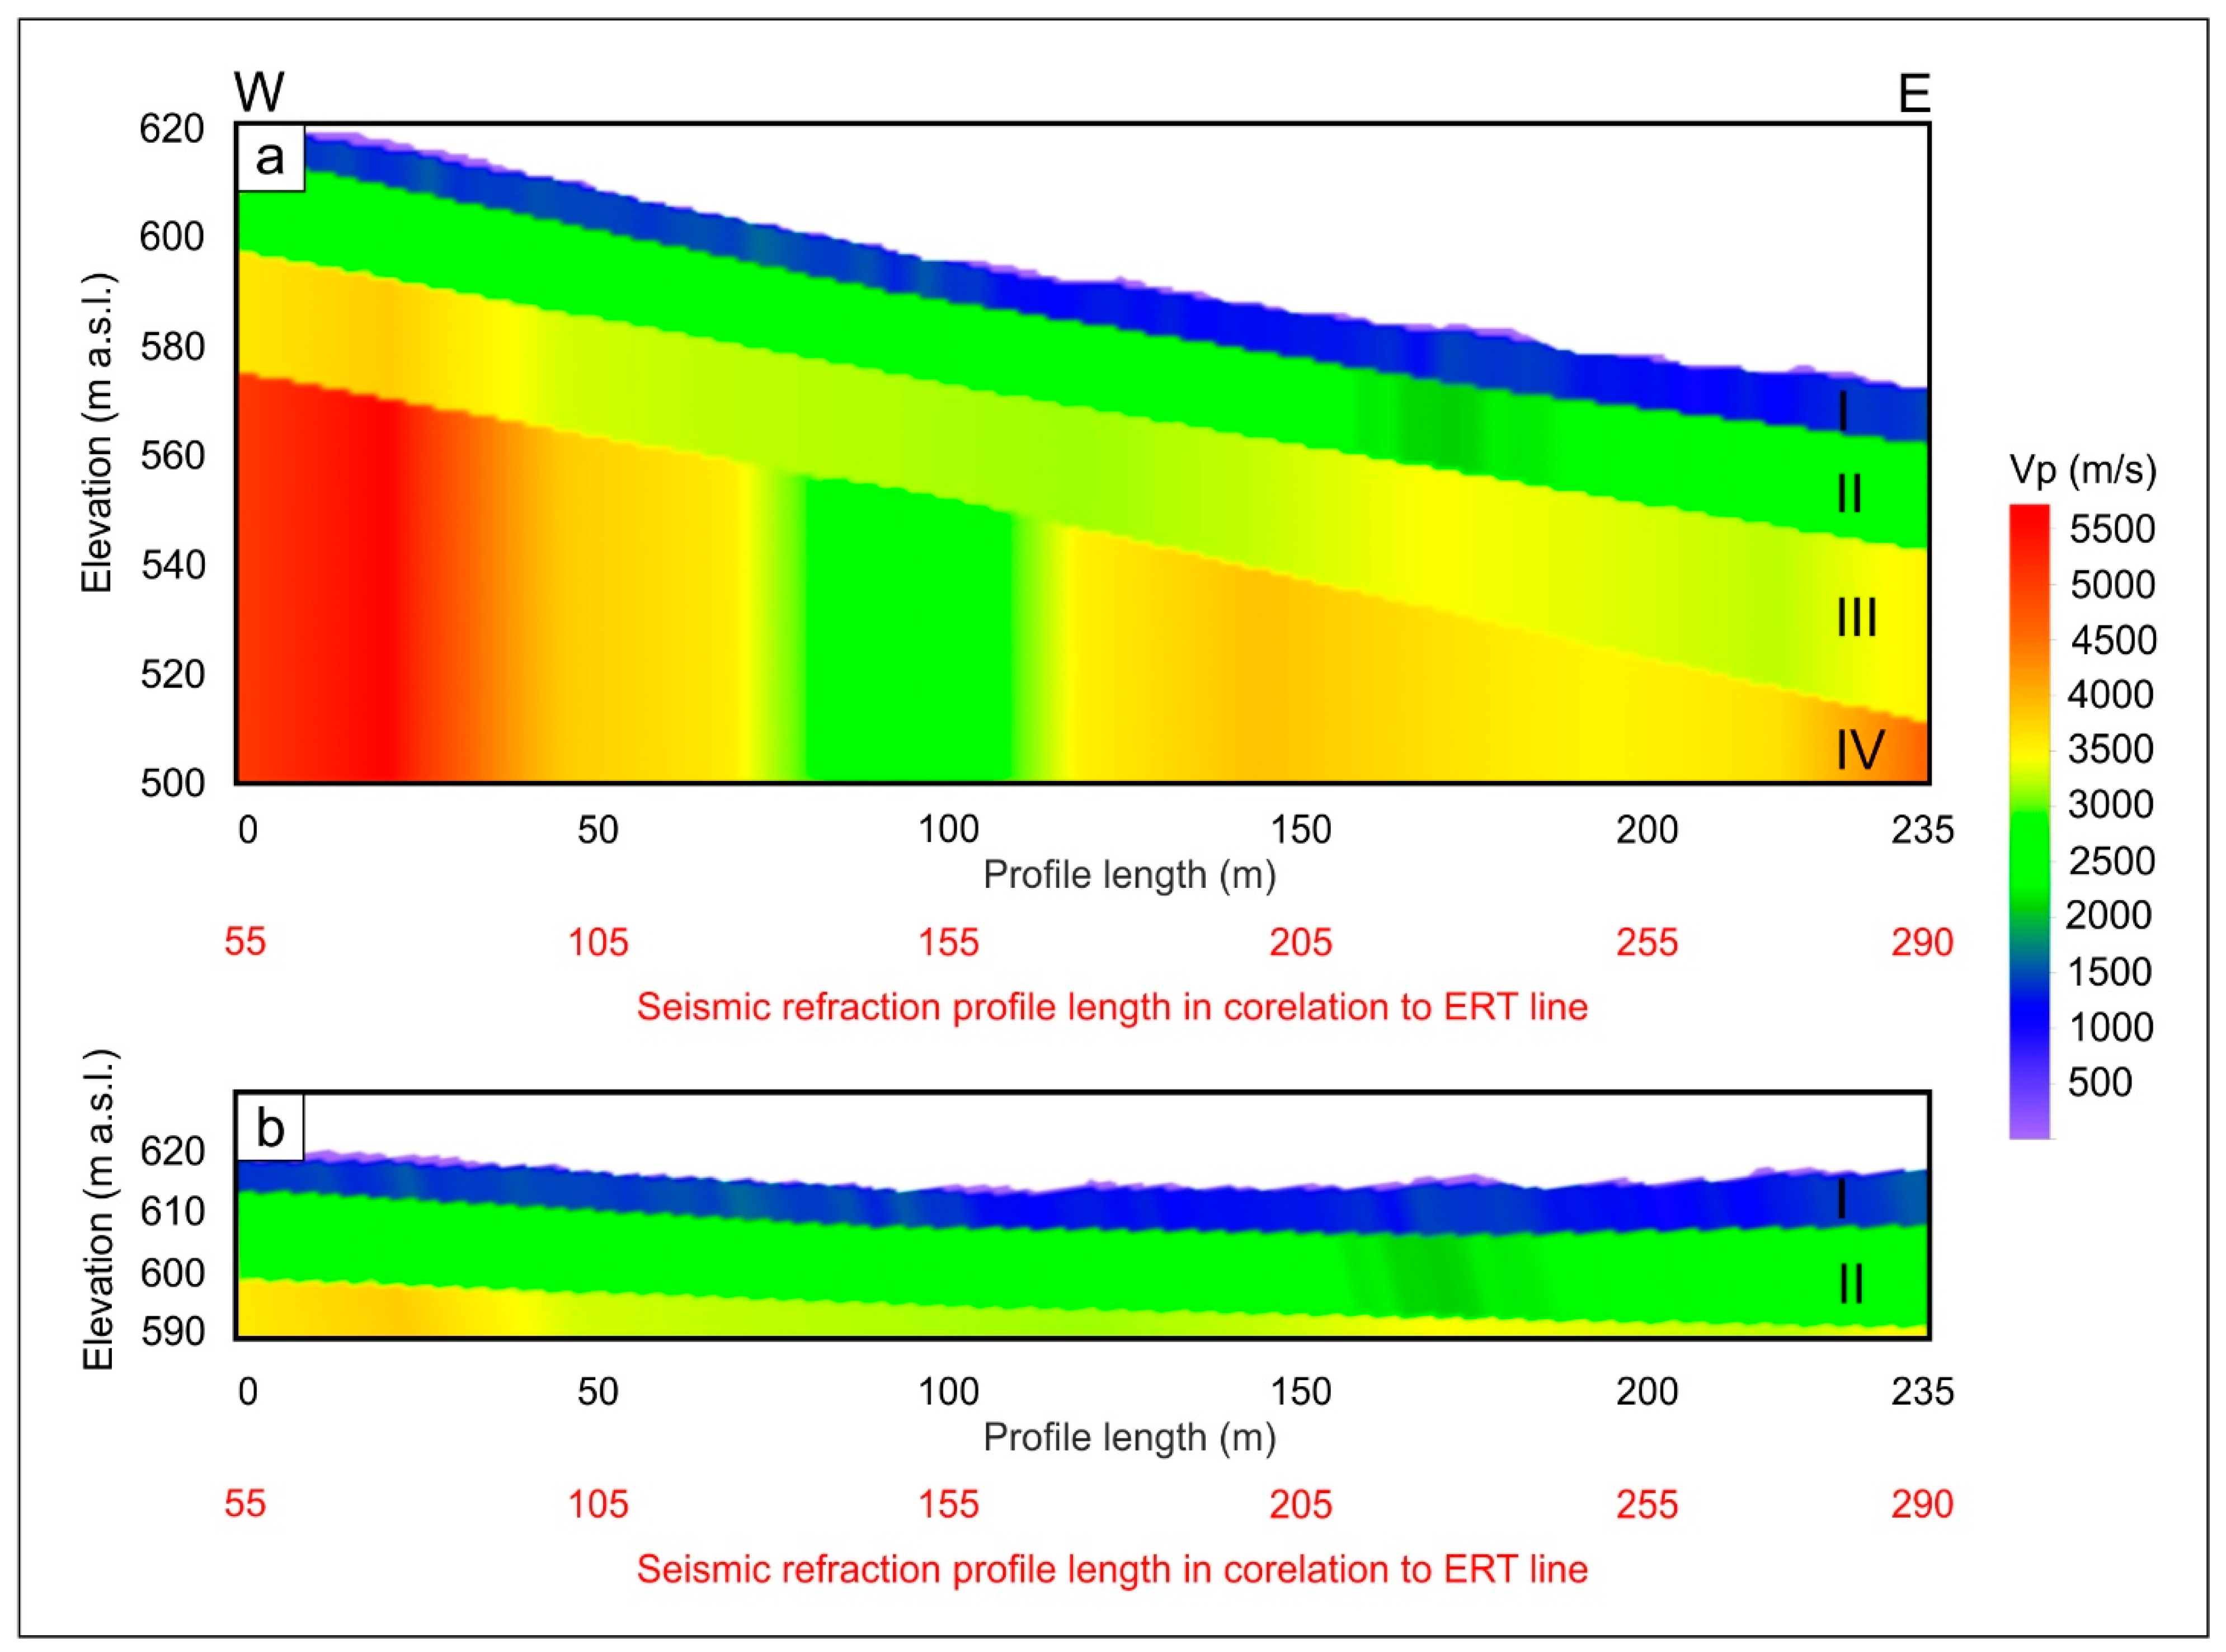
2.3.3. Seismic Tomography
2.3.4. Digital Terrain Model
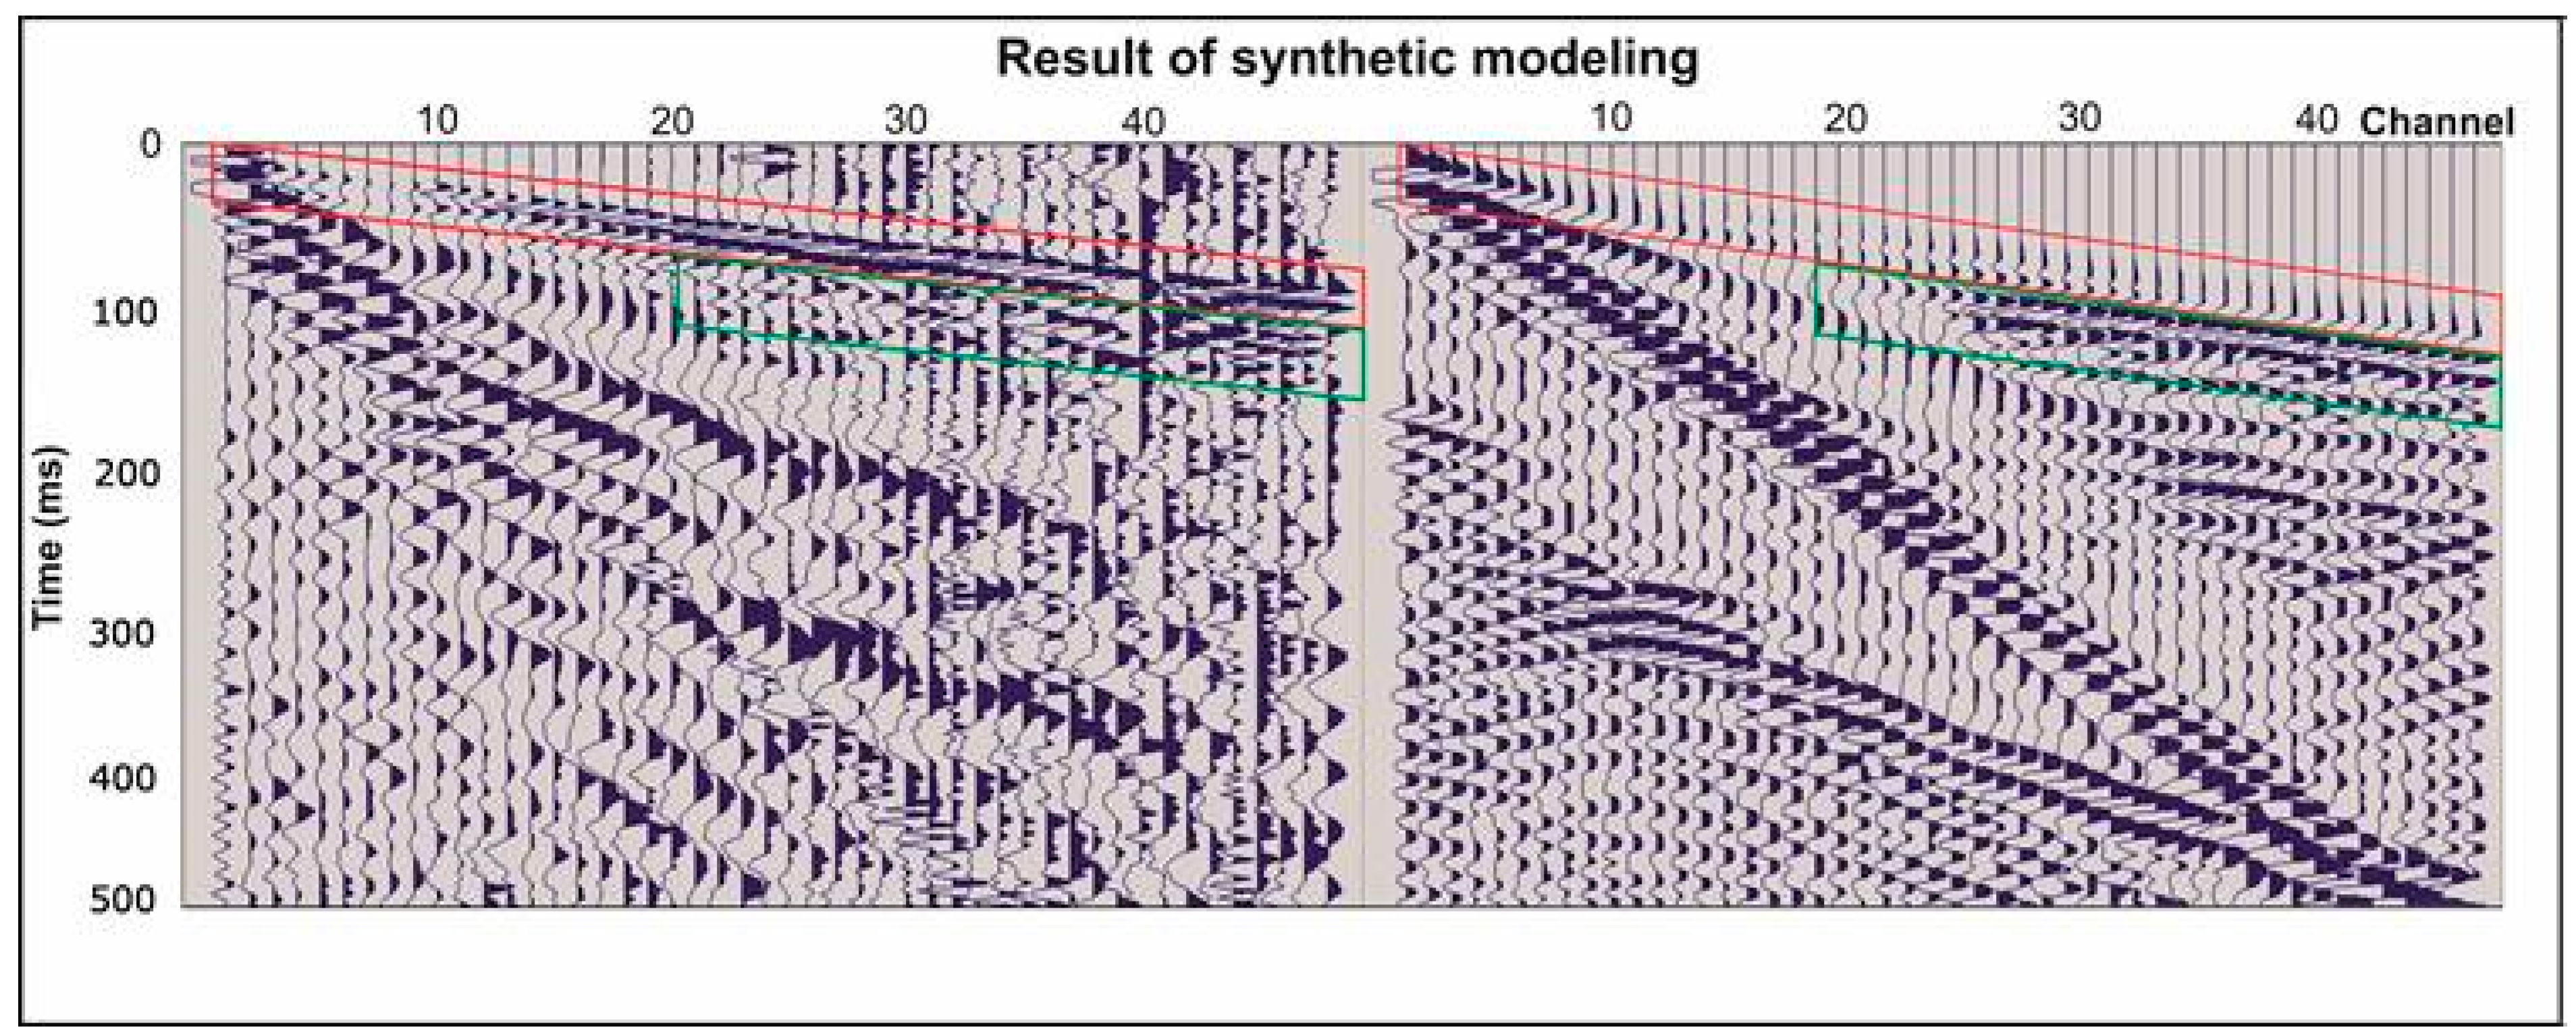
2.3.5. Data Integration and Synthetic Modeling
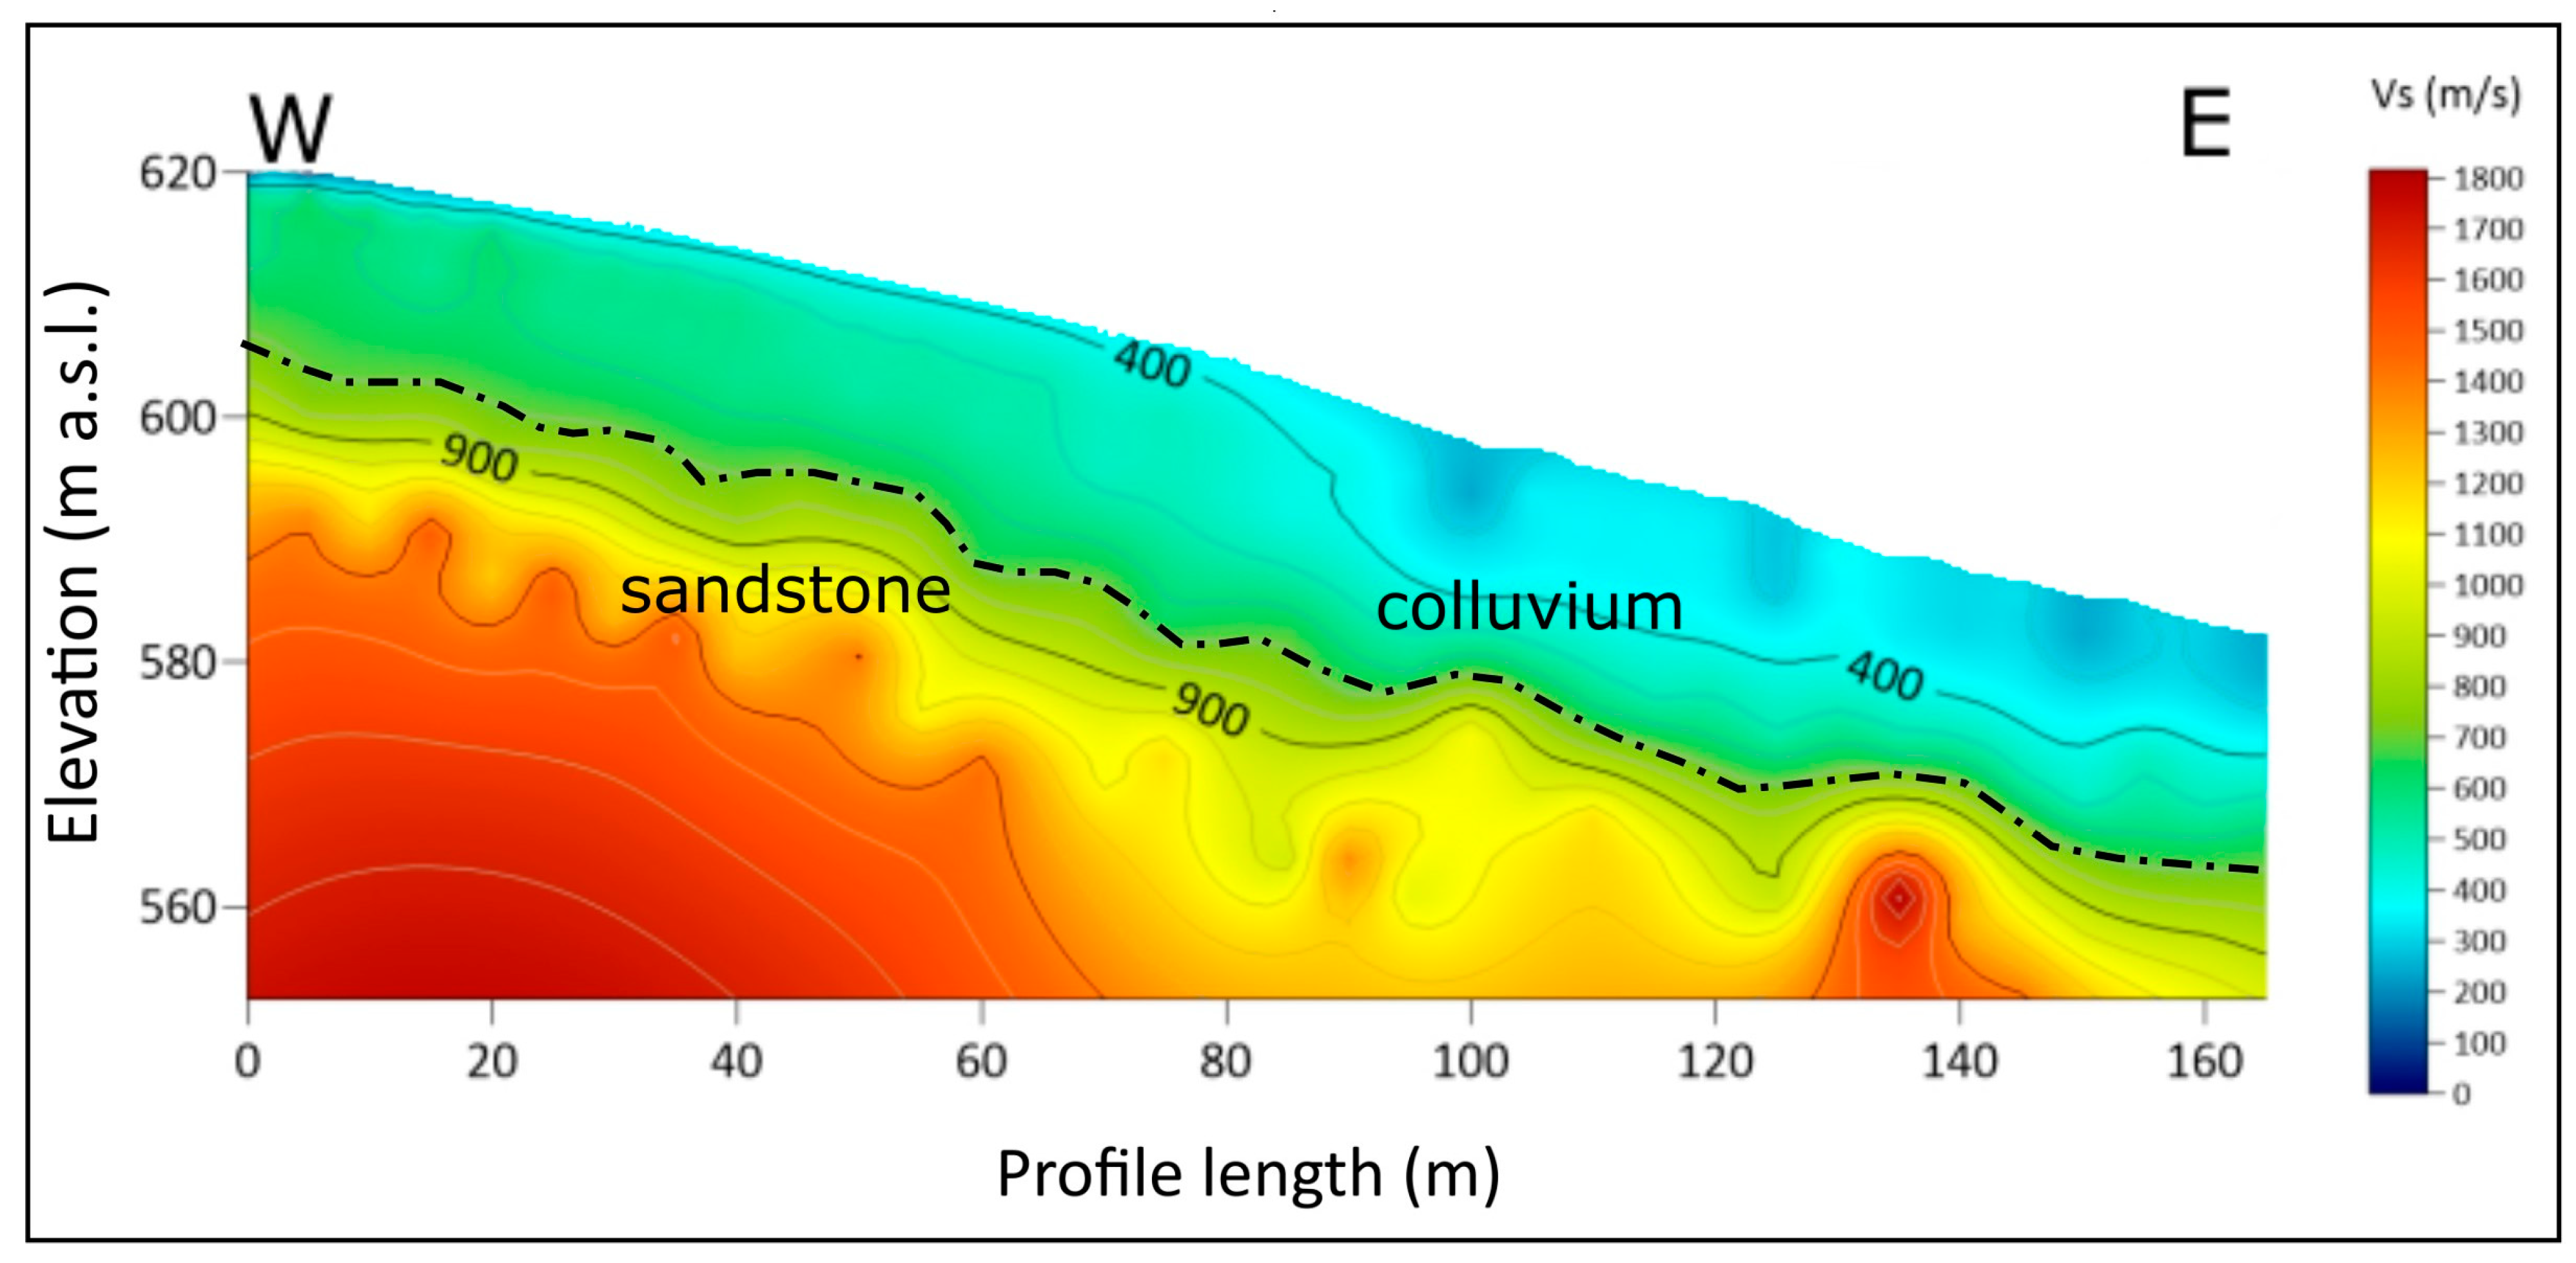
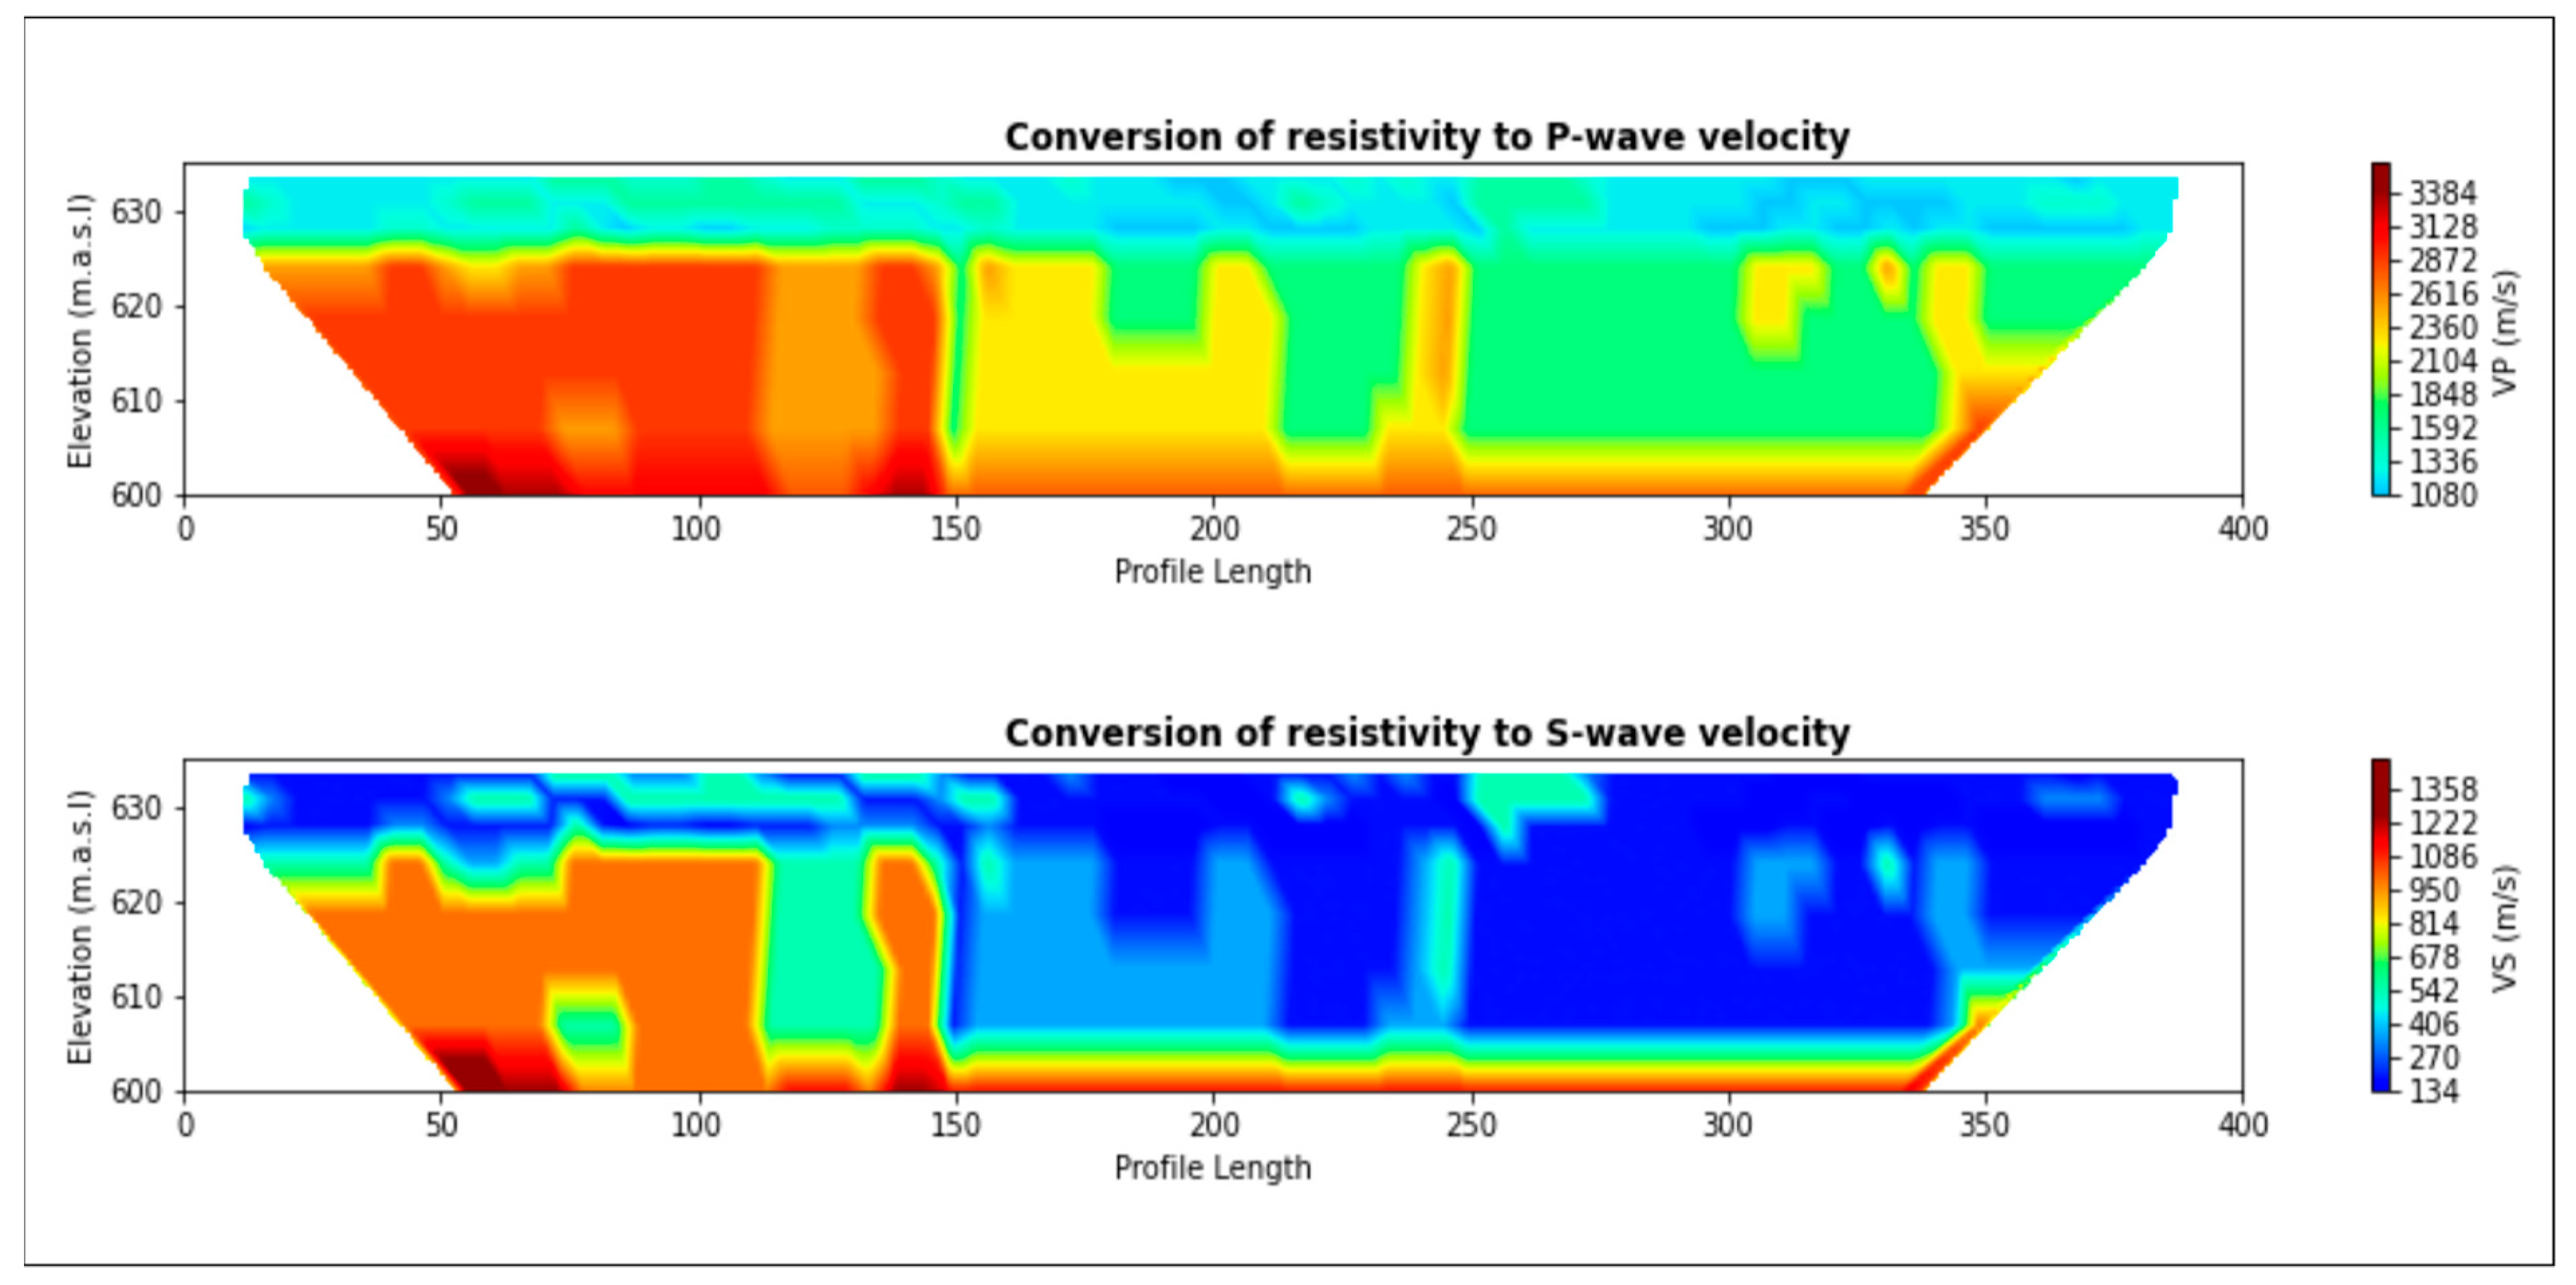
3. Results
4. Discussion
- Recognition of complicated geological structures in a mountain environment
- Distinguishing between the geological construction of the study site and the landforms created by soil movement such as faults, the surface of rupture, sliding bodies
- Estimation of the uncertainty of the results by the use of information about each result’s reliability during synthetic model building
- Cross-correlation of the information from different methods
- Final result integration and validation by integration of data from electric and seismic methods, and it is verified by comparing real seismic records with those obtained from synthetic data
- The problem of seismic wave propagation on the nearest surface is crucial for utilizing FWI and reflection imaging techniques.
5. Conclusions
Author Contributions
Funding
Data Availability Statement
Acknowledgments
Conflicts of Interest
References
- Pasierb, B.; Grodecki, M.; Gwóźdź, R. Geophysical and Geotechnical Approach to a Landslide Stability Assessment: A Case Study. Acta Geophys. 2019, 67, 1823–1834. [Google Scholar] [CrossRef] [Green Version]
- Gariano, S.L.; Guzzetti, F. Landslides in a Changing Climate. Earth Sci. Rev. 2016, 162, 227–252. [Google Scholar] [CrossRef] [Green Version]
- Ilcewicz-Stefaniuk, D.; Lemberger, M.; Magiera, J.; Rybicki, S.; Słomka, T.; Stefaniuk, M. Cataloguing Natural Geological Hazards over Poland’s Territory. Polish Geol. Inst. Spec. Pap. 2004, 15, 53–60. [Google Scholar]
- Jaboyedoff, M.; Michoud, C.; Derron, M.-H.; Voumard, J.; Leibundgut, G.; Sudmeier-Rieux, K.; Nadim, F.; Leroi, E. Human-Induced Landslides: Toward the Analysis of Anthropogenic Changes of the Slope Environment. In Landslides and Engineered Slopes—Experience, Theory and Practice: Proceedings of the 12th International Symposium on Landslides; Aversa, S., Cascini, L., Picarelli, L., Scavia, C., Eds.; CRC Press: London, UK, 2016; pp. 217–232. ISBN 9781138029880. [Google Scholar]
- Wójcik, A.; Wójciechowski, T. Landslides as One of the Most Important Elements of Geological Hazards in Poland. Prz. Geol. 2016, 64, 701–709. (In Polish) [Google Scholar]
- Petley, D. Global Patterns of Loss of Life from Landslides. Geology 2012, 40, 927–930. [Google Scholar] [CrossRef]
- Israil, M.; Pachauri, A.K. Geophysical Characterization of a Landslide Site in the Himalayan Foothill Region. J. Asian Earth Sci. 2003, 22, 253–263. [Google Scholar] [CrossRef]
- Kos, J.; Wójcik, A. Geological and Engineering Documentation of Landslides in the Carpathian Flysch. Prz. Geol. 2021, 69, 825–834. (In Polish) [Google Scholar] [CrossRef]
- Wojciechowski, T. Landslide Susceptibility of Poland. Prz. Geol. 2019, 67, 320–325. (In Polish) [Google Scholar] [CrossRef]
- Marciniec, P.; Zimnal, Z.; Wojciechowski, T.; Perski, Z.; Rczkowski, W.; Laskowicz, I.; Nescieruk, P.; Grabowski, D.; Kuak, M.; Wójcik, A. Landslides in Poland: From Registration to Forecast, 13 Years of the LCS Project. Prz. Geol. 2019, 67, 291–297. (In Polish) [Google Scholar]
- Poprawa, D.; Ra̧czkowski, W. Carpathian Landslides (Southern Poland). Prz. Geol. 2003, 51, 685–692. (In Polish) [Google Scholar]
- Corominas, J.; van Westen, C.; Frattini, P.; Cascini, L.; Malet, J.P.; Fotopoulou, S.; Catani, F.; Van Den Eeckhaut, M.; Mavrouli, O.; Agliardi, F.; et al. Recommendations for the Quantitative Analysis of Landslide Risk. Bull. Eng. Geol. Environ. 2014, 73, 209–263. [Google Scholar] [CrossRef] [Green Version]
- Zhong, C.; Liu, Y.; Gao, P.; Chen, W.; Li, H.; Hou, Y.; Nuremanguli, T.; Ma, H. Landslide Mapping with Remote Sensing: Challenges and Opportunities. Int. J. Remote Sens. 2020, 41, 1555–1581. [Google Scholar] [CrossRef]
- Mohan, A.; Singh, A.K.; Kumar, B.; Dwivedi, R. Review on Remote Sensing Methods for Landslide Detection Using Machine and Deep Learning. Trans. Emerg. Telecommun. Technol. 2021, 32, e3998. [Google Scholar] [CrossRef]
- Travelletti, J.; Demand, J.; Jaboyedoff, M.; Marillier, F. Mass Movement Characterization Using a Reflexion and Refraction Seismic Survey with the Sloping Local Base Level Concept. Geomorphology 2010, 116, 1–10. [Google Scholar] [CrossRef]
- El-Raouf, A.A.; Iqbal, I.; Meister, J.; Abdelrahman, K.; Alzahrani, H.; Badran, O.M. Earthflow Reactivation Assessment by Multichannel Analysis of Surface Waves and Electrical Resistivity Tomography: A Case Study. Open Geosci. 2021, 13, 1328–1344. [Google Scholar] [CrossRef]
- Whiteley, J.S.; Watlet, A.; Uhlemann, S.; Wilkinson, P.; Boyd, J.P.; Jordan, C.; Kendall, J.M.; Chambers, J.E. Rapid Characterisation of Landslide Heterogeneity Using Unsupervised Classification of Electrical Resistivity and Seismic Refraction Surveys. Eng. Geol. 2021, 290, 106189. [Google Scholar] [CrossRef]
- Casagli, N.; Cigna, F.; Bianchini, S.; Hölbling, D.; Füreder, P.; Righini, G.; Del Conte, S.; Friedl, B.; Schneiderbauer, S.; Iasio, C.; et al. Landslide Mapping and Monitoring by Using Radar and Optical Remote Sensing: Examples from the EC-FP7 Project SAFER. Remote Sens. Appl. Soc. Environ. 2016, 4, 92–108. [Google Scholar] [CrossRef] [Green Version]
- Lissak, C.; Bartsch, A.; De Michele, M.; Gomez, C.; Maquaire, O.; Raucoules, D.; Roulland, T. Remote Sensing for Assessing Landslides and Associated Hazards. Surv. Geophys. 2020, 41, 1391–1435. [Google Scholar] [CrossRef]
- Carlà, T.; Tofani, V.; Lombardi, L.; Raspini, F.; Bianchini, S.; Bertolo, D.; Thuegaz, P.; Casagli, N. Combination of GNSS, Satellite InSAR, and GBInSAR Remote Sensing Monitoring to Improve the Understanding of a Large Landslide in High Alpine Environment. Geomorphology 2019, 335, 62–75. [Google Scholar] [CrossRef]
- Arabameri, A.; Pradhan, B.; Rezaei, K.; Lee, C.W. Assessment of Landslide Susceptibility Using Statistical- and Artificial Intelligence-Based FR-RF Integrated Model and Multiresolution DEMs. Remote Sens. 2019, 11, 999. [Google Scholar] [CrossRef] [Green Version]
- Hong, H.; Pradhan, B.; Jebur, M.N.; Bui, D.T.; Xu, C.; Akgun, A. Spatial Prediction of Landslide Hazard at the Luxi Area (China) Using Support Vector Machines. Environ. Earth Sci. 2016, 75, 40. [Google Scholar] [CrossRef]
- Ghorbanzadeh, O.; Blaschke, T.; Gholamnia, K.; Meena, S.R.; Tiede, D.; Aryal, J. Evaluation of Different Machine Learning Methods and Deep-Learning Convolutional Neural Networks for Landslide Detection. Remote Sens. 2019, 11, 196. [Google Scholar] [CrossRef] [Green Version]
- Svennevig, K. Preliminary Landslide Mapping in Greenland. Geol. Surv. Denmark Greenl. Bull. 2019, 43, 1–5. [Google Scholar] [CrossRef] [Green Version]
- Ciampalini, A.; Raspini, F.; Bianchini, S.; Frodella, W.; Bardi, F.; Lagomarsino, D.; Di Traglia, F.; Moretti, S.; Proietti, C.; Pagliara, P.; et al. Remote Sensing as Tool for Development of Landslide Databases: The Case of the Messina Province (Italy) Geodatabase. Geomorphology 2015, 249, 103–118. [Google Scholar] [CrossRef]
- Grima, N.; Edwards, D.; Edwards, F.; Petley, D.; Fisher, B. Landslides in the Andes: Forests Can Provide Cost-Effective Landslide Regulation Services. Sci. Total Environ. 2020, 745, 141128. [Google Scholar] [CrossRef]
- Strozzi, T.; Klimeš, J.; Frey, H.; Caduff, R.; Huggel, C.; Wegmüller, U.; Rapre, A.C. Satellite SAR Interferometry for the Improved Assessment of the State of Activity of Landslides: A Case Study from the Cordilleras of Peru. Remote Sens. Environ. 2018, 217, 111–125. [Google Scholar] [CrossRef] [Green Version]
- Aslan, G.; Foumelis, M.; Raucoules, D.; De Michele, M.; Bernardie, S.; Cakir, Z. Landslide Mapping and Monitoring Using Persistent Scatterer Interferometry (PSI) Technique in the French Alps. Remote Sens. 2020, 12, 1305. [Google Scholar] [CrossRef] [Green Version]
- Kang, Y.; Zhao, C.; Zhang, Q.; Lu, Z.; Li, B. Application of InSAR Techniques to an Analysis of the Guanling Landslide. Remote Sens. 2017, 9, 1046. [Google Scholar] [CrossRef] [Green Version]
- Pawluszek-Filipiak, K.; Borkowski, A.; Motagh, M. Multi-Temporal Landslide Activity Investigation by Spaceborne SAR Interferometry: The Case Study of the Polish Carpathians. Remote Sens. Appl. Soc. Environ. 2021, 24, 100629. [Google Scholar] [CrossRef]
- Hussain, Y.; Schlögel, R.; Innocenti, A.; Hamza, O.; Iannucci, R.; Martino, S.; Havenith, H. Review on the Geophysical and UAV-Based Methods Applied to Landslides. Remote Sens. 2022, 14, 4564. [Google Scholar] [CrossRef]
- Kamiński, M.; Zientara, P.; Krawczyk, M. Electrical Resistivity Tomography and Digital Aerial Photogrammetry in the Research of the “Bachledzki Hill” Active Landslide—In Podhale (Poland). Eng. Geol. 2021, 285, 106004. [Google Scholar] [CrossRef]
- Karwacki, K. Use of Aerial Images in Research of Mass Movements—A Case Study of the Lachowice Landslide (Western Carpathians, Beskid Makowski Mts). Biul. Panstw. Inst. Geol. 2016, 466, 115–122. [Google Scholar] [CrossRef]
- Perski, Z.; Wojciechowski, T.; Wójcik, A.; Borkowski, A. Monitoring of Landslide Dynamics with SAR Interferometry and LIDAR. Case Study of Klodne Landslide (Southern Poland). In Proceedings of the 3rd World Landslide Forum, Beijing, China, 2–6 June 2014. [Google Scholar]
- Zygmunt, M.; Sanecki, J.; Klewski, A. Determination of the Causes of Landslides in the Polish Flysch Carpathians Based on UAV Aerial Images. J. Civ. Eng. Environ. Archit. 2017, 34, 413–422. (In Polish) [Google Scholar] [CrossRef]
- Prokešová, R.; Kardoš, M.; Medveďová, A. Landslide Dynamics from High-Resolution Aerial Photographs: A Case Study from the Western Carpathians, Slovakia. Geomorphology 2010, 115, 90–101. [Google Scholar] [CrossRef]
- Wojciechowski, T.; Borkowski, A.; Perski, Z.; Wójcik, A. Airborne Laser Scanning Data in Landslide Studies at the Example Ofthe Zbyszyce Landslide (Outer Carpathians). Prz. Geol. 2012, 60, 95–102. (In Polish) [Google Scholar]
- Stumpf, A.; Malet, J.P.; Allemand, P.; Pierrot-Deseilligny, M.; Skupinski, G. Ground-Based Multi-View Photogrammetry for the Monitoring of Landslide Deformation and Erosion. Geomorphology 2015, 231, 130–145. [Google Scholar] [CrossRef]
- Bitelli, G.; Dubbini, M.; Zanutta, A.; Scanning, L.; Sensing, R. Terrestrial Laser Scanning and Digital Photogrammetry Techniques To Monitor Landslide Bodies. In Proceedings of the 20th ISPRS Congress Geo-Imagery Bridging Continents, Istanbul, Turkey, 12–23 July 2004; pp. 246–251. [Google Scholar]
- Travelletti, J.; Delacourt, C.; Allemand, P.; Malet, J.P.; Schmittbuhl, J.; Toussaint, R.; Bastard, M. Correlation of Multi-Temporal Ground-Based Optical Images for Landslide Monitoring: Application, Potential and Limitations. ISPRS J. Photogramm. Remote Sens. 2012, 70, 39–55. [Google Scholar] [CrossRef] [Green Version]
- Corsini, A.; Farina, P.; Antonello, G.; Barbieri, M.; Casagli, N.; Coren, F.; Guerri, L.; Ronchetti, F.; Sterzai, P.; Tarchi, D. Space-Borne and Ground-Based SAR Interferometry as Tools for Landslide Hazard Management in Civil Protection. Int. J. Remote Sens. 2006, 27, 2351–2369. [Google Scholar] [CrossRef]
- Wang, G.; Joyce, J.; Phillips, D.; Shrestha, R.; Carter, W. Delineating and Defining the Boundaries of an Active Landslide in the Rainforest of Puerto Rico Using a Combination of Airborne and Terrestrial LIDAR Data. Landslides 2013, 10, 503–513. [Google Scholar] [CrossRef]
- Baltensweiler, A.; Walthert, L.; Ginzler, C.; Sutter, F.; Purves, R.S.; Hanewinkel, M. Terrestrial Laser Scanning Improves Digital Elevation Models and Topsoil PH Modelling in Regions with Complex Topography and Dense Vegetation. Environ. Model. Softw. 2017, 95, 13–21. [Google Scholar] [CrossRef]
- Pilecka, E. Remote Sensing as the Method for Analysis of Mass Movements. Bull. Miner. Energy Econ. Res. Inst. Polish Acad. Sci. 2013, 84, 103–115. [Google Scholar]
- Bruno, F.; Martillier, F. Test of High-Resolution Seismic Reflection and Other Geophysical Techniques on the Boup Landslide in the Swiss Alps. Surv. Geophys. 2000, 21, 333–348. [Google Scholar] [CrossRef]
- Eichkitz, C.G.; Schreilechner, M.G.; Amtmann, J.; Schmid, C. Shallow Seismic Reflection Study of the Gschliefgraben Landslide Deposition Area—Interpretation and Three Dimensional Modeling. Austrian J. Earth Sci. 2009, 102, 52–60. [Google Scholar]
- Wang, S.; Malehmir, A.; Bastani, M. Geophysical Characterization of Areas Prone to Quick-Clay Landslides Using Radio-Magnetotelluric and Seismic Methods. Tectonophysics 2016, 677–678, 248–260. [Google Scholar] [CrossRef]
- Renalier, F.; Jongmans, D.; Campillo, M.; Bard, P.Y. Shear Wave Velocity Imaging of the Avignonet Landslide (France) Using Ambient Noise Cross Correlation. J. Geophys. Res. Earth Surf. 2010, 115, F03032. [Google Scholar] [CrossRef] [Green Version]
- Lapenna, V.; Lorenzo, P.; Perrone, A.; Piscitelli, S.; Rizzo, E.; Sdao, F. 2D Electrical Resistivity Imaging of Some Complex Landslides in the Lucanian Apennine Chain, Southern Italy. Geophysics 2005, 70, B11. [Google Scholar] [CrossRef]
- Bellanova, J.; Calamita, G.; Giocoli, A.; Luongo, R.; Macchiato, M.; Perrone, A.; Uhlemann, S.; Piscitelli, S. Electrical Resistivity Imaging for the Characterization of the Montaguto Landslide (Southern Italy). Eng. Geol. 2018, 243, 272–281. [Google Scholar] [CrossRef]
- Bednarczyk, Z. Application of GPR Scanning for Landslide Investigations in Polish Carpathians. In Proceedings of the Near Surface 2008-14th EAGE European Meeting of Environmental and Engineering Geophysics, Krakow, Poland, 15–17 September 2008; pp. 372–376. [Google Scholar]
- Borecka, A.; Herzig, J.; Durjasz-Rybacka, M. Ground Penetrating Radar Investigations of Landslides: A Case Study in a Landslide in Radziszów. Stud. Geotech. Mech. 2015, 37, 11–18. [Google Scholar] [CrossRef]
- Kowalczyk, S.; Mieszkowski, R.; Pacanowski, G. The Stability Evaluation of Warsaw Slope Selected Pieces Based on Electrical Resistivity Tomography Survey (ERT). Przegląd Geol. 2014, 62, 634–640. (In Polish) [Google Scholar]
- Orozco, A.F.; Bücker, M.; Steiner, M.; Malet, J.P. Complex-Conductivity Imaging for the Understanding of Landslide Architecture. Eng. Geol. 2018, 243, 241–252. [Google Scholar] [CrossRef]
- Mreyen, A.-S.; Cauchie, L.; Micu, M.; Onaca, A.; Havenith, H.-B. Multiple Geophysical Investigations to Characterize Massive Slope Failure Deposits: Application to the Balta Rockslide, Carpathians. Geophys. J. Int. 2021, 225, 1032–1047. [Google Scholar] [CrossRef]
- Bichler, A.; Bobrowsky, P.; Best, M.; Douma, M.; Hunter, J.; Calvert, T.; Burns, R. Three-Dimensional Mapping of a Landslide Using a Multi-Geophysical Approach: The Quesnel Forks Landslide. Landslides 2004, 1, 29–40. [Google Scholar] [CrossRef]
- Mantovani, M.; Devoto, S.; Forte, E.; Mocnik, A.; Pasuto, A.; Piacentini, D.; Soldati, M. A Multidisciplinary Approach for Rock Spreading and Block Sliding Investigation in the North-Western Coast of Malta. Landslides 2013, 10, 611–622. [Google Scholar] [CrossRef]
- Godio, A.; Strobbia, C.; De Bacco, G. Geophysical Characterisation of a Rockslide in an Alpine Region. Eng. Geol. 2006, 83, 273–286. [Google Scholar] [CrossRef]
- Khan, M.A.; Basharat, M.; Riaz, M.T.; Sarfraz, Y.; Farooq, M.; Khan, A.Y.; Pham, Q.B.; Ahmed, K.S.; Shahzad, A. An Integrated Geotechnical and Geophysical Investigation of a Catastrophic Landslide in the Northeast Himalayas of Pakistan. Geol. J. 2021, 56, 4760–4778. [Google Scholar] [CrossRef]
- Bogoslovsky, V.A.; Ogilvy, A.A. Geophysical Methods for the Investigation of Landslides. Geophysics 1977, 42, 562–571. [Google Scholar] [CrossRef]
- Bestyński, Z. Geophysical Methods in Engineering Geology. Biul. PIG 2011, 446, 175–182. (In Polish) [Google Scholar]
- Ostrowski, S.; Pacanowski, G.; Lasocki, M. Application of Engineering Geophysics Methods to Recognize the Genesis of Carpathian Landslides. Biul. Inf. Geofiz. 2011, 10, 19–25. (In Polish) [Google Scholar]
- Bestyński, Z.; Pacanowski, G.; Sieinski, E. Geophysical Investigation and Geotechnical Classifications for Stability Assessment of Carpathian Flysch Slopes. Prz. Geol. 2017, 65, 717–724. (In Polish) [Google Scholar]
- Crawford, M.M.; Bryson, L.S.; Woolery, E.W.; Wang, Z. Using 2-D Electrical Resistivity Imaging for Joint Geophysical and Geotechnical Characterization of Shallow Landslides. J. Appl. Geophys. 2018, 157, 37–46. [Google Scholar] [CrossRef]
- Marciniak, A.; Kowalczyk, S.; Gontar, T.; Owoc, B.; Nawrot, A.; Luks, B.; Cader, J.; Majdański, M. Integrated Geophysical Imaging of a Mountain Landslide—A Case Study from the Outer Carpathians, Poland. J. Appl. Geophys. 2021, 191, 104364. [Google Scholar] [CrossRef]
- Gawriuczenkow, I.; Kaczmarek, Ł.; Kiełbasiński, K.; Kowalczyk, S.; Mieszkowski, R.; Wójcik, E. Slope Stability and Failure Hazards in the Light of Complex Geological Surveys. Sci. Rev. Eng. Environ. Sci. 2017, 26, 85–98. (In Polish) [Google Scholar] [CrossRef]
- Whiteley, J.S.; Chambers, J.E.; Uhlemann, S.; Wilkinson, P.B.; Kendall, J.M. Geophysical Monitoring of Moisture-Induced Landslides: A Review. Rev. Geophys. 2019, 57, 106–145. [Google Scholar] [CrossRef] [Green Version]
- Danneels, G.; Bourdeau, C.; Torgoev, I.; Havenith, H.B. Geophysical Investigation and Dynamic Modelling of Unstable Slopes: Case-Study of Kainama (Kyrgyzstan). Geophys. J. Int. 2008, 175, 17–34. [Google Scholar] [CrossRef] [Green Version]
- Tsai, W.N.; Chen, C.C.; Chiang, C.W.; Chen, P.Y.; Kuo, C.Y.; Wang, K.L.; Lin, M.L.; Chen, R.F. Electrical Resistivity Tomography (ERT) Monitoring for Landslides: Case Study in the Lantai Area, Yilan Taiping Mountain, Northeast Taiwan. Front. Earth Sci. 2021, 9, 1–17. [Google Scholar] [CrossRef]
- Oldenborger, G.A.; Knoll, M.D.; Routh, P.S.; LaBrecque, D.J. Time-Lapse ERT Monitoring of an Injection/Withdrawal Experiment in a Shallow Unconfined Aquifer. Geophysics 2007, 72, F177. [Google Scholar] [CrossRef] [Green Version]
- Nolet, G. A Breviary of Seismic Tomography: Imaging the Interior of the Earth and Sun; Cambridge University Press: Cambridge, UK, 2008. [Google Scholar]
- Wood, C.M.; Cox, B.R. A Comparison of MASW Dispersion Uncertainty and Bias for Impact and Harmonic Sources. In Proceedings of the GeoCongress 2012, Oakland, CA, USA, 25–29 March 2012; pp. 2756–2765. [Google Scholar]
- Zhao, C.; Lu, Z. Remote Sensing of Landslides—A Review. Remote Sens. 2018, 10, 279. [Google Scholar] [CrossRef] [Green Version]
- Kniess, U.; Travelletti, J.; Daehne, A.; Krzeminska, D.; Bièvre, G.; Jongmans, D.; Corsini, A.; Bogaard, T.; Malet, J.-P. Innovative Techniques for the Characterization of the Morphology, Geometry and Hydrological Features of Slow-Moving Landslides. In Mountain Risks: From Prediction to Management and Governance; Van Asch, T., Corominas, J., Greiving, S., Malet, J.-P., Sterlacchini, S., Eds.; Springer: Dordrecht, The Netherlands, 2014; pp. 57–82. ISBN 978-94-007-6769-0. [Google Scholar]
- Lapenna, V.; Guariglia, A.; Saladino, R.; Arbia, F.; Lacovara, B.; Perrone, A.; Simoniello, T. Airborne Laser Scanner, Optical High-Resolution Images Analysis and Geophysical Survey for Investigating the Slope of Bosco Piccolo Village (Basilicata Region, Southern Italy). In Proceedings of the EGU General Assembly Conference Abstracts, Vienna, Austria, 19–24 April 2009; p. 12975. [Google Scholar]
- Travelletti, J.; Malet, J.P. Characterization of the 3D Geometry of Flow-like Landslides: A Methodology Based on the Integration of Heterogeneous Multi-Source Data. Eng. Geol. 2012, 128, 30–48. [Google Scholar] [CrossRef]
- Çelik, S.; Özyazıcıoğlu, M.; Şahin, R.; Uysal, H.; Çakıcı, F.Z.; Kalkan, E. The Destruction of Erzurum Ski-Jumping Complex by a Landslide: Evaluation of an Engineering Design Failure. Nat. Hazards 2021, 107, 475–496. [Google Scholar] [CrossRef]
- Dankers, R.; Feyen, L. Climate Change Impact on Flood Hazard in Europe: An Assessment Based on High-Resolution Climate Simulations. J. Geophys. Res. Atmos. 2008, 113, D19105. [Google Scholar] [CrossRef]
- Twardosz, R.; Walanus, A.; Guzik, I. Warming in Europe: Recent Trends in Annual and Seasonal Temperatures. Pure Appl. Geophys. 2021, 178, 4021–4032. [Google Scholar] [CrossRef]
- Lollino, P.; Cotecchia, F.; Elia, G.; Mitaritonna, G.; Santaloia, F. Interpretation of Landslide Mechanisms Based on Numerical Modelling: Two Case-Histories. Eur. J. Environ. Civ. Eng. 2014, 20, 1032–1053. [Google Scholar] [CrossRef]
- Meusburger, K.; Alewell, C. Impacts of Anthropogenic and Environmental Factors on the Occurrence of Shallow Landslides in an Alpine Catchment (Urseren Valley, Switzerland). Nat. Hazards Earth Syst. Sci. 2008, 8, 509–520. [Google Scholar] [CrossRef] [Green Version]
- Glade, T. Landslide Occurrence as a Response to Land Use Change: A Review of Evidence from New Zealand. Catena 2003, 51, 297–314. [Google Scholar] [CrossRef] [Green Version]
- Soldati, M.; Corsini, A.; Pasuto, A. Landslides and Climate Change in the Italian Dolomites since the Late Glacial. Catena 2004, 55, 141–161. [Google Scholar] [CrossRef]
- Borgatti, L.; Soldati, M. Landslides as a Geomorphological Proxy for Climate Change: A Record from the Dolomites (Northern Italy). Geomorphology 2010, 120, 56–64. [Google Scholar] [CrossRef]
- Froude, M.J.; Petley, D.N. Global Fatal Landslide Occurrence from 2004 to 2016. Nat. Hazards Earth Syst. Sci. 2018, 18, 2161–2181. [Google Scholar] [CrossRef] [Green Version]
- Marciniak, A.; Stan-Kłeczek, I.; Idziak, A.; Majdański, M. Uncertainty Based Multi-Step Seismic Analysis for near-Surface Imaging. Open Geosci. 2019, 11, 727–737. [Google Scholar] [CrossRef]
- OpenStreetMap Contributors Planet Dump [Data File from 06.09.2022]. Available online: https://planet.openstreetmap.org (accessed on 6 September 2022).
- Paul, Z.; Ryłko, W.; Tomaś, A. Zarys Budowy Geologicznej Zachodniej Części Karpat Polskich (Bez Utworów Czwartorzędowych). Prz. Geol. 1996, 44, 469–476. (In Polish) [Google Scholar]
- Cieszkowski, M.; Golonka, J.; Krobicki, M.; Ślączka, A.; Waśkowska, A.; Wendorf, M. Olistoliths within the Silesian Series and Their Connections with Evolutionary Stages of the Silesian Basin. Geologia 2009, 35, 13–21. (In Polish) [Google Scholar]
- Waśkowska-Oliwa, A. The Eocene Hieroglyphic Beds and Green Shales in the Rożnów Lake Area (Silesian Nappe, Outer Carpathians) —Facies Development and Biostratigraphy. Geol. Geophys. Environ. 2014, 40, 5–26. [Google Scholar] [CrossRef] [Green Version]
- Golonka, J.; Waśkowska-Oliwa, A. Stratigraphy of the Polish Flysch Carpathians between Bielsko-Biała and Nowy Targ. Geol. Akad. Górniczo-Hut. Im. Stanisława Staszica W Krakowie 2007, 33, 5–27. (In Polish) [Google Scholar]
- Cieszkowski, M.; Golonka, J.; Waśkowska-Oliwa, A.; Chrustek, M. Geological Structure of the Sucha Beskidzka Region—Świnna Poręba (Polish Flysch Carpathians). Kwart. AGH Geol. 2006, 32, 155–201. (In Polish) [Google Scholar]
- PGI-NRI Geological Map of Poland 1:50000. Available online: https://geologia.pgi.gov.pl/arcgis/apps/MapSeries (accessed on 7 November 2022).
- Bestyński, Z.; Thiel, K. Geophysical Investigations of the Carpathian Slide Slopes. Polish Geol. Inst. Spec. Pap. 2005, 20, 35–39. [Google Scholar]
- Pilecki, Z.; Zietek, J.; Karczewski, J.; Pilecka, E.; Klosinski, J. The Effectiveness of Recognizing of Failure Surface of the Carpathian Flysch Landslide Using Wave Methods. In Proceedings of the Near Surface 2007—13th European Meeting of Environmental and Engineering Geophysics, Istanbul, Turkey, 3–5 September 2007; pp. 256–260. [Google Scholar]
- Ostrowski, S.; Rybak-Ostrowska, B.; Lasocki, M. Application of Near-Surface Geophysical Survey for Recognition of the Geology of Landslide Areas in the Carpathians—A Case Study. Prz. Geol. 2013, 61, 67–73. (In Polish) [Google Scholar]
- Leica Geosystems Leica Viva GPS RTK—Instrument Datasheet. Available online: https://leica-geosystems.com/en-us/products/gnss-systems/controllers/leica-viva-cs15-and-cs10# (accessed on 20 December 2022).
- Guideline Geo ABEM Terrameter LS—Instrument Datasheet. Available online: https://www.guidelinegeoc.cdn.triggerfish.cloud/uploads/2016/11/ABEM-Terrameter-LS-Technical-Specifications.pdf (accessed on 20 December 2022).
- Guideline Geo ABEM Terraloc—Instrument Datasheet. Available online: https://wwwguidelinegeoc.cdn.triggerfish.cloud/uploads/2017/07/ABEM-Terraloc-Pro-2-TechSpec-210823-web.pdf (accessed on 20 December 2022).
- RIEGL RIEGL VZ 6000—Instrument Datasheet. Available online: http://www.riegl.com/uploads/tx_pxpriegldownloads/RIEGL_VZ-6000_Datasheet_2020-09-14.pdf (accessed on 20 December 2022).
- GUGiK ASG-EUPOS System. Available online: http://www.asgeupos.pl (accessed on 20 December 2022).
- Loke, M.H. Tutorial: 2-D and 3-D Electrical Imaging Surveys; Geotomo Software: Gelugor, Malaysia, 2018. [Google Scholar]
- Park, C.B.; Miller, R.D.; Miura, H. Optimum Field Parameters of an MASW Survey. Proc. Soc. Explor. Geophys. Jpn. Tokyo 2002, 22, 23. [Google Scholar]
- Pilecki, Z. Techniki Sejsmiczne. In Metoda Sejsmiczna w Geoinżynierii; IGSMiE PAN: Kraków, Poland, 2018; pp. 123–168. ISBN 9788362922895. (In Polish) [Google Scholar]
- Dal Moro, G. (Ed.) Surface Wave Analysis for Near Surface Applications; Elsevier: Oxford, UK, 2014; ISBN 978-0-12-800770-9. [Google Scholar]
- Bohlen, T. Parallel 3-D Viscoelastic Finite Difference Seismic Modelling. Comput. Geosci. 2002, 28, 887–899. [Google Scholar] [CrossRef]
- de Jong, C.; Carletti, G.; Previtali, F. Assessing Impacts of Climate Change, Ski Slope, Snow and Hydraulic Engineering on Slope Stability in Ski Resorts (French and Italian Alps). In Engineering Geology for Society and Territory—Volume 1; Lollino, G., Manconi, A., Clague, J., Shan, W., Chiarle, M., Eds.; Springer International Publishing: Cham, Switzerland, 2015; pp. 51–55. ISBN 978-3-319-09300-0. [Google Scholar]
- Matsuura, S.; Okamoto, T.; Osawa, H.; Shibasaki, T.; Abe, K.; Okada, Y. Fluctuations in the Pore-Water Pressure of a Reactivated Landslide in a Snowy District. In Landslide Science for a Safer Geoenvironment Vol. 3 Targeteted Landslides; Springer: Cham, Switzerland, 2014; Volume 3, pp. 1–717. [Google Scholar] [CrossRef]
- Kawagoe, S.; Kazama, S.; Sarukkalige, P.R. Assessment of Snowmelt Triggered Landslide Hazard and Risk in Japan. Cold Reg. Sci. Technol. 2009, 58, 120–129. [Google Scholar] [CrossRef] [Green Version]
- Yalcinkaya, E.; Alp, H.; Ozel, O.; Gorgun, E.; Martino, S.; Lenti, L.; Bourdeau, C.; Bigarre, P.; Coccia, S. Near-Surface Geophysical Methods for Investigating the Buyukcekmece Landslide in Istanbul, Turkey. J. Appl. Geophys. 2016, 134, 23–35. [Google Scholar] [CrossRef]


| Step | Step Name | Target | Outcome |
|---|---|---|---|
| 1 | Simultaneous geophysical data processing | Recognition of the subsurface structures with information cross-correlation between methods | Geophysical images of the subsurface |
| 2 | Digital terrain model construction | Construction of the aerial surface model from two TLS datasets | Recognition of the changes visible on the surface |
| 3 | Data integration and uncertainty estimation | Synthetic verification of geophysical data to estimate result uncertainty, integration of aerial and subsurface data to final model creation | The final subsurface model with information about changes occurring during May and October 2019. Information about the uniformity of the sliding structure by comparison of data from previous studies with the latest data |
| Layer | Velocity in the Real Model (m/s) | Velocity in the Synthetic Model (m/s) | Difference (m/s) | Difference (%) |
|---|---|---|---|---|
| 1 | 1110 | 1120 | 10 | 1 |
| 2 | 2640 | 2610 | 30 | 1 |
| 3 | 2960 | 3030 | 70 | 2 |
| 4 | 4730 | 3550 | 1180 | 25 |
Disclaimer/Publisher’s Note: The statements, opinions and data contained in all publications are solely those of the individual author(s) and contributor(s) and not of MDPI and/or the editor(s). MDPI and/or the editor(s) disclaim responsibility for any injury to people or property resulting from any ideas, methods, instructions or products referred to in the content. |
© 2022 by the authors. Licensee MDPI, Basel, Switzerland. This article is an open access article distributed under the terms and conditions of the Creative Commons Attribution (CC BY) license (https://creativecommons.org/licenses/by/4.0/).
Share and Cite
Wróbel, M.; Stan-Kłeczek, I.; Marciniak, A.; Majdański, M.; Kowalczyk, S.; Nawrot, A.; Cader, J. Integrated Geophysical Imaging and Remote Sensing for Enhancing Geological Interpretation of Landslides with Uncertainty Estimation—A Case Study from Cisiec, Poland. Remote Sens. 2023, 15, 238. https://doi.org/10.3390/rs15010238
Wróbel M, Stan-Kłeczek I, Marciniak A, Majdański M, Kowalczyk S, Nawrot A, Cader J. Integrated Geophysical Imaging and Remote Sensing for Enhancing Geological Interpretation of Landslides with Uncertainty Estimation—A Case Study from Cisiec, Poland. Remote Sensing. 2023; 15(1):238. https://doi.org/10.3390/rs15010238
Chicago/Turabian StyleWróbel, Małgorzata, Iwona Stan-Kłeczek, Artur Marciniak, Mariusz Majdański, Sebastian Kowalczyk, Adam Nawrot, and Justyna Cader. 2023. "Integrated Geophysical Imaging and Remote Sensing for Enhancing Geological Interpretation of Landslides with Uncertainty Estimation—A Case Study from Cisiec, Poland" Remote Sensing 15, no. 1: 238. https://doi.org/10.3390/rs15010238