

Multi-Level Data Analyses in the Gajevo Landslide Research, Croatia

Abstract
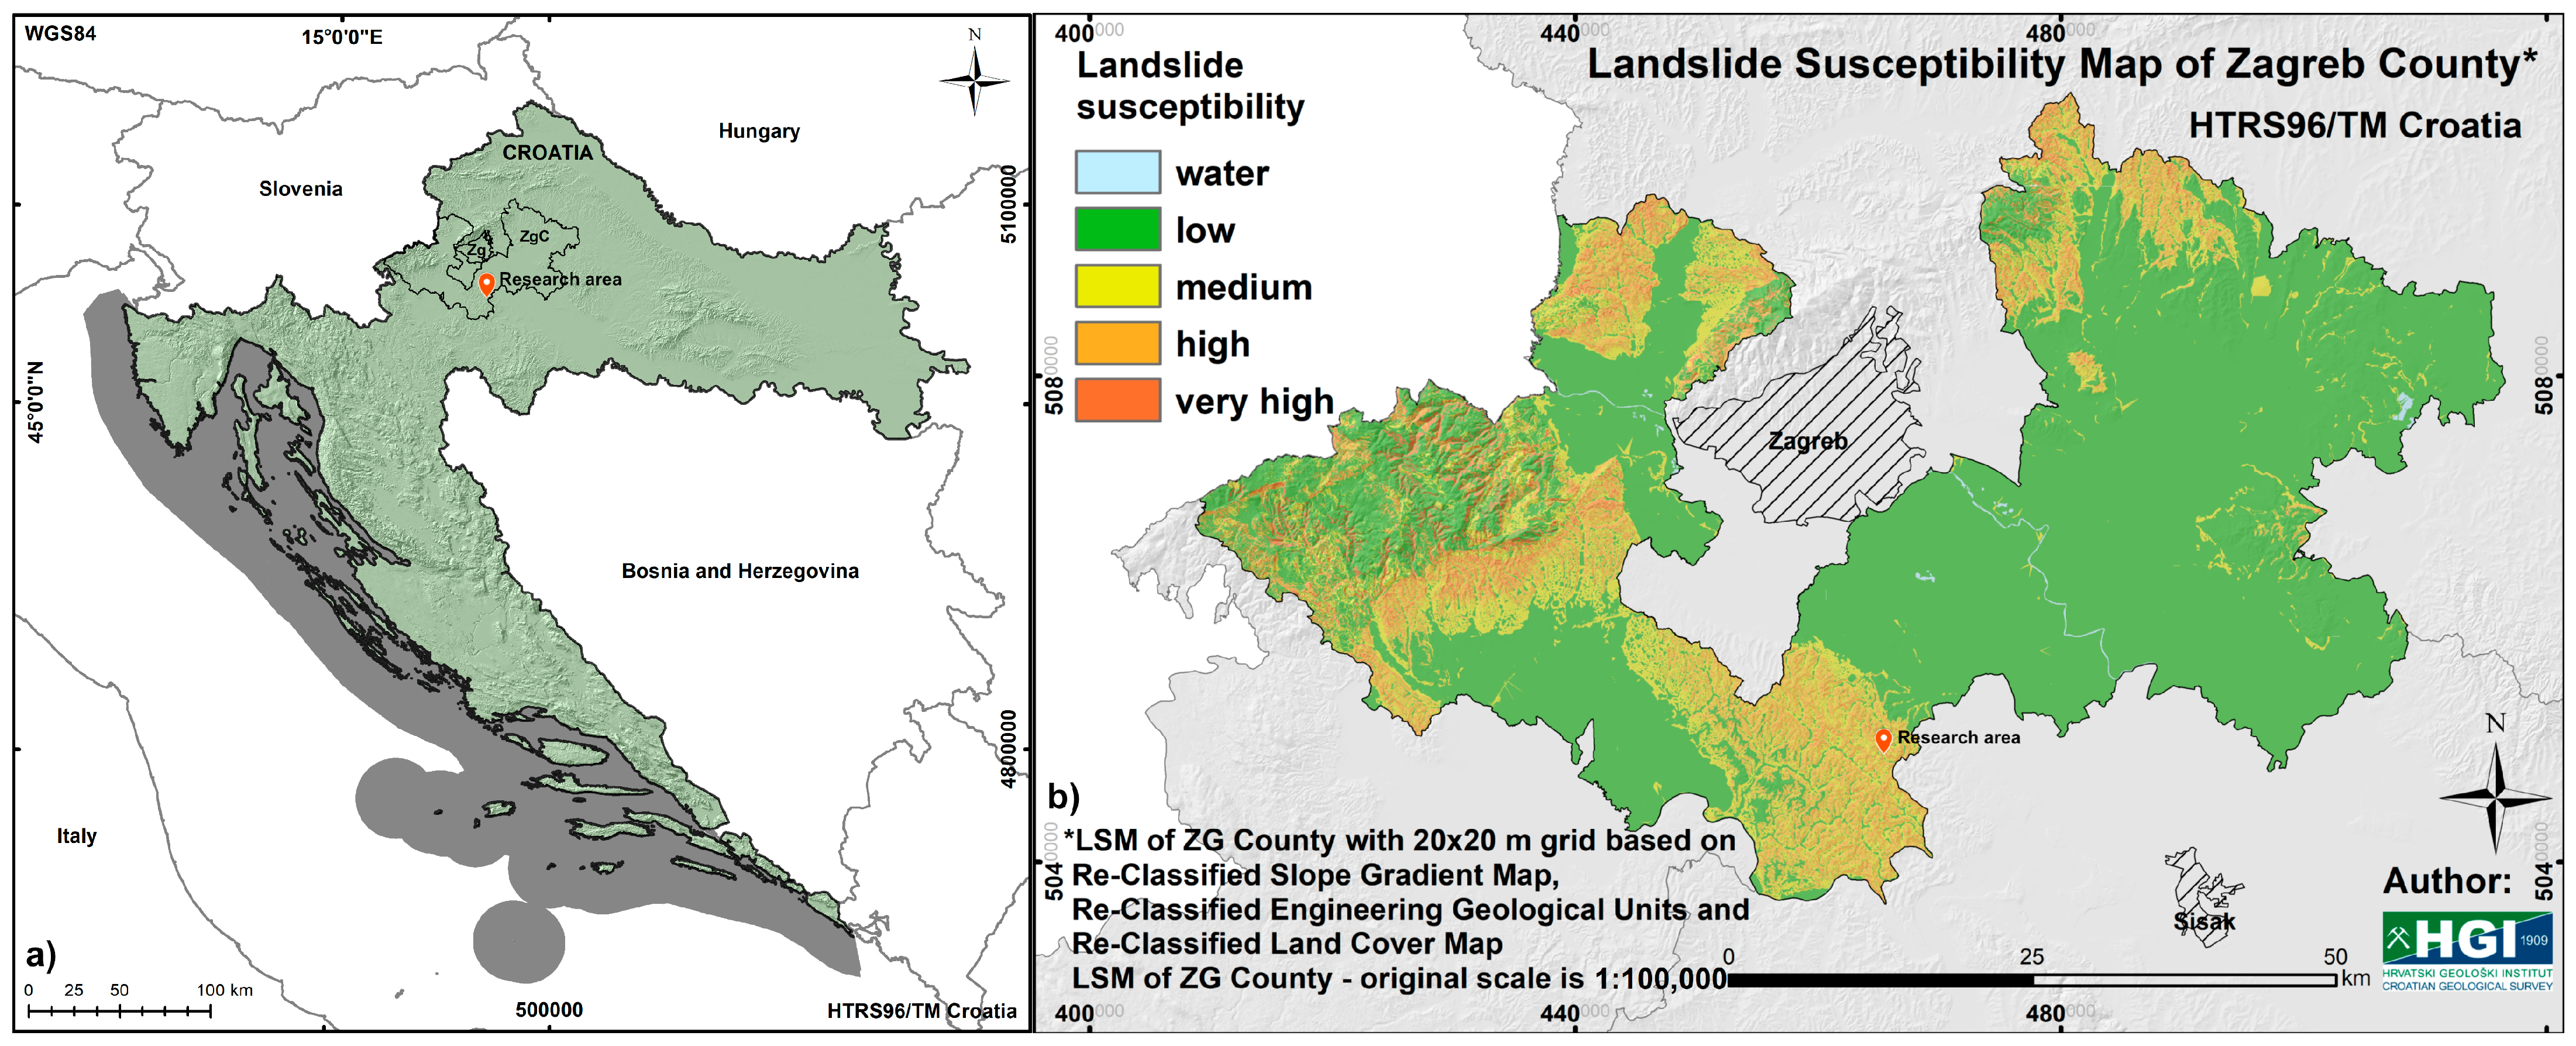
:1. Introduction
2. Materials and Methods
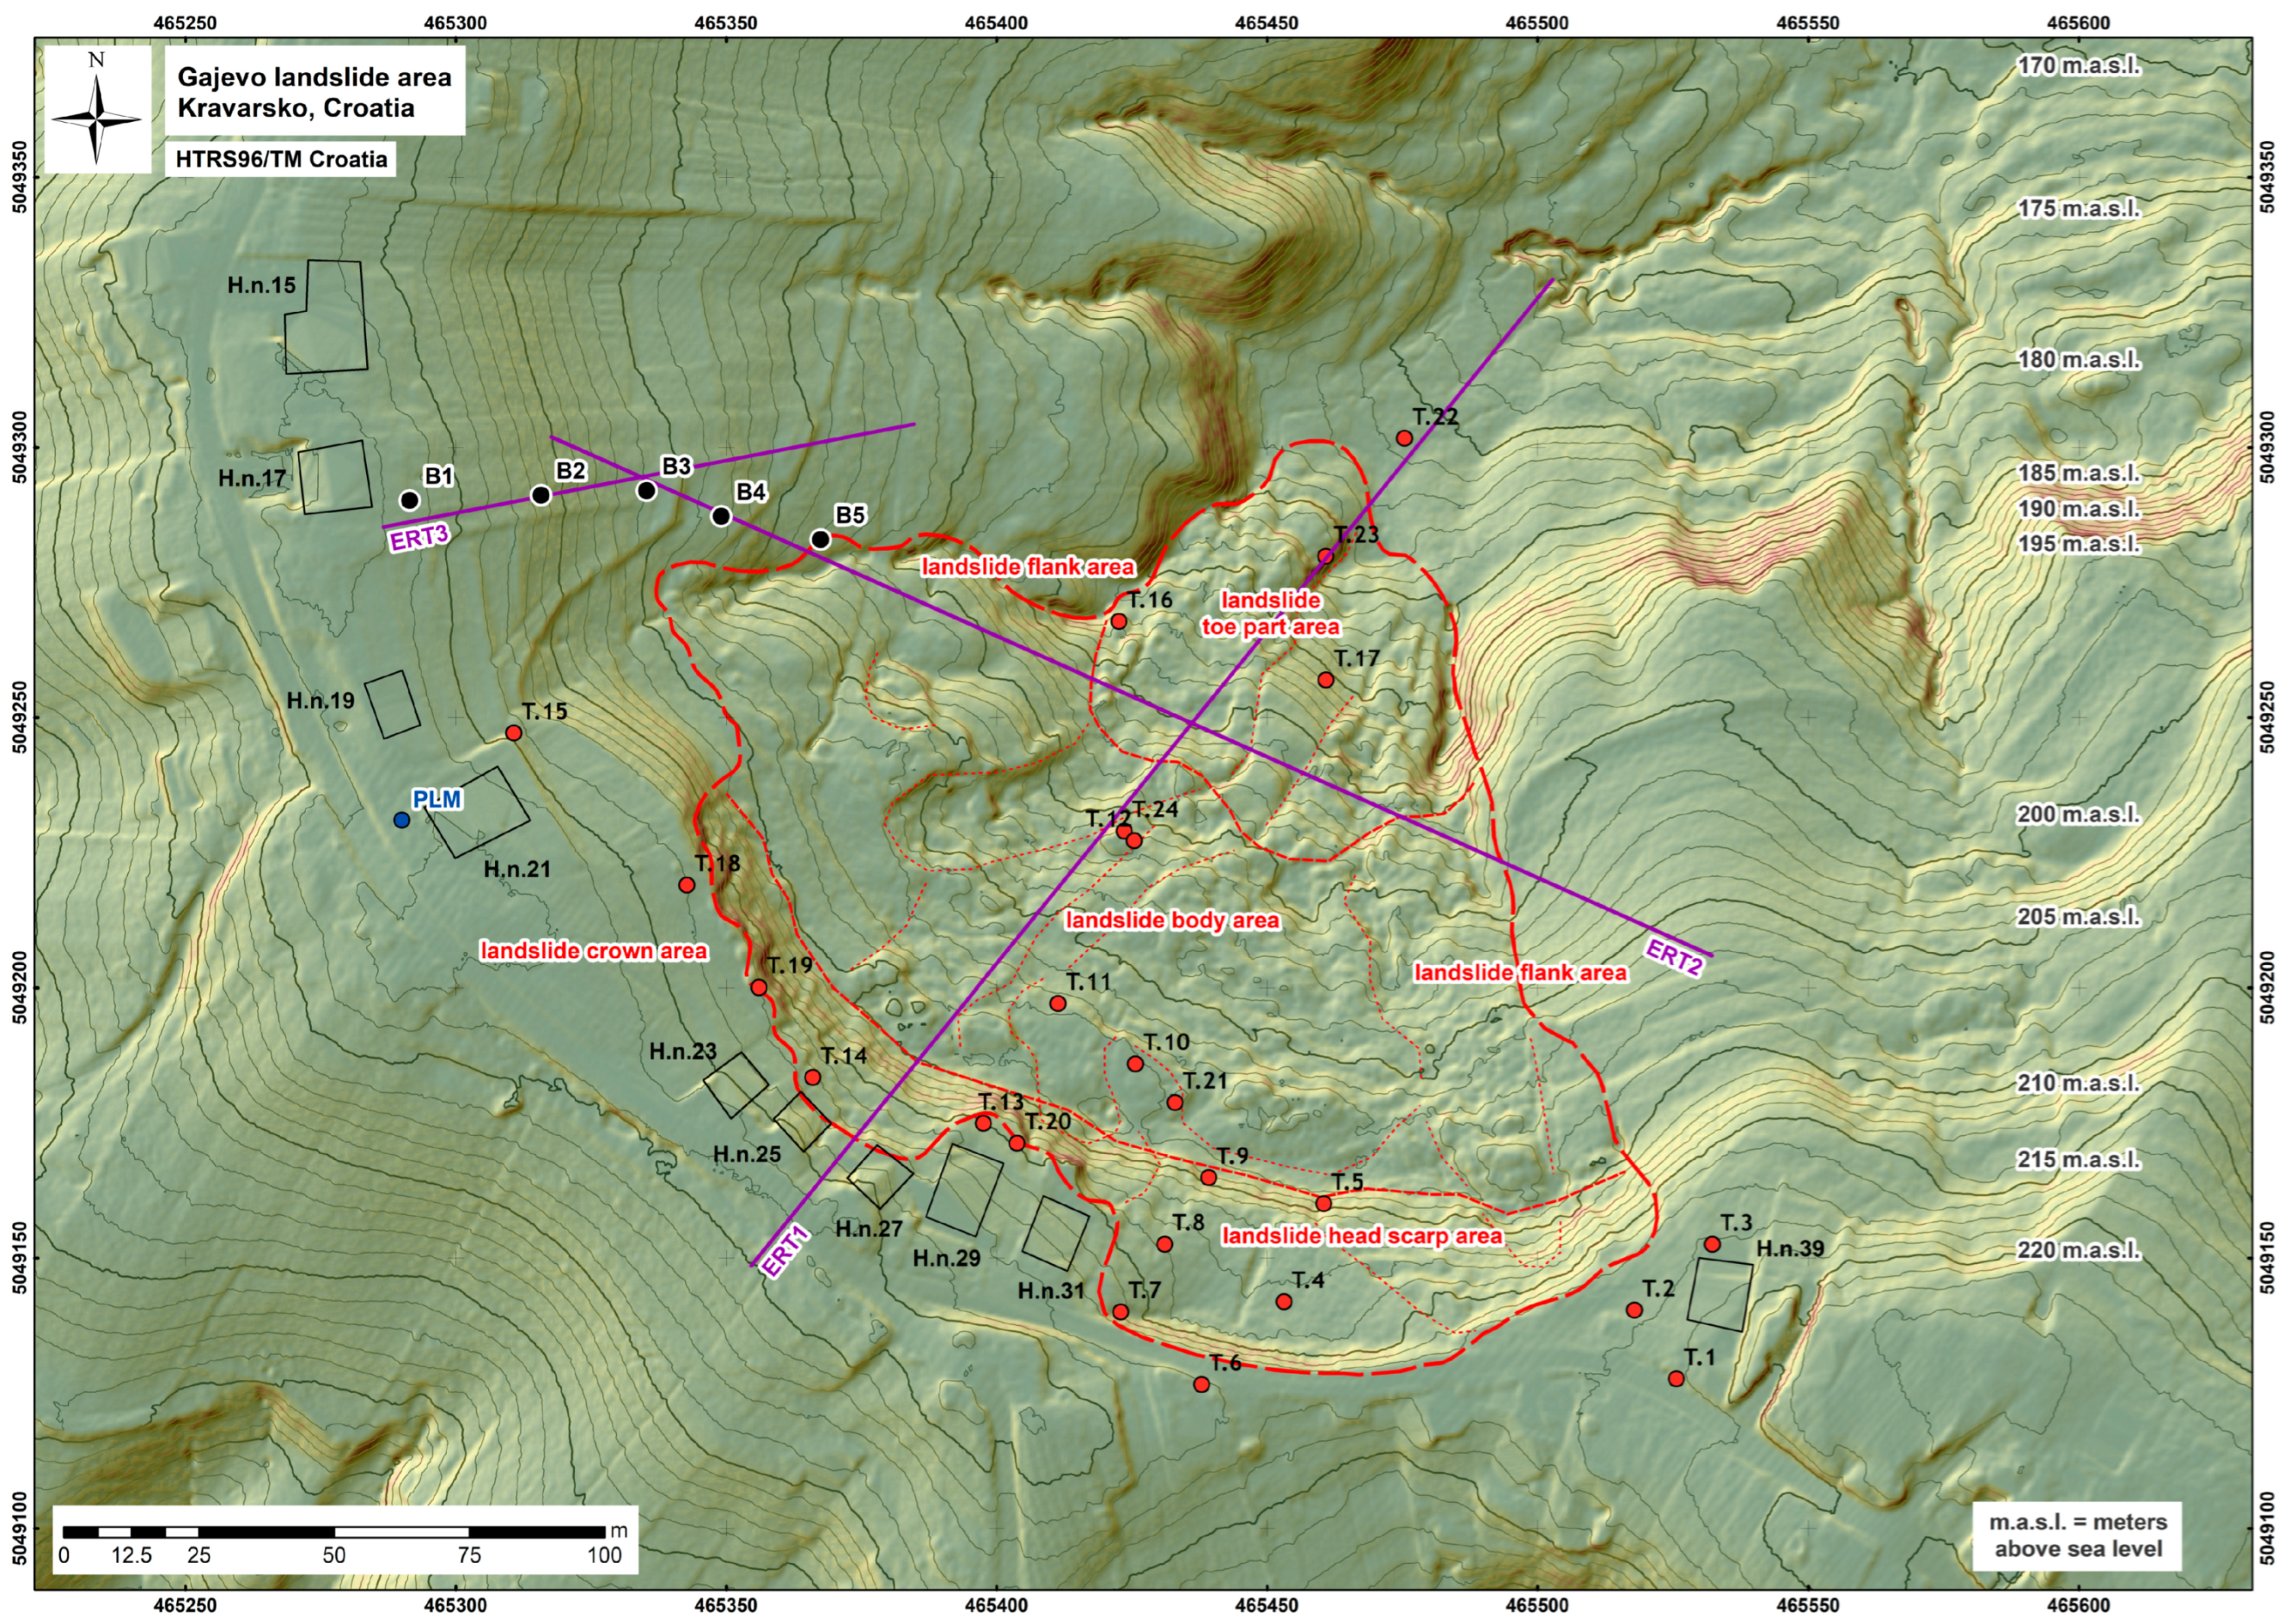
2.1. Engineering Geological Mapping—Integrating Multi-Level Data
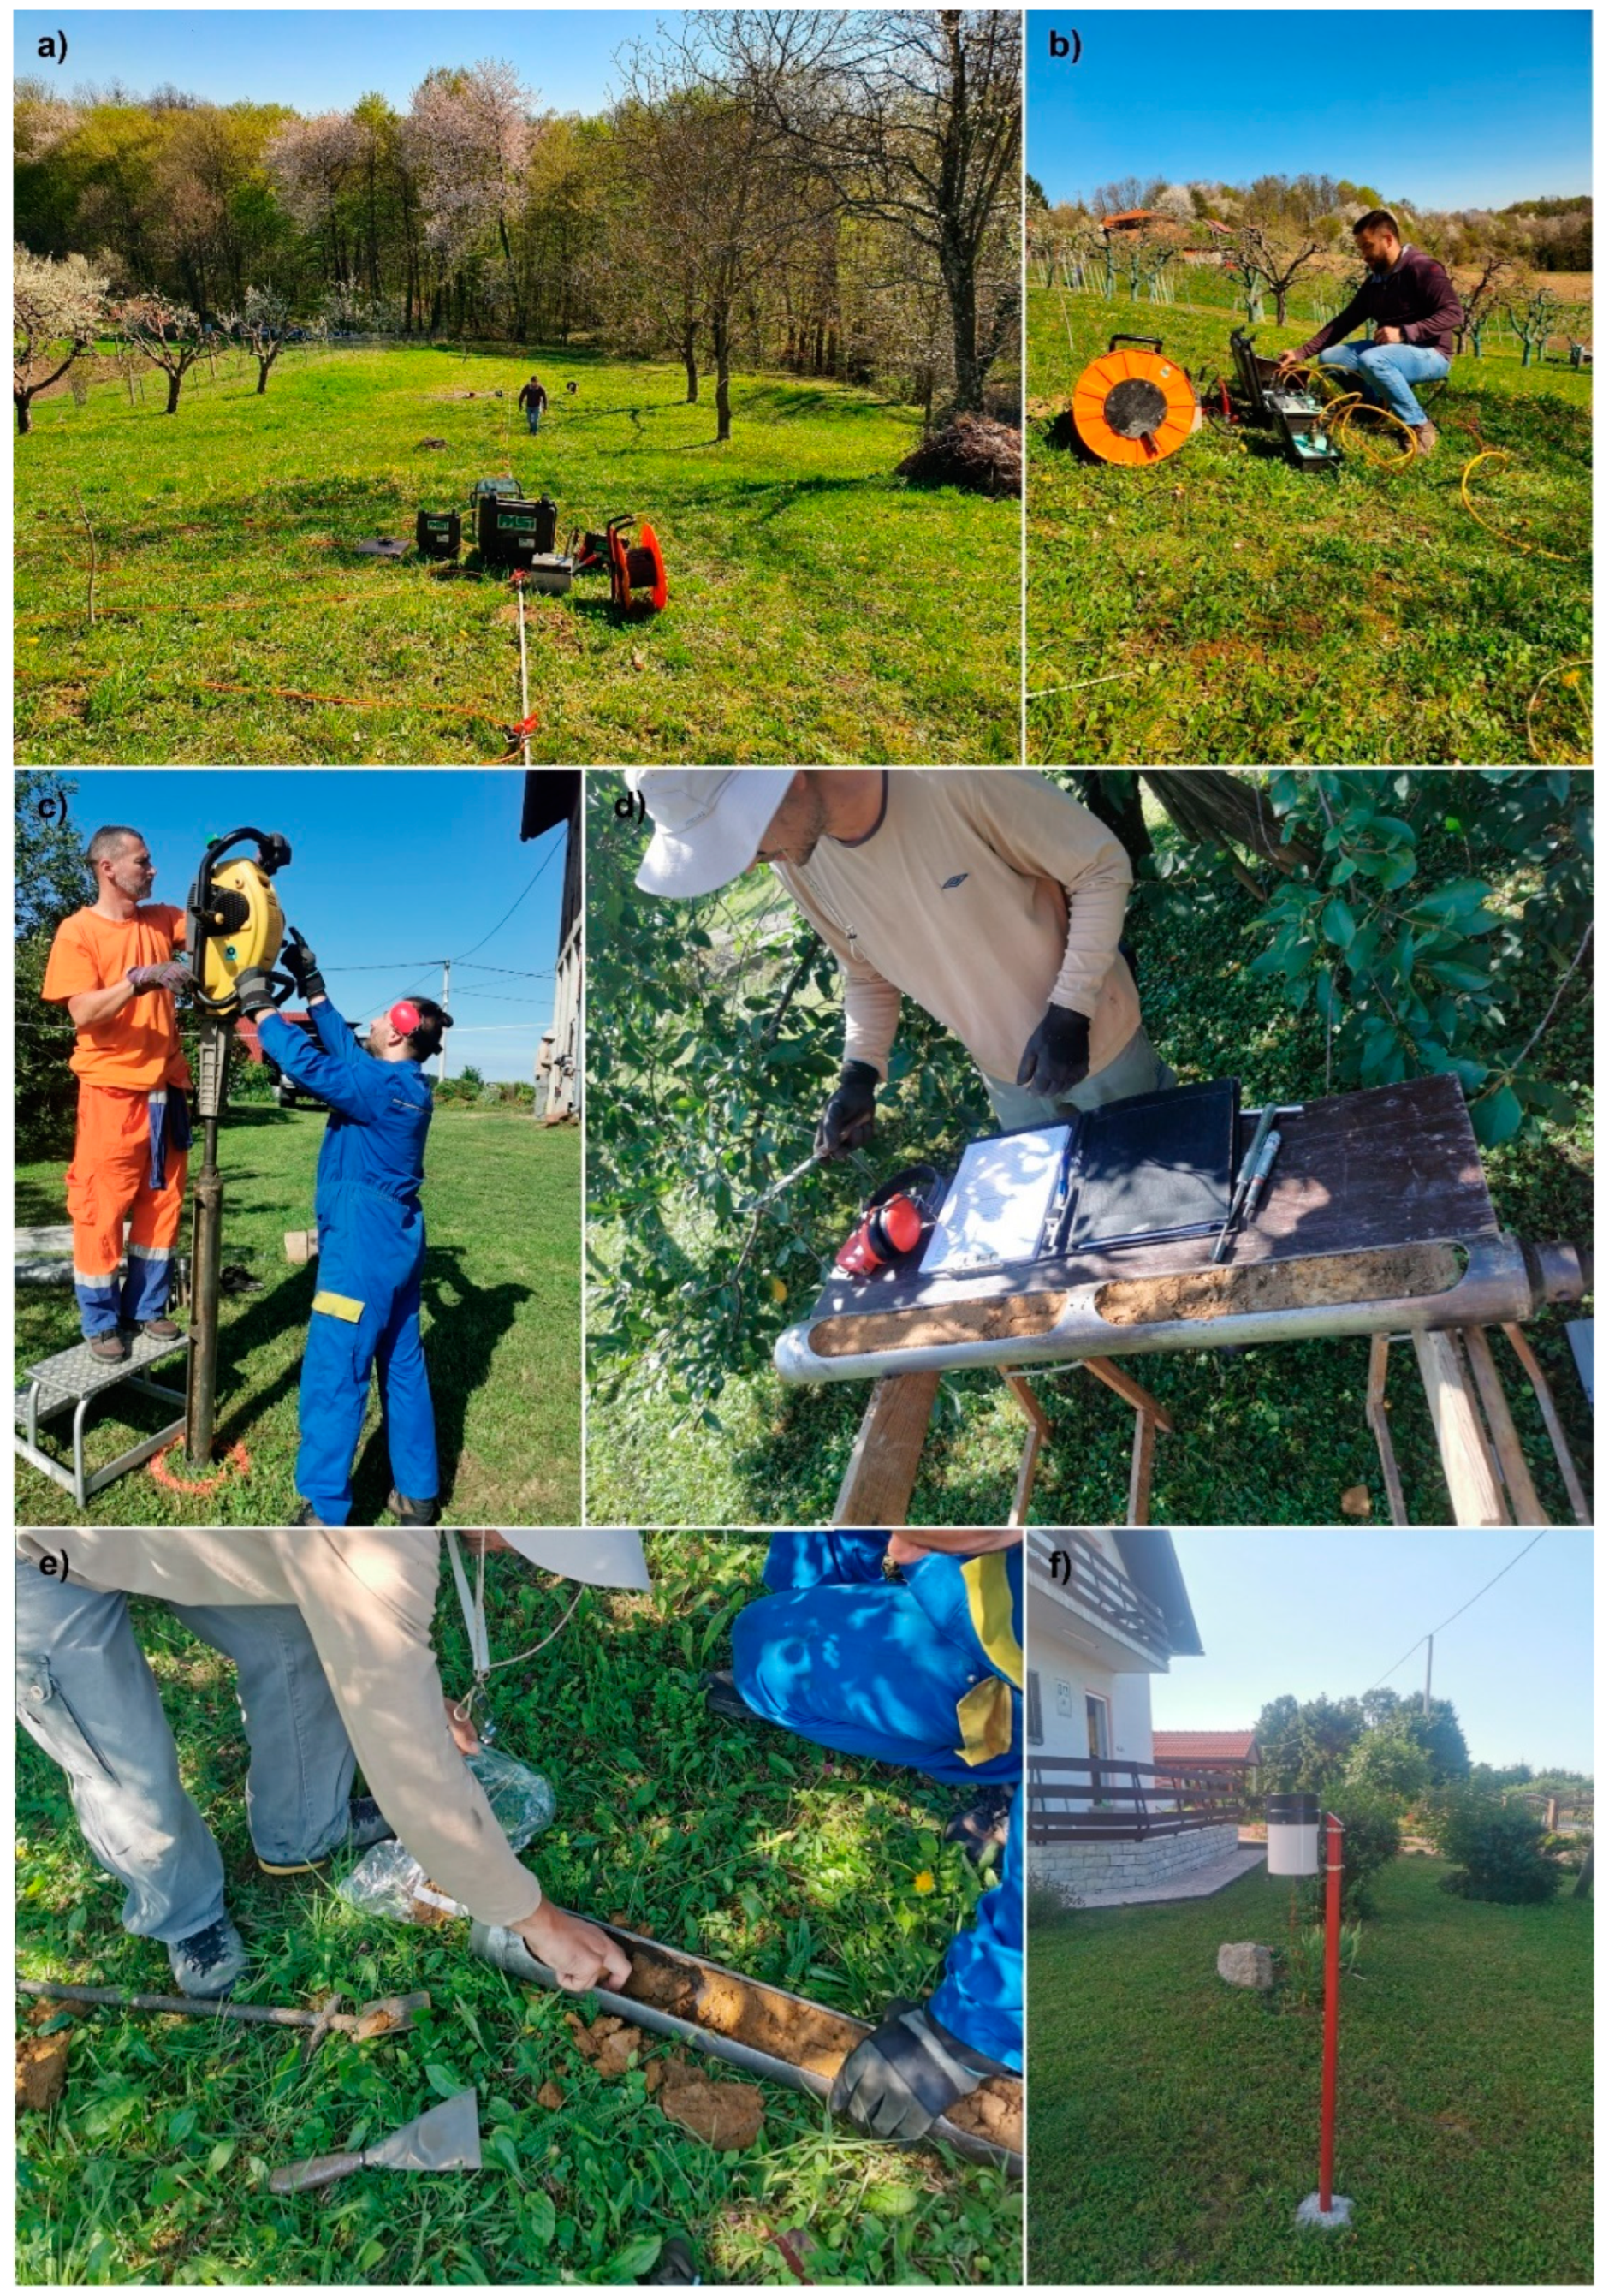
2.2. Geophysical Measurements—ERT in Landslide Research
2.3. Laboratory Analysis
2.4. Precipitation Data
3. Results
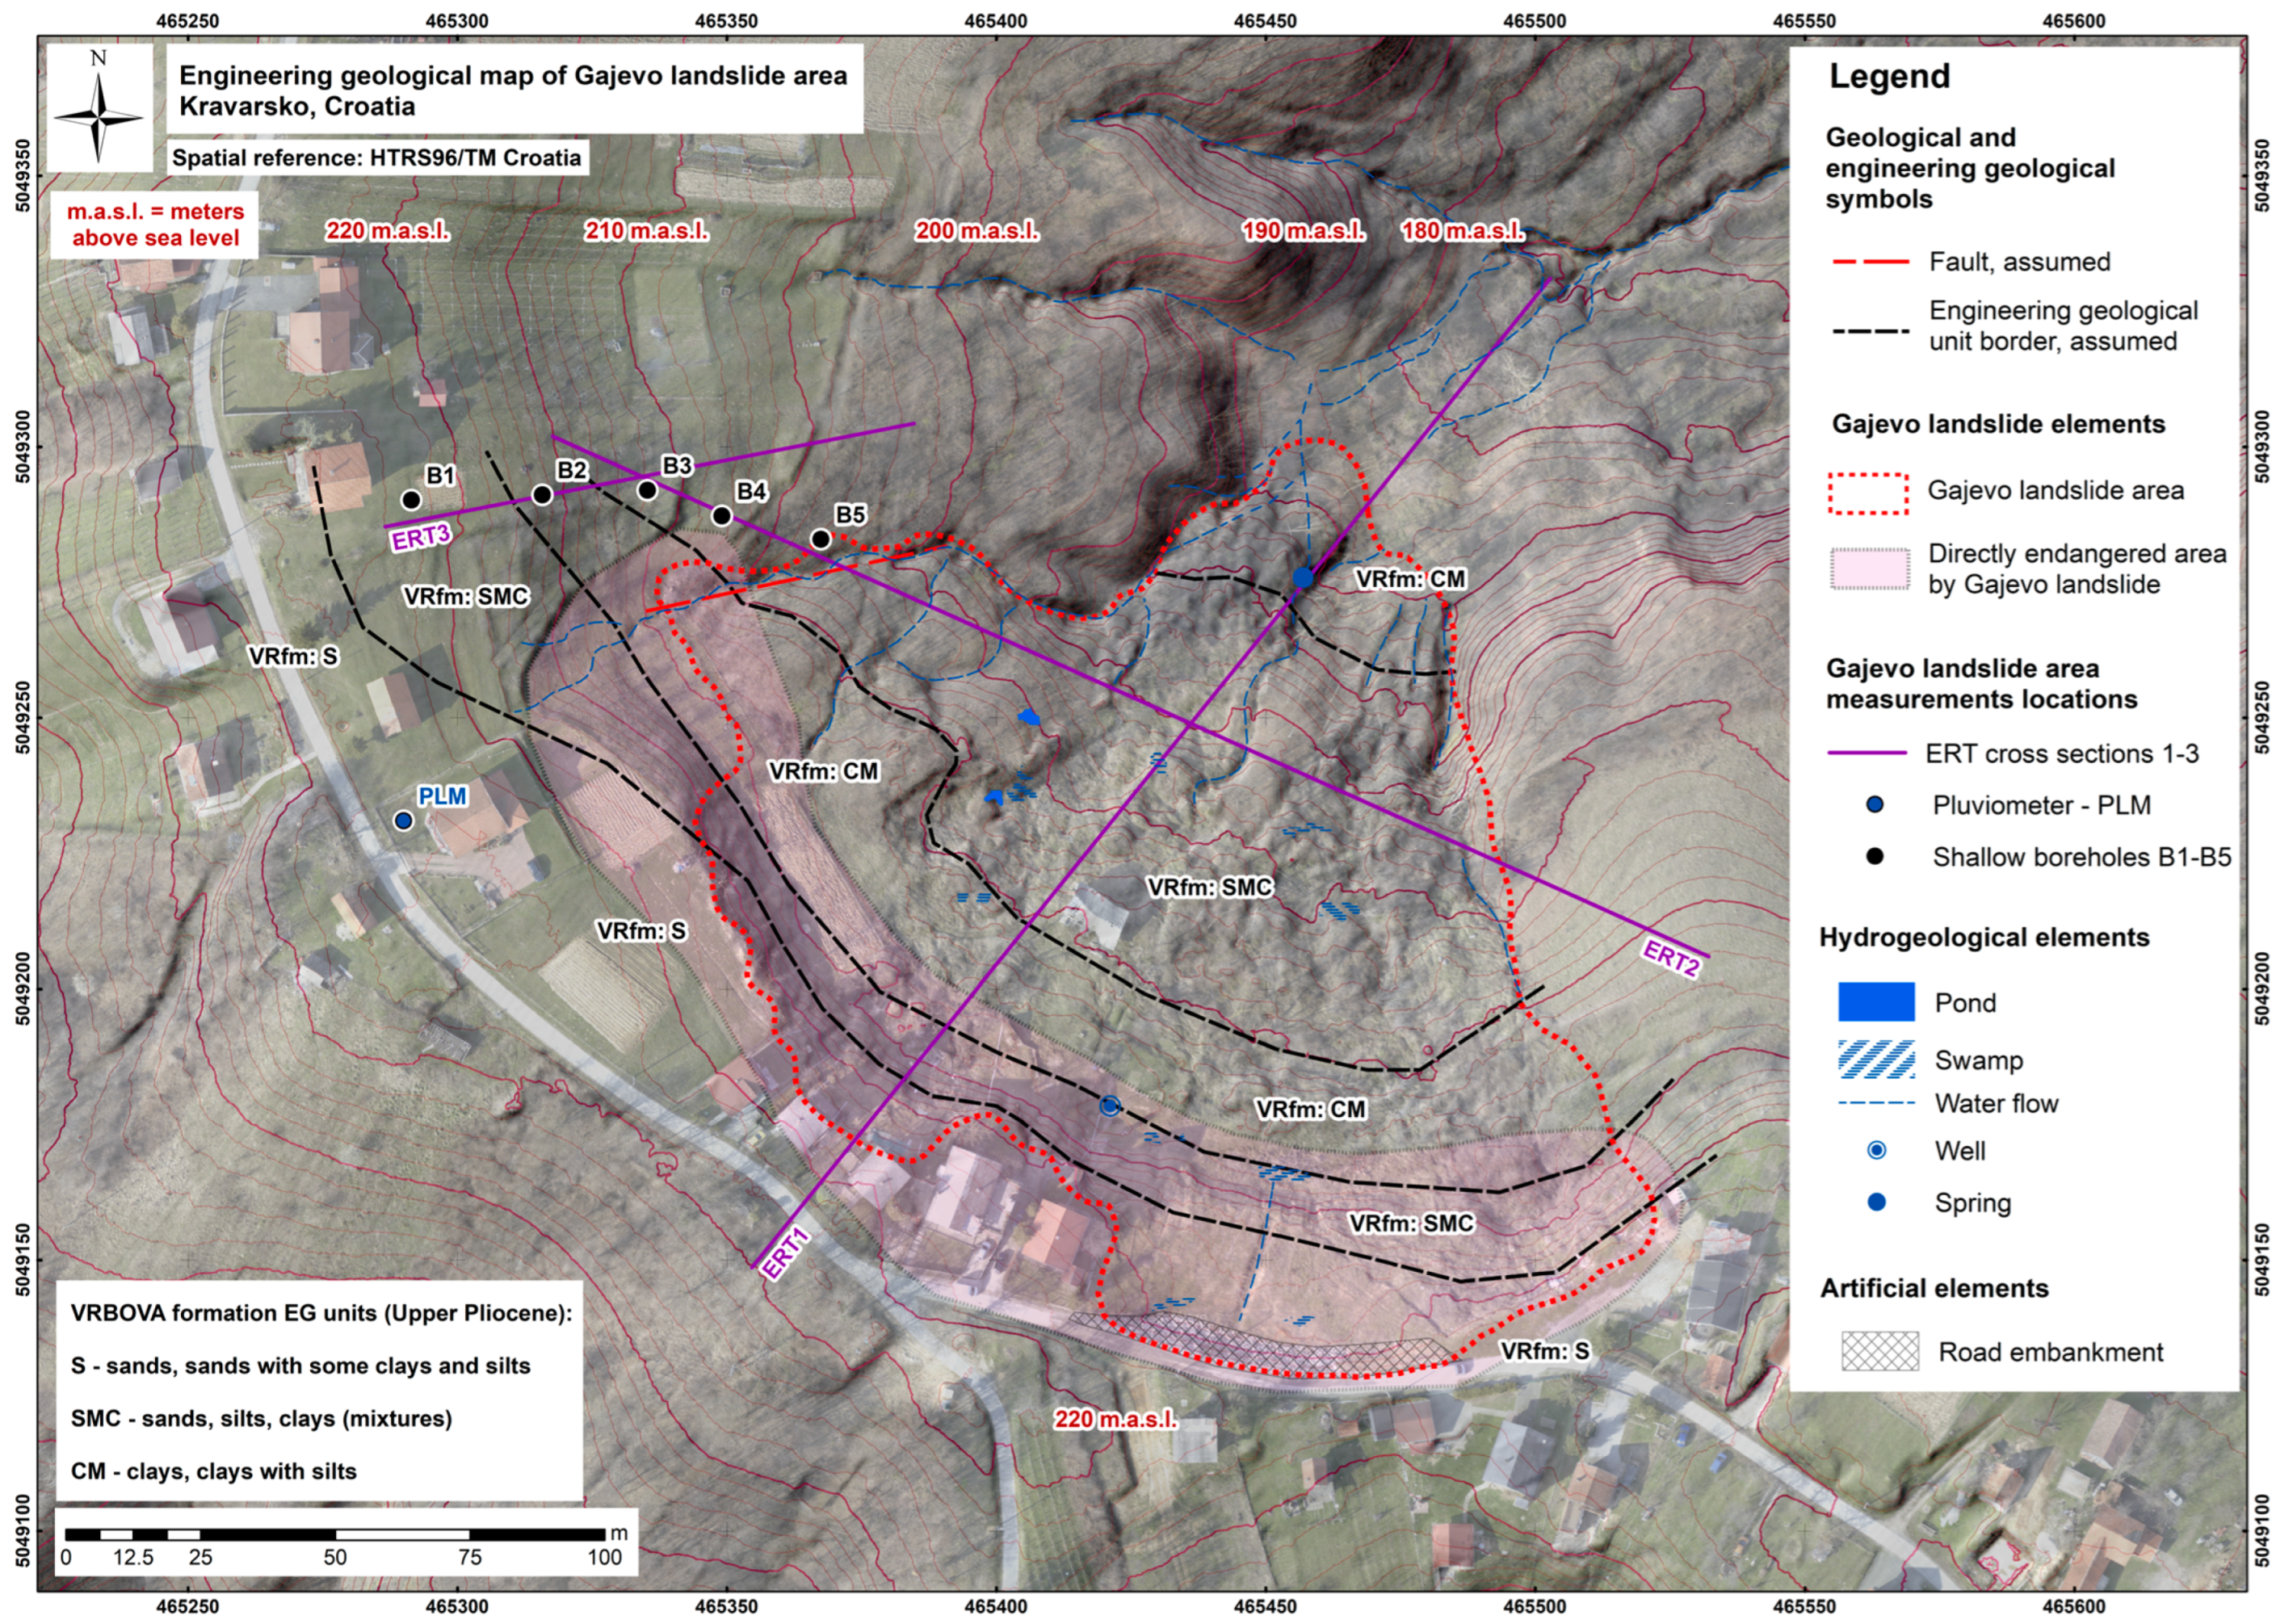
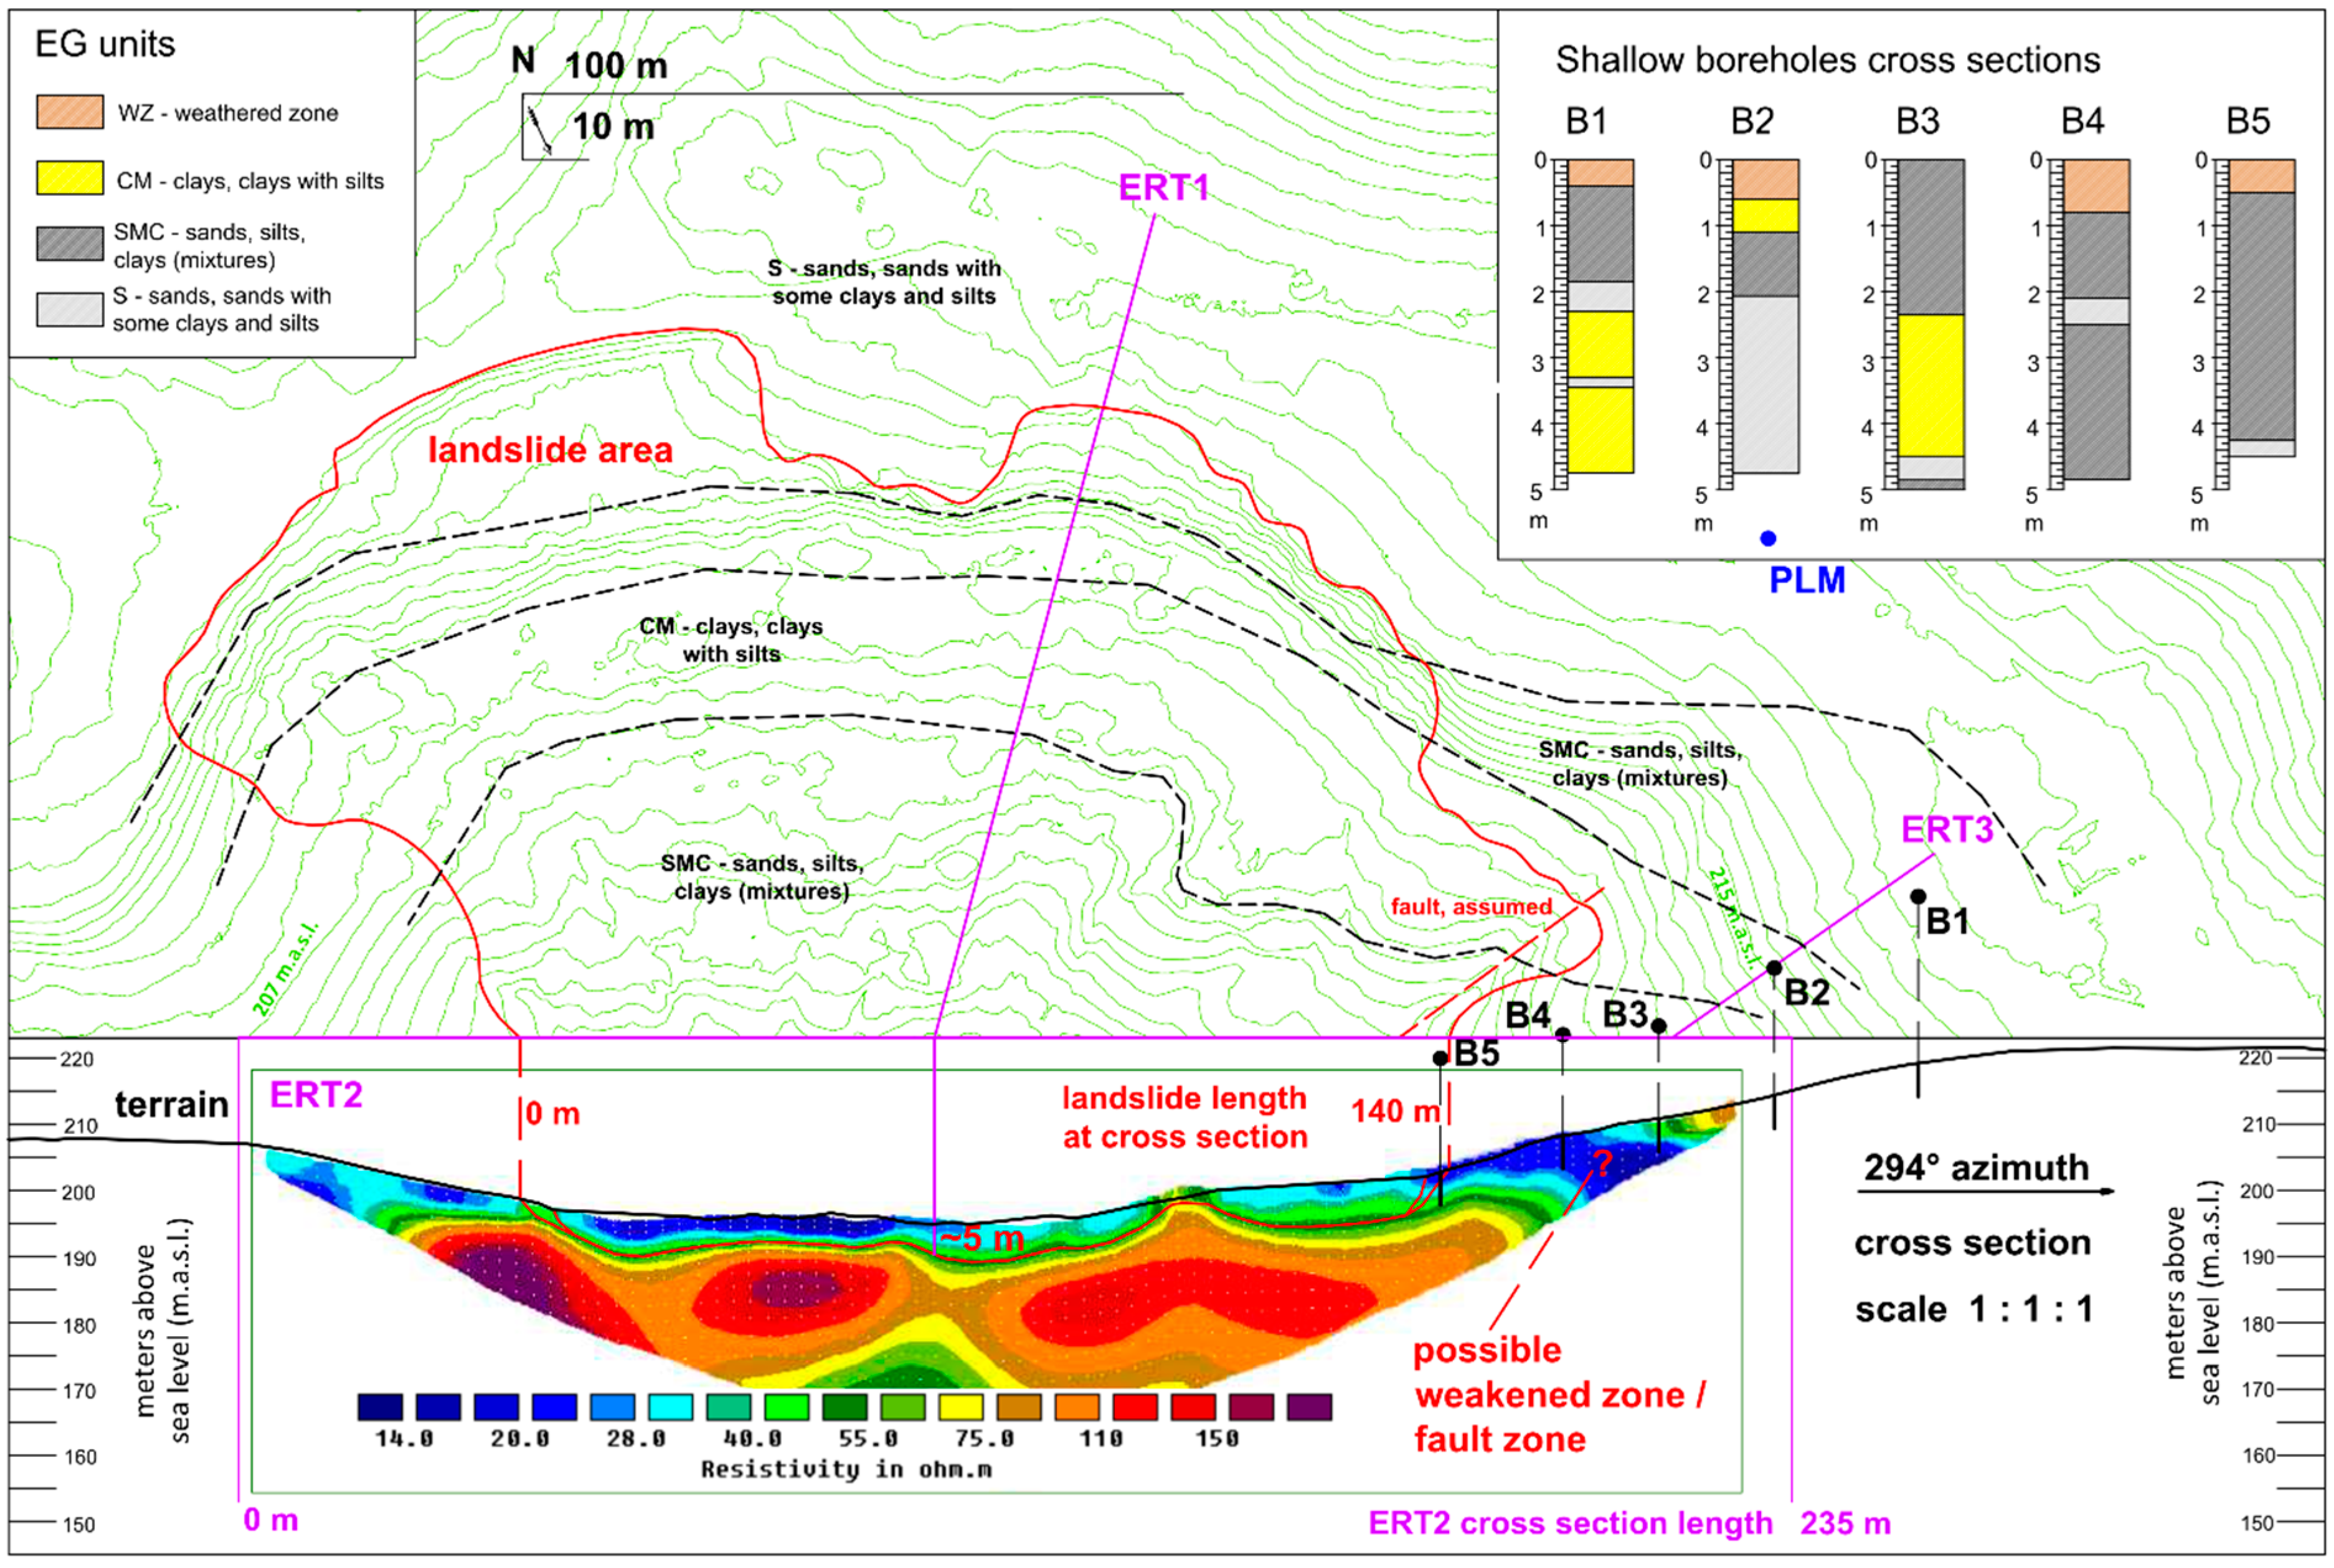
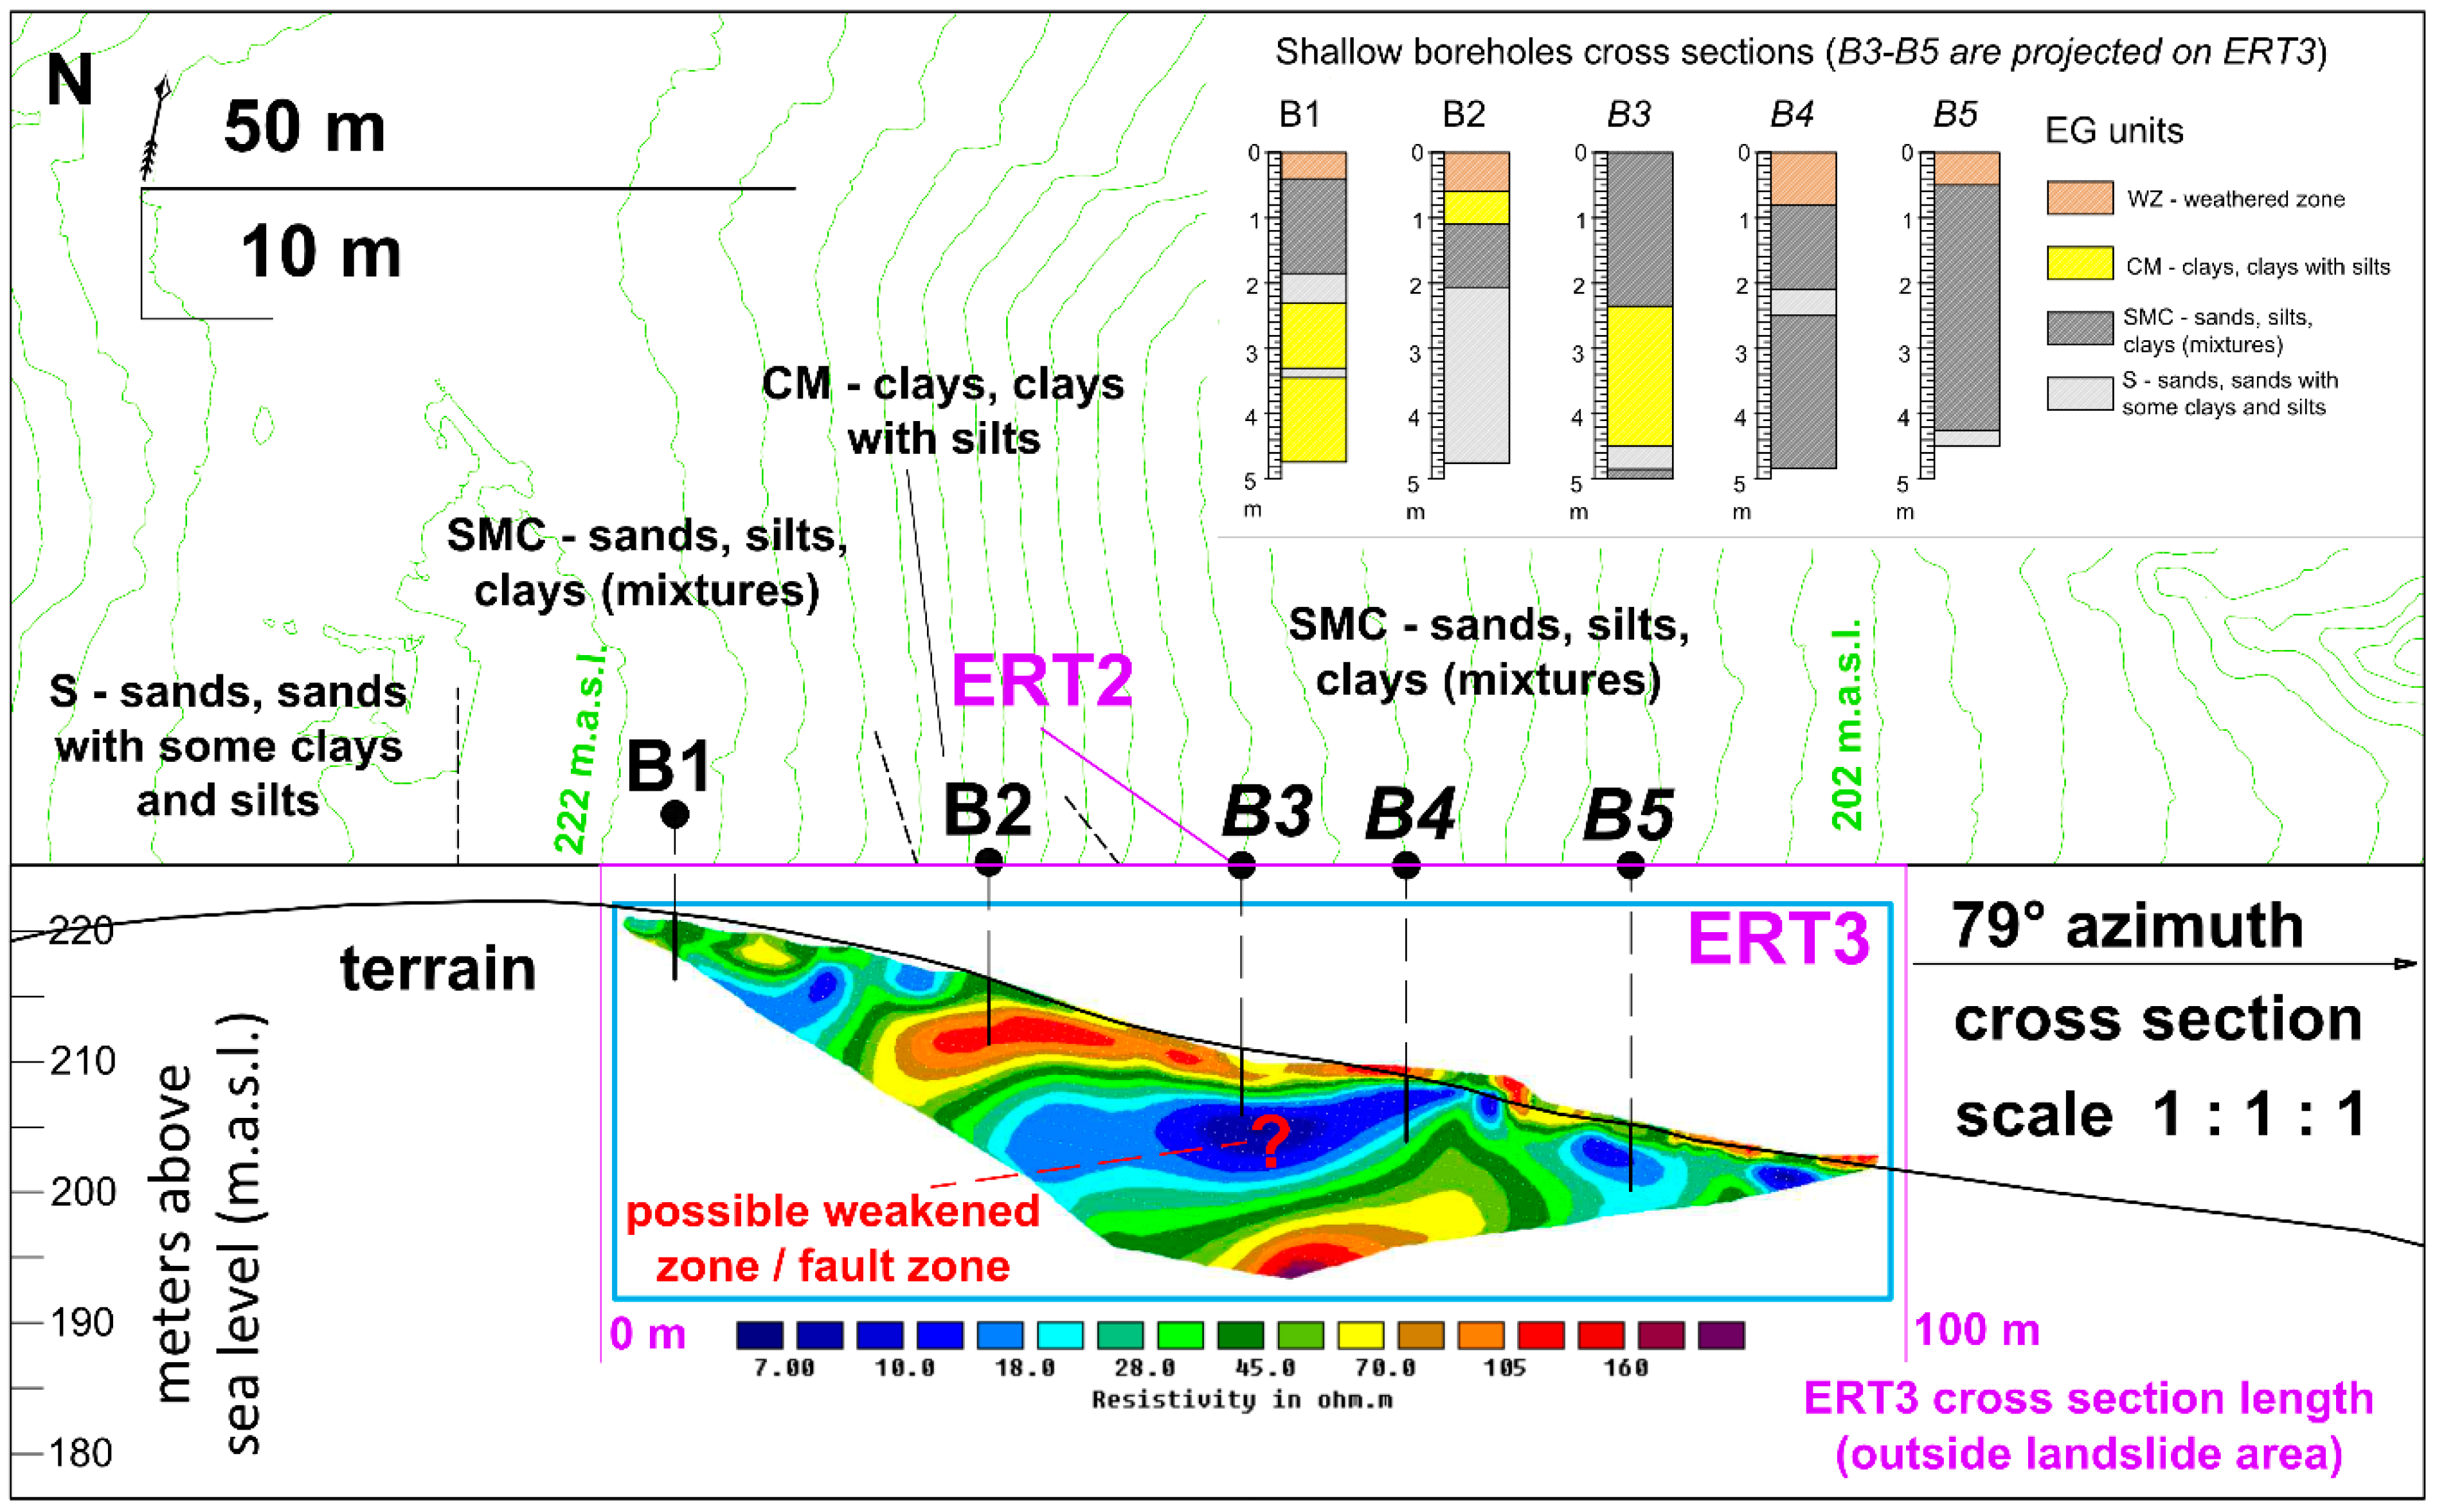
3.1. Updated Engineering Geological Map
3.2. Developed ERT Cross-Sections with Borehole Data
3.3. Laboratory Analysis Results
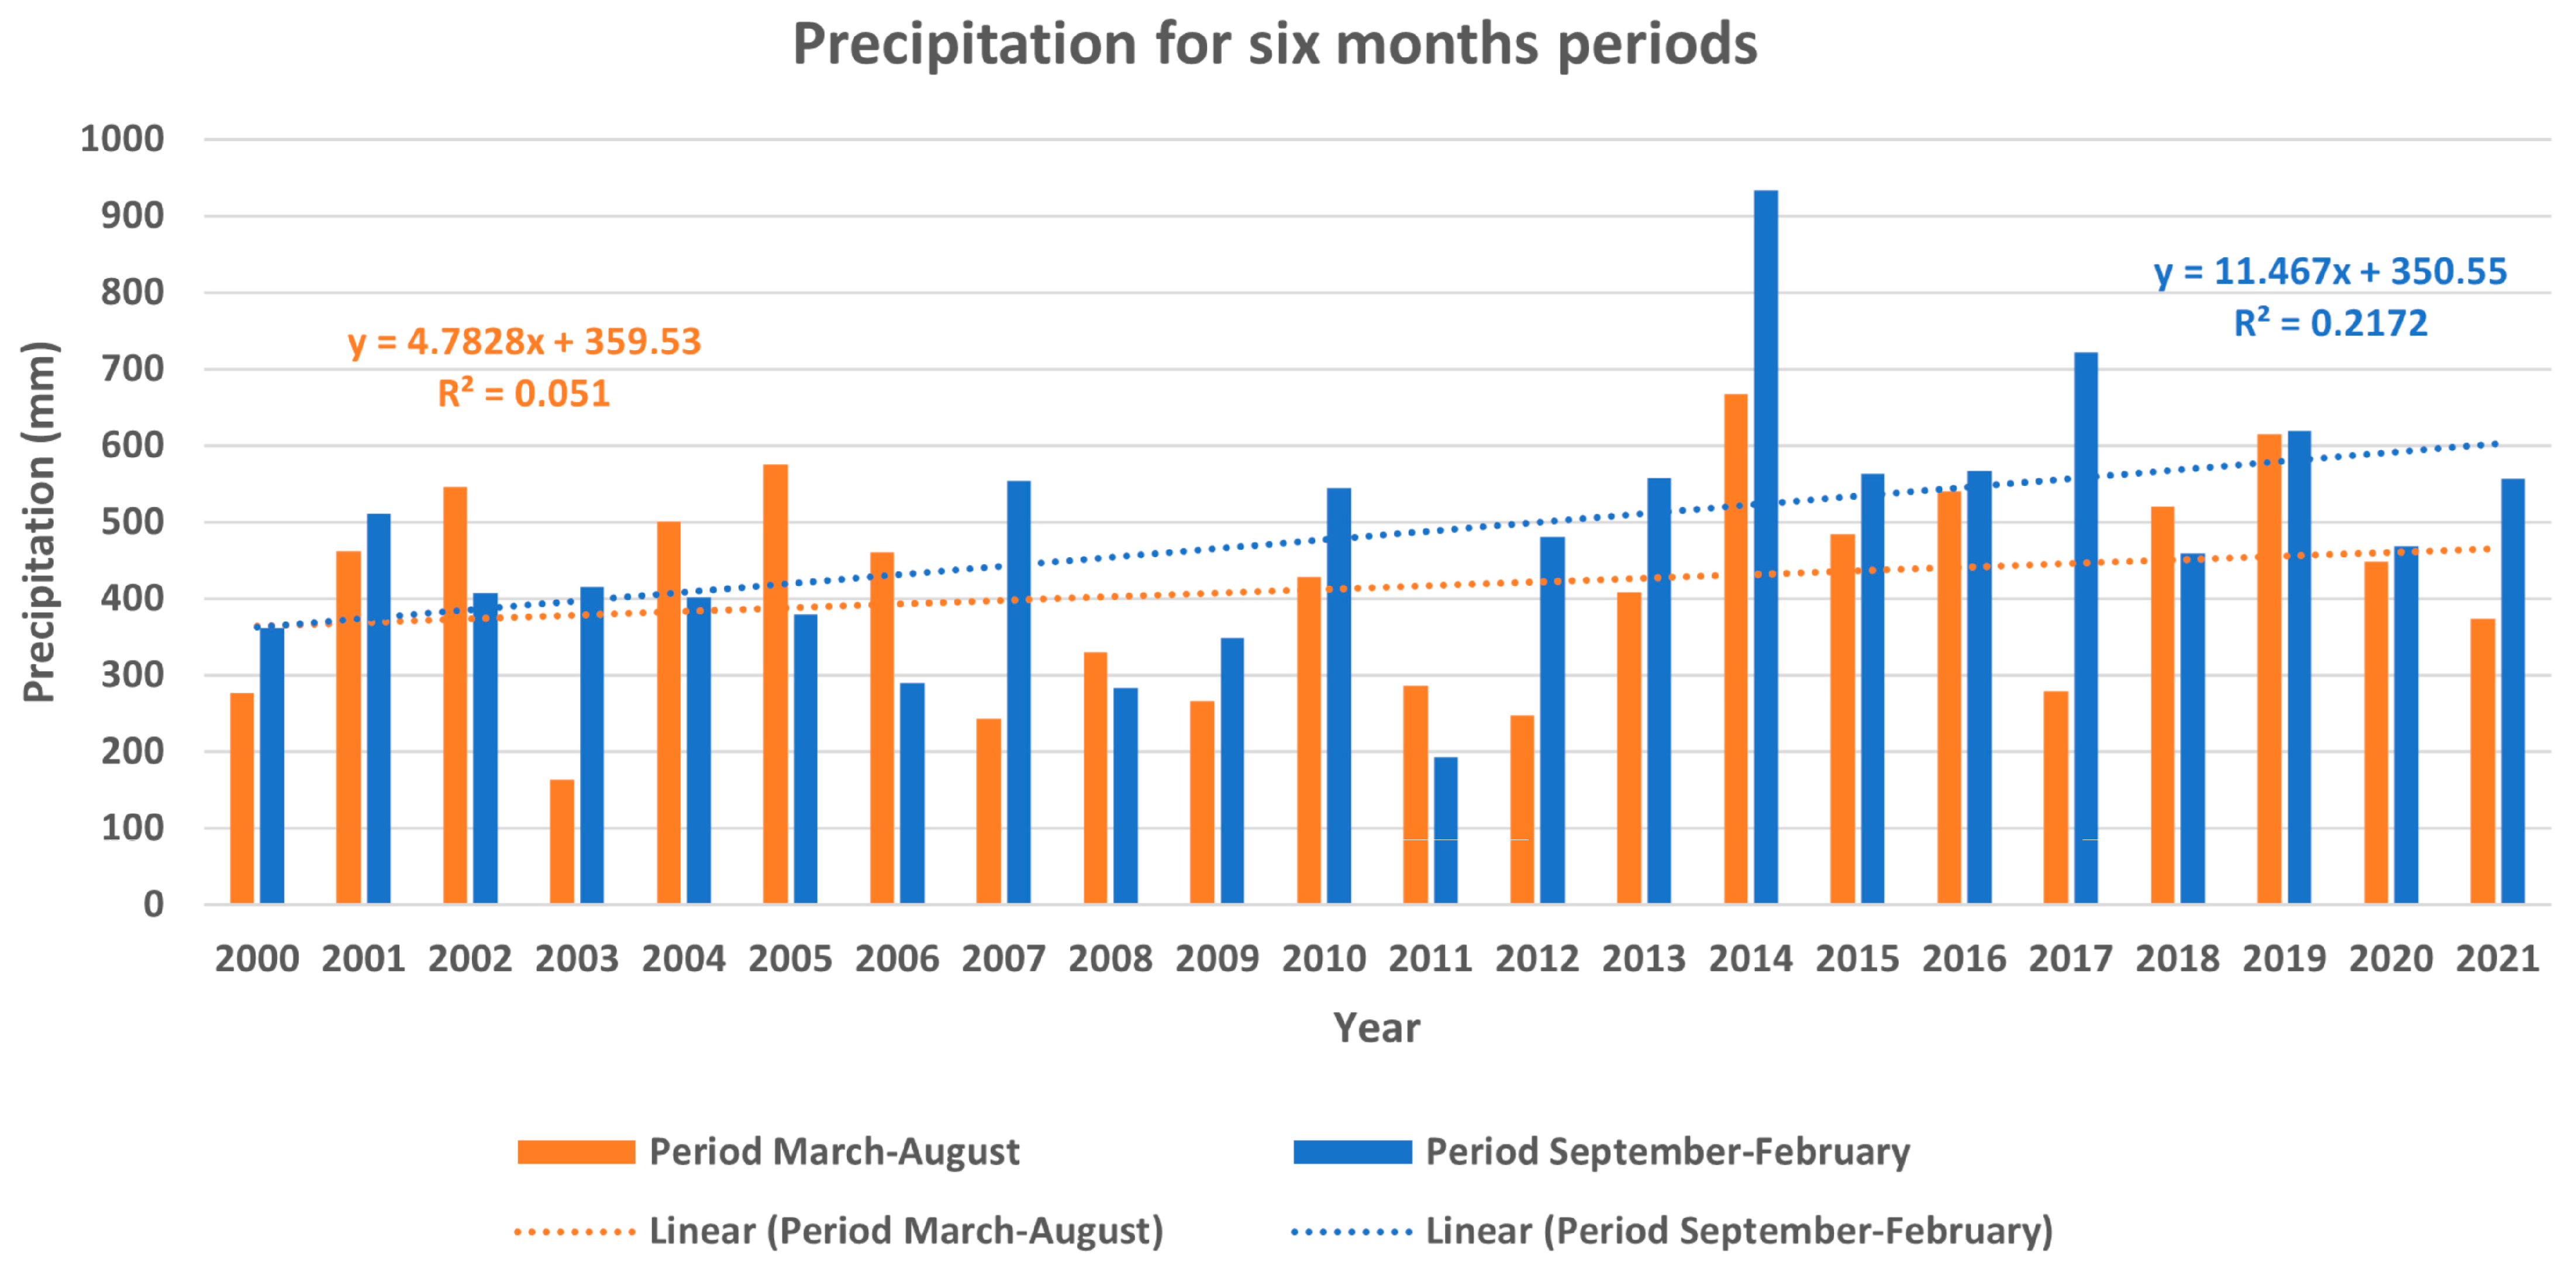
3.4. Analysis of Precipitation Data from Kravarsko Meteorological Station
4. Discussion
4.1. Comments on the Developed Engineering Geological Map of the Gajevo Landslide Area
4.2. Gajevo Landslide Area 3D Data Review
4.3. Gajevo Landslide Area Material Properties Findings
4.4. Importance of Heavy Rainfall Events
4.5. Landslide Mitigation Plan Guidelines
5. Conclusions
Author Contributions
Funding
Data Availability Statement
Acknowledgments
Conflicts of Interest
References
- Cruden, D.M. A simple definition of a landslide. Bull. Int. Assoc. Eng. Geol. 1991, 43, 27–29. [Google Scholar] [CrossRef]
- The International Geotechnical Societies’ UNESCO Working Party on World Landslide Inventory (WP/WLI). A suggested method for reporting a landslide. Bull. Int. Assoc. Eng. Geol. 1990, 41, 5–12. [Google Scholar] [CrossRef]
- Chacón, J.; Irigaray, C.; Fernández, T.; El Hamdouni, R. Engineering Geology Maps: Landslides and Geographical Information Systems. Bull. Eng. Geol. Environ. 2006, 65, 341–411. [Google Scholar] [CrossRef]
- Cornforth, D.H. Landslides in Practice: Investigation, Analysis, and Remedial/Preventative Options in Soils; John Wiley & Sons, Inc.: Hoboken, NJ, USA, 2005; pp. 1–596. ISBN 978-0-471-67816-8. [Google Scholar]
- Cruden, D.M.; Varnes, D.J. Landslide types and processes. In Landslides—Investigation and Mitigation; Turner, A.K., Schuster, R.L., Eds.; Transportation Research Board: Washington, DC, USA, 1996; Special Report 247; pp. 36–75. Available online: http://onlinepubs.trb.org/Onlinepubs/sr/sr247/sr247-003.pdf (accessed on 25 October 2022).
- Highland, L.M.; Bobrowsky, P. The Landslide Handbook—A Guide to Understanding Landslides; US Geological Survey: Denver, CO, USA, 2008; pp. 1–147. [Google Scholar] [CrossRef] [Green Version]
- Varnes, D.J. Slope movement types and processes. In Landslides: Analysis and control; Schuster, R.L., Krizek, R.J., Eds.; Transportation Research Board. National Academy of Sciences: Washington, DC, USA, 1978; Special Report 176; pp. 11–33. Available online: https://www.engr.hk/T05/176-002.pdf (accessed on 25 October 2022).
- Varnes, D.J. Landslide Hazard Zonation: A Review of Principles and Practice; International Association of Engineering Geology: Paris, France, 1984; pp. 1–63. [Google Scholar]
- Carrión-Mero, P.; Montalván-Burbano, N.; Morante-Carballo, F.; Quesada-Román, A.; Apolo-Masache, B. Worldwide Research Trends in Landslide Science. Int. J. Environ. Res. Public Health 2021, 18, 9445. [Google Scholar] [CrossRef]
- de Ojeda, P.S.; Sanz, E.; Galindo, R. Historical reconstruction and evolution of the large landslide of Inza (Navarra, Spain). Nat. Hazards 2021, 109, 2095–2126. [Google Scholar] [CrossRef]
- Esposito, G.; Carabella, C.; Paglia, G.; Miccadei, E. Relationships between Morphostructural/Geological Framework and Landslide Types: Historical Landslides in the Hilly Piedmont Area of Abruzzo Region (Central Italy). Land 2021, 10, 287. [Google Scholar] [CrossRef]
- Araújo, J.R.; Ramos, A.M.; Soares, P.M.M.; Melo, R.; Oliveira, S.C.; Trigo, R.M. Impact of extreme rainfall events on landslide activity in Portugal under climate change scenarios. Landslides 2022, 19, 2279–2293. [Google Scholar] [CrossRef]
- Calista, M.; Miccadei, E.; Piacentini, T.; Sciarra, N. Morphostructural, Meteorological and Seismic Factors Controlling Landslides in Weak Rocks: The Case Studies of Castelnuovo and Ponzano (North East Abruzzo, Central Italy). Geosciences 2019, 9, 122. [Google Scholar] [CrossRef] [Green Version]
- Mihalić Arbanas, S.; Sečanj, M.; Bernat Gazibara, S.; Krkač, M.; Begić, H.; Džindo, A.; Zekan, S.; Arbanas, Ž. Landslides in the Dinarides and Pannonian Basin—From the largest historical and recent landslides in Croatia to catastrophic landslides caused by Cyclone Tamara (2014) in Bosnia and Herzegovina. Landslides 2017, 14, 1861–1876. [Google Scholar] [CrossRef]
- Podolszki, L.; Kosović, I.; Novosel, T.; Kurečić, T. Multi-Level Sensing Technologies in Landslide Research—Hrvatska Kostajnica Case Study, Croatia. Sensors 2022, 22, 177. [Google Scholar] [CrossRef]
- Hungr, O.; Leroueil, S.; Picarelli, L. The Varnes classification of landslide types, an update. Landslides 2014, 11, 167–194. [Google Scholar] [CrossRef]
- Pollak, D.; Bostjančić, I.; Gulam, V. CGS SafEarth Project Report: Landslide Susceptibility Map in Scale of 1:100,000—Zagreb County (Project ID: HR-BA-ME59, WP Implementation Deliverable: T1.3.2a, LSM in Small Scale (HGI), Annex 3 LSM in Small Scale for Zagreb County); Internal Data Base of Interreg—IPA CBC Croatia—Bosnia and Herzegovina—Montenegro, Croatian Geological Survey: Zagreb, Croatia, 2018; pp. 1–2, 1 map. [Google Scholar]
- Podolszki, L.; Kurečić, T.; Bateson, L.; Svennevig, K. Remote Landslide Mapping, Field Validation and Model Development—An Example from Kravarsko, Croatia. Geol. Croat. 2022, 75/1, 67–82. [Google Scholar] [CrossRef]
- Zagrebačka županija. Proglašena Elementarna Nepogoda Za Općinu Kravarsko [Zagreb County. Declared Natural Disaster for Kravarsko Municipality—In Croatian] (19.02.2014). Available online: https://www.zagrebacka-zupanija.hr/vijesti/1763/proglasena-elementarna-nepogoda-za-opcinu-kravarsko (accessed on 29 September 2022).
- Blahůt, J.; Jaboyedoff, M.; Thiebes, B. “Novel Approaches in Landslide Monitoring and Data Analysis” Special Issue: Trends and Challenges. Appl. Sci. 2021, 11, 10453. [Google Scholar] [CrossRef]
- Fall, M.; Azzam, R.; Noubactep, C.A. Multi-Method Approach to Study the Stability of Natural Slopes and Landslide Susceptibility Mapping. Eng. Geol. 2006, 82, 241–263. [Google Scholar] [CrossRef]
- Guzzetti, F.; Mondini, A.C.; Cardinali, M.; Fiorucci, F.; Santangelo, M.; Kang-Tsung, C. Landslide inventory maps: New tools for an old problem. Earth Science Reviews 2012, 112, 42–66. [Google Scholar] [CrossRef] [Green Version]
- Janeras, M.; Jara, J.A.; Royán, M.J.; Vilaplana, J.M.; Aguasca, A.; Fàbregas, X.; Gili, J.A.; Buxó, P. Multi-Technique Approach to Rockfall Monitoring in the Montserrat Massif (Catalonia, NE Spain). Eng. Geol. 2017, 219, 4–20. [Google Scholar] [CrossRef] [Green Version]
- Soto, J.; Galve, J.P.; Palenzuela, J.A.; Azañón, J.M.; Tamay, J.; Irigaray, C. A multi-method approach for the characterization of landslides in an intramontane basin in the Andes (Loja, Ecuador). Landslides 2017, 14, 1929–1947. [Google Scholar] [CrossRef]
- Grabar, K.; Miklin, Ž.; Strelec, S. Geotechnical investigations of the fortress “Minčeta”, Dubrovnik, Croatia. Inženjerstvo okoliša 2016, 3/2, 63–72. Available online: https://hrcak.srce.hr/172502 (accessed on 25 October 2022).
- Hussain, Y.; Schlögel, R.; Innocenti, A.; Hamza, O.; Iannucci, R.; Martino, S.; Havenith, H.-B. Review on the Geophysical and UAV-Based Methods Applied to Landslides. Remote Sens. 2022, 14, 4564. [Google Scholar] [CrossRef]
- Jaboyedoff, M.; Del Gaudio, V.; Derron, M.-H.; Grandjean, G.; Jongmans, D. Characterizing and Monitoring Landslide Processes Using Remote Sensing and Geophysics. Eng. Geol. 2019, 259, 105167. [Google Scholar] [CrossRef]
- Jaboyedoff, M.; Oppikofer, T.; Abellán, A.; Derron, M.H.; Loye, A.; Metzger, R.; Pedrazzini, A. Use of LIDAR in landslide investigations: A review. Nat Hazards 2012, 61, 5–28. [Google Scholar] [CrossRef] [Green Version]
- Khan, M.Y.; Shafique, M.; Turab, S.A.; Ahmad, N. Characterization of an Unstable Slope Using Geophysical, UAV, and Geological Techniques: Karakoram Himalaya, Northern Pakistan. Front. Earth Sci. 2021, 9, 1–11. [Google Scholar] [CrossRef]
- Miklin, L. Primjena metoda daljinskih istraživanja na klizištu Gajevo, Kravarsko [Application of Remote Sensing Methods on the Gajevo Landslide (Kravarsko)—In Croatian]. Master’s Thesis, University of Zagreb, Zagreb, Croatia, 2021. [Google Scholar]
- Miklin, L.; Podolszki, L.; Gulam, V.; Markotić, I. The impact of Climate Changes on Slope Stability and Landslide Conditioning Factors: An Example from Kravarsko, Croatia. Remote Sens. 2022, 14, 1794. [Google Scholar] [CrossRef]
- Hung, Y.C.; Chou, H.S.; Lin, C.P. Appraisal of the Spatial Resolution of 2D Electrical Resistivity Tomography for Geotechnical Investigation. Appl. Sci. 2020, 10, 4394. [Google Scholar] [CrossRef]
- Whiteley, J.S.; Watlet, A.; Uhlemann, S.; Wilkinson, P.; Boyd, J.P.; Jordan, C.; Kendall, J.M.; Chambers, J.E. Rapid characterisation of landslide heterogeneity using unsupervised classification of electrical resistivity and seismic refraction surveys. Eng. Geol. 2021, 290, 106189. [Google Scholar] [CrossRef]
- Hasan, M.; Shang, Y.; Meng, H.; Shao, P.; Yi, X. Application of Electrical Resistivity Tomography (ERT) for Rock Mass Quality Evaluation. Sci. Rep. 2021, 11, 1–19. [Google Scholar] [CrossRef]
- Lapenna, V.; Perrone, A. Time-Lapse Electrical Resistivity Tomography (TL-ERT) for Landslide Monitoring: Recent Advances and Future Directions. Appl. Sci. 2022, 12, 1425. [Google Scholar] [CrossRef]
- Marescot, L.; Monnet, R.; Chapellier, D. Resistivity and induced polarization surveys for slope instability studies in the Swiss Alps. Eng. Geol. 2008, 98, 18–28. [Google Scholar] [CrossRef]
- Huntley, D.; Bobrowsky, P.; Hendry, M.; Macciotta, R.; Elwood, D.; Sattler, K.; Best, M.; Chambers, J.; Meldrum, P. Application of multi-dimensional electrical resistivity tomography datasets to investigate a very slow-moving landslide near Ashcroft, British Columbia, Canada. Landslides 2019, 16, 1033–1042. [Google Scholar] [CrossRef]
- Santoso, B.; Hasanah, M.U.; Setianto. Landslide investigation using self potential method and electrical resistivity tomography (Pasanggrahan, SouthSumedang, Indonesia). IOP Conf. Ser.: Earth Environ. Sci. 2019, 311, 1–9. [Google Scholar] [CrossRef]
- Whiteley, J.S.; Chambers, J.E.; Uhlemann, S.; Boyd, J.; Cimpoiasu, M.O.; Holmes, J.L.; Inauen, C.M.; Watlet, A.; Hawley-Sibbett, L.R.; Sujitapan, C.; et al. Landslide monitoring using seismic refraction tomography—The importance of incorporating topographic variations. Eng. Geol. 2020, 268, 105525. [Google Scholar] [CrossRef]
- Kumar, D. Efficacy of Electrical Resistivity Tomography Technique in Mapping Shallow Subsurface Anomaly. J. Geol. Soc. India 2012, 80, 304–307. [Google Scholar] [CrossRef]
- Loke, M.H.; Rucker, D.F.; Chambers, J.E.; Wilkinson, P.B.; Kuras, O. Electrical Resistivity Surveys and Data Interpretation. In Encyclopedia of Solid Earth Geophysics, Encyclopedia of Earth Sciences Series; Gupta, H., Ed.; Springer: Cham, Switzerland, 2020. [Google Scholar] [CrossRef]
- Bai, D.; Lu, G.; Zhu, Z.; Zhu, X.; Tao, C.; Fang, J. Using Electrical Resistivity Tomography to Monitor the Evolution of Landslides’ Safety Factors under Rainfall: A Feasibility Study Based on Numerical Simulation. Remote Sens. 2022, 14, 3592. [Google Scholar] [CrossRef]
- Ivanik, O.; Shabatura, O.; Khomenko, R.; Kravchenko, D.; Hadiatska, K. The application of the ERT method for the landslides investigation. EAGE, Geoinformatics 2021, 2021, 1–6. [Google Scholar] [CrossRef]
- Hussain, Y.; Hamza, O.; Cárdenas-Soto, M.; Borges, W.R.; Dou, J.; Rebolledo, J.F.R.; Prado, R.L. Characterization of Sobradinho Landslide in Fluvial Valley Using MASW and ERT Methods. REM Int. Eng. J. 2020, 73, 487–497. [Google Scholar] [CrossRef]
- Perrone, A.; Lapenna, V.; Piscitelli, S. Electrical Resistivity Tomography Technique for Landslide Investigation: A Review. Earth-Science Rev. 2014, 135, 65–82. [Google Scholar] [CrossRef]
- Loke, M.H. Tutorial: 2-D and 3-D Electrical Imaging Surveys; Geotomo Software: Penang, Malaysia, 2020; Available online: https://www.geotomosoft.com/downloads.php (accessed on 30 August 2022).
- Čubrilović, P.; Palavestrić, L.; Nikolić, T. Inženjerskogeološka Karta Jugoslavije 1:500,000 [Engineering—Geological Map of Yugoslavia in Scale of 1:500,000—In Croatian]; Geological Department of Serbia: Belgrade, Srbija, 1967. [Google Scholar]
- Podolszki, L.; Pollak, D.; Gulam, V.; Miklin, Ž. Development of Landslide Susceptibility Map of Croatia. In Engineering Geology for Society and Territory—Volume 2: Landslide Processes; Lollino, G., Giordan, D., Crosta, G.B., Corominas, J., Azzam, R., Wasowski, J., Sciarra, N., Eds.; Springer: Berlin/Heidelberg, Germany, 2015; Volume 2, pp. 947–950. [Google Scholar] [CrossRef] [Green Version]
- Bostjančić, I.; Filipović, M.; Gulam, V.; Pollak, D. Regional-Scale Landslide Susceptibility Mapping Using Limited LiDAR-Based Landslide Inventories for Sisak-Moslavina County, Croatia. Sustainability 2021, 13, 4543. [Google Scholar] [CrossRef]
- Pikija, M. Osnovna Geološka Karta SFRJ 1:100.000—List Sisak L33-93 [Basic Geological Map SFRY in Scale of 1:100,000—Sheet Sisak L33-93—In Croatian]; Geological Department of Serbia: Belgrade, Serbia, 1987. [Google Scholar]
- Pikija, M. Osnovna Geološka Karta SFRJ 1:100.000—Tumač Za List Sisak L33-93 [Guide for Basic Geological Map SFRY in Scale of 1:100,000—Sheet Sisak L33-93—In Croatian]; Geological Department of Serbia: Belgrade, Serbia, 1987. [Google Scholar]
- Kurečić, T. Sedimentologija i Paleoekologija Pliocenskih Viviparus Slojeva Vukomeričkih Gorica a [Sedimentology and Paleoecology of Pliocene Viviparus Beds from the Area of Vukomeričke Gorice—In Croatian]. Ph.D. Thesis, University of Zagreb, Zagreb, Croatia, 2017. [Google Scholar]
- Jović, A. Laboratory Tests Report—Gajevo Landslide; Geotehnički Studio d.o.o: Zagreb, Croatia, 2022; pp. 1–11. [Google Scholar]
- ASTM-D2487-06; Standard Practice for Classification of Soils for Engineering Purposes (Unified Soil Classification System). American Society for Testing and Materials: West Conshohocken, PA, USA, 2010; pp. 1–12. [CrossRef]
- ASTM-D422-63; Standard Test Method for Particle-Size Analysis of Soils. American Society for Testing and Materials: West Conshohocken, PA, USA, 2007; pp. 1–8. [CrossRef]
- ASTM-D2216-19; Standard Test Methods for Laboratory Determination of Water (Moisture) Content of Soil and Rock by Mass. American Society for Testing and Materials: West Conshohocken, PA, USA, 2019; pp. 1–7. [CrossRef]
- ASTM-D4318-17; Standard Test Methods for Liquid Limit, Plastic Limit, and Plasticity Index of Soils. American Society for Testing and Materials: West Conshohocken, PA, USA, 2018; pp. 1–20. [CrossRef]
- Puškarić, A. Laboratory Analysis Report—XRDP Qualitative Analysis of Samples from Gajevo Landslide; Ruđer Bošković Institute: Zagreb, Croatia, 2022; pp. 1–4. [Google Scholar]
- Kurečić, T.; Kovačić, M.; Grizelj, A. Mineral assemblage and provenance of the pliocene Viviparus beds from the area of Vukomeričke Gorice, Central Croatia. Geol. Croat. 2021, 74/3, 253–271. [Google Scholar] [CrossRef]
- Leyva, S.; Cruz-Pérez, N.; Rodríguez-Martín, J.; Miklin, L.; Santamarta, J.C. Rockfall and Rainfall Correlation in the Anaga Nature Reserve in Tenerife (Canary Islands, Spain). Rock Mech. Rock Eng. 2022, 55, 2173–2181. [Google Scholar] [CrossRef]
- Haque, U.; Blum, P.; da Silva, P.F.; Andersen, P.; Pilz, J.; Chalov, S.R.; Malet, J.P.; Jemec Auflič, M.; Andres, N.; Poyiadji, E.; et al. Fatal landslides in Europe. Landslides 2016, 13, 1545–1554. [Google Scholar] [CrossRef]
- Bian, S.; Chen, G.; Zeng, R.; Meng, X.; Jin, J.; Lin, L.; Zhang, Y.; Shi, W. Post-failure evolution analysis of an irrigation-induced loess landslide using multiple remote sensing approaches integrated with time-lapse ERT imaging: Lessons from Heifangtai, China. Landslides 2022, 19, 1179–1197. [Google Scholar] [CrossRef]
- Samodra, G.; Ramadhan, M.F.; Sartohadi, J.; Setiawan, M.A.; Christanto, N.; Sukmawijaya, A. Characterization of displacement and internal structure of landslides from multitemporal UAV and ERT imaging. Landslides 2020, 17, 2455–2468. [Google Scholar] [CrossRef]
- Merritt, A.J.; Chambers, J.E.; Murphy, W.; Wilkinson, P.B.; West, L.J.; Gunn, D.A.; Meldrum, P.I.; Kirkham, M.; Dixon, N. 3D ground model development for an active landslide in Lias mudrocks using geophysical, remote sensing and geotechnical methods. Landslides 2014, 11, 537–550. [Google Scholar] [CrossRef] [Green Version]
- Bednarik, M.; Putiška, R.; Dostál, I.; Tornyai, R.; Šilhán, K.; Holzer, F.; Weis, K.; Ružek, I. Multidisciplinary research of landslide at UNESCO site of Lower Hodruša mining water reservoir. Landslides 2018, 15, 1233–1251. [Google Scholar] [CrossRef]
- Bell, F.G. Geological Hazards: Their Assessments, Avoidance and Mitigation; E&FN Spon Press: London, UK, 2003; pp. 1–648. [Google Scholar]
- Qi, S.; Vanapalli, S.K. Influence of swelling behavior on the stability of an infinite unsaturated expansive soil slope. Comput. Geotech. 2016, 76, 154–169. [Google Scholar] [CrossRef]
- Asriza, S.; Kristyanto, T.H.W.; Indra, T.L.; Syahputra, R.; Tempessy, A.S. Determination of the Landslide Slip Surface Using Electrical Resistivity Tomography (ERT) Technique. In Advancing Culture of Living with Landslides. WLF 2017; Mikos, M., Tiwari, B., Yin, Y., Sassa, K., Eds.; Springer: Cham, Switzerland, 2017. [Google Scholar] [CrossRef]
- Pandey, L.M.S.; Shukla, S.K.; Habibi, D. Electrical resistivity of sandy soil. Géotechnique Lett. 2015, 5, 178–185. [Google Scholar] [CrossRef]
- Telford, W.M.; Geldart, L.P.; Sheriff, R.E. Applied Geophysics; Cambridge University Press: New York, NY, USA, 1990; pp. 1–760. Available online: https://kobita1234.files.wordpress.com/2016/12/telford-geldart-sheriff-applied-geophysics.pdf (accessed on 25 October 2022).
- Munoz-Castelblanco, J.A.; Pereira, J.M.; Delage, P.; Cui, Y.J. The influence of changes in water content on the electrical resistivity of a natural unsaturated loess. Geotech. Test. J. 2012, 35/1, 11–17. [Google Scholar] [CrossRef] [Green Version]
- Fukue, M.; Minato, T.; Horibe, H.; Taya, N. The microstructures of clay given by resistivity measurements. Eng. Geol. 1999, 54/1–2, 43–53. [Google Scholar] [CrossRef]
- Yoon, G.L.; Park, J.B. Sensitivity of leachate and fine contents on electrical resistivity variations of sandy soils. J. Haz. Mater. 2001, 84/2–3, 147–161. [Google Scholar] [CrossRef]
- Mihalić Arbanas, S.; Krkač, M.; Bernat, S. Application of innovative technologies in landslide research in the area of the City of Zagreb (Croatia, Europe). Croatia. Geol. Croat. 2016, 69/2, 231–243. [Google Scholar] [CrossRef]


| Sample | Depth (m) | Gravel, G (%) | Sand, S (%) | Silt, M (%) | Clay, C (%) | Classification |
|---|---|---|---|---|---|---|
| B1–S1 | 1.65–1.75 | 0.0 | 37.9 | 34.1 | 28.0 | SMC |
| B1–S2 | 2.65–2.75 | 0.0 | 3.1 | 58.7 | 38.3 | CM |
| B2–S3 | 2.85–2.95 | 0.0 | 62.5 | 32.8 | 4.7 | S with M |
| B3–S4 | 1.80–1.90 | 0.0 | 23.9 | 47.1 | 29.0 | SMC |
| B3–S5 | 4.70–4.80 | 0.0 | 59.3 | 33.6 | 7.1 | S with M |
| B5–S6 | 4.30–4.40 | 13.3 | 44.4 | 32.1 | 10.2 | S with M |
| Sample | Depth (m) | W0 (%) | WL (%) | WP (%) | IP (%) | IC (-) | Classification |
|---|---|---|---|---|---|---|---|
| B1–S1 | 1.65–1.75 | 24.8 | 46 | 23 | 23 | 0.92 | Cl |
| B1–S2 | 2.65–2.75 | 24.2 | 53 | 27 | 26 | 1.10 | CH |
| B3–S4 | 1.80–1.90 | 22.4 | 47 | 23 | 24 | 1.02 | Cl |
| Year | Precipitation (mm/year) 1 | Precipitation Minimum (Monthly Values) | Precipitation Maximum (Monthly Values) |
|---|---|---|---|
| 2000 | 638 | 9 mm in August | 119 mm in December |
| 2001 | 973 | 22 mm in October | 216 mm in September |
| 2002 | 952 | 21 mm in January | 149 mm in April |
| 2003 | 578 | 3 mm in March | 116 mm in October |
| 2004 | 903 | 42 mm in January | 190 mm in April |
| 2005 | 954 | 28 mm in January | 169 mm in August |
| 2006 | 750 | 5 mm in October | 171 mm in August |
| 2007 | 797 | 4 mm in April | 156 mm in October |
| 2008 | 613 | 13 mm in May | 99 mm in March |
| 2009 | 614 | 14 mm in September | 89 mm in June |
| 2010 | 973 | 41 mm in December | 167 mm in September |
| 2011 | 478 2 | 1 mm in November | 93 mm in June |
| 2012 | 728 | 5 mm in March | 125 mm in December |
| 2013 | 966 | 23 mm in July | 163 mm in January |
| 2014 | 1601 3 | 43 mm in March | 265 mm in September |
| 2015 | 1047 | 4 mm in December | 216 mm in October |
| 2016 | 1107 | 2 mm in December | 169 mm in February |
| 2017 | 1001 | 37 mm in July | 237 mm in September |
| 2018 | 980 | 18 mm in August | 177 mm in February |
| 2019 | 1234 | 31 mm in February | 215 mm in May |
| 2020 | 917 | 7 mm in January | 189 mm in October |
| 2021 | 930 | 2 mm in June | 138 mm in October |
| Year | February | March | April | May | June | July | August | September | October | November | December | No. of h.r.e. 1 |
|---|---|---|---|---|---|---|---|---|---|---|---|---|
| 2001 | 41 | 1 | ||||||||||
| 2006 | 41 | 1 | ||||||||||
| 2010 | 42 | 1 | ||||||||||
| 2014 | 85 | 43 | 49 | 47 | 40 | 64 | 6 | |||||
| 2015 | 67 | 69 | 52 | 3 | ||||||||
| 2016 | 82 | 1 | ||||||||||
| 2017 | 40, 60 | 48 | 3 | |||||||||
| 2018 | 40 | 48 | 73 | 3 | ||||||||
| 2019 | 46, 53 | 97 | 53 | 4 | ||||||||
| 2020 | 57, 58 | 45 | 58 | 4 | ||||||||
| 2021 | 41 | 40 | 2 | |||||||||
| 2022 | 46 | 49 | no data | no data | no data | 2 |
Disclaimer/Publisher’s Note: The statements, opinions and data contained in all publications are solely those of the individual author(s) and contributor(s) and not of MDPI and/or the editor(s). MDPI and/or the editor(s) disclaim responsibility for any injury to people or property resulting from any ideas, methods, instructions or products referred to in the content. |
© 2022 by the authors. Licensee MDPI, Basel, Switzerland. This article is an open access article distributed under the terms and conditions of the Creative Commons Attribution (CC BY) license (https://creativecommons.org/licenses/by/4.0/).
Share and Cite
Podolszki, L.; Miklin, L.; Kosović, I.; Gulam, V. Multi-Level Data Analyses in the Gajevo Landslide Research, Croatia. Remote Sens. 2023, 15, 200. https://doi.org/10.3390/rs15010200
Podolszki L, Miklin L, Kosović I, Gulam V. Multi-Level Data Analyses in the Gajevo Landslide Research, Croatia. Remote Sensing. 2023; 15(1):200. https://doi.org/10.3390/rs15010200
Chicago/Turabian StylePodolszki, Laszlo, Luka Miklin, Ivan Kosović, and Vlatko Gulam. 2023. "Multi-Level Data Analyses in the Gajevo Landslide Research, Croatia" Remote Sensing 15, no. 1: 200. https://doi.org/10.3390/rs15010200