1. Introduction
Expansive soils significantly affect many countries worldwide, damaging buildings, road networks and other infrastructure. The mechanisms involved in this phenomenon are complex, and the factors that play an active role in its development can be divided into two categories: the preparatory and the triggering ones. In the first category are the geotechnical and the geological conditions, while in the second one, the moisture variation of the ground caused by rainfall infiltration and evapotranspiration, the leakage of water supply and sewage pipes, the fluctuations of the water table, etc. The economic losses caused by this hazard is in the scale of billions of dollars each year [
1,
2]. In fact, the annual cost of damages due to expansive soils surpasses that of other natural geohazards, namely earthquakes and landslides [
3]. Examples of regions with expansive clays include: China [
4]; Sudan [
5,
6]; Australia [
7,
8]; Saudi Arabia [
9,
10]; United Kingdom [
1,
11]; Canada [
12], and Sweden [
13]. Several studies (numerical or experimental) have been carried out in order to estimate the connection between the degree of damage to buildings and the distribution of ground moisture underneath their foundation, e.g., [
14,
15,
16].
To date, Earth Observation (EO) technologies have been widely used to carry out studies investigating the failure mechanism of various natural hazard, such as landslides [
17,
18,
19], land subsidence [
20,
21,
22], flood [
23,
24], etc., along with field surveys and numerical modeling. However, the use of these technologies for the investigation of vertical ground movements due to the seasonal swelling and shrinkage of clays is at a relatively early stage [
25,
26,
27]. Nonetheless, InSAR has been successfully used in numerous studies in the last decades for studying a phenomenon also pertaining to predominantly vertical ground movements, i.e., the land subsidence due to changes in the groundwater level. These studies estimate the degree of influence of the factors that play an active role on the future extent and magnitude of land subsidence, such as the geological conditions [
28,
29], tectonic structure [
30], hydrological conditions [
31,
32,
33,
34,
35,
36,
37,
38,
39], the thickness of the compressible formations [
36,
40], the urbanization [
20,
41] and the land use [
40,
42].
The present study employs Interferometric Synthetic Aperture Radar (InSAR) data to investigate the phenomenon of ground swelling/shrinkage due to seasonal moisture changes in an expansive clay formation and assess the degree of influence of the causal factors. The methodology developed herein relies on the integration of EO technologies, pre-existing local data and experience, conventional geotechnical research and the use of statistical analysis within a GIS environment. All the factors which affect this phenomenon, namely plasticity index [
43,
44,
45], clay and montmorillonite content [
4,
46,
47], expansive soil layer thickness and depth [
6,
15], were compiled and thematic maps were constructed using spatial analysis tools. It has long been established that the larger are the values of plasticity index, clay content and montmorillonite content, the larger the tendencies for swelling/shrinkage are expected to be [
1,
2]. Subsequently, the ground movements in the area as inferred by InSAR for the period between 16 November 2002–30 December 2006 [
48] were processed. Finally, multivariate linear regression analysis using Lasso was carried out, elucidating the degree of influence of the main causal factors [
49].
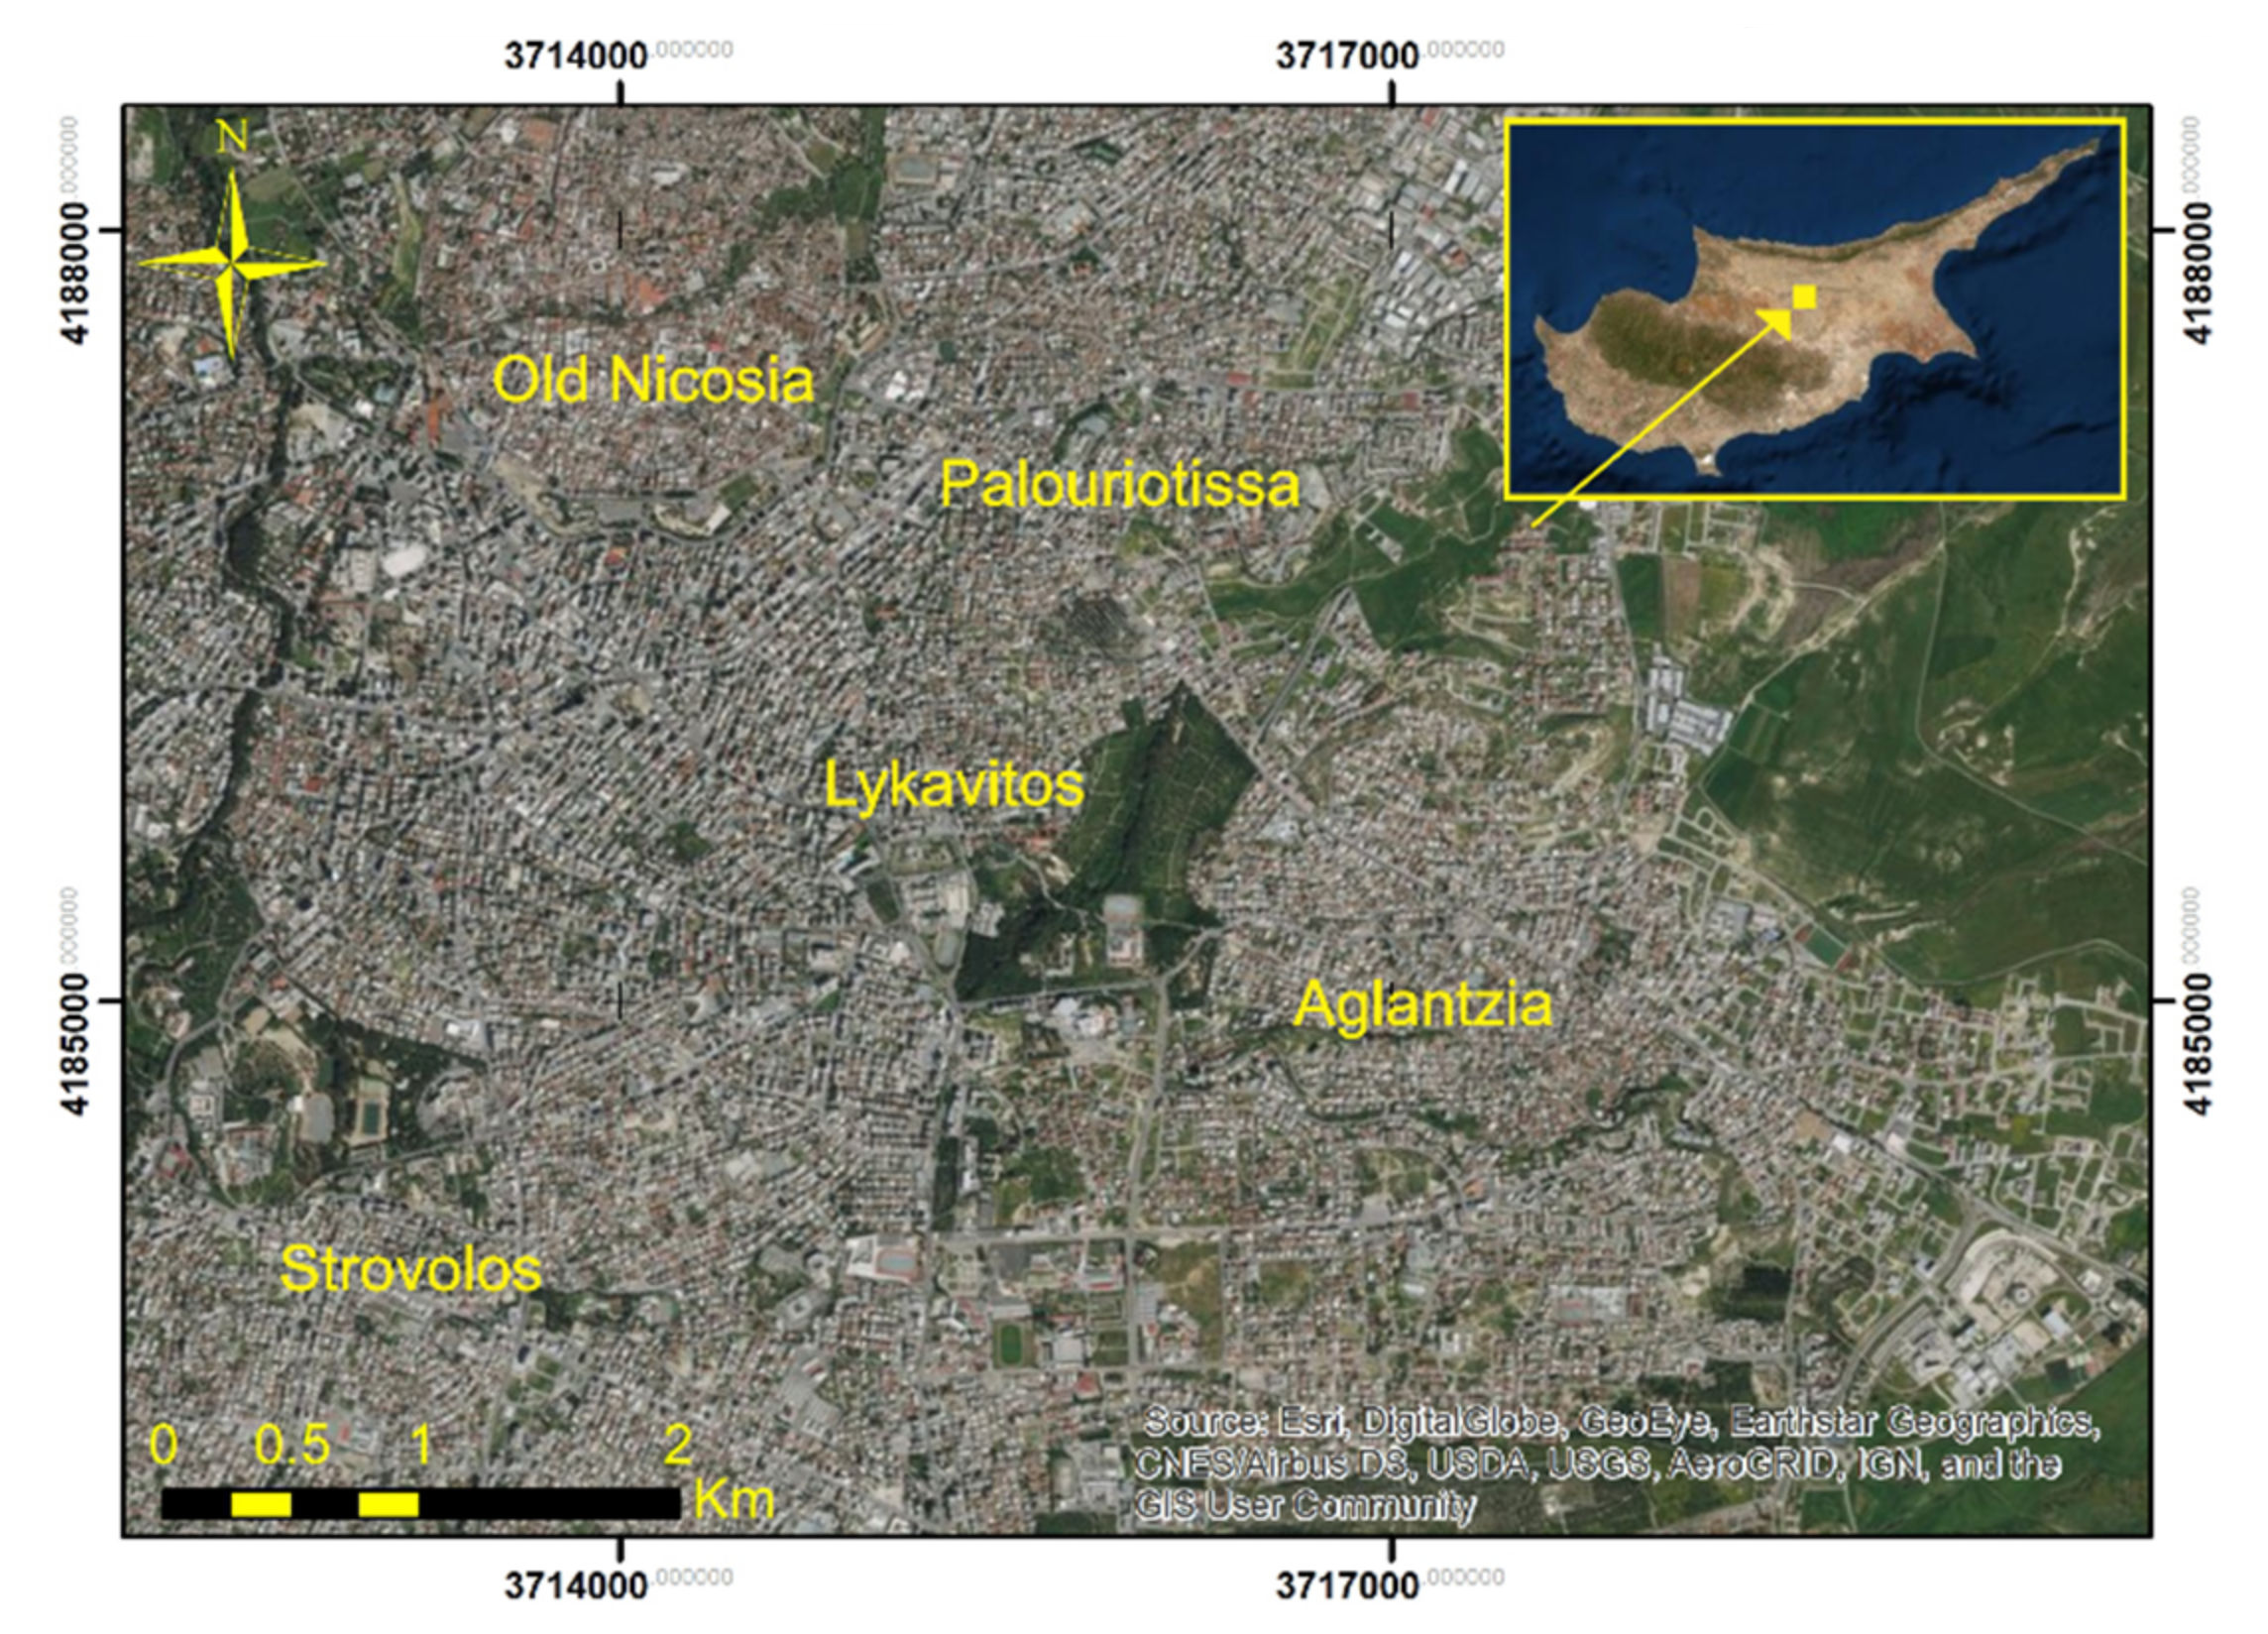
The study area is the central and eastern part of the city of Nicosia, which is the capital of the Republic of Cyprus (
Figure 1). Expansive clays cover extensive areas of the island of Cyprus. The majority of these geomaterials are bentonitic clays deposited during the late Cretaceous period as deep-water sediments produced by the hydrothermal weathering of the basaltic rocks of the Tethyan oceanic crust. Nowadays, the outcrops of these extremely expansive materials are rather limited and can be found on the ground surface in a relatively small number of areas along the southern coast and in the mountainous region of Paphos District. However, the weathering of these old formations produced sediments that were redeposited in basins north and south of the axis of the Troodos mountain range, eventually resulting in the creation of the marls of the Nicosia geological formation, which are outcroppings particularly in areas of important urban development in the island of Cyprus, such as the cities of Nicosia, Larnaca and Paphos. These outcrops in combination with the climate of the region, which is characterized by rainy winters and very dry summers, are responsible for various types of damages to buildings and other infrastructure. More specifically, the seasonal variations of the degree of ground saturation that happen inside the so-called active zone, the depth of which is of the order of 3m to 8m, cause soil expansion (during the rainy winter months) or soil shrinkage (during the dry summer months). This phenomenon puts strain on buildings founded on such soils, which more often results in cracks in in-fill walls. In more extreme cases, these cracks may propagate to the structural frame. According to a previous study [
50], which surveyed a part of the city of Nicosia where the marl is extremely expansive, 58 out of 96 buildings showed various degrees of damage due to ground swelling/shrinkage, characterized as moderate/severe for 7 of them. It is worth mentioning that in areas where the slope of the ground is >3° damages are substantially more frequent. This phenomenon may be due to the ratcheting effect on sloping terrain [
51,
52]. Τhe annual cost of repairs in the surveyed area of 1.75 km
2 was estimated to be more than 2.4 million euros (based on 2002 prices), while the decrease in real estate value was estimated at 2 million euro per year.
Based on the above, it is obvious that the social and economic impact of expansive soils has been historically significant and is becoming more important in recent years as urban centers expand into areas covering such soils. The results of the present study are meant to help in understanding the relationship between the spatial distribution of the causal factors and the magnitude of this phenomenon. Its findings can be of benefit to state authorities and other policy makers, as well as the construction industry, in planning future urban development and the maintenance of existing infrastructure.
2. Geomorphological, Geological and Climatic Setting
The study’s location is mostly urban with the exception of the northeastern part where it consists of an industrial-agricultural zone. In the Old Nicosia area, there are mainly older types of buildings, while in the area west of Lykavitos the modern center of the city is developed, with a significant concentration of high-rise buildings (applying high vertical stress to the ground). The areas southeast of Aglantzia and Strovolos are considered predominantly residential with relatively newly built modern houses. The elevation of the study area ranges from 110 to 190 m. The lowest parts are located in the northeast (110 to 140 m) while the elevation increases southwest, where it reaches 170–190 in the suburb of the Strovolos. The city center presents gentle slopes, with elevation varying from 150 to 170 m.
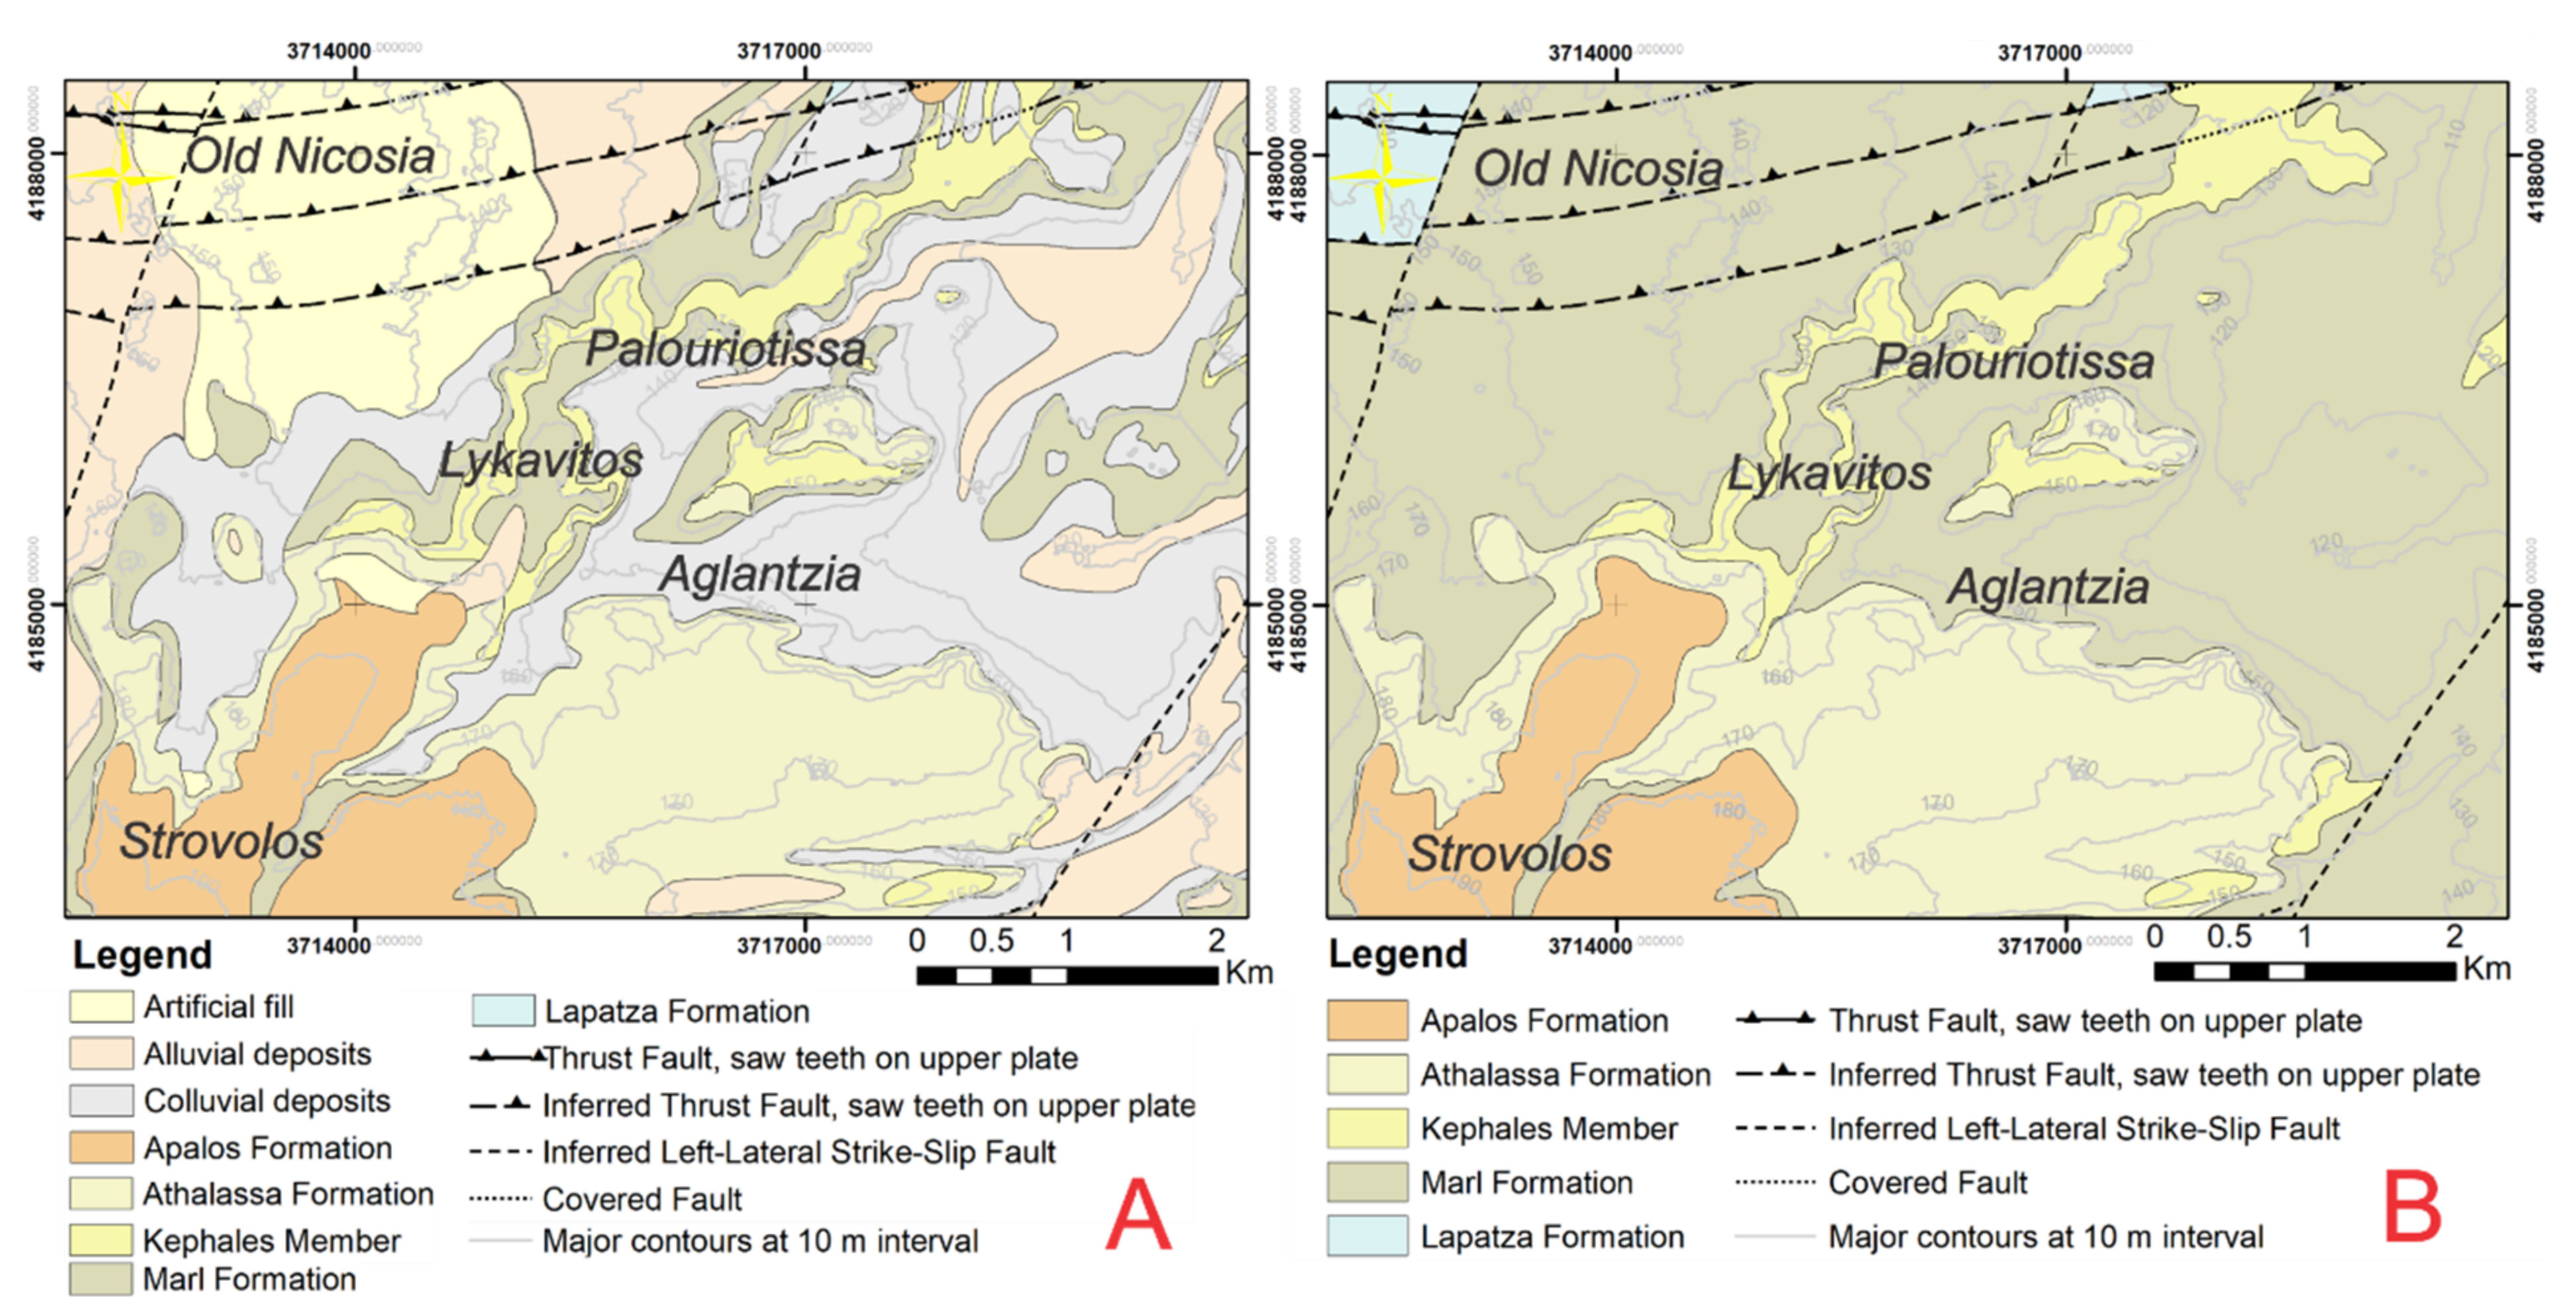
The geological maps of the Cyprus Geological Survey Department (GSD) pertaining to the wider region of Nicosia, namely the Bedrock Geologic Map of Nicosia and the Surficial Geologic Map of Nicosia (scale 1:25000) are exploited. After spatial analysis and digitization processes, the geological formations with similar characteristics were merged and the surficial geological map of the study area was constructed (
Figure 2A). The stratigraphy of the study area can be summarized as follows (starting with the younger formations and moving to the older ones):
Manmade fills: It consists of earthfills and manmade materials that have been placed irregularly on the natural ground.
Alluvial deposits: Depending on their deposition age, they can be divided into two groups:
The first group contains two distinct series. The more modern and the older one. The modern, which was deposited in rivers that were eroded into the older alluvial deposits, consist mainly of gravel, sand, silt and clay, as well as organic material. Its thickness reaches 1–2 m. The older consists of fine sand and silty clay with some pebbles.
The second group overlays the Apalos Formation. It can be mainly distinguished into two categories. The upper one underlies the alluvial terrace and it mainly consists of fine sand, silt, clay, pebbles, cobbles, and sporadic amount of manmade and organic materials. Its thickness varies from 1 to 4 m, while in some areas it reaches 10 m. The lower one consists of sands and gravels, the thickness of which vary from 1 to 5m. In some areas, fluvial stream deposits can be found, which are composed of sand and gravel with varying size of cobbles. These deposits do not exceed the 6 m in thickness.
Colluvial deposits: They consist of sand, calcareous sand, silt, clay, gravel and sporadic boulders. The total thickness reaches 4 to 6 m.
Apalos Formation (Pleistocene): Fluvial deposits, consisting of alternating layers of sand and gravel, sand, silt and clay. Its total thickness is approximately 22 m.
Nicosia Formation: The Nicosia Formation constitutes the bedrock of the entire study region and consists of several members:
Athalassa member of Nicosia Formation (Pliocene-Pleistocene): It mainly consists of calcarenite, calcareous sandstone and sandy marls.
Kephales member of Nicosia Formation (Pliocene): It consists of alternations of fine to coarse sands with varying sizes of pebble and cobble gravels. It also contains marine fossils. The thickness of this formation reaches 8 m.
Marl member of Nicosia Formation (Pliocene): This member is the dominant one in the region and is overlain unconformably by the Athalassa member and it is made up of marl and silty marl alternations with small amounts of sandy marl. It appears in two distinct horizons, the grey marl and the overlying light brown (khaki) marl. Its total thickness is the order of hundreds of meters. The grey marl is not outcropping in the Nicosia region and, thus, focus has traditionally been placed on the overlying khaki marl, which in certain locations has a montmorillonite content that can be up to 25% [
50,
53], rendering the khaki marl of the Nicosia formation medium to very highly expansive. The marl member outcrops in almost half of the study region, as seen in
Figure 2B.
Lapatza Formation: It mainly consists of siltstone, marl, khaki marl, and limestone with thin intercalations of gypsum and silicified zones.
Among the geomaterials described above, only the Marl Member of the Nicosia Formation (and possibly the sandy marl of the Athalassa member, but to a much lesser degree) consists of expansive soils. All other materials are coarse to very coarse grained, and wherever they are encountered overlying the Nicosia marl they act as a buffer zone that lessens the negative effects of the marl swelling/shrinkage.
Figure 2B shows the bedrock geology, i.e., the geology excluding alluvial-colluvial deposits and manmade fills. These geomaterials are still largely inside the so-called active zone (the zone in which the ground moisture varies seasonally). This map is a useful tool as it presents the prevailing geological conditions pertaining to building foundations. Most building foundations in Nicosia are constructer either inside the Nicosia marl or are affected by its presence at some larger but proximal depth.
According the Köppen–Geiger climate classification, Cyprus has a subtropical-mediterranean and semi-arid climate [
54], while it is characterized as arid based on the Thornthwaite climate classification [
55]. In the area of Nicosia, the winter is mild, while during the summer season (from June to August) the temperature often exceeds 40 °C. Most of the rainfalls take place during the period between November and March. The average annual rainfall is of the order of 300–350 mm.
Figure 2.
Maps of: (A) surficial and (B) bedrock geology of the study area.
Figure 2.
Maps of: (A) surficial and (B) bedrock geology of the study area.
3. Geotechnical Properties of the Nicosia Marl
In order to investigate the spatial distribution of the physical and mechanical characteristics of the Nicosia marl, over 200 drillings were collected from the numerous geotechnical investigation reports contained in the archives of GSD. The retrieved soil information was mainly about clay content (and occasionally montmorillonite content estimated using the “methylene blue” method), silt content, calcium carbonate content, the Atterberg limits, as well as the free swelling strain and/or swelling pressure measured in conventional oedometers. After data processing in the ArcGIS software (interpolation of geotechnical borehole data by using spatial analysis tools such as Kriging and topo to raster), thematic layers were constructed for the factors controlling ground swelling/shrinkage due to seasonal moisture changes, namely plasticity index (PI), clay and montmorillonite content, expansive soil layer thickness inside the active zone and depth. It should be stressed that the grey marl was not investigated due to the fact that it lies deeper than the zone of ground moisture change (active zone). This database was enriched with geotechnical data from the two campuses of the University of Cyprus, which also lie in the study area, as well as data from the reports of pertinent research projects [
25,
29].
The physical and mechanical properties of the Nicosia khaki marl are listed in
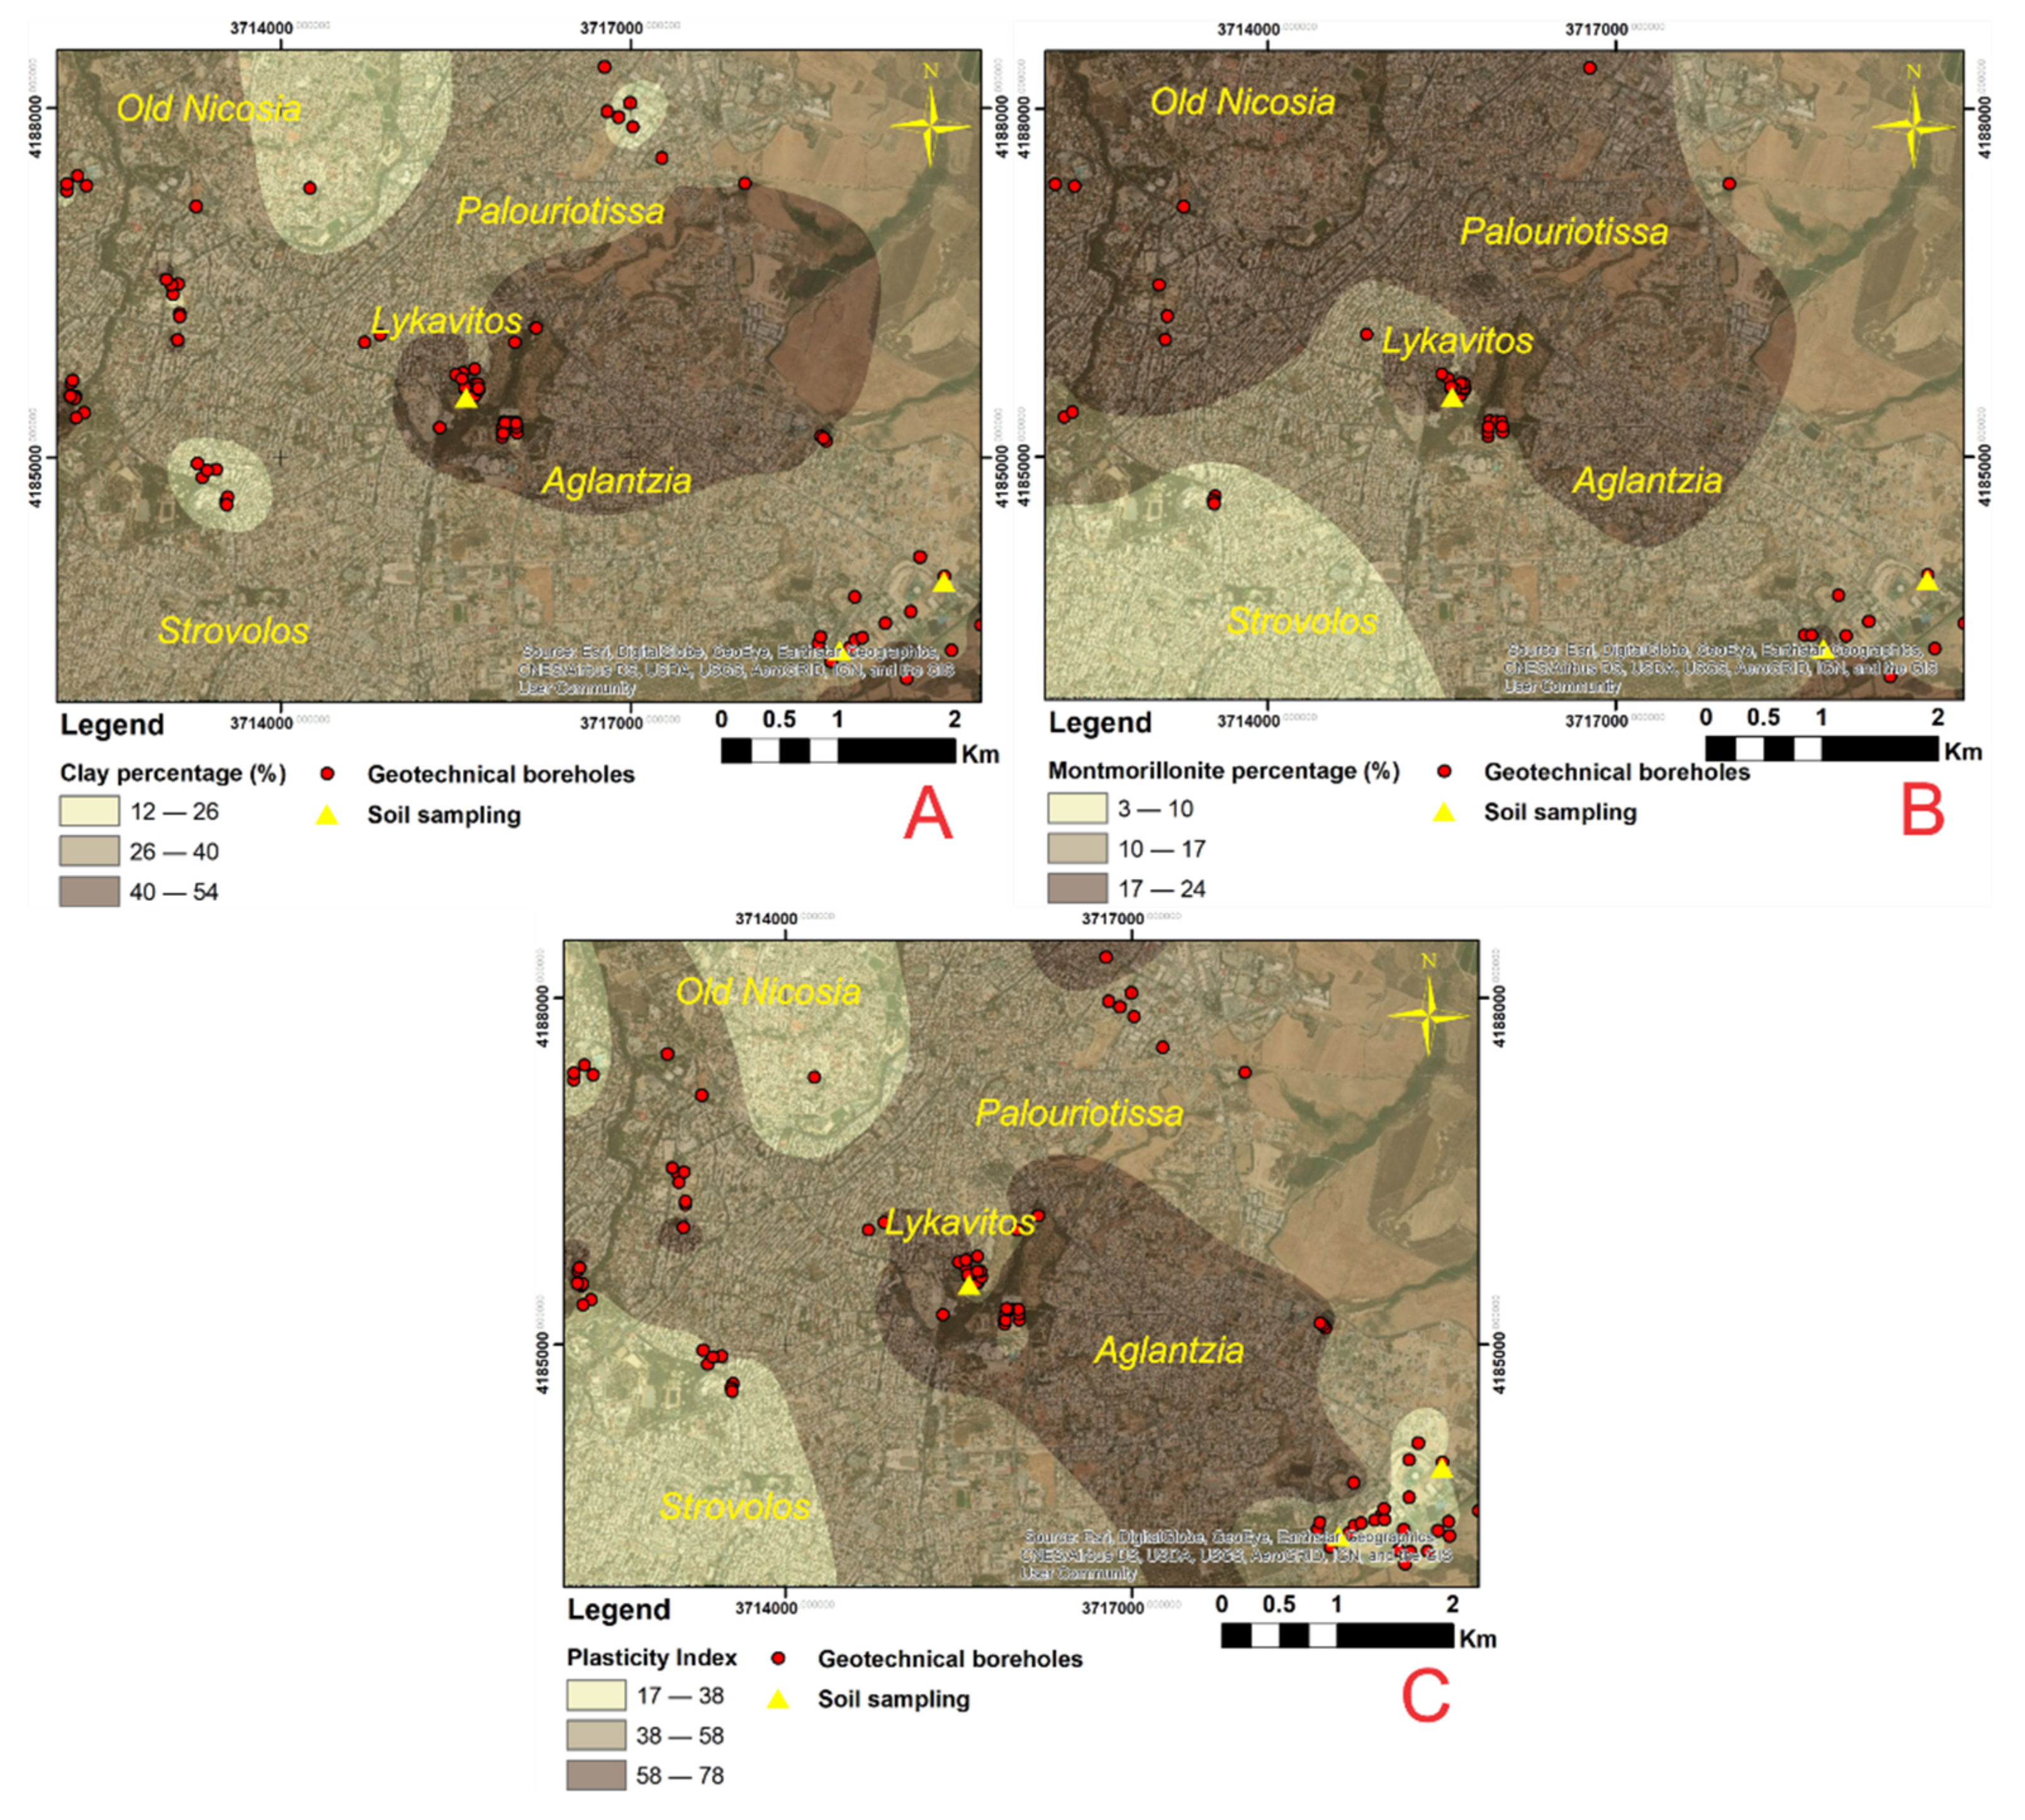
Table 1. The khaki marl consists of horizons that can be classified either as silty clay or silty clay with sand intercalations. The highest clay amounts inside the study region were observed in Lykavitos, the northern part of Aglantzia and at southern part of Palouriotissa. The clay content decrease as we move towards Old Nicosia and Strovolos (
Figure 3A). The montmorillonite content on average is 15% (reaching values up to 25%) for the silty clay horizons and the 12% (with maximum 26%) for the silty clay with sandy intercalations. The largest montmorillonite content values are observed at the area of Old Nicosia, Lykavitos and at the northeast of Aglantzia. The lower values are registered in the area around Strovolos (
Figure 3B). It should be noted that the montmorillonite content over clay fraction ratio reaches 0.7 in the area around Old Nicosia. This rate, although quite high, is confirmed by an earlier study in which 25 mineralogical tests were performed and the montmorillonite content to clay fraction ratio was found to range from 0.4 to 0.75 [
53].
As for the Plasticity Index (PI), the highest values are observed in the silty clay horizons, reaching up to 86 with an average of 46. For the sandier horizons, the corresponding values are maximum 48 and average 27. These results place the khaki Nicosia marl in the high plasticity group according to the USCS classification. The highest values were observed at Lykavitos and Aglantzia, while the lower ones in Old Nicosia and Strovolos (
Figure 3C).
Finally, taking into account the oedometer tests results, it seems that the average free swelling strain is 9%, while in some cases this rate reaches 43%. As such, the khaki marl can be characterized in general as very highly expansive.
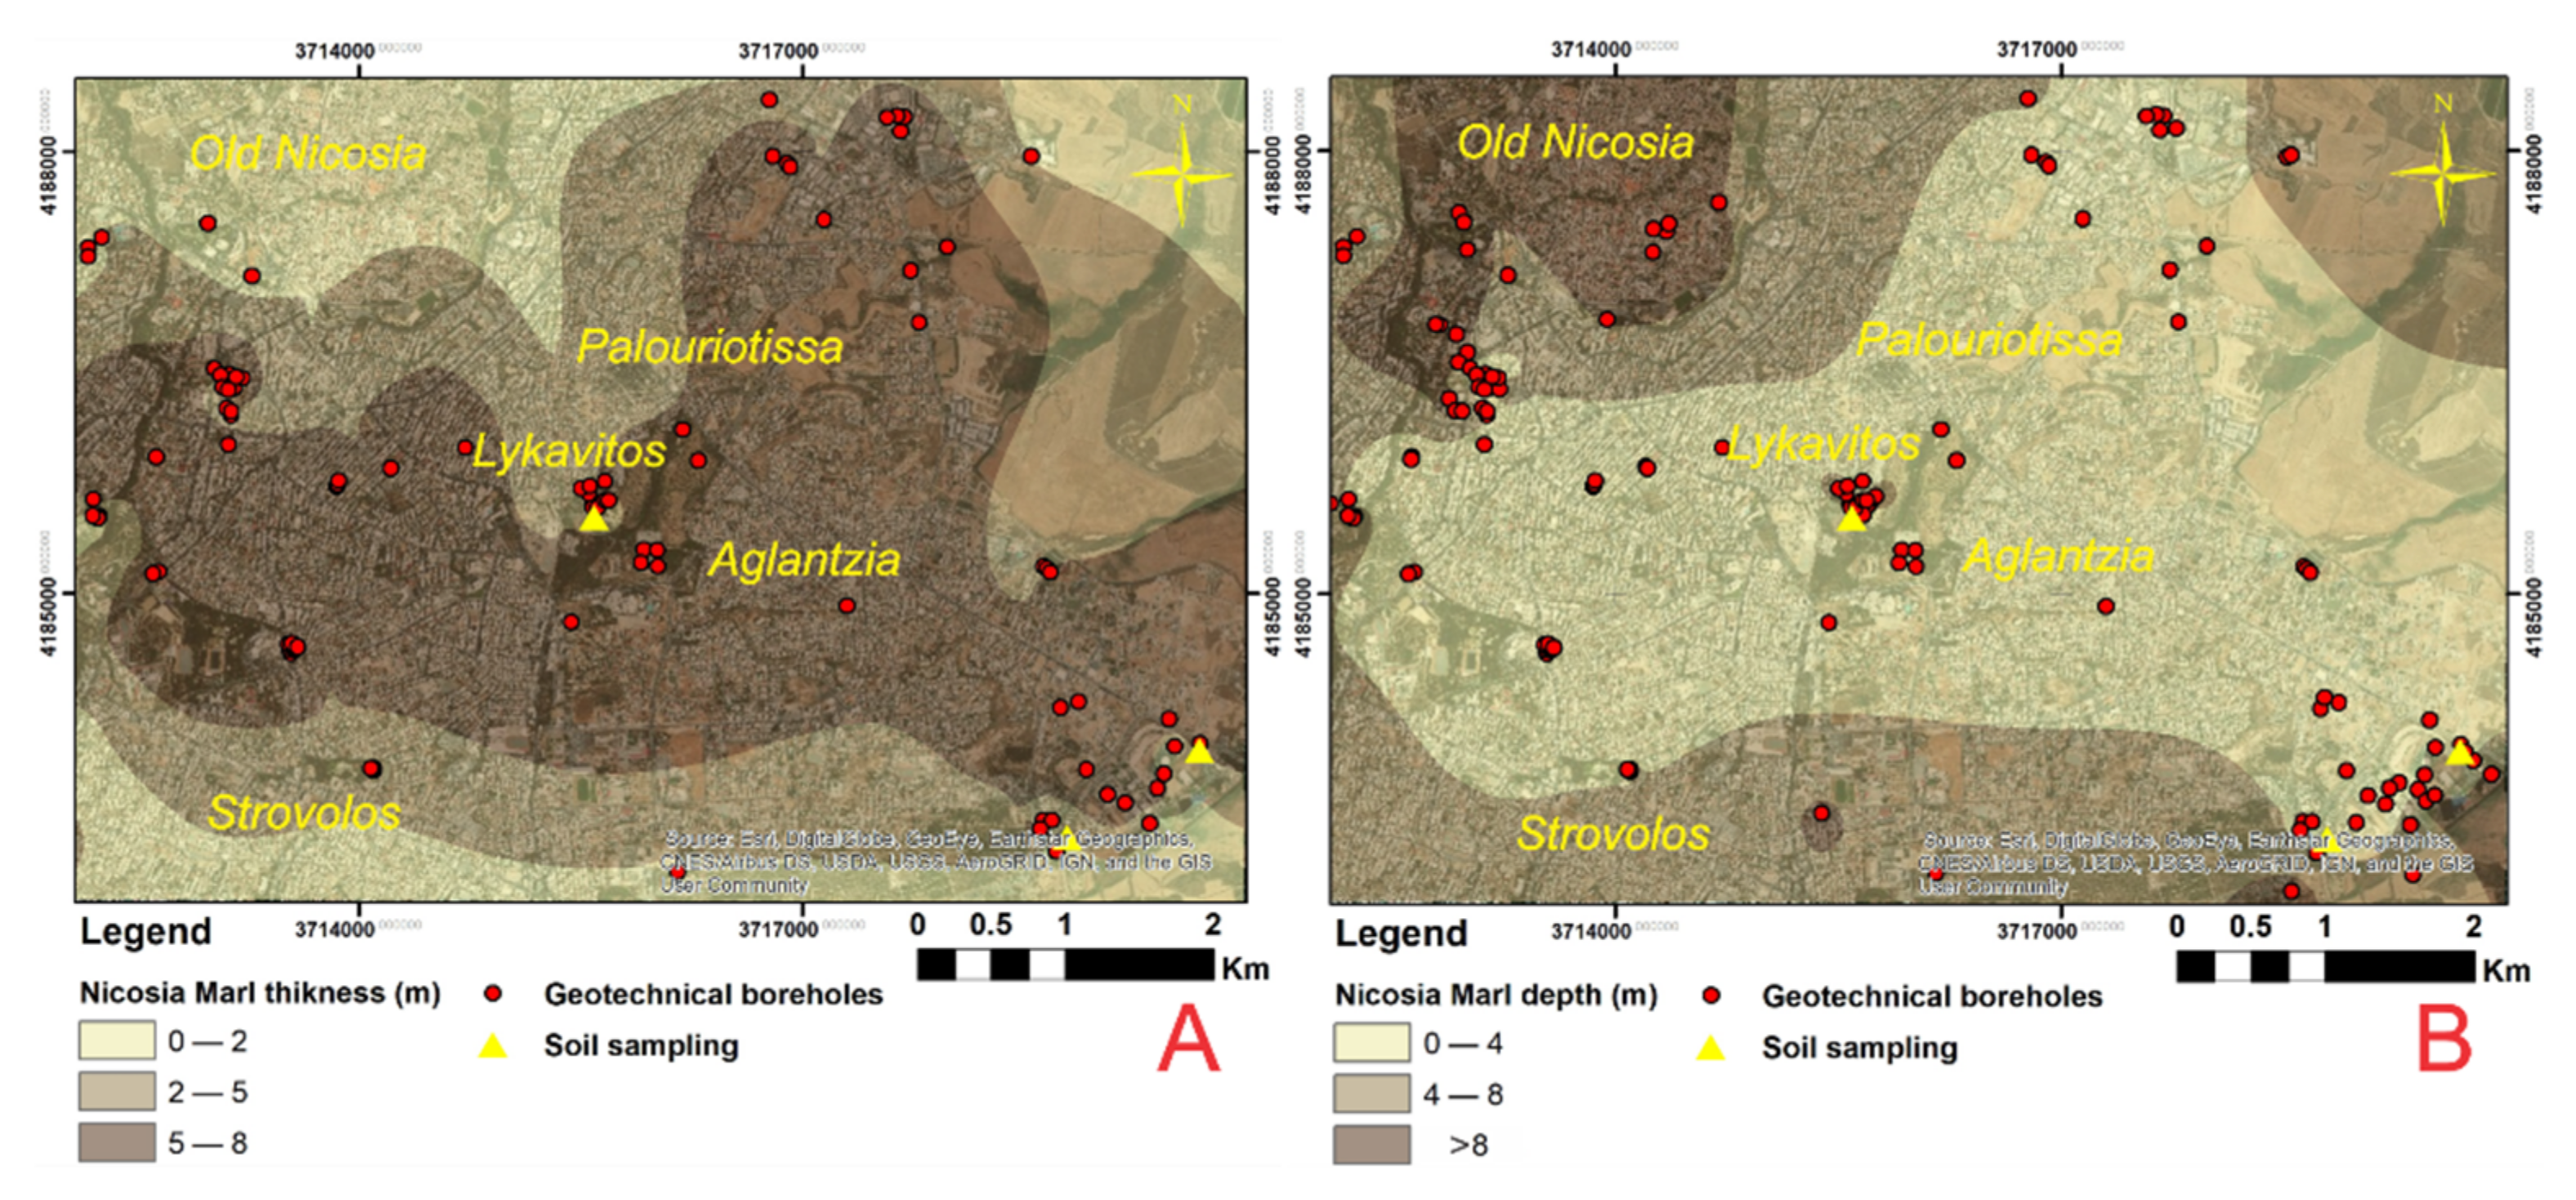
In order to create maps with the variation in the thickness of the Nicosia marl inside the presumed active zone (upper 8 m of the ground profile) (
Figure 4A) and of the depth of its upper boundary (
Figure 4B), more than 230 boreholes that contained stratigraphic information (not only geotechnical investigation boreholes) were processed. The lowest values of the marl thickness in the assumed 8 m thick active zone were observed in Old Nicosia and at the south part of Strovolos, while the highest ones were mainly in the area around Aglantzia and the Eastern part of Palouriotissa (
Figure 4A). The formation is practically outcropping in the areas around Lykavitos, Palouriotissa and Aglantzia, while the depth of the upper boundary increases substantially towards Old Nicosia (
Figure 4B).
4. InSAR Data and Processing
For the purpose of this study, the results of the European Union’s research project titled ‘PanGeo’ are used. The project’s objective was to enable free and open access to geohazard information in all EU countries, based on the collection of data via satellites [
56]. At the moment, 52 European cities provide open access maps, which consist of vector polygon Ground Stability Layer (GSL) and their GeoHazard Description (GHD).
The Geological Survey Department of Cyprus took part in this EU project. In the context of Cyprus’s participation, an urban area of 489 km
2 of the city of Nicosia was chosen for studying ground movements. Data by the Persistent Scattering Interferometry (PSI) InSAR technique (Interferometric of Synthetic Aperture Radar) from 20 radar scenes of Envisat [Environmental satellite (
Table 2) operated by the European Space Agency (ESA)] were taken and analyzed in the GAMMA IPTA software (version V1.2 June 2007).
The date range of the analysis was between 16 November 2002 and 30 December 2006. The scene of 14 May 2005 was taken as a master scene. The Georeference (X,Y) accuracy was 15 m and the reference data used for georeference was Quickbird (0.6 spatial resolution). A total number of 23818 PS points were identified with density of about 49 PS points per km2. The average annual motion rate of the entire processed area is about −0.173 mm per year while the standard deviation of the average annual motion rate reaches the 1.523.
5. Results
The investigation of this phenomenon through the SAR data processing presents some inherent weaknesses. Initially due to the nature of the phenomenon (i.e., repeated small amount of swelling followed by shrinkage without a characteristic monotonic trend), the creation of time series of the velocity or the average vertical displacements per year could not provide us with meaningful conclusions. In addition, it has to be recognized that the ground heave decreases for larger applied vertical stress and, thus, depends strongly on the pressures applied by the structures. Indeed, beyond a threshold stress point (the “swelling pressure”), the addition of moisture in the Nicosia marl does not produce swelling, but generates a collapse strain and settlement. Therefore, it is clear that, in an urban environment where high rise buildings (applying high vertical stress) coexist with smaller ones (lower vertical stress) and building with shallow foundations coexist with building founded on piles (in which case the vertical movement of the superstructure is drastically limited), the SAR data should be treated with great caution.
In order to accommodate the non-monotonic evolution of the ground movement, the amplitude of the oscillations of the vertical movement, in the form of the difference between the maximum and minimum displacement observed in the given time period, was calculated for all the PS points. This way, the intensity of the vertical deformation fluctuations (and not their tendency) becomes evident. Secondly, to mitigate the fact that ground swelling depends on the applied vertical stress, the PS points that did not belong to buildings were selected and treated separately as Free Field points and assumed to not be influenced by the loads or the rigidity of the neighboring structures. This process was done manually. More specifically, reflectors such as lighting poles, sidewalks, as well as objects and very small structures in parks and unbuilt areas, were searched and separated from PS points that obviously belonged to buildings.
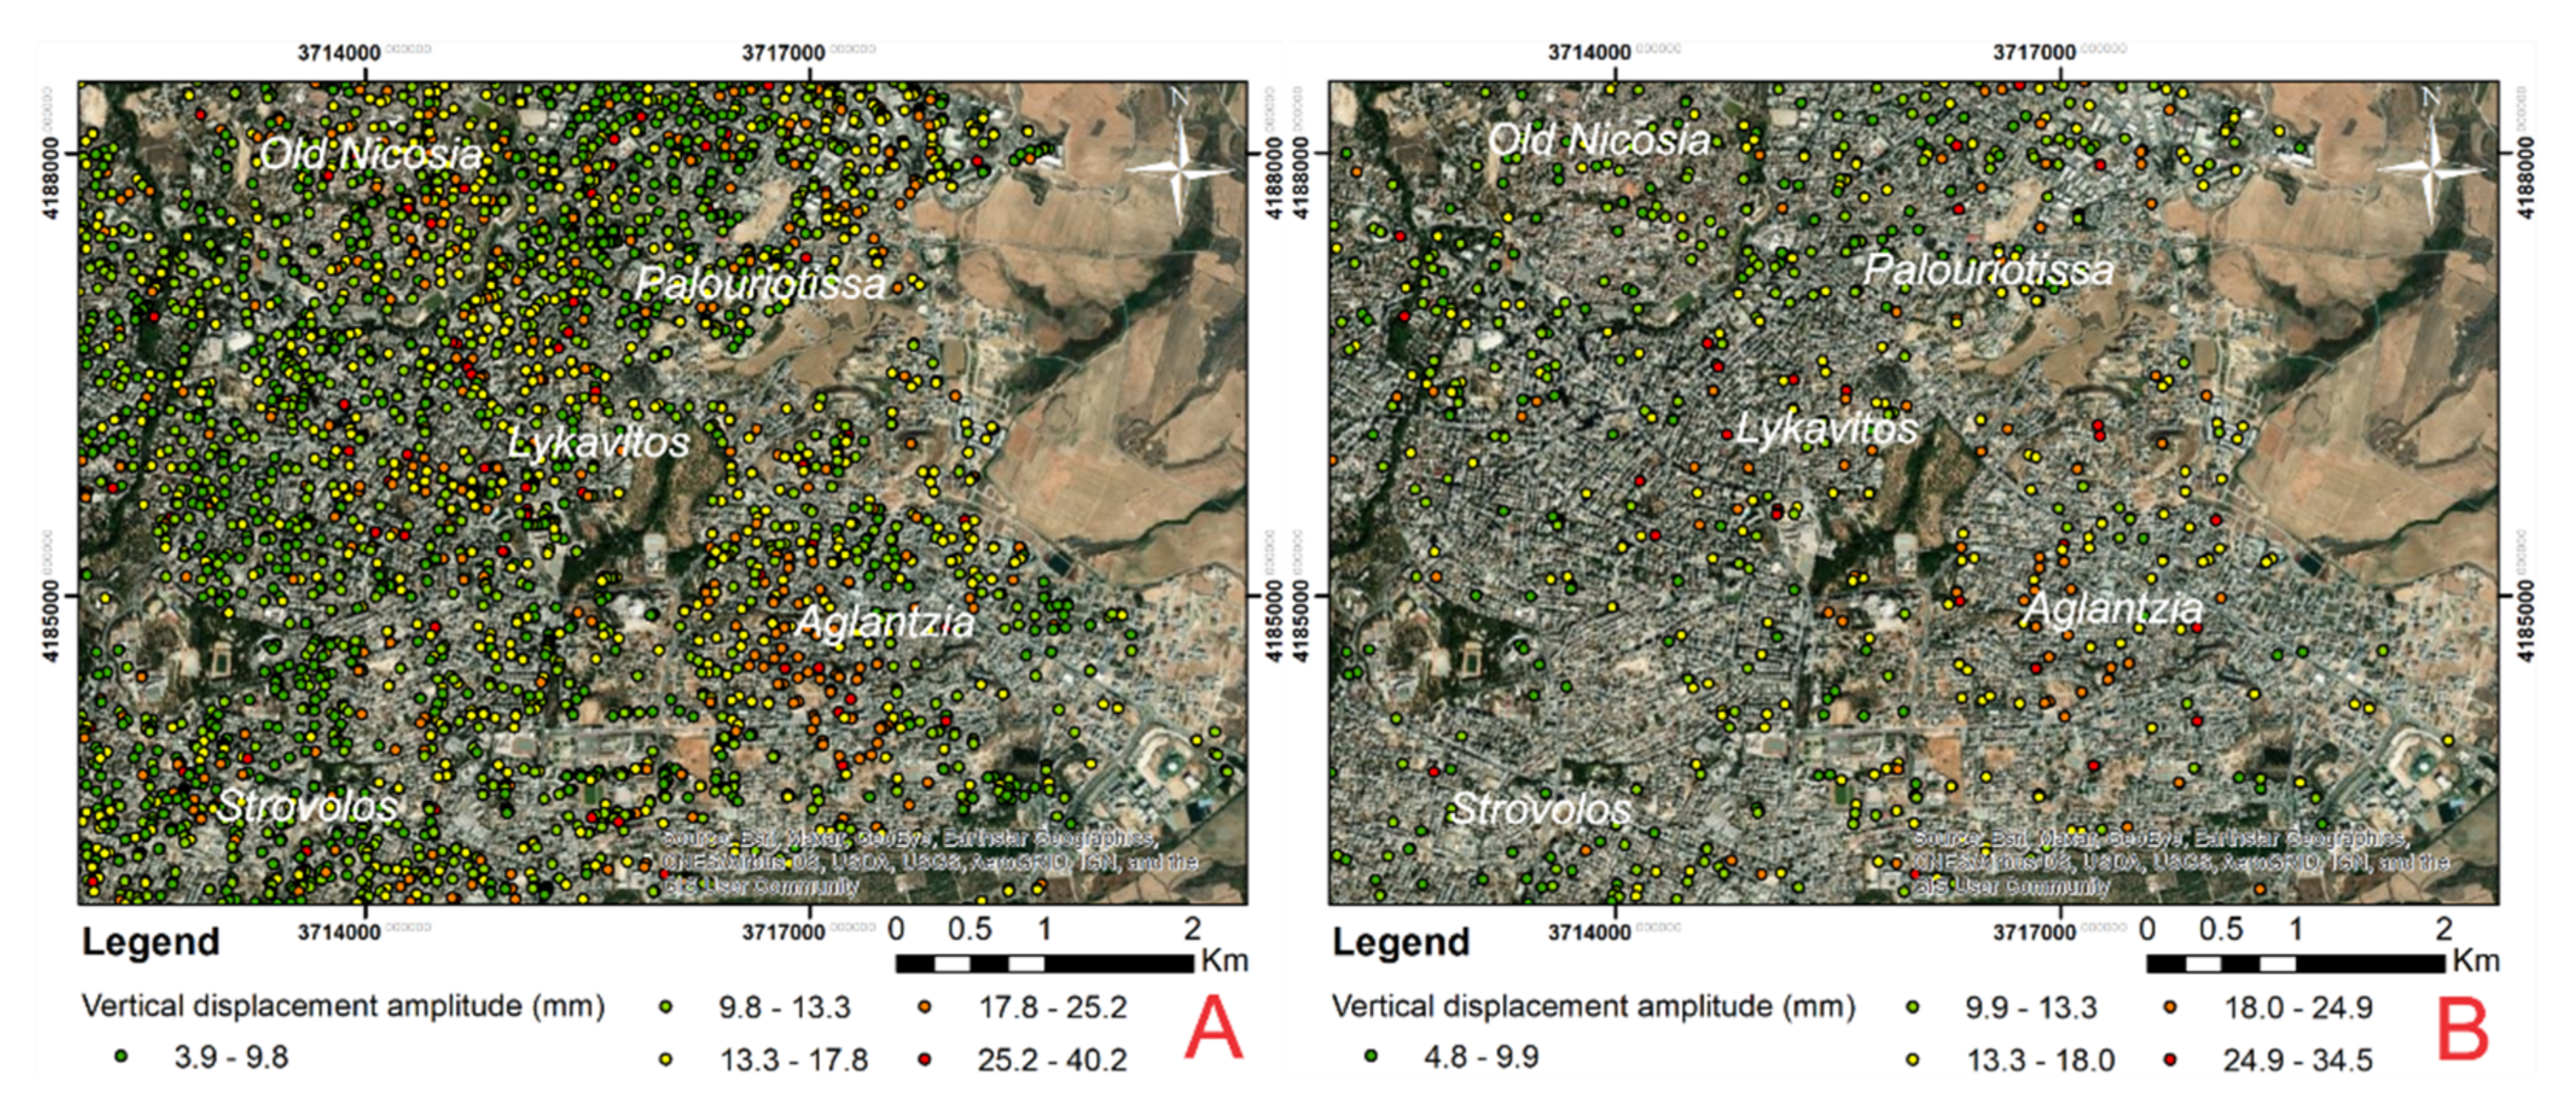
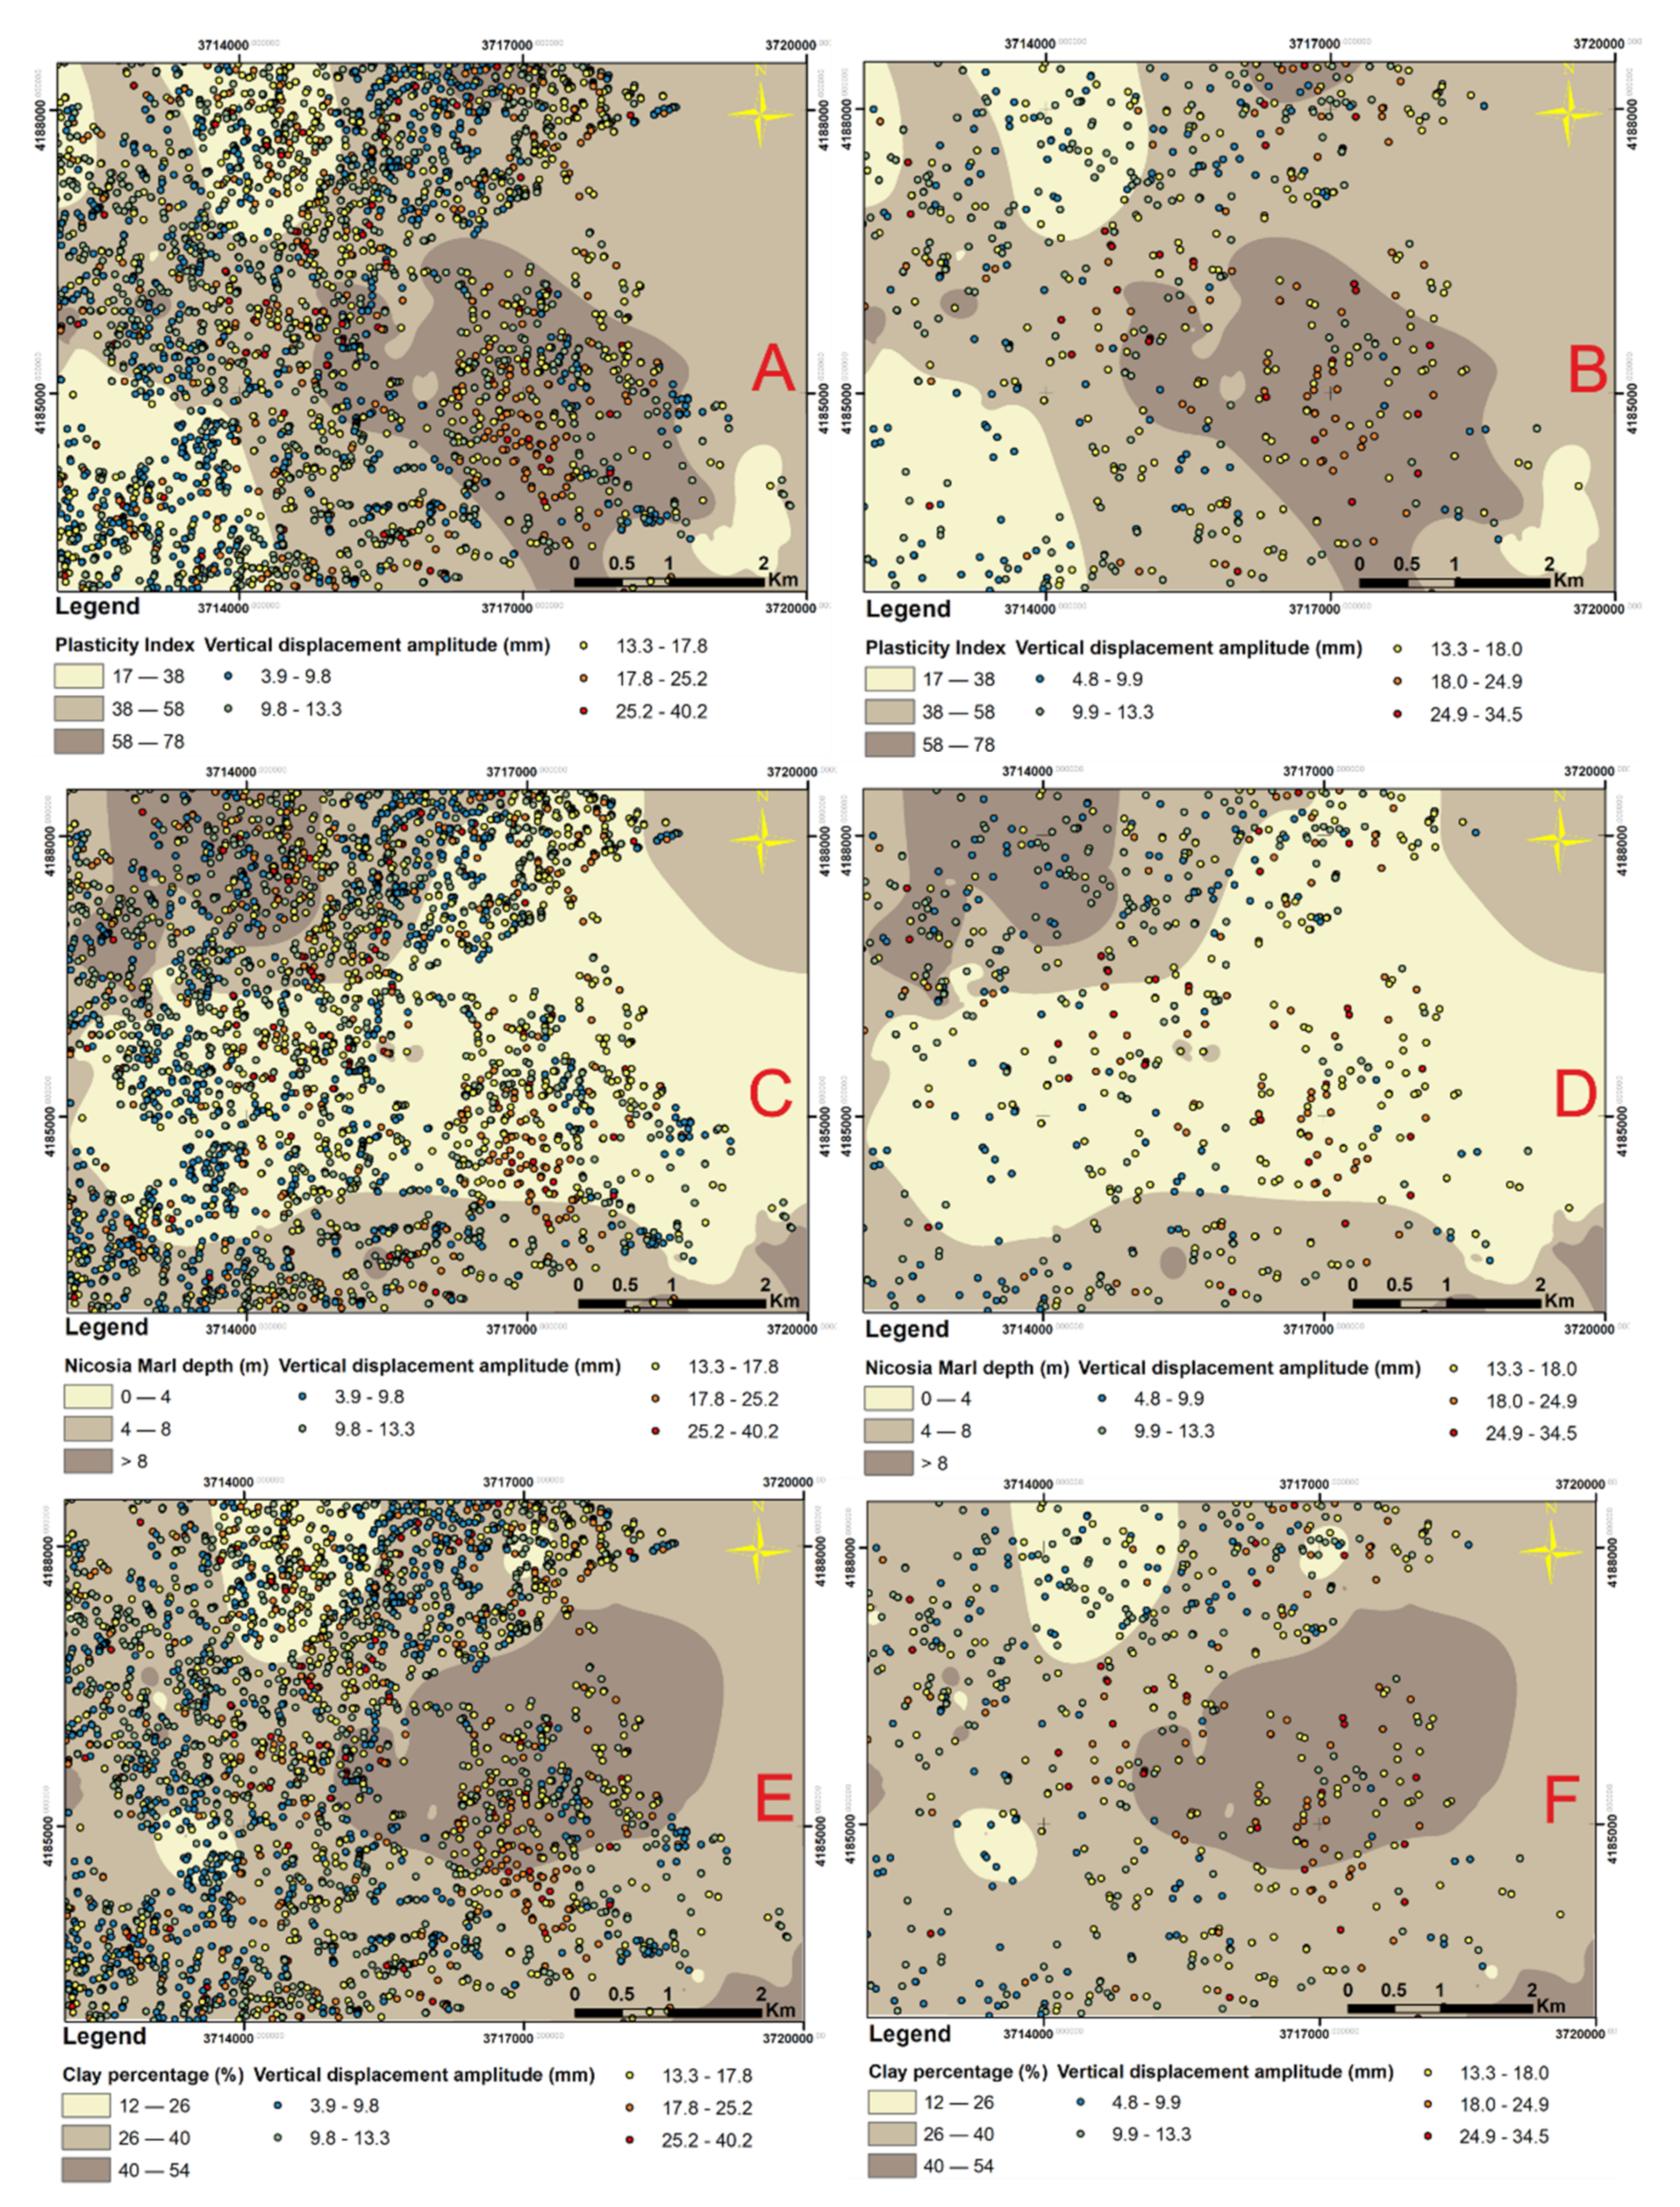
Figure 5A shows all the PS points in the study area for the period between 16 November 2002 and 30 December 2006. All the PS points were divided into five categories according to Natural Breaks method. It can be seen that the largest vertical displacements amplitudes, which can be as high as 40 mm, are observed in the areas around Lykavitos and Aglantzia. This observation is in good agreement with the Plasticity Index Thematic Layer (
Figure 6A), and both the clay content and Nicosia Marl depth, which are also very unfavorable in these areas (
Figure 6C,E). The smallest vertical displacement amplitudes appear in the Strovolos wider area, in the neighborhoods bordering the Pedieos river and in Old Nicosia and its vicinity.
A similar but more clear image is observed in
Figure 5B, where the PS Free Field points are isolated and plotted. This map pinpoints the highest values of ground movement in the areas of Lykavitos and Aglantzia. These areas present marl of high plasticity index and clay content (
Figure 6B,F). In addition, an increase in the variation in the vertical displacement amplitude is marked when moving to the north part of Palouriotissa. This can be attributed to the effect of the relative shallowness of the Nicosia Marl (
Figure 6D).
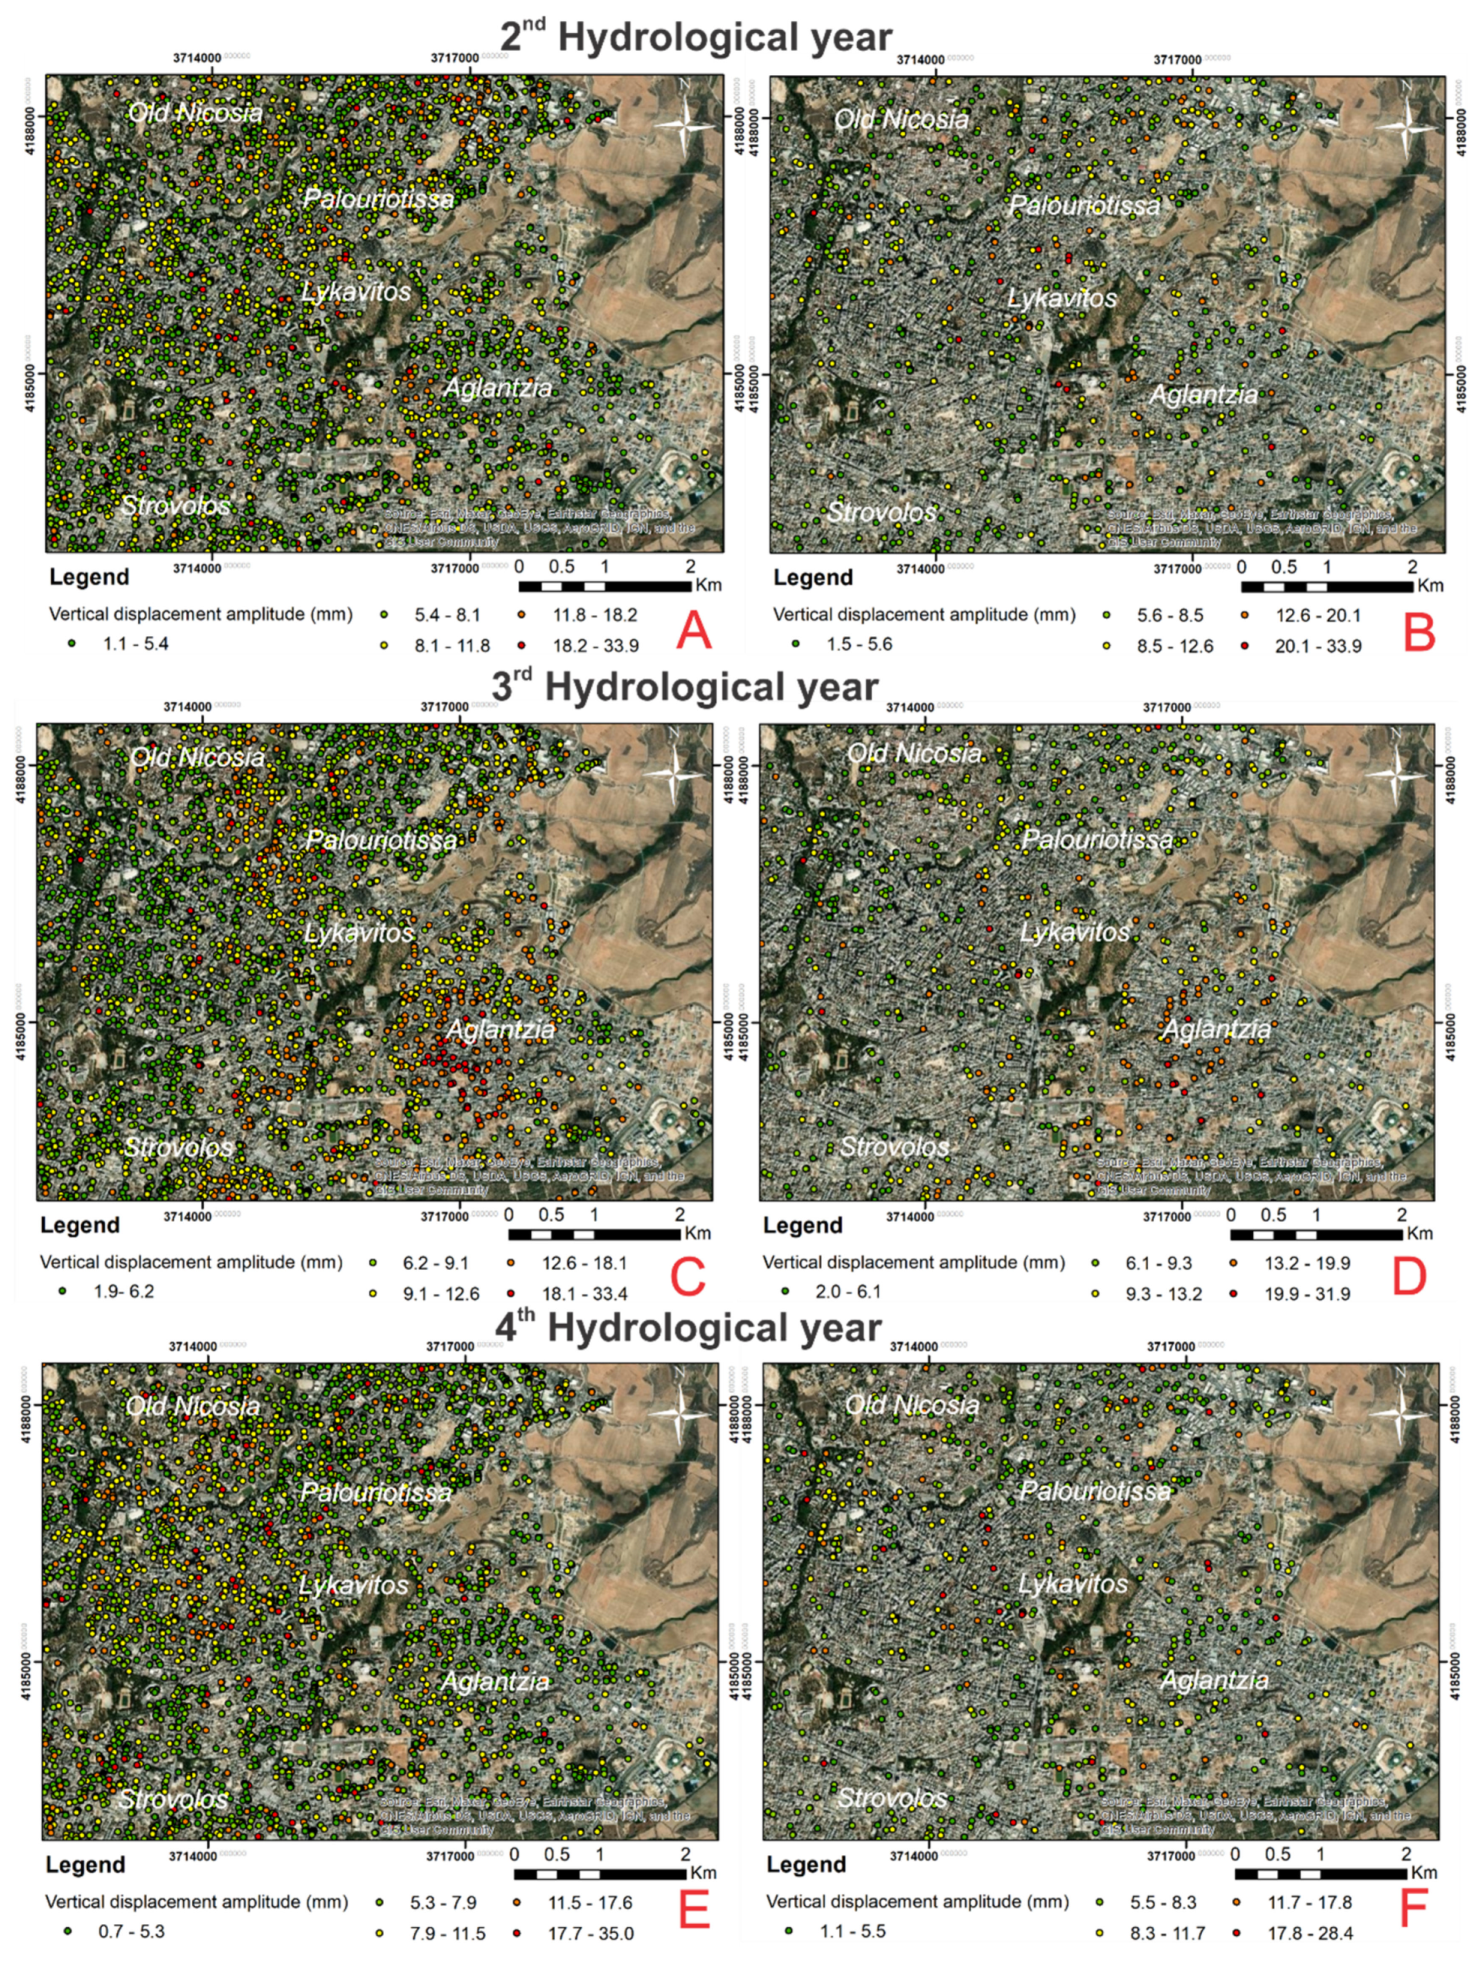
In order to investigate the vertical displacements amplitudes for the three hydrological years, six new maps were created. It should be stressed that the first hydrological year is not presented due to incomplete remote sensing data.
Figure 7A,C,E, in which all the PS points are included, shows large vertical displacement amplitudes, especially in the area around Aglantzia and Lykavitos, reaching values as high as 33 mm. Similar conclusions can be drawn for the Free Field PS points (
Figure 7B,D,F). More specifically, the highest values are observed in the area around Aglantzia and Lykavitos, while the lowest ones at the Old Nicosia and Strovolos. It is worth stressing the fact that in the western part of study area, the PS points with the lower amplitude values in
Figure 7A,C,E disappeared from
Figure 7B,D,F, while Free Field PS points with relatively large movement amplitudes remained. This observation can lead to the conclusion that in this area, high vertical displacements amplitudes can occur, but due to the PS points reflectors locations, i.e., on high-rise buildings applying high vertical stresses to the ground, the observed displacements are small.
It should be stressed that the vertical displacement amplitudes are similar both throughout the 4-year examination period (40 mm for the PS points and 35 mm for the Free Field PS points) and for each hydrological year separately (33 mm for the general PS points and 32 mm for the Free Field PS points) (
Figure 7). This observation confirms the periodicity of the phenomenon and leads in the conclusion that the main cause of ground volume changes is the seasonal fluctuation in the climatic factors (precipitation, temperature, sunshine).
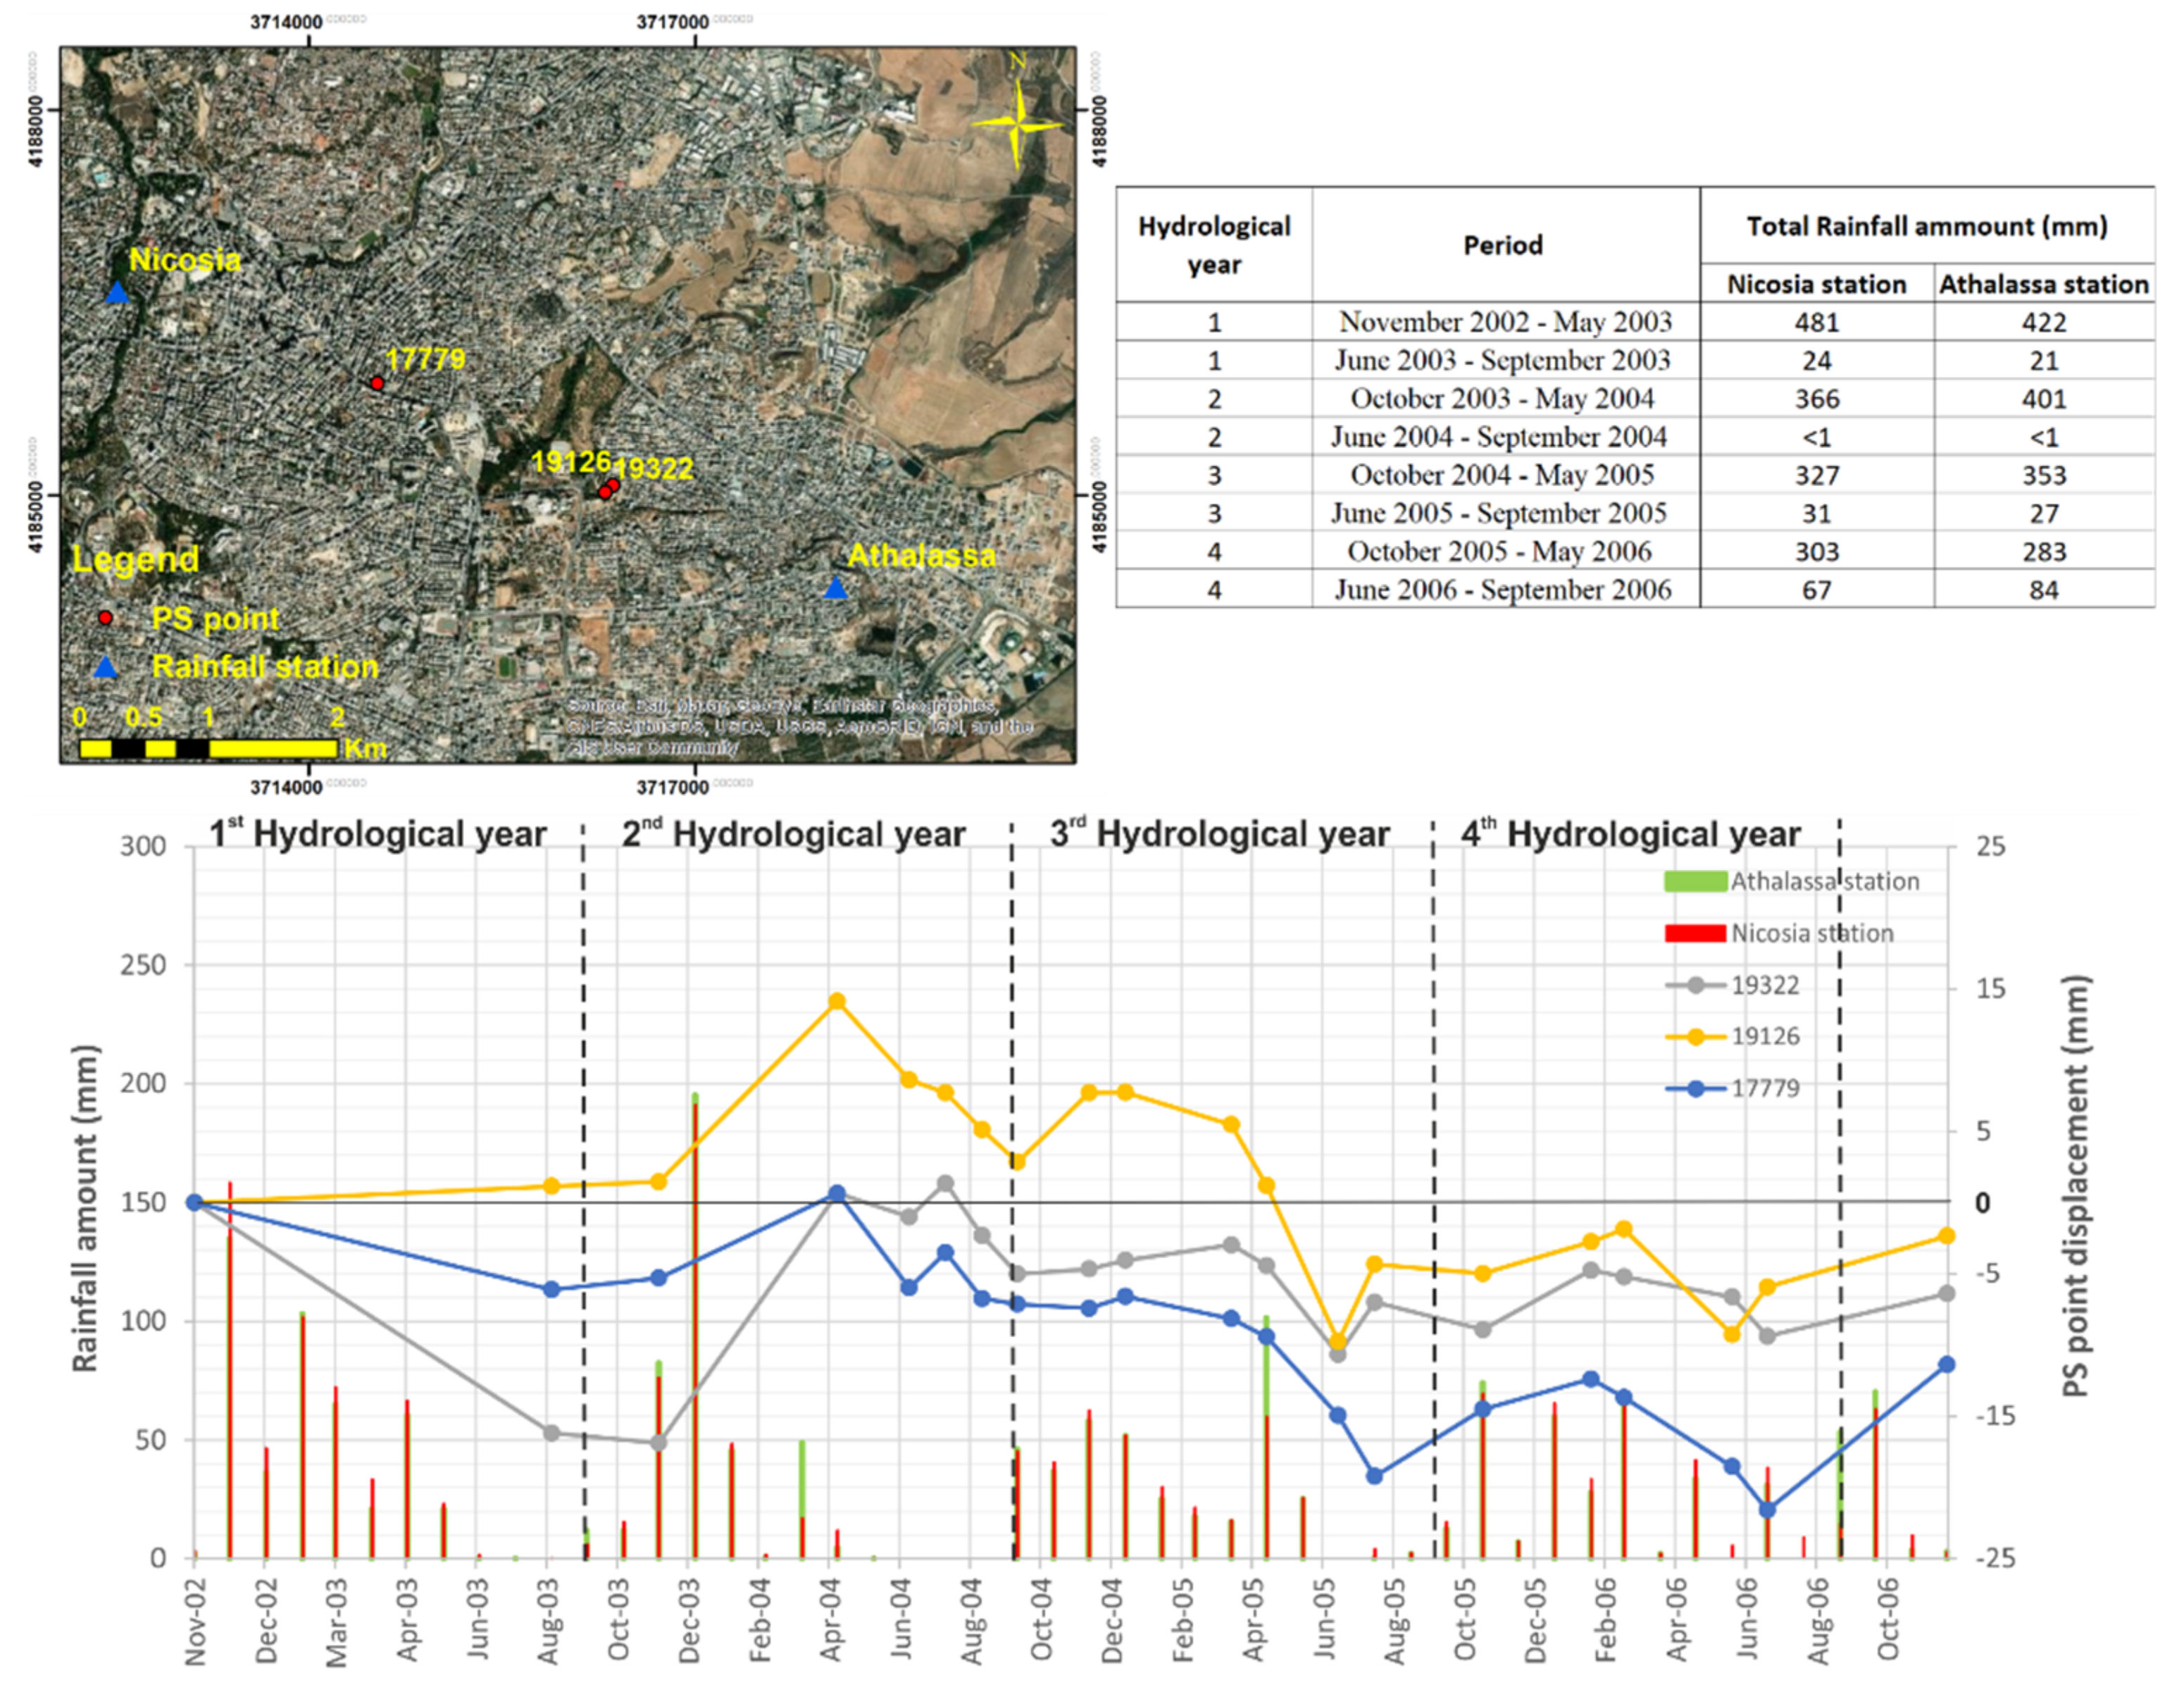
In order to investigate the periodicity of this phenomenon, the rainfall data from 2 meteorological stations, during the time period were obtained. As
Figure 8 shows, the driest period was between June 2004 and September 2004, as the cumulative amount of rainfall did not exceed 1 mm. On the contrary, the periods November 2002–May 2003 and October 2003–May 2004 presented the highest amount of precipitation. A correlation between three free field PS points (19322, 19126, 17779) and rainfall for the period November 2002–November 2006 can be discerned in
Figure 8, despite gaps in the time series. It can be seen that rainy periods are followed shortly by an upward movement of the ground, while a steady downward movement develops during the course of the dry periods. The seasonal changes in the displacement of the PS points lead to the conclusion that the repeated changes in the amount of rainfall in conjunction with the high seasonal temperature variations cause significant changes in the ground moisture inside the active zone, resulting in noticeable volumetric changes in the clay-rich horizons of the Nicosia marl.
5.1. Correlation of the Factors Controlling Ground Swelling/Shrinkage with the Remote Sensing Data
The results of the spatial analysis carried out in the GIS environment are presented below and concern the calculation of the frequency of classes of vertical ground displacement amplitude in correlation with the main causal factors. For this purpose, the PS points were divided into five classes according to the movement amplitude.
Figure 9,
Figure 10,
Figure 11,
Figure 12 and
Figure 13 show the results of the statistical analysis in the form of diagrams, accounting both for all PS points and for only the Free Field PS points. It is noted that the relative density is estimated by considering the number of PS points in each individual class depending on the area which occupied.
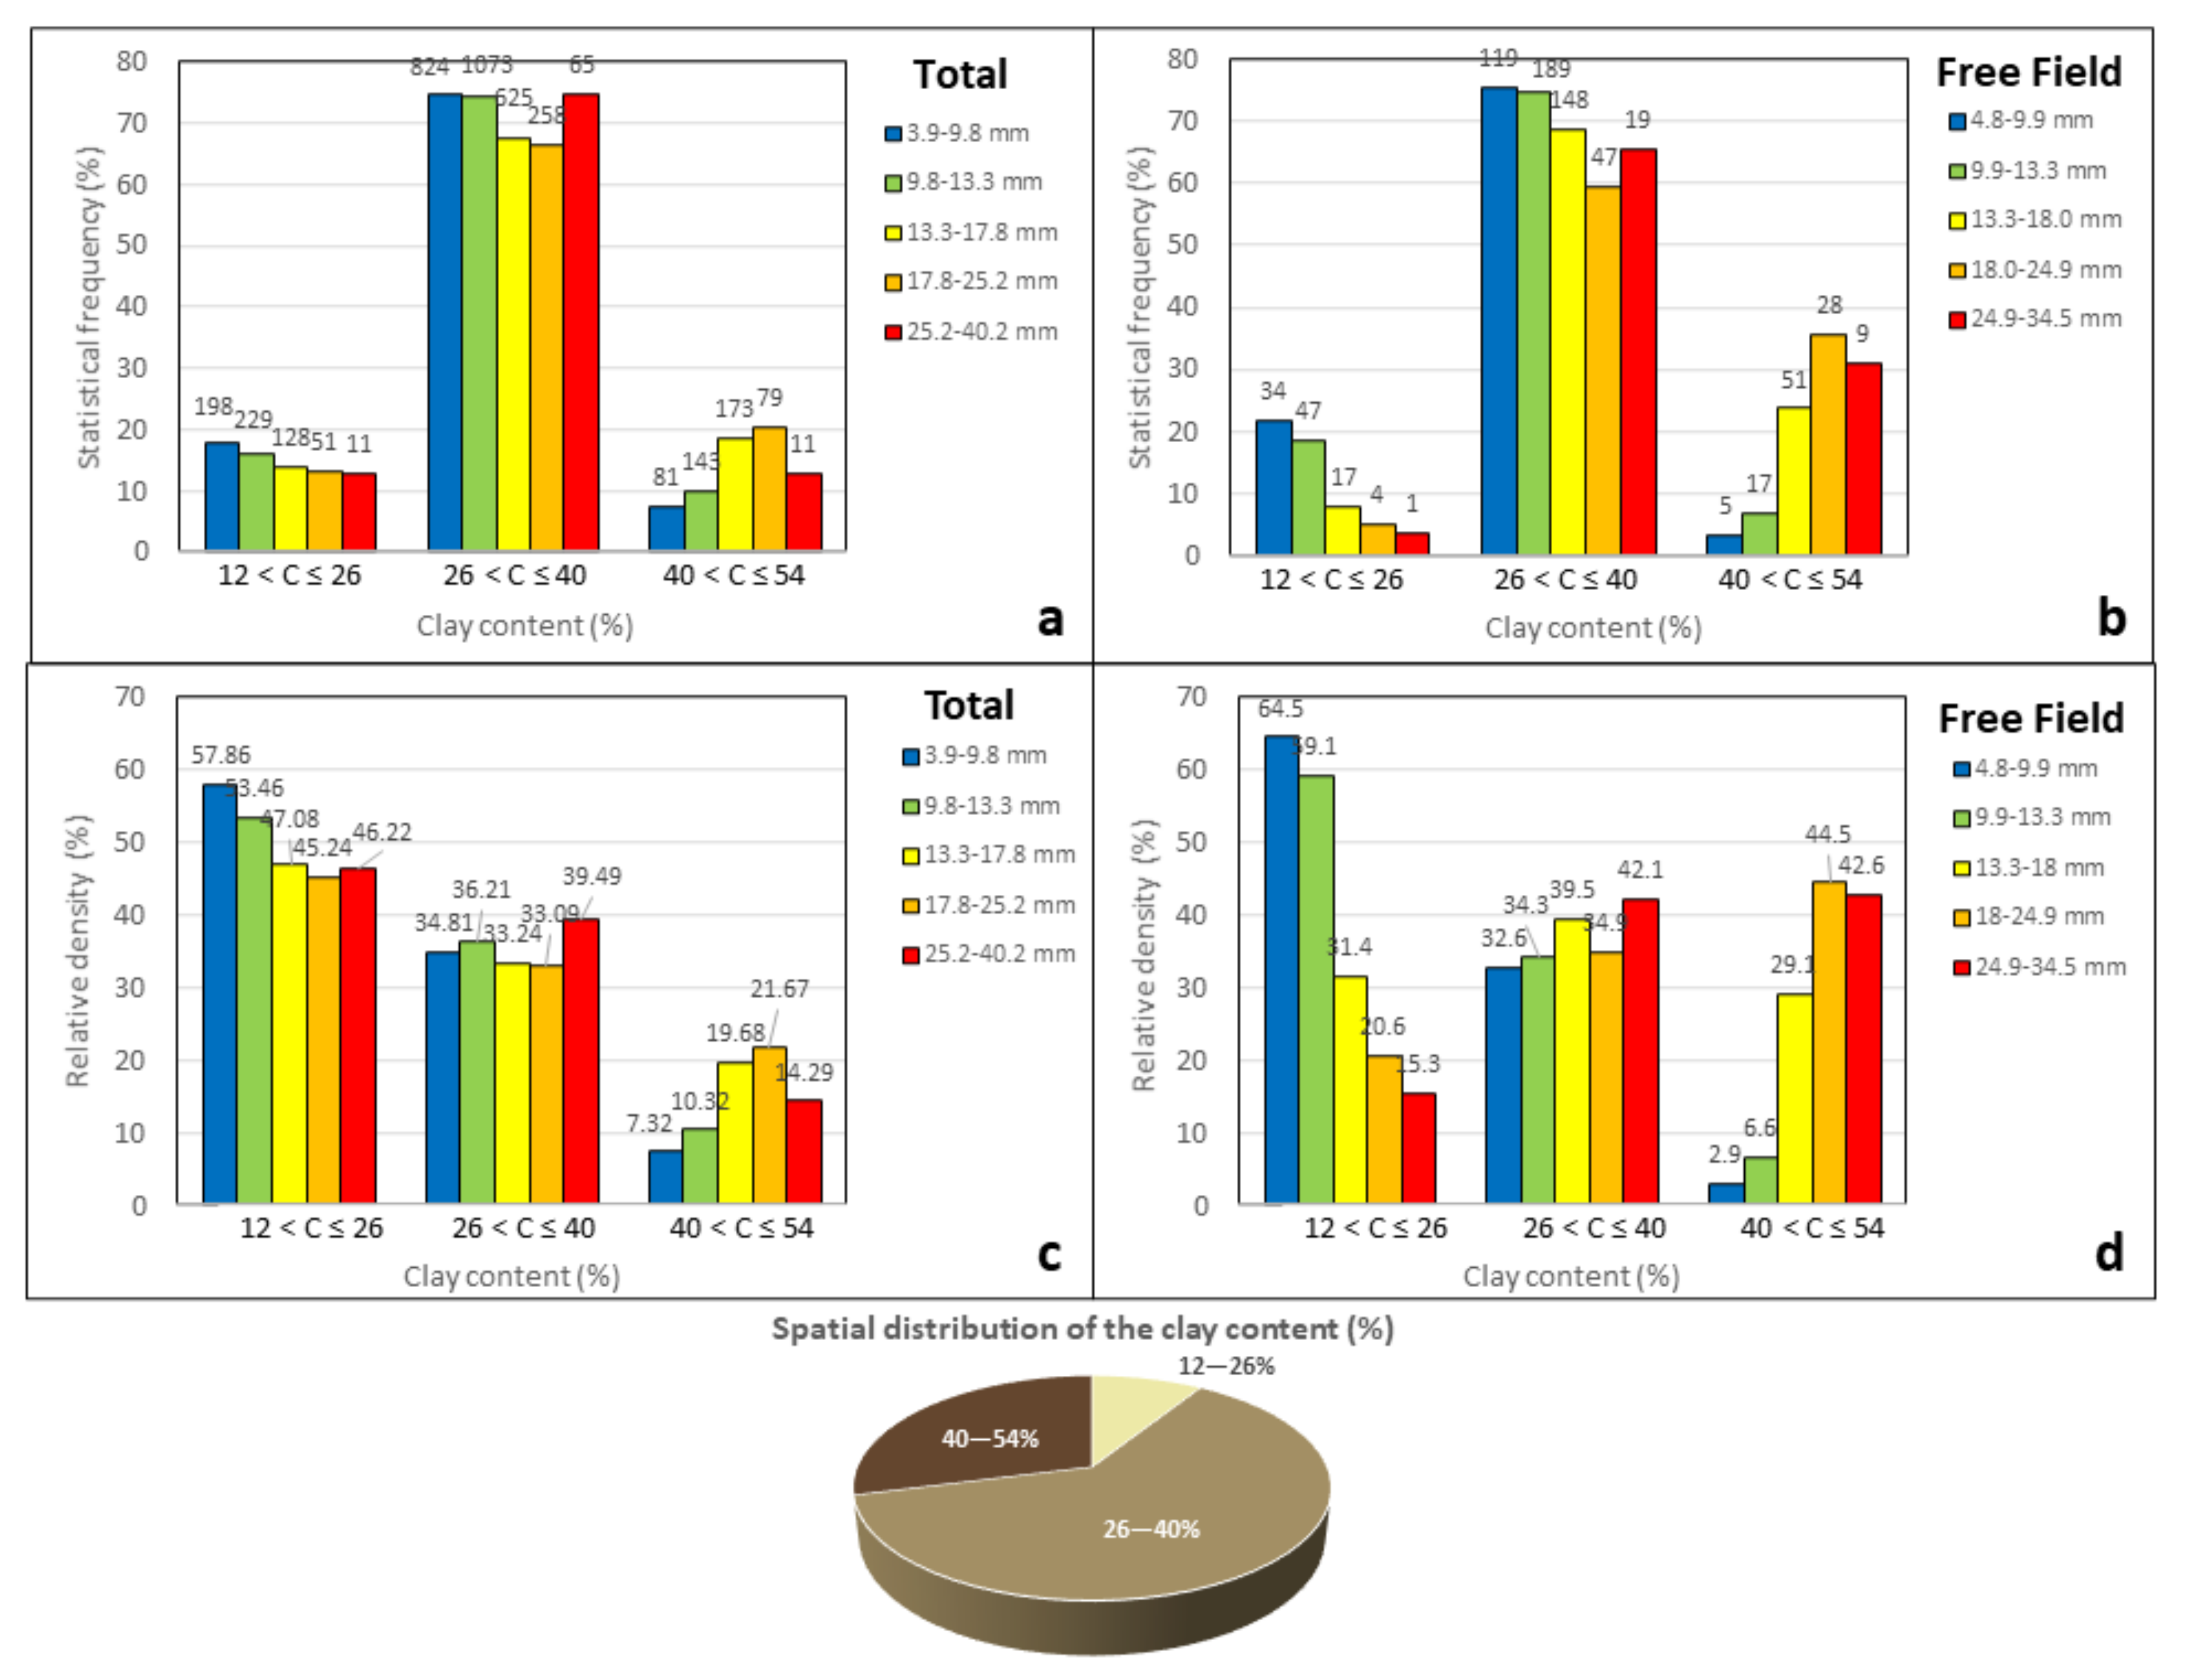
Regarding the clay content, it was observed that the study area is covered mainly by khaki marl that contains clay percentage between 26–40%. Moreover, the area in which the khaki marl contains more than 40% of clay occupies 29% of the map. The highest frequency of small movement amplitude (blue bar) PS points (824) and large movement amplitude (red bar) PS points (64) occurs in the areas where the clay content is between 26–40% (
Figure 9a). A similar picture is observed for the Free Field Ps points (
Figure 9b). After the calculation of the relative density, it was observed that the highest rate of low displacement amplitude PS points was noticed in the clay content area ≤26% for both Free Field PS Point and the general PS Points (
Figure 9c,d).
Significant variation in the high vertical displacement amplitude class between the results of the Free Field PS points and general PS points was observed. More specifically, the relative density of Free Field red PS points (42.62%) is higher in the area with clay content >40%, while the relative density of the general red PS Points is the lowest (14.29%) in same area.
From
Figure 9d, it can be seen that there is strong correlation between clay content and ground movement amplitude. For example, the relative density of highest amplitude free field PS points (red bar) increase as the clay content increases, while the lowest amplitude points (blue bar) decreases as the clay content increases. This is not observed when all PS points are considered (
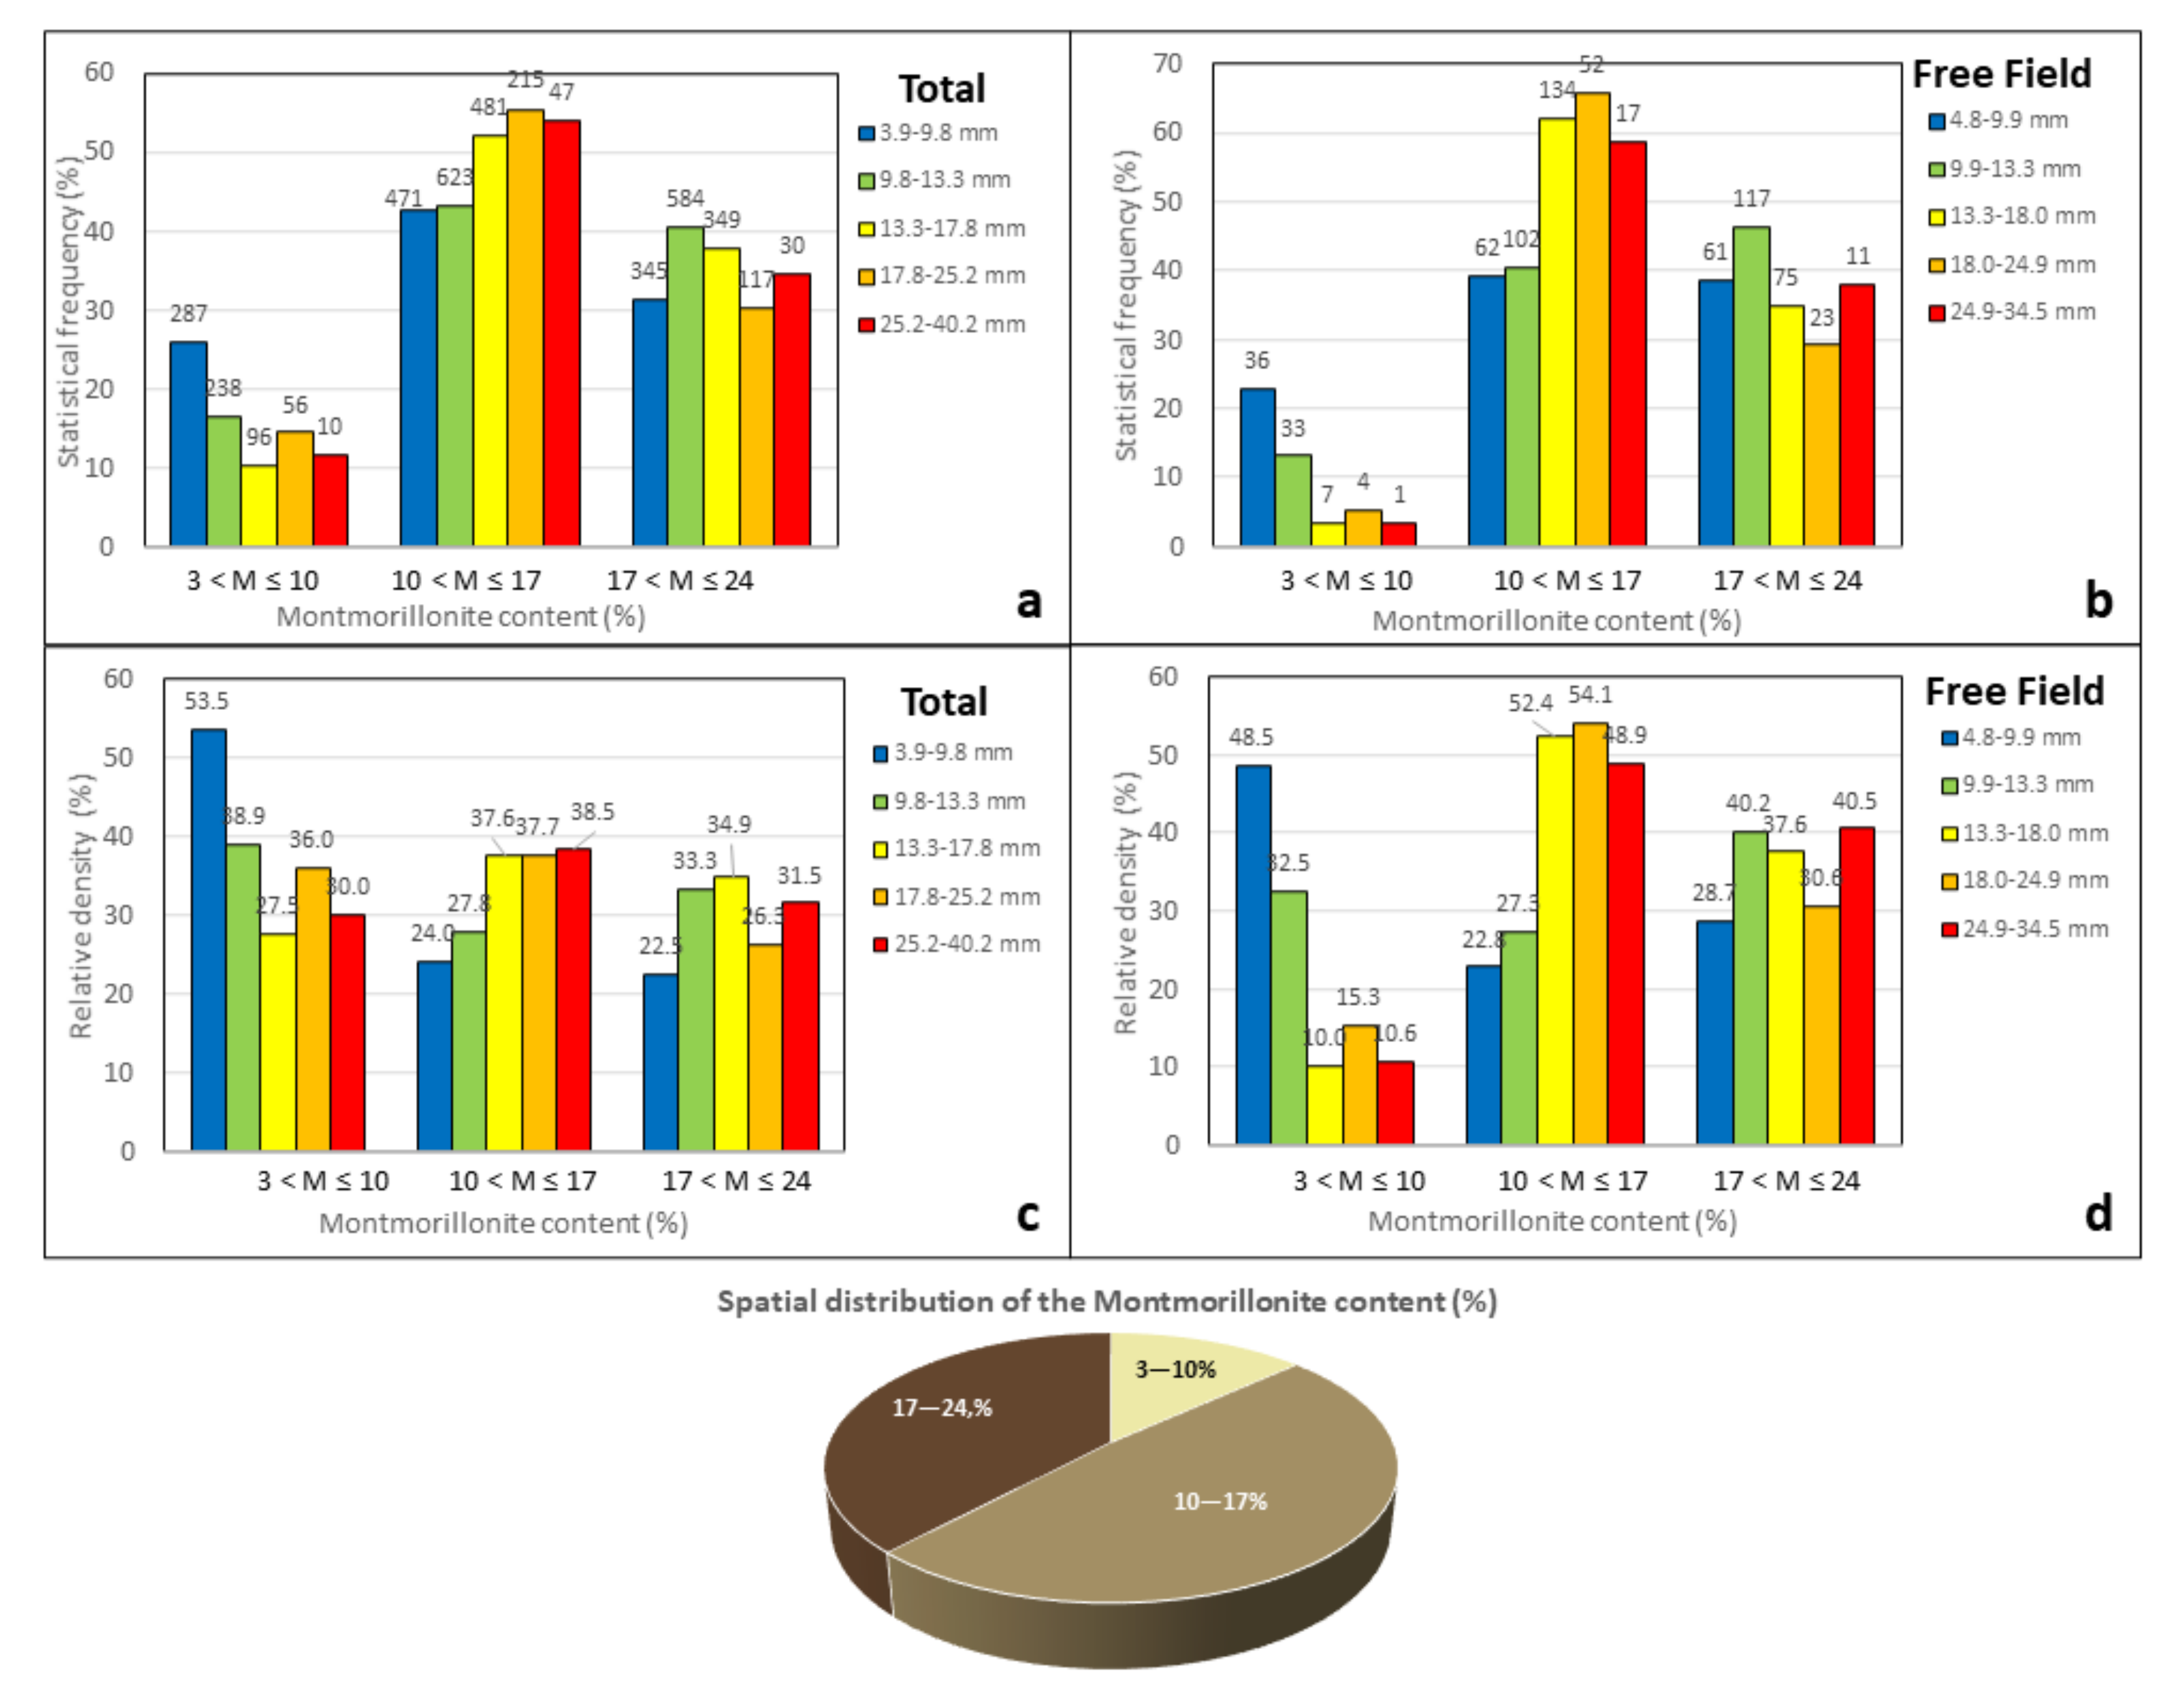
Figure 9c). This fact demonstrates clearly the necessity of removing the PS points that do not belong in the free field from the statistical dataset. Contrarily to the clay content, a clear trend is not observed for the montmorillonite content (
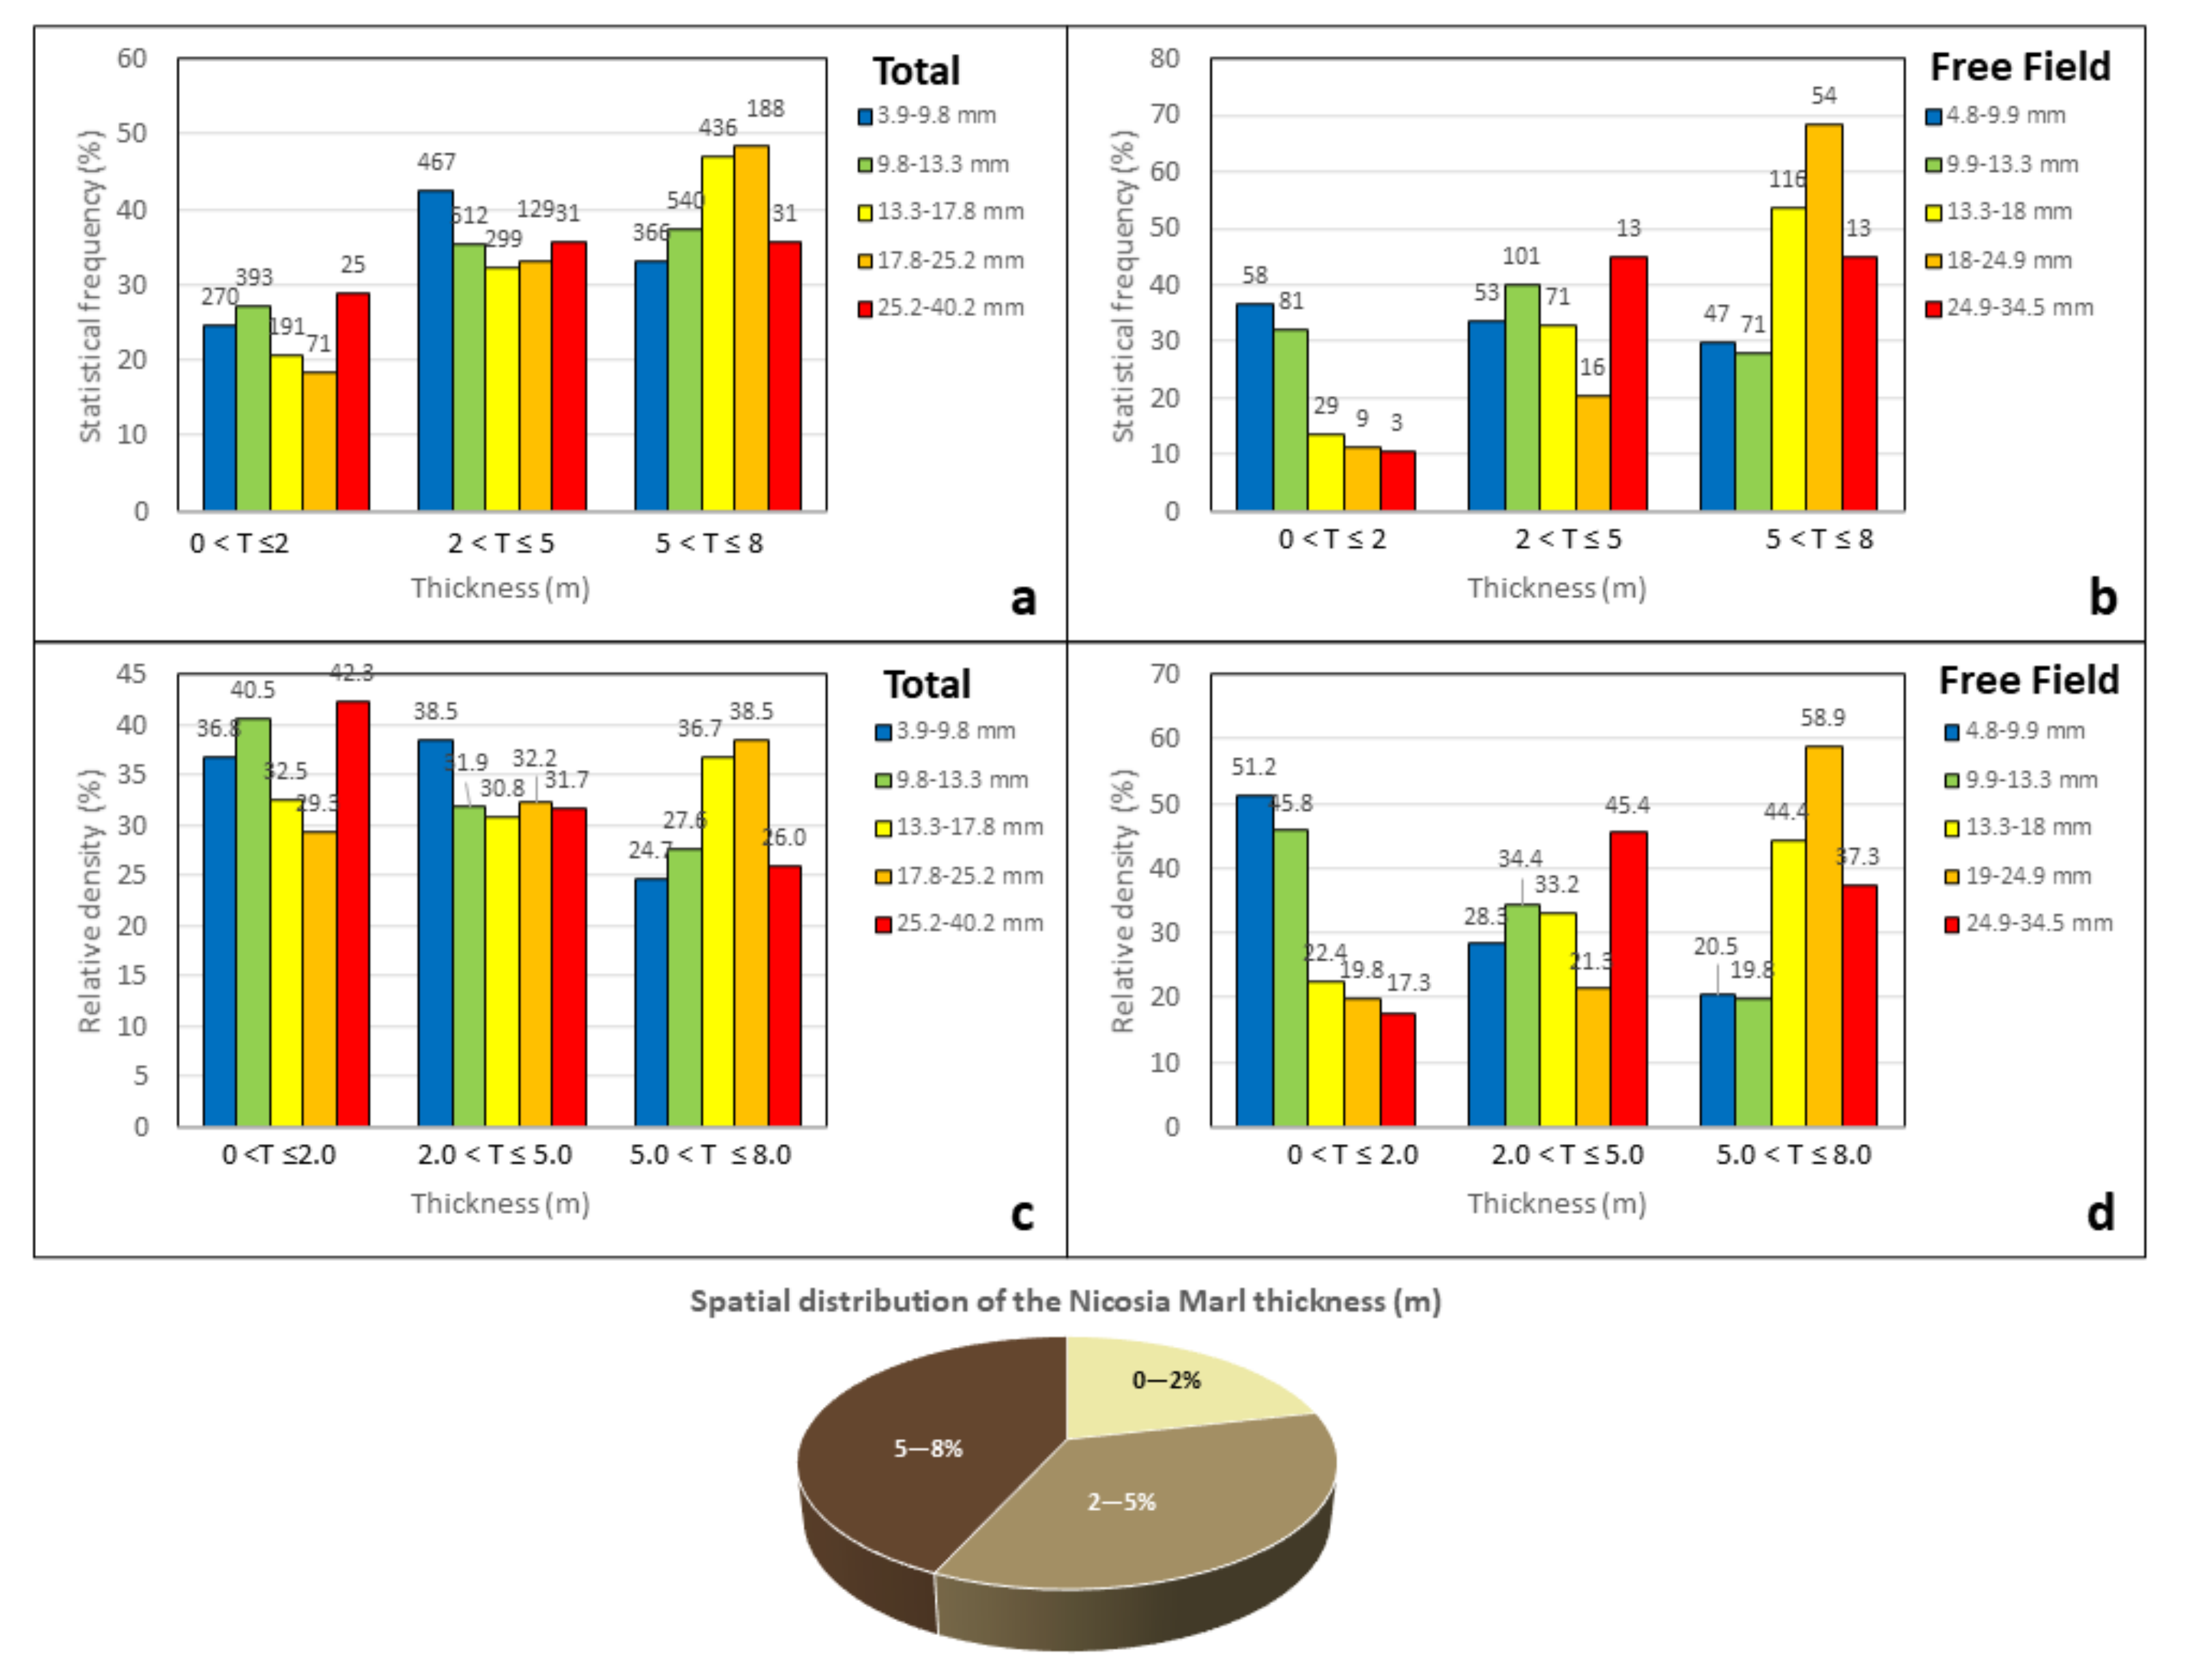
Figure 10d). For example, the relative density for the high amplitude and the low amplitude movement varying non-monotonically with increasing montmorillonite content. The same is true for the marl thickness inside the active zone (
Figure 12).
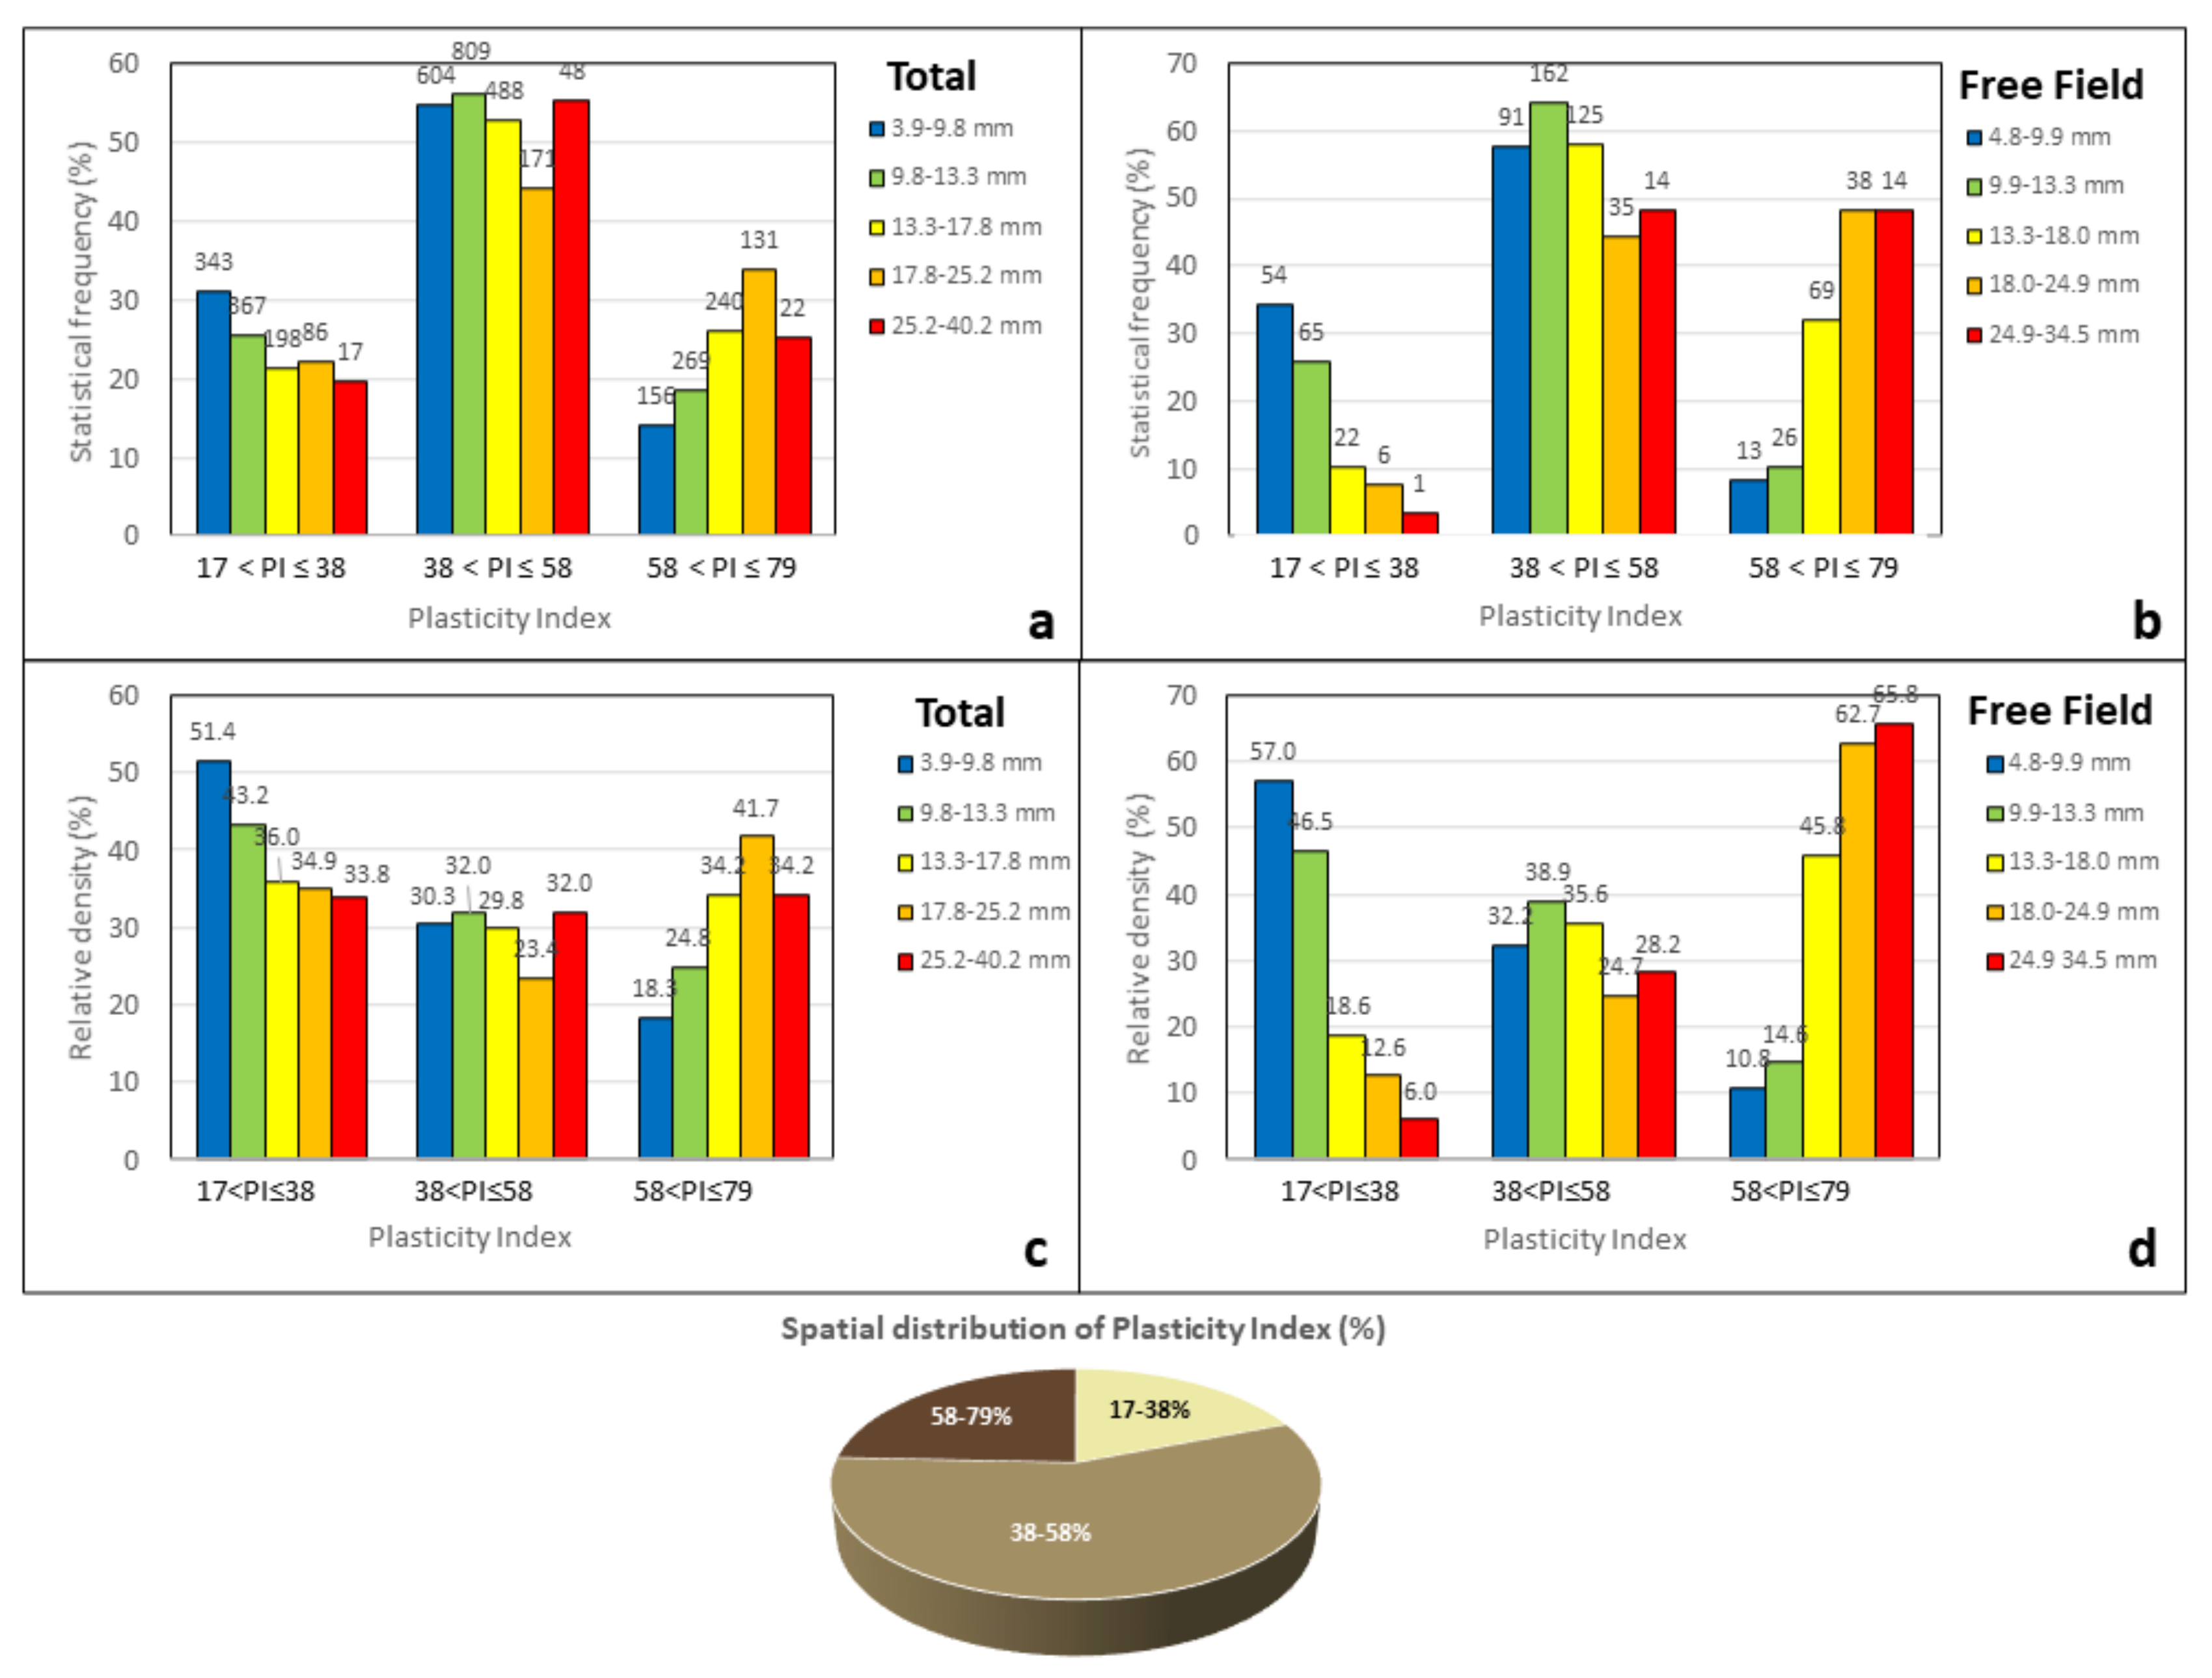
An even stronger trend than clay content gives the plasticity index (
Figure 11d) if only the free-field PS points are considered. The relative density of the highest amplitude displacement rises from 6% to 66% as PI rises to the range 58 to 79. As in the previous cases, if non free-field points are included in the statistical analysis, the correlation with PI is much weaker.
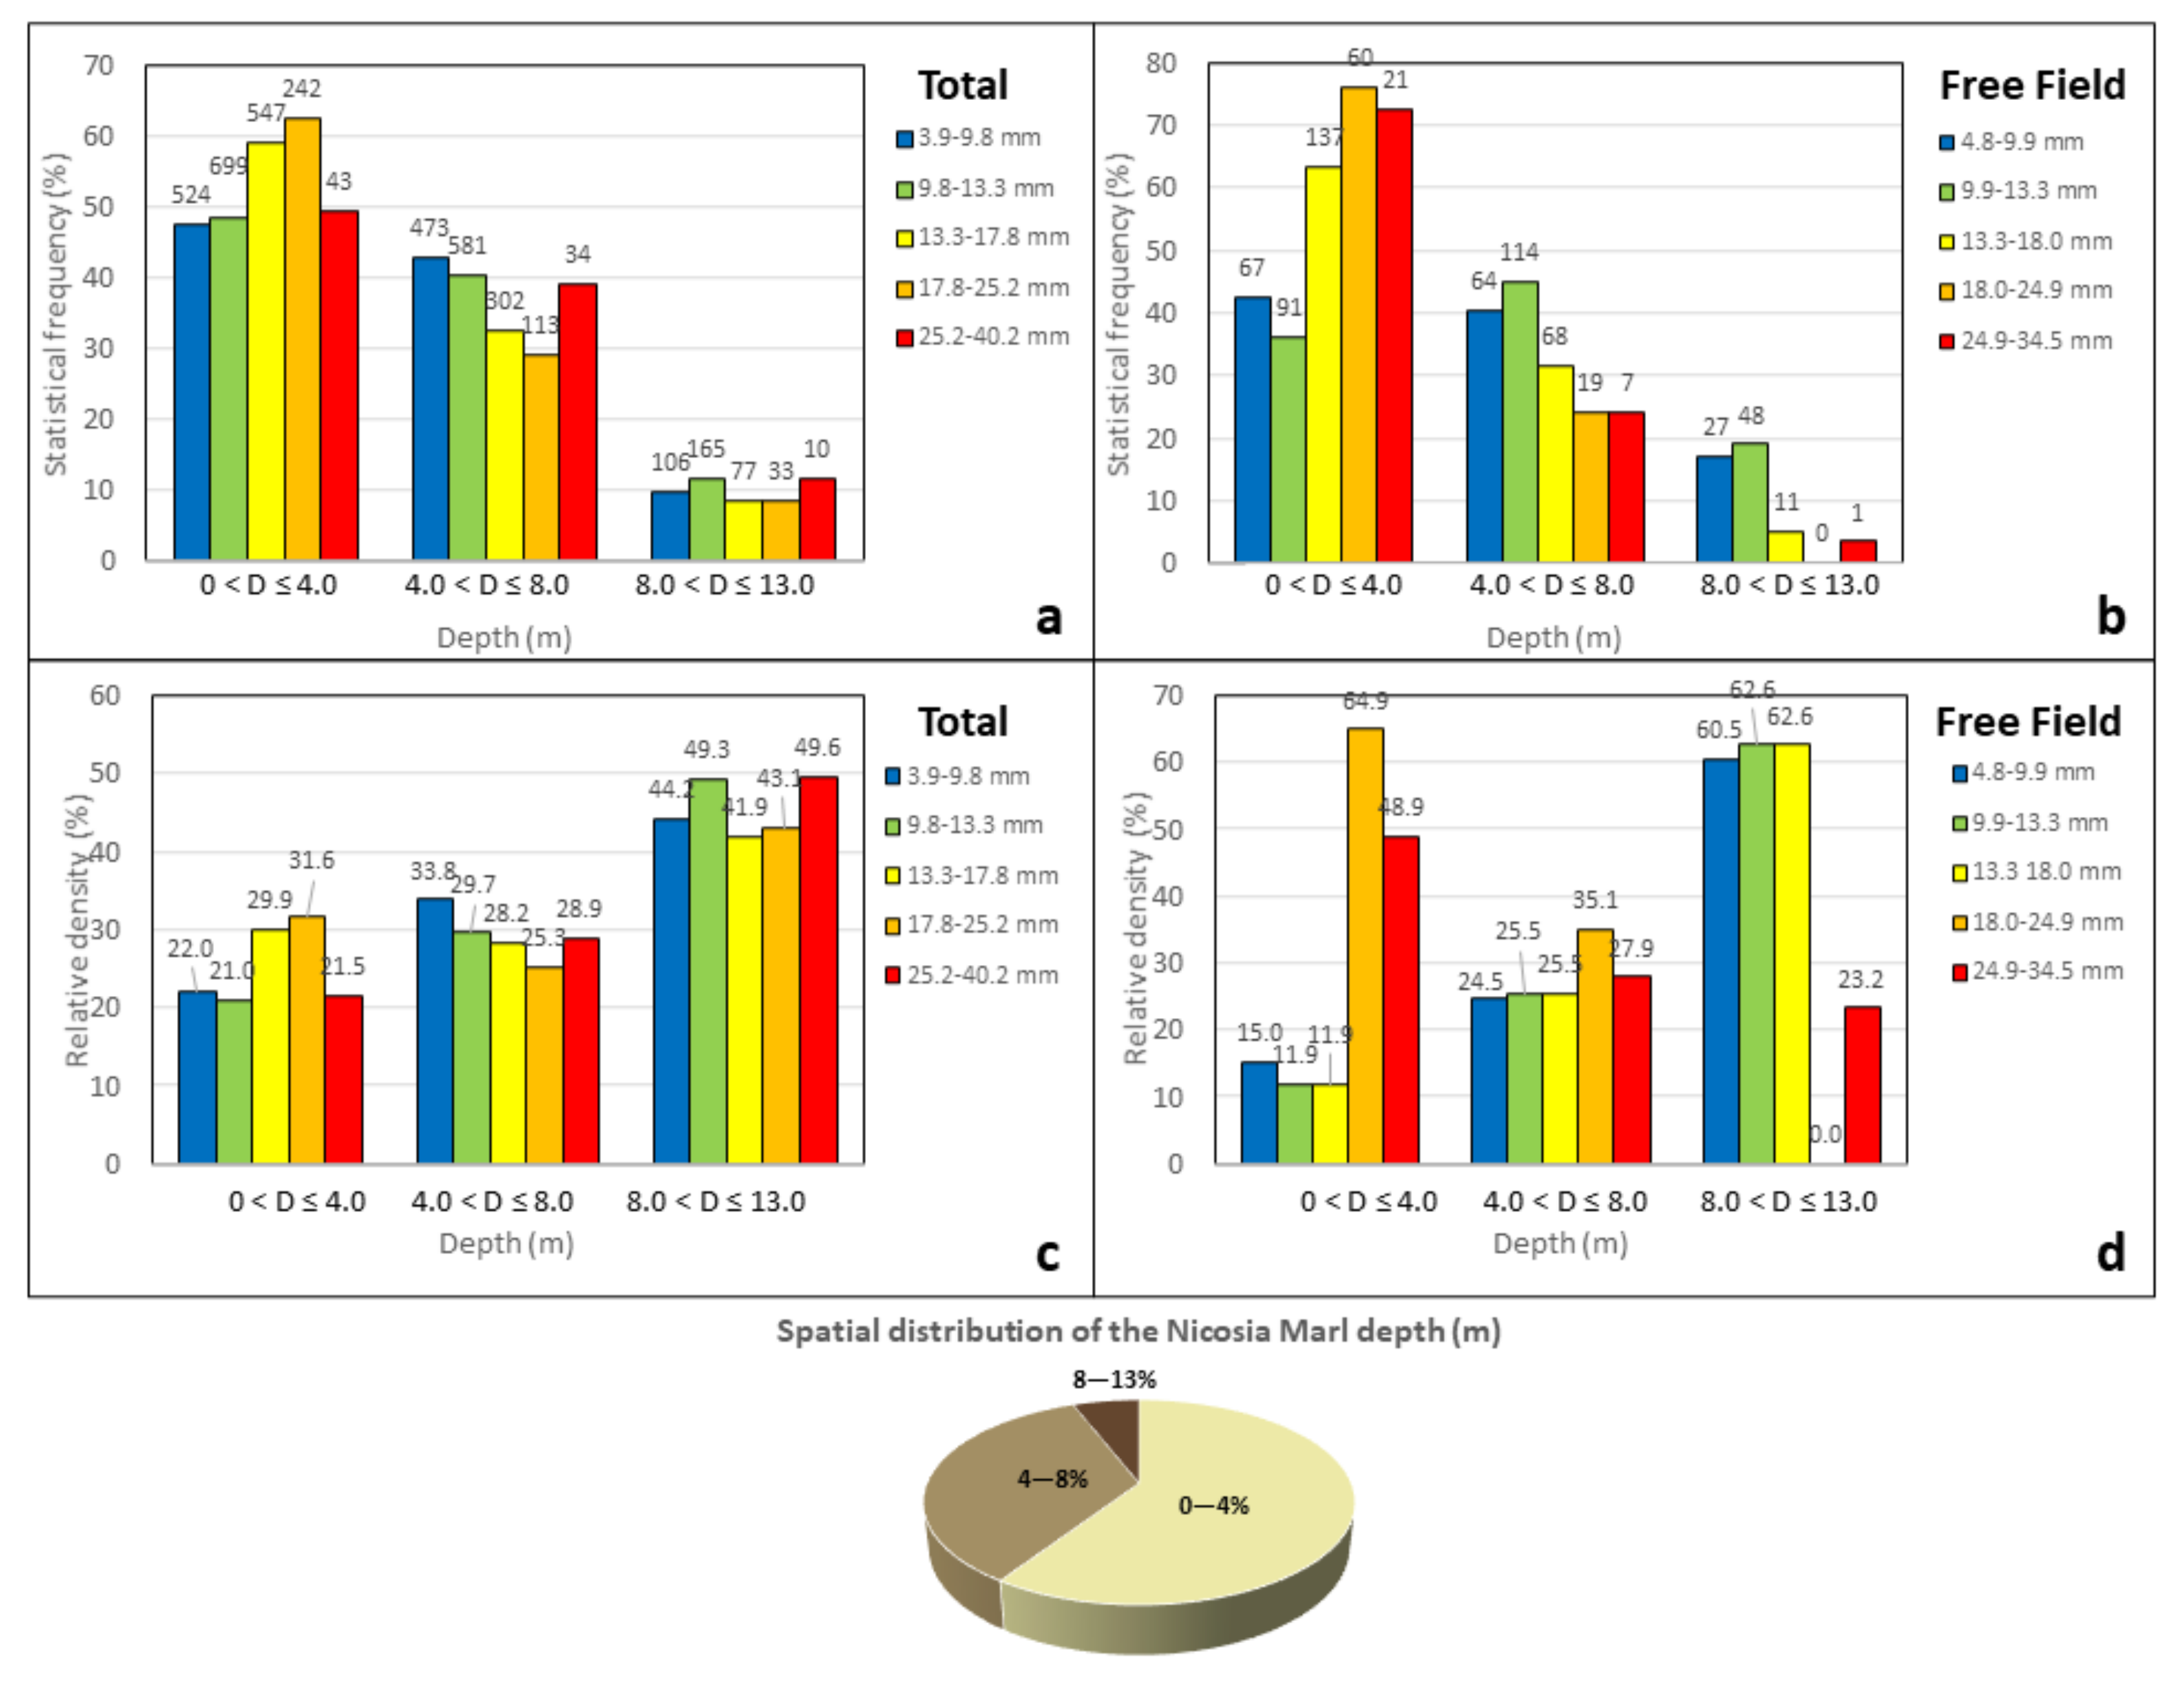
Ιn addition, the depth of the upper boundary of the Nicosia marl (
Figure 13d) gives an equally strong correlation with the clay content. Generally, the relative density of the highest amplitude displacement decreases from 48.9% to 23% as the Nicosia marl depth increase up to 8 m. On the contrary, the relative density of the lower amplitude displacement increases proportional to the Nicosia marl depth. Comparing the figures of the total points (
Figure 13a,c) with free field points (
Figure 13b,d), it is obvious that in latter case the correlation with the Nicosia marl depth is much clearer.
5.2. Lasso Regression Analysis
In previous section, the factors controlling ground swelling/shrinkage were investigated by considering each time a single causal variable without taking into account the possible interplay between them. In this paragraph, we fit a linear equation in which all the factors that play an important role in the activation of this phenomenon (Plasticity Index, Clay content, Montmorillonite content, depth of the Nicosia marl) were combined. The Nicosia marl thickness inside the active zone was not considered in this equation since it is firmly correlated with the upper boundary depth (i.e., the thickness of the non-expansive soil cover). After the normalization of each causal variable based on its minimum to maximum range, the linear equation was formulated as follows:
where
AVM is the amplitude of vertical movement for either total or free field PS points (in mm),
PI is the Plasticity Index (%),
CL is the Clay content (%),
MN is the Montmorillonite content (%) and
DP is the upper boundary depth of the Nicosia marl layer (in m).
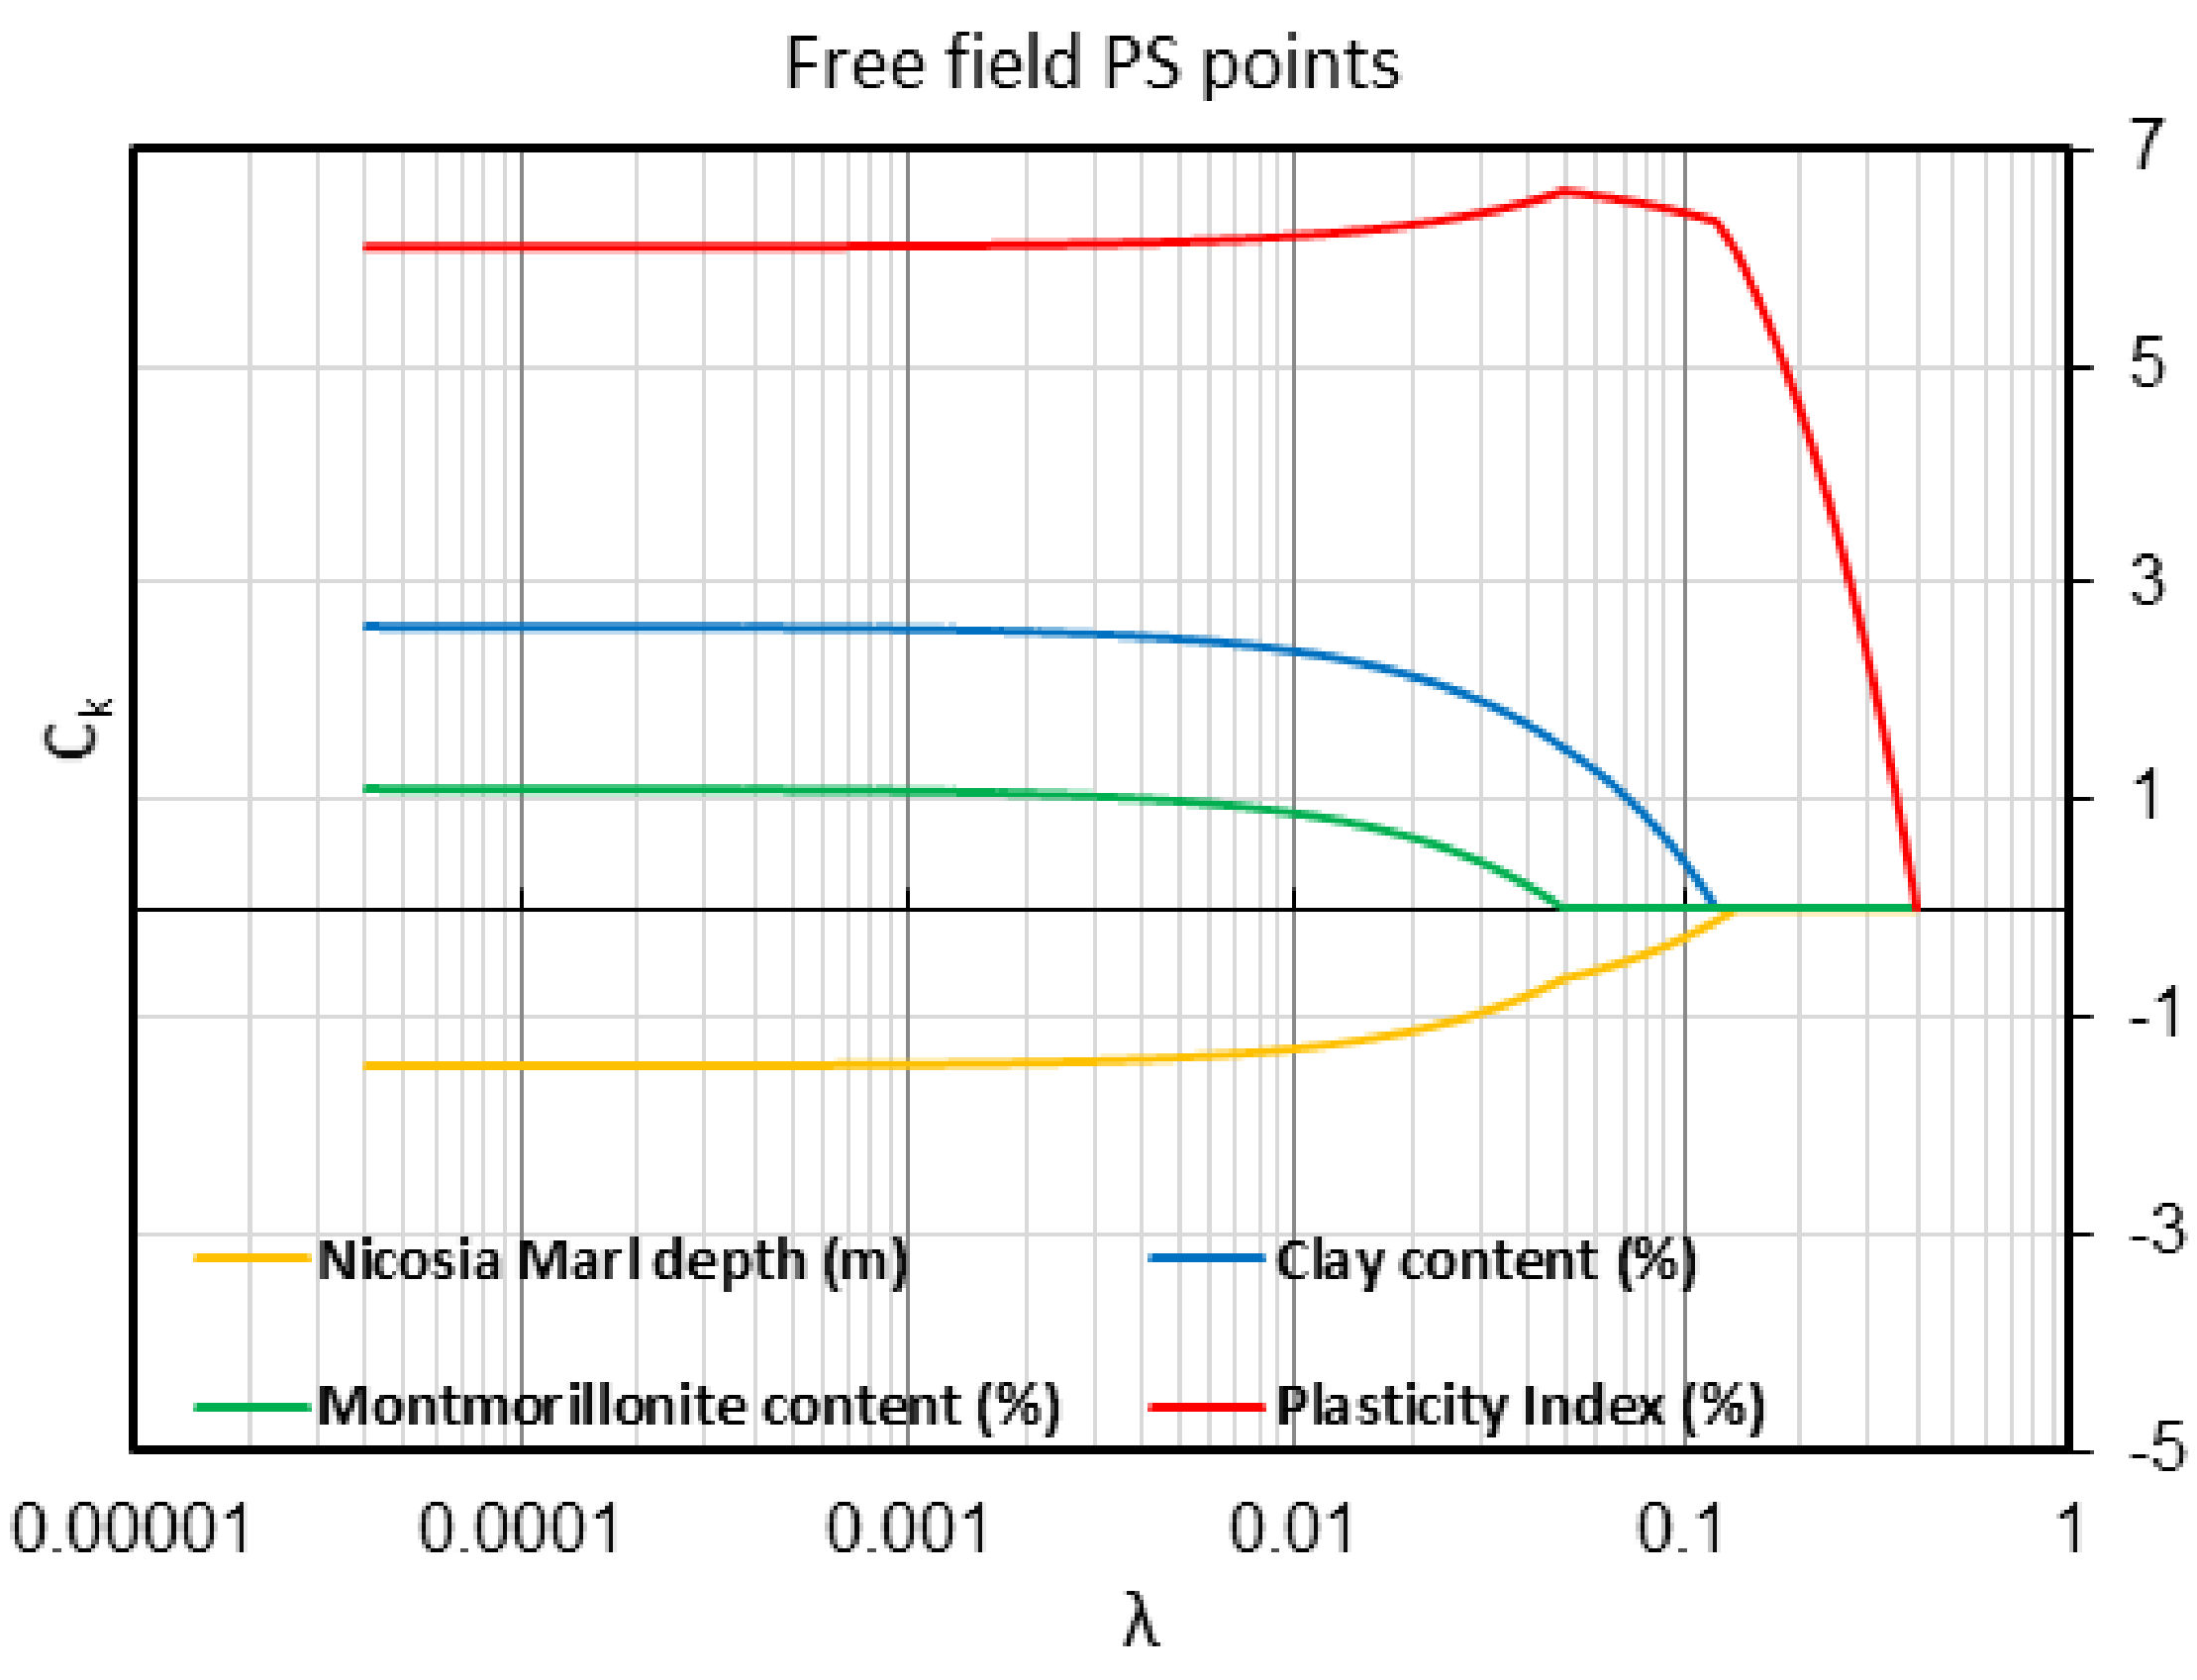
The main goal of the linear equation was to investigate the degree of influence of the causal factors by ranking them in accordance to their importance. To achieve this, the Lasso regression analysis was performed using the pertinent built-in function in MATLAB. In this method, a penalty term, which is the sum of the absolute values of the linear equation coefficients C
k (k = 1,2…n) times a user specified multiplier λ (i.e., λΣ|C
k|), is inserted in the objective function [
31]. As λ increased, the equations coefficients became seriatim zero and causal factors are effectively removed from the equation. The larger the λ for which C
k becomes zero (threshold value λ
T), the greater is the importance of the respective variable.
Figure 14 presents the evolution of the coefficients Ck with increasing λ. It can be seen that the plasticity index drops last out of the linear equation and is thus judged as the most important parameter controlling the phenomenon of ground heave/settlement.
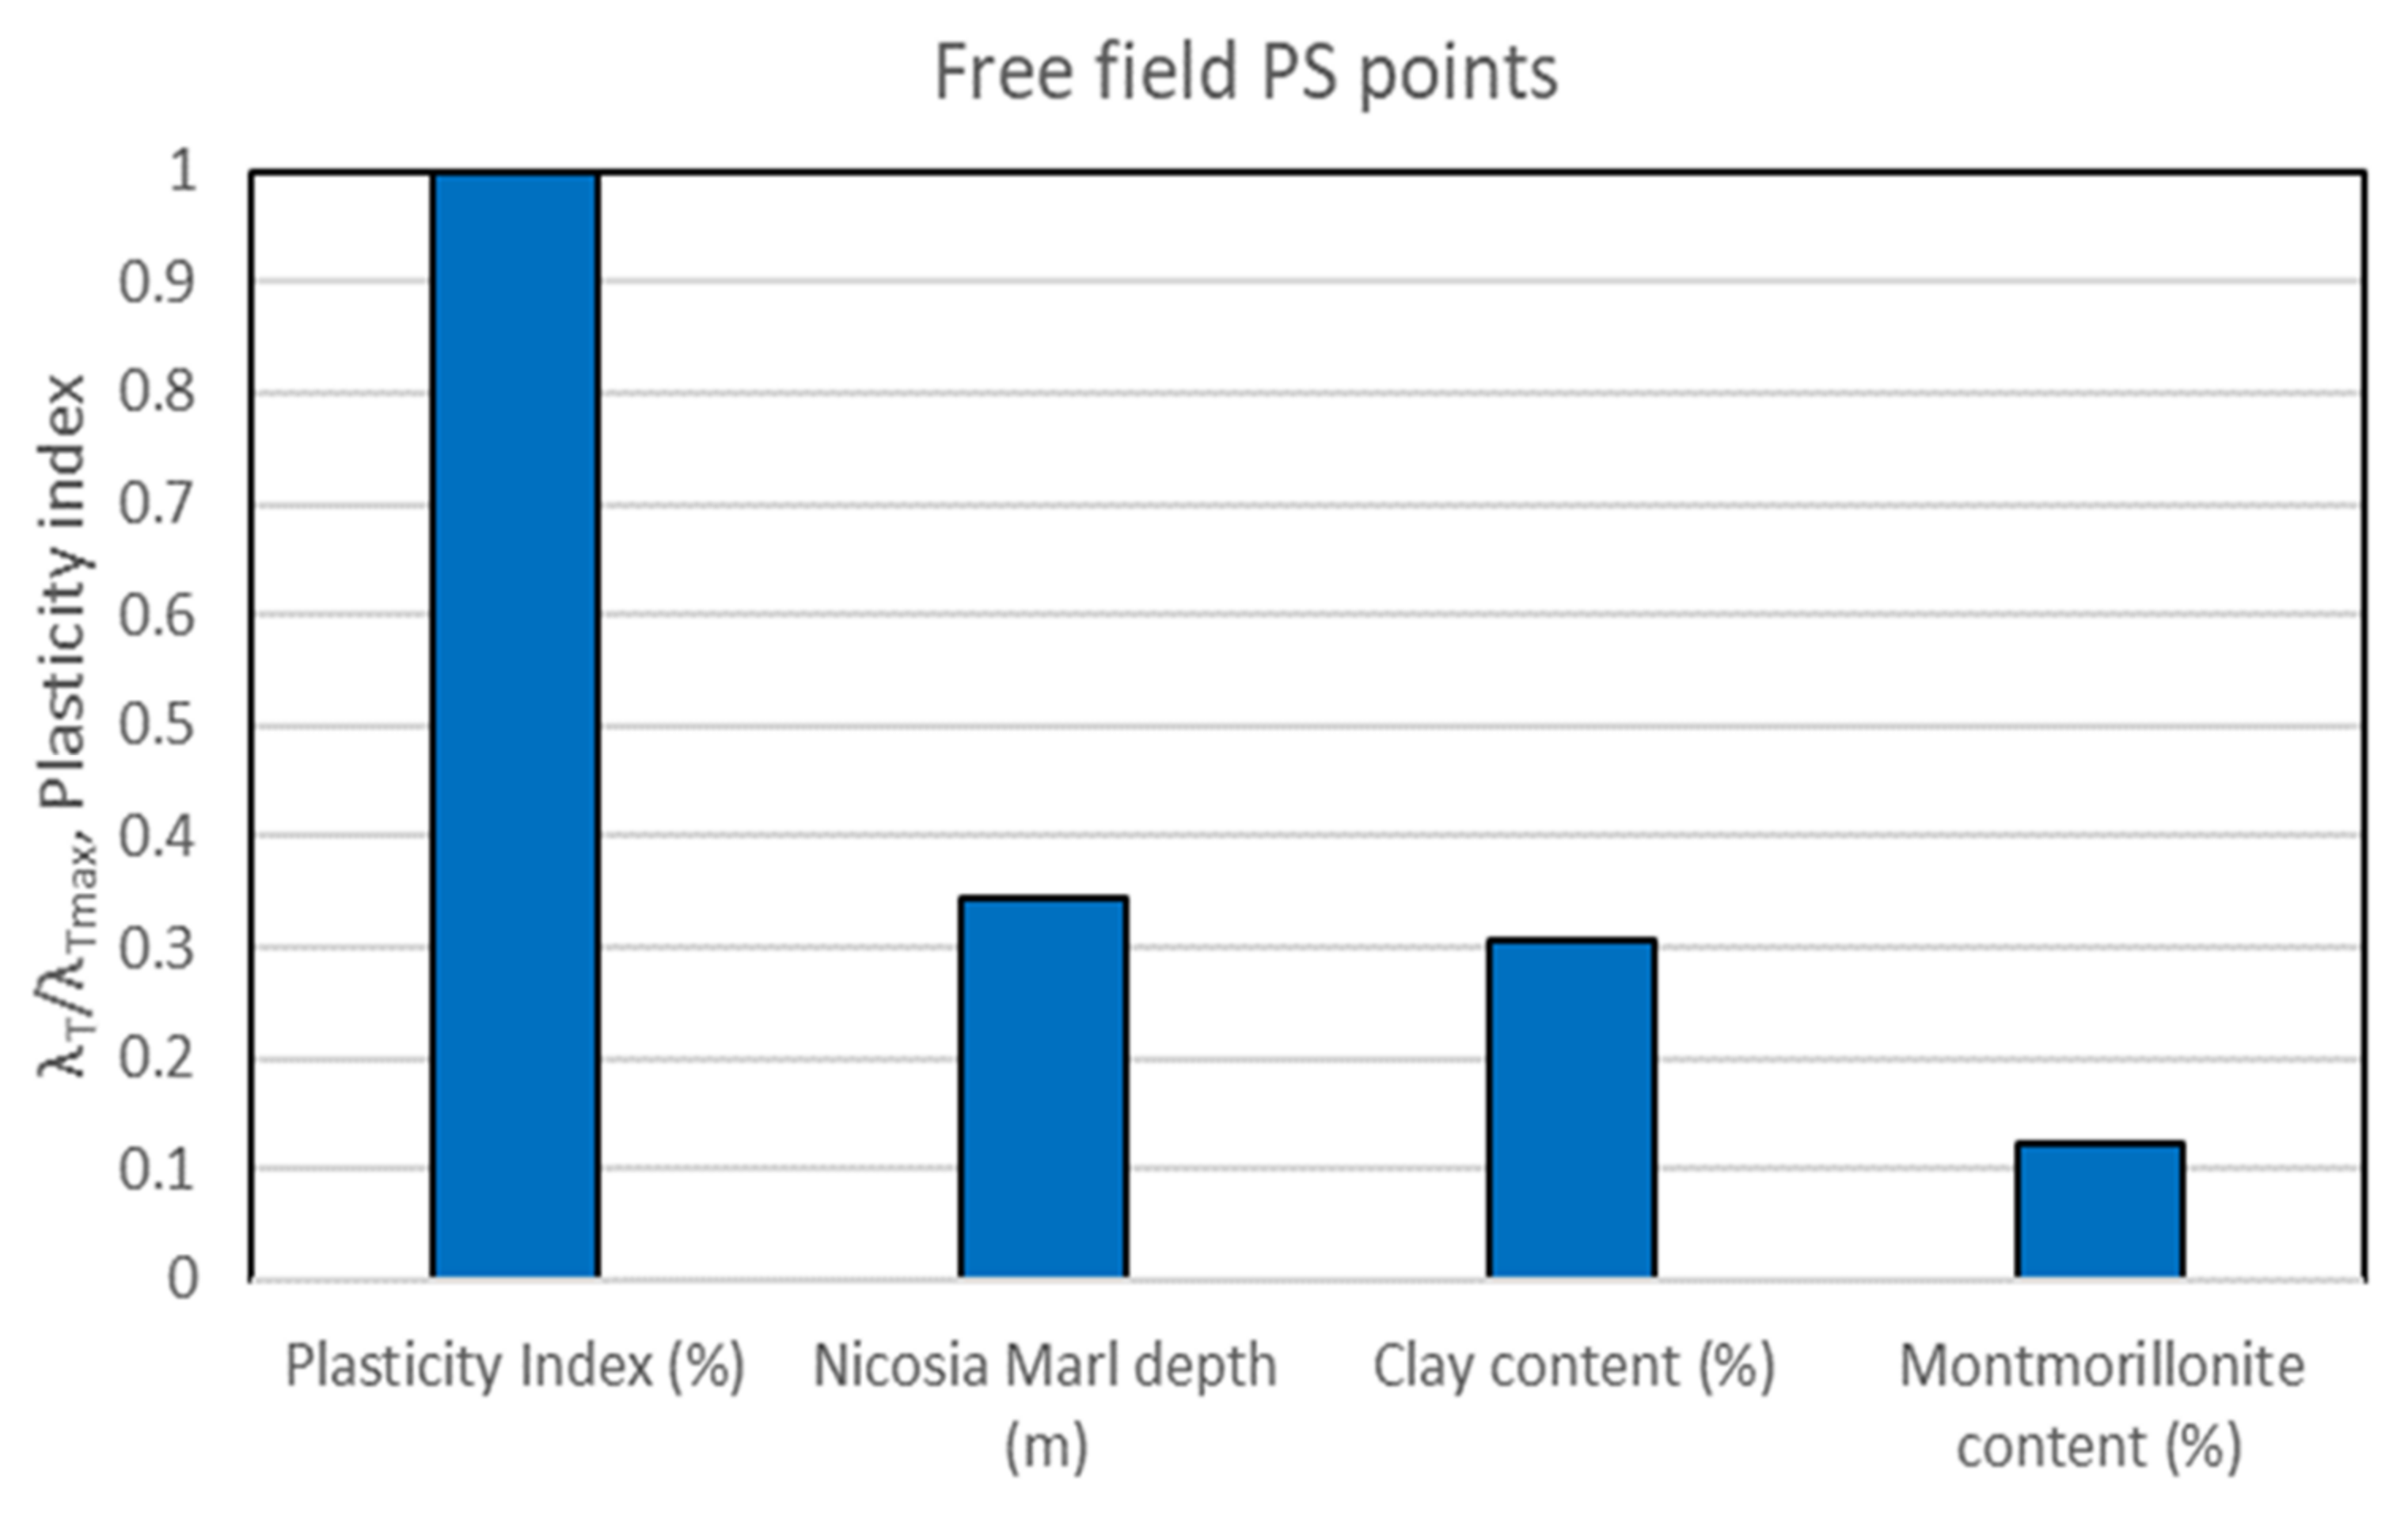
Figure 15 shows the λ
T values (values at which the C
k = 0) normalized with respect to the λ
T for the plasticity index, thus quantifying the relative importance of each variable. The plasticity index turns out to be by far the most important variable, followed by the marl depth and the clay content.
6. Discussion
The investigation of this phenomenon through the EO technologies presents some inherent difficulties. Firstly, the creation of time series with the average vertical displacements per year could not provide us with meaningful conclusions due to the repeated small amount of swelling followed by shrinkage on a yearly basis. Secondly, the magnitude of the vertical displacement is affected the pressures applied by the structures. Therefore, in an urban environment where high rise buildings coexist with smaller ones and buildings with shallow foundations coexist with buildings founded on piles (in which case the vertical movement of the superstructure is drastically limited), the SAR data should be treated with great caution. In order to overcome the above weaknesses, this research relied on estimates of the vertical movement amplitude, in the form of the difference between the maximum and minimum displacement observed in a given time period, calculated for each PS point. This way, the intensity of the vertical deformation fluctuations (and not their tendency) becomes evident. Furthermore, the PS points that did not belong to buildings were selected and treated separately as free field points aiming to mitigate the fact that ground movements depend on the applied vertical stress.
Based on the Interferometric Synthetic Aperture Radar (InSAR) data from the PanGeo project between 16 November 2002 and 30 December 2006, it was found that the seasonal fluctuations of the ground surface are of the order of a few tens of millimeters, with a maximum value of the order of 30–35 mm. This amplitude is clearly larger than the 5 mm to 10 mm observed in regions of France [
25,
26], signifying the highly expansive nature of the Nicosia marl in conjunction with the arid climate of Cyprus. Nonetheless, the value of 30–35 mm is not far from the 20–25 mm amplitude observed in eastern parts of Paris where severe damages to buildings due to soil swelling/shrinkage frequently occur [
27]. It should be stressed that the vertical displacement amplitudes are similar both throughout the examined 4-year period and for each hydrological year separately. This observation confirms the periodicity of the phenomenon and indicates that the main cause of ground volume changes is the seasonal fluctuation of ground moisture inside the active zone of Nicosia marl due to the climatic factors (precipitation, temperature, sunlight, wind). Furthermore, as presented in
Figure 8, the ground heave follows the periods of heavy precipitation with a delay of two to four months. This observation suggests that ground wetting in Nicosia marl happens slowly and abrupt activations are not expected (in the absence of other triggering factors). Nonetheless, a monotonic trend in the vertical displacement (subsidence) can also be noted in
Figure 8, which extends from the middle of the 2nd hydrological year to the end of the examined time period. Given that the water table in the study area is not exploited and lies very deep in the largest part (and, thus, is largely unaffected by the atmospheric factors), this non-periodic subsidence can be attributed to the differences between each year in the total amount of precipitation that occurs during the months in which the evapotranspiration is small (i.e., the winter months).
From the geotechnical point of view, the vertical displacements amplitudes appear to correlate well with the thematic layers of plasticity index and clay content. A similarly strong correlation is observed between the average vertical displacement rate and the clay content in the upper 1m of the soil profile in large regions of Australia [
57]. These observations are in good agreement with numerous laboratory studies, which corelate the swelling pressure (the pressure required to hold the soil, or restore the soil, to its initial void ratio when given access to water) to soil plasticity and clay content [
58,
59]. Nonetheless, future research could also examine other factors that are known to affect this phenomenon, such as liquid limit and dry unit weight.
Statistical analysis shows that strong and meaningful correlations can be established between ground movement amplitude and the causal factors (plasticity index, clay content, montmorillonite content, marl thickness inside the active zone and depth of its upper boundary), provided that PS points that are located on buildings are excluded and only “free-field” PS points are retained in the dataset. Lasso regression reveals that the most important variable controlling the amplitude of ground heave and settlement is the marl’s plasticity index, followed by the depth of the upper boundary of the marl layer (i.e., the thickness of the non-expansive soil cover) and the clay content. Yet, it must be pointed out that this study relied on a geotechnical data from boreholes that are sparsely and unevenly distributed. The present findings could be reinforced by applying the proposed approach to a region with a denser and more evenly spaced cloud of points of geotechnical data.
7. Conclusions
The research work presented herein had a goal to develop a methodological approach for investigating the phenomenon of ground swelling/shrinkage due to seasonal moisture changes in an expansive clay formation. This methodology was based on the integration of EO technologies (InSAR techniques), pre-existing local data and experience, conventional geotechnical research and the use of statistical analysis within a GIS environment. The study area is the city of Nicosia, in which an expansive soil formation, called Nicosia marl, dominates the surficial geology. The spatial correlation of seasonal heave/settlement of Nicosia marl with its physical characteristics was investigated using available geological/geotechnical data and InSAR ground motion measurements. It was found that the seasonal fluctuations of the ground surface are of the order of a few tens of millimeters, with maximum value of the order of 30–35 mm. Statistical analysis shows that there is significant correlation between all causal factors examined, namely plasticity index, clay content, montmorillonite conte, marl thickness and thickness of non-expansive cover, provided that PS points that are located on buildings are excluded and only “free-field” PS points are retained in the dataset. Lasso regression reveals that the most important variable controlling the amplitude of ground heave settlement is the marl’s plasticity index, followed by the thickness of the non-expansive cover.
This study presented a new methodological approach for the investigation of ground movement without a characteristic trend (such as land subsidence due to the overexploitation of the aquifer), highlighting the important role of EO technologies as a useful tool for the assessment of ground deformation. The use of the vertical deformation amplitude instead of the velocity can limit the weaknesses of PS data and, provided that the quality of the geotechnical thematic layers is high, the results can be rewarding. The methods and findings of the present study could be applied in other regions around the world that suffer from the adverse effects of expansive soils, helping the state authorities and other policy makers in planning future urban development and the maintenance of existing infrastructure.


