Next Issue
Volume 14, April-1
Previous Issue
Volume 14, March-1
 
 
remotesensing-logo

Journal Browser

Journal Browser

Remote Sens., Volume 14, Issue 6 (March-2 2022) – 227 articles

Cover Story (view full-size image): 
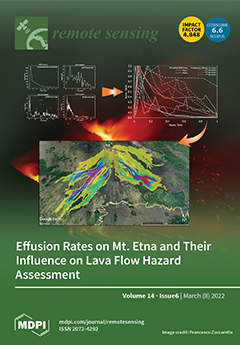
A statistical analysis of the effusion rate of recent flank eruptions at Mt Etna was performed, finding that most peaks occur at the beginning of eruptions, between 0.5% and 29% of the total duration, followed by a progressive decrease. Three generalized curves were derived through the calculation of the 25th, 50th, and 75th percentiles linked to the distribution of peaks and slope variations. Lava flow simulations were run by using each characteristic curve to quantify the differences in run-out distance, proving that an early incidence of the effusion rate peak can induce variations up to 40%. Our tests highlights how effusion rate strongly influences the emplacement of lava flow fields, with significant repercussion both on long- and short-term hazard assessment associated with effusive eruptions. View this paper
  • Issues are regarded as officially published after their release is announced to the table of contents alert mailing list.
  • You may sign up for e-mail alerts to receive table of contents of newly released issues.
  • PDF is the official format for papers published in both, html and pdf forms. To view the papers in pdf format, click on the "PDF Full-text" link, and use the free Adobe Reader to open them.
Order results
Result details
Section
Select all
Export citation of selected articles as:
19 pages, 5182 KiB  
Article
Retrieving the Infected Area of Pine Wilt Disease-Disturbed Pine Forests from Medium-Resolution Satellite Images Using the Stochastic Radiative Transfer Theory
by Xiaoyao Li, Tong Tong, Tao Luo, Jingxu Wang, Yueming Rao, Linyuan Li, Decai Jin, Dewei Wu and Huaguo Huang
Remote Sens. 2022, 14(6), 1526; https://doi.org/10.3390/rs14061526 - 21 Mar 2022
Cited by 7 | Viewed by 2452
Abstract
Pine wilt disease (PWD) is a global destructive threat to forests which has been widely spread and has caused severe tree mortality all over the world. It is important to establish an effective method for forest managers to detect the infected area in [...] Read more.
Pine wilt disease (PWD) is a global destructive threat to forests which has been widely spread and has caused severe tree mortality all over the world. It is important to establish an effective method for forest managers to detect the infected area in a large region. Remote sensing is a feasible tool to detect PWD, but the traditional empirical methods lack the ability to explain the signals and can hardly be extended to large scales. The studies using physically-based models either ignore the within-canopy heterogeneity or rely too much on prior knowledge. In this study, we propose an approach to retrieve PWD infected areas from medium-resolution satellite images of two phases based on the simulations of an extended stochastic radiative transfer model for forests infected by pests (SRTP). A small amount of prior knowledge was used, and a change of background soil was considered in this approach. The performance was evaluated in different study sites. The inversion method performs best in the three-dimensional model LESS simulation sample plots (R2 = 0.88, RMSE = 0.059), and the inversion accuracy decreases in the real forest sample plots. For Jiangxi masson pine stand with large coverage and serious damage, R2 = 0.57, RMSE = 0.074; and for Shandong black pine stand with sparse and a small number of single plant damage, R2 = 0.48, RMSE = 0.063. This study indicates that the SRTP model is more feasible for pest damage inversion over different regions compared with empirical methods. The stochastic radiative transfer theory provides a potential approach for future monitoring of terrestrial vegetation parameters. Full article
(This article belongs to the Special Issue Forest Disturbance Monitoring Using Satellite Remote Sensing)
Show Figures

Figure 1

16 pages, 12058 KiB  
Article
Recursive Enhancement of Weak Subsurface Boundaries and Its Application to SHARAD Data
by Peng Fang and Jinhai Zhang
Remote Sens. 2022, 14(6), 1525; https://doi.org/10.3390/rs14061525 - 21 Mar 2022
Cited by 3 | Viewed by 1824
Abstract
Sedimentary layers are composed of alternately deposited compositions in different periods, reflecting the geological evolution history of a planet. Orbital radar can detect sedimentary layers, but the radargram is contaminated by varying background noise levels. Traditional denoising methods, such as median filter, have [...] Read more.
Sedimentary layers are composed of alternately deposited compositions in different periods, reflecting the geological evolution history of a planet. Orbital radar can detect sedimentary layers, but the radargram is contaminated by varying background noise levels. Traditional denoising methods, such as median filter, have difficulty dealing with such kinds of noise. We propose a recursive signal enhancement scheme to identify weak reflections from intense background noise. Numerical experiments with synthetic data and SHARAD radargrams illustrate that the proposed method can enhance the clarity of the radar echoes and reveal delicate sedimentary structures previously buried in the background noise. The denoising result presents better horizontal continuity and higher vertical resolution compared with those of the traditional methods. Full article
Show Figures

Graphical abstract

19 pages, 5202 KiB  
Article
Classification of Tree Species in Different Seasons and Regions Based on Leaf Hyperspectral Images
by Rongchao Yang and Jiangming Kan
Remote Sens. 2022, 14(6), 1524; https://doi.org/10.3390/rs14061524 - 21 Mar 2022
Cited by 3 | Viewed by 2169
Abstract
This paper aims to establish a tree species identification model suitable for different seasons and regions based on leaf hyperspectral images, and to mine a more effective hyperspectral identification algorithm. Firstly, the reflectance spectra of leaves in different seasons and regions were analyzed. [...] Read more.
This paper aims to establish a tree species identification model suitable for different seasons and regions based on leaf hyperspectral images, and to mine a more effective hyperspectral identification algorithm. Firstly, the reflectance spectra of leaves in different seasons and regions were analyzed. Then, to solve the problem that 0-element in sparse random (SR) coding matrices affects the classification performance of error-correcting output codes (ECOC), two versions of supervision-mechanism-based ECOC algorithms, namely SM-ECOC-V1 and SM-ECOC-V2, were proposed in this paper. In addition, the performance of the proposed algorithms was compared with that of six traditional algorithms based on all bands and feature bands. The experiment results show that seasonal and regional changes have an effect on the reflectance spectra of leaves, especially in the near-infrared region of 760–1000 nm. When the spectral information of different seasons and different regions is added into the identification model, tree species can be effectively classified. SM-ECOC-V2 achieves the best classification performance based on both all bands and feature bands. Furthermore, both SM-ECOC-V1 and SM-ECOC-V2 outperform the ECOC method under SR coding strategy, indicating the proposed methods can effectively avoid the influence of 0-element in SR coding matrix on classification performance. Full article
(This article belongs to the Topic Artificial Intelligence in Sensors)
Show Figures

Graphical abstract

20 pages, 10127 KiB  
Article
Extraction of Olive Crown Based on UAV Visible Images and the U2-Net Deep Learning Model
by Zhangxi Ye, Jiahao Wei, Yuwei Lin, Qian Guo, Jian Zhang, Houxi Zhang, Hui Deng and Kaijie Yang
Remote Sens. 2022, 14(6), 1523; https://doi.org/10.3390/rs14061523 - 21 Mar 2022
Cited by 33 | Viewed by 7562
Abstract
Olive trees, which are planted widely in China, are economically significant. Timely and accurate acquisition of olive tree crown information is vital in monitoring olive tree growth and accurately predicting its fruit yield. The advent of unmanned aerial vehicles (UAVs) and deep learning [...] Read more.
Olive trees, which are planted widely in China, are economically significant. Timely and accurate acquisition of olive tree crown information is vital in monitoring olive tree growth and accurately predicting its fruit yield. The advent of unmanned aerial vehicles (UAVs) and deep learning (DL) provides an opportunity for rapid monitoring parameters of the olive tree crown. In this study, we propose a method of automatically extracting olive crown information (crown number and area of olive tree), combining visible-light images captured by consumer UAV and a new deep learning model, U2-Net, with a deeply nested structure. Firstly, a data set of an olive tree crown (OTC) images was constructed, which was further processed by the ESRGAN model to enhance the image resolution and was augmented (geometric transformation and spectral transformation) to enlarge the data set to increase the generalization ability of the model. Secondly, four typical subareas (A–D) in the study area were selected to evaluate the performance of the U2-Net model in olive crown extraction in different scenarios, and the U2-Net model was compared with three current mainstream deep learning models (i.e., HRNet, U-Net, and DeepLabv3+) in remote sensing image segmentation effect. The results showed that the U2-Net model achieved high accuracy in the extraction of tree crown numbers in the four subareas with a mean of intersection over union (IoU), overall accuracy (OA), and F1-Score of 92.27%, 95.19%, and 95.95%, respectively. Compared with the other three models, the IoU, OA, and F1-Score of the U2-Net model increased by 14.03–23.97 percentage points, 7.57–12.85 percentage points, and 8.15–14.78 percentage points, respectively. In addition, the U2-Net model had a high consistency between the predicted and measured area of the olive crown, and compared with the other three deep learning models, it had a lower error rate with a root mean squared error (RMSE) of 4.78, magnitude of relative error (MRE) of 14.27%, and a coefficient of determination (R2) higher than 0.93 in all four subareas, suggesting that the U2-Net model extracted the best crown profile integrity and was most consistent with the actual situation. This study indicates that the method combining UVA RGB images with the U2-Net model can provide a highly accurate and robust extraction result for olive tree crowns and is helpful in the dynamic monitoring and management of orchard trees. Full article
(This article belongs to the Special Issue UAV Applications for Forest Management: Wood Volume, Biomass, Mapping)
Show Figures

Figure 1

21 pages, 9232 KiB  
Article
Mapping Canopy Cover in African Dry Forests from the Combined Use of Sentinel-1 and Sentinel-2 Data: Application to Tanzania for the Year 2018
by Astrid Verhegghen, Klara Kuzelova, Vasileios Syrris, Hugh Eva and Frédéric Achard
Remote Sens. 2022, 14(6), 1522; https://doi.org/10.3390/rs14061522 - 21 Mar 2022
Cited by 9 | Viewed by 4994
Abstract
High-resolution Earth observation data is routinely used to monitor tropical forests. However, the seasonality and openness of the canopy of dry tropical forests remains a challenge for optical sensors. In this study, we demonstrate the potential of combining Sentinel-1 (S1) SAR and Sentinel-2 [...] Read more.
High-resolution Earth observation data is routinely used to monitor tropical forests. However, the seasonality and openness of the canopy of dry tropical forests remains a challenge for optical sensors. In this study, we demonstrate the potential of combining Sentinel-1 (S1) SAR and Sentinel-2 (S2) optical sensors in order to map the tree cover in East Africa. The overall methodology consists of: (i) the generation of S1 and S2 layers, (ii) the collection of an expert-based training/validation dataset and (iii) the classification of the satellite data. Three different classification workflows, together with different approaches to incorporating the spatial information to train the classifiers, are explored. Two types of maps were derived from these mapping approaches over Tanzania: (i) binary tree cover–no tree cover (TC/NTC) maps, and (ii) maps of the canopy cover classes. The overall accuracy of the maps is >95% for the TC/NTC maps and >85% for the forest types maps. Considering the neighboring pixels for training the classification improved the mapping of the areas that are covered by 1–10% tree cover. The study relied on open data and publicly available tools and can be integrated into national monitoring systems. Full article
(This article belongs to the Special Issue Accelerating REDD+ Initiatives in Africa Using Remote Sensing)
Show Figures

Graphical abstract

20 pages, 7070 KiB  
Article
Simulation of Soil Organic Carbon Content Based on Laboratory Spectrum in the Three-Rivers Source Region of China
by Wei Zhou, Haoran Li, Shiya Wen, Lijuan Xie, Ting Wang, Yongzhong Tian and Wenping Yu
Remote Sens. 2022, 14(6), 1521; https://doi.org/10.3390/rs14061521 - 21 Mar 2022
Cited by 4 | Viewed by 2352
Abstract
Soil organic carbon (SOC) changes affect the land carbon cycle and are also closely related to climate change. Visible-near infrared spectroscopy (Vis-NIRS) has proven to be an effective tool in predicting soil properties. Spectral transformations are necessary to reduce noise and ensemble learning [...] Read more.
Soil organic carbon (SOC) changes affect the land carbon cycle and are also closely related to climate change. Visible-near infrared spectroscopy (Vis-NIRS) has proven to be an effective tool in predicting soil properties. Spectral transformations are necessary to reduce noise and ensemble learning methods can improve the estimation accuracy of SOC. Yet, it is still unclear which is the optimal ensemble learning method exploiting the results of spectral transformations to accurately simulate SOC content changes in the Three-Rivers Source Region of China. In this study, 272 soil samples were collected and used to build the Vis-NIRS simulation models for SOC content. The ensemble learning was conducted by the building of stack models. Sixteen combinations were produced by eight spectral transformations (S-G, LR, MSC, CR, FD, LRFD, MSCFD and CRFD) and two machine learning models of RF and XGBoost. Then, the prediction results of these 16 combinations were used to build the first-step stack models (Stack1, Stack2, Stack3). The next-step stack models (Stack4, Stack5, Stack6) were then made after the input variables were optimized based on the threshold of the feature importance of the first-step stack models (importance > 0.05). The results in this study showed that the stack models method obtained higher accuracy than the single model and transformations method. Among the six stack models, Stack 6 (5 selected combinations + XGBoost) showed the best simulation performance (RMSE = 7.3511, R2 = 0.8963, and RPD = 3.0139, RPIQ = 3.339), and obtained higher accuracy than Stack3 (16 combinations + XGBoost). Overall, our results suggested that the ensemble learning of spectral transformations and simulation models can improve the estimation accuracy of the SOC content. This study can provide useful suggestions for the high-precision estimation of SOC in the alpine ecosystem. Full article
Show Figures

Figure 1

23 pages, 7549 KiB  
Article
Using Augmented and Virtual Reality (AR/VR) to Support Safe Navigation on Inland and Coastal Water Zones
by Tomasz Templin, Dariusz Popielarczyk and Marcin Gryszko
Remote Sens. 2022, 14(6), 1520; https://doi.org/10.3390/rs14061520 - 21 Mar 2022
Cited by 14 | Viewed by 5455
Abstract
The aim of this research is to propose a new solution to assist sailors in safe navigation on inland shallow waters by using Augmented and Virtual Reality. Despite continuous progress in the methodology of displaying bathymetric data and 3D models of the bottoms, [...] Read more.
The aim of this research is to propose a new solution to assist sailors in safe navigation on inland shallow waters by using Augmented and Virtual Reality. Despite continuous progress in the methodology of displaying bathymetric data and 3D models of the bottoms, there is still a lack of solutions promoting these data and their widespread use. Most existing products present navigation content on 2D/3D maps onscreen. Augmented Reality (AR) technology revolutionises the way digital content is displayed. This paper presents the solution for the use of AR on inland and coastal waterways to increase the safety of sailing and other activities on the water (diving, fishing, etc.). The real-time capability of AR in the proposed mobile application also allows other users to be observed on the water in limited visibility and even at night. The architecture and the prototype Mobile Augmented Reality (MAR) applications are presented. The required AR, including the preparation methodology supported by the Virtual Reality Geographic Information System (VRGIS), is also shown. The prototype’s performance has been validated in water navigation, specifically for exemplary lakes of Warmia and Mazury in Poland. The performed tests showed the great usefulness of AR in the field of content presentation during the navigation process. Full article
(This article belongs to the Special Issue Advances in Remote Sensing of the Inland and Coastal Water Zones)
Show Figures

Graphical abstract

23 pages, 42852 KiB  
Article
Projections of Climate Change Impacts on Flowering-Veraison Water Deficits for Riesling and Müller-Thurgau in Germany
by Chenyao Yang, Christoph Menz, Maxim Simões De Abreu Jaffe, Sergi Costafreda-Aumedes, Marco Moriondo, Luisa Leolini, Arturo Torres-Matallana, Daniel Molitor, Jürgen Junk, Helder Fraga, Cornelis van Leeuwen and João A. Santos
Remote Sens. 2022, 14(6), 1519; https://doi.org/10.3390/rs14061519 - 21 Mar 2022
Cited by 7 | Viewed by 3073
Abstract
With global warming, grapevine is expected to be increasingly exposed to water deficits occurring at various development stages. In this study, we aimed to investigate the potential impacts of projected climate change on water deficits from the flowering to veraison period for two [...] Read more.
With global warming, grapevine is expected to be increasingly exposed to water deficits occurring at various development stages. In this study, we aimed to investigate the potential impacts of projected climate change on water deficits from the flowering to veraison period for two main white wine cultivars (Riesling and Müller-Thurgau) in Germany. A process-based soil-crop model adapted for grapevine was utilized to simulate the flowering-veraison crop water stress indicator (CWSI) of these two varieties between 1976–2005 (baseline) and 2041–2070 (future period) based on a suite of bias-adjusted regional climate model (RCM) simulations under RCP4.5 and RCP8.5. Our evaluation indicates that the model can capture the early-ripening (Müller-Thurgau) and late-ripening (Riesling) traits, with a mean bias of prediction of ≤2 days and a well-reproduced inter-annual variability for more than 60 years. Under climate projections, the flowering stage is advanced by 10–20 days (higher in RCP8.5) between the two varieties, whereas a slightly stronger advancement is found for Müller-Thurgau than for Riesling for the veraison stage. As a result, the flowering-veraison phenophase is mostly shortened for Müller-Thurgau, whereas it is extended by up to two weeks for Riesling in cool and high-elevation areas. The length of phenophase plays an important role in projected changes of flowering-veraison mean temperature and precipitation. The late-ripening trait of Riesling makes it more exposed to increased summer temperature (mainly in August), resulting in a higher mean temperature increase for Riesling (1.5–2.5 °C) than for Müller-Thurgau (1–2 °C). As a result, an overall increased CWSI by up to 15% (ensemble median) is obtained for both varieties, whereas the upper (95th) percentile of simulations shows a strong signal of increased water deficit by up to 30%, mostly in the current winegrowing regions. Intensified water deficit stress can represent a major threat for high-quality white wine production, as only mild water deficits are acceptable. Nevertheless, considerable variabilities of CWSI were discovered among RCMs, highlighting the importance of efforts towards reducing uncertainties in climate change impact assessment. Full article
Show Figures

Figure 1

28 pages, 24789 KiB  
Review
Giant Planet Atmospheres: Dynamics and Variability from UV to Near-IR Hubble and Adaptive Optics Imaging
by Amy A. Simon, Michael H. Wong, Lawrence A. Sromovsky, Leigh N. Fletcher and Patrick M. Fry
Remote Sens. 2022, 14(6), 1518; https://doi.org/10.3390/rs14061518 - 21 Mar 2022
Cited by 5 | Viewed by 4845
Abstract
Each of the giant planets, Jupiter, Saturn, Uranus, and Neptune, has been observed by at least one robotic spacecraft mission. However, these missions are infrequent; Uranus and Neptune have only had a single flyby by Voyager 2. The Hubble Space Telescope, particularly the [...] Read more.
Each of the giant planets, Jupiter, Saturn, Uranus, and Neptune, has been observed by at least one robotic spacecraft mission. However, these missions are infrequent; Uranus and Neptune have only had a single flyby by Voyager 2. The Hubble Space Telescope, particularly the Wide Field Camera 3 (WFC3) and Advanced Camera for Surveys (ACS) instruments, and large ground-based telescopes with adaptive optics systems have enabled high-spatial-resolution imaging at a higher cadence, and over a longer time, than can be achieved with targeted missions to these worlds. These facilities offer a powerful combination of high spatial resolution, often <0.05”, and broad wavelength coverage, from the ultraviolet through the near infrared, resulting in compelling studies of the clouds, winds, and atmospheric vertical structure. This coverage allows comparisons of atmospheric properties between the planets, as well as in different regions across each planet. Temporal variations in winds, cloud structure, and color over timescales of days to years have been measured for all four planets. With several decades of data already obtained, we can now begin to investigate seasonal influences on dynamics and aerosol properties, despite orbital periods ranging from 12 to 165 years. Future facilities will enable even greater spatial resolution and, combined with our existing long record of data, will continue to advance our understanding of atmospheric evolution on the giant planets. Full article
(This article belongs to the Special Issue Remote Sensing Observations of the Giant Planets)
Show Figures

Figure 1

20 pages, 2795 KiB  
Article
A GNSS/5G Integrated Three-Dimensional Positioning Scheme Based on D2D Communication
by Wei Zhang, Yuanxi Yang, Anmin Zeng and Yangyin Xu
Remote Sens. 2022, 14(6), 1517; https://doi.org/10.3390/rs14061517 - 21 Mar 2022
Cited by 8 | Viewed by 2730
Abstract
The fifth generation (5G) communication has the potential to achieve ubiquitous positioning when integrated with a global navigation satellite system (GNSS). The device-to-device (D2D) communication, serving as a key technology in the 5G network, provides the possibility of cooperative positioning with high-density property. [...] Read more.
The fifth generation (5G) communication has the potential to achieve ubiquitous positioning when integrated with a global navigation satellite system (GNSS). The device-to-device (D2D) communication, serving as a key technology in the 5G network, provides the possibility of cooperative positioning with high-density property. The mobile users (MUs) collaborate to jointly share the position and measurement information, which can make use of more references for positioning. In this paper, a GNSS/5G integrated three-dimensional positioning scheme based on D2D communication is proposed, where the time of arrival (TOA) and received signal strength (RSS) measurements are jointly utilized in the 5G network. The density spatial clustering of application with noise (DBSCAN) is exploited to reduce the position uncertainty of the cooperative nodes, and the positions of the requesting nodes are obtained simultaneously. The particle filter (PF) algorithm is further conducted to improve the position accuracy of the requesting nodes. Numerical results show that the position deviation of the cooperative nodes can be significantly decreased and that the proposed algorithm performs better than the nonintegrated one. The DBSCAN brings an increase of about 50% in terms of the positioning accuracy compared with GNSS results, and the PF further increases the accuracy about 8%. It is also verified that the algorithm suits the fixed and dynamic condition well. Full article
Show Figures

Figure 1

18 pages, 3031 KiB  
Article
A Supervoxel-Based Random Forest Method for Robust and Effective Airborne LiDAR Point Cloud Classification
by Lingfeng Liao, Shengjun Tang, Jianghai Liao, Xiaoming Li, Weixi Wang, Yaxin Li and Renzhong Guo
Remote Sens. 2022, 14(6), 1516; https://doi.org/10.3390/rs14061516 - 21 Mar 2022
Cited by 14 | Viewed by 3602
Abstract
As an essential part of point cloud processing, autonomous classification is conventionally used in various multifaceted scenes and non-regular point distributions. State-of-the-art point cloud classification methods mostly process raw point clouds, using a single point as the basic unit and calculating point cloud [...] Read more.
As an essential part of point cloud processing, autonomous classification is conventionally used in various multifaceted scenes and non-regular point distributions. State-of-the-art point cloud classification methods mostly process raw point clouds, using a single point as the basic unit and calculating point cloud features by searching local neighbors via the k-neighborhood method. Such methods tend to be computationally inefficient and have difficulty obtaining accurate feature descriptions due to inappropriate neighborhood selection. In this paper, we propose a robust and effective point cloud classification approach that integrates point cloud supervoxels and their locally convex connected patches into a random forest classifier, which effectively improves the point cloud feature calculation accuracy and reduces the computational cost. Considering the different types of point cloud feature descriptions, we divide features into three categories (point-based, eigen-based, and grid-based) and accordingly design three distinct feature calculation strategies to improve feature reliability. Two International Society of Photogrammetry and Remote Sensing benchmark tests show that the proposed method achieves state-of-the-art performance, with average F1-scores of 89.16 and 83.58, respectively. The successful classification of point clouds with great variation in elevation also demonstrates the reliability of the proposed method in challenging scenes. Full article
(This article belongs to the Topic Computational Intelligence in Remote Sensing)
Show Figures

Figure 1

21 pages, 2205 KiB  
Article
Estimating High-Resolution PM2.5 Concentrations by Fusing Satellite AOD and Smartphone Photographs Using a Convolutional Neural Network and Ensemble Learning
by Fei Wang, Shiqi Yao, Haowen Luo and Bo Huang
Remote Sens. 2022, 14(6), 1515; https://doi.org/10.3390/rs14061515 - 21 Mar 2022
Cited by 7 | Viewed by 2617
Abstract
Aerosol optical depth (AOD) data derived from satellite products have been widely used to estimate fine particulate matter (PM2.5) concentrations. However, existing approaches to estimate PM2.5 concentrations are invariably limited by the availability of AOD data, which can be missing [...] Read more.
Aerosol optical depth (AOD) data derived from satellite products have been widely used to estimate fine particulate matter (PM2.5) concentrations. However, existing approaches to estimate PM2.5 concentrations are invariably limited by the availability of AOD data, which can be missing over large areas due to satellite measurements being obstructed by, for example, clouds, snow cover or high concentrations of air pollution. In this study, we addressed this shortcoming by developing a novel method for determining PM2.5 concentrations with high spatial coverage by integrating AOD-based estimations and smartphone photograph-based estimations. We first developed a multiple-input fuzzy neural network (MIFNN) model to measure PM2.5 concentrations from smartphone photographs. We then designed an ensemble learning model (AutoELM) to determine PM2.5 concentrations based on the Collection-6 Multi-Angle Implementation of Atmospheric Correction AOD product. The R2 values of the MIFNN model and AutoELM model are 0.85 and 0.80, respectively, which are superior to those of other state-of-the-art models. Subsequently, we used crowdsourced smartphone photographs obtained from social media to validate the transferability of the MIFNN model, which we then applied to generate smartphone photograph-based estimates of PM2.5 concentrations. These estimates were fused with AOD-based estimates to generate a new PM2.5 distribution product with broader coverage than existing products, equating to an average increase of 12% in map coverage of PM2.5 concentrations, which grows to an impressive 25% increase in map coverage in densely populated areas. Our findings indicate that the robust estimation accuracy of the ensemble learning model is due to its detection of nonlinear correlations and high-order interactions. Furthermore, our findings demonstrate that the synergy of smartphone photograph-based estimations and AOD-based estimations generates significantly greater spatial coverage of PM2.5 distribution than AOD-based estimations alone, especially in densely populated areas where more smartphone photographs are available. Full article
Show Figures

Figure 1

20 pages, 3608 KiB  
Article
Ground Maneuvering Target Focusing via High-Order Phase Correction in High-Squint Synthetic Aperture Radar
by Lei Ran, Zheng Liu and Rong Xie
Remote Sens. 2022, 14(6), 1514; https://doi.org/10.3390/rs14061514 - 21 Mar 2022
Cited by 3 | Viewed by 1841
Abstract
Moving target imaging in high-squint synthetic aperture radar (SAR) shows great potential for reconnaissance and surveillance tasks. For the desired resolution, high-squint SAR has a long-time coherent processing interval (CPI). In this case, the maneuvering motion of the moving target usually causes high-order [...] Read more.
Moving target imaging in high-squint synthetic aperture radar (SAR) shows great potential for reconnaissance and surveillance tasks. For the desired resolution, high-squint SAR has a long-time coherent processing interval (CPI). In this case, the maneuvering motion of the moving target usually causes high-order phase terms in the echoed data, which cannot be neglected for precise focusing. Many ground moving target imaging (GMTIm) algorithms have been proposed in the literature, but some high-order phase terms remain uncompensated in high-squint SAR. For this problem, a high-order phase correction-based GMTIm (HPC-GMTIm) method is proposed in this paper. We assumed that the target of interest has a constant velocity in the subaperture CPI, but maneuvering motion parameters for the whole CPI. Within the short subaperture CPI, the target signal can be simplified as a three-order phase expression, and the instantaneous Doppler frequency (DF) was estimated by some time–frequency analysis tools, including the Hough transform and the fractional Fourier transform. For the whole CPI, the subaperture, the instantaneous DF was combined to form a total least-squares problem, outputting the undetermined phase coefficients. Using the proposed local-to-global processing chain, all high-order phase terms can be estimated and corrected, which outperforms existing methods. The effectiveness of the HPC-GMTIm method is demonstrated by real measured high-squint SAR data. Full article
(This article belongs to the Special Issue Radar High-Speed Target Detection, Tracking, Imaging and Recognition)
Show Figures

Figure 1

22 pages, 2443 KiB  
Article
Unsupervised Remote Sensing Image Super-Resolution Guided by Visible Images
by Zili Zhang, Yan Tian, Jianxiang Li and Yiping Xu
Remote Sens. 2022, 14(6), 1513; https://doi.org/10.3390/rs14061513 - 21 Mar 2022
Cited by 6 | Viewed by 2990
Abstract
Remote sensing images are widely used in many applications. However, due to being limited by the sensors, it is difficult to obtain high-resolution (HR) images from remote sensing images. In this paper, we propose a novel unsupervised cross-domain super-resolution method devoted to reconstructing [...] Read more.
Remote sensing images are widely used in many applications. However, due to being limited by the sensors, it is difficult to obtain high-resolution (HR) images from remote sensing images. In this paper, we propose a novel unsupervised cross-domain super-resolution method devoted to reconstructing a low-resolution (LR) remote sensing image guided by an unpaired HR visible natural image. Therefore, an unsupervised visible image-guided remote sensing image super-resolution network (UVRSR) is built. The network is divided into two learnable branches: a visible image-guided branch (VIG) and a remote sensing image-guided branch (RIG). As HR visible images can provide rich textures and sufficient high-frequency information, the purpose of VIG is to treat them as targets and make full use of their advantages in reconstruction. Specially, we first use a CycleGAN to drag the LR visible natural images to the remote sensing domain; then, we apply an SR network to upscale these simulated remote sensing domain LR images. However, the domain gap between SR remote sensing images and HR visible targets is massive. To enforce domain consistency, we propose a novel domain-ruled discriminator in the reconstruction. Furthermore, inspired by the zero-shot super-resolution network (ZSSR) to explore the internal information of remote sensing images, we add a remote sensing domain inner study to train the SR network in RIG. Sufficient experimental works show UVRSR can achieve superior results with state-of-the-art unpaired and remote sensing SR methods on several challenging remote sensing image datasets. Full article
(This article belongs to the Special Issue Advanced Super-resolution Methods in Remote Sensing)
Show Figures

Figure 1

14 pages, 1388 KiB  
Article
A Proposed Satellite-Based Crop Insurance System for Smallholder Maize Farming
by Wonga Masiza, Johannes George Chirima, Hamisai Hamandawana, Ahmed Mukalazi Kalumba and Hezekiel Bheki Magagula
Remote Sens. 2022, 14(6), 1512; https://doi.org/10.3390/rs14061512 - 21 Mar 2022
Cited by 1 | Viewed by 2928
Abstract
Crop farming in Sub-Saharan Africa is constantly confronted by extreme weather events. Researchers have been striving to develop different tools that can be used to reduce the impacts of adverse weather on agriculture. Index-based crop insurance (IBCI) has emerged to be one of [...] Read more.
Crop farming in Sub-Saharan Africa is constantly confronted by extreme weather events. Researchers have been striving to develop different tools that can be used to reduce the impacts of adverse weather on agriculture. Index-based crop insurance (IBCI) has emerged to be one of the tools that could potentially hedge farmers against weather-related risks. However, IBCI is still constrained by poor product design and basis risk. This study complements the efforts to improve IBCI design by evaluating the performances of the Tropical Applications of Meteorology using SATellite data and ground-based observations (TAMSAT) and Climate Hazards Group InfraRed Precipitation with Station data (CHIRPS) in estimating rainfall at different spatial scales over the maize-growing season in a smallholder farming area in South Africa. Results show that CHIRPS outperforms TAMSAT and produces better results at 20-day and monthly time steps. The study then uses CHIRPS and a crop water requirements (CWR) model to derive IBCI thresholds and an IBCI payout model. Results of CWR modeling show that this proposed IBCI system can cover the development, mid-season, and late-season stages of maize growth in the study area. The study then uses this information to calculate the weight, trigger, exit, and tick for each of these growth stages. Although this approach is premised on the prevailing conditions in the study area, it can be applied in other areas with different growing conditions to improve IBCI design. Full article
(This article belongs to the Special Issue Monitoring Crops and Rangelands Using Remote Sensing)
Show Figures

Figure 1

31 pages, 6054 KiB  
Article
Calibration and Validation of SWAT Model by Using Hydrological Remote Sensing Observables in the Lake Chad Basin
by Ali Bennour, Li Jia, Massimo Menenti, Chaolei Zheng, Yelong Zeng, Beatrice Asenso Barnieh and Min Jiang
Remote Sens. 2022, 14(6), 1511; https://doi.org/10.3390/rs14061511 - 21 Mar 2022
Cited by 21 | Viewed by 4703
Abstract
Model calibration and validation are challenging in poorly gauged basins. We developed and applied a new approach to calibrate hydrological models using distributed geospatial remote sensing data. The Soil and Water Assessment Tool (SWAT) model was calibrated using only twelve months of remote [...] Read more.
Model calibration and validation are challenging in poorly gauged basins. We developed and applied a new approach to calibrate hydrological models using distributed geospatial remote sensing data. The Soil and Water Assessment Tool (SWAT) model was calibrated using only twelve months of remote sensing data on actual evapotranspiration (ETa) geospatially distributed in the 37 sub-basins of the Lake Chad Basin in Africa. Global sensitivity analysis was conducted to identify influential model parameters by applying the Sequential Uncertainty Fitting Algorithm–version 2 (SUFI-2), included in the SWAT-Calibration and Uncertainty Program (SWAT-CUP). This procedure is designed to deal with spatially variable parameters and estimates either multiplicative or additive corrections applicable to the entire model domain, which limits the number of unknowns while preserving spatial variability. The sensitivity analysis led us to identify fifteen influential parameters, which were selected for calibration. The optimized parameters gave the best model performance on the basis of the high Nash–Sutcliffe Efficiency (NSE), Kling–Gupta Efficiency (KGE), and determination coefficient (R2). Four sets of remote sensing ETa data products were applied in model calibration, i.e., ETMonitor, GLEAM, SSEBop, and WaPOR. Overall, the new approach of using remote sensing ETa for a limited period of time was robust and gave a very good performance, with R2 > 0.9, NSE > 0.8, and KGE > 0.75 applying to the SWAT ETa vs. the ETMonitor ETa and GLEAM ETa. The ETMonitor ETa was finally adopted for further model applications. The calibrated SWAT model was then validated during 2010–2015 against remote sensing data on total water storage change (TWSC) with acceptable performance, i.e., R2 = 0.57 and NSE = 0.55, and remote sensing soil moisture data with R2 and NSE greater than 0.85. Full article
(This article belongs to the Special Issue Remote Sensing of Hydrological Processes: Modelling and Applications)
Show Figures

Figure 1

28 pages, 3460 KiB  
Article
Retrieval of Black Carbon Absorption Aerosol Optical Depth from AERONET Observations over the World during 2000–2018
by Naghmeh Dehkhoda, Juhyeon Sim, Sohee Joo, Sungkyun Shin and Youngmin Noh
Remote Sens. 2022, 14(6), 1510; https://doi.org/10.3390/rs14061510 - 21 Mar 2022
Cited by 4 | Viewed by 2915
Abstract
Black carbon (BC) absorption aerosol optical depth (AAODBC) defines the contribution of BC in light absorption and is retrievable using sun/sky radiometer measurements provided by Aerosol Robotic Network (AERONET) inversion products. In this study, we utilized AERONET-retrieved depolarization ratio (DPR, [...] Read more.
Black carbon (BC) absorption aerosol optical depth (AAODBC) defines the contribution of BC in light absorption and is retrievable using sun/sky radiometer measurements provided by Aerosol Robotic Network (AERONET) inversion products. In this study, we utilized AERONET-retrieved depolarization ratio (DPR, δp), single scattering albedo (SSA, ω), and Ångström Exponent (AE, å) of version 3 level 2.0 products as indicators to estimate the contribution of BC to the absorbing fractions of AOD. We applied our methodology to the AERONET sites, including North and South America, Europe, East Asia, Africa, India, and the Middle East, during 2000–2018. The long-term AAODBC showed a downward tendency over Sao Paulo (−0.001 year−1), Thessaloniki (−0.0004 year−1), Beijing (−0.001 year−1), Seoul (−0.0015 year−1), and Cape Verde (−0.0009 year−1) with the highest values over the populous sites. This declining tendency in AAODBC can be attributable to the successful emission control policies over these sites, particularly in Europe, America, and China. The AAODBC at the Beijing, Sao Paulo, Mexico City, and the Indian sites showed a clear seasonality indicating the notable role of residential heating in BC emissions over these sites during winter. We found a higher correlation between AAODBC and fine mode AOD at 440 nm at all sites except for Beijing. High pollution episodes, BC emission from different sources, and aggregation properties seem to be the main drivers of higher AAODBC correlation with coarse particles over Beijing. Full article
(This article belongs to the Section Atmospheric Remote Sensing)
Show Figures

Graphical abstract

20 pages, 5923 KiB  
Article
SIF-Based GPP Is a Useful Index for Assessing Impacts of Drought on Vegetation: An Example of a Mega-Drought in Yunnan Province, China
by Chuanhua Li, Lixiao Peng, Min Zhou, Yufei Wei, Lihui Liu, Liangliang Li, Yunfan Liu, Tianbao Dou, Jiahao Chen and Xiaodong Wu
Remote Sens. 2022, 14(6), 1509; https://doi.org/10.3390/rs14061509 - 21 Mar 2022
Cited by 7 | Viewed by 2864
Abstract
The impact of drought on terrestrial ecosystem Gross Primary Productivity (GPP) is strong and widespread; therefore, it is important to study the response of terrestrial ecosystem GPP to drought. In this paper, we compared the correlations of Sun-induced Chlorophyll fluorescence (SIF), Enhanced Vegetation [...] Read more.
The impact of drought on terrestrial ecosystem Gross Primary Productivity (GPP) is strong and widespread; therefore, it is important to study the response of terrestrial ecosystem GPP to drought. In this paper, we compared the correlations of Sun-induced Chlorophyll fluorescence (SIF), Enhanced Vegetation Index (EVI), and Normalized Differential Vegetation Index (NDVI) with the drought index sc_PDSI, estimated GPP in Yunnan Province, China, based on SIFTOTAL data (SIF data with canopy effects eliminated), and analyzed the response characteristics of GPP to drought for one mega-drought event (2009–2011) in combination with the sc_PDSI drought index. The results show that SIF is more sensitive to drought than the NDVI and EVI; the correlation between the GPP estimated based on SIF data (GPPSIF) and the actual observed flux values (R2 = 0.83) is better than GPPGLASS and GPPLUE, and the RMSE is also lower than those two products. This drought has a serious impact on GPP, and the monthly average values of the effect of drought on GPP (GPPd) in Yunnan Province in 2009, 2010, and 2011 are −11.37 gC·m−2·month−1, −23.48 gC·m−2·month−1 and −17.92 gC·m−2·month−1, which are 8.6%, 17.48% and 13.85% of the monthly average in a normal year, respectively. The spatial variability of GPP response to drought is significant, which is mainly determined by the degree, and duration of the drought, the vegetation type, the topography, and anthropogenic factors. In conclusion, GPPSIF quickly and accurately reflects the process of this drought, and this study helps to elucidate the response of GPP to drought conditions and provides more scientific information for drought prediction and ecosystem management. Full article
Show Figures

Graphical abstract

29 pages, 7016 KiB  
Article
Glacier Recession in the Altai Mountains after the LIA Maximum
by Dmitry Ganyushkin, Kirill Chistyakov, Ekaterina Derkach, Dmitriy Bantcev, Elena Kunaeva, Anton Terekhov and Valeria Rasputina
Remote Sens. 2022, 14(6), 1508; https://doi.org/10.3390/rs14061508 - 20 Mar 2022
Cited by 10 | Viewed by 2597
Abstract
The study aims to reconstruct the Altai glaciers at the maximum of the LIA, to estimate the reduction of the Altai glaciers from the LIA maximum to the present, and to analyze glacier reduction rates on the example of the Tavan Bogd mountain [...] Read more.
The study aims to reconstruct the Altai glaciers at the maximum of the LIA, to estimate the reduction of the Altai glaciers from the LIA maximum to the present, and to analyze glacier reduction rates on the example of the Tavan Bogd mountain range. Research was based on remote sensing and field data. The recent glaciation in the southern part of the Altai is estimated (1256 glaciers with the total area of 559.15 ± 31.13 km2), the area of the glaciers of the whole Altai mountains is estimated at 1096.55 km2. In the southern part of Altai, 2276 glaciers with a total area of 1348.43 ± 56.16 km2 were reconstructed, and the first estimate of the LIA glacial area for the entire Altai mountain system was given (2288.04 km2). Since the LIA, the glaciers decrease by 59% in the southern part of Altai and by 47.9% for the whole Altai. The average increase in ELA in the southern part of Altai was 106 m. The larger increase of ELA in the relatively humid areas was probably caused by a decrease in precipitation. Glaciers in the Tavan Bogd glacial center degraded with higher rates after 1968 relative to the interval between 1850–1968. One of the intervals of fast glacier shrinkage in 2000–2010 was caused by a dry and warm interval between 1989 and 2004. However, the fast decrease in glaciers in 2000–2010 was mainly caused by the shrinkage or disappearance of the smaller glaciers, and large valley glaciers started a fast retreat after 2010. The study results present the first evaluation of the glacier recession of the entire Altai after the LIA maximum. Full article
(This article belongs to the Special Issue The Cryosphere Observations Based on Using Remote Sensing Techniques)
Show Figures

Graphical abstract

23 pages, 30433 KiB  
Article
Two-Stream Swin Transformer with Differentiable Sobel Operator for Remote Sensing Image Classification
by Siyuan Hao, Bin Wu, Kun Zhao, Yuanxin Ye and Wei Wang
Remote Sens. 2022, 14(6), 1507; https://doi.org/10.3390/rs14061507 - 20 Mar 2022
Cited by 19 | Viewed by 4504
Abstract
Remote sensing (RS) image classification has attracted much attention recently and is widely used in various fields. Different to natural images, the RS image scenes consist of complex backgrounds and various stochastically arranged objects, thus making it difficult for networks to focus on [...] Read more.
Remote sensing (RS) image classification has attracted much attention recently and is widely used in various fields. Different to natural images, the RS image scenes consist of complex backgrounds and various stochastically arranged objects, thus making it difficult for networks to focus on the target objects in the scene. However, conventional classification methods do not have any special treatment for remote sensing images. In this paper, we propose a two-stream swin transformer network (TSTNet) to address these issues. TSTNet consists of two streams (i.e., original stream and edge stream) which use both the deep features of the original images and the ones from the edges to make predictions. The swin transformer is used as the backbone of each stream given its good performance. In addition, a differentiable edge Sobel operator module (DESOM) is included in the edge stream which can learn the parameters of Sobel operator adaptively and provide more robust edge information that can suppress background noise. Experimental results on three publicly available remote sensing datasets show that our TSTNet achieves superior performance over the state-of-the-art (SOTA) methods. Full article
(This article belongs to the Special Issue State-of-the-Art Remote Sensing Image Scene Classification)
Show Figures

Figure 1

18 pages, 17885 KiB  
Article
Glacier Mass Balance in the Manas River Using Ascending and Descending Pass of Sentinel 1A/1B Data and SRTM DEM
by Lili Yan, Jian Wang and Donghang Shao
Remote Sens. 2022, 14(6), 1506; https://doi.org/10.3390/rs14061506 - 20 Mar 2022
Cited by 8 | Viewed by 2538
Abstract
Mountain glaciers monitoring is important for water resource management and climate changes but is limited by the lack of a high-quality Digital Elevation Model (DEM) and field measurements. Sentinel 1A/1B satellites provide alternative data for glacier mass balance. In this study, we tried [...] Read more.
Mountain glaciers monitoring is important for water resource management and climate changes but is limited by the lack of a high-quality Digital Elevation Model (DEM) and field measurements. Sentinel 1A/1B satellites provide alternative data for glacier mass balance. In this study, we tried to generate DEMs from C-band Sentinel 1A/1B ascending and descending pass SLC images and evaluate the overall accuracy of INSAR DEMs based on Shuttle Radar Topography Mission (SRTM) DEM and ICESat/GLAS. The low Standard Deviation (STD)and Root Means Square Error (RMSE) displayed the feasibility of Sentinel 1A/1B satellites for DEM generation. Glacier elevation changes and glacier mass balance were estimated based on INSAR DEM and SRTM DEM. The results showed that the most glaciers have exhibited obvious thinning, and the mean annual glacier mass balance between 2000 and 2020 was −0.18 ± 0.1 m w.e.a−1. The south-facing and-east facing aspects, slope and elevation play an important role on glacier melt. This study demonstrates that ascending and descending orbit data of Sentinel-1A/1B satellites are promising for the detailed retrieval of surface elevation changes and mass balance in mountain glaciers. Full article
(This article belongs to the Special Issue Remote Sensing for Mountain Vegetation and Snow Cover)
Show Figures

Figure 1

21 pages, 11182 KiB  
Article
Effects of UAV-LiDAR and Photogrammetric Point Density on Tea Plucking Area Identification
by Qingfan Zhang, Maosheng Hu, Yansong Zhou, Bo Wan, Le Jiang, Quanfa Zhang and Dezhi Wang
Remote Sens. 2022, 14(6), 1505; https://doi.org/10.3390/rs14061505 - 20 Mar 2022
Cited by 1 | Viewed by 2985
Abstract
High-cost data collection and processing are challenges for UAV LiDAR (light detection and ranging) mounted on unmanned aerial vehicles in crop monitoring. Reducing the point density can lower data collection costs and increase efficiency but may lead to a loss in mapping accuracy. [...] Read more.
High-cost data collection and processing are challenges for UAV LiDAR (light detection and ranging) mounted on unmanned aerial vehicles in crop monitoring. Reducing the point density can lower data collection costs and increase efficiency but may lead to a loss in mapping accuracy. It is necessary to determine the appropriate point cloud density for tea plucking area identification to maximize the cost–benefits. This study evaluated the performance of different LiDAR and photogrammetric point density data when mapping the tea plucking area in the Huashan Tea Garden, Wuhan City, China. The object-based metrics derived from UAV point clouds were used to classify tea plantations with the extreme learning machine (ELM) and random forest (RF) algorithms. The results indicated that the performance of different LiDAR point density data, from 0.25 (1%) to 25.44 pts/m2 (100%), changed obviously (overall classification accuracies: 90.65–94.39% for RF and 89.78–93.44% for ELM). For photogrammetric data, the point density was found to have little effect on the classification accuracy, with 10% of the initial point density (2.46 pts/m2), a similar accuracy level was obtained (difference of approximately 1%). LiDAR point cloud density had a significant influence on the DTM accuracy, with the RMSE for DTMs ranging from 0.060 to 2.253 m, while the photogrammetric point cloud density had a limited effect on the DTM accuracy, with the RMSE ranging from 0.256 to 0.477 m due to the high proportion of ground points in the photogrammetric point clouds. Moreover, important features for identifying the tea plucking area were summarized for the first time using a recursive feature elimination method and a novel hierarchical clustering-correlation method. The resultant architecture diagram can indicate the specific role of each feature/group in identifying the tea plucking area and could be used in other studies to prepare candidate features. This study demonstrates that low UAV point density data, such as 2.55 pts/m2 (10%), as used in this study, might be suitable for conducting finer-scale tea plucking area mapping without compromising the accuracy. Full article
Show Figures

Figure 1

23 pages, 5635 KiB  
Article
A Reconstructed Global Daily Seamless SIF Product at 0.05 Degree Resolution Based on TROPOMI, MODIS and ERA5 Data
by Jiaochan Hu, Jia Jia, Yan Ma, Liangyun Liu and Haoyang Yu
Remote Sens. 2022, 14(6), 1504; https://doi.org/10.3390/rs14061504 - 20 Mar 2022
Cited by 5 | Viewed by 3314
Abstract
Satellite-derived solar-induced chlorophyll fluorescence (SIF) has been proven to be a valuable tool for monitoring vegetation’s photosynthetic activity at regional or global scales. However, the coarse spatiotemporal resolution or discrete space coverage of most satellite SIF datasets hinders their full potential for studying [...] Read more.
Satellite-derived solar-induced chlorophyll fluorescence (SIF) has been proven to be a valuable tool for monitoring vegetation’s photosynthetic activity at regional or global scales. However, the coarse spatiotemporal resolution or discrete space coverage of most satellite SIF datasets hinders their full potential for studying carbon cycle and ecological processes at finer scales. Although the recent TROPOspheric Monitoring Instrument (TROPOMI) partially addresses this issue, the SIF still has drawbacks in spatial insufficiency and spatiotemporal discontinuities when gridded at high spatiotemporal resolutions (e.g., 0.05°, 1-day or 2-day) due to its nonuniform sampling sizes, swath gaps, and clouds contaminations. Here, we generated a new global SIF product with Seamless spatiotemporal coverage at Daily and 0.05° resolutions (SDSIF) during 2018–2020, using the random forest (RF) approach together with TROPOMI SIF, MODIS reflectance and meteorological datasets. We investigated how the model accuracy was affected by selection of explanatory variables and model constraints. Eventually, models were trained and applied for specific continents and months given the similar response of SIF to environmental variables within closer space and time. This strategy achieved better accuracy (R2 = 0.928, RMSE = 0.0597 mW/m2/nm/sr) than one universal model (R2 = 0.913, RMSE = 0.0653 mW/m2/nm/sr) for testing samples. The SDSIF product can well preserve the temporal and spatial characteristics in original TROPOMI SIF with high temporal correlations (mean R2 around 0.750) and low spatial residuals (less than ±0.081 mW/m2/nm/sr) between them two at most regions (80% of global pixels). Compared with the original SIF at five flux sites, SDSIF filled the temporal gaps and was better consistent with tower-based SIF at the daily scale (the mean R2 increased from 0.467 to 0.744. Consequently, it provided more reliable 4-day SIF averages than the original ones from sparse daily observations (e.g., the R2 at Daman site was raised from 0.614 to 0.837), which resulted in a better correlation with 4-day tower-based GPP. Additionally, the global coverage ratio and local spatial details had also been improved by the reconstructed seamless SIF. Our product has advantages in spatiotemporal continuities and details over the original TROPOMI SIF, which will benefit the application of satellite SIF for understanding carbon cycle and ecological processes at finer spatial and temporal scales. Full article
Show Figures

Figure 1

24 pages, 7973 KiB  
Article
Three-Dimensional Simulation Model for Synergistically Simulating Urban Horizontal Expansion and Vertical Growth
by Linfeng Zhao, Xiaoping Liu, Xiaocong Xu, Cuiming Liu and Keyun Chen
Remote Sens. 2022, 14(6), 1503; https://doi.org/10.3390/rs14061503 - 20 Mar 2022
Cited by 6 | Viewed by 2655
Abstract
Urban expansion studies have focused on two-dimensional planar dimensions, ignoring the impact of building height growth changes in the vertical direction on the urban three-dimensional (3D) spatial expansion. Past 3D simulation studies have tended to focus on simulating virtual cities, and a few [...] Read more.
Urban expansion studies have focused on two-dimensional planar dimensions, ignoring the impact of building height growth changes in the vertical direction on the urban three-dimensional (3D) spatial expansion. Past 3D simulation studies have tended to focus on simulating virtual cities, and a few studies have attempted to build 3D simulation models to achieve the synergistic simulation of real cities. This study proposes an urban 3D spatial expansion simulation model to achieve a synergistic simulation of urban horizontal expansion and vertical growth. The future land use simulation model was used to simulate urban land use changes in the horizontal direction. The random forest (RF) regression algorithm was used to predict building height growth in the vertical direction. Furthermore, the RF algorithm was used to mine the patterns of spatial factors affecting building heights. The 3D model was applied to simulate 3D spatial changes in Shenzhen City from 2014 to 2034. The model effectively simulates the horizontal expansion and vertical growth of a real city in 3D space. The crucial factors affecting building heights and the simulation results of future urban 3D expansion hotspot areas can provide scientific support for decisions in urban spatial planning. Full article
Show Figures

Figure 1

20 pages, 3866 KiB  
Article
Semantic Segmentation of Polarimetric SAR Image Based on Dual-Channel Multi-Size Fully Connected Convolutional Conditional Random Field
by Yingying Kong and Qiupeng Li
Remote Sens. 2022, 14(6), 1502; https://doi.org/10.3390/rs14061502 - 20 Mar 2022
Cited by 1 | Viewed by 1733
Abstract
The traditional fully connected convolutional conditional random field has a proven robust performance in post-processing semantic segmentation of SAR images. However, the current challenge is how to improve the richness of image features, thereby improving the accuracy of image segmentation. This paper proposes [...] Read more.
The traditional fully connected convolutional conditional random field has a proven robust performance in post-processing semantic segmentation of SAR images. However, the current challenge is how to improve the richness of image features, thereby improving the accuracy of image segmentation. This paper proposes a polarization SAR image semantic segmentation method based on a dual-channel multi-size fully connected convolutional conditional random field. Firstly, the full-polarization SAR image and the corresponding optical image are input into the model at the same time, which can increase the richness of feature information. Secondly, multi-size input integrates image information of different sizes and models images of various sizes. Finally, the importance of features is introduced to determine the weights of polarized SAR images and optical images, and CRF is improved into a potential function so that the model can adaptively adjust the degree of influence of different image features on the segmentation effect. The experimental results show that the proposed method achieves the highest mean intersection over union (mIoU) and global accuracy (GA) with the least running time, which verifies the effectiveness of our method. Full article
(This article belongs to the Section Remote Sensing Image Processing)
Show Figures

Figure 1

12 pages, 16836 KiB  
Technical Note
Application of Multispectral Remote Sensing for Mapping Flood-Affected Zones in the Brumadinho Mining District (Minas Gerais, Brasil)
by Lorenzo Ammirati, Rita Chirico, Diego Di Martire and Nicola Mondillo
Remote Sens. 2022, 14(6), 1501; https://doi.org/10.3390/rs14061501 - 20 Mar 2022
Cited by 8 | Viewed by 2787
Abstract
The collapse of the tailing “Dam B1” of the Córrego do Feijão Mine (Brumadinho, Brasil) that occurred in January 2019 is considered a large socio-environmental flood-disaster where numerous people died and the local flora and fauna were seriously affected, including agricultural areas of [...] Read more.
The collapse of the tailing “Dam B1” of the Córrego do Feijão Mine (Brumadinho, Brasil) that occurred in January 2019 is considered a large socio-environmental flood-disaster where numerous people died and the local flora and fauna were seriously affected, including agricultural areas of the Paraopeba River. This study aims to map the land area affected by the flood by using multispectral satellite images. To pursue this aim, Level-2A multispectral images from the European Space Agency’s Sentinel-2 sensor were acquired before and after the tailing dam collapse in the period 2019–2021. The pre- and post-failure event analysis allowed us to evidence drastic changes in the vegetation rate, as well as in the nature of soils and surficial waters. The spectral signatures of the minerals composing the mining products allowed us to highlight the effective area covered by the flood and to investigate the evolution of land properties after the disaster. This technique opens the possibility for quickly classifying areas involved in floods, as well as obtaining significant information potentially useful for monitoring and planning the reclamation and restoration activities in similar cases worldwide, representing an additional tool for evaluating the environmental issues related to mining operations in large areas at high temporal resolution. Full article
(This article belongs to the Special Issue Remote Sensing Solutions for Mapping Mining Environments)
Show Figures

Figure 1

19 pages, 7945 KiB  
Article
Missing Data Imputation in GNSS Monitoring Time Series Using Temporal and Spatial Hankel Matrix Factorization
by Hanlin Liu and Linchao Li
Remote Sens. 2022, 14(6), 1500; https://doi.org/10.3390/rs14061500 - 20 Mar 2022
Cited by 3 | Viewed by 2224
Abstract
GNSS time series for static reference stations record the deformation of monitored targets. However, missing data are very common in GNSS monitoring time series because of receiver crashes, power failures, etc. In this paper, we propose a Temporal and Spatial Hankel Matrix Factorization [...] Read more.
GNSS time series for static reference stations record the deformation of monitored targets. However, missing data are very common in GNSS monitoring time series because of receiver crashes, power failures, etc. In this paper, we propose a Temporal and Spatial Hankel Matrix Factorization (TSHMF) method that can simultaneously consider the temporal correlation of a single time series and the spatial correlation among different stations. Moreover, the method is verified using real-world regional 10-year period monitoring GNSS coordinate time series. The Mean Absolute Error (MAE) and Root-Mean-Square Error (RMSE) are calculated to compare the performance of TSHMF with benchmark methods, which include the time-mean, station-mean, K-nearest neighbor, and singular value decomposition methods. The results show that the TSHMF method can reduce the MAE range from 32.03% to 12.98% and the RMSE range from 21.58% to 10.36%, proving the effectiveness of the proposed method. Full article
(This article belongs to the Special Issue Geodetic Observations for Earth System)
Show Figures

Graphical abstract

16 pages, 57315 KiB  
Communication
Range Gate Pull-Off Mainlobe Jamming Suppression Approach with FDA-MIMO Radar: Theoretical Formalism and Numerical Study
by Pengfei Wan, Yuanlong Weng, Jingwei Xu and Guisheng Liao
Remote Sens. 2022, 14(6), 1499; https://doi.org/10.3390/rs14061499 - 20 Mar 2022
Cited by 7 | Viewed by 2107
Abstract
With the development of an electronic interference technique, the self-defense jammer can generate mainlobe jamming using the range gate pull-off (RGPO) strategy, which brings serious performance degradation of target tracking for the ground-based warning radar. In this paper, a RGPO mainlobe jamming suppression [...] Read more.
With the development of an electronic interference technique, the self-defense jammer can generate mainlobe jamming using the range gate pull-off (RGPO) strategy, which brings serious performance degradation of target tracking for the ground-based warning radar. In this paper, a RGPO mainlobe jamming suppression approach is proposed, with a frequency diverse array using multiple-input multiple-output (FDA-MIMO) radar. The RGPO mainlobe jamming differs from the true target in slant range, thus it is possible to identify the true target from the RGPO mainlobe jammings by exploiting the transmit beampattern diversity of FDA-MIMO radar. A RGPO mainlobe jamming suppression approach is devised by using joint transmit–receive beamforming for a group of range sectors. The jamming suppression performance is studied, in consideration of practical time-delay of RGPO jamming. Simulation examples are provided to verify the effectiveness of the proposed approach. Full article
Show Figures

Figure 1

21 pages, 4848 KiB  
Article
MLCRNet: Multi-Level Context Refinement for Semantic Segmentation in Aerial Images
by Zhifeng Huang, Qian Zhang and Guixu Zhang
Remote Sens. 2022, 14(6), 1498; https://doi.org/10.3390/rs14061498 - 20 Mar 2022
Cited by 9 | Viewed by 2145
Abstract
In this paper, we focus on the problem of contextual aggregation in the semantic segmentation of aerial images. Current contextual aggregation methods only aggregate contextual information within specific regions to improve feature representation, which may yield poorly robust contextual information. To address this [...] Read more.
In this paper, we focus on the problem of contextual aggregation in the semantic segmentation of aerial images. Current contextual aggregation methods only aggregate contextual information within specific regions to improve feature representation, which may yield poorly robust contextual information. To address this problem, we propose a novel multi-level context refinement network (MLCRNet) that aggregates three levels of contextual information effectively and efficiently in an adaptive manner. First, we designed a local-level context aggregation module to capture local information around each pixel. Second, we integrate multiple levels of context, namely, local-level, image-level, and semantic-level, to aggregate contextual information from a comprehensive perspective dynamically. Third, we propose an efficient multi-level context transform (EMCT) module to address feature redundancy and to improve the efficiency of our multi-level contexts. Finally, based on the EMCT module and feature pyramid network (FPN) framework, we propose a multi-level context feature refinement (MLCR) module to enhance feature representation by leveraging multi-level contextual information. Extensive empirical evidence demonstrates that our MLCRNet achieves state-of-the-art performance on the ISPRS Potsdam and Vaihingen datasets. Full article
(This article belongs to the Topic Computational Intelligence in Remote Sensing)
Show Figures

Figure 1

17 pages, 6251 KiB  
Article
Elevation Regimes Modulated the Responses of Canopy Structure of Coastal Mangrove Forests to Hurricane Damage
by Qiong Gao and Mei Yu
Remote Sens. 2022, 14(6), 1497; https://doi.org/10.3390/rs14061497 - 20 Mar 2022
Cited by 3 | Viewed by 1940
Abstract
Mangrove forests have unique ecosystem functions and services, yet the coastal mangroves in tropics are often disturbed by tropical cyclones. Hurricane Maria swept Puerto Rico and nearby Caribbean islands in September 2017 and caused tremendous damage to the coastal mangrove systems. Understanding the [...] Read more.
Mangrove forests have unique ecosystem functions and services, yet the coastal mangroves in tropics are often disturbed by tropical cyclones. Hurricane Maria swept Puerto Rico and nearby Caribbean islands in September 2017 and caused tremendous damage to the coastal mangrove systems. Understanding the vulnerability and resistance of mangrove forests to disturbances is pivotal for future restoration and conservation. In this study, we used LiDAR point clouds to derive the canopy height of five major mangrove forests, including true mangroves and mangrove associates, along the coast of Puerto Rico before and after the hurricanes, which allowed us to detect the spatial variations of canopy height reduction. We then spatially regressed the pre-hurricane canopy height and the canopy height reduction on biophysical factors such as the elevation, the distance to rivers/canals within and nearby, the distance to coast, tree density, and canopy unevenness. The analyses resulted in the following findings. The pre-hurricane canopy height increased with elevation when elevation was low and moderate but decreased with elevation when elevation was high. The canopy height reduction increased quadratically with the pre-hurricane canopy height, but decreased with elevation for the four sites dominated by true mangroves. The site of Palma del Mar dominated by Pterocarpus, a mangrove associate, experienced the strongest wind, and the canopy height reduction increased with elevation. The canopy height reduction decreased with the distance to rivers/canals only for sites with low to moderate mean elevation of 0.36–0.39 m. In addition to the hurricane winds, the rainfall during hurricanes is an important factor causing canopy damage by inundating the aerial roots. In summary, the pre-hurricane canopy structures, physical environment, and external forces brought by hurricanes interplayed to affect the vulnerability of coastal mangroves to major hurricanes. Full article
Show Figures

Figure 1

Previous Issue
Next Issue
Back to TopTop