Article

Time Series Surface Deformation of Changbaishan Volcano Based on Sentinel-1B SAR Data and Its Geological Significance

1
College of Geoexploration Science and Technology, Jilin University, Changchun 130026, China
2
The State Key Laboratory of Lunar and Planetary Sciences, Macau University of Science and Technology, Macau 999078, China
3
Tianjin Research Institute for Water Transport Engineering M.O.T., Tianjin 300456, China
4
Changbaishan Tianchi Volcano Observatory, Antu 133618, China
5
Key Laboratory of Earthquake Geodesy, Institute of Seismology, China Earthquake Administration, Wuhan 430071, China
6
Laboratory of Deep-Space Exploration, National Astronomical Observatories, Chinese Academy of Sciences, Beijing 100101, China
7
School of Space Science and Astronomy, University of Chinese Academy of Sciences, Beijing 100049, China
*
Author to whom correspondence should be addressed.
Remote Sens. 2022, 14(5), 1213; https://doi.org/10.3390/rs14051213
Submission received: 31 December 2021 / Revised: 24 February 2022 / Accepted: 25 February 2022 / Published: 1 March 2022
(This article belongs to the Special Issue Radar Imaging Theory, Techniques, and Applications II)

Abstract

:
Monitoring the surface deformation is of great significance, in order to explore the activity and geophysical features of the underground deep pressure source in the volcanic regions. In this study, the time series surface deformation of the Changbaishan volcano is retrieved via Sentinel-1B SAR data, using the SBAS-InSAR method. The main results are as follows. (1) The mean surface deformation velocity in the Changbaishan volcano is uplifted as a whole, while the uplift is locally distributed, which shows a strong correlation with faults. (2) The time series surface deformation of the Changbaishan volcano indicates an apparently seasonal change. (3) The cumulative surface deformation shows a strong correlation with the maximal magnitude and number of annual earthquakes, and it is likely dominated by the maximal magnitude of the annual earthquakes. (4) The single Mogi source model is appropriate to evaluate the deep pressure source in the Changbaishan volcano, constrained by the calculated surface deformation. The optimal estimated depth of the magma chamber is about 6.2 km, and the volume is increased by about 3.2 × 10⁶ m3. According to the time series surface deformation, it is concluded that the tectonic activity and faults, related to the deep pressure source, are pretty active in the Changbaishan volcano.

1. Introduction

The Changbaishan Tianchi volcano (Changbaishan volcano) is located on the border between China and North Korea, the only large-scale Cenozoic multi-genetic central composite stratovolcano. It has experienced many violent eruptions in history, and the eruption in 946 AD is considered one of the largest volcanic eruptions in the past two thousand years, which is still thought as the most potentially hazardous active volcano in China [1,2,3,4,5].
Currently, the magmatic activity and physical properties of the magma chamber beneath the Changbaishan volcano are mainly studied with geophysical methods, including seismic, gravity, and geomagnetic exploration. The seismic tomography is used to study the origin of deep mantle volcanoes, the seismic prospecting method is employed to invert the crustal velocity structure, and the magneto-telluric sounding method is undertaken to invert the crustal resistivity structure; all these methods prove the existence of an active magma chamber beneath the Changbaishan volcano, formed by the subduction and dehydration of the Pacific plate [6,7,8,9,10,11,12,13,14,15,16]. The Bouguer gravity anomalies imply that there occurs a local mass loss, with low values centered at the Changbaishan volcano, indicating the existence of a magma chamber in the deep crust [8]. The in-situ measurements from 2002 to 2005 show that there is a strong correlation between the seismic intensity and magmatic activity in the Changbaishan area [17,18,19,20,21,22]. Thus, it is necessary to enhance the observation of the magmatic activity in the Changbaishan volcano.
In addition to geophysical exploration methods, remote sensing technology is also an important technique of volcanic activity monitoring. A widely used remote sensing sensor, synthetic aperture radar (SAR), is widely used not only in SAR change detection [23,24], but also in SAR modeling and SAR deformation monitoring of volcanoes [25,26]. The magmatic activity will bring about surface deformation in the volcanic regions [27,28,29]. Thus, besides the geophysical methods, the surface deformation is one of the important ways to indirectly monitor the magmatic activity of the magma chamber [30,31,32,33,34,35]. Since 2002, GPS and leveling surveys have been used to monitor the surface deformation in the Changbaishan volcano [36]. However, the operations of the field observation are critically limited by the complex surface topography and severe climate in the Changbaishan volcano. Comparatively, an interferometric synthetic aperture radar (InSAR) technique has commonly been considered one of the most profitable and effective ways to monitor the surface deformation in volcanic regions [37,38,39,40], which have also been used to study the Changbaishan volcano [30,31,32,33,34,35] (Table 1).
With the JERS-1 and ERS imagery, Kim and Won [41] firstly evaluated the surface information features in the Changbaishan volcano from 1992 to 1998, which indicates an average 3 mm/year uplift. Han et al. [31] assessed that the annual surface deformation of the Changbaishan volcano is about 5 mm/year, from 1994 to 1998, with JERS images, while Tang P. et al. [35] proposed a relatively larger annual surface deformation in this period, about 6 mm/year, using the permanent scattering InSAR (PS-InSAR) method. Unlike others, Chen et al. [30] found that the Changbaishan volcano had almost no deformation from 1995 to 1998. Tang P. et al. [35] obtained an average 3 mm/year uplift, from 2007 to 2010. Mainly in this period, He et al. [32] found that the uplift is about 10 mm/year using 24 ALOS PALSAR images, and Kim et al. [34] proposed a clear uplift up to 30 mm/year in the eastern slope of the Changbaishan volcano with ALOS PALSAR data and ENVISAT ASAR data. Using 19 ALOS-2 images from ascending orbit, provided by the Japanese Aerospatial Exploration Agency, Trasatti et al. [42] detected a 20 mm/year movement elongated in NW-SE direction on the southeastern flank and a −20 mm/year movement on the southwestern flank of the Changbaishan volcano from 2018 to 2020. Additionally, the depth and geometric properties of the deep pressure source are evaluated with the reckoned surface deformation by He et al. [32] and Kim et al. [34]. These studies bring a fresh view of the volcanic activities in the Changbaishan volcano.
However, the evaluated surface deformations are apparently different by several researchers, which is mainly brought by the following causes. First, the atmospheric error is hard to reduce in the traditional methods for the great elevation change and complex climate in the Changbaishan volcano. Second, the orbital periods of the used JERS-1, ASAR, and ALOS PALSAR sensors are different, and a stable data source with an excellent revisiting period is indispensable to assess the surface deformation features in the Changbaishan volcano.
As a new data source, Sentinel-1B SAR data have the good spatial resolution, extremely high orbit determination accuracy, and shorter revisit period, which will inevitably improve the monitoring of the surface deformation in the Changbaishan volcano. Additionally, the small baseline subset InSAR (SBAS-InSAR) method is feasible to significantly reduce the atmospheric error by the free combination of limited short time baseline and spatial baseline [43]. Therefore, the surface deformation in the Changbaishan volcano is evaluated with the SBAS-InSAR method, using the Sentinel-1B SAR data.

2. Study Area and Data

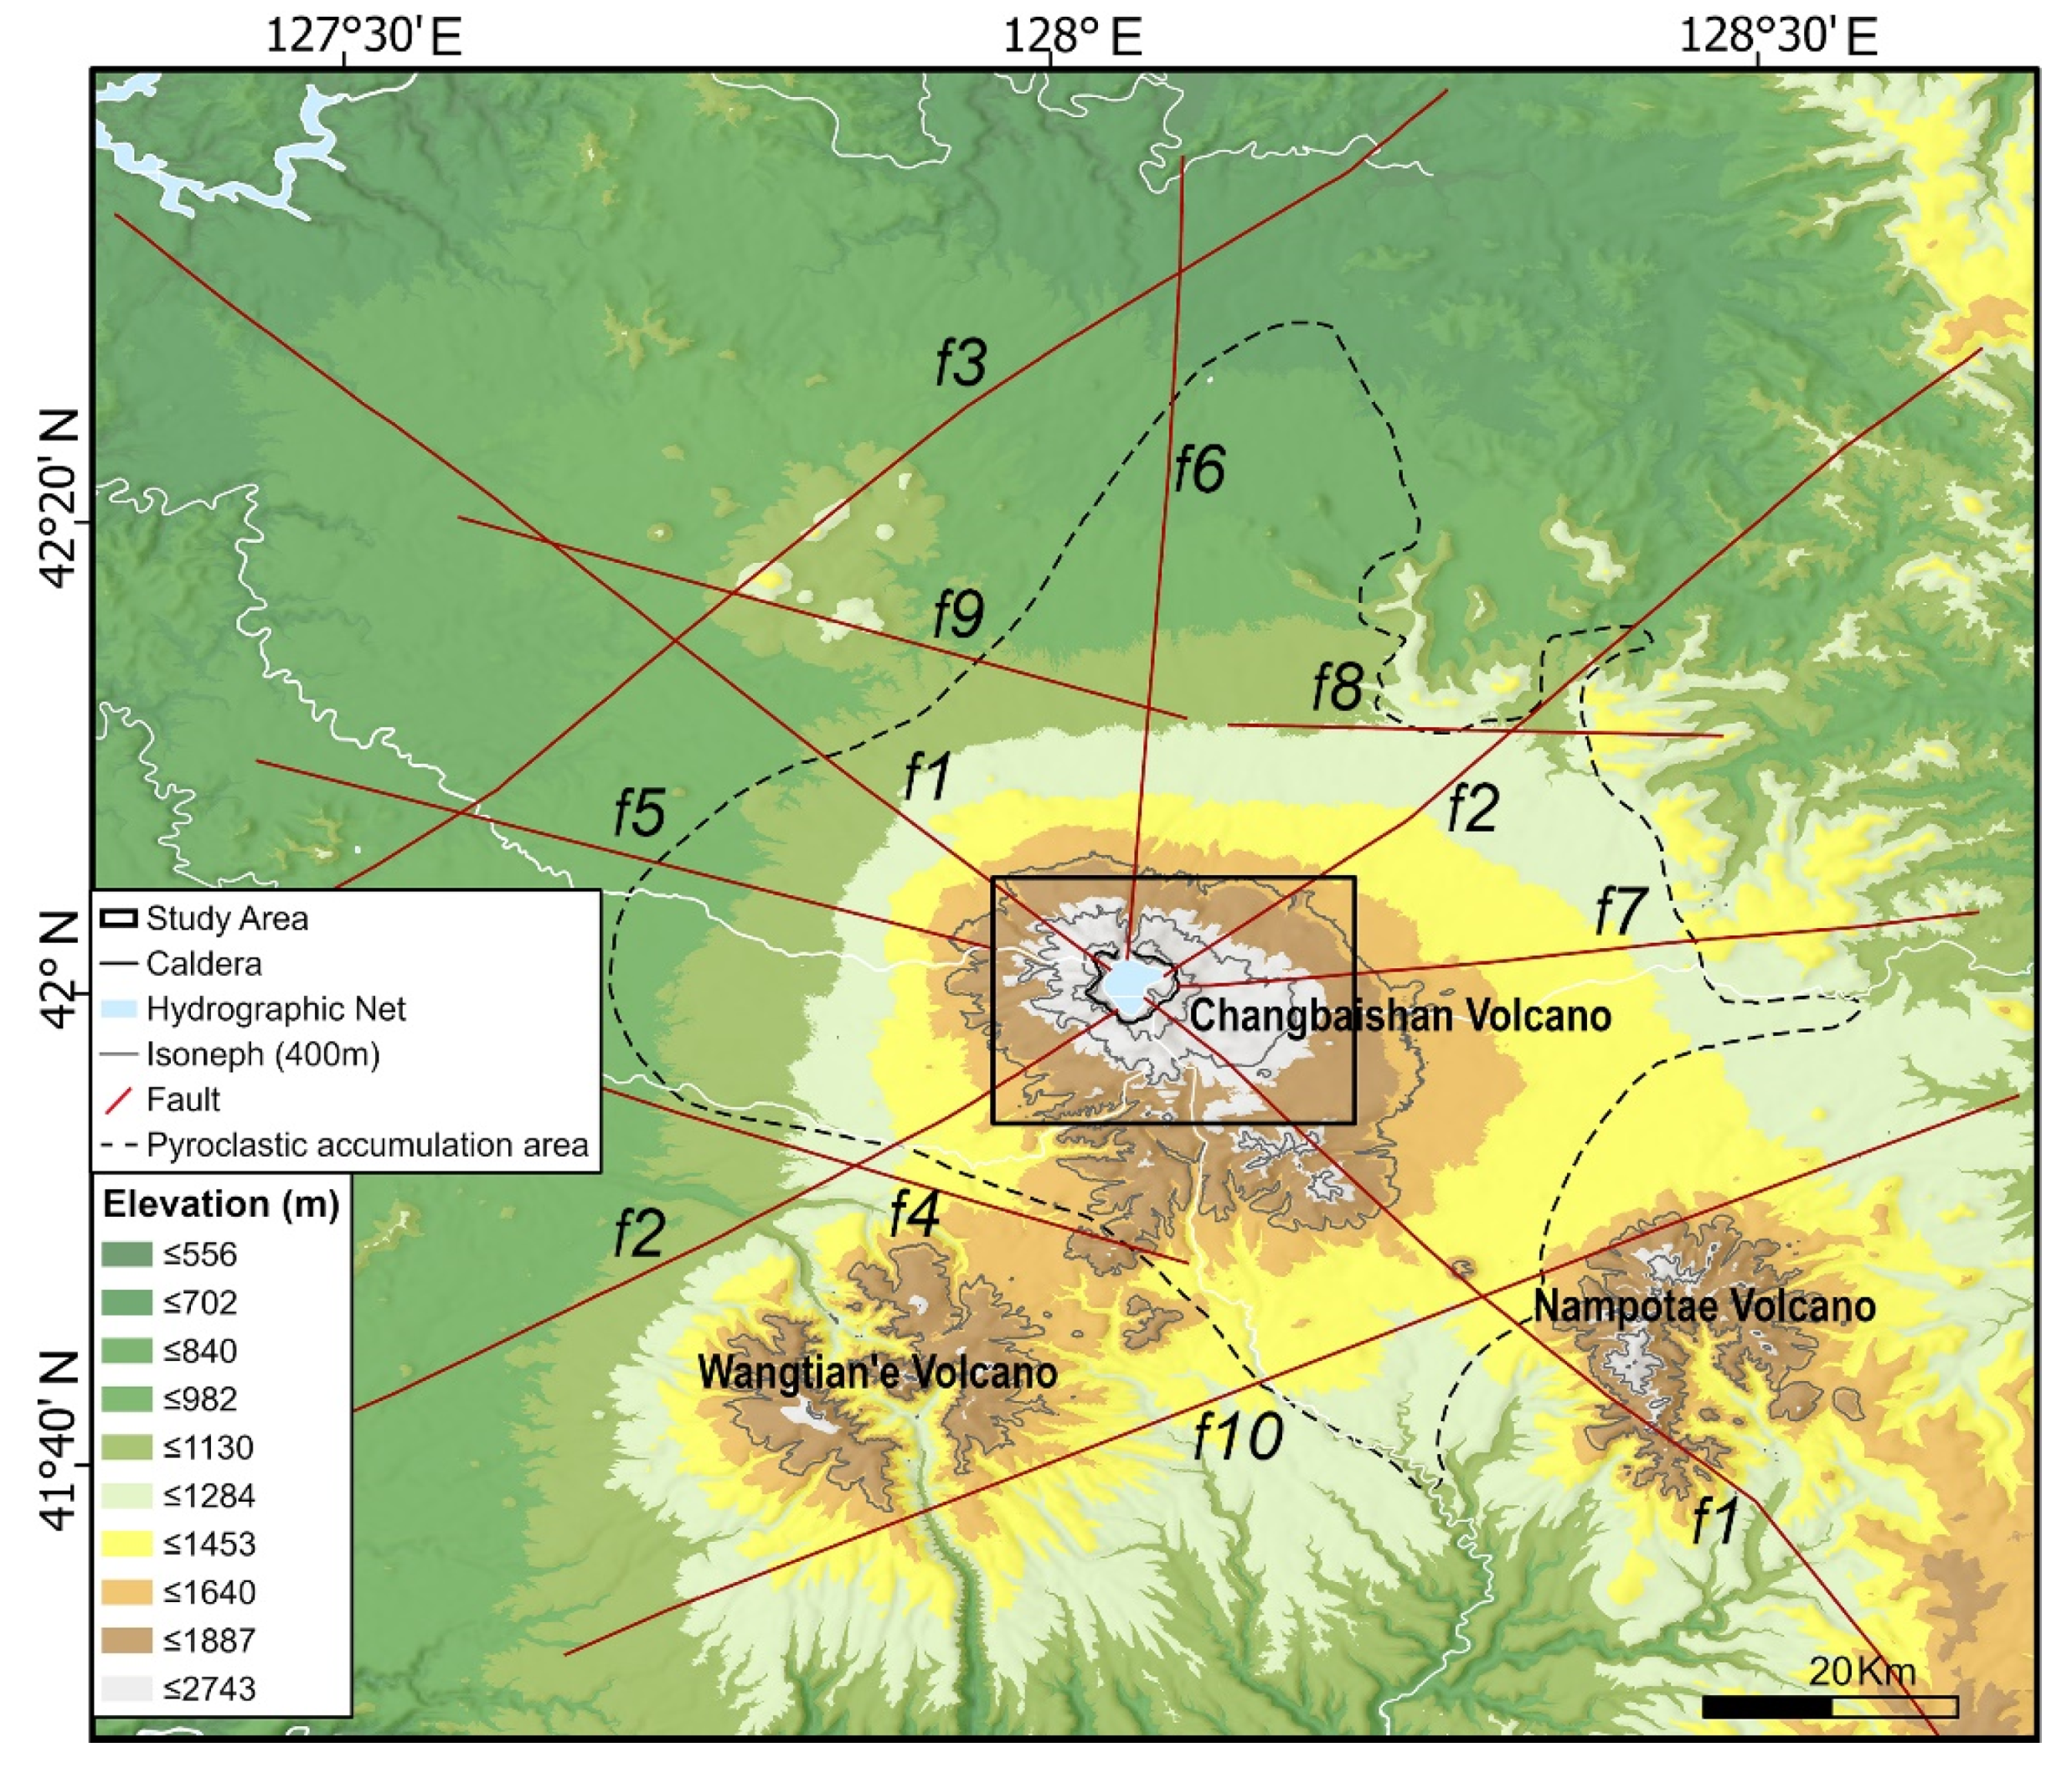
2.1. Regional Geology

The Changbaishan volcano is located on the border between China and North Korea in the east of Jilin Province, ranging from 41°30′N to 42°36′N and 127°22′E to 128°41′E (Figure 1). The highest altitude is about 2749.2 m, at Mount Baitou [2,3]. Here, Wangtian’e volcano is located approximately 30 km southwest, and Nampotae volcano is about 40 km northwest of the Changbaishan volcano. The three volcanoes belong to the evolutionary sequence of the Changbaishan volcano group, and the youngest active one is the Changbaishan volcano. It has a temperate continental mountain climate, with an average annual rainfall of 1333 mm. The snow cover always begins in October and ends in April (of the following year). More than 85% of the study area is covered by a dense forest, and there is a typical division of the vertical vegetation zones.
The Changbaishan volcano is located to the east of the Dunhua-Mishan fault in the outermost part of the Northeast Rift System, the front of the subduction zone of the Western Pacific Plate, and the northern edge of the ancient Sino- Korean craton fault [2,44,45]. There are mainly ten faults marked f1 to f10, as shown in Figure 1 [15,45,46,47,48]. Fault f1 is originated from Baishanzhen to Kimchaek in NW trending, which is nearly upright and 320 km in length. Fault f2 is from Liudaogou through the Changbaishan volcano until Zhenfengshan in NE trending, with a distance of 150 km, which is a compressive-shear fault. Faults f1 and f2 are the most significant geologic structures in the Changbaishan region, which dominated the shape of the Changbaishan volcano. Fault f3, a strike-slip fault with a length of over 120 km, is extended from Mayihe to Liangjiang in NE trending. Fault f4 is from Manjiang to Baishan in NWW trending, and a fault cliff in V shape is developed along this fault, forming the main valley of the Manjiang River. Fault f5, with a length of about 50 km, is from Songshan to Tianchi in NWW trending, a radial fault in the west of the Changbaishan volcano. Fault f6 is a tensile fault with NNE trending, which is from Tianchi to Hongtoushanzi. Faults f7 is from Tianchi to Tumen River, spreading along the NW direction, controlling the Pleistocene basalt volcanic group in the study area. Faults f8, f9, and f10 are interpreted with the remote sensing technique by Chen [46].

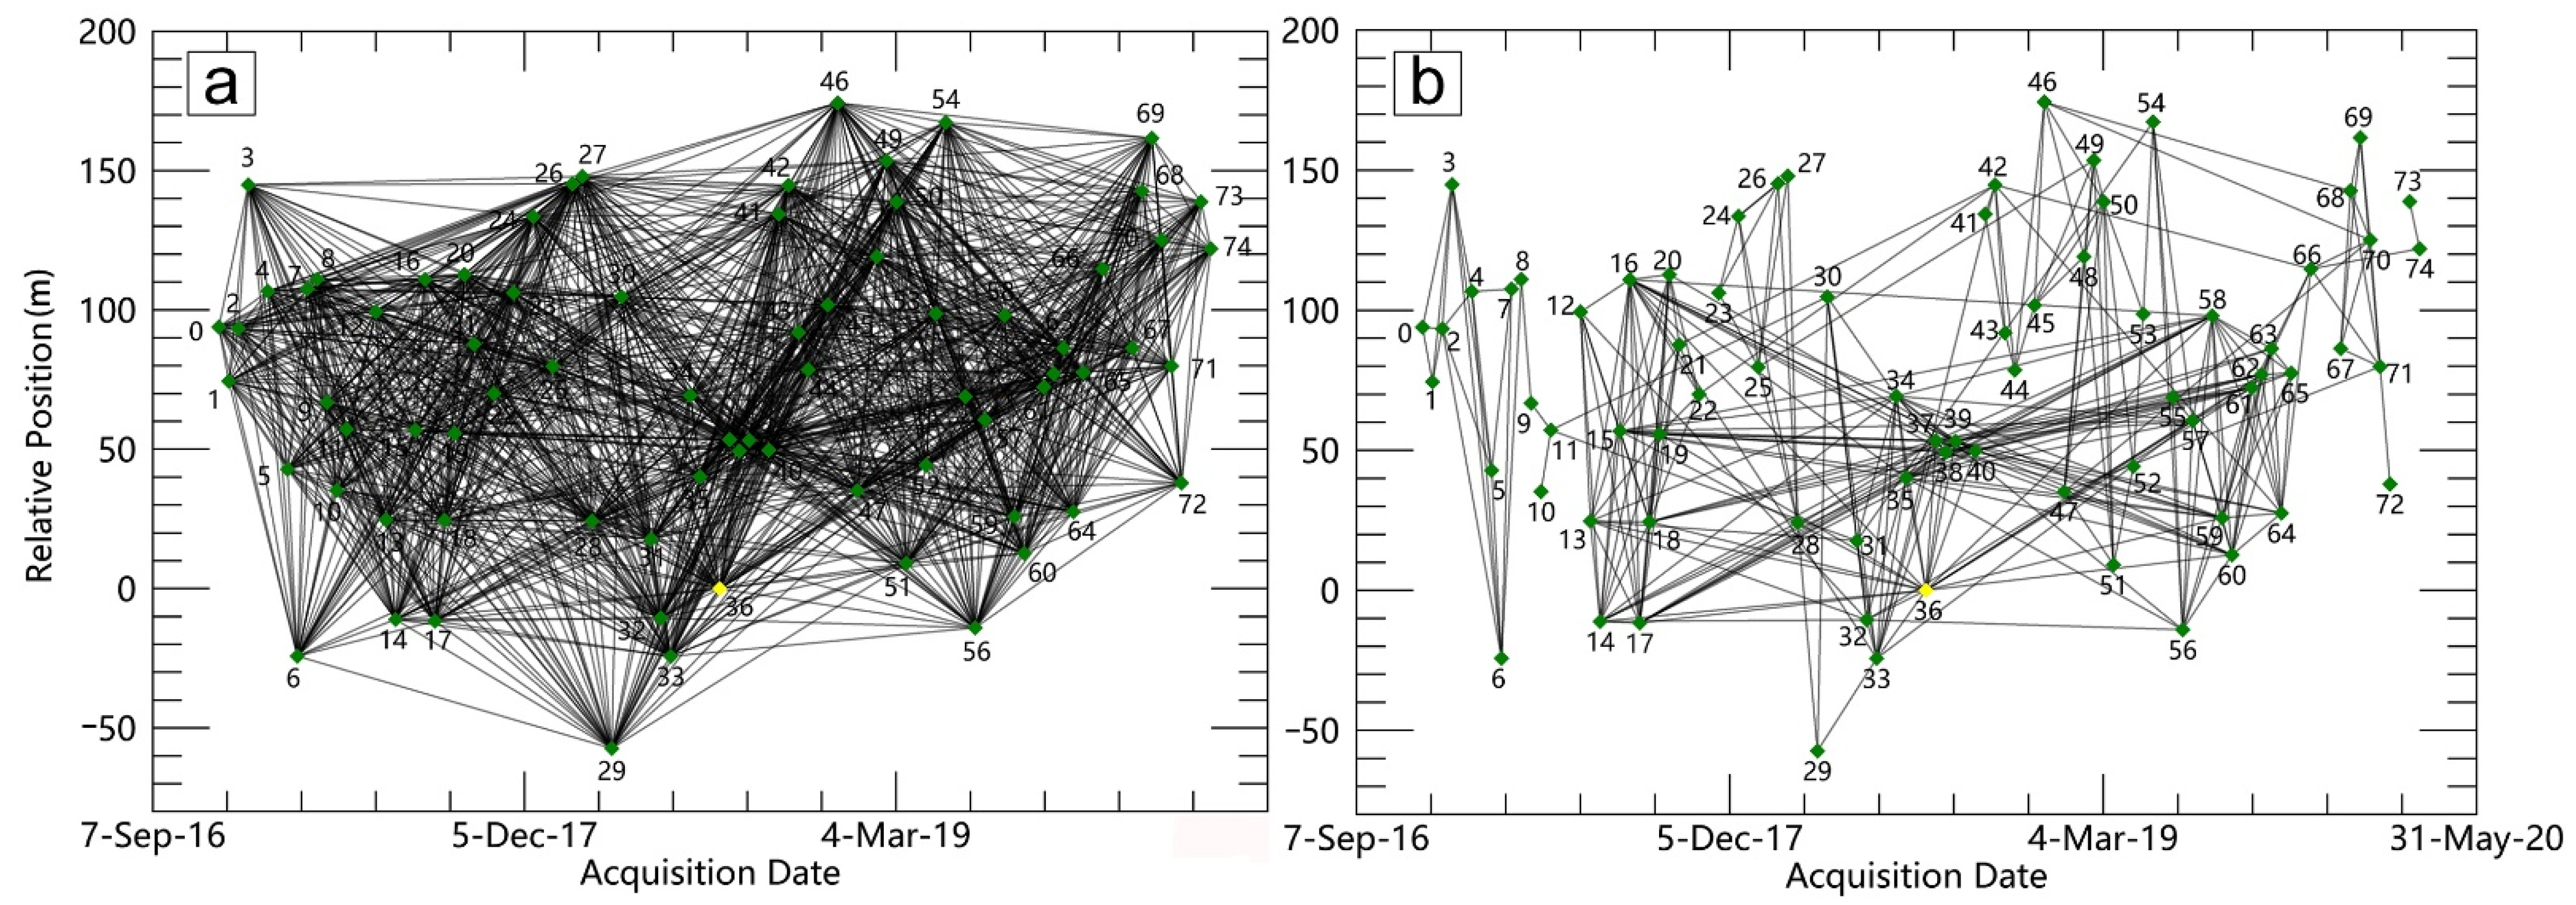
2.2. Sentinel-1B SAR Data

The Sentinel-1B satellite was launched on 25 April 2016, and it began to acquire SAR data products in C-band at a 5.4 GHz frequency in August 2016 by the European Space Agency (ESA) Copernicus program. As an earth observation satellite, the 12-day revisit period is reasonably short, and the orbit determination ephemeris is highly accurate, making Sentinel-1B SAR data widely used to monitor the surface deformation in extensive regions [49,50].
To obtain the time series surface deformation of the Changbaishan volcano, 75 descending orbit images were used continuously from 2016 to 2020. The detailed information of the selected data is listed in Appendix A Table A1. All the data are single look complex (SLC) products, with descending orbit (path = 134), interferometric wide swath (IW) mode, and VV polarization. The spatial resolution of the data is 20 m × 5 m. Moreover, the time interval of continuously acquired images is limited to one revisit period (12 days) to three revisit periods (36 days) to maintain a high coherence. Then, with the available 75 scenes of the SAR data, the perpendicular baseline is less than 180 m, with an average of 83 m, according to Appendix A Table A1. The above parameters are better compared with the SAR data used by Tang P. et al. [35] and Kim et al. [33,34], when studying the surface deformation in the Changbaishan volcano.
Additionally, ALOS World 3D-30 m (AW3D30) data, global digital surface model (DSM) data released by Japan Aerospace Exploration Agency (JAXA) in May 2015, have been used to coregister the SAR images accurately and to correct interferograms brought by the topography. The spatial resolution of the data is 30 m, and the elevation accuracy is 5 m [51]. To avoid the baseline error, caused by the error-containing orbit information, the POD precise orbit ephemerides data are also used, whose orbit determination accuracy is better than 5 cm [51].

3. Data Processing

3.1. Subsection

SBAS-InSAR is systematically and widely used to retrieve the deformation field of the volcanic region, and it can document centimeter- to millimeter-scale slow surface deformation [52]. By the free combination of 75 SAR images, with short time intervals and perpendicular baselines, the influences of spatiotemporal decoherence and atmospheric delay can be well-suppressed with the SBAS-InSAR technique.
In this study, the SBAS-InSAR method was performed with SARSCAPE software, which was developed by the SARMAP AG Company. At first, by selecting a definite temporal-spatial baseline threshold (according to Figure 2, the time baseline is 430 days and perpendicular baseline is 180 m) and considering the Doppler center frequency difference, the data set is divided into different subsets by Delaunay triangulation to generate 1533 interferometric pairs (Figure 2a). Then, the accuracy of the sub-pixel level was achieved by using the external DEM data for the auxiliary accurate co-registration. Additionally, each pair of matched images was imaged by interference, and interferogram and coherence coefficient maps were obtained. Finally, after evaluating the quality of all interferograms and coherence coefficient maps, the interferometric pairs with low coherence were removed, and only 309 interferometric pairs were kept (Figure 2b).
The reference DEM was used to remove the flat effect phase and topographic phase, and an adaptive power spectrum filter [53] was adopted to reduce the phase noise in the interferograms before phase unwrapping with the Delaunay minimum cost flow (Delaunay MCF) [54] method.
A total of 86 ground control points were selected in the regions with high coherence coefficients, which were used to estimate and remove the phase changes caused by orbit error, the residual topography phase, and slope phase in unwrapping phase superposition, using the cubic polynomial refinement method. Then, a linear model between deformation velocity and elevation coefficient, based on highly coherent pixels, was established to derive the residual height and preliminary deformation, and the singular value decomposition method was applied to search the least-squares solution for each coherent pixel, as well as to estimate the nonlinear deformation. After eliminating the influence of atmospheric delay through a spatial-temporal filter, the cumulative surface deformation (CSD) and mean deformation velocity (MDV) along the line of sight (LOS) were obtained, at last (Figure 3).

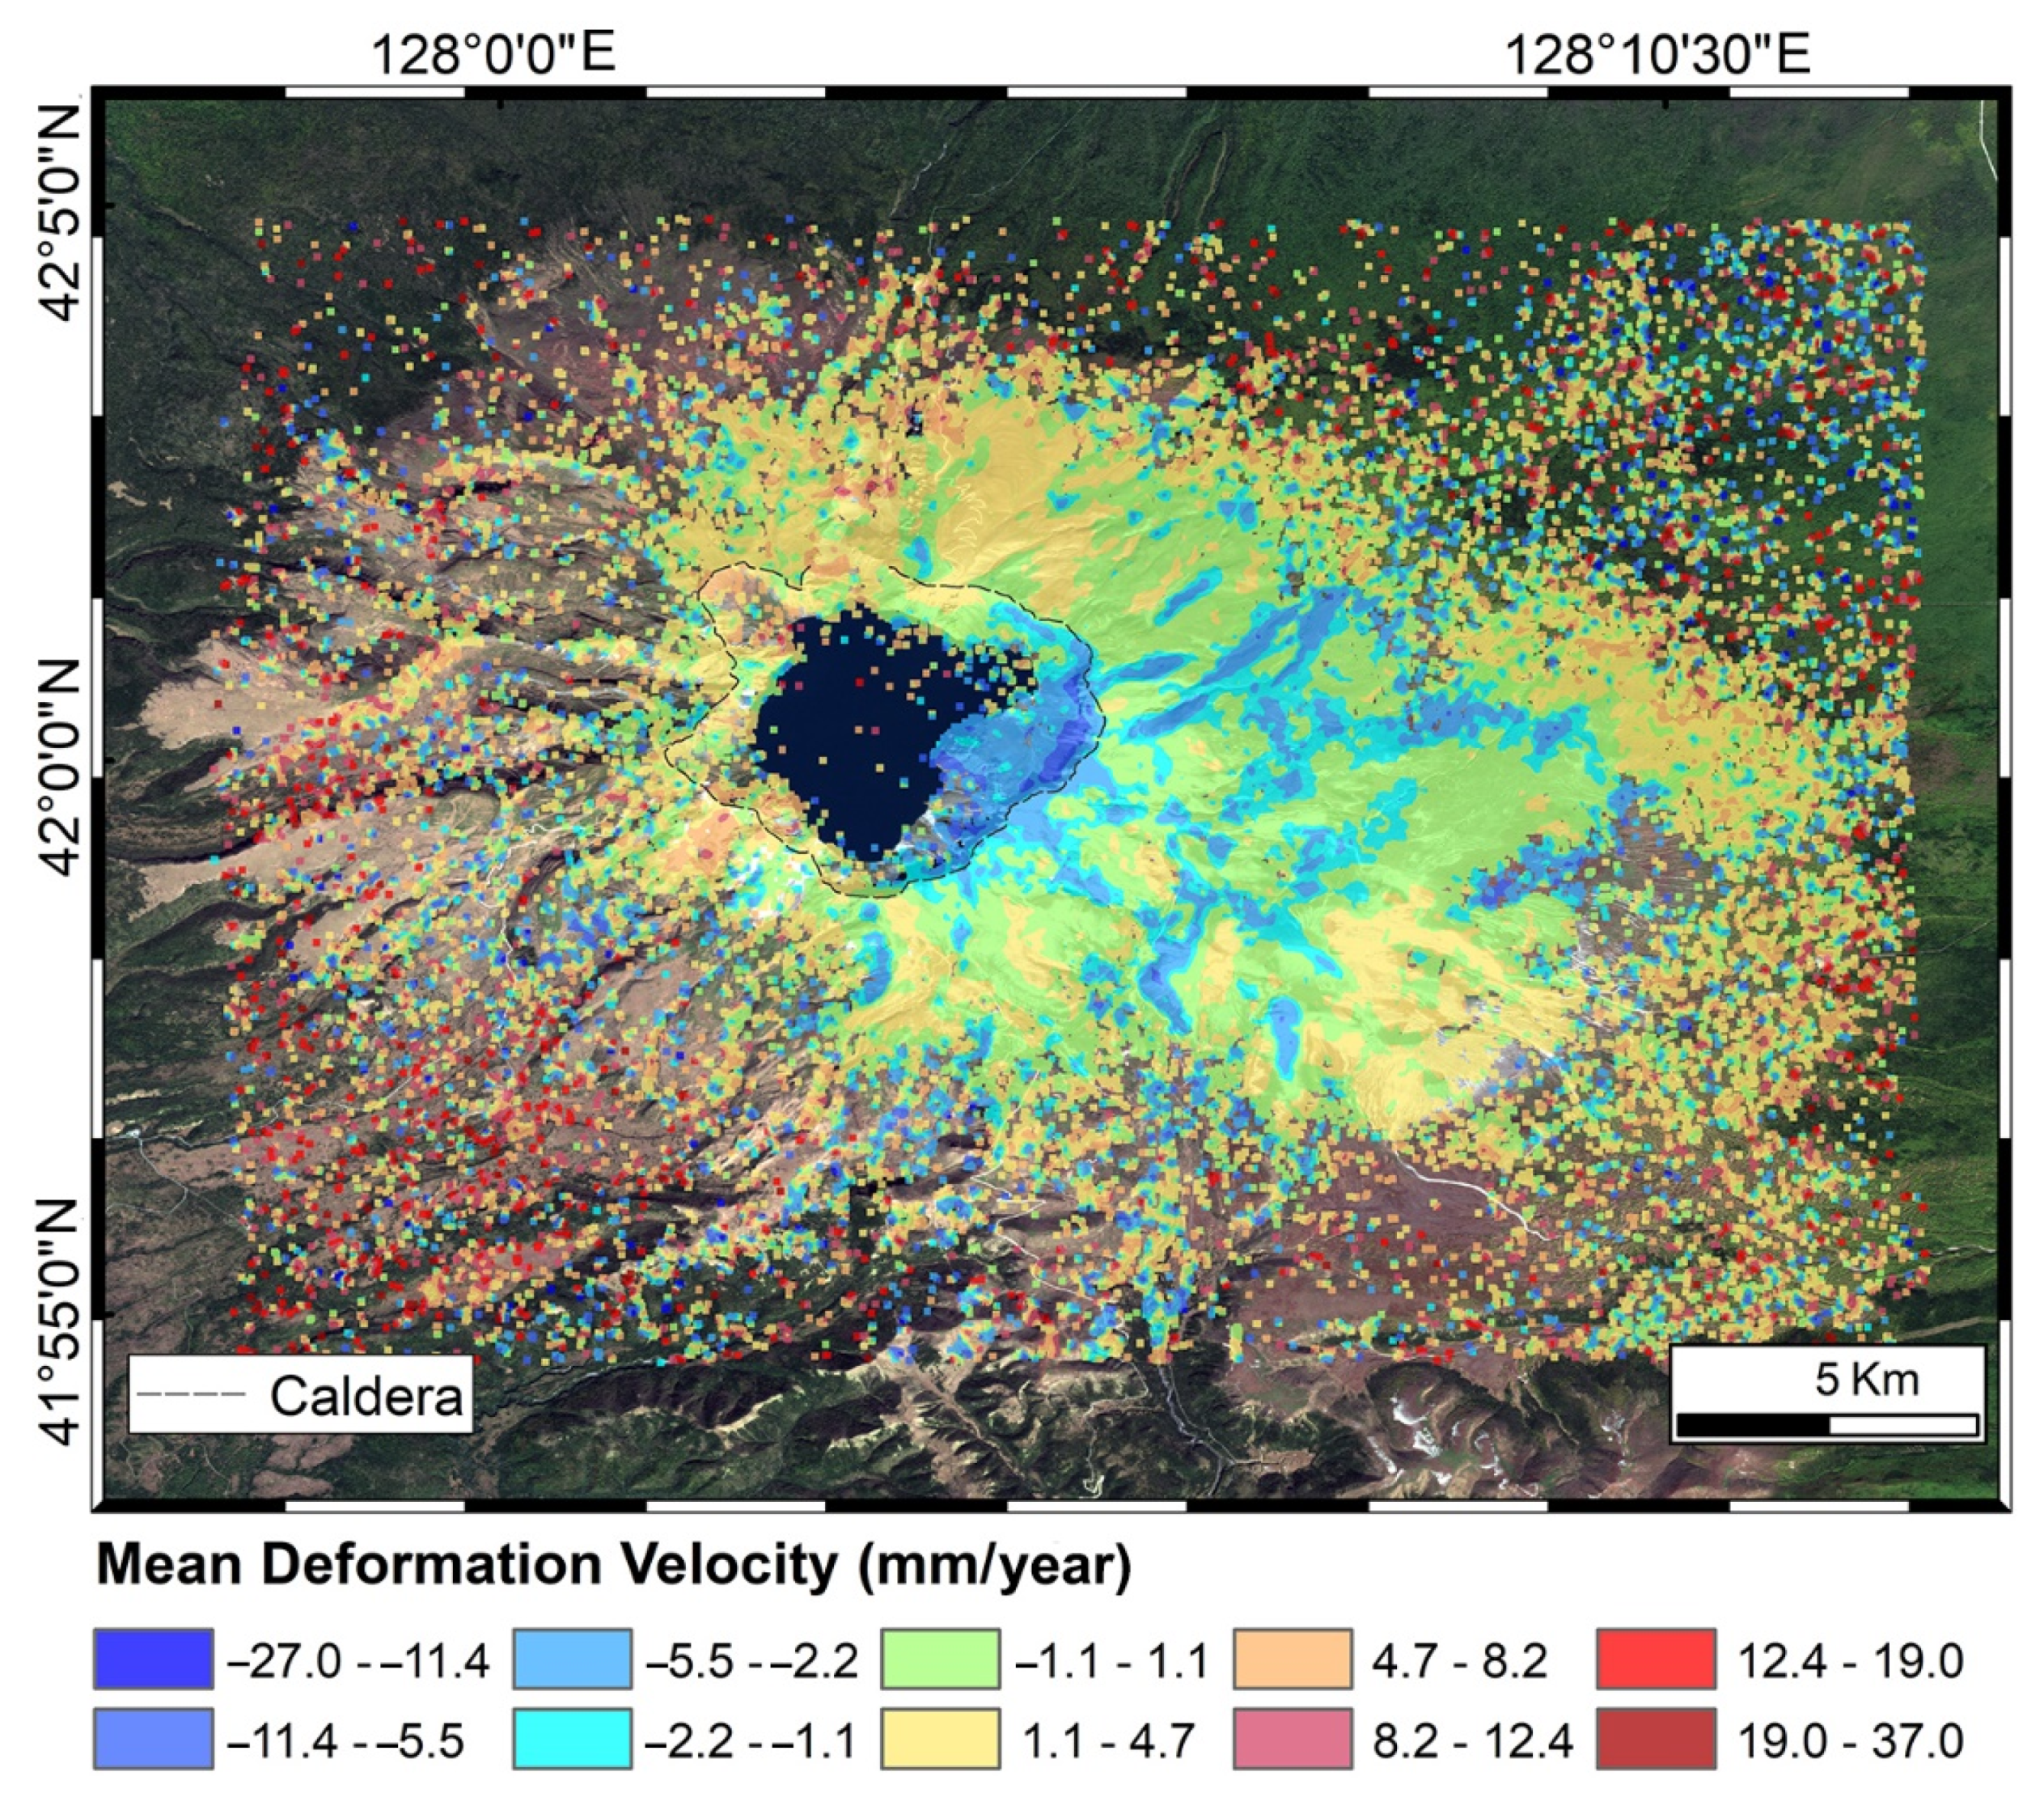
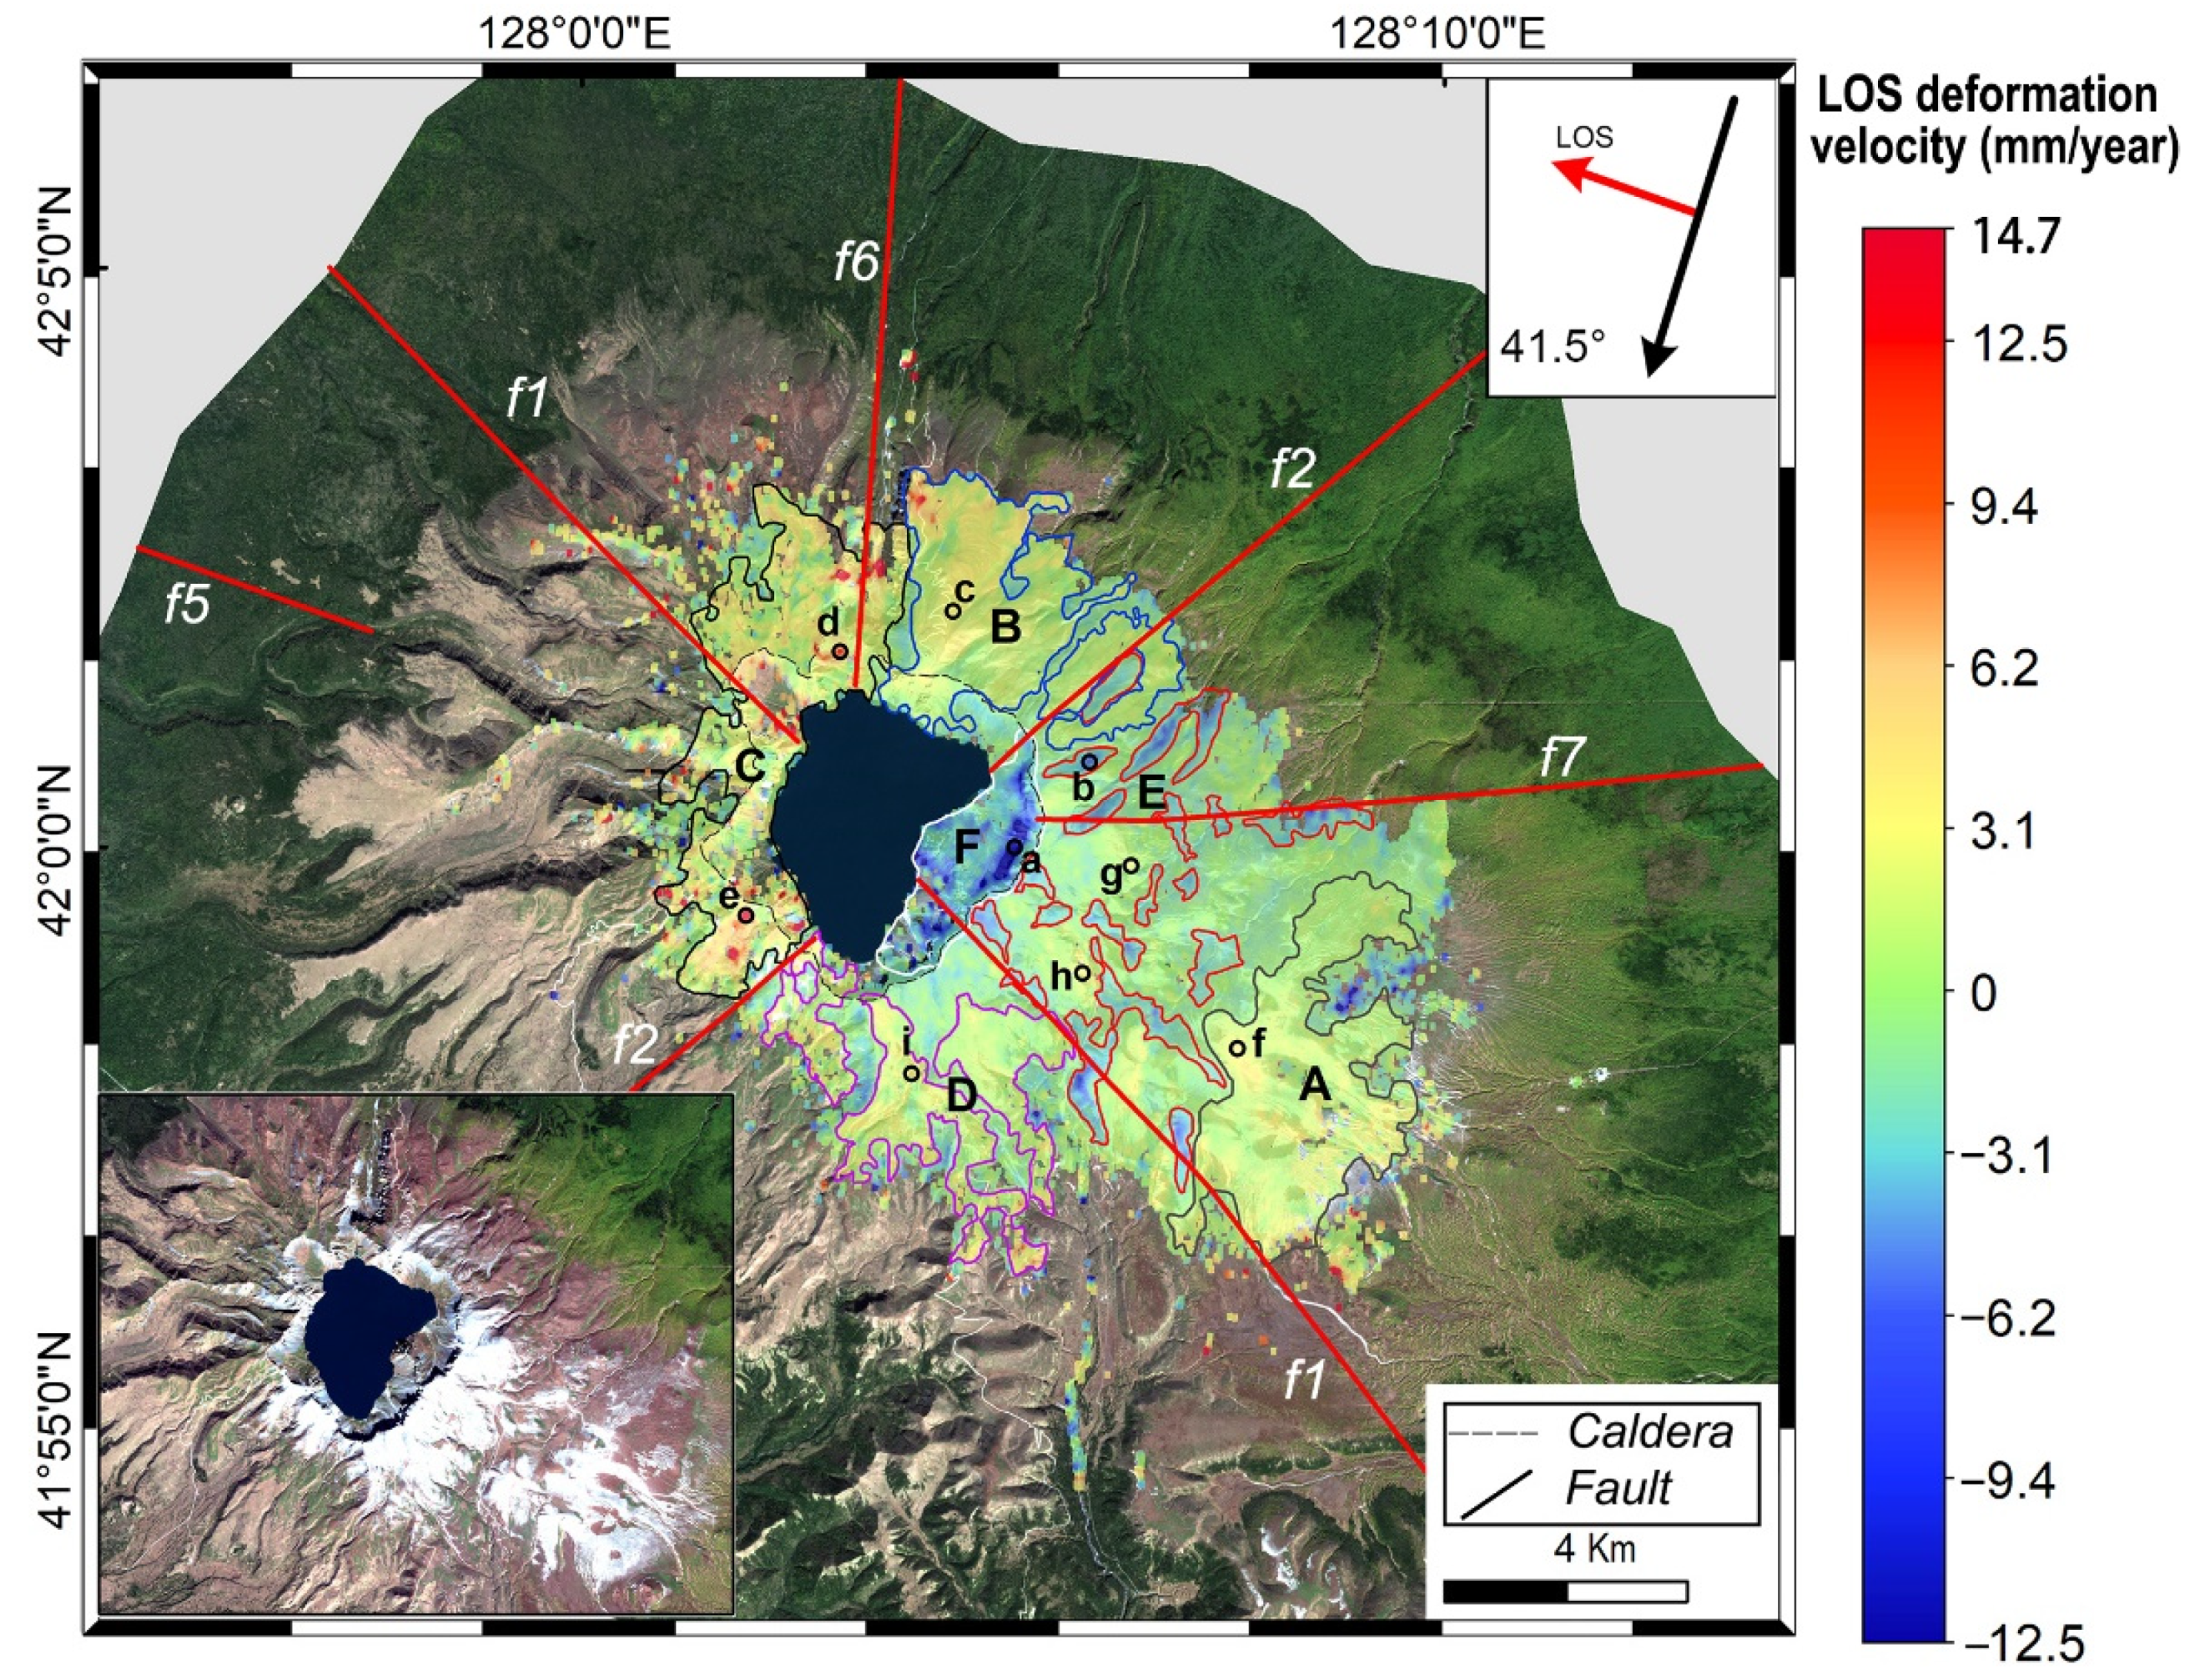
3.2. Mean Deformation Velocity (MDV) in Changbaishan Volcano

Figure 3 shows that the number of the points with the estimated MDV are densely distributed on the northern and eastern slopes of the Changbaishan volcano, which is brought by the observation mode of the Sentinel-1B instrument orientating in this direction.
However, Figure 3 shows that the MDV is heavily dispersed in the Changbaishan volcano. Generally, the relatively lower absolute values mainly occur in the regions surrounding Tianchi caldera, while the relatively larger values (absolute values) occur in the region far from the caldera. Particularly, there also exist abnormal values in the caldera lake due to the specular reflection of SAR signals by water surface. Additionally, in the regions relatively far from Tianchi caldera, the abnormally large or small deformation values are irregularly distributed. Considering that the ground surface in these regions is densely covered by the vegetation and the climate in the Changbaishan volcano is rather complex, the influence of the atmospheric effect and surface topography will bring a severely temporal de-coherence of the scatterers and result in the dispersity of the surface deformation results. Thus, it is indispensable to refine the reliability of the calculated MDV.

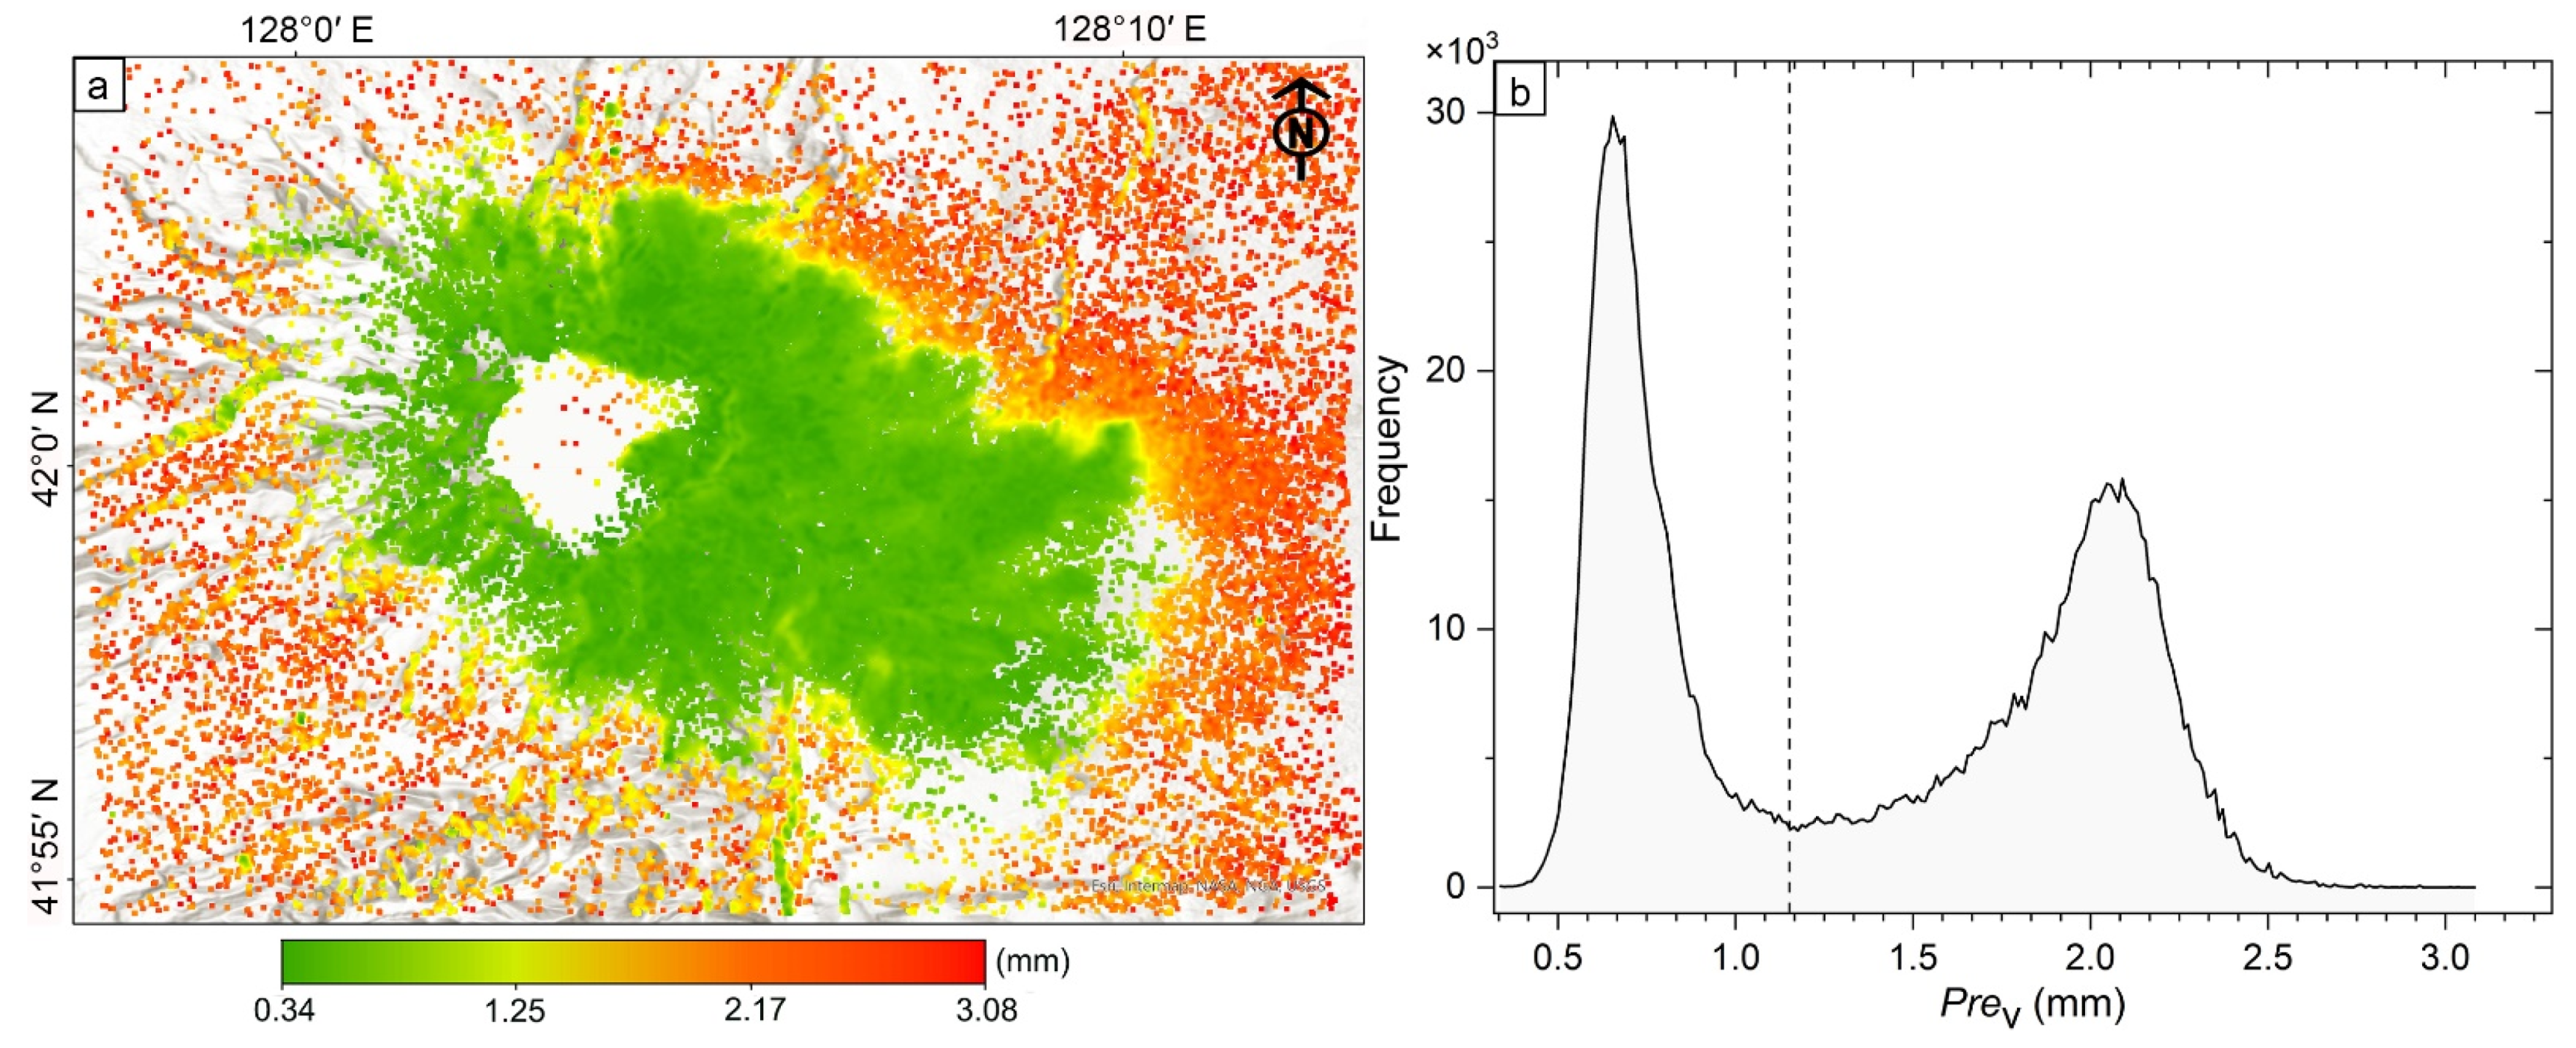
3.3. Reliability Analysis

Here, the standard deviation of coherence is introduced to refine the MDV obtained with SBAS-InSAR method, which can be used to evaluate the quality of the retrieved results [33,55]. The corresponding formula is expressed as:
P r e v = λ 4 π 1 γ 2 2 γ 2
where λ is the SAR wavelength, γ is interferometric coherence, and Prev is the estimated value of the MDV accuracy. Based on Equation (1), the Prev of every inverted MDV point in the Changbaishan volcano can be calculated, as is shown in Figure 4a.
Figure 4 shows the relatively lower Prev values with green color and extending towards the southeast direction surrounding Tianchi caldera and the rather large values in the remaining place largely with red and yellow colors. That is, the MDV around Tianchi caldera are relatively higher accuracy.
To identify the surface deformation with high accuracy, the statistical histogram of the Prev is generated (Figure 4b), which shows a bimodal characteristic. The first mode ranges from 0.34 to about 1.176 mm, with the peak at 0.64 mm, representing the deformation values with higher accuracy. The second mode is from 1.176 to 3.08 mm with the 2.07 mm peak, representing the deformation values with poor accuracy. Thus, the surface deformation map of the Changbaishan volcano is generated with the first-mode Prev constraint (Figure 5).
Figure 5 shows that, after Prev constraint, the abnormal deformation values in the caldera lake and the regions relatively far from Tianchi caldera are totally eliminated in Figure 5. Compared to the previous studies [31,32,33,34,35], several new phenomena should be mentioned.
First, the uplift is different in dynamic ranges. Our result shows that the uplift velocity is generally from 0 to 5 mm/year. The maximum uplift velocity was 14.7 mm/year, which only existed in some isolated spots on the western slope. Comparatively, the uplift is generally from 0 to 35 mm by Kim et al. [33], 0 yearto 30 mm/year by Kim et al. [34], 0 yearto 5 mm/year by Han et al. [31], 0 yearto 6 mm/year by Tang P. et al. [35], 0 yearto 10 mm/year by He et al. [32], and 0 yearto 20 mm/year by Trasatti et al. [42]. Generally, the dynamic range of the uplift in this study is clearly smaller than that obtained by Kim et al. [33,34], but similar to that estimated by the others.
Second, Kim et al. [33,34] found a region with clearly uplift in the eastern slope, marked by A centered at (41°58′N, 128°08′E), which is clearly expressed in our study. Kim et al. [33] proposed that the uplift is about 30 mm/year. Here, Trasatti et al. [42] provided an up to 15 mm/year uplift, while it is only about 3 mm/year in our results. Besides Region A, more regions with similar uplift are found in this study, and they mainly exist in Regions B (42°1′53″N, 128°4′53″E), C (42°0′51″N, 128°2′16″E), and D (41°58′0″N, 128°4′10″E).
Third, besides the uplift, there also occur subsidence in abundant regions, which is seldom mentioned in the previous studies. The most apparent subsidence occurs in the eastern inner wall of Tianchi caldera (Region F, centered at (42°0′2″N, 128°4′39″E)), with obvious landslide characteristics. The area is about 4.45 km2, and the maximal MDV is nearly −11.3 mm/year. Additionally, subsidence occurs in multiple regions with considerable area in the eastern slope of the Changbaishan volcano and a few patches with relatively small areas in the southern and northern slopes, including Region E (41°59′44″N, 128°6′38″E).
The reason to these phenomena will be further discussed in the following section.

4. Discussion

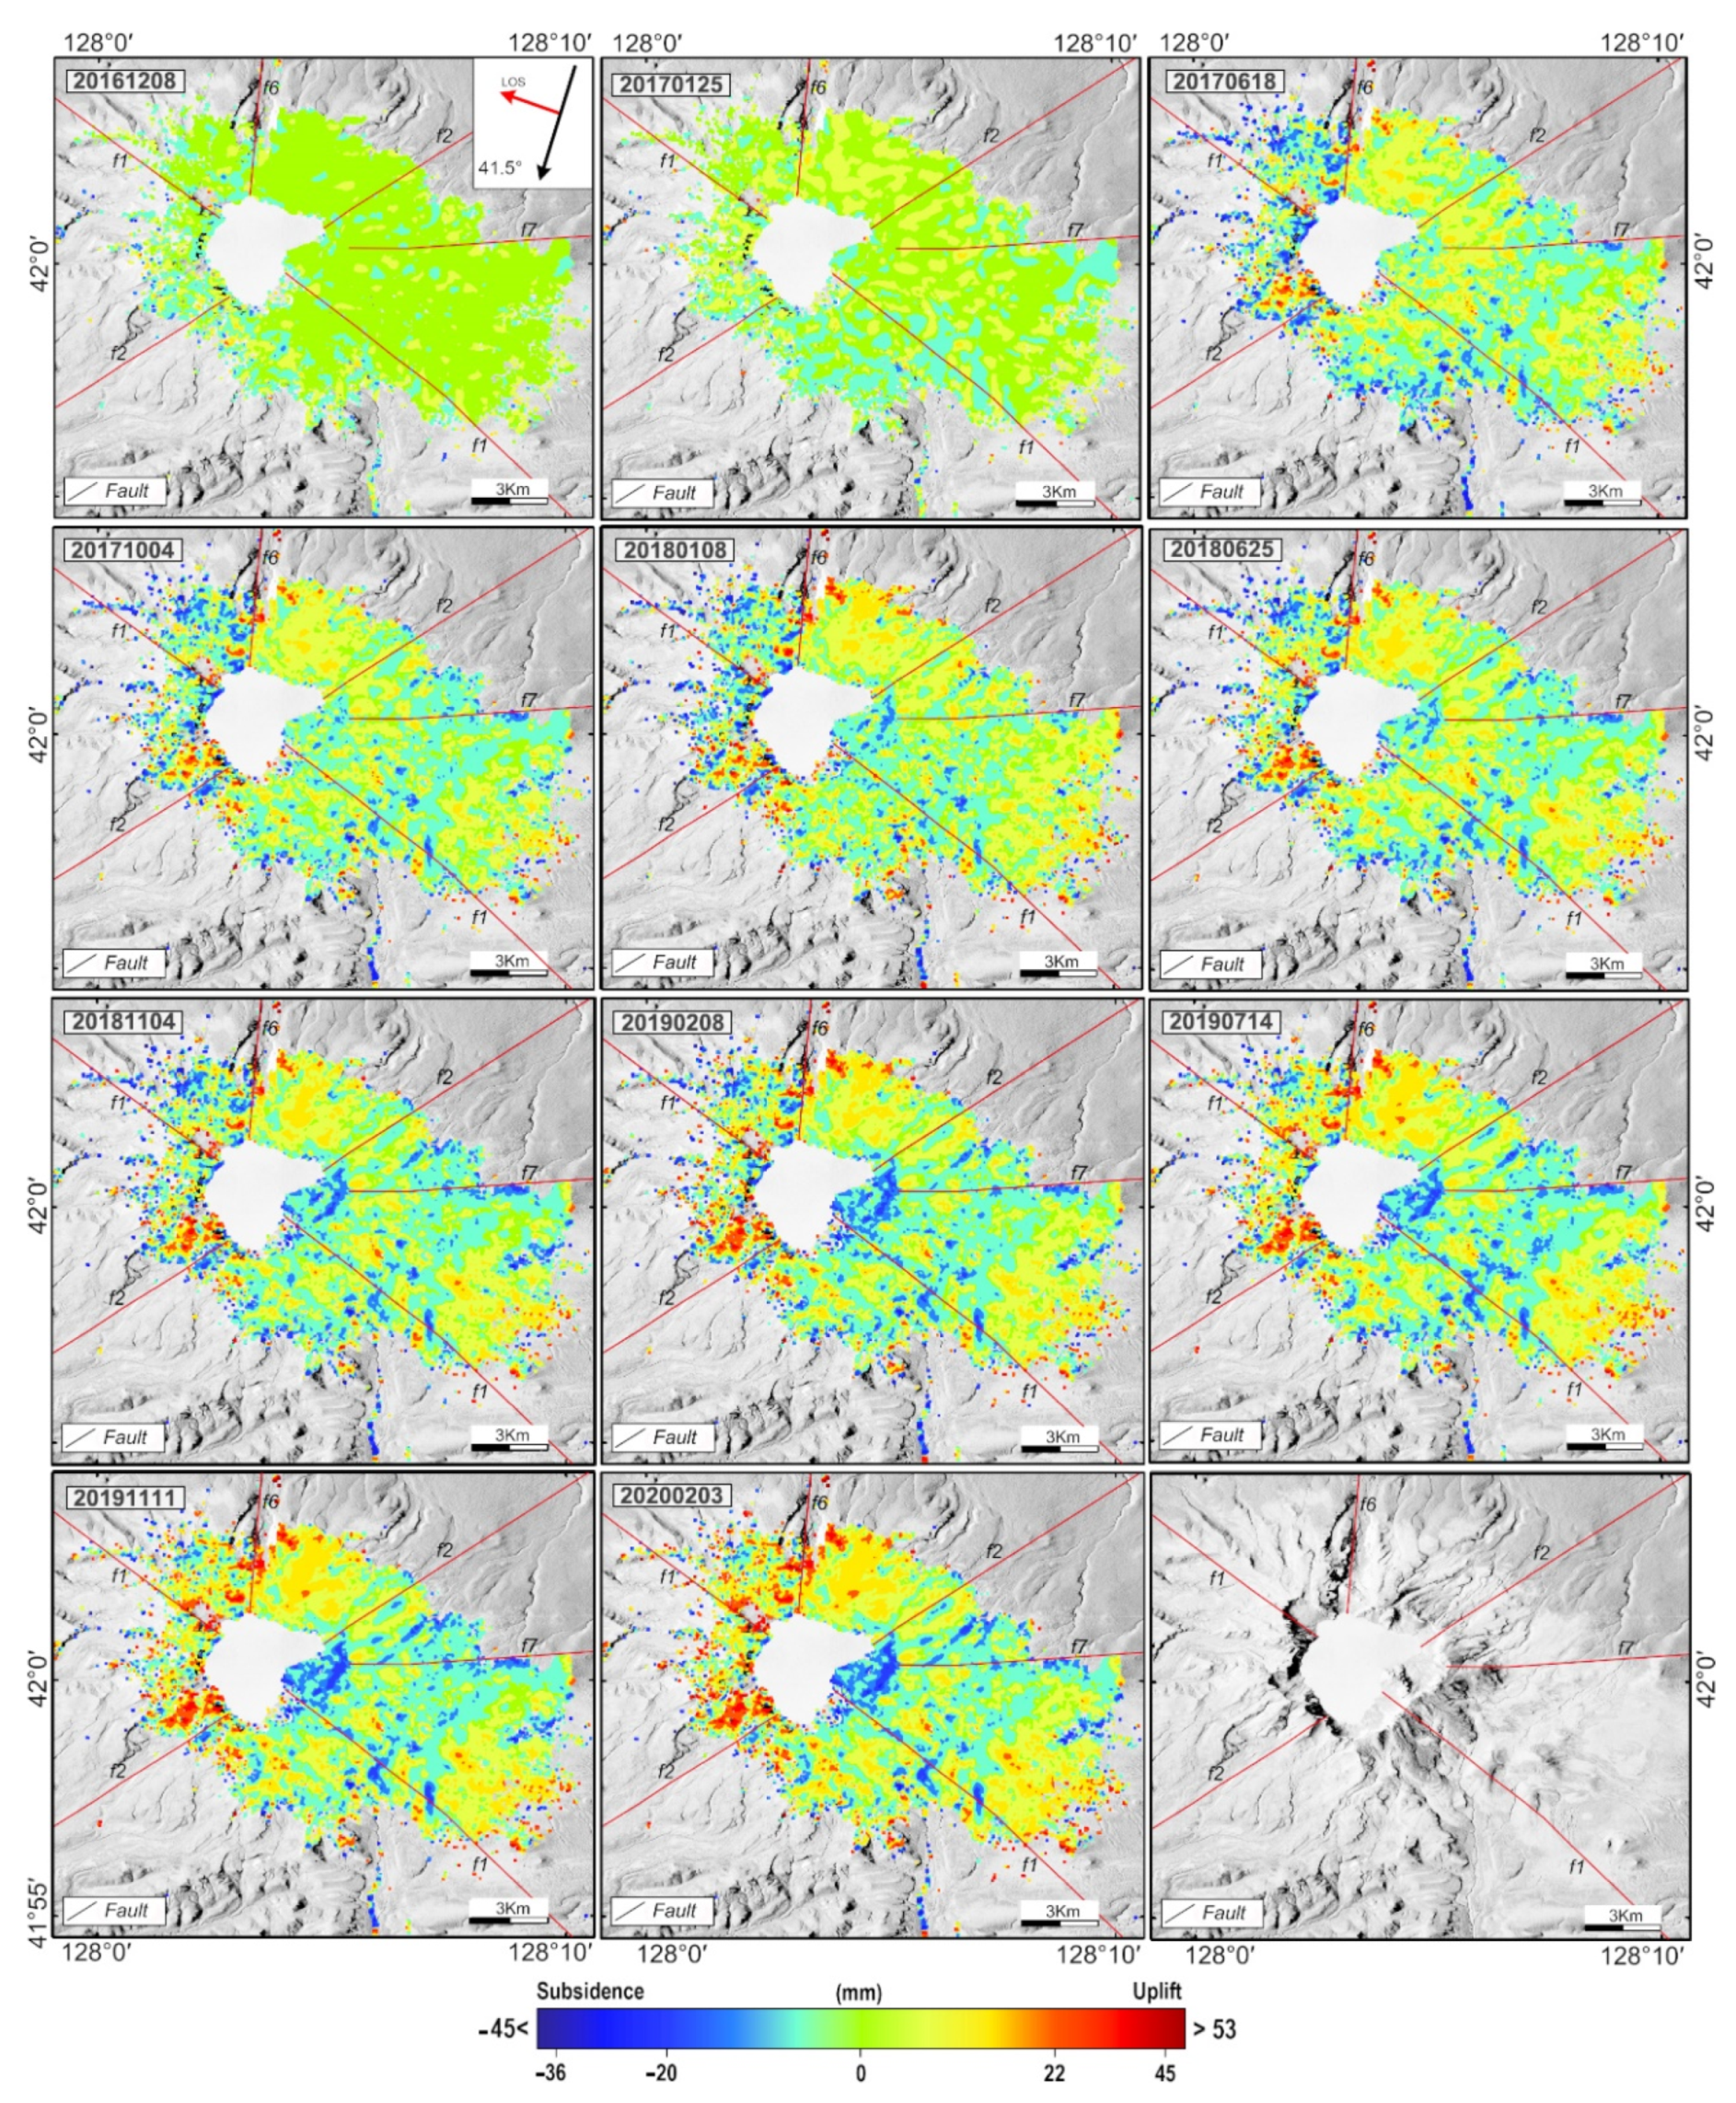
4.1. Spatial Distributions of Surface Deformation Fields

Generally, Figure 5 shows a fresh view of the surface deformation in the Changbaishan volcano, which is expressed in the following aspects.
(1)
The uplift is locally distributed.
Figure 5 shows that there occur abundant regions with uplift. Besides the uplift mentioned by Kim et al. [33,34] in Region A, the uplift mainly occurs in Regions B (northern slope) and C (western slope) of the Changbaishan volcano, and the deformation velocities of which are almost 2.2 mm/year, larger than that in Region A. Nearly all the most apparent uplifts occur in Region C in the western slope, and the mean uplift velocity is 4.37 mm/year. The highest uplift is up to 13.1 mm/year in Spots d (128°3′4″E, 42°1′46″N) and e (128°1′59″E, 41°59′29″N). Moreover, Region D in the southeastern slope is also uplifted, and its MDV is about 2.4 mm/year. In short, the uplifted extent is high in the east part of the study area in Region A, relatively low in the middle region located in the eastern and southern slopes, but highest in the western and northern slopes.
Interestingly, we notice that the boundaries of the locally distributed uplifts are related to the faults. Bounded by fault f2, the uplift degree of the northwestern part was generally higher than that of the southeastern part. Besides, along fault f1, there occur several patches with almost highest uplift in the northern part, while the east boundary of Region D and west boundary of Region A approximate the fault. Additionally, the surface deformation is clearly different between the east and west sides of fault f6.
To better understand the relationship between the surface deformation and the influence of the tectonic activities, the CSDs in multiple time spans are generated, as shown in Figure 6. Figure 6 verifies the influence of the tectonic activities on the evolution of the surface deformation, which is expressed as follows.
First, fault f2 is essential in controlling the variation of the locally distributed uplift. In December 2016 and January 2017, the difference is unclear between the two sides of the fault. Whereas from June 2017, the CSD in the west side is clearly higher than that in the east side, and the difference becomes fairly apparent in February 2020. Additionally, in February 2020, the uplift in the west side is almost the highest in the Changbaishan volcano, indicating that fault f2 plays a decisive role in the surface deformation in the study area. This phenomenon also agrees well that fault f2 is a significant dip-slip reverse fault in the Changbaishan volcano [45,46,47,48].
Second, fault f6 should also be in active. Bounded by fault f6, abundant spots with considerably large surface deformation occur in the west side and the local moderate uplift occurs in the east side, which is clearly expressed by the CSDs from June 2017. This means the strong correlation between fault f6 the locally distributed CSDs in the Changbaishan volcano, and its importance is just next to fault f2. However, the importance of fault f6 is not mentioned before, indicating that this should be an ignored significant fault.
Finally, the relationship between fault f1 and the locally distributed CSDs is not clear. Jin and Zhang [47], Liu et al. [48], Li et al. [45], Trasatti et al. [42], and Chen [46] proposed that fault f1 is one of the crucial faults in the Changbaishan volcano. Figure 6 shows that the difference of the CSDs along fault f1 is not clear. However, we mentioned that there occur abundant spots with relatively highest CSD in the northwestern section of fault f1, and the eastern section passes through the northeast boundary of Region D and southwestern boundary of Region A. Additionally, Using 19 ALOS-2 images from ascending orbit, Trasatti et al. [42] proposed that the fault is most active from 2018 to 2020. Here, considering that the used Sentinel-1B SAR data are only along a descending orbit, the deformation pattern retrieved could be influenced by the LOS in this study. Due to the parallel between the LOS vector and the fault strike, the locally distributed CSDs along fault f1 is not clear with respect to the other faults. Therefore, we ranked fault f1 as the third most active fault.
Therefore, the strong correlation between the surface deformation and the faults means that the tectonic activities play an essential role in controlling the current surface deformation of the Changbaishan volcano. Additionally, from the deformation quantity as expressed in Figure 5 and Figure 6, it can be concluded that fault f2 plays a controlling role on the surface deformation in the Changbaishan volcano, followed by faults f6 and f1.
(2)
There occurs abundant regions with subsidence.
Apparently, the subsidence is widely distributed in the study area. On a local scale, it is mainly distributed in the eastern slope of the study area, including Regions E and F, and the largest subsidence is up to −11.3 mm/year. In an isolated pattern, it is commonly distributed in a linear shape along the valleys. Particularly in Region E, the subsidence in local scale is extended in the linear shape along the river gully. Thus, erosion should be the main possibility leading to subsidence in the Changbaishan volcano.
Li et al. [45,56] and Liu et al. [2] suggested that the Changbaishan volcano is covered with pumice pyroclastic rocks of the Yuanchi and Tianwen periods, as well as the alkali flow pyroclastic rocks of the Qixiangzhan period, which were easy to be eroded and transported again under the condition of water saturation and caused volcanic debris flow and other disasters [57]. Thus, the strong correlation between the shape and distribution of the subsidence and lithology of the strata verifies that the subsidence is mainly brought by the erosion of the strata, which is not related to the activity of the deep pressure source in the Changbaishan volcano.
Additionally, on a local scale, the subsidence is widely distributed in the eastern slope. Comparatively, the uplift occurs in its east-most region and the western slope of the Changbaishan volcano. The surface deformation of such kind is probably related to the relative movements between Asia and Pacific Ocean plates, which deserves to be further studied in a more extensive scale.

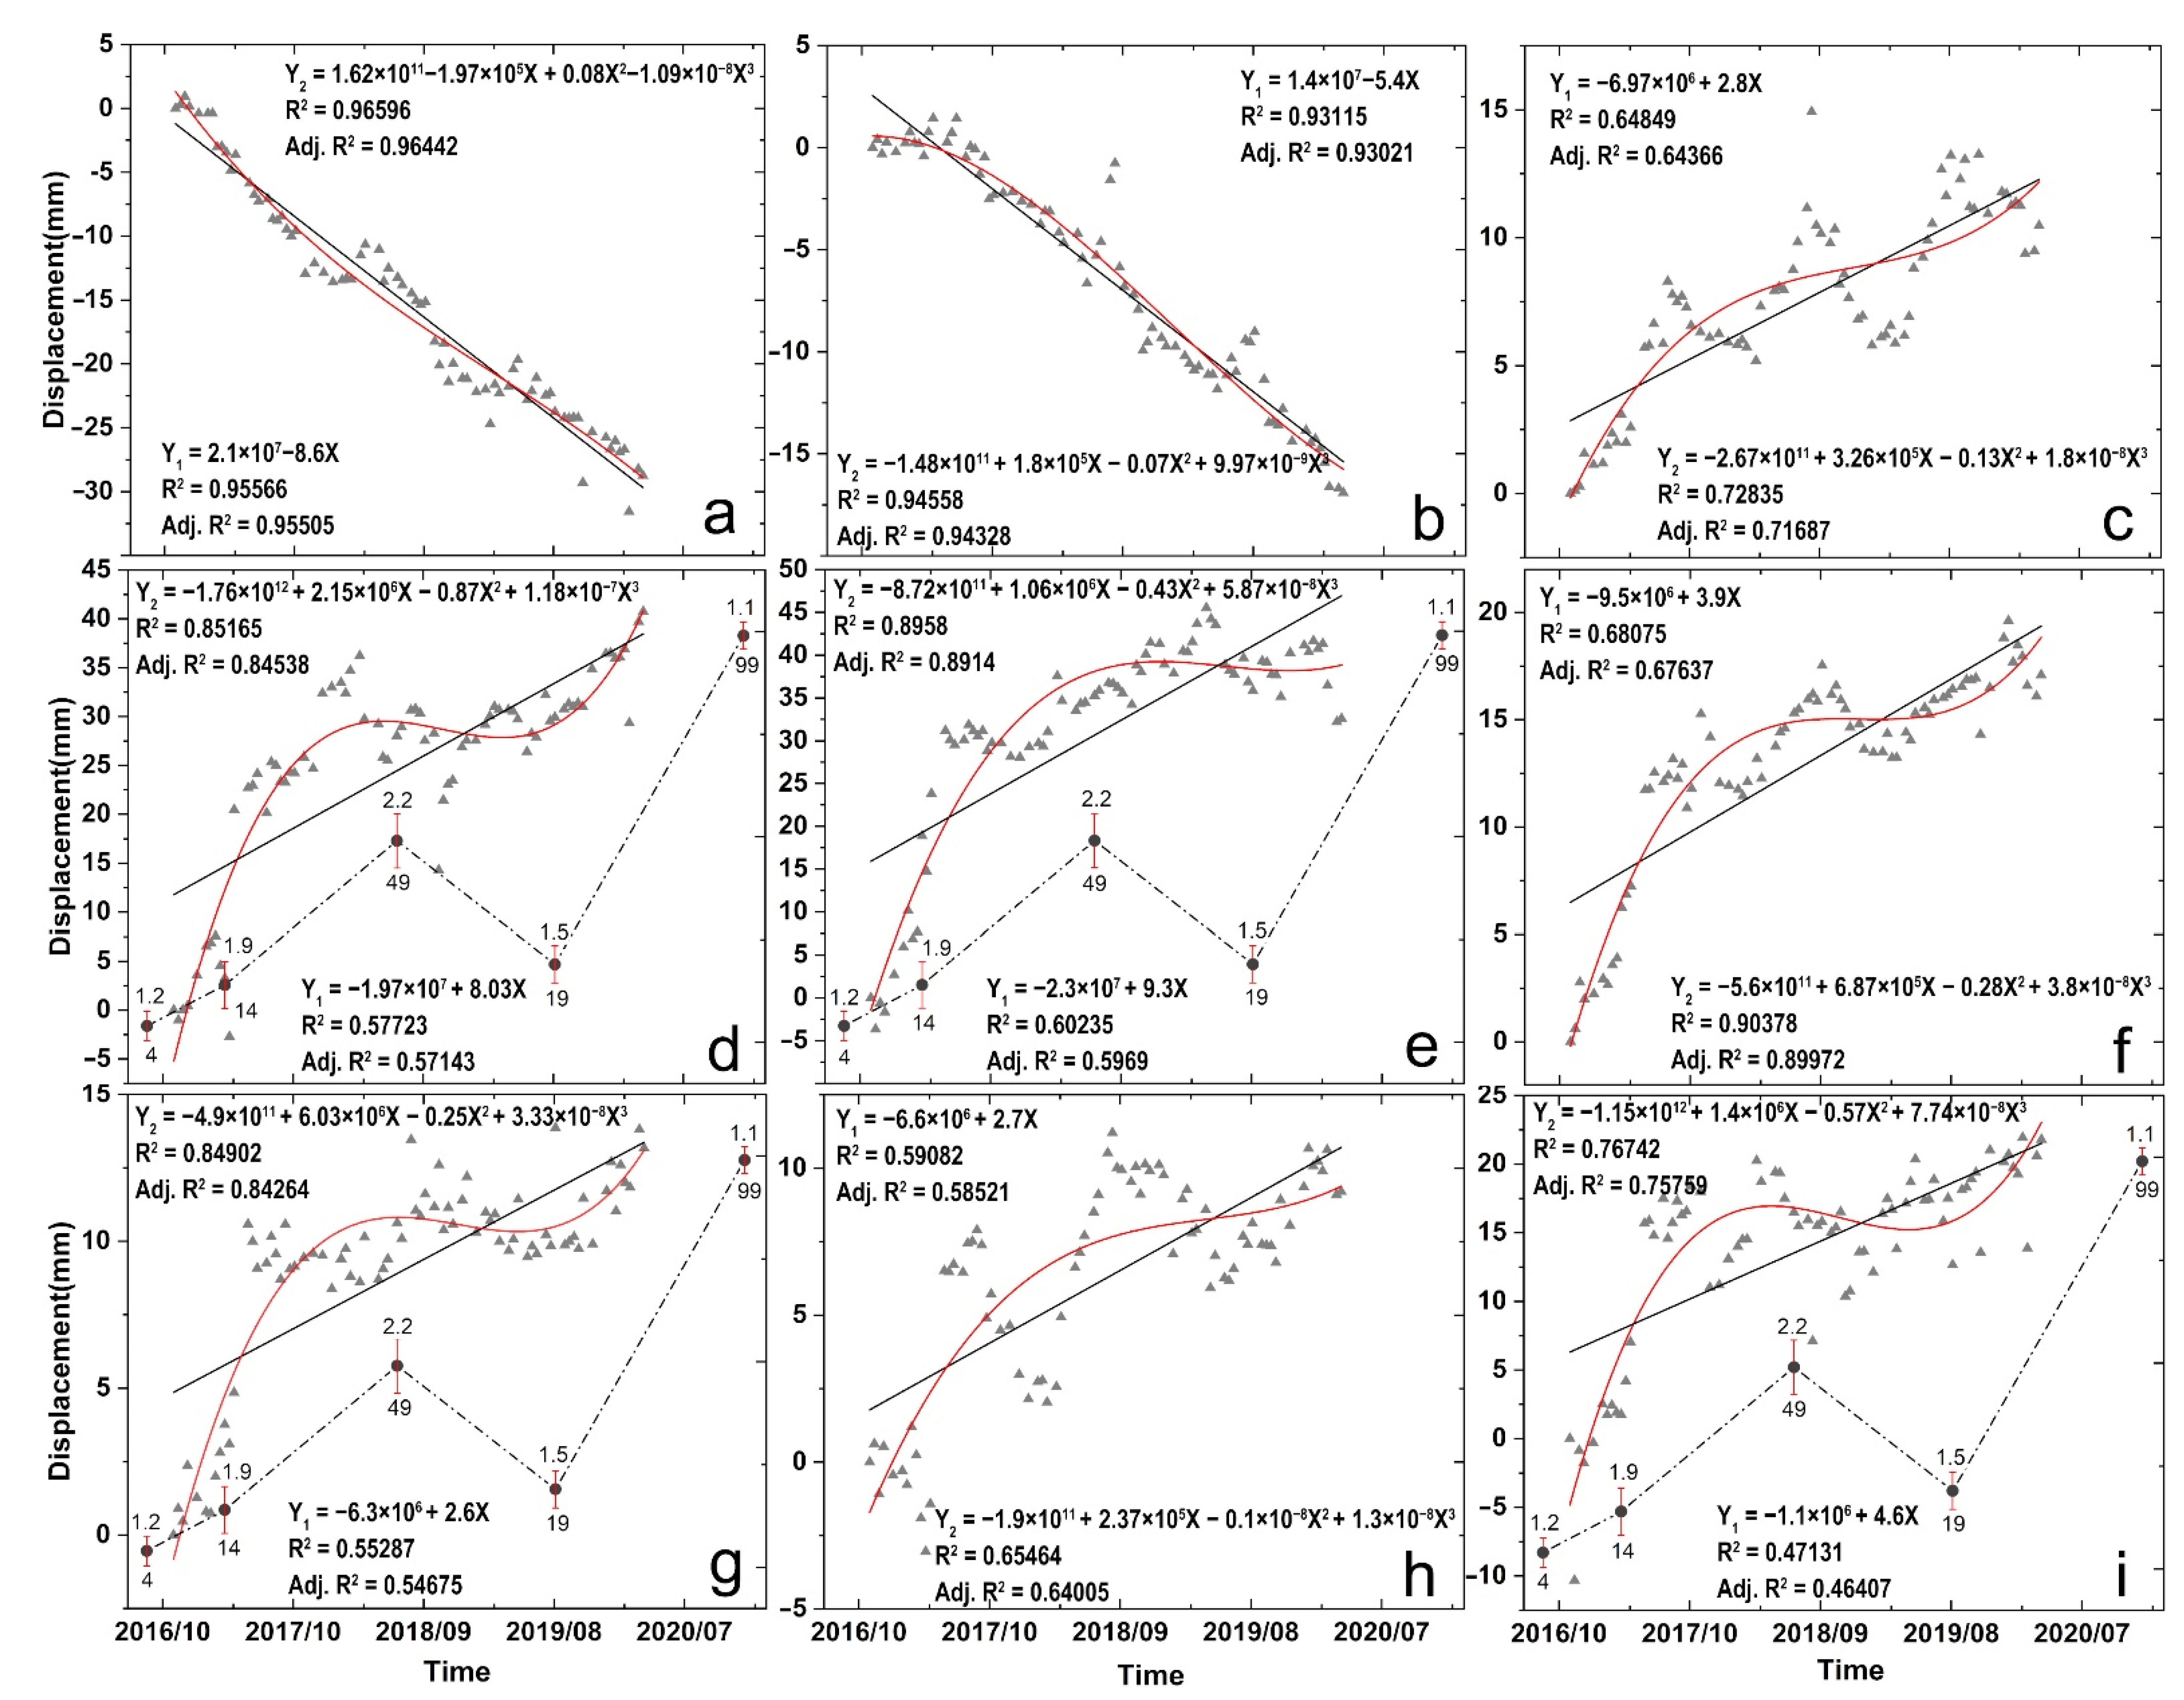
4.2. Temporal Changes of Surface Deformation Fields

To further understand the time series characteristics of surface deformation in the study area, nine spots representing typical locations with evident uplift and subsidences in the Changbaishan volcano (Figure 5, Spots a–i) are selected to make the variation curves of CSD with time (Figure 7). Additionally, the first- (Y1) and third-order (Y2) polynomial fitting schemes of the CSDs with time are performed as an auxiliary to understand the time series characteristics of the surface deformation. The first-order polynomial fitting curve clearly shows the overall trend of the CSDs, and the third-order polynomial fitting curve presents detailed information of the CSDs. Several meaningful findings are presented, as follows.
(1)
The time series cumulative surface deformation is seasonal.
Figure 7 shows that the CSDs of Spots c, f, g, and h indicate a similar regularity. From November 2016 to August 2017, they all showed uplift, and the amount was less than 20 mm. Then, by March 2018, the surface deformation was the subsidence trend. The minimum subsidence was 2.27 mm at Spot g, while the maximal subsidence was only 7.36 mm at Spot h. From March 2018 to August 2018, they all showed the uplift, with a lifting amount of more than 6.09 mm. From September 2018 to March 2019, they indicate the subsidence trend, ranging from 3.12 mm to 8.71 mm. After that, Spots f, g, and h show an obvious uplift trend. Though Spot c showed an interval peak in August 2019, it presents an uplift trend on the whole.
Generally, the time series CSDs are apparently seasonal. The subsidence mainly occurs from October to February or March of the following year, while the uplift occurs from April to August or September.
This seasonal variation also occurs in the specific years in Spots d and e with obvious uplift. Additionally, though the time series CSDs in Spots a and b share apparent subsidence trends, the local CSD peaks primarily occur from April to August.
Regarding that the snow and ice cover of the mountain is seasonal, it is probable the existence of the snow and ice that brought the seasonal change of the time series CSDs. Whereas, Figure 7 indicates that, even if there exists the seasonal change of the time series CSDs, its quantity is slight compared to the total CSDs from 2016 to 2020. Thus, the retrieved time series CSDs are effective in this study.
(2)
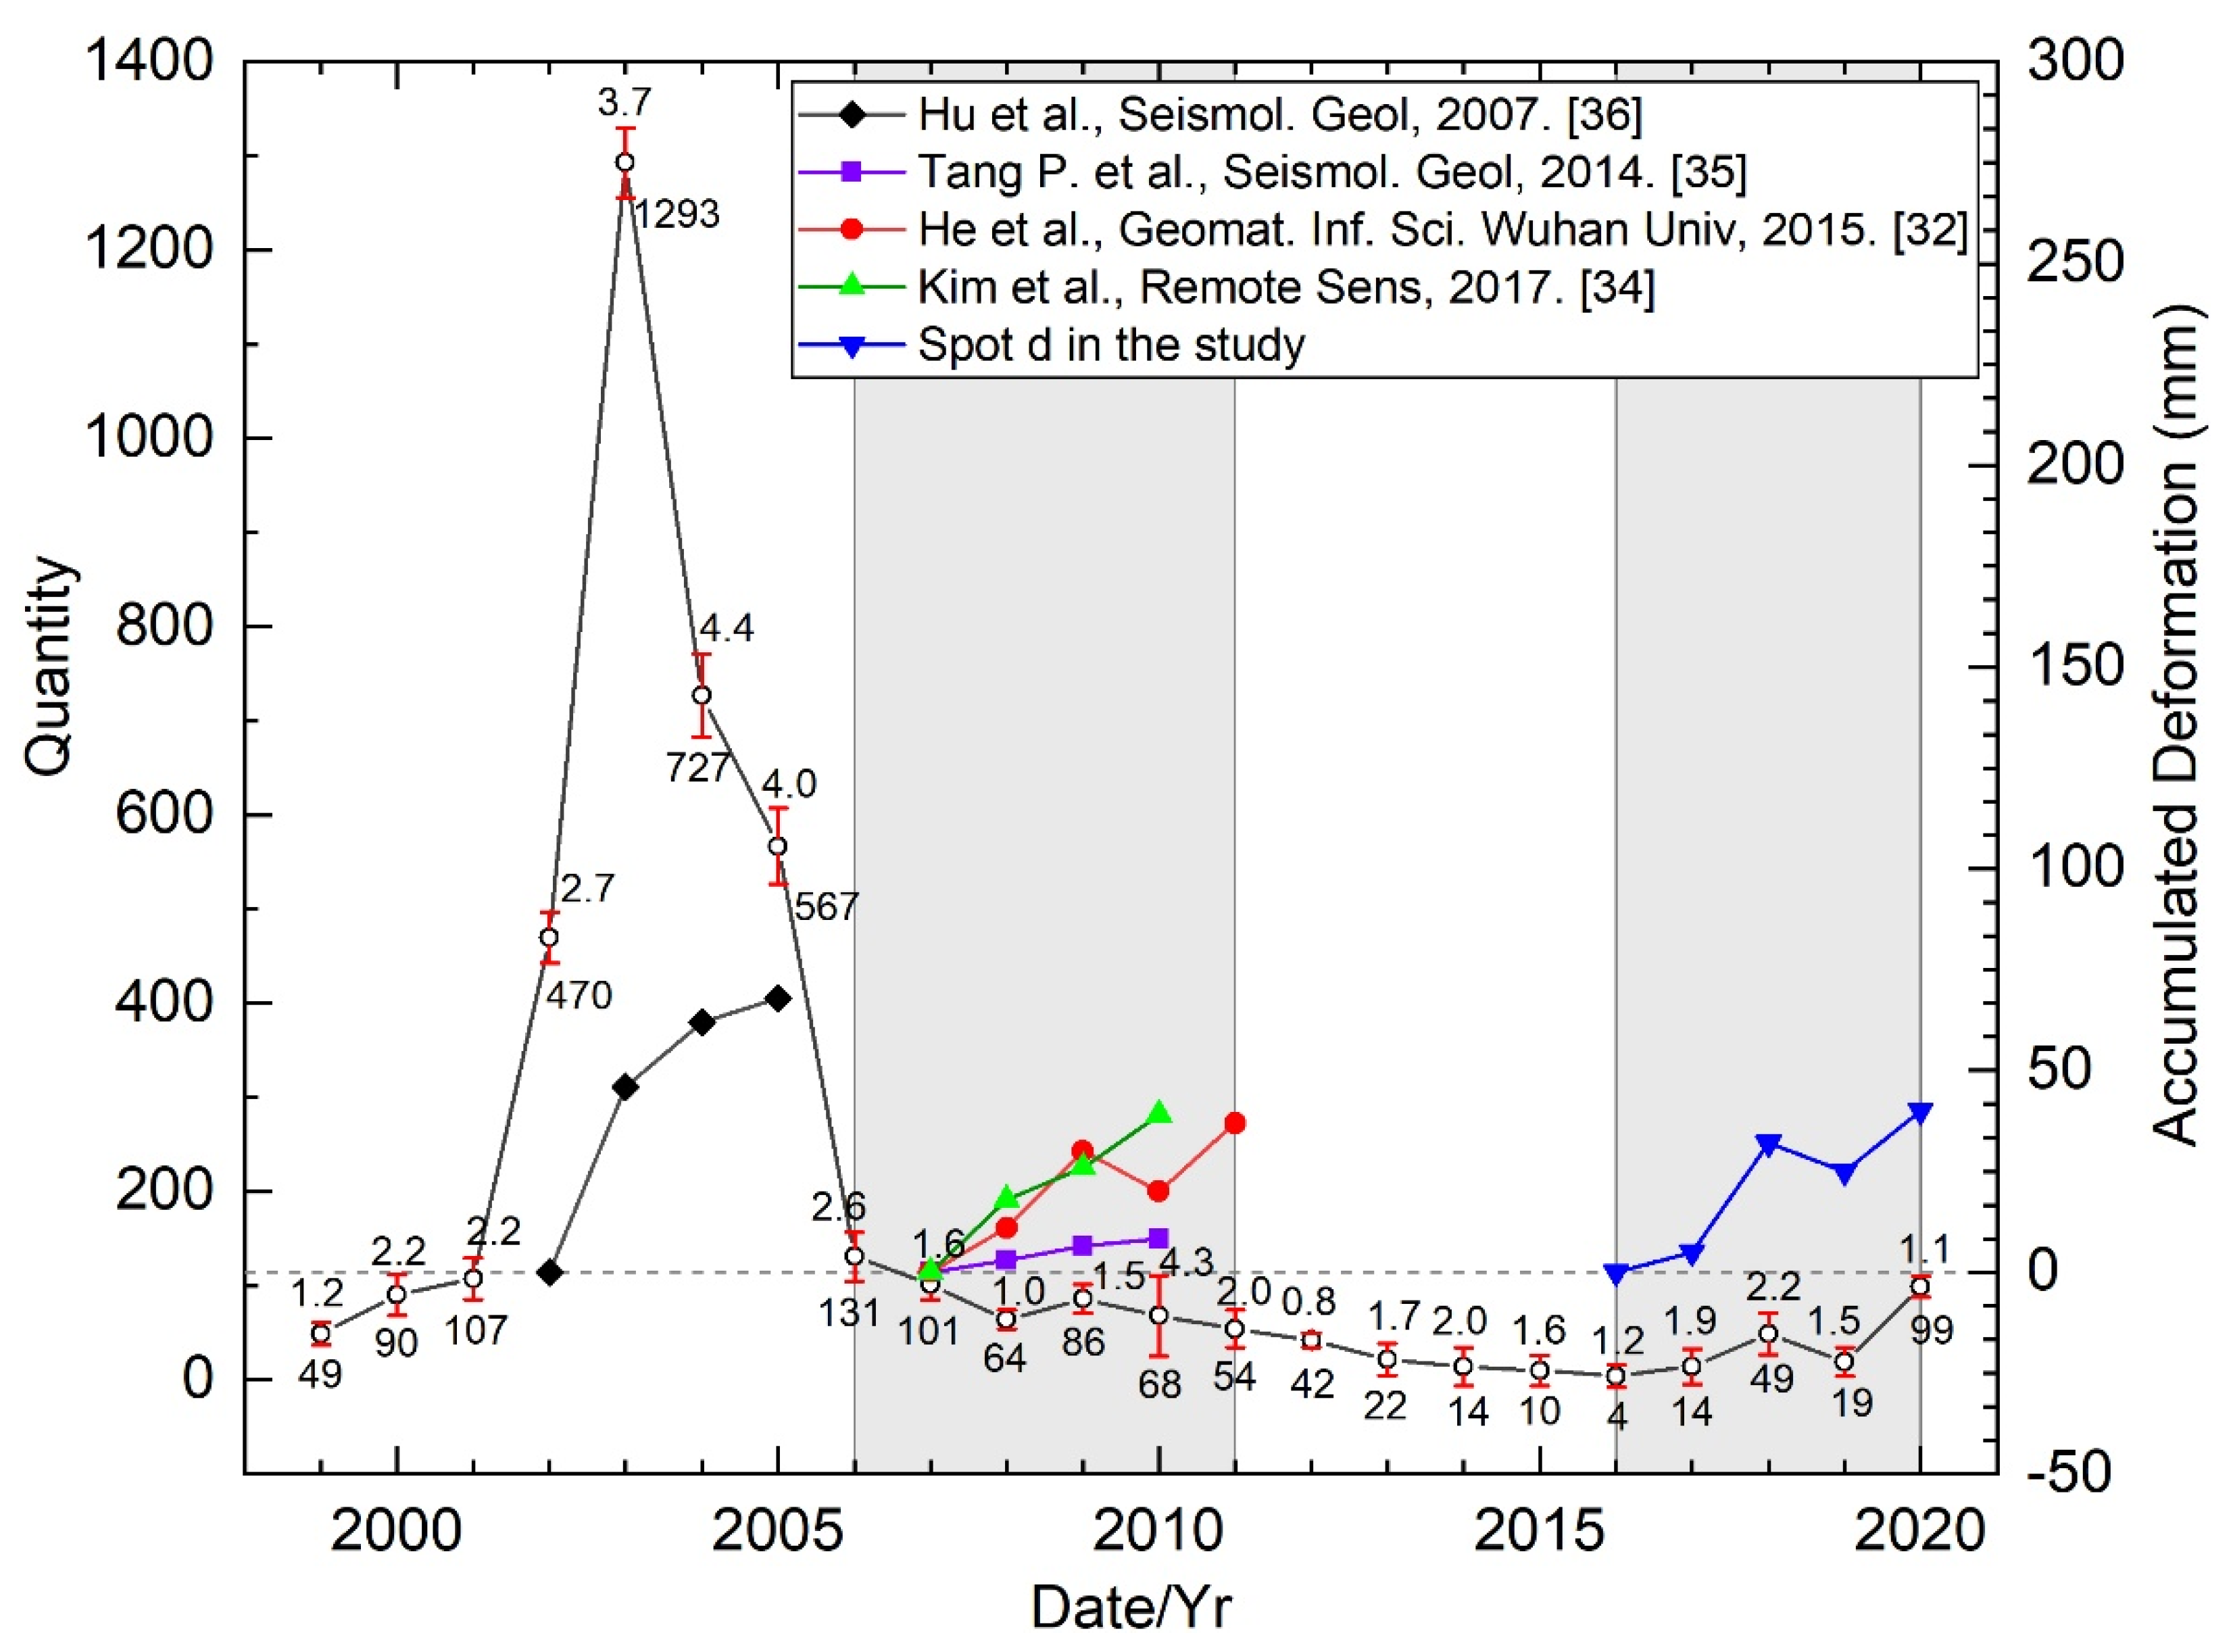
The time series cumulative surface deformation is probably correlated with the tectonic activity.
Figure 7 shows that the variation of CSD with time probably reflects the tectonic activity of the Changbaishan volcano to some extent. From the overall performances (first-order fitting curves) and third-order polynomial fitting curves of the times series CSD, the Changbaishan volcano should be active from October 2016 to February 2017, and the CSD has increased significantly in this period. Thereafter, it should be quiet until May 2019, and the overall uplift of each point is not obvious. There is a slight downward trend at Spots d and g due to seasonal changes and stratum erosion. After May 2019, there probably occurs a new active period, and all spots show an apparent uplift trend.
To pursue the relationship between time series CSD and the tectonic activity, we superimposed the maximal magnitude and the number of annual earthquakes on Figure 7d,e,g,i with time series CSDs in similar pattern. Compared to the time series CSD and the maximal magnitude and the number of annual earthquakes, a meaningful finding is that the time series CSD is likely related to the earthquakes that happened in the Changbaishan volcano. Here, the annual maximal magnitude of the earthquakes increases from ML 1.2 in 2016 to ML 2.2 in 2018, and the number increases from 4 times in 2016 to 49 times in 2018; correspondingly, the maximal uplift of the fitted CSD has a 31 mm increase in this period. After that, the maximal magnitude of annual earthquakes decreases to ML 1.9, and the number decreases to 19 times in 2019; simultaneously, the fitted CSD declined to largely 2 mm in this period. Then, from 2019 to 2020, the maximal magnitude keeps almost constant, but the number increases from 19 times to 99 times, while the maximal increase of the CSD is about 13 mm.
Thus, the time series CSD of the Changbaishan volcano is probably correlated with the maximal magnitude and the number of annual earthquakes. As mentioned above, from 2016 to 2019, the change of the fitted CSD is positively related to the maximal magnitude and the number of annual earthquakes, though the correlation is not apparent in the year from 2019 to 2020.
To further understand the relationship of the CSD and the earthquakes, the maximal magnitude and the number of annual earthquakes from 1999 to 2020, monitored by Changbaishan Tianchi Volcano Observatory, are plotted in Figure 8. Additionally, the leveling measurement by Hu et al. [36] and the surface deformation results estimated by Tang P. et al. [35], He et al. [32], and Kim et al. [34] are plotted in Figure 8.
Figure 8 shows that the maximal magnitude of the earthquakes linearly increases from ML 2.7 in 2002 to ML 4.4 in 2004 but slightly decreases to ML 4.0 in 2005, while the number reached highest in 2003. Meanwhile, the CSD shows a good agreement with the maximal magnitude of the earthquakes from 2002 to 2004, but the agreement is not good from 2004 to 2005.
From 2007 to 2010, the retrieved CSD is consistent with the change of earthquake magnitude and frequency, but the deformation range is quite different. E.g., the CSDs by Tang P. et al. [35], He et al. [32], and Kim et al. [34] are consistent with maximal magnitude of the earthquakes. Particularly, the variation of the maximal magnitude of the earthquakes is clearly lower from 2008 to 2009 than that from 2009 to 2010, and the CSD shows a similar behavior as such.
Combined with the findings mentioned above, the time series CSD is strongly correlated with the seismic activities in the Changbaishan volcano, where the annual maximal earthquake magnitude likely dominates the surface deformation in the corresponding year.

4.3. Re-Evaluating Deep Pressure Source of Changbaishan Volcano

In the past 20 years, the location and geometric characteristics of the deep pressure source are always the hotspots in studying the Changbaishan volcano [8,9].

4.3.1. Model Selection

Hu et al. [58] analyzed the possible shape of deep pressure source by comparing the effects of the single and double Mogi source models, prolate spheroid, and Okada rectangular dislocation model on the surface deformation in the Changbaishan volcano. Hu et al. [36] inversed the magma chamber with single Mogi source model using the GPS and leveling data from 2002 to 2005, and found that the magma chamber was shrinking. Chen et al. [30] studied the magma chamber of the Changbaishan volcano based on the single Mogi and double Mogi source models with the leveling measured and GPS data. Zhu et al. [59] inverted the deep pressure source with GPS and leveling measured data from 2002 to 2003 using three mutually perpendicular expansion point source models. He et al. [32] assessed the magma volume change rate using single Mogi source model with the InSAR surface deformation from 2006 to 2011. Kim et al. [34] simulated a deep pressure source combined with the single Mogi source and Okada dislocation models. Huang et al. [9] used the finite element equivalent physical strength method to invert the deep pressure source of the Changbaishan volcano, which indicated that the surface deformation caused by an ellipsoidal magma chamber fits well with the observed GPS and leveling measured data. By defining a spheroid source, a tabular reservoir, and a NW-SE fault, Trasatti et al. [42] indicates that the Changbaishan volcano is still affected by deep magmatic recharge from 2018 to 2020, and a NW-SE trending fault is reactivated. These results about the deep pressure source of the Changbaishan volcano are summarized in Table 2.
According to the previous results, we thought that the shape of the deep pressure source of the Changbaishan volcano is likely irregular. Therefore, to evaluate the deep pressure source of the Changbaishan volcano, we have selected four idealized deep pressure source models with different geometric shapes, including the single Mogi [60], penny-shaped sill-like [61], finite spherical [62], and prolate spheroid [63] sources. Moreover, considering that deep pressure sources may distribute in different depths and there probably exists more than one layer of magmatic sources [7,8,32,64], the double Mogi source model is also introduced in this study.

4.3.2. Inversion of Volcanic Deep Pressure Source

To evaluate the deep pressure source of the Changbaishan volcano, the Bayesian algorithm framework is adopted [65]. First, the CSD is simulated using the aforementioned five deep pressure source models, and the likelihood function estimation is obtained by comparing the simulated CSD and the inverted CSD in this study when considering the errors of the Sentinel-1B InSAR data. Then, based on the prior information and likelihood function estimation, the Markov chain Monte Carlo algorithm and Metropolis-Hastings algorithm are used to iteratively sample the posterior probability density function of deep pressure source model parameters. Finally, through finding the maximum posteriori probability solution of the posteriori probability density function, a set of optimal deep pressure source model parameters (e.g., the horizontal position, depth, and geometric structure) can be calculated.
Here, the Bayesian algorithm is operated with the MATLAB® software package, GBIS (Geodetic Bayesian Inversion Software) V1.1 [65]. Since the variation of the maximal magnitude and the number of annual earthquakes is relatively slight from 2007 to 2020 (Figure 8), the prior information of single Mogi and double Mogi source models refers to the relevant researches from 2007 to 2016 [32,34]. The prior information regarding the penny-shaped sill-like, finite spherical, and prolate spheroid source models are referred to in previous studies [9,42,59]. The prior information of the five deep pressure sources is present in Table 3.
To improve the efficiency of Bayesian inversion, the simulated annealing algorithm is used to obtain the “Start” parameters of each deep pressure source model in the initial stage of inversion. Based on the above priori parameters and the Bayesian algorithm, the optimal posteriori probability solution, mean, median, and 2.5 percent and 97.5 percent of posterior probability density functions of location, depth, volume, and other parameters derived with the aforementioned five deep pressure source models are obtained (Table 4).

4.3.3. Inversion Results

Table 4 shows that, among the five volcanic deep pressure source models, the estimated “Depth” with the single Mogi source model is 6.2 km, which is closer to the results of Hu et al. [36] (6.854 km in 2002 to 2003), He et al. [32] (6.9 km in 2009–2011), Huang et al. [9] (6.86 km in 2002 to 2003), and Trasatti et al. [42] (6.7 km in 2009 to 2011, 7.7 km in 2018 to 2020) in Table 2. In addition, the location (X, Y) of the single Mogi source is located in the northwestern slope of the Changbaishan volcano, which is consistent with the viewpoint of Yang et al. [64], who proposed that the deep magma chamber of the Changbaishan volcano is not directly below the Changbaishan volcano, as well as with the conclusion of He et al. [32], who given that the single Mogi source is located in the west of the lower part of the volcano. Therefore, the inversion result with single Mogi source model should be rational.
Then, the posterior probability density functions of the deep pressure source parameters can be obtained through 1 × 10⁷ iterations of the single Mogi source model, as is shown in Figure 9. The scatter diagrams in the first three rows show the joint distributions between the parameter pairs, and the bottom rows show the histograms of marginal distributions of each parameter. The warm color represents the parameters with high frequency, corresponding to the horizontal and vertical axis, while the cold color is the opposite. Figure 9 intuitively reflects a good correlation between the parameter pairs, using the single Mogi source model, which again validates that the single Mogi source parameters are reasonable. Here, the optimal estimated depth of the single Mogi source is 6.2 km, and the volume increase is 3.2 × 10⁶ m3. Compared with the prolate spheroid source volume variation of Trasatti et al. [42] in 2018 to 2020, our single Mogi source results (optimal parameters) are consistent with it in order of magnitude. The difference between the two is 4.1 (±2.4) × 106 m3. Considering that we have monitored for a longer period (2016–2020), and the variation of surface deformation will make our results different from it, which is reasonable.
Therefore, the complex local surface deformation in the Changbaishan volcano can be partly explained by the expansion of the single Mogi source distributed in the northwest of Tianchi caldera. In the time series, it shows a strong correlation with the maximal magnitude and number of annual earthquakes. Additionally, in space, it shows that the locally distribution of the CSDs is bounded by faults, and the largest uplift mainly occurs in the western slope of the Changbaishan volcano. In recent years, earthquakes frequently occurred in the Changbaishan volcano. On 5 March 2021, an ML 3.1 earthquake has occurred in Fusong, China (41.81°N, 127.87°E, depth 25 km, https://www.cea.gov.cn/cea/xwzx/zqsd/5576146/index.html, accessed on 6 March 2021), whose epicenter is located just along fault f2. This supports the finding that fault f2 plays an important role in the time series CSDs in the Changbaishan volcano. Therefore, it is inferred that the tectonic activity in the Changbaishan volcano is active, and the faults related to the deep pressure source are also in the active state.

5. Conclusions

In this study, the surface deformation of the Changbaishan volcano in the LOS direction is retrieved using the SBAS-InSAR method with 75 Sentinel-1B SAR data, from 2016 to 2020. The deep pressure source is evaluated with five models, based on the Bayesian algorithm via the calculated CSD. The main findings are presented as follows:
(1)
The MDV in the Changbaishan volcano is uplifted as a whole. The uplifted extent is relatively high in the east part, relatively low in the middle region, located in the eastern and southern slopes, but highest in the western and northern slopes.
(2)
There exists a seasonal fluctuation in the time series CSD of the Changbaishan volcano. It shows subsidence mainly from October to February or March of the following year and uplift from April to August or September.
(3)
The CSD shows a strong correlation with the maximal magnitude and the number of annual earthquakes. After comparison, combined with the previous results, the CSD in the Changbaishan volcano is likely dominated by the maximal magnitude of the earthquakes in the corresponding year.
(4)
There is a strong correlation between surface deformation and the faults in Tianchi Volcano. Fault f2 plays a controlling role on the surface deformation in the Changbaishan volcano, followed by faults f6 and f1.
(5)
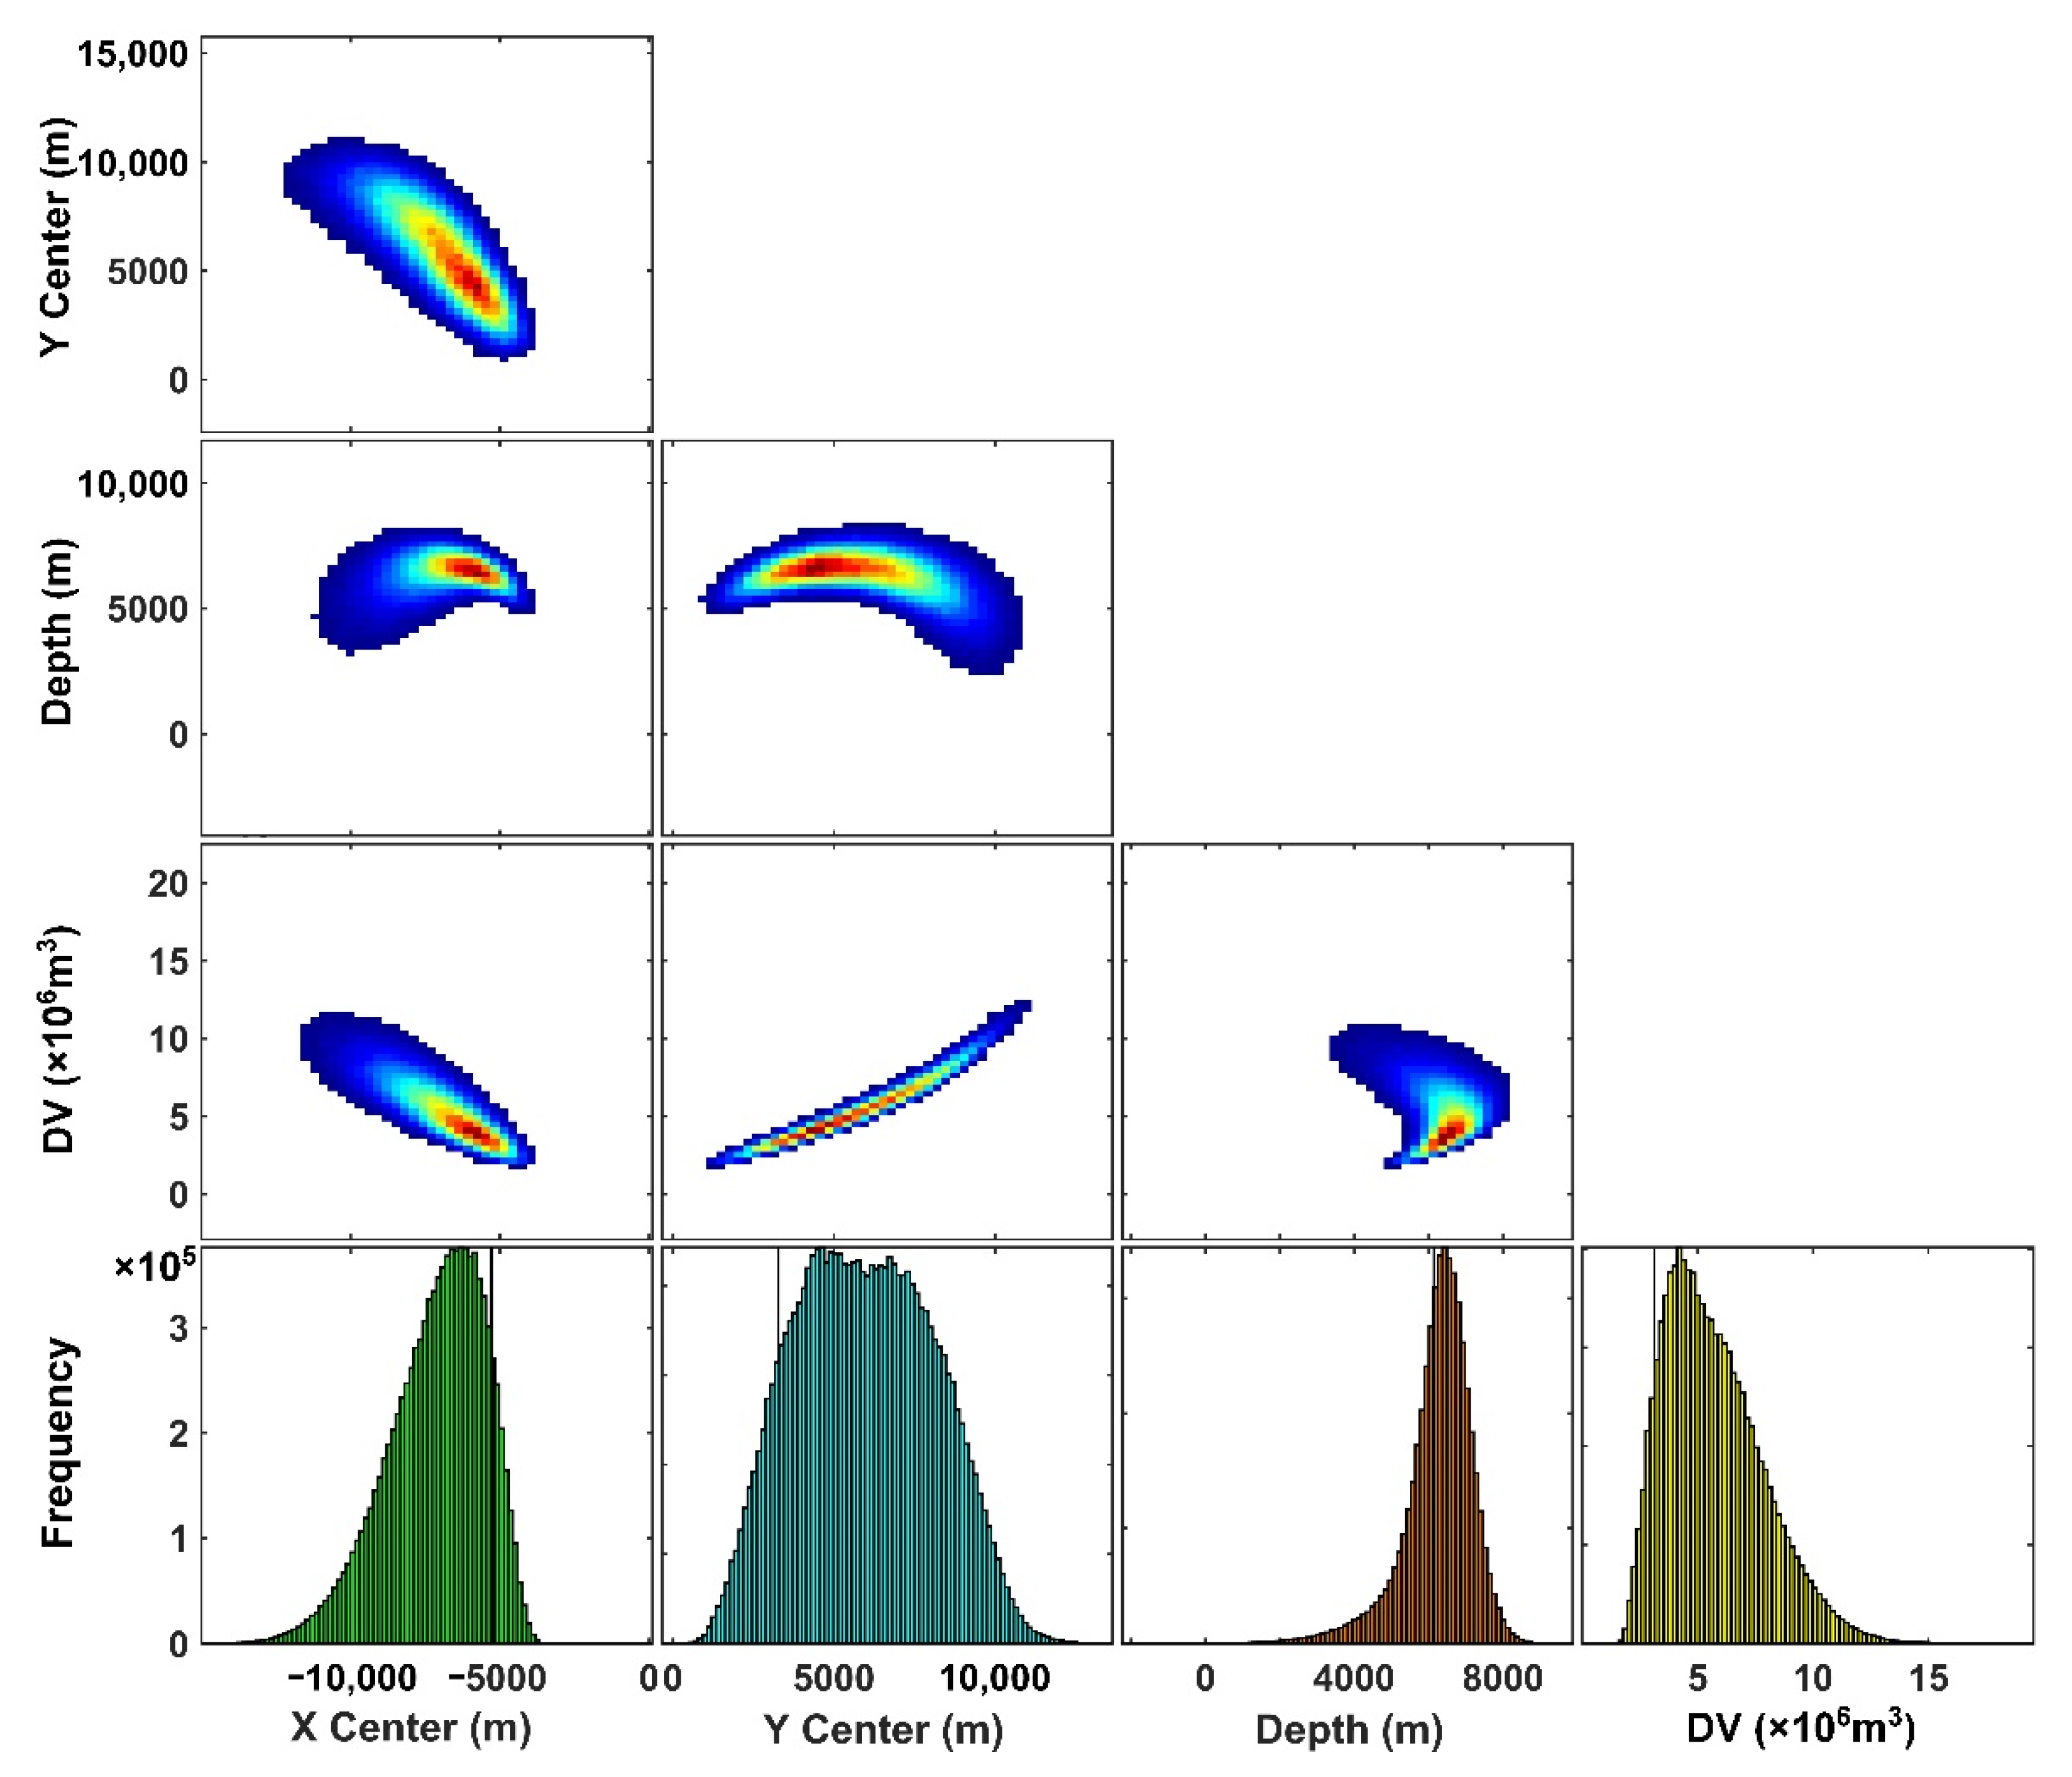
After comparison, the single Mogi source model is appropriate for evaluating the deep pressure source in the Changbaishan volcano, constrained by the calculated surface deformation in this study. The results show that the optimal estimated depth of the magma chamber is 6.2 km, and the volume increase is 3.2 × 10⁶ m3. Additionally, it is inferred that the tectonic activity in the Changbaishan volcano is in an active state.

Author Contributions

Conceptualization, Z.M. and Y.Y.; methodology, Z.M. and C.S.; software, C.W.; validation, C.S., Y.Y. and X.D.; formal analysis, Z.M. and C.S.; data curation, Z.M.; writing—original draft preparation, Z.M. and C.S.; writing—review and editing, Z.M., C.S., Y.Y., C.W., X.D. and D.W.; visualization, Z.M.; supervision, Y.Y.; project administration, Y.Z.; funding acquisition, Z.M. and Y.Z. All authors have read and agreed to the published version of the manuscript.

Funding

This research was funded by the National Key R & D project of China, grant number 2021YFA0715104, the National Natural Science Foundation of China, grant number 42071309, the Strategic Priority Research Program of Chinese Academy of Sciences, grant number XDB 41000000, the opening fund of State Key Laboratory of Lunar and Planetary Sciences (Macau University of Science and Technology), Macau FDCT grant number 119/2017/A3, the Science and Technology Development Fund (FDCT) of Macau, grant number 0059/2020/A2, the central level, scientific research institutes for basic R & D special foundation, grant number TKS20210212, and the Graduate Innovative Research Project of Jilin University, grant number 101832020CX225.

Institutional Review Board Statement

Not applicable.

Informed Consent Statement

Not applicable.

Data Availability Statement

Sentinel-1B SAR images and Sentinel-2 data were downloaded from the European Space Agency (ESA) (https://scihub.copernicus.eu/dhus/#/home, accessed on 27 June 2021). The POD precise orbit ephemerides data were downloaded from the European Space Agency (ESA) (https://scihub.copernicus.eu/gnss/#/home, accessed on 27 June 2021). The ALOS World 3D DEM was downloaded from Japan Aerospace Exploration Agency (JAXA) (https://www.eorc.jaxa.jp/ALOS/en/aw3d30/data/index.htm, accessed on 22 July 2021).

Acknowledgments

The statistical data of volcanic earthquake of the Changbaishan volcano were provided by Changbaishan Tianchi Volcano Observatory. The inversion process of volcanic deep pressure source is solved by the GBIS (Geodetic Bayesian Inversion Software) V1.1 software package [65] (https://comet.nerc.ac.uk/gbis/, accessed on 20 September 2021). Thanks for the use of GBIS software package, provided by Bagnardi and Hooper [65].

Conflicts of Interest

The authors declare no conflict of interest.

Appendix A

Table A1. Available Sentinel-1B data of the study area, from 2016 to 2020.
No.Acquisition TimeAbsolute OrbitPathPerpendicular Baseline (m)No.Acquisition TimeAbsolute OrbitPathPerpendicular Baseline (m)
026 November 201600313513493.87613824 August 201801241013449.3319
18 December 201600331013474.4027395 September 201801258513453.1985
220 December 201600348513493.33014029 September 201801293513449.6745
31 January 2017003360134144.8574111 October 2018013110134134.333
425 January 2017004010134106.6544223 October 2018013285134144.707
518 February 201700436013442.798434 November 201801346013491.89
62 March 2017004535134−24.24144416 November 201801363513478.573
714 March 2017004710134107.5374510 December 2018013985134101.761
826 March 2017004885134110.9984622 December 2018014160134174.279
97 April 201700506013466.76984715 January 2019014510134354.1653
1019 April 201700523513435.2373488 February 2019014860134119.087
111 May 201700541013457.1744920 February 201901 5035134153.503
126 June 201700593513499.3488504 March 2019015210134138.687
1318 June 201700611013424.69135116 March 20190153851349.10079
1430 June 2017006285134−11.1132529 April 201901573513444.1878
1524 July 201700663513456.84395321 April 201901591013498.6213
165 August 2017006810134110.937543 May 2019016085134167.254
1717 August 2017006985134−11.67515527 May 201901643513468.9393
1829 August 201700716013424.4308568 June 2019016610134−14.0697
1910 September 201700733513455.75655720 June 201901678513460.5642
2022 September 2017007510134112.6955814 July 201901713513497.993
214 October 201700768513487.72125926 July 201901731013425.8509
2228 October 201700803513469.9597607 August 201901748513412.6419
2321 November 2017008385134106.1746131 August 201901783513472.3225
2415 December 2017008735134133.516212 September 201901801013477.0498
258 January 201800908513479.72786324 September 201901818513486.2929
261 February 2018009435134145.222646 October 201901836013427.5584
2713 February 2018009610134147.8736518 October 201901853513477.5763
2825 February 201800978513424.22846611 November 2019018885134114.73
2921 March 2018010135134−57.3436717 December 201901941013486.3005
302 April 2018010310134104.7496829 December 2019019585134142.613
318 May 201801083513417.69416910 January 2020019760134161.581
3220 May 2018011010134−10.577022 January 2020019935134125.07
331 June 2018011185134−24.3215713 February 202002011013479.863
3425 June 201801153513469.29297215 February 202002028513437.91
357 July 201801171013440.12167310 March 2020020635134138.783
3631 July 201801206013407422 March 2020020810134121.937
3712 August 201801223513453.4225-----

References

  1. Iacovino, K.; Ju-Song, K.; Sisson, T.; Lowenstern, J.; Kuk-Hun, R.; Jong-Nam, J.; Kun-Ho, S.; Song-Hwan, H.; Oppenheimer, C.; Hammond, J.O.S.; et al. Quantifying gas emissions from the “Millennium Eruption” of Paektu volcano, Democratic People’s Republic of Korea/China. Sci. Adv. 2016, 2, e1600913. [Google Scholar] [CrossRef] [PubMed] [Green Version]
  2. Liu, J.; Chen, S.; Guo, W.; Sun, C.; Zhang, M.; Guo, Z. Research advances in the Mt. Changbai Volcano. Bull. Miner. Pet. Geochem. 2015, 34, 710–723. [Google Scholar] [CrossRef]
  3. Liu, R.; Li, J.; Wei, H.; Xu, D.-M.; Zhen, X. Volcano at Tianchi lake, Changbaishan Mt.--A modern volcano with potential danger of eruption. Chin. J. Geophys. 1992, 35, 661–664. (In Chinese) [Google Scholar]
  4. Oppenheimer, C.; Wacker, L.; Xu, J.D.; Galvan, J.D.; Stoffel, M.; Guillet, S.; Corona, C.; Sigl, M.; Di Cosmo, N.; Hajdas, I.; et al. Multi-proxy dating the ’Millennium Eruption’ of Changbaishan to late 946 CE. Quat. Sci Rev. 2017, 158, 164–171. [Google Scholar] [CrossRef] [Green Version]
  5. Wei, H.; Liu, G.; Gill, J. Review of eruptive activity at Tianchi volcano, Changbaishan, northeast China: Implications for possible future eruptions. Bull. Volcanol. 2013, 75, 706. [Google Scholar] [CrossRef]
  6. Cheng, X.; Chen, Z.; Bai, W. A numerical simulation of magma migration in crust fracture-an application to Changbaishan Tianchi volcano. Chin. J. Geophys. 2014, 57, 1522–1533. (In Chinese) [Google Scholar] [CrossRef]
  7. Fan, X.; Chen, Q.; Guo, Z. High-resolution Rayleigh-wave phase velocity structure beneath the Changbaishan volcanic field associated with its magmatic system. Acta Pet. Sin. 2020, 36, 2081–2091. [Google Scholar] [CrossRef]
  8. Guan, Y.; Chol, S.; Yang, G.; Liu, J.; Lee, Y.; Oh, C.; Jin, X.; Wu, Y. Changbaishan Tianchi volcano crustal magma chambers modeling with gravity profile. Acta Pet. Sin. 2020, 36, 3840–3852. [Google Scholar] [CrossRef]
  9. Huang, L.; Cheng, H.; Zhang, H.; Gao, R.; Shi, Y. Numerical inversion of deformation caused by a pressurized magma chamber: An example from the Changbaishan volcano. Chin. J. Geophys. 2020, 63, 4050–4064. (In Chinese) [Google Scholar] [CrossRef]
  10. Kim, Y.W.; Chang, S.J.; Witek, M.; Ning, J.; Wen, J. S-velocity mantle structure of East Asia from teleseismic traveltime tomography: Inferred mechanisms for the Cenozoic intraplate volcanoes. J. Geophys. Res. Solid Earth 2021, 126, e2020JB020345. [Google Scholar] [CrossRef]
  11. Kyong-Song, R.; Hammond, J.O.; Chol-Nam, K.; Hyok, K.; Yong-Gun, Y.; Gil-Jong, P.; Chong-Song, R.; Oppenheimer, C.; Liu, K.W.; Iacovino, K. Evidence for partial melt in the crust beneath Mt. Paektu (Changbaishan), Democratic People’s Republic of Korea and China. Sci. Adv. 2016, 2, e1501513. [Google Scholar] [CrossRef] [PubMed] [Green Version]
  12. Tang, Y.; Obayashi, M.; Niu, F.; Grand, S.; Chen, Y.; Kawakatsu, H.; Tanaka, S.; Ning, J.; Ni, J. Changbaishan volcanism in northeast China linked to subduction-induced mantle upwelling. Nat. Geosci. 2014, 7, 470–475. [Google Scholar] [CrossRef]
  13. Tian, Y.; Zhu, H.; Zhao, D.; Liu, C.; Feng, X.; Liu, T.; Ma, J. Mantle transition zone structure beneath the Changbai volcano: Insight into deep slab dehydration and hot upwelling near the 410km discontinuity. J. Geophys. Res. Solid Earth 2016, 121, 5794–5808. [Google Scholar] [CrossRef] [Green Version]
  14. Yang, J.; Faccenda, M. Intraplate volcanism originating from upwelling hydrous mantle transition zone. Nature 2020, 579, 88–91. [Google Scholar] [CrossRef] [PubMed]
  15. Zhang, C.; Wu, M.; Zhang, C.; Liao, C.; Miao, Z. Measurement of present-day stress and analysis of stress state in the Changbaishan mountains of Jilin province. Chin. J. Geophys. 2016, 59, 922–930. [Google Scholar] [CrossRef]
  16. Zhang, F.; Wu, Q.; Li, Y.; Zhang, R. The seismic evidence of velocity variation for Changbaishan volcanism in Northeast China. Geophys. J. Int. 2019, 218, 283–294. [Google Scholar] [CrossRef]
  17. Lemarchand, N.; Grasso, J.R. Interactions between earthquakes and volcano activity. Geophys. Res. Lett. 2007, 34, L24303. [Google Scholar] [CrossRef] [Green Version]
  18. Liu, G.; Li, C.; Peng, Z.; Liu, Y.; Zhang, Y.; Liu, D.; Zhang, M.; Pan, B. The 2002–2005 Changbaishan Volcanic Unrest Triggered by the 2002 M 7.2 Wangqing Deep Focus Earthquake. Front. Earth Sci. 2021, 8, 599329. [Google Scholar] [CrossRef]
  19. Walter, T.R.; Amelung, F. Volcano-earthquake interaction at Mauna Loa volcano, Hawaii. J. Geophys. Res. Solid Earth 2006, 111, B05204. [Google Scholar] [CrossRef] [Green Version]
  20. Wu, J.; Ming, Y.; Zhang, H.; Liu, G.; Fang, L.; Su, W.; Wang, W. Earthquake swarm activity in Changbaishan Tianchi volcano. Chin. J. Geophys. 2007, 50, 938–946. [Google Scholar] [CrossRef]
  21. Wu, J.; Ming, Y.; Zhang, H.; Su, W.; Liu, Y. Seismic activity at the Chanbaishan Tianchi volcano in the summer of 2002. Chin. J. Geophys. 2005, 48, 684–691. [Google Scholar] [CrossRef]
  22. Zhang, M.; Wen, L. Earthquake characteristics before eruptions of Japan’s Ontake volcano in 2007 and 2014. Geophys. Res. Lett. 2015, 42, 6982–6988. [Google Scholar] [CrossRef]
  23. Bayindir, C. Enhancements to Synthetic Aperture Radar Chirp Waveforms and Non-Coherent SAR Change Detection Following Large Scale Disasters; Georgia Institute of Technology: Atlanta, GA, USA, 2013. [Google Scholar]
  24. Bayındır, C.; Frost, J.D.; Barnes, C.F. Assessment and enhancement of sar noncoherent change detection of sea-surface oil spills. IEEE J. Ocean. Eng. 2017, 43, 211–220. [Google Scholar] [CrossRef]
  25. Papageorgiou, E.; Foumelis, M.; Trasatti, E.; Ventura, G.; Raucoules, D.; Mouratidis, A. Multi-sensor SAR geodetic imaging and modelling of santorini volcano post-unrest response. Remote Sens. 2019, 11, 259. [Google Scholar] [CrossRef] [Green Version]
  26. Schaefer, L.N.; Di Traglia, F.; Chaussard, E.; Lu, Z.; Nolesini, T.; Casagli, N. Monitoring volcano slope instability with Synthetic Aperture Radar: A review and new data from Pacaya (Guatemala) and Stromboli (Italy) volcanoes. Earth-Sci. Rev. 2019, 192, 236–257. [Google Scholar] [CrossRef]
  27. Baker, S.; Amelung, F. Top-down inflation and deflation at the summit of Kīlauea Volcano, Hawai ‘i observed with InSAR. J. Geophys. Res. Solid Earth 2012, 117, B12406. [Google Scholar] [CrossRef] [Green Version]
  28. Neri, M.; Casu, F.; Acocella, V.; Solaro, G.; Pepe, S.; Berardino, P.; Sansosti, E.; Caltabiano, T.; Lundgren, P.; Lanari, R. Deformation and eruptions at Mt. Etna (Italy): A lesson from 15 years of observations. Geophys. Res. Lett. 2009, 36, L02309. [Google Scholar] [CrossRef]
  29. Vilardo, G.; Isaia, R.; Ventura, G.; De Martino, P.; Terranova, C. InSAR Permanent Scatterer analysis reveals fault re-activation during inflation and deflation episodes at Campi Flegrei caldera. Remote Sens. Environ. 2010, 114, 2373–2383. [Google Scholar] [CrossRef]
  30. Chen, G.; Shan, X.; Moon, W.; Kim, K. A modeling of the magma chamber beneath the Changbai Mountains volcanic area constrained by InSAR and GPS derived deformation. Chin. J. Geophys. 2008, 51, 765–773. [Google Scholar] [CrossRef]
  31. Han, Y.; Song, X.; Shan, X.; Qu, C.; Wang, C.; Guo, L.; Zhang, G.; Liu, Y. Deformation monitoring of Changbaishan Tianchi volcano using D-InSAR technique and error analysis. Chin. J. Geophys. 2010, 53, 1571–1579. (In Chinese) [Google Scholar] [CrossRef]
  32. He, P.; Xu, C.; Wen, Y. Estimating the Magma Activity of the Changbaishan Vocano with PALSAR Data. Geomat. Inf. Sci. Wuhan Univ. 2015, 40, 214–221. [Google Scholar] [CrossRef]
  33. Kim, J.R.; Lin, S.Y.; Hong, S.w.; Choi, Y.S.; Yun, H.W. Ground deformation tracking over Mt. Baekdu: A pre-evaluation of possible magma recharge by D-InSAR analysis. KSCE J. Civ. Eng. 2014, 18, 1505–1510. [Google Scholar] [CrossRef]
  34. Kim, J.R.; Lin, S.Y.; Yun, H.W.; Tsai, Y.L.; Seo, H.J.; Hong, S.; Choi, Y. Investigation of Potential Volcanic Risk from Mt. Baekdu by DInSAR Time Series Analysis and Atmospheric Correction. Remote Sens. 2017, 9, 138. [Google Scholar] [CrossRef] [Green Version]
  35. Tang, P.; Shan, X.; Wang, C. Research on the deformation monitoring of Changbaishan volcano based on PsinSar technique. Seismol. Geol. 2014, 36, 177–185. [Google Scholar] [CrossRef]
  36. Hu, Y.; Wang, Q.; Cui, D.; Wang, W.; Li, K.; Chen, H. Application of Mogi model at Changbaishan Tianchi volcano. Seismol. Geol. 2007, 29, 144–149. [Google Scholar]
  37. Albino, F.; Biggs, J.; Yu, C.; Li, Z. Automated Methods for Detecting Volcanic Deformation Using Sentinel-1 InSAR Time Series Illustrated by the 2017–2018 Unrest at Agung, Indonesia. J. Geophys. Res. Solid Earth 2020, 125, e2019JB017908. [Google Scholar] [CrossRef] [Green Version]
  38. Babu, A.; Kumar, S. SBAS interferometric analysis for volcanic eruption of Hawaii island. J. Volcanol. Geotherm. Res. 2019, 370, 31–50. [Google Scholar] [CrossRef]
  39. Pavez, A.; Remy, D.; Bonvalot, S.; Diament, M.; Gabalda, G.; Froger, J.-L.; Julien, P.; Legrand, D.; Moisset, D. Insight into ground deformations at Lascar volcano (Chile) from SAR interferometry, photogrammetry and GPS data: Implications on volcano dynamics and future space monitoring. Remote Sens. Environ. 2006, 100, 307–320. [Google Scholar] [CrossRef] [Green Version]
  40. Solaro, G.; Acocella, V.; Pepe, S.; Ruch, J.; Neri, M.; Sansosti, E. Anatomy of an unstable volcano from InSAR: Multiple processes affecting flank instability at Mt. Etna, 1994–2008. J. Geophys. Res. Solid Earth 2010, 115, B10405. [Google Scholar] [CrossRef]
  41. Kim, S.W.; Won, J.S. Slow deformation of Mt. Baekdu stratovolcano observed by satellite radar interferometry. In Proceedings of the FRINGE 2003 Workshop (ESA SP-550): 2004, Frascati, Italy, 1–5 December 2003. [Google Scholar]
  42. Trasatti, E.; Tolomei, C.; Wei, L.; Ventura, G. Upward Magma Migration within the Multi-level Plumbing System of the Changbaishan Volcano (China/North Korea) Revealed by the Modeling of 2018–2020 SAR Data. Front. Earth Sci. 2021, 9, 741287. [Google Scholar] [CrossRef]
  43. Berardino, P.; Fornaro, G.; Lanari, R.; Sansosti, E. A new algorithm for surface deformation monitoring based on small baseline differential SAR interferograms. IEEE Trans. Geosci. Remote 2002, 40, 2375–2383. [Google Scholar] [CrossRef] [Green Version]
  44. Chen, Q.; Ai, Y.; Chen, Y. Overview of deep structures under the Changbaishan volcanic area in Northeast China. Sci. China Earth Sci. 2019, 62, 935–952. [Google Scholar] [CrossRef]
  45. Li, C.; Zhang, X.; Zhang, Y. Analysis of tectonic setting of Changbaishan Tianchi volcano. Seismol. Geomagn. Obs. Res. 2006, 27, 43–49. [Google Scholar]
  46. Chen, H. Volcaniclastic Ejecta, Volcano Stratigraphy and Volcanic Geological Mapping in Changbaishan Tianchi Volcanoes. Master’s Thesis, Jilin University, Changchun, China, 2020. [Google Scholar]
  47. Jin, B.; Zhang, X. Study on Volcanic Geology of Changbai Mountain; Korean National Education Press in Northeast China: Yanji, China, 1994. [Google Scholar]
  48. Liu, M.; Gu, M.; Sun, Z.; Wei, H.; Jin, B. Activity of main faults and hydrothermal alteration zone at the Tianchi volcano. Changbaishan Earthq. Res. China 2004, 20, 64–72. [Google Scholar]
  49. Raspini, F.; Bianchini, S.; Ciampalini, A.; Del Soldato, M.; Solari, L.; Novali, F.; Del Conte, S.; Rucci, A.; Ferretti, A.; Casagli, N. Continuous, semi-automatic monitoring of ground deformation using Sentinel-1 satellites. Sci. Rep. 2018, 8, 7253. [Google Scholar] [CrossRef] [Green Version]
  50. Zhang, B.; Wang, R.; Deng, Y.; Ma, P.; Lin, H.; Wang, J. Mapping the Yellow River Delta land subsidence with multitemporal SAR interferometry by exploiting both persistent and distributed scatterers. ISPRS J. Photogramm. Remote Sens. 2019, 148, 157–173. [Google Scholar] [CrossRef]
  51. Hu, L.; Dai, K.; Xing, C.; Li, Z.; Tomás, R.; Clark, B.; Shi, X.; Chen, M.; Zhang, R.; Qiu, Q. Land subsidence in Beijing and its relationship with geological faults revealed by Sentinel-1 InSAR observations. Int. J. Appl. Earth Obs. Geoinf. 2019, 82, 101886. [Google Scholar] [CrossRef]
  52. Qu, F.; Lu, Z.; Zhang, Q.; Bawden, G.W.; Kim, J.W.; Zhao, C.; Qu, W. Mapping ground deformation over Houston–Galveston, Texas using multi-temporal InSAR. Remote Sens. Environ. 2015, 169, 290–306. [Google Scholar] [CrossRef]
  53. Goldstein, R.M.; Werner, C.L. Radar interferogram filtering for geophysical applications. Geophys. Res. Lett. 1998, 25, 4035–4038. [Google Scholar] [CrossRef] [Green Version]
  54. Pepe, A.; Lanari, R. On the extension of the minimum cost flow algorithm for phase unwrapping of multitemporal differential SAR interferograms. IEEE Trans. Geosci. Remote 2006, 44, 2374–2383. [Google Scholar] [CrossRef]
  55. Wu, Q.; Jia, C.; Chen, S.; Li, H. SBAS-InSAR based deformation detection of urban land, created from mega-scale mountain excavating and valley filling in the Loess Plateau: The case study of Yan’an City. Remote Sens. 2019, 11, 1673. [Google Scholar] [CrossRef] [Green Version]
  56. Li, C.; Lv, J.; Wang, J.; Cai, H.; Liu, B. Assessments of risk and hazards of pyroclastic flow in Tianchi volcano, Changbaishan. Seism. Res. Northeast. China 1999, 27, 43–49. [Google Scholar]
  57. Syarifuddin, M.; Oishi, S.; Legono, D.; Hapsari, R.I.; Iguchi, M. Integrating X-MP radar data to estimate rainfall induced debris flow in the Merapi volcanic area. Adv. Water Resour. 2017, 110, 249–262. [Google Scholar] [CrossRef]
  58. Hu, Y.; Wang, Q.; Cui, D.; Li, K.; Zheng, C. Influences on surface deformation by the three different stress source models in volcanic area. Seism. Res. Northeast. China 2005, 21, 33–38. [Google Scholar]
  59. Zhu, G.; Wang, Q.; Shi, Y.; Cui, D. Modelling pressurized deformation source for Changbaishan volcano with homogenous expansion point source. Chin. J. Geophys. 2008, 51, 89–96. [Google Scholar] [CrossRef]
  60. Mogi, K. Relations between the eruptions of various volcanoes and the deformations of the ground surfaces around them. Earthq. Res. Inst. 1958, 36, 99–134. [Google Scholar]
  61. Fialko, Y.; Khazan, Y.; Simons, M. Deformation due to a pressurized horizontal circular crack in an elastic half-space, with applications to volcano geodesy. Geophys. J. Int. 2001, 146, 181–190. [Google Scholar] [CrossRef] [Green Version]
  62. McTigue, D. Elastic stress and deformation near a finite spherical magma body: Resolution of the point source paradox. J. Geophys. Res. Solid Earth 1987, 92, 12931–12940. [Google Scholar] [CrossRef]
  63. Yang, X.; Davis, P.M.; Dieterich, J.H. Deformation from inflation of a dipping finite prolate spheroid in an elastic half-space as a model for volcanic stressing. J. Geophys. Res. Solid Earth 1988, 93, 4249–4257. [Google Scholar] [CrossRef]
  64. Yang, Z.; Zhang, X.; Zhao, J.; Yang, J.; Duan, Y.; Wang, S. Tomographic imaging of 3-D crustal structure beneath Changbaishan-Tianchi volcano region. Chin. J. Geophys. 2005, 48, 107–115. [Google Scholar] [CrossRef]
  65. Bagnardi, M.; Hooper, A. Inversion of Surface Deformation Data for Rapid Estimates of Source Parameters and Uncertainties: A Bayesian Approach. Geochem. Geophy. Geosyst. 2018, 19, 2194–2211. [Google Scholar] [CrossRef]
Figure 1. Overview of the study area. The base map is ALOS World 3D DEM (30 m). The black rectangle indicates the range in this study. The solid red lines marked f1, f2, ……, and f10 are the fault structures. The solid gray line represents the contour line with an interval of 400 m.
Remotesensing 14 01213 g001
Figure 2. An interconnected network of interferometric pairs in SBAS-InSAR analysis. (a) Original interferometric pairs; (b) optimized interferometric pairs. The green dots are the slave images, the yellow dots represent the super master images, and each line represents an interferometric pair.
Remotesensing 14 01213 g002
Figure 3. Mean deformation velocity along the LOS direction in the Changbaishan volcano. The results were overlaid on sentinel-2 MSI image with 30% transparency.
Remotesensing 14 01213 g003
Figure 4. (a) The Prev of every inverted MDV point in the Changbaishan volcano. The base map was generated using ESRI ArcGIS Pro Online Map platform (https://www.esri.com/en-us/arcgis/products/arcgis-pro/resources, accessed on 6 August 2021), and (b) Histogram of the Prev values. The dashed line is located at 1.176 mm, which is the lowest value between two modes.
Remotesensing 14 01213 g004
Figure 5. The mean deformation velocity after Prev constraint in the Changbaishan volcano. Capital letters, A to F, represent the deformation regions, and lowercase letters, a to j, are the special deformation spots. The black lines are the faults outlined in Figure 1.
Remotesensing 14 01213 g005
Figure 6. The cumulative surface deformation (CSD) along LOS direction.
Remotesensing 14 01213 g006
Figure 7. Time series cumulative surface deformation of the nine selected typical positions of the Changbaishan volcano. Subfigures (ai) are marked with the cumulative deformation first-order (Y1) and third-order (Y2) polynomial fitting curve equation with the corresponding Goodness of Fit (R2 represents the coefficient of determination (COD), Adj. R2 represents the adjusted coefficient of determination (Adjusted R2)). The black dot line is the maximum magnitude and the number of annual earthquakes in the corresponding year, where the number in the upper is the maximum magnitude of the earthquake and the number in the lower is the amount of the earthquakes. The data is in-situ measured by Changbaishan Tianchi Volcano Observatory. The epicenters of earthquakes are within 30 km of the Changbaishan volcano.
Remotesensing 14 01213 g007
Figure 8. The maximal magnitude and the number of annual earthquakes in the Changbaishan volcano from 1999 to 2020. The data is in-situ measured by Changbaishan Tianchi Volcano Observatory. The epicenters of earthquakes are within 30 km of the Changbaishan volcano. The black line is the leveling measurement by Hu et al. [36], the purple, red, and green lines are the retrieved CSD results by Tang P. et al. [35], He et al. [32], and Kim et al. [34], respectively. The blue line is the result of this study.
Remotesensing 14 01213 g008
Figure 9. Marginal posterior probability distributions for the single Mogi source parameters for the Changbaishan volcano. Black line represents the maximal a posteriori probability solution. Scatter plots are contoured according to frequency (cold colors for low frequency, warm colors for high frequency).
Remotesensing 14 01213 g009
Table 1. Current status in studying surface deformation in the Changbaishan volcano using InSAR method.
PeriodDatasetQuantity of DatasetsMethodMaximum Surface DeformationPressure Source Inversion
Kim and Won [41]1992–1998ERS-1/2 and JERS-110/41DInSAR3 mm/year-
Chen et al. [30]1995–1998JERS-12DInSARalmost no deformationDouble Mogi source
Han et al. [31]1994–1998JERS-14DInSAR5 mm/year-
Tang P. et al. [35]1992–1998JERS-119PS-InSAR6 mm/year-
2007–2010ENVISAT ASAR14PS-InSAR3 mm/year-
Kim et al. [34]2007–2010ENVISAT ASAR/ALOS PALSAR19/4StaMPS/DInSAR30 mm/yearSingle Mogi source/Okada dislocation
He et al. [32]2006–2011ALOS PALSAR24PS-InSAR10 mm/yearSingle Mogi source
Trasatti et al. [42]2018–2020ALOS-219PS-InSAR20 mm/yearProlate spheroid
Table 2. Previous inversion results of deep pressure source of the Changbaishan volcano.
ModelDepth (km)ΔV   ( × 10 6   m 3 ) Strike (°)Plunge (°)
Hu et al. [58]Double Mogi source3.2791
(2002–2003)
0.004--
4.19680.015--
Hu et al. [36]Single Mogi source6.854
(2002~2003)
16.980--
7.653
(2003~2004)
10.620--
3.1515
(2004~2005)
3.390--
Zhu et al. [59]Okada dislocation9.2
(2002–2003)
5.220337.714.0
9.27.034.482.2
9.26.598302.878.5
Chen et al. [30]Double Mogi source7.9
(2002–2003)
6.3--
5.51.6--
He et al. [32]Single Mogi source5.3
(2006–2009)
2.475 *--
6.9
(2009–2011)
2.093 *--
Kim et al. [34]Single Mogi source11.465
(2007.8–2007.12)
3.756--
11.094
(2008.3–2008.5)
1.579--
10.013
(2010.0–2010.4)
−1.557--
Huang et al. [9]Finite Element6.86
(2002–2003)
-77.544.3
-324.569.1
-217.953.1
Trasatti et al. [42]Prolate spheroid7.77.3 (±2.4)1400
Tabular reservoir (2018–2020)14.0−14 (±4)500
Single Mogi source (2002–2005)4.404.6 (±1.53)--
Single Mogi source (2009–2011)6.70−1.4 (±0.2)--
Note: The source volume retains two decimal places, and the data marked with * are converted from the data in the original paper.
Table 3. The prior information for the single Mogi, double Mogi, penny-shaped sill-like, finite spherical, and prolate spheroid sources.
ModelParameterStartStepLowerUpper
Single Mogi and double MogiX (m)050−15,00015,000
Y (m)050−15,00015,000
Depth (m)300010010010,000
DV (m3)1 × 1051 × 105−1 × 1071 × 109
Penny-shaped sill-likeX (m)0100−20,00020,000
Y (m)0100−20,00020,000
Depth (m)20005010020,000
Radius (m)10001001002000
ΔP/μ−1 × 10−31 × 10−4−1 × 1031 × 103
Finite sphericalX (m)−1000100−20,00020,000
Y (m)10001000−20,00020,000
Depth (m)3000100100015,000
Radius (m)1000501005000
ΔP/μ−1 × 10−31 × 10−4−1 × 1061 × 105
Prolate spheroidX (m)0100−20,00020,000
Y (m)0100−20,00020,000
Depth (m)500050100020,000
Major semi axis (m)50050120,000
Aspect ratio0.50.010.010.99
ΔP/μ−1 × 1031 × 10−4−1 × 1031 × 103
Strike (°)27011359
Plunge (°)−301−89.989.9
Note: The coordinates X (km) and Y (km) are centered in the geo-reference point: [128.084°, 42.051°]; Depth (km) is depth of deep pressure source (positive downward); DV (×106 m3) is the change of the deep pressure source volume; Radius (m) is the radius of the sphere; Major semi axis (m) is the length of major semi-axis; Aspect ratio is dimensionless aspect ratio between semi-axes (minor/major); ΔP/μ is the dimensionless excess pressure; Strike (°) is the strike angle of major semi-axis with respect to North (0°/360° = N; 90° = E; 180° = S; 270° = W); Plunge (°) is the inclination angle of major semi-axis with respect to horizontal (0° = horizontal; 90° = vertical).
Table 4. The ‘Optimal’, ‘Mean’, ‘Median’ values, and 97.5% confidence of inverted deep pressure source parameters.
ModelParameterOptimalMeanMedian2.5%97.5%
Single MogiX (km)−5.315−7.126−6.910−10.809−4.603
Y (km)3.1725.9465.8992.1269.967
Depth (km)6.26.26.43.87.7
DV   ( × 106 m3)3.25.75.32.510.6
Double Mogi1X (km)−3.831−3.817−3.847−5.109−2.852
Y (km)1.4471.9131.6890.7454.330
Depth (km)4. 74.74.83.06.3
DV   ( × 106 m3)1.82.02.00.93.8
Double Mogi2X (km)−7.088−7.192−7.124−7.412−7.075
Y (km)−0.869−0.909−0.869−1.009−0.334
Depth (km)0.0120.1060.042−0.0040.334
DV   ( × 106 m3)0.00060.01710.00170.00070.0658
Penny-shaped sill-likeX (km)−0.741−0.931−0.938−1.180−0.677
Y (km)−5.908−5.665−5.655−5.968−5.358
Depth (km)1.41.91.91.32.1
Radius (m)236.2341.0332.1235.3427.6
ΔP/μ−0.01−0.00−0.00−0.01−0.00
Finite sphericalX (km)3.3043.3803.3722.9713.834
Y (km)2.4282.4912.4761.9663.098
Depth (km)1.01.01.01.01.2
Radius (m)149.5227.3170.2102.0686.1
ΔP/μ−0.56−0.60−0.39−1.86−0.01
Prolate spheroidX (km)0.6180.6870.6850.3821.041
Y (km)−0.708−0.741−0.719−1.195−0.413
Depth (km)1.01.11.01.01.3
Aspect ratio0.040.040.020.010.13
ΔP/μ−0.04−0.18−0.11−0.67−0.00
Major semi axis (m)2378.42355.72357.11879.02838.6
Strike (°)291.18291.57291.64281.12312.12
Plunge (°)53.1853.1953.5146.2957.03
Geo-reference point: [128.084°, 42.051°].
Publisher’s Note: MDPI stays neutral with regard to jurisdictional claims in published maps and institutional affiliations.

