Next Issue
Volume 14, March-2
Previous Issue
Volume 14, February-2
 
 
remotesensing-logo

Journal Browser

Journal Browser

Remote Sens., Volume 14, Issue 5 (March-1 2022) – 248 articles

Cover Story (view full-size image): 
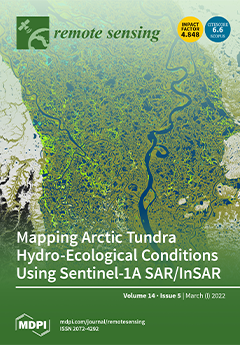
There is an increased interest in exploiting novel interferometric synthetic aperture radar (InSAR) techniques for Earth observation activities. However, InSAR measurements, such as coherence, have not been widely explored for Arctic tundra land cover classification. Thus, in this study, we assessed a time-series of dual-polarimetric Sentinel-1A SAR/InSAR, along with topographic data, for mapping the Mackenzie Delta region. SAR intensity and coherence time–series patterns were used to characterize six hydro-ecological cover types defined by their structure (e.g., graminoid, or woody) and hydrology (e.g., wet, or dry). Our study established a machine learning methodology capable of deriving this critical hydro-ecological information which will be important to update over forthcoming seasons due to accelerated warming of the climate. View this paper
  • Issues are regarded as officially published after their release is announced to the table of contents alert mailing list.
  • You may sign up for e-mail alerts to receive table of contents of newly released issues.
  • PDF is the official format for papers published in both, html and pdf forms. To view the papers in pdf format, click on the "PDF Full-text" link, and use the free Adobe Reader to open them.
Order results
Result details
Section
Select all
Export citation of selected articles as:
22 pages, 161466 KiB  
Article
An Interpretation Approach of Ascending–Descending SAR Data for Landslide Identification
by Tianhe Ren, Wenping Gong, Liang Gao, Fumeng Zhao and Zhan Cheng
Remote Sens. 2022, 14(5), 1299; https://doi.org/10.3390/rs14051299 - 07 Mar 2022
Cited by 19 | Viewed by 4381
Abstract
The technique of interferometric synthetic aperture radar (InSAR) is increasingly employed for landslide detection over large areas, even though the limitations of initial InSAR analysis results have been well acknowledged. Steep terrain in mountainous areas may cause geometric distortions of SAR images, which [...] Read more.
The technique of interferometric synthetic aperture radar (InSAR) is increasingly employed for landslide detection over large areas, even though the limitations of initial InSAR analysis results have been well acknowledged. Steep terrain in mountainous areas may cause geometric distortions of SAR images, which could affect the accuracy of InSAR analysis results. In addition, due to the existence of massive ground deformation points in the initial InSAR analysis results, accurate landslide recognition from the initial results is challenging. To efficiently identify potential landslide areas from the ascending–descending SAR datasets, this paper presents a novel interpretation approach to analyze the initial time-series InSAR analysis results. Within the context of the proposed approach, SAR visibility analysis, conversion analysis of deformation rates obtained from the time-series InSAR analysis, and spatial analysis and statistics tools for cluster extraction are incorporated. The effectiveness of the proposed approach is illustrated through a case study of landslide identification in Danba, a county in Sichuan, China. The potential landslide regions in the study area are identified based on the interpretation of small baseline subset InSAR (SBAS-InSAR) results, obtained with ascending–descending Sentinel-1A datasets. Finally, on the basis of the field survey results, a total of 21 landslides are detected in the potential landslide regions identified, through which the results obtained from the proposed interpretation approach are tested. Full article
(This article belongs to the Section Remote Sensing in Geology, Geomorphology and Hydrology)
Show Figures

Figure 1

19 pages, 5426 KiB  
Article
Vegetation Browning Trends in Spring and Autumn over Xinjiang, China, during the Warming Hiatus
by Moyan Li, Junqiang Yao, Jingyun Guan and Jianghua Zheng
Remote Sens. 2022, 14(5), 1298; https://doi.org/10.3390/rs14051298 - 07 Mar 2022
Cited by 8 | Viewed by 2678
Abstract
Satellite-derived vegetation records (GIMMS3g-NDVI) report that climate warming promotes vegetation greening trends; however, the climate impacts on vegetation growth during the global warming hiatus period (1998–2012) remain unclear. In this study, we focused on the vegetation change trend in Xinjiang in spring and [...] Read more.
Satellite-derived vegetation records (GIMMS3g-NDVI) report that climate warming promotes vegetation greening trends; however, the climate impacts on vegetation growth during the global warming hiatus period (1998–2012) remain unclear. In this study, we focused on the vegetation change trend in Xinjiang in spring and autumn before and during the recent warming hiatus period, and their climate-driving mechanisms, which have not been examined in previous studies. Based on satellite records, our results indicated that the summer normalized difference vegetation index (NDVI) in Xinjiang experienced a greening trend, while a browning trend existed in spring and autumn during this period. The autumn NDVI browning trend in Xinjiang was larger than that in spring; however, the spring NDVI displayed a higher correlation with climatic factors than did the autumn NDVI. During the warming hiatus, spring climatic factors were the main controlling factors of spring NDVI, and spring vapor pressure deficit (VPD) had the highest positive correlation with spring NDVI, followed by spring temperature. The larger increase in air temperature in spring than in autumn resulted in increased VPD differences in spring and autumn. In autumn, summer climatic factors (e.g., VPD, WS, RH, and precipitation) were significantly correlated with the autumn NDVI during the warming hiatus. However, the autumn temperature was weakly correlated with the autumn NDVI. Our results have significant implications for understanding the response of vegetation growth to recent and future climatic conditions. Full article
(This article belongs to the Special Issue Remote Sensing of Watershed)
Show Figures

Graphical abstract

23 pages, 3322 KiB  
Article
Biogeochemical Model Optimization by Using Satellite-Derived Phytoplankton Functional Type Data and BGC-Argo Observations in the Northern South China Sea
by Chan Shu, Peng Xiu, Xiaogang Xing, Guoqiang Qiu, Wentao Ma, Robert J. W. Brewin and Stefano Ciavatta
Remote Sens. 2022, 14(5), 1297; https://doi.org/10.3390/rs14051297 - 07 Mar 2022
Cited by 3 | Viewed by 2664
Abstract
Marine biogeochemical models have been widely used to understand ecosystem dynamics and biogeochemical cycles. To resolve more processes, models typically increase in complexity, and require optimization of more parameters. Data assimilation is an essential tool for parameter optimization, which can reduce model uncertainty [...] Read more.
Marine biogeochemical models have been widely used to understand ecosystem dynamics and biogeochemical cycles. To resolve more processes, models typically increase in complexity, and require optimization of more parameters. Data assimilation is an essential tool for parameter optimization, which can reduce model uncertainty and improve model predictability. At present, model parameters are often adjusted using sporadic in-situ measurements or satellite-derived total chlorophyll-a concentration at sea surface. However, new ocean datasets and satellite products have become available, providing a unique opportunity to further constrain ecosystem models. Biogeochemical-Argo (BGC-Argo) floats are able to observe the ocean interior continuously and satellite phytoplankton functional type (PFT) data has the potential to optimize biogeochemical models with multiple phytoplankton species. In this study, we assess the value of assimilating BGC-Argo measurements and satellite-derived PFT data in a biogeochemical model in the northern South China Sea (SCS) by using a genetic algorithm. The assimilation of the satellite-derived PFT data was found to improve not only the modeled total chlorophyll-a concentration, but also the individual phytoplankton groups at surface. The improvement of simulated surface diatom provided a better representation of subsurface particulate organic carbon (POC). However, using satellite data alone did not improve vertical distributions of chlorophyll-a and POC. Instead, these distributions were improved by combining the satellite data with BGC-Argo data. As the dominant variability of phytoplankton in the northern SCS is at the seasonal timescale, we find that utilizing monthly-averaged BGC-Argo profiles provides an optimal fit between model outputs and measurements in the region, better than using high-frequency measurements. Full article
(This article belongs to the Section Ocean Remote Sensing)
Show Figures

Figure 1

21 pages, 3947 KiB  
Article
Land Surface Phenology Retrieval through Spectral and Angular Harmonization of Landsat-8, Sentinel-2 and Gaofen-1 Data
by Jun Lu, Tao He, Dan-Xia Song and Cai-Qun Wang
Remote Sens. 2022, 14(5), 1296; https://doi.org/10.3390/rs14051296 - 07 Mar 2022
Cited by 8 | Viewed by 2976
Abstract
Land Surface Phenology is an important characteristic of vegetation, which can be informative of its response to climate change. However, satellite-based identification of vegetation transition dates is hindered by inconsistencies in different observation platforms, including band settings, viewing angles, and scale effects. Therefore, [...] Read more.
Land Surface Phenology is an important characteristic of vegetation, which can be informative of its response to climate change. However, satellite-based identification of vegetation transition dates is hindered by inconsistencies in different observation platforms, including band settings, viewing angles, and scale effects. Therefore, time-series data with high consistency are necessary for monitoring vegetation phenology. This study proposes a data harmonization approach that involves band conversion and bidirectional reflectance distribution function (BRDF) correction to create normalized reflectance from Landsat-8, Sentinel-2A, and Gaofen-1 (GF-1) satellite data, characterized by the same spectral and illumination-viewing angles as the Moderate-Resolution Imaging Spectroradiometer (MODIS) and Nadir BRDF Adjusted Reflectance (NBAR). The harmonized data are then subjected to the spatial and temporal adaptive reflectance fusion model (STARFM) to produce time-series data with high spatio–temporal resolution. Finally, the transition date of typical vegetation was estimated using regular 30 m spatial resolution data. The results show that the data harmonization method proposed in this study assists in improving the consistency of different observations under different viewing angles. The fusion result of STARFM was improved after eliminating differences in the input data, and the accuracy of the remote-sensing-based vegetation transition date was improved by the fused time-series curve with the input of harmonized data. The root mean square error (RMSE) estimation of the vegetation transition date decreased by 9.58 days. We concluded that data harmonization eliminates the viewing-angle effect and is essential for time-series vegetation monitoring through improved data fusion. Full article
Show Figures

Figure 1

16 pages, 6320 KiB  
Article
A New Spatial Filtering Algorithm for Noisy and Missing GNSS Position Time Series Using Weighted Expectation Maximization Principal Component Analysis: A Case Study for Regional GNSS Network in Xinjiang Province
by Wudong Li, Zhao Li, Weiping Jiang, Qusen Chen, Guangbin Zhu and Jian Wang
Remote Sens. 2022, 14(5), 1295; https://doi.org/10.3390/rs14051295 - 07 Mar 2022
Cited by 9 | Viewed by 1936
Abstract
Common Mode Error (CME) presents a kind of spatially correlated error that is widespread in regional Global Navigation Satellite System (GNSS) networks and should be eliminated during postprocessing of a GNSS position time series. Several spatiotemporal filtering methods have been developed to mitigate [...] Read more.
Common Mode Error (CME) presents a kind of spatially correlated error that is widespread in regional Global Navigation Satellite System (GNSS) networks and should be eliminated during postprocessing of a GNSS position time series. Several spatiotemporal filtering methods have been developed to mitigate the effects of CME. However, such methodologies become inappropriate when missing and noisy data exists. In this research, we introduce a novel spatial filtering algorithm called Weighted Expectation Maximization Principal Component Analysis (WEMPCA) for detecting and removing CME from noisy GNSS position time series with missing values, among which formal errors of daily GNSS solutions are utilized to weight the input data. Compared with traditional PCA and the special case of EMPCA, simulation experiments demonstrate that the new WEMPCA algorithm always has outstanding performance over others. The WEMPCA algorithm was then successfully used to extract the CME from real noisy and missing GNSS position time series in Xinjiang province. Our results show that only the first principal component exhibits significant spatial response, with average values of 70.11%, 66.53%, and 52.45% for North, East, and Up (NEU) components, respectively, indicating that it represents the CME of this region. After removing CME, the canonical correlation coefficients and root mean square error of GNSS residual time series, as well as the amplitudes of power-law noises (PLN), are obviously decreased in all three directions. However, the white noise (WN) amplitudes are found to diminish exclusively in the North and East component, not in the Up components. Moreover, the average velocity differences before and after filtering CME are 0.19 mm/year, 0.03 mm/year, and −0.56 mm/year for the NEU components, respectively, indicating that CME has an influence on the GNSS station velocity estimation. The velocity uncertainty is also reduced by 43.51%, 38.64%, and 40.39% on average for the NEU components, respectively, implying that the velocity estimates are more reliable and accurate after removing CME. Therefore, we conclude that the new WEMPCA approach provides an efficient solution to detect and mitigate CME from the noisy and missing GNSS position time series. Full article
Show Figures

Figure 1

18 pages, 5296 KiB  
Article
Efficient Depth Fusion Transformer for Aerial Image Semantic Segmentation
by Li Yan, Jianming Huang, Hong Xie, Pengcheng Wei and Zhao Gao
Remote Sens. 2022, 14(5), 1294; https://doi.org/10.3390/rs14051294 - 07 Mar 2022
Cited by 12 | Viewed by 6049
Abstract
Taking depth into consideration has been proven to improve the performance of semantic segmentation through providing additional geometry information. Most existing works adopt a two-stream network, extracting features from color images and depth images separately using two branches of the same structure, which [...] Read more.
Taking depth into consideration has been proven to improve the performance of semantic segmentation through providing additional geometry information. Most existing works adopt a two-stream network, extracting features from color images and depth images separately using two branches of the same structure, which suffer from high memory and computation costs. We find that depth features acquired by simple downsampling can also play a complementary part in the semantic segmentation task, sometimes even better than the two-stream scheme with the same two branches. In this paper, a novel and efficient depth fusion transformer network for aerial image segmentation is proposed. The presented network utilizes patch merging to downsample depth input and a depth-aware self-attention (DSA) module is designed to mitigate the gap caused by difference between two branches and two modalities. Concretely, the DSA fuses depth features and color features by computing depth similarity and impact on self-attention map calculated by color feature. Extensive experiments on the ISPRS 2D semantic segmentation dataset validate the efficiency and effectiveness of our method. With nearly half the parameters of traditional two-stream scheme, our method acquires 83.82% mIoU on Vaihingen dataset outperforming other state-of-the-art methods and 87.43% mIoU on Potsdam dataset comparable to the state-of-the-art. Full article
Show Figures

Graphical abstract

21 pages, 3800 KiB  
Review
Advances in Lightning Monitoring and Location Technology Research in China
by Yijun Zhang, Yang Zhang, Mengjin Zou, Jingxuan Wang, Yurui Li, Yadan Tan, Yuwen Feng, Huiyi Zhang and Shunxing Zhu
Remote Sens. 2022, 14(5), 1293; https://doi.org/10.3390/rs14051293 - 07 Mar 2022
Cited by 13 | Viewed by 3616
Abstract
Monitoring lightning and its location is important for understanding thunderstorm activity and revealing lightning discharge mechanisms. This is often realized based on very low-frequency/low-frequency (VLF/LF) signals, very high-frequency (VHF) signals, and optical radiation signals generated during the lightning discharge process. The development of [...] Read more.
Monitoring lightning and its location is important for understanding thunderstorm activity and revealing lightning discharge mechanisms. This is often realized based on very low-frequency/low-frequency (VLF/LF) signals, very high-frequency (VHF) signals, and optical radiation signals generated during the lightning discharge process. The development of lightning monitoring and location technology worldwide has largely evolved from a single station to multiple stations, from the return strokes (RSs) of cloud-to-ground (CG) lightning flashes to total lightning flashes, from total lightning flashes to lightning discharge channels, and from ground-based lightning observations to satellite-based lightning observations, all of which have aided our understanding of atmospheric electricity. Lightning monitoring and positioning technology in China has kept up with international advances. In terms of lightning monitoring based on VLF/LF signals, single-station positioning technology has been developed, and a nationwide CG lightning detection network has been built since the end of the twentieth century. Research on total lightning flash positioning technology began at the beginning of the 21st century, and precision total lightning flash positioning technology has improved significantly over the last 10 years. In terms of positioning technology based on VHF signals, narrowband interferometers and wideband interferometers have been developed, and long-baseline radiation source positioning technology and continuous interferometers have been developed over the last ten years, significantly improving the channel characterization ability of lightning locations. In terms of lightning monitoring based on optical signals, China has for the first time developed lightning mapping imagers loaded by geosynchronous satellites, providing an important means for large-scale and all-weather lightning monitoring. Full article
Show Figures

Figure 1

19 pages, 4564 KiB  
Article
Seasonal Contrast and Interactive Effects of Potential Drivers on Land Surface Temperature in the Sichuan Basin, China
by Ziyi Wang, Dongqi Sun, Chunguang Hu, Yu Wang and Jingxiang Zhang
Remote Sens. 2022, 14(5), 1292; https://doi.org/10.3390/rs14051292 - 06 Mar 2022
Cited by 13 | Viewed by 2504
Abstract
Little is known about the seasonal heterogeneity of land surface temperature (LST) and the interaction relationship between potential drivers in Sichuan Basin, China. In this study, based on exploring the spatial heterogeneity of LST in Sichuan Basin, China, multi-source remote sensing data as [...] Read more.
Little is known about the seasonal heterogeneity of land surface temperature (LST) and the interaction relationship between potential drivers in Sichuan Basin, China. In this study, based on exploring the spatial heterogeneity of LST in Sichuan Basin, China, multi-source remote sensing data as potential drivers were selected and a Geo-detector model was applied to analyze the main drivers and the interactive relationship between drivers on LST during different seasons. The results showed that the high-temperature areas in Sichuan Basin in different seasons all appeared in the cities near the high mountains on the edge of the basin. This phenomenon was summarized as “sinking heat island” by us. From the driving factors, the biophysical parameters (DEM, SLOPE and NDVI) had the greatest impact on LST in each season, reaching the peak in the transition season. The climate parameters (WIND, HUM, PRE and TEM) and socioeconomic parameters (LIGHT, POP and ROAD) also had a certain impact on LST. The influence of a single landscape parameter (SHDI, PD, LPI, ED and LSI) on LST is limited. From the effect of factor interaction on LST, the interaction of biophysical parameters, climatic parameters and landscape parameters from summer to the transitional season was strengthened obviously, and it showed a downward trend in the winter; in contrast, the socioeconomic parameters showed the opposite characteristics, indicating that the interaction between human activities and other factors affected LST more obviously in the winter. The results of this study are not only valuable for understanding the spatial features of LST but also important for formulating mitigation strategies and sustainable development of urban heat island in Sichuan Basin. Full article
(This article belongs to the Topic Climate Change and Environmental Sustainability)
Show Figures

Figure 1

18 pages, 5238 KiB  
Article
ISAR Resolution Enhancement Method Exploiting Generative Adversarial Network
by Haobo Wang, Kaiming Li, Xiaofei Lu, Qun Zhang, Ying Luo and Le Kang
Remote Sens. 2022, 14(5), 1291; https://doi.org/10.3390/rs14051291 - 06 Mar 2022
Cited by 16 | Viewed by 2163
Abstract
Deep learning has been used in inverse synthetic aperture radar (ISAR) imaging to improve resolution performance, but there still exist some problems: the loss of weak scattering points, over-smoothed imaging results, and the universality and generalization. To address these problems, an ISAR resolution [...] Read more.
Deep learning has been used in inverse synthetic aperture radar (ISAR) imaging to improve resolution performance, but there still exist some problems: the loss of weak scattering points, over-smoothed imaging results, and the universality and generalization. To address these problems, an ISAR resolution enhancement method of exploiting a generative adversarial network (GAN) is proposed in this paper. We adopt a relativistic average discriminator (RaD) to enhance the ability of the network to describe target details. The proposed loss function is composed of feature loss, adversarial loss, and absolute loss. The feature loss is used to get the main characteristics of the target. The adversarial loss ensures that the proposed GAN recovers more target details. The absolute loss is adopted to make the imaging results not over-smoothed. Experiments based on simulated and measured data under different conditions demonstrate that the proposed method has good imaging performance. In addition, the universality and generalization of the proposed GAN are also well verified. Full article
Show Figures

Figure 1

28 pages, 9850 KiB  
Article
Multiple UAV Flights across the Growing Season Can Characterize Fine Scale Phenological Heterogeneity within and among Vegetation Functional Groups
by David J. A. Wood, Todd M. Preston, Scott Powell and Paul C. Stoy
Remote Sens. 2022, 14(5), 1290; https://doi.org/10.3390/rs14051290 - 06 Mar 2022
Cited by 7 | Viewed by 2972
Abstract
Grasslands and shrublands exhibit pronounced spatial and temporal variability in structure and function with differences in phenology that can be difficult to observe. Unpiloted aerial vehicles (UAVs) can measure vegetation spectral patterns relatively cheaply and repeatably at fine spatial resolution. We tested the [...] Read more.
Grasslands and shrublands exhibit pronounced spatial and temporal variability in structure and function with differences in phenology that can be difficult to observe. Unpiloted aerial vehicles (UAVs) can measure vegetation spectral patterns relatively cheaply and repeatably at fine spatial resolution. We tested the ability of UAVs to measure phenological variability within vegetation functional groups and to improve classification accuracy at two sites in Montana, U.S.A. We tested four flight frequencies during the growing season. Classification accuracy based on reference data increased by 5–10% between a single flight and scenarios including all conducted flights. Accuracy increased from 50.6% to 61.4% at the drier site, while at the more mesic/densely vegetated site, we found an increase of 59.0% to 64.4% between a single and multiple flights over the growing season. Peak green-up varied by 2–4 weeks within the scenes, and sparse vegetation classes had only a short detectable window of active phtosynthesis; therefore, a single flight could not capture all vegetation that was active across the growing season. The multi-temporal analyses identified differences in the seasonal timing of green-up and senescence within herbaceous and sagebrush classes. Multiple UAV measurements can identify the fine-scale phenological variability in complex mixed grass/shrub vegetation. Full article
(This article belongs to the Section Remote Sensing in Agriculture and Vegetation)
Show Figures

Figure 1

19 pages, 864 KiB  
Article
Smoothing Linear Multi-Target Tracking Using Integrated Track Splitting Filter
by Sufyan Ali Memon, Ihsan Ullah, Uzair Khan and Taek Lyul Song
Remote Sens. 2022, 14(5), 1289; https://doi.org/10.3390/rs14051289 - 06 Mar 2022
Cited by 5 | Viewed by 2341
Abstract
Multi-target tracking (MTT) is a challenging issue due to an unknown number of real targets, motion uncertainties, and coalescence behavior of sensor (such as radar) measurements. The conventional MTT systems deal with intractable computational complexities because they enumerate all feasible joint measurement-to-track association [...] Read more.
Multi-target tracking (MTT) is a challenging issue due to an unknown number of real targets, motion uncertainties, and coalescence behavior of sensor (such as radar) measurements. The conventional MTT systems deal with intractable computational complexities because they enumerate all feasible joint measurement-to-track association hypotheses and recursively calculate the a posteriori probabilities of each of these joint hypotheses. Therefore, the state-of-art MTT system demands bypassing the entire joint data association procedure. This research work utilizes linear multi-target (LM) tracking to treat feasible target detections followed by neighbored tracks as clutters. The LM integrated track splitting (LMITS) algorithm was developed without a smoothing application that produces substantial estimation errors. Smoothing refines the state estimation in order to reduce estimation errors for an efficient MTT. Therefore, we propose a novel Fixed Interval Smoothing LMITS (FIsLMITS) algorithm in the existing LMITS algorithm framework to improve MTT performance. This algorithm initializes forward and backward tracks employing LMITS separately using measurements collected from the sensor in each scan. The forward track recursion starts after the smoothing. Therefore, each forward track acquires backward multi-tracks that arrived from upcoming scans (future scans) while simultaneously associating them in a forward track for fusion and smoothing. Thus, forward tracks become more reliable for multi-target state estimation in difficult cluttered environments. Monte Carlo simulations are carried out to demonstrate FIsLMITS with improved state estimation accuracy and false track discrimination (FTD) in comparison to the existing MTT algorithms. Full article
(This article belongs to the Special Issue Radar Signal Processing for Target Tracking)
Show Figures

Figure 1

17 pages, 11326 KiB  
Article
An Experimental HBIM Processing: Innovative Tool for 3D Model Reconstruction of Morpho-Typological Phases for the Cultural Heritage
by Vincenzo Barrile, Ernesto Bernardo and Giuliana Bilotta
Remote Sens. 2022, 14(5), 1288; https://doi.org/10.3390/rs14051288 - 06 Mar 2022
Cited by 21 | Viewed by 2997
Abstract
In this paper, we want to propose an investigation and a re-reading of the “Conventazzo” of San Pietro di Deca in Torrenova (ME), through the use of geomatics techniques (laser scanner, UAV—Unmanned Aerial Vehicle-photogrammetry and BIM—Building Information Modeling) and a reconstruction and representation [...] Read more.
In this paper, we want to propose an investigation and a re-reading of the “Conventazzo” of San Pietro di Deca in Torrenova (ME), through the use of geomatics techniques (laser scanner, UAV—Unmanned Aerial Vehicle-photogrammetry and BIM—Building Information Modeling) and a reconstruction and representation of different morpho-typological phases that highlight the numerous changes that this structure has undergone over the years. Particular attention was given to the BIM/HBIM (Heritage BIM) construction, bearing in mind that, in particular, the use of HBIM software for cultural heritage cannot perfectly represent old buildings with complex notable and particularly detailed architecture. Specifically, a new methodology is presented in order to replicate the complex details found in antique buildings, through the direct insertion of various 3D model parts (.obj) (point cloud segmentation from laser scanner and UAV/photogrammetry survey) into a BIM environment that includes intelligent objects linked to form the smart model. By having a huge amount of information available in a single digital model (HBIM), and by including all the information acquired during the survey campaign, it is possible to study the morphotypological evolutions of the building without the need to carry out subsequent survey campaigns. The limit of the proposed methodology, compared to the most used methodologies (despite the good results obtained), is that it requires the use of many types of software and is very slow. The proposed methodology was put to the test on the reconstruction of the “Conventazzo” in San Pietro di Deca, Torrenova (Messina). Full article
Show Figures

Figure 1

26 pages, 7986 KiB  
Article
Changes in the Eruptive Style of Stromboli Volcano before the 2019 Paroxysmal Phase Discovered through SOM Clustering of Seismo-Acoustic Features Compared with Camera Images and GBInSAR Data
by Flora Giudicepietro, Sonia Calvari, Luca D’Auria, Federico Di Traglia, Lukas Layer, Giovanni Macedonio, Teresa Caputo, Walter De Cesare, Gaetana Ganci, Marcello Martini, Massimo Orazi, Rosario Peluso, Giovanni Scarpato, Laura Spina, Teresa Nolesini, Nicola Casagli, Anna Tramelli and Antonietta M. Esposito
Remote Sens. 2022, 14(5), 1287; https://doi.org/10.3390/rs14051287 - 06 Mar 2022
Cited by 5 | Viewed by 2321
Abstract
Two paroxysmal explosions occurred at Stromboli on 3 July and 28 August 2019, the first of which caused the death of a young tourist. After the first paroxysm an effusive activity began from the summit vents and affected the NW flank of the [...] Read more.
Two paroxysmal explosions occurred at Stromboli on 3 July and 28 August 2019, the first of which caused the death of a young tourist. After the first paroxysm an effusive activity began from the summit vents and affected the NW flank of the island for the entire period between the two paroxysms. We carried out an unsupervised analysis of seismic and infrasonic data of Strombolian explosions over 10 months (15 November 2018–15 September 2019) using a Self-Organizing Map (SOM) neural network to recognize changes in the eruptive patterns of Stromboli that preceded the paroxysms. We used a dataset of 14,289 events. The SOM analysis identified three main clusters that showed different occurrences with time indicating a clear change in Stromboli’s eruptive style before the paroxysm of 3 July 2019. We compared the main clusters with the recordings of the fixed monitoring cameras and with the Ground-Based Interferometric Synthetic Aperture Radar measurements, and found that the clusters are associated with different types of Strombolian explosions and different deformation patterns of the summit area. Our findings provide new insights into Strombolian eruptive mechanisms and new perspectives to improve the monitoring of Stromboli and other open conduit volcanoes. Full article
Show Figures

Graphical abstract

15 pages, 2170 KiB  
Technical Note
Parsimonious Gap-Filling Models for Sub-Daily Actual Evapotranspiration Observations from Eddy-Covariance Systems
by Danlu Guo, Arash Parehkar, Dongryeol Ryu, Quan J. Wang and Andrew W. Western
Remote Sens. 2022, 14(5), 1286; https://doi.org/10.3390/rs14051286 - 05 Mar 2022
Viewed by 2293
Abstract
Missing data and low data quality are common issues in field observations of actual evapotranspiration (ETa) from eddy-covariance systems, which necessitates the need for gap-filling techniques to improve data quality and utility for further analyses. A number of models have been [...] Read more.
Missing data and low data quality are common issues in field observations of actual evapotranspiration (ETa) from eddy-covariance systems, which necessitates the need for gap-filling techniques to improve data quality and utility for further analyses. A number of models have been proposed to fill temporal gaps in ETa or latent heat flux observations. However, existing gap-filling approaches often use multi-variate models that rely on relationships between ETa and other meteorological and flux variables, highlighting a critical lack of parsimonious gap-filling models. This study aims to develop and evaluate parsimonious approaches to fill gaps in ETa observations. We adapted three gap-filling models previously used for other meteorological variables but never applied to infill sub-daily ETa or flux observations from eddy-covariance systems before. All three models are solely based on the observed diurnal patterns in the ETa data, which infill gaps in sub-daily data with sinusoidal functions (Sinusoidal), smoothing functions (Smoothing) and pattern matching (MaxCor) approaches, respectively. We presented a systematic approach for model evaluation, considering multiple patterns of data gaps during different times of the day. The three gap-filling models were evaluated together with another benchmarking gap-filling model, mean diurnal variation (MDV) that has been commonly used and has similar data requirement. We used a case study with field measurements from an EC system over summer 2020–2021, at a maize field in southeastern Australia. We identified the MaxCor model as the best gap-filling model, which informs the diurnal pattern of the day to infill by using another day with similar temporal patterns and complete data. Following the MaxCor model, the MDV and the Sinusoidal models show comparable performances. We further discussed the infilling models in terms of their dependence on data availability and their suitability for different practical situations. The MaxCor model relies on high data availability for both days with complete data and the available records within each day to infill. The Sinusoidal model does not rely on any day with complete data, which makes it the ideal choice in situations where days with complete records are limited. Full article
(This article belongs to the Special Issue Accuracy and Quality Control of Remote Sensing Data)
Show Figures

Figure 1

17 pages, 3676 KiB  
Article
Satellite-Based Diagnosis and Numerical Verification of Ozone Formation Regimes over Nine Megacities in East Asia
by Hyo-Jung Lee, Lim-Seok Chang, Daniel A. Jaffe, Juseon Bak, Xiong Liu, Gonzalo González Abad, Hyun-Young Jo, Yu-Jin Jo, Jae-Bum Lee, Geum-Hee Yang, Jong-Min Kim and Cheol-Hee Kim
Remote Sens. 2022, 14(5), 1285; https://doi.org/10.3390/rs14051285 - 05 Mar 2022
Cited by 13 | Viewed by 4289
Abstract
Urban photochemical ozone (O3) formation regimes (NOx- and VOC-limited regimes) at nine megacities in East Asia were diagnosed based on near-surface O3 columns from 900 to 700 hPa, nitrogen dioxide (NO2), and formaldehyde (HCHO), which were [...] Read more.
Urban photochemical ozone (O3) formation regimes (NOx- and VOC-limited regimes) at nine megacities in East Asia were diagnosed based on near-surface O3 columns from 900 to 700 hPa, nitrogen dioxide (NO2), and formaldehyde (HCHO), which were inferred from measurements by ozone-monitoring instruments (OMI) for 2014–2018. The nine megacities included Beijing, Tianjin, Hebei, Shandong, Shanghai, Seoul, Busan, Tokyo, and Osaka. The space-borne HCHO–to–NO2 ratio (FNR) inferred from the OMI was applied to nine megacities and verified by a series of sensitivity tests of Weather Research and Forecasting model with Chemistry (WRF-Chem) simulations by halving the NOx and VOC emissions. The results showed that the satellite-based FNRs ranged from 1.20 to 2.62 and the regimes over the nine megacities were identified as almost NOx-saturated conditions, while the domain-averaged FNR in East Asia was >2. The results of WRF–Chem sensitivity modeling show that O3 increased when the NOx emissions reduced, whereas VOC emission reduction showed a significant decrease in O3, confirming the characteristics of VOC-limited conditions in all of the nine megacities. When both NOx and VOC emissions were reduced, O3 decreased in most cities, but increased in the three lowest-FNRs megacities, such as Shanghai, Seoul, and Tokyo, where weakened O3 titration caused by NOx reduction had a larger enough effect to offset O3 suppression induced by the decrease in VOCs. Our model results, therefore, indicated that the immediate VOC emission reduction is a key controlling factor to decrease megacity O3 in East Asia, and also suggested that both VOC and NOx reductions may not be of broad utility in O3 abatement in megacities and should be considered judiciously in highly NOx-saturated cities in East Asia. Full article
Show Figures

Figure 1

15 pages, 12538 KiB  
Technical Note
Identification of the Potential Critical Slip Surface for Fractured Rock Slope Using the Floyd Algorithm
by Shengyuan Song, Mingyu Zhao, Chun Zhu, Fengyan Wang, Chen Cao, Haojie Li and Muye Ma
Remote Sens. 2022, 14(5), 1284; https://doi.org/10.3390/rs14051284 - 05 Mar 2022
Cited by 13 | Viewed by 1913
Abstract
A rock slope can be characterized by tens of persistent discontinuities. A slope can be massive. The slip surface of the slope is usually easier to expand along with the discontinuities because the shear strength of the discontinuities is substantially lower than that [...] Read more.
A rock slope can be characterized by tens of persistent discontinuities. A slope can be massive. The slip surface of the slope is usually easier to expand along with the discontinuities because the shear strength of the discontinuities is substantially lower than that of the rock blocks. Based on this idea, this paper takes a jointed rock slope in Hengqin Island, Zhuhai as an example, and establishes a three-dimensional (3D) model of the studied slope by digital close-range photogrammetry to rapidly interpret 222 fracture parameters. Meanwhile, a new Floyd algorithm for finding the shortest path is developed to realize the critical slip surface identification of the studied slope. Within the 3D fracture network model created using the Monte Carlo method, a sequence of cross-sections is placed. These cross-sections containing fractures are used to search for the shortest paths between the designated shear entrances and exits. For anyone combination of entry point and exit point, the shortest paths corresponding to different cross-sections are different and cluttered. For the sake of safety and convenience, these shortest paths are simplified as a circular arc that is regarded as a potential slip surface. The fracture frequency is used to determine the probability of sliding along a prospective critical slip surface. The potential slip surface through the entrance point (0, 80) and exit point (120, 0) is identified as the final critical slip surface of the slope due to the maximum fracture frequency. Full article
Show Figures

Figure 1

25 pages, 7755 KiB  
Article
The Extensive Parameters as a Tool to Monitoring the Volcanic Activity: The Case Study of Vulcano Island (Italy)
by Salvatore Inguaggiato, Fabio Vita, Iole Serena Diliberto, Agnes Mazot, Lorenzo Calderone, Andrea Mastrolia and Marco Corrao
Remote Sens. 2022, 14(5), 1283; https://doi.org/10.3390/rs14051283 - 05 Mar 2022
Cited by 23 | Viewed by 3483
Abstract
On Vulcano Island (Italy), many geochemical crises have occurred during the last 130 years of solfataric activity. The main crises occurred in 1978–1980, 1988–1991, 1996, 2004–2007, 2009–2010 and the ongoing 2021 anomalous degassing activity. These crises have been characterized by early signals of [...] Read more.
On Vulcano Island (Italy), many geochemical crises have occurred during the last 130 years of solfataric activity. The main crises occurred in 1978–1980, 1988–1991, 1996, 2004–2007, 2009–2010 and the ongoing 2021 anomalous degassing activity. These crises have been characterized by early signals of resuming degassing activity, measurable by the increase of volatiles and energy output emitted from the summit areas of the active cone, and particularly by increases of gas/water ratios in the fumarolic area at the summit. In any case, a direct rather than linear correspondence has been observed among the observed increase in the fluid output, seismic release and ground deformation, and is still a subject of study. We present here the results obtained by the long-term monitoring (over 13 years of observations) of three extensive parameters: the SO2 flux monitored in the volcanic plume, the soil CO2 flux and the local heat flux, monitored in the mild thermal anomaly located to the east of the high-temperature fumarole. The time variations of these parameters showed cyclicity in the volcanic degassing and a general increase in the trend in the last period. In particular, we focused on the changes in the mass and energy output registered in the period of June–December 2021, to offer in near-real-time the first evaluation of the level and duration of the actual exhalative crisis affecting Vulcano Island. In this last event, a clear change in degassing style was recorded for the volatiles emitted by the magma. For example, the flux of diffused CO2 from the soils reached the maximum never-before-recorded value of 34,000 g m−2 d−1 and the flux of SO2 of the plume emitted by the fumarolic field on the summit crater area reached values higher than 200 t d−1. The interpretation of the behavior of this volcanic system, resulting from the detailed analyses of these continuous monitoring data, will complete the framework of observations and help in defining and possibly forecasting the next evolution of the actual exhaling crisis. Full article
Show Figures

Figure 1

19 pages, 1641 KiB  
Article
Using Multi-Source Nighttime Lights Data to Proxy for County-Level Economic Activity in China from 2012 to 2019
by Xiaoxuan Zhang and John Gibson
Remote Sens. 2022, 14(5), 1282; https://doi.org/10.3390/rs14051282 - 05 Mar 2022
Cited by 17 | Viewed by 3008
Abstract
The use of nighttime lights (NTL) data to proxy for local economic activity is well established in remote sensing and other disciplines. Validation studies comparing NTL data with traditional economic indicators, such as Gross Domestic Product (GDP), underpin this usage in applied studies. [...] Read more.
The use of nighttime lights (NTL) data to proxy for local economic activity is well established in remote sensing and other disciplines. Validation studies comparing NTL data with traditional economic indicators, such as Gross Domestic Product (GDP), underpin this usage in applied studies. Yet the most widely cited validation studies do not use the latest NTL data products, may not distinguish between time-series and cross-sectional uses of NTL data, and usually are for aggregated units, such as nation-states or the first sub-national level, yet applied studies increasingly focus on smaller and lower-level spatial units. To provide more updated and disaggregated validation results, this study examines relationships between GDP and NTL data for 2657 county-level units in China, observed each year from 2012 to 2019. The NTL data used were from three sources: the Defense Meteorological Satellite Program (DMSP), whose time series was recently extended to 2019; and two sets of Visible Infrared Imaging Radiometer Suite (VIIRS) data products. The first set of VIIRS products is the recently released version 2 (V.2 VNL) annual composites, and the second is the NASA Black Marble annual composites. Contrasts were made between cross-sectional predictions for GDP differences between areas and time-series predictions of economic activity changes over time, and also considered different levels of spatial aggregation. Full article
(This article belongs to the Special Issue Applications of AI and Remote Sensing in Urban Systems)
Show Figures

Figure 1

27 pages, 9439 KiB  
Article
Geostatistical Resampling of LiDAR-Derived DEM in Wide Resolution Range for Modelling in SWAT: A Case Study of Zgłowiączka River (Poland)
by Damian Śliwiński, Anita Konieczna and Kamil Roman
Remote Sens. 2022, 14(5), 1281; https://doi.org/10.3390/rs14051281 - 05 Mar 2022
Cited by 13 | Viewed by 2092
Abstract
A digital elevation model (DEM) is an essential element of input data in the model research of watersheds. Recently, progress in measurement techniques has led to the availability of such data with high spatial resolution. Therefore, simplification of DEMs to shorten the time [...] Read more.
A digital elevation model (DEM) is an essential element of input data in the model research of watersheds. Recently, progress in measurement techniques has led to the availability of such data with high spatial resolution. Therefore, simplification of DEMs to shorten the time of their processing is a significant, but insufficiently investigated issue. This study, gradually and with various methods, carried out a great simplification of a detailed LiDAR-derived DEM. Then, the impact of that treatment on the precision of the selected elements for modeling a watershed was assessed. The simplification comprised a reduction in resolution, with the use of statistical resampling methods, namely giving an average, modal, median, minimum, maximum, or the closest value to the pixels. This process was carried out in a wide range of pixel sizes, increasing by 50% each time (from 1 m to 1.5, 2.3, 3.4, 5.1, 7.6, 11, 17, 26, 38, 58, and 86 m, respectively). The precision of the obtained DEMs and the precision of the delineation of boundaries of the watershed and watercourses were assessed. With the systematic reduction in the resolution of a DEM, its precision systematically decreased. The changes in the precision of determining the watercourses and boundaries of a watershed were irregular, ranging from being very small, to mild, to significant. A method of giving the minimum value, that was simple with regard to computing, was singled out. In the determination of both the watercourses and the boundaries of a watershed, this method produced one of the best results for the higher resolution and for the lower resolution—considerably better than the other methods tested. The research was conducted on a flat agricultural catchment, and it can be assumed that the obtained conclusions can be considered for similar cases. For catchments with different characteristics, further research is advisable. Full article
(This article belongs to the Special Issue Geostatistics and Spatial Data Mining for Ecological Climatology)
Show Figures

Figure 1

12 pages, 4377 KiB  
Article
Ground-Penetrating Radar and Photogrammetric Investigation on Prehistoric Tumuli at Parabita (Lecce, Italy) Performed with an Unconventional Use of the Position Markers
by Raffaele Persico, Emanuele Colica, Tiziana Zappatore, Claudio Giardino and Sebastiano D’Amico
Remote Sens. 2022, 14(5), 1280; https://doi.org/10.3390/rs14051280 - 05 Mar 2022
Cited by 6 | Viewed by 1826
Abstract
In this contribution, we propose ground-penetrating radar (GPR) investigation performed close and on some prehistoric tumuli, locally called “piccole specchie”, in the countryside around the town of Parabita (Lecce), within the Salento peninsula (southern Italy). In order to perform the GPR [...] Read more.
In this contribution, we propose ground-penetrating radar (GPR) investigation performed close and on some prehistoric tumuli, locally called “piccole specchie”, in the countryside around the town of Parabita (Lecce), within the Salento peninsula (southern Italy). In order to perform the GPR investigation on the tumuli, an unconventional method of data acquisition was exploited, involving, consequently, some non-conventional data processing steps. Photogrammetric survey was also performed, and 3D digital models of the prehistoric tumuli were created. The investigations have revealed some anomalies under two out of three investigated tumuli, which were interpreted as prehistoric tombs. Full article
(This article belongs to the Special Issue Sensors & Methods in Cultural Heritage)
Show Figures

Figure 1

34 pages, 13530 KiB  
Article
Effects of Land Use/Cover on Regional Habitat Quality under Different Geomorphic Types Based on InVEST Model
by Baixue Wang and Weiming Cheng
Remote Sens. 2022, 14(5), 1279; https://doi.org/10.3390/rs14051279 - 05 Mar 2022
Cited by 43 | Viewed by 3934
Abstract
Research on habitat quality change is of great significance for regional ecological security. Analysis of spatiotemporal change of habitat quality based on different geomorphic types can restore the background of ecological environment in historical periods and provide scientific support for revealing the evolution [...] Read more.
Research on habitat quality change is of great significance for regional ecological security. Analysis of spatiotemporal change of habitat quality based on different geomorphic types can restore the background of ecological environment in historical periods and provide scientific support for revealing the evolution law of regional ecological environment quality and ecological restoration. This study aimed to identify the change in habitat quality under different geomorphic types from 1995 to 2018. Based on DEM data, geomorphic types of different scales were divided. The InVEST habitat quality model was used to analyze the spatiotemporal change in habitat quality in individual land use types in the Altay region. The spatiotemporal changes and main influencing factors of habitat quality under the background of different geomorphic types were explored. Remote sensing data was used to analyze the land use/cover changes. Sixteen threat sources, their maximum distance of impact, mode of decay, and sensitivity to threats were also estimated for each land use type. The results showed that habitat quality decreased significantly in 2015, which was related to the rapid expansion of cultivated and construction land as threat sources, as well as the decrease of forestland and grassland as sensitive factors. However, habitat quality improved significantly in 2018, because of the implementation of ecological restoration policy in 2015. Affected by elevation and topographic relief, the geomorphic type with the best habitat quality index was the large undulating middle mountain (0.927) and the worst was the medium altitude platform (0.351). Woodland contributed the most to habitat quality in large undulating middle mountain (35.07), and bare rock gravel land contributed the most to medium altitude platform (127.68). Habitat quality of different geomorphic types showed obvious spatial aggregation, and from high altitude to low altitude showed a banded ladder-like distribution. Changes in habitat quality during the past three decades suggested that the conservation and restoration strategies applied in regional ecosystem were effective. On the basis of the analysis results, four types of zoning management schemes were divided, and the ecological management and conservation measures were put forward. Therefore, this study can help decision makers, especially regarding the lack of data on biodiversity. Full article
(This article belongs to the Special Issue Remote Sensing and GIS for Geomorphological Mapping)
Show Figures

Figure 1

21 pages, 4126 KiB  
Article
A Cost-Effective Method for Reconstructing City-Building 3D Models from Sparse Lidar Point Clouds
by Marek Kulawiak
Remote Sens. 2022, 14(5), 1278; https://doi.org/10.3390/rs14051278 - 05 Mar 2022
Cited by 8 | Viewed by 2597
Abstract
The recent popularization of airborne lidar scanners has provided a steady source of point cloud datasets containing the altitudes of bare earth surface and vegetation features as well as man-made structures. In contrast to terrestrial lidar, which produces dense point clouds of small [...] Read more.
The recent popularization of airborne lidar scanners has provided a steady source of point cloud datasets containing the altitudes of bare earth surface and vegetation features as well as man-made structures. In contrast to terrestrial lidar, which produces dense point clouds of small areas, airborne laser sensors usually deliver sparse datasets that cover large municipalities. The latter are very useful in constructing digital representations of cities; however, reconstructing 3D building shapes from a sparse point cloud is a time-consuming process because automatic shape reconstruction methods work best with dense point clouds and usually cannot be applied for this purpose. Moreover, existing methods dedicated to reconstructing simplified 3D buildings from sparse point clouds are optimized for detecting simple building shapes, and they exhibit problems when dealing with more complex structures such as towers, spires, and large ornamental features, which are commonly found e.g., in buildings from the renaissance era. In the above context, this paper proposes a novel method of reconstructing 3D building shapes from sparse point clouds. The proposed algorithm has been optimized to work with incomplete point cloud data in order to provide a cost-effective way of generating representative 3D city models. The algorithm has been tested on lidar point clouds representing buildings in the city of Gdansk, Poland. Full article
Show Figures

Figure 1

23 pages, 3776 KiB  
Article
Challenges with Regard to Unmanned Aerial Systems (UASs) Measurement of River Surface Velocity Using Doppler Radar
by Filippo Bandini, Monica Coppo Frías, Jun Liu, Kasparas Simkus, Sofia Karagkiolidou and Peter Bauer-Gottwein
Remote Sens. 2022, 14(5), 1277; https://doi.org/10.3390/rs14051277 - 05 Mar 2022
Cited by 6 | Viewed by 2029
Abstract
Surface velocity is traditionally measured with in situ techniques such as velocity probes (in shallow rivers) or Acoustic Doppler Current Profilers (in deeper water). In the last years, researchers have developed remote sensing techniques, both optical (e.g., image-based velocimetry techniques) and microwave (e.g., [...] Read more.
Surface velocity is traditionally measured with in situ techniques such as velocity probes (in shallow rivers) or Acoustic Doppler Current Profilers (in deeper water). In the last years, researchers have developed remote sensing techniques, both optical (e.g., image-based velocimetry techniques) and microwave (e.g., Doppler radar). These techniques can be deployed from Unmanned Aerial Systems (UAS), which ensure fast and low-cost surveys also in remotely-accessible locations. We compare the results obtained with a UAS-borne Doppler radar and UAS-borne Particle Image Velocimetry (PIV) in different rivers, which presented different hydraulic–morphological conditions (width, slope, surface roughness and sediment material). The Doppler radar was a commercial 24 GHz instrument, developed for static deployment, adapted for UAS integration. PIV was applied with natural seeding (e.g., foam, debris) when possible, or with artificial seeding (woodchips) in the stream where the density of natural particles was insufficient. PIV reconstructed the velocity profile with high accuracy typically in the order of a few cm s−1 and a coefficient of determination (R2) typically larger than 0.7 (in half of the cases larger than 0.85), when compared with acoustic Doppler current profiler (ADCP) or velocity probe, in all investigated rivers. However, UAS-borne Doppler radar measurements show low reliability because of UAS vibrations, large instrument sampling footprint, large required sampling time and difficult-to-interpret quality indicators suggesting that additional research is needed to measure surface velocity from UAS-borne Doppler radar. Full article
(This article belongs to the Special Issue Remote Sensing of Fluvial Systems)
Show Figures

Figure 1

23 pages, 28591 KiB  
Article
Blind Remote Sensing Image Deblurring Using Local Binary Pattern Prior
by Ziyu Zhang, Liangliang Zheng, Yongjie Piao, Shuping Tao, Wei Xu, Tan Gao and Xiaobin Wu
Remote Sens. 2022, 14(5), 1276; https://doi.org/10.3390/rs14051276 - 05 Mar 2022
Cited by 13 | Viewed by 2976
Abstract
In this paper, an algorithm based on local binary pattern (LBP) is proposed to obtain clear remote sensing images under the premise of unknown causes of blurring. We find that LBP can completely record the texture features of the images, which will not [...] Read more.
In this paper, an algorithm based on local binary pattern (LBP) is proposed to obtain clear remote sensing images under the premise of unknown causes of blurring. We find that LBP can completely record the texture features of the images, which will not change widely due to the generation of blur. Therefore, LBP prior is proposed, which can filter out the pixels containing important textures in the blurry image through the mapping relationship. The corresponding processing methods are adopted for different types of pixels to cope with the challenges brought by the rich texture and details of remote sensing images and prevent over-sharpening. However, the existence of LBP prior increases the difficulty of solving the model. To solve the model, we construct the projected alternating minimization (PAM) algorithm that involves the construction of the mapping matrix, the fast iterative shrinkage-thresholding algorithm (FISTA) and the half-quadratic splitting method. Experiments with the AID dataset show that the proposed method can achieve highly competitive processing results for remote sensing images. Full article
(This article belongs to the Section Remote Sensing Image Processing)
Show Figures

Figure 1

17 pages, 5629 KiB  
Article
An Object-Based Genetic Programming Approach for Cropland Field Extraction
by Caiyun Wen, Miao Lu, Ying Bi, Shengnan Zhang, Bing Xue, Mengjie Zhang, Qingbo Zhou and Wenbin Wu
Remote Sens. 2022, 14(5), 1275; https://doi.org/10.3390/rs14051275 - 05 Mar 2022
Cited by 13 | Viewed by 2786
Abstract
Cropland fields are the basic spatial units for agricultural management, and information about their distribution is critical for analyzing agricultural investments and management. However, the extraction of cropland fields of smallholder farms is a challenging task because of their irregular shapes and diverse [...] Read more.
Cropland fields are the basic spatial units for agricultural management, and information about their distribution is critical for analyzing agricultural investments and management. However, the extraction of cropland fields of smallholder farms is a challenging task because of their irregular shapes and diverse spectrum. In this paper, we proposed a new object-based Genetic Programming (GP) approach to extract cropland fields. The proposed approach used the multiresolution segmentation (MRS) method to acquire objects from a very high resolution (VHR) image, and extracted spectral, shape and texture features as inputs for GP. Then GP was used to automatically evolve the optimal classifier to extract cropland fields. The results show that the proposed approach has obtained high accuracy in two areas with different landscape complexities. Further analysis show that the GP approach significantly outperforms five commonly used classifiers, including K-Nearest Neighbor (KNN), Decision Tree (DT), Naïve Bayes (NB), Support Vector Machine (SVM), and Random Forest (RF). By using different numbers of training samples, GP can maintain high accuracy with any volume of samples compared to other classifiers. Full article
(This article belongs to the Special Issue Progresses in Agro-Geoinformatics)
Show Figures

Figure 1

19 pages, 4597 KiB  
Article
Development of a Phenology-Based Method for Identifying Sugarcane Plantation Areas in China Using High-Resolution Satellite Datasets
by Yi Zheng, Zhuoting Li, Baihong Pan, Shangrong Lin, Jie Dong, Xiangqian Li and Wenping Yuan
Remote Sens. 2022, 14(5), 1274; https://doi.org/10.3390/rs14051274 - 05 Mar 2022
Cited by 14 | Viewed by 3439
Abstract
Sugarcane is an important sugar and biofuel crop with high socio-economic importance, and its planted area has increased rapidly in recent years. China is the world’s third or fourth sugarcane producer. However, to our knowledge, no study has investigated the mapping of sugarcane [...] Read more.
Sugarcane is an important sugar and biofuel crop with high socio-economic importance, and its planted area has increased rapidly in recent years. China is the world’s third or fourth sugarcane producer. However, to our knowledge, no study has investigated the mapping of sugarcane cultivation areas across entire China. In this study, we developed a phenology-based method to identify sugarcane plantations in China at 30-m spatial resolution from 2016–2020 using the time-series of Landsat and Sentinel-1/2 images derived from Google Earth Engine (GEE) platform. The method worked by comparing the phenological similarity in normalized difference vegetation index (NDVI) series between unknown pixels and sugarcane samples. The phenological similarity was assessed using the time-weighted dynamic time warping method (TWDTW), which has less sensitivity to training samples than machine learning methods and therefore can be easily applied to large areas with limited samples. More importantly, our method introduced multiple and moving time standard phenological curves of sugarcane to the TWDTW by fully considering the variable crop life-cycle of sugarcane, particularly its long harvest season spanning from December to March of the following year. Validations showed the method performed well in 2019, with overall accuracies of 93.47% and 92.74% for surface reflectance (SR) and top of atmosphere reflectance (TOA) data, respectively. The sugarcane maps agreed well with the agricultural statistical areas from 2016–2020. The mapping accuracies using TOA data were comparable to SR data in 2019–2020, but outperformed SR data in 2016–2018 when SR data had lower availability on GEE. The sugarcane maps produced in this study can be used to monitor growing conditions and production of sugarcane and, therefore, can benefit sugarcane management, sustainable sugarcane production, and national food security. Full article
Show Figures

Figure 1

14 pages, 2171 KiB  
Article
Spatial Difference between Temperature and Snowfall Driven Spring Phenology of Alpine Grassland Land Surface Based on Process-Based Modeling on the Qinghai–Tibet Plateau
by Shuai An, Xiaoyang Zhang and Shilong Ren
Remote Sens. 2022, 14(5), 1273; https://doi.org/10.3390/rs14051273 - 05 Mar 2022
Cited by 2 | Viewed by 1582
Abstract
As a sensitive indicator for climate change, the spring phenology of alpine grassland on the Qinghai–Tibet Plateau (QTP) has received extensive concern over past decade. It has been demonstrated that temperature and precipitation/snowfall play an important role in driving the green-up in alpine [...] Read more.
As a sensitive indicator for climate change, the spring phenology of alpine grassland on the Qinghai–Tibet Plateau (QTP) has received extensive concern over past decade. It has been demonstrated that temperature and precipitation/snowfall play an important role in driving the green-up in alpine grassland. However, the spatial differences in the temperature and snowfall driven mechanism of alpine grassland green-up onset are still not clear. This manuscript establishes a set of process-based models to investigate the climate variables driving spring phenology and their spatial differences. Specifically, using 500 m three-day composite MODIS NDVI datasets from 2000 to 2015, we first estimated the land surface green-up onset (LSGO) of alpine grassland in the QTP. Further, combining with daily air temperature and precipitation datasets from 2000 to 2015, we built up process-based models for LSGO in 86 meteorological stations in the QTP. The optimum models of the stations separating climate drivers spatially suggest that LSGO in grassland is: (1) controlled by temperature in the north, west and south of the QTP, where the precipitation during late winter and spring is less than 20 mm; (2) driven by the combination of temperature and precipitation in the middle, east and southwest regions with higher precipitation and (3) more likely controlled by both temperature and precipitation in snowfall dominant regions, since the snow-melting process has negative effects on the air temperature. The result dictates that snowfall and rainfall should be concerned separately in the improvement of the spring phenology model of the alpine grassland ecosystem. Full article
Show Figures

Graphical abstract

19 pages, 5357 KiB  
Article
Deep-Learning-Based Multispectral Image Reconstruction from Single Natural Color RGB Image—Enhancing UAV-Based Phenotyping
by Jiangsan Zhao, Ajay Kumar, Balaji Naik Banoth, Balram Marathi, Pachamuthu Rajalakshmi, Boris Rewald, Seishi Ninomiya and Wei Guo
Remote Sens. 2022, 14(5), 1272; https://doi.org/10.3390/rs14051272 - 05 Mar 2022
Cited by 13 | Viewed by 5067
Abstract
Multispectral images (MSIs) are valuable for precision agriculture due to the extra spectral information acquired compared to natural color RGB (ncRGB) images. In this paper, we thus aim to generate high spatial MSIs through a robust, deep-learning-based reconstruction method using ncRGB images. Using [...] Read more.
Multispectral images (MSIs) are valuable for precision agriculture due to the extra spectral information acquired compared to natural color RGB (ncRGB) images. In this paper, we thus aim to generate high spatial MSIs through a robust, deep-learning-based reconstruction method using ncRGB images. Using the data from the agronomic research trial for maize and breeding research trial for rice, we first reproduced ncRGB images from MSIs through a rendering model, Model-True to natural color image (Model-TN), which was built using a benchmark hyperspectral image dataset. Subsequently, an MSI reconstruction model, Model-Natural color to Multispectral image (Model-NM), was trained based on prepared ncRGB (ncRGB-Con) images and MSI pairs, ensuring the model can use widely available ncRGB images as input. The integrated loss function of mean relative absolute error (MRAEloss) and spectral information divergence (SIDloss) were most effective during the building of both models, while models using the MRAEloss function were more robust towards variability between growing seasons and species. The reliability of the reconstructed MSIs was demonstrated by high coefficients of determination compared to ground truth values, using the Normalized Difference Vegetation Index (NDVI) as an example. The advantages of using “reconstructed” NDVI over Triangular Greenness Index (TGI), as calculated directly from RGB images, were illustrated by their higher capabilities in differentiating three levels of irrigation treatments on maize plants. This study emphasizes that the performance of MSI reconstruction models could benefit from an optimized loss function and the intermediate step of ncRGB image preparation. The ability of the developed models to reconstruct high-quality MSIs from low-cost ncRGB images will, in particular, promote the application for plant phenotyping in precision agriculture. Full article
(This article belongs to the Special Issue UAVs in Sustainable Agriculture)
Show Figures

Figure 1

12 pages, 1806 KiB  
Article
Ultra-Wideband Imaging via Frequency Diverse Array with Low Sampling Rate
by Zhonghan Wang, Yaoliang Song and Yitong Li
Remote Sens. 2022, 14(5), 1271; https://doi.org/10.3390/rs14051271 - 05 Mar 2022
Cited by 4 | Viewed by 1512
Abstract
Imaging systems based on millimeter waves (mm-waves) are advancing to achieve higher resolution and wider bandwidth. However, a large bandwidth requires high sample rates, which may limit the development of ultra-wideband imaging systems. In this letter, we introduce the concept of frequency diverse [...] Read more.
Imaging systems based on millimeter waves (mm-waves) are advancing to achieve higher resolution and wider bandwidth. However, a large bandwidth requires high sample rates, which may limit the development of ultra-wideband imaging systems. In this letter, we introduce the concept of frequency diverse array (FDA) into mm-wave imaging systems. In particular, we propose an ultra-wideband imaging method based on the FDA configuration to reduce sampling rates. In the proposed method, the required sampling rate of an imaging system with N transmit elements is only one-Nth of the conventional systems. Hence, the proposed method can significantly reduce the sampling rate. Unlike compressed-sensing-based sampling methods, the proposed method does not require repeated observations, and is easier to implement. Thanks to the FDA concept, the proposed method can scan the space without phase-shifters or rotation of antennas. We perform matched filtering process in the frequency domain to obtain frequency-delay-dependent vectors. By discretizing the scene, we establish a dictionary covering the imaging scene. Accordingly, a convex optimization problem with measured results and the dictionary based on sparse reconstruction are formulated to realize super-resolution imaging. Compared to conventional methods, the proposed method can distinguish smaller target intervals with low sampling rate in an easy-to-implement way. The proposed method provides a different perspective for the development of ultra-wideband imaging systems. Full article
(This article belongs to the Section Remote Sensing Communications)
Show Figures

Figure 1

40 pages, 120842 KiB  
Article
Granularity of Digital Elevation Model and Optimal Level of Detail in Small-Scale Cartographic Relief Presentation
by Timofey Samsonov
Remote Sens. 2022, 14(5), 1270; https://doi.org/10.3390/rs14051270 - 05 Mar 2022
Cited by 1 | Viewed by 2371
Abstract
One of the key applications of digital elevation models (DEMs) is cartographic relief presentation. DEMs are widely used in mapping, most commonly in the form of contours, hypsometric tints, and hill shading. Recent advancements in the coverage, quality, and resolution of global DEMs [...] Read more.
One of the key applications of digital elevation models (DEMs) is cartographic relief presentation. DEMs are widely used in mapping, most commonly in the form of contours, hypsometric tints, and hill shading. Recent advancements in the coverage, quality, and resolution of global DEMs facilitate the overall improvement of the detail and reliability of terrain-related research. At the same time, geographic problem solving is conducted in a wide variety of scales, and the data used for mapping should have the corresponding level of detail. Specifically, at small scales, intensive generalization is needed, which is also true for elevation data. With the widespread accessibility of detailed DEMs, this principle is often violated, and the data are used for mapping at scales far smaller than what is appropriate. Small-scale relief shading obtained from fine-resolution DEMs is excessively detailed and brings an unclear representation of the Earth’s surface instead of emphasizing what is important at the scale of visualization. Existing coarse-resolution global DEMs do not resolve the issue, since they accumulate the maximum possible information in every pixel, and therefore also require reduction in detail to obtain a high-quality cartographic image. It is clear that guidelines and effective principles for DEM generalization at small scales are needed. Numerous algorithms have been developed for the generalization of elevation data represented either in gridded, contoured, or pointwise form. However, the answer to the most important question—When should we stop surface simplification?—remains unclear. Primitive error-based measures such as vertical distance are not effective for cartography, since they do not account for the landform structure of the surface perceived by the map reader. The current paper approached the problem by elaborating the granularity—a newly developed property of DEMs, which characterizes the typical size of a landform represented on the DEM surface. A methodology of estimating the granularity through a landform width measure was conceptualized and implemented as software. Using the developed program tools, the optimal granularity was statistically learned from DEMs reconstructed for multiple fragments of manually drawn 1:200,000, 1:500,000, and 1:1,000,000 topographic maps covering different relief types. It was shown that the relative granularity should be 5–6 mm at the mapping scale to achieve the clearness of relief presentation typical for manually drawn maps. We then demonstrate how the granularity measure can be used effectively as a constraint during DEM generalization. Experimental results on a combination of contours, hypsometric tints, and hill shading indicated clearly that the optimal level of detail in small-scale cartographic relief presentation can be achieved by DEM generalization constrained by granularity in combination with fine DEM resolution, which facilitates high-quality rendering. Full article
(This article belongs to the Special Issue Perspectives on Digital Elevation Model Applications)
Show Figures

Figure 1

Previous Issue
Next Issue
Back to TopTop