Article

A Detection Method for Collapsed Buildings Combining Post-Earthquake High-Resolution Optical and Synthetic Aperture Radar Images

1
School of Electronics and Information Engineering, Nanjing University of Information Science and Technology, Nanjing 210044, China
2
School of Remote Sensing and Geomatics Engineering, Nanjing University of Information Science and Technology, Nanjing 210044, China
3
Laboratory for Regional Oceanography and Numerical Modeling, Qingdao National Laboratory for Marine Science and Technology, Qingdao 266237, China
4
Research and Development Center of Postal Industry Technology, School of Modern Posts, Institute of Modern Posts, Nanjing University of Posts and Telecommunications, Nanjing 210003, China
5
National Laboratory of Solid State Microstructures, Nanjing University, Nanjing 210093, China
*
Author to whom correspondence should be addressed.
Remote Sens. 2022, 14(5), 1100; https://doi.org/10.3390/rs14051100
Submission received: 20 December 2021 / Revised: 21 February 2022 / Accepted: 21 February 2022 / Published: 23 February 2022

Abstract

:
The detection of collapsed buildings based on post-earthquake remote sensing images is conducive to eliminating the dependence on pre-earthquake data, which is of great significance to carry out emergency response in time. The difficulties in obtaining or lack of elevation information, as strong evidence to determine whether buildings collapse or not, is the main challenge in the practical application of this method. On the one hand, the introduction of double bounce features in synthetic aperture radar (SAR) images are helpful to judge whether buildings collapse or not. On the other hand, because SAR images are limited by imaging mechanisms, it is necessary to introduce spatial details in optical images as supplements in the detection of collapsed buildings. Therefore, a detection method for collapsed buildings combining post-earthquake high-resolution optical and SAR images was proposed by mining complementary information between traditional visual features and double bounce features from multi-source data. In this method, a strategy of optical and SAR object set extraction based on an inscribed center (OpticalandSAR-ObjectsExtraction) was first put forward to extract a unified optical-SAR object set. Based on this, a quantitative representation of collapse semantic knowledge in double bounce (DoubleBounceCollapseSemantic) was designed to bridge a semantic gap between double bounce and collapse features of buildings. Ultimately, the final detection results were obtained based on the improved active learning support vector machines (SVMs). The multi-group experimental results of post-earthquake multi-source images show that the overall accuracy (OA) and the detection accuracy for collapsed buildings (Pcb) of the proposed method can reach more than 82.39% and 75.47%. Therefore, the proposed method is significantly superior to many advanced methods for comparison.

Graphical Abstract

1. Introduction

Timely and accurate evaluation of earthquake damages to buildings after earthquakes is an important part of disaster surveillance [1]. Compared with traditional field survey methods, the remote sensing technology that adopts a remote imaging mode has many advantages, such as timely acquisition of information and not being limited by field conditions, so it has become the main technical means for extracting earthquake damage information of buildings [2,3].
In recent years, the detection of buildings subjected to earthquake damages based on remote sensing images has mainly focused on the identification of collapsed buildings [4,5]. The reason is that collapsed buildings are usually severely damaged and people are trapped therein, which are primary targets in post-earthquake emergency response and rescue [6]. In complex post-earthquake scenarios, collapsed and non-collapsed buildings are generally significantly different in the height. Therefore, introducing elevation information to traditional high-resolution remote sensing images can provide direct evidence support for judging whether buildings collapse or not. Even so, the acquisition of digital elevation data, such as light detection and ranging (LiDAR), usually requires extracting ground control points, with high computation complexity and time costs. Therefore, it is difficult to meet the timeliness requirements for the detection of collapsed buildings after earthquakes [7,8]. For this reason, it is necessary to design a reliable detection method for collapsed buildings in the event of a lack of elevation data. In accordance with different data sources used, detection methods for collapsed buildings can be classified into three categories as a whole: (1) methods based on pre-earthquake and post-earthquake images; (2) methods based on post-earthquake images; and (3) methods combining elevation data.
(1)
Methods based on pre-earthquake and post-earthquake images: Such methods can be used to evaluate the damage degree of buildings by extracting changes of typical features from pre-earthquake/post-earthquake images [9]. Due to the introduction of pre-earthquake data for reference, other ground objects with features similar to collapsed buildings that have existed before earthquakes generally can be effectively eliminated from detection results by using such methods. In spite of this, normal urban evolution may also produce abundant changes in addition to earthquake impact. Furthermore, the lack of pre-earthquake data after earthquakes is often the bottleneck that restricts the popularization and application of such methods [10,11,12].
(2)
Methods based on post-earthquake images: Such methods eliminate the dependence on pre-earthquake data and have stronger universality compared with methods based on pre-earthquake and post-earthquake images [13]. Collapsed buildings are depicted by extracting manually defined or automatically extracted features such as spectra, texture and space and thus an appropriate classifier is selected for prediction [14]. Even so, the diversity of collapsed buildings and complexity of post-earthquake scenarios lead to more prominent problems of different objects with the same spectra and same object with different spectra, which requires establishing more discriminative classification models. Furthermore, the lack of elevation information, as the direct evidence to determine whether buildings collapse or not, is still the main challenge in practical application of such methods [15].
(3)
Methods combining elevation data: Based on remote sensing images, elevation information provided by elevation data, such as LiDAR and digital elevation model (DEM), is used in such methods as a strong basis for determining whether buildings collapse or not [16,17,18]. Although remote sensing images are strongly complementary with elevation data, it is not a common practice to specially collect and produce elevation data only for the detection of collapsed buildings in practical application. In addition, there is no reliable method for scanning and measuring collapsed buildings at present.
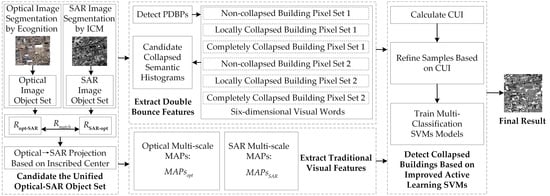
Compared with traditional machine learning, deep learning adopts a deep nonlinear network structure to achieve an approximation of a complex function through hierarchical learning, thus extracting advanced features [19]. In recent years, scholars have carried out research on semantic segmentation of the deep learning technique Mask Region-Based Convolutional Neural Network (Mask RCNN), and obtained a great deal of research findings in remote sensing applications. For example, Li et al. [20] proposed a novel Histogram Thresholding Mask Region-Based Convolutional Neural Network (HTMask R-CNN), which utilized the significant differences between old and new buildings in grayscale histogram to improve the classification ability of the model. Mahmoud et al. [21] proposed an adaptive Mask RCNN framework to detect multi-scale objects in optical remote sensing images. In this method, the standard convolutional neural network in Mask RCNN is replaced by ResNet50 to overcome the vanishing gradient problem. Zhao et al. [22] proposed a method combining Mask RCNN with building boundary regularization, which could produce better regularized polygons. In addition to building detection, many state- of-the-art Mask RCNN semantic segmentations have been proposed for other applications. For example, Bhuiyan et al. [23] developed a high-throughput mapping workflow to automatically detect and classify ice-wedge polygons (IWPs). Witharana et al. [24] gauged the influence of spectral and spatial artifacts on the prediction accuracies of CNN models by using Mask RCNN. Despite this, at present, training is usually carried out using deep learning methods based on training samples in specific areas, so the portability of the model remains unclear. In the meantime, the production and manual annotation of sample sets after earthquakes are very time consuming and laborious, which seriously restricts the application of such methods in the detection of collapsed buildings.
In conclusion, machine learning methods based on post-earthquake images neither rely on pre-earthquake data nor require a large number of training samples, so they have unique advantages in usability and timeliness. In view of the lack of elevation information in such methods, introducing the double bounce features can provide supplementary information. Among different scattering contributions present in high-resolution synthetic aperture radar (SAR) images, the double bounce (which is caused by the corner reflector assembled by the front wall and its adjacent ground) with linear characteristics indicates the presence of a building or other artificial target. However, the double bounce features are influenced by the orientation angle of the buildings and the ground material, as well as the polarization. Adamo Ferro demonstrated that the double bounce effect has a strong power signature for buildings which have a wall on the side closest to the sensor almost parallel to the SAR azimuth direction [25]. In polarized SAR images, the double bounce intensity of cross polarization is usually weaker than that of co-polarization, and the double bounce intensity decreases with the increase of the angle between the orientation of the buildings and the polarized SAR azimuth direction. In the post-earthquake scenario, the collapse of a building results in a reduction of the ‘ground-wall’ dihedral structure. The main difference of the scattering mechanism before and after building collapse is the change from the primary double-bounce scattering mechanism to the primary single-bounce scattering mechanism. This is embodied in the real post-earthquake SAR data in which the double bounce generally appears as a bright line parallel to the wall of a non-collapsed building. In comparison, the double bounce of collapsed buildings is not significant or exhibits disorderly distributed speckle noise [26]. To this end, by taking SAR and optical satellite images after an earthquake in Sendai, Japan in 2011 as examples, different manifestations of the double bounce of collapsed and non-collapsed buildings are displayed in Figure 1. Therefore, double bounce may indirectly reflect the elevation information and improve the accuracy of collapsed building detection.
However, SAR images inevitably have problems, such as lack of spectral information, complex noise, and blur degradation, so it is not reliable to detect collapsed buildings by only relying on SAR images. Meanwhile, the spectral and spatial details contained in high-resolution optical images are favorable for accurate location and profile extraction of buildings. Therefore, based on the combination of post-earthquake high-resolution optical and SAR images, traditional visual features of optical images such as spectra, texture and morphology features can be combined with double bounce features. This can provide a new technical path for accurately and reliably detecting collapsed buildings with a lack of elevation information. In particular, in complex environments such as urban areas, many scattering contributions from small structures with possibly different materials interfere, which are not considered in the currently reported theoretical models.
To achieve the complementary advantages of high-resolution optical and SAR images, it is prioritized to establish a unified object set from multi-source data. However, due to a great difference in imaging mechanisms between optical and SAR images, the same object may have significantly different manifestations in two types of data, so it is difficult to extract profile pairs belonging to the same object from heterologous images. In addition, at present, there are few quantitative representations and analysis methods for collapse semantic knowledge contained in double bounce. Finally, the combination of multi-source data means that the annotation of training samples is more time consuming and laborious. Therefore, a reliable effectiveness measure is needed to fully mine and select representative training samples, so as to improve the detection efficiency and accuracy of collapsed buildings.
In view of the above challenges, a non-deep learning method for collapsed buildings combining post-earthquake high-resolution optical and SAR images was proposed in this research. Firstly, a strategy of optical and SAR object set extraction based on inscribed center (OpticalandSAR-ObjectsExtraction) was designed to provide unified analysis elements for the subsequent feature modeling and detection of collapsed buildings. The inscribed center represents the center of the circle with the largest radius inside the boundary of the object. Based on this, a quantitative representation of collapse semantic knowledge in double bounce (DoubleBounceCollapseSemantic) was constructed according to spatial distribution of double bounce. After that, feature modeling of collapsed buildings was performed based on traditional visual features and double bounce features. Finally, the samples were refined based on a category uncertainty index (CUI) between the samples to be tagged and the tagged samples to optimize the active learning process, thus detecting collapsed buildings.
The novel contributions of the proposed method are shown as follows: (1) The proposed OpticalandSAR-ObjectsExtraction overcame imaging differences between heterologous images and extracted a unified object set from optical and SAR images. (2) The proposed DoubleBounceCollapseSemantic provided a way to quantitatively extract double bounce features from SAR images, which could significantly improve the accuracy of collapsed building detection. (3) The CUI was put forward to improve the training process of active learning support vector machines (SVMs), which was conducive to fully mining and selecting representative training samples.

2. Methodology

The proposed method mainly included four steps: building the unified optical-SAR object set based on OpticalandSAR-ObjectsExtraction; extracting double bounce features based on DoubleBounceCollapseSemantic; extracting traditional visual features based on morphological attribute profiles (MAPs); and detecting collapsed buildings based on improved active learning SVMs. The specific realization process is displayed in Figure 2.

2.1. Construction of the Unified Optical-SAR Object Set Based on OpticalandSAR-ObjectsExtraction

To construct the unified optical-SAR object set, the proposed OpticalandSAR-ObjectsExtraction was mainly divided into three steps, namely image segmentation, establishment of a coarse registration-based affine transformation equation, and projection of inscribed center of an object and region growing.

2.1.1. Image Segmentation

Firstly, two images were segmented, and the inscribed center of the object was taken as a feature point in segmentation results to establish the coarse registration-based affine transformation equation. The optical image was segmented by utilizing the well-known business software Ecognition to obtain the object set R o p t of the optical image [27]. The segmentation was performed using the following parameters: scale parameter, 30; shape, 0.5; compactness, 0.2. Furthermore, an iterated conditional model (ICM) based on Markov is conducive to better highlighting foreground targets including buildings in SAR image segmentation, so this method was used to obtain the object set R S A R of the SAR image [28]. The reason why we adopted this method is that, on one hand, the method is an image segmentation algorithm based on statistics, which is spatially constrained and has fewer model parameters. On the other hand, this method has been successfully applied to SAR images with different polarizations, such as single polarimetry, dual polarimetry and full polarimetry and yields good results.

2.1.2. Establishment of the Coarse Registration-Based Affine Transformation Equation

In R o p t and R S A R , the matched object pairs are searched as a basis for establishing the affine transformation equation. Because of invariance to translation, rotation and scaling of moment invariants, the 7th-order Hu moment invariants are taken as measures for similarity between objects [29]. The specific steps are demonstrated as follows:
Step 1: Based on Equation (1), moment invariants of the i th object in R o p t and j th object in R S A R are calculated and all possible combinations are traversed.
d i j = n = 1 7 ( ϕ i ( n ) ψ j ( n ) ) 2
where, ϕ i ( n ) and ψ j ( n ) represent the n th moment invariant of the i th object in the optical image and n th moment invariant of the j th object in the SAR image, respectively.
Step 2: An object with the smallest moment invariant is selected from R S A R for each object in R o p t to construct a set of matched object pairs R o p t S A R . An object with the minimum moment invariant is selected from R o p t for each object in R S A R to constitute another set of matched object pairs R S A R o p t .
Step 3: The same matched object pairs in R o p t S A R and R S A R o p t are retained as the final set of matched object pairs R m a t c h .
Step 4: Because inscribed circles of each object are bound to exist and locate inside of the objects, the inscribed centers of each object can be calculated in R m a t c h . On this basis, each matched object pair can obtain a pair of matched inscribed centers (feature points), thus obtaining the set of matched feature points P m a t c h required for establishing the affine transformation equation.
Step 5: By combining P m a t c h and Equation (2), the affine transformation equation between optical and SAR images can be established.
{ x = a 0 + a 1 x + a 2 y y = b 0 + b 1 x + b 2 y

2.1.3. Projection of Inscribed Centers of Objects and Region Growing

The objects in the SAR image that match with each object in the optical image are searched. Based on coarse registration results, the inscribed centers of each object in R o p t are directly projected into the SAR image according to the affine transformation equation, thus obtaining a set of project points in the SAR image. Based on region growing of project points, the SAR image is divided into connected regions corresponding to each object in R o p t [30], so as to finally acquire the unified optical-SAR object set R u n i .

2.2. Extraction of Double Bounce Features Based on Double Bounce Collapse Semantic

In view of extraction of collapse semantic features contained in double bounce, this study mainly designed two parts, namely detection of potential double bounce pixels (PDBPs) and construction of a collapse semantic histogram.

2.2.1. Detection of PDBPs

Since double bounce is shown as a highlighted line in the SAR image, this study firstly used Hough transform for line detection [31], in which LOG operators were used for edge detection to obtain a set of initial potential double bounce pixels (IPDBPs). On this basis, for any one pixel e in IPDBPs, pixels belonging to IPDBPs are searched in its eight neighborhoods. If there is only one pixel meeting the condition, the pixel e is regarded as an endpoint. In this case, the pixels belonging to IPDBPs are searched continuously in a 5 × 5 window with e as the center and the overlapped pixels in eight neighborhoods of these pixels and eight neighborhoods of the pixel e are all taken as PDBPs. Traversing all pixels, the final set of PDBPs is extracted from the SAR image.

2.2.2. Construction of the Collapse Semantic Histogram

In the SAR image, a visual vocabulary based on collapse semantics was designed and the collapse semantic histogram was constructed by combining with a spatial relationship between R u n i and PDBPs. When the total number of objects in R u n i is N , for any one object R u n i c ( c = 1 , 2 , 3 , , N ) , the set of visual words and DoubleBounceCollapseSemantic rules are defined as follows:
  • Pixel set 1 of non-collapsed buildings. Double bounce of non-collapsed buildings usually appears as a highlighted line at the corner of a building. Therefore, line segments of double bounce with features of non-collapsed buildings overlap or are adjacent to profiles of the objects, showing a similar curvature and direction and a certain length. The specific search and discrimination steps are shown as follows:
Step 1: The blurred line segment L ˜ that overlaps or is adjacent to the R u n i c profile is firstly searched. From any one pixel g on the profile, PDBPs are searched from eight neighborhoods of g . If there is a PDBP, defined as r , PDBPs in eight neighborhoods of r are searched. The newly searched PDBPs and r are retained and the fitting line L ^ is obtained according to these pixels. On this basis, new PDBPs are searched continuously in the existing newly searched eight neighborhoods of each PDBP. If they exist, the distance from this point to L ^ is calculated. When the distance is smaller than w , this PDBP is retained. In a similar way, all possible pixels are traversed and all retained PDBPs constitute the blurred line segment L ˜ .
Step 2: For the next pixel g on the profile, a blurred line segment corresponding to g can be obtained by repeating Step 1. All points on the profile are traversed to form a candidate blurred line-segment set S 1 . All blurred line segments with the length larger than T a are retained to constitute a blurred line-segment set S 2 .
Step 3: For foot points of two endpoints of any one line segment L S 2 in the set S 2 on the profile of the object, the line segment L S 2 of the profile between foot points is intercepted and the line segment L S 2 which simultaneously meets the following two conditions constitutes a blurred line-segment set S 3 . (1) The difference in average curvatures of L S 2 and L S 2 is calculated and should be smaller than the threshold T b . (2) L S 2 and L S 2 are fitted by straight lines using the ordinary least squares to calculate the slope difference of the two straight lines which should be smaller than the threshold T c . S 3 is the constructed visual word. It should be pointed out that, in order to improve the automation degree of the proposed method, the following adaptive extraction strategy is adopted for T a , T b and T c . Compared with collapsed buildings, double bounce of non-collapsed buildings is usually longer and more complete. Based on this assumption, an objective function F S 3 ( T a , T b , T c ) is constructed, representing the number of pixels extracted from S 3 for an object under different combinations of T a , T b and T c . Let T a , T b and T c be valued in intervals of [0, t], [0, 1] and [0, 1] and t indicate the length of the diagonal of the bounding rectangle for object R u n i c . When F S 3 is the maximum, T a , T b and T c constitute the optimal parameter combination.
  • Pixel set 1 of locally collapsed buildings. In S 1 , blurred line segments with the length smaller than or equal to T a are retained, namely the constructed visual word.
  • Pixel set 1 of completely collapsed buildings. Except for PDBPs which have been defined as visual words, the other PDBPs located on the R u n i c profile or within one pixel outside the profile are the constructed visual word.
  • Pixel set 2 of non-collapsed buildings. Within pixels in R u n i c profile, a candidate blurred line-segment set i n n e r meeting conditions is searched from any one pixel u . Except for different starting points and scopes of search, other steps are exactly the same as S 1 above. Because the blurred line segments in i n n e r are located inside R u n i c , the i n n e r is directly regarded as the constructed visual word.
  • Pixel set 2 of locally collapsed buildings. In R u n i c , PDBPs without being defined as visual words are defined as PDBP r e s and the ratio of the number of PDBP r e s to the total number of pixels is φ . Furthermore, the ratio of the total number of PDBPs in the SAR image to the total number of pixels is defined as φ S A R . If φ φ S A R , PDBP r e s is the constructed visual word.
  • Pixel set 2 of completely collapsed buildings. In R u n i c , PDBPs without being defined as visual words are the constructed visual word.
Based on the above six-dimensional visual words, the collapse sematic histogram I c s h of the double bounce of R u n i c can be obtained.

2.3. Extraction of Traditional Visual Features Based on MAPs

The area, diagonal, normalized moment of inertia (NMI) and standard deviation in MAPs have been proven to have strong discrimination ability in the detection of buildings. To this end, the traditional visual features in optical and SAR images are extracted based on the four attributes through the proposed automatic building detection from high-resolution remote sensing images based on joint optimization and decision fusion of MAPs (detailed steps can refer to previous studies [32]). On this basis, the multi-scale MAPs sets corresponding to optical and SAR images are obtained, including M A P s o p t and M A P s S A R . In M A P s o p t , the mean gray values of R u n i c in each attribute profile (AP) are calculated, thus obtaining the visual histogram I o s h of optical images corresponding to R u n i c . Similarly, the visual histogram I s s h of SAR images can be obtained.

2.4. Detection of Collapsed Buildings Based on Improved Active Learning SVMs

In the classification stage, R u n i is classified into non-collapsed buildings, collapsed buildings and others by using active learning SVMs. The decision-making function of each SVM classifier is shown as follows:
f ( h k ) = s i g n ( m = 1 M y m α m K ( x m , h k ) + b )
Furthermore, when annotating samples by active learning SVMs, it is difficult to annotate samples that are always on the category boundary with the greatest uncertainties. Therefore, this study proposed the CUI, and the calculation process is demonstrated as follows:
Step 1: The probabilities of the samples h k to be annotated belonging to annotated positive samples w l p and annotated negative samples v l q are separately calculated:
D ( w l p / h k ) = p = 1 P h k , w l p h k w l p P
D ( v l q / h k ) = q = 1 Q h k , v l q h k v l q Q
where, w l p indicates the p ( p = 1 , 2 P ) th sample in the l th category of positive samples; v l q represents the q ( q = 1 , 2 Q ) th sample in the l th category of negative samples.
Step 2: On this basis, the CUI of h k on the l th classifier is calculated by the following formula:
CUI ( w l p , v l q ) = 2 [ ( D 2 ( w l p / h k ) 1 ) × ( D 2 ( v l q / h k ) 1 ) ]
where, the larger the CUI is, the greater the classification uncertainty of the sample h k .
Step 3: Based on this, the categorical decision function f l ( h k ) of the sample h k is calculated in accordance with Equation (3). When CUI is the minimum and f l ( h k ) is the maximum, the sample h k is annotated. The annotated samples are added into the training samples to re-train the model. By repeating the above steps, the samples are refined to obtain the final detection results of collapsed buildings.

3. Experiments and Evaluation

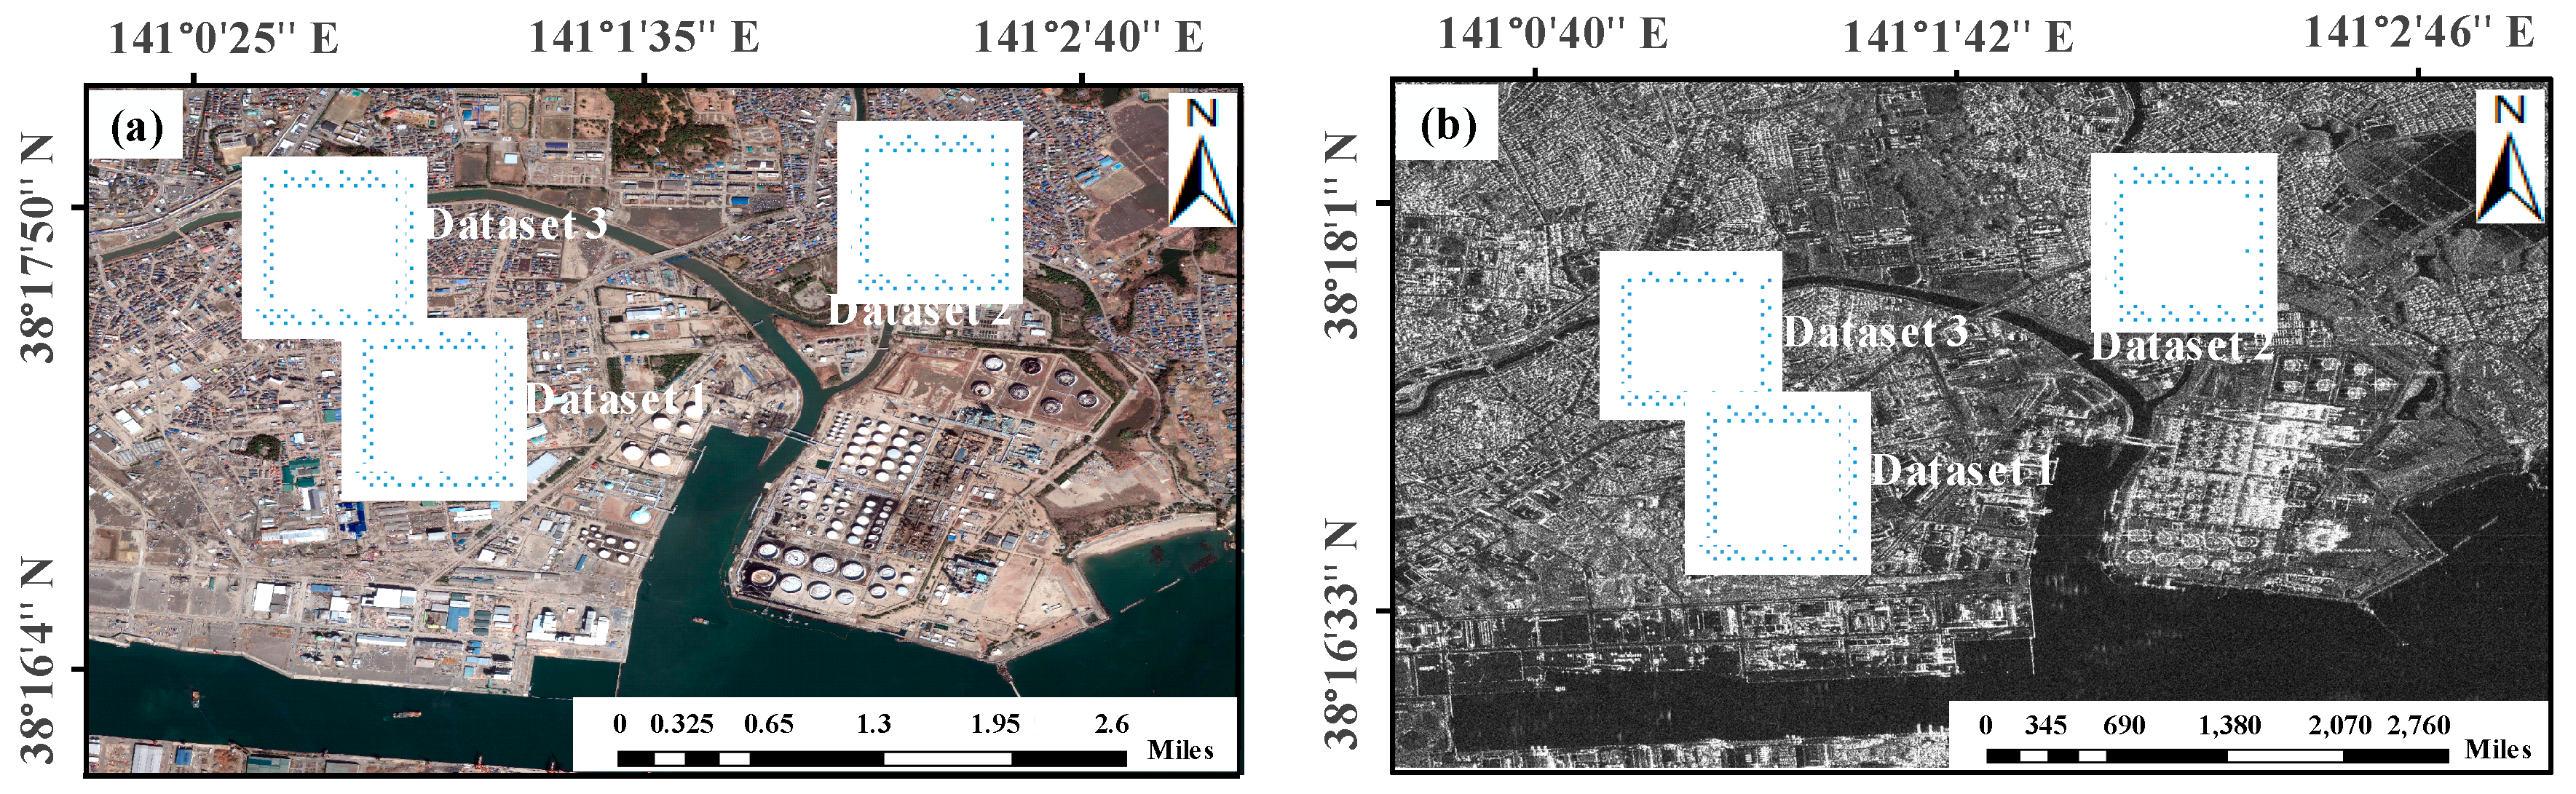
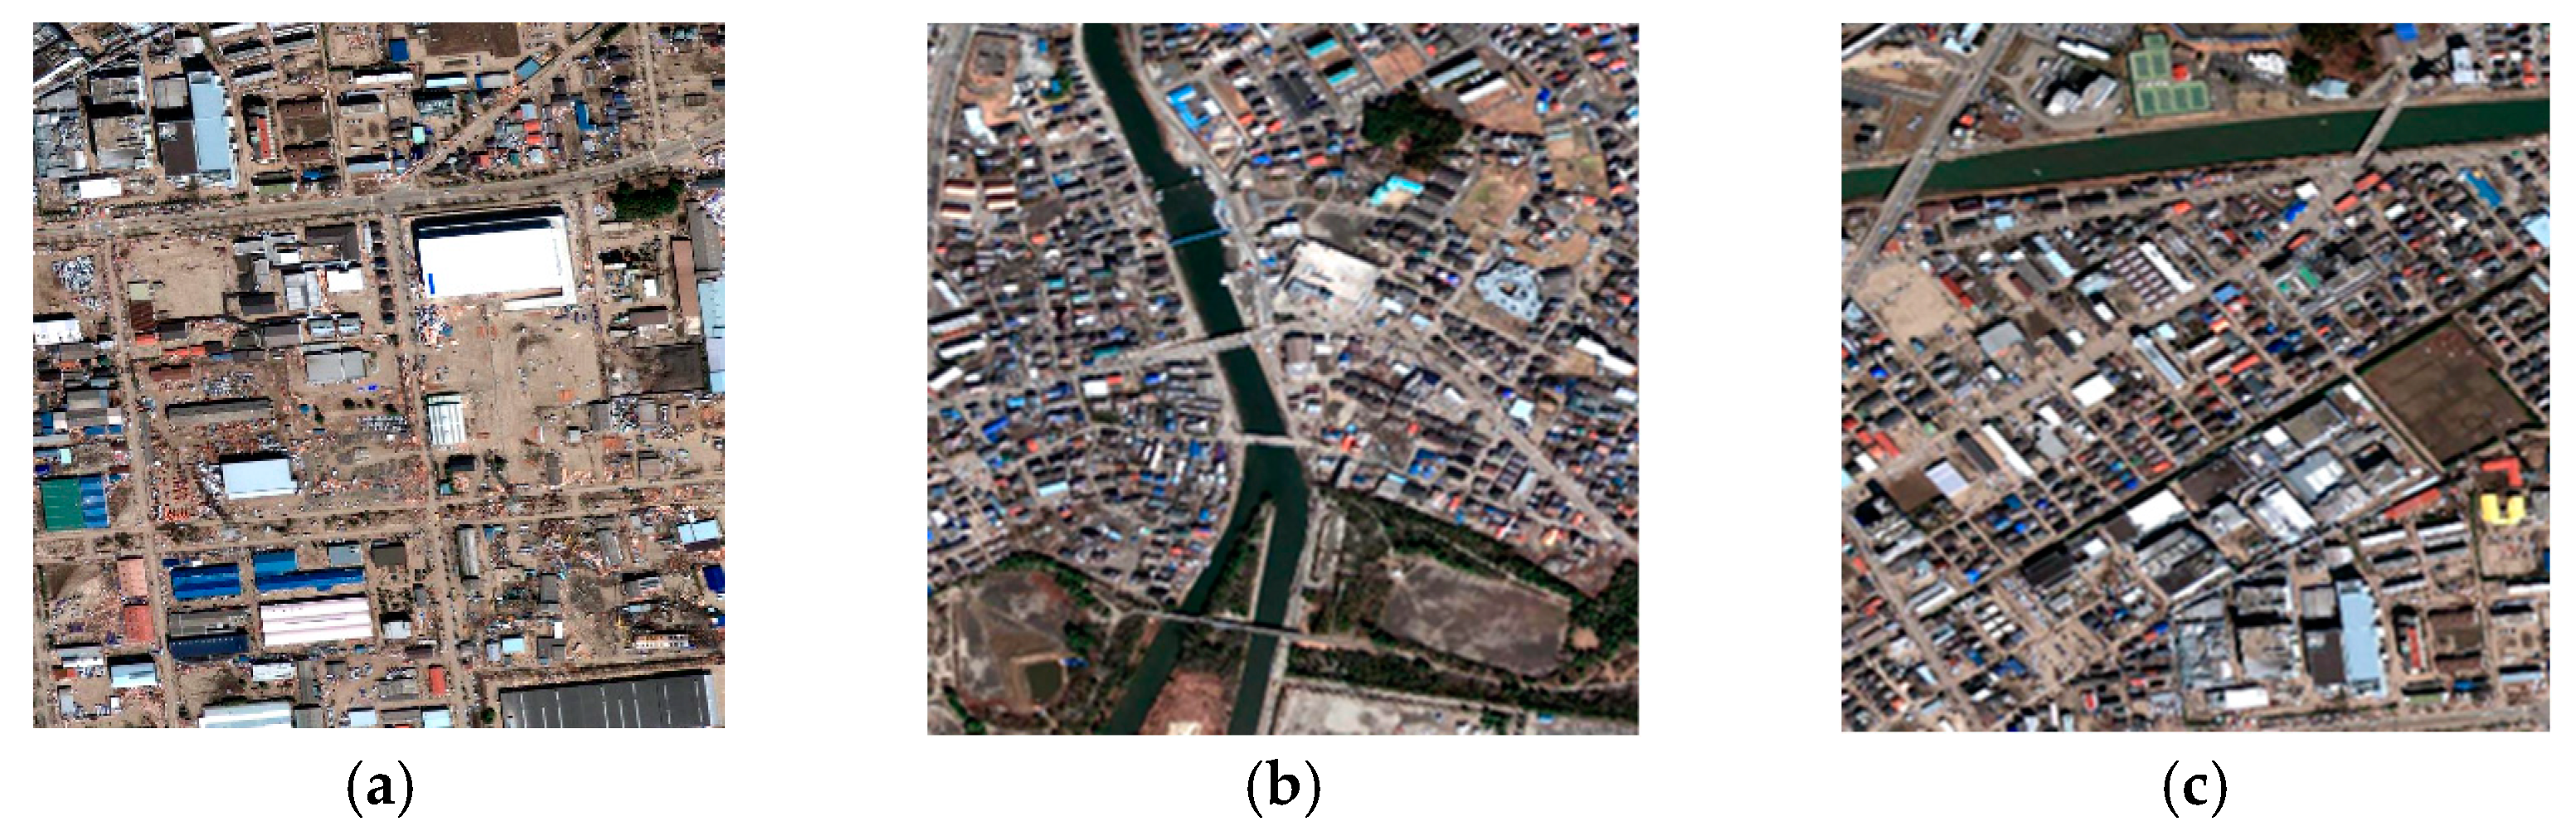
3.1. Study Area and Dataset Description

The study area is located in Sendai, Japan. An earthquake (Mw 9.0) occurred on 11 March 2011. The epicenter was located in the Pacific Ocean to the east of Miyagi Prefecture, Japan, with a focal depth of 20 km. Sendai is one of the cities that were most seriously hit by the earthquake. The earthquake and tsunami damaged lots of buildings, including 9877 collapsed buildings.
The post-earthquake high-resolution optical images adopted in this study are IKONOS satellite images in Sendai, Japan, which were collected on 24 March 2011 and showed a spatial resolution of 1 m, as displayed in Figure 3a. Post-earthquake high-resolution SAR images were TerraSAR-X satellite images for the area, collected on 23 March 2011 with the spatial resolution of 3 m. The images were acquired in HH polarization in stripmap mode, as demonstrated in Figure 3b. In the experiments, for the difference in resolution between optical and SAR images, the images with the lower resolution were re-sampled in this research, so that multi-source images had the same resolution. On this basis, this study selected three representative regions for experiments. Dataset 1 is located in an industrial zone where buildings were large and sparsely distributed, as shown in Figure 4a. Compared with the industrial zone, the residential area is usually the most severely affected, and is usually the primary target of post-earthquake emergency response and post-disaster reconstruction. To this end, the constructed Datasets 2 and 3 are both located in the residential area, as displayed in Figure 4b,c. Buildings in this area are usually densely distributed and neatly arranged. Due to the significant radiometric and geometric differences between optical and SAR data, their exact registration and high geometric precision correction are not only very complex but also difficult to obtain the desired results. In addition, since each object is extracted separately in optical and SAR images in this paper, only the matching set of objects need to be found in both datasets. For this reason, the following strategy was adopted for producing the datasets: taking the cropped and segmented optical image as a reference, we cropped the corresponding area in the SAR image which could completely cover all the objects in the optical image according to the visual interpretation.

3.2. Experimental Settings and Methods for Comparison

In the experiments, four different advanced methods were selected for comparison. The first is the detection method of optical images based on sparse dictionary (SD-OPT). The spatial context information is further introduced by constructing the same and different pairs of words with this method, so as to construct multi-visual features to model collapsed buildings [33]. The second is the detection method of SAR images based on multi-texture feature fusion (RF-SAR). In this method, texture features are extracted by comprehensively utilizing the gray-level histogram, gray-level co-occurrence matrix (GLCM), local binary pattern (LBP) and Gabor filtering, and then post-earthquake collapse information of buildings is obtained by Random Forest [34]. This third method is a deep learning method based on object context and boundary enhanced loss (OCR-BE). In this method, a novel loss function, BE loss, is designed according to the distance between pixels and the boundary, forcing the network to pay more attention to learning of boundary pixels [35]. The fourth method is a deep learning method based on UNet 3+ (UNet 3+). UNet 3+ takes advantage of full-scale skip connections and deep supervisions to make full use of the multi-scale features [36]. Among the four methods, the first two are single-source imaging methods based on traditional machine learning. By comparing them, complementarity and combined advantages of two data sources (optical and SAR images) in the detection of collapsed buildings can be verified. The latter two methods belong to deep learning methods combining multi-source data. Comparing them, it is conducive to analyze the difference in performances between the proposed method and deep learning methods in the detection of collapsed buildings, especially under small sample conditions.
All experiments are based on the three datasets in Section 3.1. In order to ensure consistency of evaluation indexes for accuracy across different methods, semantic segmentation results obtained by OCR-BE and UNet 3+ were converted into object-level detection results according to the proportion of pixels belonging to different categories. In the experiments, Matlab 2018 was taken as a simulation platform in all traditional machine learning methods. The two deep learning methods were based on PyTorch-1.3.1 framework and implemented in Ubuntu 16.04.

3.3. General Results and Analysis

Based on the three datasets, the detection results of collapsed buildings by different methods are demonstrated in Figure 5, Figure 6 and Figure 7. In addition, the true ground map made through visual interpretation is regarded as a basis for accuracy evaluation, in which white, gray and black represent the collapsed buildings, non-collapsed buildings and others, respectively.
As shown in the above figures, the detection results obtained by the proposed method are significantly superior to those of the four methods for comparison as a the whole. As traditional machine learning methods, SD-OPT adopts optical images, while RF-SAR uses SAR images. Compared with the proposed method, SD-OPT and RF-SAR separately have prominent false negatives (FNs) and false positives (FPs) because they only rely on single-source data, as displayed in (c) and (d) in Figure 5, Figure 6 and Figure 7. As two deep learning methods, OCR-BE and UNet 3+ need massive training samples to fully train a deep network; otherwise, it is difficult to obtain ideal detection effects. In the experiments, the sample sizes of the three datasets are 1880, 2036 and 2058, and the proportions of the sample sizes of collapsed buildings in the total number of samples are only 9.2%, 10.6% and 12.8%. This results in serious over-fitting and poor generalization effects of the model on the test set. This is the main reason why the detection accuracies of collapsed buildings using OCR-BE and UNet 3+ are significantly lower than that of the traditional machine learning methods. It is considered that with the increase of the sample size of collapsed buildings, the accuracy of the deep learning methods gradually improves until the model converges. In addition, for plants with a large size and low detection difficulty in the industrial zone (Figure 5), except for the RF-SAR method with a lot of FNs and FPs, other methods have good detection effects on buildings with large sizes. For densely distributed small buildings that are difficult to detect in the residential area (Figure 6 and Figure 7), the proposed method and SD-OPT method are significantly superior to other methods regarding the FN rate and FP rate. This indicates that rich spatial details provided by optical images are favorable for accurate characterization of collapsed buildings in the complex context compared with SAR images.
Furthermore, six evaluation indexes, including overall accuracy (OA), FP rate and FN rate as well as detection accuracies of non-collapsed buildings (Pnb), collapsed buildings (Pcb) and others (Po) were used for quantitative accuracy evaluation, and the results are shown in Table 1, Table 2 and Table 3. In the three experiments, OAs of the proposed method separately rise to 82.39%, 80.60% and 78.61%. Particularly, Pcb concerned here reaches more than 73.94%, showing the best performance in all experimental methods and consistent conclusions with visual analysis. In comparison with the proposed method, SD-OPT and RF-SAR only depend on single-source data and their FN rates and FP rates increase by more than 3.77% and 6.94%, respectively. As deep learning methods, OCR-BE and Unet 3+ can only obtain better detection effects of non-collapsed buildings than the proposed method under small sample sizes, while other accuracy indexes reduce significantly, especially with the Pcb being the lowest at only 9.43%. Nevertheless, the detection effects of the two deep learning methods will be greatly improved under the condition of sufficient training samples. Therefore, the strategy of combining optical and SAR images proposed in this research is necessary, feasible and effective in the detection of collapsed buildings and can achieve ideal effects under small sample conditions.

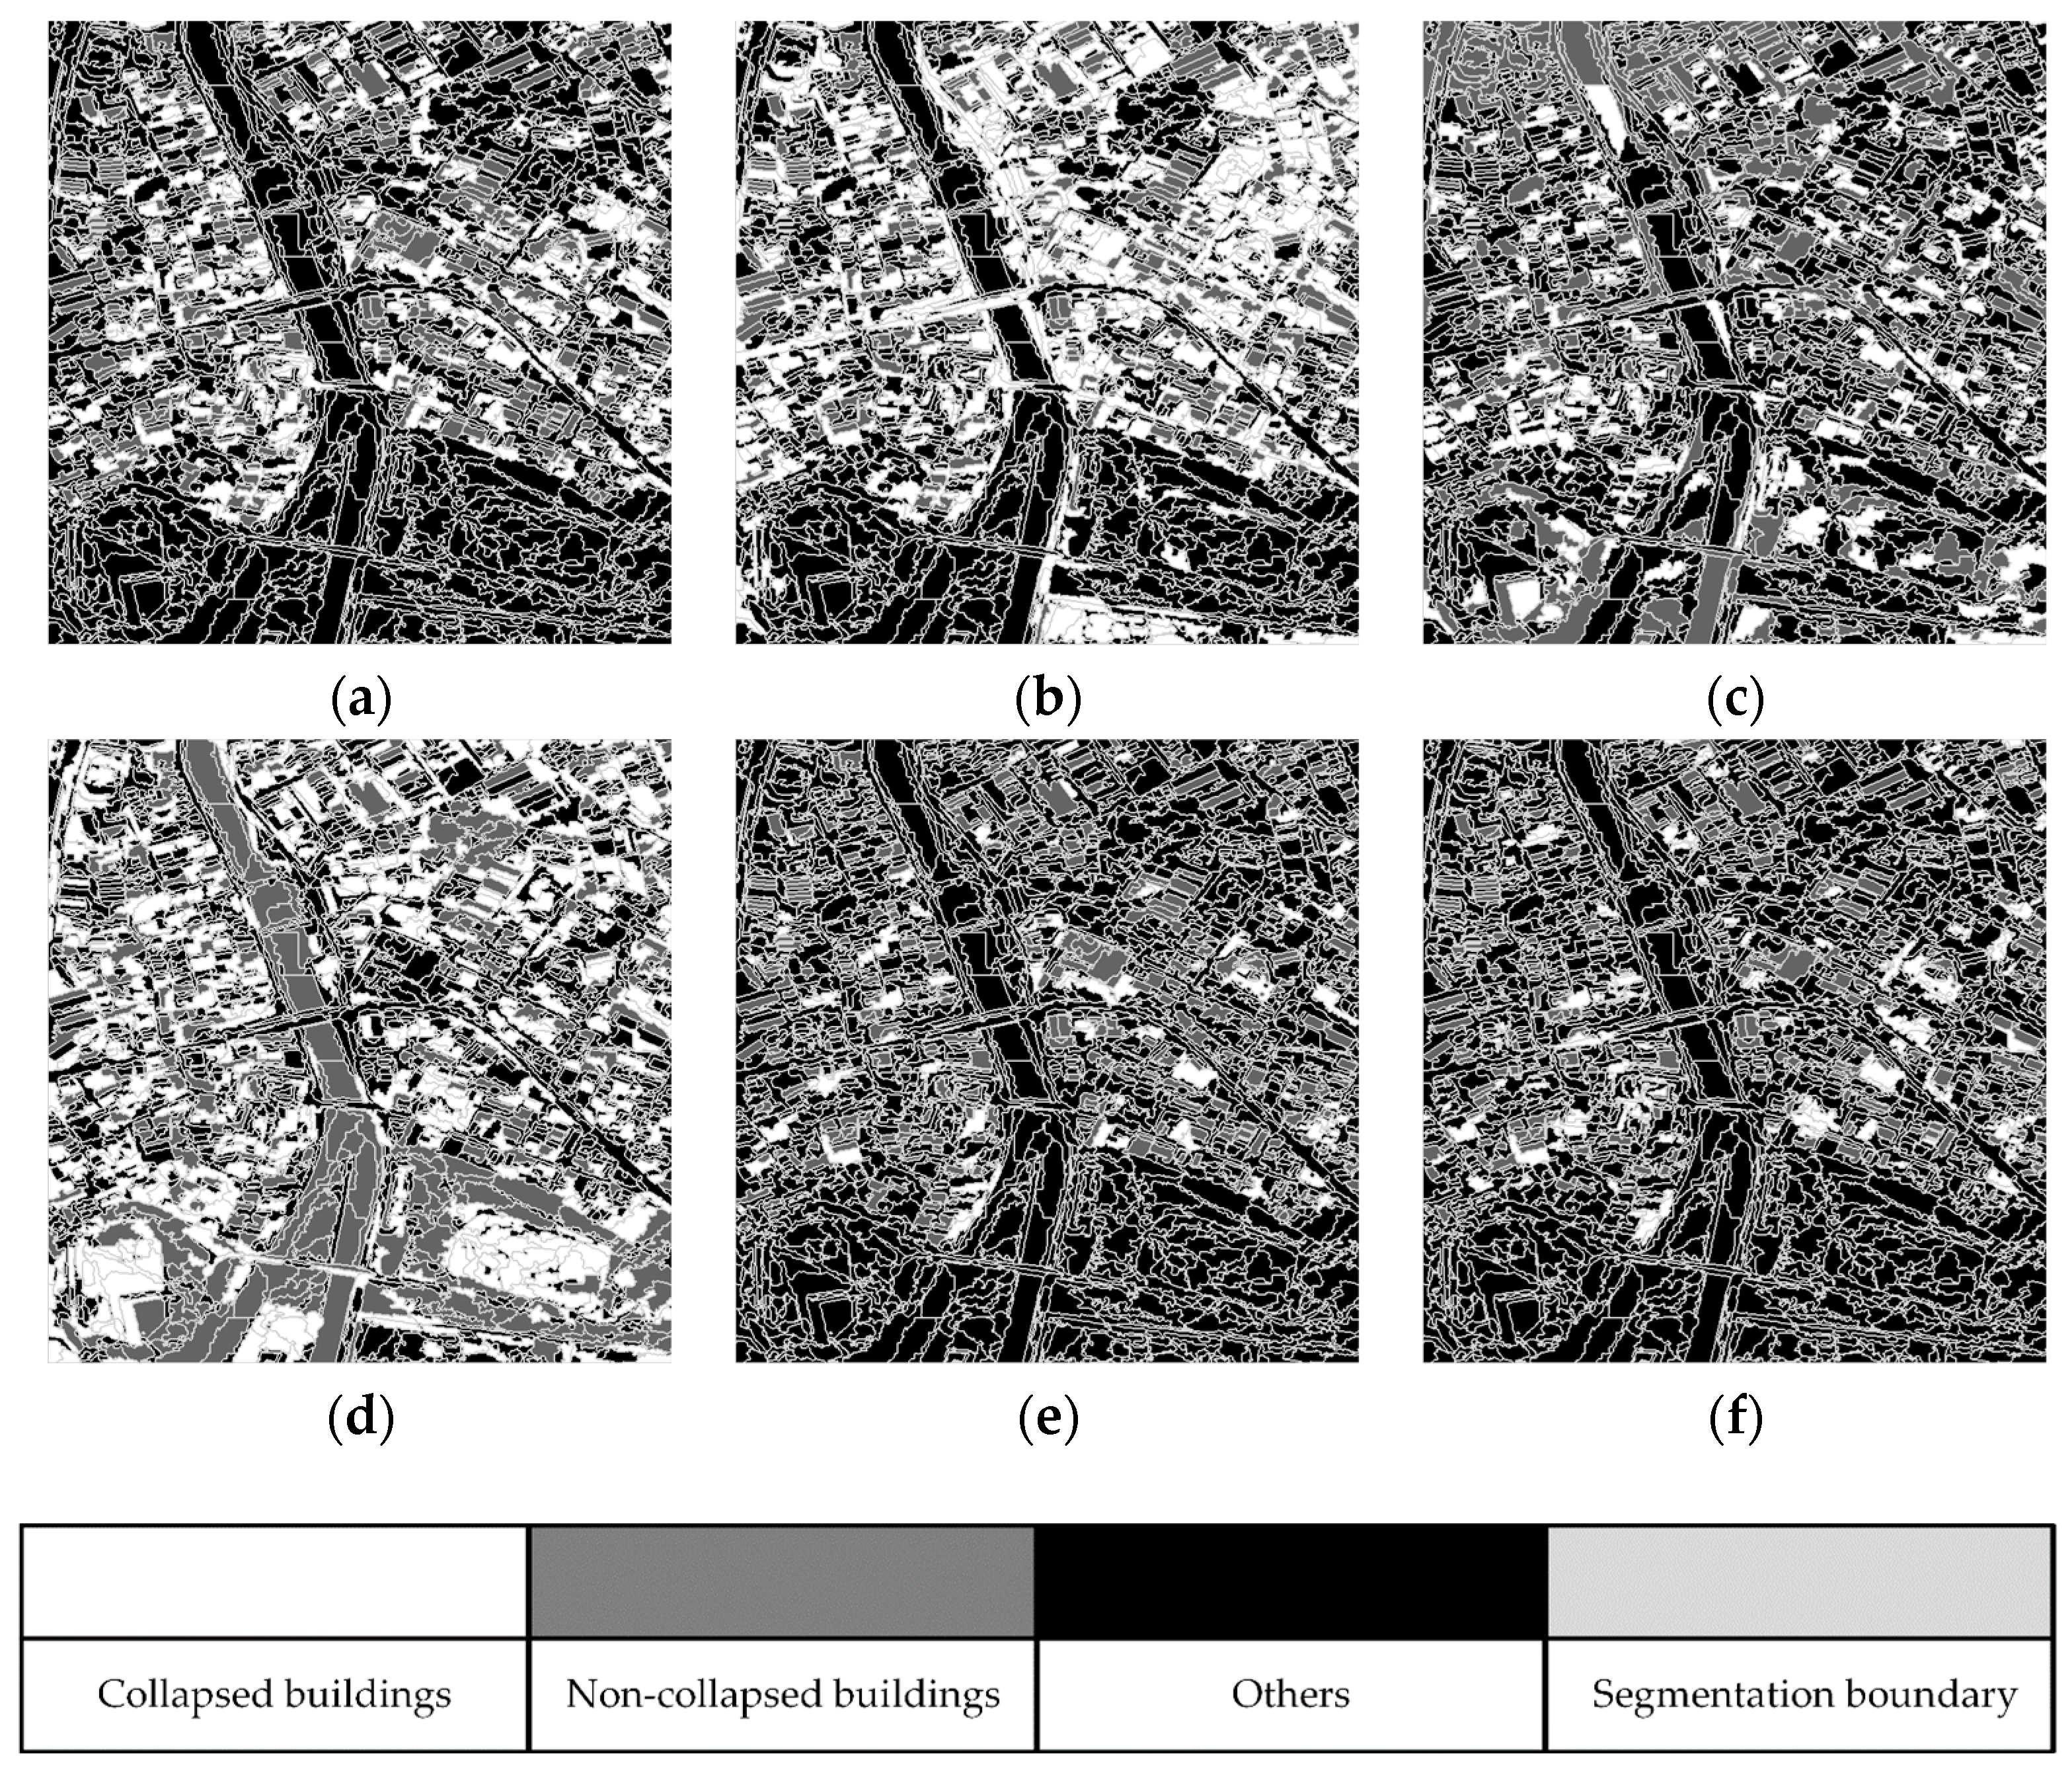
3.4. Visual Comparison of Representative Patches

For further detailed visual analysis and discussion, representative patches were selected in the three datasets, as shown in Figure 8, Figure 9 and Figure 10. Yellow and red boxes separately represent the collapsed buildings and non-collapsed buildings.
The above figures demonstrate that buildings in the industrial zone are easy to detect because of their large sizes and sparse distribution, so better detection effects of collapsed buildings can be acquired by all experimental methods. However, only UNet 3+ (yellow box in Figure 8g) shows FNs and SD-OPT presents FPs (yellow box in Figure 8e). For non-collapsed buildings in the industrial zone (red boxes in Figure 8), the proposed method and the two deep learning methods do not incur FPs, while SD-OPT and RF-SAR separately show FPs (red box in Figure 8d) and FNs (red box in Figure 8e). In the residential area with neatly arranged and densely distributed buildings, only the proposed method yields completely correct detection results for collapsed buildings (yellow boxes in Figure 9 and Figure 10). By contrast, RF-SAR (yellow box in Figure 10e) and OCR-BE (yellow box in Figure 10f) present FPs, while SD-OPT (yellow box in Figure 9d) and UNet 3+ (yellow boxes in Figure 9g and Figure 10g) show FNs. For non-collapsed buildings, the visual analysis results are similar to that of the industrial zone and good effects are reached by different methods. However, only SD-OPT and RF-SAR have obvious FPs and FNs. In conclusion, the detection effects of non-collapsed buildings by the five methods are good, while the proposed method has higher Pcb and less FPs and FNs by combining with optical and SAR images, which is consistent with the quantitative analysis results.

4. Discussion

4.1. Validity Analysis of Combined Optical and SAR Images

To further verify the validity of combined optical and SAR images, experiments based on single-source data (optical or SAR images) were conducted by using the proposed method. The accuracy evaluation of experimental results obtained by combining optical and SAR images, based on the optical image and based on the SAR image, are separately shown in Table 4.
On this basis, after combining optical and SAR images, the OA in experiments based on three datasets increases by 6.31~7.71% and Pcb rises by 12.56~19.03% compared with that under single-source data. Therefore, earthquake damage characteristics of buildings were depicted from multiple perspectives by combining optical and SAR images after the earthquake, and the extracted complementary information could significantly improve the detection accuracy of collapsed buildings. Particularly, double bounce in the SAR image provides key evidence support for judging whether buildings collapse or not, so Pcb in the experiment based on the SAR image is always significantly higher than that based on the optical image only with traditional visual features.
In addition, two representative patches were selected for further visual analysis, as shown in Figure 11 and Figure 12. For collapsed buildings with fragmented distribution in both images (yellow boxes in Figure 11), correct results can be obtained by the three methods. For collapsed buildings with well-preserved roofs in optical images (yellow boxes in Figure 12), correct judgement can be made by only the proposed method and the method based on SAR images because the double bounce in SAR images shows the typical collapse semantic features. However, FPs appear when using the method based on optical images (yellow box in Figure 12d). Non-collapsed buildings shown in red boxes in Figure 11 illustrate complete profile and single texture in optical and SAR images, so correct results are obtained from the three methods. For non-collapsed buildings with intact roofs in optical images but regional fragmentation distribution in SAR images, only the proposed method and that based on optical images can make correct judgements, while the method based on SAR images have obvious FPs. Therefore, it is feasible and effective to improve Pcb by complementing advantages of optical and SAR images.

4.2. Validity Analysis of DoubleBounceCollapseSemantic

To clarify the validity of the constructed DoubleBounceCollapseSemantic, the comparative experiments were carried out by adding or not adding double bounce features extracted by DoubleBounceCollapseSemantic to traditional visual features of combined optical and SAR images. The results are shown in Table 5.
As illustrated in the above table, the OA in the case of adding DoubleBounceCollapseSemantic increases by 3.34~3.92%, while FP rate and FN rate decrease by 1.7~1.49% and 2.71~3.61% compared with those in the case without adding DoubleBounceCollapseSemantic. Pcb rises by 6.49%, 9.48% and 6.79%, respectively. Therefore, the proposed DoubleBounceCollapseSemantic is effective. On this basis, six collapsed buildings and six non-collapsed buildings were selected from the three datasets and histogram statistics were created on pixels of double bounce belonging to different visual words, as displayed in Figure 13a,b.
Therefore, the histogram of collapsed buildings shows similar distribution, with low intra-class separability. Meanwhile, the proportion of the pixels of collapsed buildings is significantly higher than that of the non-collapsed ones, so it is conducive to obtaining correct identification results. For non-collapsed buildings, the proportions of pixels of collapsed to non-collapsed are contrary to collapsed buildings. Therefore, collapsed and non-collapsed buildings have good inter-class separability in the above histograms. Furthermore, for pixels of locally collapsed buildings, their proportion in collapsed buildings is significantly higher than that in non-collapsed buildings, so this is favorable for enhancing inter-class separability between collapsed and non-collapsed buildings.

4.3. Validity Analysis of CUI

To verify the validity of CUI, comparative experiments were conducted by adding or not adding CUI to the active learning SVMs, and the accuracy was evaluated. The results are shown in Table 6.
As listed in Table 6, OAs in the three experiments increase by 0.81%, 1.53% and 1.71%, while FP rate and FN rate reduce by 0.16~1.71% and 0.61~1.09%, respectively. Therefore, this suggests that the proposed CUI is conducive to selecting more representative samples for model training, which can significantly improve the classification accuracy.

4.4. Analysis of Effects of the Number of Initial Training Samples

In order to verify the performance of improved active learning SVMs proposed in this study under different numbers of initial training samples, the number of initial training samples in each category is valued in the interval [5, 50] at the step length of 5. The change trend of the OA with the increase of the number of training samples is shown in Figure 14.
Therefore, with the increase of the number of initial training samples, the OA rapidly rises in the interval [0, 20] and then tends to be stable. The OAs under Datasets 1 and 2 reach the peak (83.05% and 81.43%) when the sample size is 45. The OA under Dataset 3 reaches the peak of 79.14% when the sample size is 50. Although the peak OA rises by 0.53~0.83% compared with that under the sample size of 20, the number of the training samples required is more than doubled. In accordance with the above analysis, the number of training samples in each category is suggested to be 20.

5. Conclusions

With a lack of pre-earthquake data, the detection method for collapsed buildings relying on post-earthquake high-resolution optical and SAR images was proposed. To solve the challenge for accurately judging whether buildings collapse or not due to the lack of elevation data, the elevation information of buildings was indirectly acquired with this method by mining the double bounce features in SAR images. Moreover, automated detection of collapsed buildings was reached through combining multi-source traditional visual features. To this end, this research firstly designed the OpticalandSAR-Objects Extraction strategy to construct the unified optical-SAR object set. Based on this, the DoubleBounceCollapseSemantic was constructed, thus bridging the semantic gap between double bounce and collapse features of buildings. In the classification stage, the CUI was put forward, which was conducive to selecting more representative samples to optimize active learning SVMs and finally automatically detect collapsed buildings. Through multi-group comparative experiments on post-earthquake remote sensing images in different regions, the proposed method shows excellent performances compared with visual and quantitative analysis. The OA and Pcb can reach 82.39% and 75.47% at most, so the proposed method is superior to multiple methods for comparison. However, the proposed model does not dig into the influence of factors such as orientation angle of the building and polarization on double bounce intensity. In the future, we will focus on these issues to develop more complicated and advanced models.

Author Contributions

Conceptualization, C.W.; methodology, C.W. and Y.Z.; software, Y.Z.; validation, T.X., Y.Z. and S.C.; formal analysis, Y.Z. and L.G.; investigation, F.S. and J.L.; resources, C.W.; writing—original draft preparation, Y.Z.; writing—review and editing, C.W.; visualization, C.W. and Y.Z.; supervision, C.W., T.X. and S.C.; project administration, C.W. All authors have read and agreed to the published version of the manuscript.

Funding

This work was supported in part by the Natural Science Foundation of Jiangsu Province (Grants No JSZRHYKJ202114), the Natural Science Foundation of Jiangsu Province (Grants No YJGL-YF-2020-16), the National Natural Science Foundation of China (Grant No. 42176180), the Post-doctoral fund of Jiangsu Province under Grant No. 2021K013A, the Universities Natural Science Research project of Jiangsu Province under Grant 19KJB510048, the Opening fund for National Key Laboratory of Solid Microstructure Physics in Nanjing University under Grant No. M30006, the Post-doctoral fund of Jiangsu Province under Grant No. 1701132B and the Six Talent-peak Project in Jiangsu Province under Grant 2019XYDXX135.

Institutional Review Board Statement

Not applicable.

Informed Consent Statement

Not applicable.

Data Availability Statement

The data presented in this study are available on request from the corresponding author. The data are not publicly available due to other ongoing research.

Conflicts of Interest

All authors have reviewed the manuscript and approved submission to this journal. The authors declare that there is no conflict of interest regarding the publication of this article.

References

  1. Moya, L.; Geiß, C.; Hashimoto, M.; Mas, E. Disaster Intensity-Based Selection of Training Samples for Remote Sensing Building Damage Classification. IEEE Trans. Geosci. Remote Sens. 2021, 59, 8288–8304. [Google Scholar] [CrossRef]
  2. Cotrufo, S.; Sandu, C.; Tonolo, F.G.; Boccardo, P. Building damage assessment scale tailored to remote sensing vertical imagery. Eur. J. Remote Sens. 2018, 51, 991–1005. [Google Scholar] [CrossRef] [Green Version]
  3. Li, J.; Zhao, S.; Jin, H.; Li, Y.; Guo, Y. A method of combined texture features and morphology for building seismic damage information extraction based on GF remote sensing images. Acta Seismol. 2019, 5, 658–670. [Google Scholar]
  4. Rui, Z.; Yi, Z.; Shi, W. Construction and Application of a Post-Quake House Damage Model Based on Multiscale Self-Adaptive Fusion of Spectral Textures Images. In Proceedings of the IGARSS 2020—2020 IEEE International Geoscience and Remote Sensing Symposium, Waikoloa, HI, USA, 26 September–2 October 2020; pp. 6631–6634. [Google Scholar]
  5. Rui, X.; Cao, Y.; Yuan, X.; Kang, Y.; Song, W. DisasterGAN: Generative Adversarial Networks for Remote Sensing Disaster Image Generation. Remote Sens. 2021, 13, 4284. [Google Scholar] [CrossRef]
  6. Wen, Q.; Jiang, K.; Wang, W.; Liu, Q.; Guo, Q.; Li, L.; Wang, P. Automatic Building Extraction from Google Earth Images under Complex Backgrounds Based on Deep Instance Segmentation Network. Sensors 2019, 19, 333. [Google Scholar] [CrossRef] [Green Version]
  7. Janalipour, M.; Mohammadzadeh, A. A novel and automatic framework for producing building damage map using post-event LiDAR data. Int. J. Disaster Risk Reduct. 2019, 39, 101238. [Google Scholar] [CrossRef]
  8. Kaoshan, D.; Ang, L.; Hexiao, Z. Surface damage quantification of post-earthquake building based on terrestrial laser scan data. Struct. Control. Health Monit. 2018, 25, e2210. [Google Scholar]
  9. Jihui, T.; Deren, L.; Wenqing, F. Detecting Damaged Building Regions Based on Semantic Scene Change from Multi-Temporal High-Resolution Remote Sensing Images. ISPRS Int. J. Geo-Inf. 2017, 6, 131. [Google Scholar]
  10. Jun, L.; Pei, L. Extraction of Earthquake-Induced Collapsed Buildings from Bi-Temporal VHR Images Using Object-Level Homogeneity Index and Histogram. IEEE J. Sel. Top. Appl. Earth Obs. Remote Sens. 2019, 12, 2755–2770. [Google Scholar]
  11. Akhmadiya, A.; Nabiyev, N.; Moldamurat, K. Use of Sentinel-1 Dual Polarization Multi-Temporal Data with Gray Level Co-Occurrence Matrix Textural Parameters for Building Damage Assessment. Pattern Recognit. Image Anal. 2021, 31, 240–250. [Google Scholar] [CrossRef]
  12. Zhou, Z.; Gong, J.; Hu, X. Community-scale multi-level post-hurricane damage assessment of residential buildings using multi-temporal airborne LiDAR data. Autom. Constr. 2019, 98, 30–45. [Google Scholar] [CrossRef]
  13. Jiang, X.; He, Y.; Li, G.; Liu, Y. Building Damage Detection via Superpixel-Based Belief Fusion of Space-Borne SAR and Optical Images. IEEE Sens. J. 2019, 20, 2008–2022. [Google Scholar] [CrossRef]
  14. Xin, Y.; Ming, L.; Jun, W. Building-Based Damage Detection from Postquake Image Using Multiple-Feature Analysis. IEEE Geosci. Remote Sens. Lett. 2017, 14, 499–503. [Google Scholar]
  15. Chen, Q.; Yang, H.; Li, L.; Liu, X. A Novel Statistical Texture Feature for SAR Building Damage Assessment in Different Polarization Modes. IEEE J. Sel. Top. Appl. Earth Obs. Remote Sens. 2020, 13, 154–165. [Google Scholar] [CrossRef]
  16. Wang, X.; Li, P. Extraction of urban building damage using spectral, height and corner information from VHR satellite images and airborne LiDAR data. ISPRS J. Photogramm. Remote Sens. 2020, 159, 322–336. [Google Scholar] [CrossRef]
  17. Adriano, B.; Xia, J.; Baier, G.; Yokoya, N.; Koshimura, S. Multi-Source Data Fusion Based on Ensemble Learning for Rapid Building Damage Mapping during the 2018 Sulawesi Earthquake and Tsunami in Palu, Indonesia. Remote Sens. 2019, 11, 886. [Google Scholar] [CrossRef] [Green Version]
  18. Guo, J.; Luan, Y.; Li, Z.; Liu, X.; Li, C.; Chang, X. Mozambique Flood (2019) Caused by Tropical Cyclone Idai Monitored from Sentinel-1 and Sentinel-2 Images. IEEE J. Sel. Top. Appl. Earth Obs. Remote Sens. 2021, 14, 8761–8772. [Google Scholar] [CrossRef]
  19. Zheng, W.; Hu, D.; Wang, J. Fault Localization Analysis Based on Deep Neural Network. Math. Probl. Eng. 2016, 4, 1–11. [Google Scholar] [CrossRef] [Green Version]
  20. Li, Y.; Xu, W.; Chen, H.; Jiang, J.; Li, X. A Novel Framework Based on Mask R-CNN and Histogram Thresholding for Scalable Segmentation of New and Old Rural Buildings. Remote Sens. 2021, 13, 1070. [Google Scholar] [CrossRef]
  21. Mahmoud, A.; Mohamed, S.; El-Khoribi, R.; Abdelsalam, H. Object Detection Using Adaptive Mask RCNN in Optical Remote Sensing Images. Int. Intell. Eng. Syst. 2020, 13, 65–76. [Google Scholar] [CrossRef]
  22. Zhao, K.; Kang, J.; Jung, J.; Sohn, G. Building Extraction from Satellite Images Using Mask R-CNN With Building Boundary Regularization. In CVPR Workshops; IEEE: New York, NY, USA, 2018; pp. 247–251. [Google Scholar]
  23. Bhuiyan, M.A.E.; Witharana, C.; Liljedahl, A.K. Use of Very High Spatial Resolution Commercial Satellite Imagery and Deep Learning to Automatically Map Ice-Wedge Polygons across Tundra Vegetation Types. J. Imaging 2020, 6, 137. [Google Scholar] [CrossRef] [PubMed]
  24. Witharana, C.; Bhuiyan, A.E.; Liljedahl, A.K.; Kanevskiy, M.; Epstein, H.E.; Jones, B.M.; Daanen, R.; Griffin, C.G.; Kent, K.; Jones, M.K.W. Understanding the synergies of deep learning and data fusion of multispectral and panchromatic high resolution commercial satellite imagery for automated ice-wedge polygon detection. ISPRS J. Photogramm. Remote Sens. 2020, 170, 174–191. [Google Scholar] [CrossRef]
  25. Ferro, A.; Brunner, D.; Bruzzone, L.; Lemoine, G. On the Relationship Between Double Bounce and the Orientation of Buildings in VHR SAR Images. IEEE Geosci. Remote Sens. Lett. 2011, 8, 612–616. [Google Scholar] [CrossRef]
  26. Cho, K.; Park, S.; Cho, J.; Moon, H.; Han, S. Automatic Urban Area Extraction from SAR Image Based on Morphological Operator. IEEE Geosci. Remote Sens. Lett. 2021, 18, 831–835. [Google Scholar] [CrossRef]
  27. Zhang, A.; Sun, G.; Liu, S. Multi-scale segmentation of very high-resolution remote sensing image based on gravitational field and optimized region merging. Multimed. Tools Appl. 2017, 76, 15105–15122. [Google Scholar] [CrossRef]
  28. Nazarinezhad, J.; Dehghani, M. A contextual-based segmentation of compact PolSAR images using Markov Random Field (MRF) model. Int. J. Remote Sens. 2018, 40, 985–1010. [Google Scholar] [CrossRef]
  29. Li, Q.; Yin, K.; Yuan, G. ROI Extraction of Village Targets and Heterogeneous Image Registration. Modern Radar. 2019, 41, 31–36. [Google Scholar]
  30. Huang, H.; Li, X.; Chen, C. Individual Tree Crown Detection and Delineation from Very-High-Resolution UAV Images Based on Bias Field and Marker-Controlled Watershed Segmentation Algorithms. IEEE J. Sel. Top. Appl. Earth Obs. Remote Sens. 2018, 11, 2253–2262. [Google Scholar] [CrossRef]
  31. Liu, W.; Zhang, Z.; Chen, X.; Li, S.; Zhou, Y. Dictionary Learning-Based Hough Transform for Road Detection in Multispectral Image. IEEE Geosci. Remote Sens. Lett. 2017, 14, 2330–2334. [Google Scholar] [CrossRef]
  32. Wang, C.; Zhang, Y.; Chen, X.; Jiang, H.; Mukherjee, M.; Wang, S. Automatic Building Detection from High-Resolution Remote Sensing Images Based on Joint Optimization and Decision Fusion of Morphological Attribute Profiles. Remote Sens. 2021, 13, 357. [Google Scholar] [CrossRef]
  33. Shi, F.; Wang, C.; Shen, Y.; Zhang, Y.; Qui, X. High-resolution Remote Sensing Image Post-earthquake Building Detection Based on Sparse Dictionary. Chin. J. Sci. Instrum. 2020, 41, 205–213. [Google Scholar]
  34. Du, Y.; Gong, L.; Li, Q. Earthquake-Induced Building Damage Assessment on SAR Multi-Texture Feature Fusion. In Proceedings of the IGARSS 2020—2020 IEEE International Geoscience and Remote Sensing Symposium, Waikoloa, HI, USA, 26 September–2 October 2020; pp. 6608–6610. [Google Scholar]
  35. Wang, C.; Qiu, X.; Huan, H.; Wang, S.; Zhang, Y.; Chen, X.; He, W. Earthquake-Damaged Buildings Detection in Very High-Resolution Remote Sensing Images Based on Object Context and Boundary Enhanced Loss. Remote Sens. 2021, 13, 3119. [Google Scholar] [CrossRef]
  36. Huang, H.; Lin, L.; Tong, R.; Hu, H.; Zhang, Q.; Iwamoto, Y.; Han, X.; Chen, Y.-W.; Wu, J. UNet 3+: A Full-Scale Connected UNet for Medical Image Segmentation. arXiv 2020, arXiv:2004.08790. [Google Scholar]
Figure 1. The optical images and the corresponding SAR images: (a) optical images of non-collapsed buildings; (b) SAR images of non-collapsed buildings; (c) optical images of collapsed buildings; (d) SAR images of collapsed buildings. (In (b,d), green boxes represent double bounce of non-collapsed buildings, while red boxes indicate double bounce of collapsed buildings).
Remotesensing 14 01100 g001
Figure 2. Specific flow of the method.
Remotesensing 14 01100 g002
Figure 3. (a,b) Study area.
Remotesensing 14 01100 g003
Figure 4. The optical images for the three datasets: (a) Dataset 1; (b) Dataset 2; (c) Dataset 3.
Remotesensing 14 01100 g004
Figure 5. Detection results of collapsed buildings based on Dataset 1: (a) reference map; (b) proposed method; (c) SD-OPT; (d) RF-SAR; (e) OCR-BE; (f) UNet 3+.
Remotesensing 14 01100 g005
Figure 6. Detection results of collapsed buildings based on Dataset 2: (a) reference map; (b) proposed method; (c) SD-OPT; (d) RF-SAR; (e) OCR-BE; (f) UNet 3+.
Remotesensing 14 01100 g006
Figure 7. Detection results of collapsed buildings based on Dataset 3: (a) reference map; (b) proposed method; (c) SD-OPT; (d) RF-SAR; (e) OCR-BE; (f) UNet 3+.
Remotesensing 14 01100 g007
Figure 8. Detection results of collapsed buildings in the representative patches in Dataset 1: (a) original drawing of the representative patches; (b) reference diagram of the representative patches; (c) proposed method; (d) SD-OPT; (e) RF-SAR; (f) OCR-BE; (g) UNet 3+.
Remotesensing 14 01100 g008
Figure 9. Detection results of collapsed buildings in the representative patches in Dataset 2: (a) original drawing of the representative patches; (b) reference diagram of the representative patches; (c) proposed method; (d) SD-OPT; (e) RF-SAR; (f) OCR-BE; (g) UNet 3+.
Remotesensing 14 01100 g009
Figure 10. Detection results of collapsed buildings in the representative patches in Dataset 3: (a) original drawing of the representative patches; (b) reference diagram of the representative patches; (c) proposed method; (d) SD-OPT; (e) RF-SAR; (f) OCR-BE; (g) UNet 3+.
Remotesensing 14 01100 g010
Figure 11. Detection results of collapsed buildings in the representative sub-patch 1: (a) original drawing of the representative sub-patch 1; (b) reference diagram; (c) proposed method; (d) only optical images; (e) only SAR images.
Remotesensing 14 01100 g011
Figure 12. Detection results of collapsed buildings in the representative sub-patch 2: (a) original drawing of the representative sub-patch 2; (b) reference diagram; (c) proposed method; (d) only optical images; (e) only SAR images.
Remotesensing 14 01100 g012
Figure 13. Histograms of pixels of double bounce belonging to different visual words for (a) collapsed buildings and (b) non-collapsed buildings.
Remotesensing 14 01100 g013aRemotesensing 14 01100 g013b
Figure 14. Effects of the number of initial training samples on OA.
Remotesensing 14 01100 g014
Table 1. Detection accuracy based on Dataset 1.
Method/
Indicator
OA (%)FP (%)FN (%)Pnb (%)Pcb (%)Po (%)
Evaluation
Criteria
The Higher the BetterThe Lower the BetterThe Lower the BetterThe Higher
the Better
The Higher the BetterThe Higher the Better
Proposed method82.399.6517.6152.9274.5788.55
SD-OPT75.8514.5925.1541.3546.8292.62
RF-SAR63.9921.9636.0125.2944.5173.17
OCR-BE78.4613.3115.3578.9429.4890.10
UNet 3+77.2815.8019.9680.2114.4592.52
Table 2. Detection accuracy based on Dataset 2.
Method/
Indicator
OA (%)FP (%)FN (%)Pnb (%)Pcb (%)Po (%)
Evaluation
Criteria
The Higher the BetterThe Lower the BetterThe Lower the BetterThe Higher
the Better
The Higher the BetterThe Higher the Better
Proposed method80.6010.7419.4050.2273.9485.68
SD-OPT74.6614.5126.3417.7747.2287.14
RF-SAR63.4122.3936.5924.3829.6374.02
OCR-BE77.1412.4922.2076.0322.3087.26
UNet 3+76.8011.8724.5950.0021.7689.73
Table 3. Detection accuracy based on Dataset 3.
Method/
Indicator
OA (%)FP (%)FN (%)Pnb (%)Pcb (%)Po (%)
Evaluation
Criteria
The Higher the BetterThe Lower the BetterThe Lower the BetterThe Higher
the Better
The Higher the BetterThe Higher the Better
Proposed method78.6112.8022.6955.0875.4783.51
SD-OPT66.8119.9033.1945.7241.1377.17
RF-SAR59.2325.6040.7722.7327.5574.77
OCR-BE76.3913.9222.8963.9833.3285.04
UNet 3+75.1114.4325.5565.249.4392.88
Table 4. Comparison of detection accuracies of combining optical and SAR images with those based on single-source data.
DatasetsMethod/IndicatorOA (%)FP (%)FN (%)Pnb (%)Pcb (%)Po (%)
Evaluation CriteriaThe Higher the BetterThe Lower the BetterThe Lower the BetterThe Lower
the Better
The Higher the BetterThe Higher the Better
Dataset 1Optical and SAR82.399.6517.6152.9274.5788.55
Optical66.4930.5627.1240.8646.5975.79
SAR74.6814.4923.3250.1957.2381.10
Dataset 2Optical and SAR80.6010.7419.4050.2273.9485.68
Optical64.6220.7630.3838.4347.6672.24
SAR74.7114.4825.2945.0454.9183.33
Dataset 3Optical and SAR78.6112.8022.6955.0875.4783.51
Optical65.4019.9531.6569.7950.5767.02
SAR72.3016.0725.7045.4562.9179.76
Table 5. Validity analysis of DoubleBounceCollapseSemantic. and separately represent that a feature is added and not added.
DatasetsMethod/IndicatorOA (%)FP (%)FN (%)Pnb (%)Pcb (%)Po (%)
Evaluation CriteriaThe Higher the BetterThe Lower the BetterThe Lower
the Better
The Higher the BetterThe Higher the BetterThe Higher the Better
Dataset 1 DoubleBounceCollapseSemantic82.399.6517.6152.9274.5788.55
DoubleBounceCollapseSemantic78.8311.8620.8148.6467.6385.52
Dataset 2 DoubleBounceCollapseSemantic80.6010.7419.4050.2273.9485.68
DoubleBounceCollapseSemantic77.2612.4423.0146.2864.4684.48
Dataset 3 DoubleBounceCollapseSemantic78.6112.8022.6955.0875.4783.51
DoubleBounceCollapseSemantic74.6915.2925.4042.2568.6881.47
Table 6. Validity analysis of CUI. and separately represent that an index is added and not added.
DatasetsMethod/IndicatorOA (%)FP (%)FN (%)
Evaluation CriteriaThe Higher
the Better
The Lower the BetterThe Lower the Better
Dataset 1 CUI82.399.6517.61
CUI81.589.8118.33
Dataset 2 CUI80.6010.7419.40
CUI79.0712.4520.01
Dataset 3 CUI78.6112.8022.69
CUI76.9013.2723.78
Publisher’s Note: MDPI stays neutral with regard to jurisdictional claims in published maps and institutional affiliations.

