Article

A Novel Approach to Validate Satellite Snowfall Retrievals by Ground-Based Point Measurements

Department of Earth, Ocean and Atmospheric Science, Florida State University, Tallahassee, FL 32306, USA
*
Author to whom correspondence should be addressed.
Remote Sens. 2022, 14(3), 434; https://doi.org/10.3390/rs14030434
Submission received: 18 November 2021 / Revised: 3 January 2022 / Accepted: 14 January 2022 / Published: 18 January 2022
(This article belongs to the Special Issue Radar Remote Sensing of Cloud and Precipitation)

Abstract

:
A novel method has been proposed for validating satellite radar snowfall retrievals using surface station observations over the western United States mountainous region, where the mean snowfall rate at a station depends on its elevation. First, all station data within a 1° × 1° grid are used to develop a snowfall rate versus elevation relation. This relation is then used to compute snowfall rate in other locations within the 1° × 1° grid, as if surface observations were available everywhere in the grid. Grid mean snowfall rates are then derived, which should be more representative to the mean snowfall rate of the grid than using data at any one station or from a simple mean of all stations in the grid. Comparison of the so-derived grid mean snowfall rates with CloudSat retrievals shows that the CloudSat product underestimates snowfall by about 65% when averaged over all the 768 grids in the western United States mountainous regions. The bias does not seem to have clear dependency on elevation but strongly depends on snowfall rate. As an application of the method, we further estimated the snowfall to precipitation ratio using both ground and satellite measured data. It is found that the rates of increase with elevation of the snowfall to precipitation ratio are quite similar when calculating from ground and satellite data, being about 25% per kilometer elevation up or approximately 4% per every degree Cuisses of temperature drop.

Graphical Abstract

1. Introduction

Glacier and snowpack over high mountains are critical water resources to populations living in the lowland regions. For example, upland areas (above 2000 m elevation) in the high mountains of Asia supply the five basins of the Indus, Ganges, Yellow, Brahmaputra, and Yangtze rivers, providing water to 1.4 billion people in the downstream region [1,2]. In the western United States (U.S.), the bulk of surface water resources, as represented by the flow of the Colorado and Columbia River systems, is derived from melted winter snowpack [3]. In a warming climate, glacier is depleting over a global scale [4,5]. In the western U.S., it is observed that mountain snowpack is declining accompanied with rising surface temperature and early start of snow melting in the recent decades [6], which threatens the water resources in the western states [7]. The long-term variation of snowfall is an important indicator of climate change in both regional and global scales [8,9] and a key component of the hydrological cycle in the mid- and high latitudes [10,11,12,13].
For estimation of snowfall over a large-scale, satellite remote sensing becomes inevitable, particularly over remote mountainous regions. There are currently several satellite precipitation products available, for example, radar products [14,15], microwave radiometer products [16], radar-radiometer combined products [17], and multisensor merged products [18,19,20]. Since passive sensors measure the combined contribution from the atmosphere and surface to the upwelling radiation, the quality of their snowfall retrieval suffers greatly from the complexity of snow-covered surfaces, particularly over mountainous terrains [10,21]. Satellite radars are considered to be the most suitable sensors for snowfall observations, among which the Cloud Profiling Radar (CPR) aboard the CloudSat satellite [22] is clearly the most reliable one because of its high sensitivity [23,24,25]. The Global Precipitation Measurement (GPM) mission Dual-Frequency Precipitation Radar (DPR) lacks the ability to detect most of snowfall events although it is suitable to measure rainfall and heavy snowfall [25]. For this reason, we will focus on the validation of snowfall retrievals from CloudSat observations.
To assure the quality of satellite radar snowfall estimation as well as for fine-tuning of retrieval algorithms, validations by ground-based in situ measurements, such as by snow gauges, pillows, boards, etc., are required [26,27], although uncertainties exist in these validation data as well [28,29,30]. However, problems arise when we try to validate satellite measured areal precipitation using a ground-based point measurement. Even if the gauge and satellite estimates are individually correct at their own scale, the two sets may not equal because the point measurement by gauges lacks the areal representativeness [31,32]. This problem is particularly serious over mountainous regions where orographic effect makes the distribution of precipitation spatially quite variable and sometimes preferentially skewed to mountain peaks or valleys [33,34,35].
Moreover, there is an additional difficulty for the validation of snowfall retrievals from CloudSat CPR using ground-based point measurements. Because of the CPR’s narrow coverage of its ground path (~1.5 km), it is impossible to obtain a statistically meaningful number of coincident data points for instantaneous comparison between CPR retrieval and ground measurements at a station. To conduct the validation, we have to examine the consistency between the climatological mean of snowfall observed over time at a ground station with the CPR retrievals averaged over an area surrounding that station. The surrounding area must be large enough to include a sufficiently large number of CPR observations so that the “climatological mean” is stable. As shown in the next section, the climatological mean of snowfall measured at a station is often not representative of the areal mean in the surrounding region because snowfall is systematically low in the valleys and high over the mountain peaks. To mitigate this problem, we develop a novel method to derive a more meaningful areal mean of snowfall climatology surrounding ground stations by introducing a dynamically varying relation between mean snowfall rate and elevation.
In choosing ground truth datasets for the validation, we intentionally excluded datasets that have already embedded in model analysis or remote sensing retrievals, such as SNODAS (Snow Data Assimilation System, [36]), Stage IV [37], or MRMS (Multi-Radar Multi-Sensor System, [38]). Instead, we chose datasets that are collected from ground stations. We have identified two such datasets, which are used for validation in this study, i.e., the Snow Telemetry (SNOTEL, [39]) and Global Historical Climatology Network Daily, (GHCND, [40]). SNOTEL provides snow water equivalent data via a pressure-sensing snow pillow over mountainous regions in the western U.S. and Alaska. Using SNOTEL data, Wen et al. [41] evaluated the ground radar based MRMS snowfall and the Integrated Multi-satellitE Retrievals for GPM (IMERG) products. Severe underestimation against SNOTEL is found in both the radar and satellite products. In addition, Song et al. [42] used SNOTEL data to assess the performance of various precipitation products from satellites, reanalysis, and rain gauges in Alaska. They unraveled that most of the products can capture snowfall events; however, the reanalysis products tend to overestimate while the IMERG underestimates snowfall accumulation. GHCND is created by international collaboration and contains variables such as precipitation and temperature measured at weather stations. While this dataset has been used for climatological studies, from the authors’ knowledge there have been no published works for snowfall validation.
The goal of this study is to validate space radar precipitation using SNOTEL and GHCND data, with special focus on CloudSat snowfall product over the western U.S. mountainous regions. We first point out the pitfalls resulting from using either SNOTEL or GHCND data alone for the validation, then propose a new method by combining SNOTEL and GHCND data together with accounting for their stations’ elevation information. Finally, as an application of the new method, we compare the snowfall to total precipitation ratios derived from surface station data and satellite radar data.

2. Data

In this section, we describe the datasets used in this study, which include surface station data from SNOTEL and GHCND and satellite radar retrievals from CloudSat CPR and GPM DPR.

2.1. Surface Station Data

The SNOTEL network is designed by the United States Department of Agriculture to collect snowpack and related climate data in the western U.S. and Alaska. It provides fully automated data for high snow accumulation regions including many remote areas. Snow water equivalent measurements are made using snow pillows filled with an antifreeze solution. As snow accumulates, a pressure transducer monitors the pressure of the fluid and converts the pressure to snow water equivalent [3]. In addition, snow depth, all-season precipitation accumulation, and air temperature with daily maximums, minimums, and averages are available. Although the snow pillow provides hourly data, we only use daily snow measurements in this study. The daily snow accumulation is calculated by the difference in cumulative values between two consecutive days, and a negative snow accumulation value is screened out [41]. In this study, data from 768 SNOTEL stations in the western U.S. were used to compute annual mean snowfall rate covering the period of 2006 through 2017. In addition, total precipitation measured by gauges is also reported at each station. We computed rainfall using daily total precipitation minus snowfall for the purpose of deriving snowfall to precipitation ratio.
The GHCND dataset has provided daily climate data including maximum and minimum temperature, total daily precipitation, snowfall, and snow depth etc. over global land areas [40], although we only use data over the western U.S. in this study. The U.S. collection contains the most complete daily data including some of the 19th century observations [43] as well as the 21st century measurements from the U.S. Climate Reference Network. We converted the variable “snowfall” (daily snowfall depth) to snow water equivalent to make it comparable to snowfall quantity in other datasets by assuming snowpack density of 0.1 g cm−3 [44]. Only data that passed all quality assurance check as indicated in the dataset are included in the data analysis. The period covered in this study for annual mean snowfall rate calculation is from 2006 through 2017. In addition to snowfall, total precipitation reported at the GHCND stations was used for the computation of snowfall to precipitation ratio.

2.2. Satellite Data

The satellite retrievals to be validated are snowfall from CloudSat CPR. The CPR operates at W band with the minimum detectability of around −30 dBZ. Its high sensitivity to light snow and broad global coverage makes it a good candidate for snowfall retrievals. The radar reflectivity is sampled in the vertical with a bin size of 240 m. The footprint size of radar reflectivity profiles is 1.4 km cross track by 2.5 km along track. The standard snowfall product, 2C-SNOW-PROFILE (Version R05), was created from CPR radar reflectivity profiles based on [15].
To estimate the snowfall to total precipitation ratio, GPM DPR retrievals are also used for the estimation of rainfall. The DPR operates at Ku and Ka bands. The Ku radar swath has a width of 245 km and consists of 49 beams with a vertical resolution of 250 m in the normal scan mode. In this study, the normal scan mode data from the DPR level 2A precipitation retrievals at version 6 [45] are used. Since the minimum detectability of DPR is around 13 dBZ, it misses a large portion of light precipitation events [24]. Therefore, we used DPR only for rainfall estimates.
Though both CPR and DPR products have their intrinsic flag for precipitation type, the classification method they use is different. To conduct consistent phase determination across the CPR and DPR datasets, we applied the phase classification scheme developed by [46]. Meteorological variables collocated from the fifth generation European Centre for Medium-Range Weather Forecasts (ECMWF) reanalysis (ERA5, [47]) hourly reanalysis data at a resolution of 0.25° (latitude) × 0.25° (longitude) were used as inputs, including the 2-m temperature and dew point, surface pressure, and low-level lapse rate.
The key input variable into the phase classification scheme is the 2-m temperature. According to [48], the 30-km spatial resolution of ERA5 is inadequate to provide accurate 2-m temperature at the radar pixel scale of a few kilometers over the complex terrains. To mitigate this problem, we followed the topography correction method proposed by [48] to derive the 2-m temperature at the radar footprint. The Shuttle Radar Topography Mission dataset with 15 arcseconds (~417 m) resolution, SRTM15 [49], was used as topography reference. We first calculated the average elevation from SRTM15 at each ERA5 grid, and then computed the difference between the elevation at the radar pixels and corresponding ERA5 grids. Using the low-level lapse rate, we interpolated the 2-m temperature at surface level. The temperature difference before and after correction ranges from −10 to 10 K, which would substantially impact the precipitation phase determination. We used the 2-m temperature, relative humidity, and low-level lapse rate as inputs to the phase classification scheme of [46], which provides the conditional probability of solid precipitation. A probability of 50% was regarded as the threshold to separate rain and snow. Once the precipitation is classified, the snowfall rate in CPR and the rainfall rate in DPR products were selected for analysis.
The CloudSat snow product ranging from 2006 to 2017 was used for annual mean snowfall estimates. The snowfall near the surface cannot be reliably measured due to contamination by the ground clutters. So, after we decided the precipitation phase at surface to be solid, we used the lowest available snow retrieval as the surface snowfall rate. For surface rainfall estimates, we used the level-2A product, 2ADPR, “DPR precipitation” for the surface rainfall retrievals [45] covering 2015 to 2019 to compute the annual mean rainfall rate. Similar to CPR snowfall estimation, we first decided on the surface precipitation type at the time and location of the DPR radar pixel based on the phase classification algorithm [46]. Once rain was recognized, we used the precipitation retrieval at the lowest uncontaminated level as the surface rainfall estimate.
The precipitation observations were then sorted into 1° × 1° grids. The annual mean value is the total snowfall or rainfall divided by the total number of observations within each grid. To avoid uneven sampling among seasons, we averaged the rainfall or snowfall rates in every 5-day window for all available years, then computed the annual mean. The annual mean snowfall to total precipitation ratio is calculated as the annual mean snowfall rate divided by the annual mean precipitation rate, which is snowfall plus rainfall rates.

3. Results

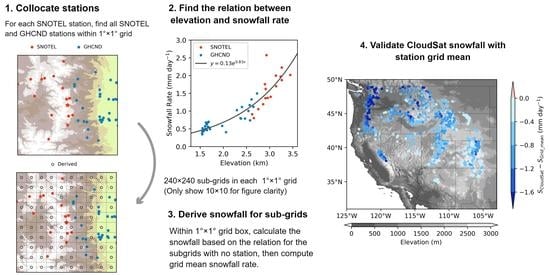
3.1. A Novel Approach for Satellite Snowfall Validation

As mentioned earlier, to obtain a statistically meaningful comparison between satellite radar and surface station measurements, we need to average data over a sufficiently long time and over a large enough area surrounding the surface station. In several tests of try and error, we found that we need to average the CloudSat data over an area of 1° (latitude) by 1° (longitude) for the entire observation record from mid-2006 to mid-2017 for the comparison statistics to be stable. Therefore, in the following discussions in this section we will use CloudSat data averaged over 1° × 1° for 2006 through 2017 to compare station mean data averaged during 2006–2017.
We first demonstrate the problem arising from using either SNOTEL or GHCND data alone to validate CloudSat snowfall retrievals. Figure 1 shows the annual means of (a) SNOTEL and (b) GHCND snowfall rates and the CloudSat minus (c) SNOTEL and (d) GHCND annual mean snowfall rates. The mean snowfall rates are generally larger at SNOTEL than at GHCND stations. As a result, CloudSat CPR mostly underestimates snowfall against SNOTEL while having a mixture of over- and underestimation against GHCND observations. One may suspect that this systematic difference is due to the inaccuracy of either SNOTEL or GHCND or both snowfall estimates. However, we argue in the following that it is largely caused by the elevation difference of these two types of stations.
Since SNOTEL collects data automatically, the stations can be placed in remote areas where frequent human access is not needed. However, GHCND stations are mostly conventional stations where routine manual measurements are required, and they are mostly located in the valleys for easy human access. This systematic difference of station elevations is shown in Figure 2. If snowfall intensity depends on station elevation, a systematic difference in annual mean snowfall between the two types of stations will occur. To test this hypothesis, we plot annual mean snowfall rates versus station elevation in Figure 3 using both SNOTEL and GHCND data. A clear trend of snowfall rate increasing with elevation can be observed, and the SNOTEL and GHCND data seem to follow the same increasing trend. Therefore, we argue that the systematic difference between SNOTEL and GHCND mean snowfall rates is not a result of observation error at the stations but rather caused by the systematic difference of station elevations. To further verify this hypothesis, we calculated the difference of mean snowfall rates for all SNOTEL-GHCND station pairs that are within 25 km horizontal distance and plotted the results in Figure 4 as a function of the elevation difference between the pair and SNOTEL station elevation. It is shown that the snowfall rate difference is near zero when the pair of stations are at the same elevation. The value of SNOTEL minus GHCND snowfall rates even becomes negative when the SNOTEL station is at a lower elevation than the GHCND station; the large positive values occur when the SNOTEL station is higher than the GHCND station.
To account for this snowfall dependency on elevation, a new validation dataset that combines the SNOTEL and GHCND data is created using the method as schematically shown in Figure 5. This is one of the 768 1° × 1° grids centered at SNOTEL stations examined in this study. First, we divide each 1° × 1° grid centered at a SNOTEL station into 240 × 240 sub-grids (Note that the number of sub-grids shown in Figure 5a is much less than 240 × 240 for figure clarity); the mean elevation of each sub-grid is determined by SRTM15 topography data. The relation between annual mean snowfall rate and elevation is derived from combined SNOTEL and GHCND data as shown in Figure 5b. This relation is used to fill the values at those sub-grids where there is neither SNOTEL nor GHCND stations. The 1° × 1° grid mean snowfall rate is then computed by averaging over values of all the sub-grids. This areal mean value will be used to compare with CloudSat snowfall observations within the 1° × 1° area centered at the SNOTEL location.
A key procedure in this method is to determine the mean snowfall rate versus elevation relation, which varies depending on locations. We carefully examined this relation for all the grids corresponding to the 768 SNOTEL stations; each grid was assigned a unique relation although some of them are quite similar. For most of the grids, we found that an exponential function fits the relation well. In Figure 6 we show several examples illustrating the typical shapes of the snowfall-elevation relation. A fitting curve (sometimes stepwised for a better fitting) is also shown in each figure, which is used to compute the snowfall rate in the sub-grids that are not occupied by either SNOTEL or GHCND stations. In the examples, (b) and (d) are from high mountain areas in Wyoming and Colorado. Snowfall rate increases with elevation in a relatively slow rate. There are about 1/3 of the 768 grids with a similar pattern. The two examples (e) and (f) in the Pacific West have much sharp increases of snowfall rates with elevations although the topography there merely reaches 2 km above sea level. There are also about 1/3 of the 768 grids with a similar pattern. The rest of the 1/3 grids have a pattern somewhere in between the previous two, similar to the ones shown in (a) and (c).
Essentially, this method is to mimic the grid mean as if ground stations are densely positioned in every sub-grid. It is noted that the gap-filling operation is not archived by spatial interpolation but rather by relying on the elevation dependence of climatological mean of snowfall. This elevation dependence seems to be a characteristic of snowfall precipitation as it is also reported over the Tibetan Plateau [48]. The mean snowfall rate so derived for a 1° × 1° grid should be more representative of that for the area measured by CloudSat, thus validation against this value is more meaningful. In the following discussions, this new value is referred to as “grid mean” snowfall rate.
In Figure 7 we show how much difference the above method makes in annual mean snowfall rates against original SNOTEL values. Overall, the grid mean snowfall rate is lowered by 0.43 mm day−1 (or 25%), averaged over all stations in the region. However, the sign of the changes is not uniformly distributed as it generally adjusts the value downward where the SNOTEL’s elevation is higher than its surrounding areas and vice versa.
CloudSat CPR retrievals are then compared with the grid mean snowfall rates, and the results are shown in Figure 8 and Figure 9. Recall that the CloudSat annual mean values are derived by averaging data from 2006 through 2017 over a 1° × 1° area centered at SNOTEL stations. In Figure 8, the comparison indicates that CloudSat underestimates snowfall for most of the grids in the west U.S. mountainous region. In Figure 9, the scatterplots show the difference and ratio between CloudSat retrieval and grid mean snowfall rate over a 1° × 1° area centered at SNOTEL station as a function of grid mean elevation or snowfall rates. It is seen that the bias or ratio does not seem to have a dependency on elevation. However, they strongly depend on snowfall rate–the higher the snowfall rate is, the larger the underestimation by CloudSat will be. When averaged over the grids around all the 768 SNOTEL stations, the bias of CloudSat estimates is about −0.85 mm day−1, which is −65% with respect to the grid mean snowfall rate estimated by the ground measurements. While further studies are needed, we suspect that this underestimation is largely a result of the space radar’s inability to obtain valid measurements close to the surface. The lowest level without ground contamination is often 1 km or higher above the ground, and snowfall rate often decreases with height in this region.

3.2. Investigation of the Snowfall to Precipitation Ratio

The change in snowfall to total precipitation ratio can serve as a useful indicator on how global warming impacts on hydrological cycle. In a recent study using present weather reports, Shi and Liu found that the ratio of snowfall to precipitation occurrence has been decreasing globally in the past 40 years while at high latitudes shows an increasing trend [50]. The ratio of snowfall to precipitation amount cannot be examined in their study because of the lack of snowfall data. Over the contiguous United States, Feng and Hu studied the ratio of snowfall to precipitation amount using the U.S. Historical Climatology Network (USHCN) data and found a decreasing trend over the past five decades in most of the regions [51]. However, similar to the GHCND data, the USHCN data used in their study are skewed toward the lowland areas where snowfall amounts are generally lower than those over high mountains. As an application of the new validation dataset created in this study, in this section we study the snowfall to precipitation ratio (hereafter, referred to as S/P ratio) over the west U.S. mountainous region and examine how well this ratio can be estimated from satellite radar observations.
To calculate S/P ratio, we first examine whether rainfall rates also have elevation dependence in this region. Similar to Figure 3 and Figure 4, in Figure 10a,b we show the scatterplot of annual mean rainfall rate observed at SNOTEL and GHCND stations versus elevation and the difference of snowfall rates between SNOTEL and GHCND station pairs that are within 25 km as a function of their station’s elevation difference. Unlike the case of snowfall, the annual mean rainfall rate does not show a clear dependency on elevation. We also examined SNOTEL and GHCND rainfall data in the 1° × 1° area surrounding the 768 SNOTEL stations. No clear elevation dependency is found either. Based on the above findings, we calculated the ground truth 1° × 1° grid mean rainfall simply by averaging all ground observations within the grid. The S/P ratio based on ground data was then computed by the grid mean snowfall rate and the average rainfall rate over a 1° × 1° area surrounding SNOTEL stations.
The regional distribution and elevation dependency of S/P ratio estimated by ground data are shown in Figure 11. S/P ratio is larger than 20% for most of the grids and there is a clear positive correlation between elevation and S/P ratio. Roughly, S/P ratio increases 25% with an increase of 1 km elevation. If the mean temperature lapse rate is 6.5 °C km−1, it translates to a roughly 4% S/P ratio change per every degree Celsius temperature change. Albeit rather crudely, this may be considered to be an observation-based estimate of the sensitivity of precipitation phase change to a warming environment.
Similar to the approach proposed by [48], we may estimate the S/P ratio based on the satellite radar data using CloudSat snowfall averaged from 2006 to 2017 and DPR rainfall averaged from 2014 to 2020. The S/P ratio maps estimated by satellite data and its dependency on elevation are shown in Figure 12. Compared to the results shown in Figure 11, although the satellite radar data derived elevation dependency of the S/P ratio is noisier in the scatterplot, the relation seems to follow a similar trend, i.e., about 20~25% increase in S/P ratio per every kilometer increase in elevation. The noisy relation may be improved by averaging data over a large area, for example, 1° × 2° as done by [48], which is beyond the scope of this study and will be examined in the future. The S/P ratio estimated from the satellite is somewhat lower (by 20% on average) than that estimated by ground data. Recall that CloudSat underestimates snowfall in this region by about 65% against ground measured grid mean values. The lower S/P ratio by satellite data is partially caused by the CloudSat snowfall underestimation. However, based on our evaluation, the GPM DPR retrievals also underestimate rainfall in this region by about 50%, possibly because the GPM rainfall, too, is derived from DPR reflectivity at levels of 1 km or above over actual surface. As a result, the S/P ratio underestimation becomes less severe than either the CloudSat snowfall or the GPM DPR rainfall underestimation.

4. Discussions

In this study, we proposed a new approach to validate satellite measured areal mean quantity by point station measurements. The novelty of this approach is that it utilizes the characteristic of climatological mean snowfall rate increasing with elevation, so that we can downscale the snowfall distribution with measurements at very sparsely distributed stations. Although the rate of increase of snowfall with elevation is different from location to location as shown in Figure 6, the general trend seems to be universal; it is true for the 768 SNOTEL locations we examined in this study and for the areal mean results in Tibetan Plateau as reported by [48]. It is noted that this trend is generally not true for rainfall, as shown in Figure 10. Therefore, the approach is not applicable to rainfall validations. It is also noted that the approach proposed here is conceptually different from spatial interpolation in filling measurement gaps, which uses the horizontal spatial pattern of measured quantities and needs the stations with known observables to be distributed relatively uniformly in the horizontal plane for a better interpolation. Our approach, however, uses the unique property of mean snowfall rate varying with elevation regardless of the horizontal distribution of existing stations. To the authors’ best knowledge, we are the first ones proposing this approach.
One other issue may be raised related to the time mismatch for snowfall and rainfall estimations in the computation of satellite derived S/P ratio in Section 3.2. CloudSat snowfall retrievals are available only from 2006 to 2017 and GPM DPR rainfall retrievals are available from March 2014 onward. To compute S/P ratio, we assumed that the mean of each retrieval in a 1° × 1° box represents the climatological mean of snowfall or rainfall, implying that the roughly 10-year mean of snowfall or the 6-year mean of rainfall is much greater than the difference of them between the two time periods. To test this assumption, we analyzed the relative difference of mean snowfall rates between the two time periods. The results are shown in Figure 13. The differences are generally less than 20% with both positive and negative values, resulting in the difference averaged for all stations almost canceling out (3% for SNOTEL and 0.4% for GHCND stations). Considering that we use 1° × 1° averaged satellite estimates to compute S/P ratio, the uncertainty of mean snowfall rate caused by the time difference should most likely be only a few percent, a value significantly smaller than the uncertainty of the retrievals. Song and Liu performed a similar analysis using ERA5 reanalysis data [48] for the Tibetan Plateau and reached a similar conclusion, i.e., the variation of multi-year mean of precipitation being far less than either the mean values themselves or the observational uncertainties. Therefore, the S/P ratio derived from the satellite data is still physically meaningful.
There are a few studies in the literature on comparing CloudSat snowfall product with surface station measurements [52,53,54], ground-based radar measurements [55,56,57,58], and model reanalysis [59,60,61]. Most of these studies are conducted over high latitudes. Among them, King [53] evaluated CloudSat snowfall product against four station measurements and three gridded snow water equivalent products throughout the Canadian Arctic and found that CloudSat has better performance north of 70°N, with underestimation compared to measurements at most of the stations and the reanalysis. Ryan et al. [61] derived a 15-km resolution snowfall climatology from CloudSat snowfall retrievals over Greenland ice sheet and concluded that CloudSat accumulation climatology has an uncertainty of ± 28% with respect to accumulation rates derived from ice cores. Edel et al. [60] compared CloudSat snowfall climatology with several reanalysis datasets and found that similar general geographical patterns are observed in all datasets, although there are significant mean snowfall rate differences over the Arctic between 58° and 82°N. Using conventional surface weather station data over Canada, Hiley et al. [52] found that CloudSat snowfall retrieval does not correlate well with surface station measurements, except for at some high latitude stations where CloudSat has more frequent sampling and mixed phase precipitation is less of an issue. While these studies indicate that CloudSat snowfall product is of great value in climate research, its accuracy is still unclear, and thus a quantitative assessment is still needed even in the high latitudes.
Validation of CloudSat snowfall over the midlatitudes, which is more relevant to this study, has been conducted using ground-based weather radar observations over the U.S. Of particular interest is the work done by Cao et al. [55], in which it is found that CloudSat underestimates heavier snowfall and the underestimation is well correlated to the snowfall intensity, a result that is consistent with the conclusion of this study. In a subsequent study, Chen et al. [56] found that there is a large discrepancy between CloudSat and surface radar snowfall estimates with a low correlation coefficient of only about 0.41, and the discrepancy seems to be related to snowfall intensity and the bin height where CloudSat surface snowfall is determined. On the other hand, Matrosov [57] compared the same surface weather measurements with CloudSat retrievals but resampled the surface radar data to match the bin height at which CloudSat snowfall is derived and found that the above correlation coefficient is much higher, being around 0.8 to 0.85 depending on the method used for the reflectivity to snowfall rate conversion. Therefore, it is argued that the discrepancy between CloudSat and surface radar retrievals is largely due to the CloudSat CPR’s inability to measure near surface snowfall because of the contamination of ground clutter. We argued the same point in this study and pointed out that this problem is particularly severe in the mountainous regions with the combination of orographic precipitation enhancement and the existence of satellite radar blind zone. Clearly, future verification of this speculation is needed with joint analysis of surface radar, weather station, SNOTEL, and CloudSat data.

5. Conclusions

This study aims at assessing the accuracy of CloudSat snowfall retrievals in the mountainous regions in the western U.S. using ground-based snowfall measurements. When validating the satellite radar snowfall retrievals, we found that the two sets of ground truth data have systematic differences with each other: the SNOTEL has significantly higher values of annual mean snowfall rate than the GHCND does. Further investigation indicates that this systematic difference is a result of SNOTEL stations being mostly placed at higher elevations than the GHCND stations, and snowfall is generally heavier at high than low elevations in the mountainous regions. Therefore, we conclude that neither SNOTEL nor GHCND dataset alone can correctly represent an areal mean of snowfall rate, thus it cannot be used to compare with the areal mean values of CloudSat retrieved snowfall.
To solve this problem, a novel approach is proposed in this study, in which all SNOTEL and GHCND station data within a 1° × 1° area are used to develop a snowfall rate versus elevation relation. This relation is then used to compute snowfall rate in other locations within the 1° × 1° area, mimicking that surface observations are available everywhere in the grid. Grid mean snowfall rates surrounding all SNOTEL stations are then derived, which should be more representative of the mean snowfall rate than those derived by either SNOTEL or GHCND dataset alone. The so-derived grid mean snowfall rates are compared with CloudSat retrieved mean snowfall rates in corresponding grids. The results show that the CloudSat product underestimates snowfall by about 65% when averaged over all the 768 grids in the west U.S. mountainous region. The bias occurs regardless of elevation but strongly depends on mean snowfall rates in the grid. That is, the heavier the mean snowfall is in a grid, the more severe the underestimation will be.
As an application of the so-derived grid mean snowfall, we further estimated the snowfall to precipitation ratio from both ground and satellite measured data. The satellite estimation is based on an approach proposed by [48] using CloudSat to estimate snowfall and GPM DPR to estimate rainfall. The general distributions of the surface and the satellite-based estimation of S/P ratio have similar horizontal pattern, although the satellite estimated S/P ratio is somewhat lower than the ground-based estimation. The increasing rates of S/P ratio with elevation derived from ground and satellite-based data are quite similar, being about 20–25% per kilometer up, which translates to approximately 4% per degree Celsius of temperature drop.
This study introduced a new approach to validate satellite precipitation retrievals by surface point measurements where the surface precipitation intensity around the stations is not randomly distributed but depends on some topographic features, such as elevation as shown in this study. Although we only demonstrated the usage of the method for snowfall validation in the western U.S., the same strategy can be applied elsewhere, should the precipitation pattern there show a clear dependency on a topographic feature.

Author Contributions

H.J., S.S. and G.L. contributed to data analysis and writing of the original manuscript. G.L. initiated and supervised the research. H.J. developed the snowfall versus elevation relations. S.S. analyzed the snowfall to precipitation ratio. All authors have read and agreed to the published version of the manuscript.

Funding

NASA grants 80NSSC19K0718 and NNX17AG73G.

Informed Consent Statement

Not applicable.

Data Availability Statement

SNOTEL data are available from the USDA: https://www.wcc.nrcs.usda.gov/snow/snotel-data.html (accessed on 10 January 2022). GHCND data are available from NOAA/NCDC: ftp://ftp.ncdc.noaa.gov/pub/data/ghcn/daily, (accessed on 10 January 2022). CloudSat data are available from CloudSat Data Processing Center at Colorado State University: https://www.cloudsat.cira.colostate.edu, (accessed on 5 August 2019). GPM data are available from NASA data center: https://gpm.nasa.gov/data (accessed on 18 June 2020). SRTM data are available from https://topex.ucsd.edu/WWW_html/srtm15_plus.html (accessed on 6 March 2021). ERA5 data are available from ECMWF: https://www.ecmwf.int/en/forecasts/datasets/reanalysis-datasets/era5, (accessed on 10 October 2021).

Acknowledgments

The authors would like to acknowledge the funding support from NASA under PMM grant 80NSSC19K0718 and CPEX grant NNX17AG73G. The authors thank the agencies that provide the SNOTEL, GHCND, CloudSat, GPM, SRTM, and ERA5 data. The authors would like to thank the three anonymous reviewers for valuable comments.

Conflicts of Interest

The authors declare no conflict of interest.

References

  1. Immerzeel, W.W.; Van Beek, L.P.H.; Bierkens, M.F.P. Climate change will affect the Asian water towers. Science 2010, 328, 1382–1385. [Google Scholar] [CrossRef]
  2. Bookhagen, B.; Burbank, D.W. Toward a complete Himalayan hydrological budget: Spatiotemporal distribution of snowmelt and rainfall and their impact on river discharge. J. Geophys. Res. Earth Surf. 2010, 115, 3019. [Google Scholar] [CrossRef] [Green Version]
  3. Serreze, M.C.; Clark, M.P.; Armstrong, R.L.; McGinnis, D.A.; Pulwarty, R.S. Characteristics of the western United States snowpack from snowpack telemetry (SNOTEL) data. Water Resour. Res. 1999, 35, 2145–2160. [Google Scholar] [CrossRef] [Green Version]
  4. Zemp, M.; Frey, H.; Gärtner-Roer, I.; Nussbaumer, S.U.; Hoelzle, M.; Paul, F.; Haeberli, W.; Denzinger, F.; Ahlstrøm, A.P.; Anderson, B.; et al. Historically unprecedented global glacier decline in the early 21st century. J. Glaciol. 2015, 61, 745–762. [Google Scholar] [CrossRef] [Green Version]
  5. Blunden, J.; Arndt, D.S. State of the climate in 2019. Bull. Am. Meteorol. Soc. 2020, 101, S1–S429. [Google Scholar] [CrossRef]
  6. Mote, P.W.; Hamlet, A.F.; Clark, M.P.; Lettenmaier, D.P. Declining mountain snowpack in western North America. Bull. Am. Meteorol. Soc. 2005, 86, 39–50. [Google Scholar] [CrossRef]
  7. Musselman, K.N.; Addor, N.; Vano, J.A.; Molotch, N.P. Winter melt trends portend widespread declines in snow water resources. Nat. Clim. Chang. 2021, 11, 418–424. [Google Scholar] [CrossRef] [PubMed]
  8. Burnett, A.W.; Kirby, M.E.; Mullins, H.T.; Patterson, W.P. Increasing Great Lake–effect snowfall during the Twentieth Century: A Regional Response to Global Warming? J. Clim. 2003, 16, 3535–3542. [Google Scholar] [CrossRef] [Green Version]
  9. Kunkel, K.E.; Palecki, M.; Ensor, L.; Hubbard, K.G.; Robinson, D.; Redmond, K.; Easterling, D. Trends in twentieth-century U.S. snowfall using a quality-controlled dataset. J. Atmos. Ocean. Technol. 2009, 26, 33–44. [Google Scholar] [CrossRef] [Green Version]
  10. Behrangi, A.; Tian, Y.; Lambrigtsen, B.H.; Stephens, G.L. What does CloudSat reveal about global land precipitation detection by other spaceborne sensors? Water Resour. Res. 2014, 50, 4893–4905. [Google Scholar] [CrossRef]
  11. Field, P.R.; Heymsfield, A.J. Importance of snow to global precipitation. Geophys. Res. Lett. 2015, 42, 9512–9520. [Google Scholar] [CrossRef] [Green Version]
  12. Kidd, C.; Levizzani, V. Status of satellite precipitation retrievals. Hydrol. Earth Syst. Sci. 2011, 15, 1109–1116. [Google Scholar] [CrossRef] [Green Version]
  13. Worley, S.J.; Woodruff, S.D.; Reynolds, R.W.; Lubker, S.J.; Lott, N. ICOADS Release 2.1 Data and products. Int. J. Climatol. 2005, 25, 823–842. [Google Scholar] [CrossRef]
  14. Iguchi, T.; Haddad, Z.S. Introduction to radar rain retrieval methods. Adv. Glob. Chang. Res. 2020, 67, 169–182. [Google Scholar] [CrossRef]
  15. Wood, N.B.; L’Ecuyer, T.S. Level 2C Snow Profile Process Description and Interface Control Document, Product Version P1_R05. NASA JPL CloudSat Project Document Revision 0. 2018. Available online: https://www.cloudsat.cira.colostate.edu/cloudsat-static/info/dl/2c-snow-profile/2C-SNOW-PROFILE_PDICD.P1_R05.rev0_.pdf (accessed on 10 January 2022).
  16. Kummerow, C.D.; Randel, D.L.; Kulie, M.; Wang, N.Y.; Ferraro, R.; Munchak, S.J.; Petkovic, V. The evolution of the Goddard profiling algorithm to a fully parametric scheme. J. Atmos. Ocean. Technol. 2015, 32, 2265–2280. [Google Scholar] [CrossRef]
  17. Grecu, M.; Olson, W.S.; Munchak, S.J.; Ringerud, S.; Liao, L.; Haddad, Z.; Kelley, B.L.; Mclaughlin, S.F. The GPM combined algorithm. J. Atmos. Ocean. Technol. 2016, 33, 2225–2245. [Google Scholar] [CrossRef]
  18. Huffman, G.J.; Adler, R.F.; Bolvin, D.T.; Gu, G.; Nelkin, E.J.; Bowman, K.P.; Hong, Y.; Stocker, E.F.; Wolff, D.B. The TRMM Multisatellite Precipitation Analysis (TMPA): Quasi-global, multiyear, combined-sensor precipitation estimates at fine scales. J. Hydrometeorol. 2007, 8, 38–55. [Google Scholar] [CrossRef]
  19. Joyce, R.J.; Xie, P. Kalman filter–based CMORPH. J. Hydrometeorol. 2011, 12, 1547–1563. [Google Scholar] [CrossRef]
  20. Kubota, T.; Aonashi, K.; Ushio, T.; Shige, S.; Takayabu, Y.N.; Kachi, M.; Arai, Y.; Tashima, T.; Masaki, T.; Kawamoto, N.; et al. Global Satellite Mapping of Precipitation (GSMaP) products in the GPM era. Adv. Glob. Chang. Res. 2020, 67, 355–373. [Google Scholar] [CrossRef]
  21. Ebtehaj, A.M.; Bras, R.L.; Foufoula-Georgiou, E. Evaluation of ShARP passive rainfall retrievals over snow-covered land surfaces and coastal zones. J. Hydrometeorol. 2016, 17, 1013–1029. [Google Scholar] [CrossRef]
  22. Stephens, G.L.; Vane, D.G.; Boain, R.J.; Mace, G.G.; Sassen, K.; Wang, Z.; Illingworth, A.J.; O’Connor, E.J.; Rossow, W.B.; Durden, S.L.; et al. The CloudSat mission and the A-Train: A new dimension of space-based observations of clouds and precipitation. Bull. Am. Meteorol. Soc. 2002, 83, 1771–1790. [Google Scholar] [CrossRef] [Green Version]
  23. Casella, D.; Panegrossi, G.; Sanò, P.; Marra, A.C.; Dietrich, S.; Johnson, B.T.; Kulie, M.S. Evaluation of the GPM-DPR snowfall detection capability: Comparison with CloudSat-CPR. Atmos. Res. 2017, 197, 64–75. [Google Scholar] [CrossRef]
  24. Adhikari, A.; Liu, C.; Kulie, M.S. Global distribution of snow precipitation features and their properties from 3 years of GPM observations. J. Clim. 2018, 31, 3731–3754. [Google Scholar] [CrossRef]
  25. Liu, G. Radar snowfall measurement. Adv. Glob. Chang. Res. 2020, 67, 277–295. [Google Scholar] [CrossRef]
  26. Derin, Y.; Anagnostou, E.; Berne, A.; Borga, M.; Boudevillain, B.; Buytaert, W.; Chang, C.-H.; Delrieu, G.; Hong, Y.; Hsu, Y.C.; et al. Multiregional satellite precipitation products evaluation over complex terrain. J. Hydrometeorol. 2016, 17, 1817–1836. [Google Scholar] [CrossRef]
  27. Navarro, A.; García-Ortega, E.; Merino, A.; Sánchez, J.L.; Kummerow, C.; Tapiador, F.J. Assessment of IMERG precipitation estimates over Europe. Remote Sens. 2019, 11, 2470. [Google Scholar] [CrossRef] [Green Version]
  28. Rasmussen, R.; Baker, B.; Kochendorfer, J.; Meyers, T.; Landolt, S.; Fischer, A.P.; Black, J.; Thériault, J.M.; Kucera, P.; Gochis, D.; et al. How well are we measuring snow: The NOAA/FAA/NCAR winter precipitation test bed. Bull. Am. Meteorol. Soc. 2012, 93, 811–829. [Google Scholar] [CrossRef] [Green Version]
  29. Schneider, U.; Becker, A.; Finger, P.; Meyer-Christoffer, A.; Ziese, M.; Rudolf, B. GPCC’s new land surface precipitation climatology based on quality-controlled in situ data and its role in quantifying the global water cycle. Theor. Appl. Climatol. 2013, 115, 15–40. [Google Scholar] [CrossRef] [Green Version]
  30. Behrangi, A.; Gardner, A.; Reager, J.T.; Fisher, J.B.; Yang, D.; Huffman, G.J.; Adler, R.F. Using GRACE to estimate snowfall accumulation and assess gauge undercatch corrections in high latitudes. J. Clim. 2018, 31, 8689–8704. [Google Scholar] [CrossRef]
  31. Habib, E.; Ciach, G.J.; Krajewski, W.F. A method for filtering out raingauge representativeness errors from the verification distributions of radar and raingauge rainfall. Adv. Water Resour. 2004, 27, 967–980. [Google Scholar] [CrossRef]
  32. Wang, J.; Wolff, D.B. Evaluation of TRMM ground-validation radar-rain errors using rain gauge measurements. J. Appl. Meteorol. Climatol. 2010, 49, 310–324. [Google Scholar] [CrossRef] [Green Version]
  33. Dinku, T.; Chidzambwa, S.; Ceccato, P.; Connor, S.J.; Ropelewski, C.F. Validation of high-resolution satellite rainfall products over complex terrain. Int. J. Remote Sens. 2008, 29, 4097–4110. [Google Scholar] [CrossRef]
  34. Hu, Q.; Yang, D.; Li, Z.; Mishra, A.K.; Wang, Y.; Yang, H. Multi-scale evaluation of six high-resolution satellite monthly rainfall estimates over a humid region in China with dense rain gauges. Int. J. Remote Sens. 2014, 35, 1272–1294. [Google Scholar] [CrossRef]
  35. Barros, A.P.; Arulraj, M. Remote sensing of orographic precipitation. Adv. Glob. Chang. Res. 2020, 69, 559–582. [Google Scholar] [CrossRef]
  36. National Operational Hydrologic Remote Sensing Center. Snow Data Assimilation System (SNODAS) Data Products at NSIDC, Version 1; NSIDC: National Snow and Ice Data Center: Boulder, CO, USA, 2004. [CrossRef]
  37. Du, J. NCEP/EMC 4 Km Gridded Data (GRIB) Stage IV Data. Version 1.0; UCAR/NCAR—Earth Observing Laboratory: Boulder, CO, USA, 2011. [Google Scholar] [CrossRef]
  38. Zhang, J.; Howard, K.; Langston, C.; Kaney, B.; Qi, Y.; Tang, L.; Grams, H.; Wang, Y.; Cocks, S.; Martinaitis, S.; et al. Multi-Radar Multi-Sensor (MRMS) quantitative precipitation estimation: Initial operating capabilities. Bull. Am. Meteorol. Soc. 2016, 97, 621–638. [Google Scholar] [CrossRef]
  39. USDA Natural Resources Conservation Service. SNOwpack TELemetry Network (SNOTEL). NRCS. 2021. Available online: https://data.nal.usda.gov/dataset/snowpack-telemetry-network-snotel (accessed on 10 January 2022).
  40. Menne, M.J.; Durre, I.; Vose, R.S.; Gleason, B.E.; Houston, T.G. An overview of the global historical climatology network-daily database. J. Atmos. Ocean. Technol. 2012, 29, 897–910. [Google Scholar] [CrossRef]
  41. Wen, Y.; Behrangi, A.; Lambrigtsen, B.; Kirstetter, P.-E. Evaluation and uncertainty estimation of the latest radar and satellite snowfall products using SNOTEL measurements over mountainous regions in western United States. Remote Sens. 2016, 8, 904. [Google Scholar] [CrossRef] [Green Version]
  42. Song, Y.; Broxton, P.D.; Ehsani, M.R.; Behrangi, A. Assessment of snowfall accumulation from satellite and reanalysis products using SNOTEL observations in Alaska. Remote Sens. 2021, 13, 2922. [Google Scholar] [CrossRef]
  43. Dupigny-Giroux, L.A.; Ross, T.F.; Elms, J.D.; Truesdell, R.; Doty, S.R. NOAA’S climate database modernization program: Rescuing, archiving, and digitizing history. Bull. Am. Meteorol. Soc. 2007, 88, 1015–1017. [Google Scholar] [CrossRef]
  44. Potter, J.G. Water Content of Freshly Fallen Snow; CIR-4232, TEC-569; Meteorological Branch of the Canadian Department of Transport: Toronto, ON, Canada, 1965; p. 12. [Google Scholar]
  45. Iguchi, T.; Seto, S.; Meneghini, R.; Yoshida, N.; Awaka, J.; Le, M.; Chandrasekar, V.; Brodzik, S.; Kubota, T. GPM/DPR Level-2 Algorithm Theoretical Basis Document. JAXA–NASA Technical Report. 2017. Available online: http://www.eorc.jaxa.jp/GPM/doc/algorithm/ATBD_DPR_201708_whole_1.pdf (accessed on 10 January 2022).
  46. Sims, E.M.; Liu, G. A parameterization of the probability of snow-rain transition. J. Hydrometeorol. 2015, 16, 1466–1477. [Google Scholar] [CrossRef]
  47. Hersbach, H.; Bell, B.; Berrisford, P.; Hirahara, S.; Horányi, A.; Muñoz-Sabater, J.; Nicolas, J.; Peubey, C.; Radu, R.; Schepers, D.; et al. The ERA5 global reanalysis. Q. J. R. Meteorol. Soc. 2020, 146, 1999–2049. [Google Scholar] [CrossRef]
  48. Song, P.; Liu, G. Partitioning solid and liquid precipitation over the Tibetan Plateau based on satellite radar observations. J. Hydrometeorol. 2021, 22, 2861–2875. [Google Scholar] [CrossRef]
  49. Tozer, B.; Sandwell, D.T.; Smith, W.H.F.; Olson, C.; Beale, J.R.; Wessel, P. Global bathymetry and topography at 15 arc sec: SRTM15+. Earth Sp. Sci. 2019, 6, 1847–1864. [Google Scholar] [CrossRef]
  50. Shi, S.; Liu, G. The latitudinal dependence in the trend of snow event to precipitation event ratio. Sci. Rep. 2021, 11, 18112. [Google Scholar] [CrossRef] [PubMed]
  51. Feng, S.; Hu, Q. Changes in winter snowfall/precipitation ratio in the contiguous United States. J. Geophys. Res. Atmos. 2007, 112, 15109. [Google Scholar] [CrossRef]
  52. Hiley, M.J.; Kulie, M.S.; Bennartz, R. Uncertainty analysis for CloudSat snowfall retrievals. J. Appl. Meteorol. Climatol. 2011, 50, 399–418. [Google Scholar] [CrossRef]
  53. King, F. Validating CloudSat-CPR Retrievals for the Estimation of Snow Accumulation in the Canadian Arctic. UWSpace. 2018. Available online: https://hdl.handle.net/10012/1436 (accessed on 10 January 2022).
  54. Kodamana, R.; Fletcher, C.G. Validation of CloudSat-CPR derived precipitation occurrence and phase estimates across Canada. Atmosphere 2021, 12, 295. [Google Scholar] [CrossRef]
  55. Cao, Q.; Hong, Y.; Chen, S.; Gourley, J.J.; Zhang, J.; Kirstetter, P.E. Snowfall detectability of NASA’s CloudSat: The first cross-investigation of its 2C-Snow-Profile product and National Muti-Sensor Mosaic QPE (NMQ) snowfall data. Prog. Electromagn. Res. 2014, 148, 55–61. [Google Scholar] [CrossRef]
  56. Chen, S.; Hong, Y.; Kulie, M.; Behrangi, A.; Stepanian, P.M.; Cao, Q.; You, Y.; Zhang, J.; Hu, J.; Zhang, X. Comparison of snowfall estimates from the NASA CloudSat Cloud Profiling Radar and NOAA/NSSL Multi-Radar Multi-Sensor system. J. Hydrol. 2016, 541, 862–872. [Google Scholar] [CrossRef]
  57. Matrosov, S.Y. Comparative evaluation of snowfall retrievals from the CloudSat W-band radar using ground-based weather radars. J. Atmos. Ocean. Tech. 2019, 36, 101–111. [Google Scholar] [CrossRef]
  58. Souverijns, N.; Gosart, A.; Lhermitte, S.; Gorodetskaya, I.V.; Grazioli, J.; Berne, A.; Duran-Alarcon, C.; Boudevillain, B.; Genthon, C.; Scarchilli, C.; et al. Evaluation of the CloudSat surface snowfall product over Antarctica using ground-based precipitation radars. Cryosphere 2018, 12, 3775–3789. [Google Scholar] [CrossRef] [Green Version]
  59. Liu, Y.; Li, F.; Hao, W.; Barriot, J.-P.; Wang, Y. Evaluation of synoptic snowfall on the Antarctic ice sheet based on CloudSat, in-situ observations and atmospheric reanalysis datasets. Remote Sens. 2019, 11, 1686. [Google Scholar] [CrossRef] [Green Version]
  60. Edel, L.; Claud, C.; Genthon, C.; Palerme, C.; Wood, N.; L’Ecuyer, T.; Bromwich, D. Arctic snowfall from CloudSat observations and reanalyses. J. Clim. 2020, 33, 2093–2109. [Google Scholar] [CrossRef]
  61. Ryan, J.C.; Smith, L.C.; Wu, M.; Cooley, S.W.; Miège, C.; Montgomery, L.N.; Koenig, L.S.; Fettweis, X.; Noel, B.P.Y.; van den Broeke, M.R. Evaluation of CloudSat’s cloud-profiling radar for mapping snowfall rates across the Greenland Ice Sheet. J. Geophys. Res. Atmos. 2020, 125, e2019JD031411. [Google Scholar] [CrossRef]
Figure 1. Station mean snowfall rates for (a) SNOTEL and (b) GHCND, and the difference of (c) CloudSat minus SNOTEL and (d) CloudSat minus GHCND over the western U.S. region. CloudSat data are averaged over 1° × 1° grid.
Remotesensing 14 00434 g001
Figure 2. Distribution of the elevations: (a) SNOTEL and (b) GHCND stations.
Remotesensing 14 00434 g002
Figure 3. Annual mean snowfall rate versus station elevation for both SNOTEL (red) and GHCND (blue) stations.
Remotesensing 14 00434 g003
Figure 4. Two-dimensional histogram of annual mean snowfall rate difference between SNOTEL-GHCND station pairs that are within 25 km horizontal distance as a function of station elevation difference (ZSNOTEL−ZGHCND) and SNOTEL station elevation (ZSNOTEL). Positive values indicate that snowfall rate is higher at SNOTEL than at GHCND station.
Remotesensing 14 00434 g004
Figure 5. (a) Schematic of the method to generate grid mean snowfall rate. The star at the center of the left diagram is the SNOTEL station to be focused on. Red circles are locations of other SNOTEL stations. Blue circles are GHCND stations. Snowfall rate versus elevation relation is derived by data from all SNOTEL and GHCND stations within the 1° × 1° area as shown in the diagram on the right. (b) The exponential fitting is applied with the fitting function shown in the legend. The 1° × 1° area is divided into 240 × 240 sub-grids. Note that the number of sub-grids shown in (a) is much less than 240 × 240 for figure clarity. The derived snowfall rate versus elevation relation will be used to compute snowfall rate at sub-grid without a SNOTEL or GHCND station, shown as black empty circles in (a).
Remotesensing 14 00434 g005
Figure 6. Examples of snowfall rate versus elevation relations.
Remotesensing 14 00434 g006
Figure 7. The difference between 1° × 1° grid mean (SGrid_mean) and original SNOTEL (SSNOTEL) snowfall rates. The adjustment has both positive and negative values although there are more stations with downward adjustments.
Remotesensing 14 00434 g007
Figure 8. The difference between CloudSat (SCloudSat) and 1° × 1° grid mean (SGrid_mean) snowfall rates.
Remotesensing 14 00434 g008
Figure 9. Scatterplots of the difference (a,b) and the ratio (c,d) between CloudSat retrieval (SCloudSat) and grid mean snowfall rates (SGrid_mean) over 1° × 1° grids centered at SNOTEL locations.
Remotesensing 14 00434 g009
Figure 10. (a) Scatterplot of annual mean rainfall rate observed at SNOTEL and GHCND stations versus station elevation and (b) the 2-dimensional histogram of the difference of snowfall rates between SNOTEL and GHCND station pairs that are within 25 km as a function of station elevation difference (ZSNOTEL−ZGHCND) and SNOTEL station elevation (ZSNOTEL).
Remotesensing 14 00434 g010
Figure 11. (a) Distribution and (b) elevation dependency of snowfall to precipitation (S/P) ratio estimated using ground-based SNOTEL and GHCND data.
Remotesensing 14 00434 g011
Figure 12. Same as Figure 11 but estimated using satellite radar observations.
Remotesensing 14 00434 g012
Figure 13. Percentage difference of mean snowfall rates between the time periods of 2006–2017 and 2014–2020 for (a) SNOTEL and (b) GHCND stations. The percentage difference is defined by the difference divided by the means of snowfall rate during the two time periods.
Remotesensing 14 00434 g013
Publisher’s Note: MDPI stays neutral with regard to jurisdictional claims in published maps and institutional affiliations.

