Article

Capability of GPM IMERG Products for Extreme Precipitation Analysis over the Indonesian Maritime Continent

1
Department of Physics, Universitas Andalas, Padang 25163, Indonesia
2
Department of Physics, Universitas Gajah Mada, Yogyakarta 55281, Indonesia
3
Agency for Meteorology, Climatology and Geophysics of Republic Indonesia, Jakarta 10610, Indonesia
4
Department of Environment, Land and Infrastructure Engineering, Politecnico of Turin, 10129 Turin, Italy
5
Research Institute for Sustainable Humanosphere (RISH), Kyoto University, Gokasho, Uji, Kyoto 611-0011, Japan
*
Author to whom correspondence should be addressed.
Remote Sens. 2022, 14(2), 412; https://doi.org/10.3390/rs14020412
Submission received: 19 November 2021 / Revised: 11 January 2022 / Accepted: 13 January 2022 / Published: 17 January 2022
(This article belongs to the Special Issue Radar Remote Sensing of Cloud and Precipitation)

Abstract

:
Integrated Multi-satellite Retrievals for GPM (IMERG) data have been widely used to analyze extreme precipitation, but the data have never been validated for the Indonesian Maritime Continent (IMC). This study evaluated the capability of IMERG Early (E), Late (L), and Final (F) data to observe extreme rain in the IMC using the rain gauge data within five years (2016–2020). The capability of IMERG in the observation of the extreme rain index was evaluated using Kling–Gupta efficiency (KGE) matrices. The IMERG well captured climatologic characteristics of the index of annual total precipitation (PRCPTOT), number of wet days (R85p), number of very wet days (R95p), number of rainy days (R1mm), number of heavy rain days (R10mm), number of very heavy rain days (R20mm), consecutive dry days (CDD), and max 5-day precipitation (RX5day), indicated by KGE value >0.4. Moderate performance (KGE = 0–0.4) was shown in the index of the amount of very extremely wet days (R99p), the number of extremely heavy precipitation days (R50mm), max 1-day precipitation (RX1day), and Simple Daily Intensity Index (SDII). Furthermore, low performance of IMERG (KGE < 0) was observed in the consecutive wet days (CWDs) index. Of the 13 extreme rain indices evaluated, IMERG underestimated and overestimated precipitation of nine and four indexes, respectively. IMERG tends to overestimate precipitation of indexes related to low rainfall intensity (e.g., R1mm). The highest overestimation was observed in the CWD index, related to the overestimation of light rainfall and the high false alarm ratio (FAR) from the daily data. For all indices of extreme rain, IMERG showed good capability to observe extreme rain variability in the IMC. Overall, IMERG-L showed a better capability than IMERG-E and -F but with an insignificant difference. Thus, the data of IMERG-E and IMERG-L, with a more rapid latency than IMERG-F, have great potential to be used for extreme rain observation and flood modeling in the IMC.

1. Introduction

Since the last decades, Earth’s extreme climate events have been exacerbated by the continuous increase of temperatures [1]. The increasing trend of extreme rain is one aspect of extreme climate [2] and is expected to continue in all parts of the world for the following decades as projected by climate models [2,3]. The increase in both the intensity and the frequency of the extreme rain shows distinctive patterns in different regions around the world [4,5,6]. In general, the increase of the extreme rain intensity is more prevalent in comparison to the increase of the extreme rain frequency [5], with trends in the increase of the extreme rain intensity driven by the total amount of precipitation in a given region. The higher increase tends to occur in regions with an abundance of water resources [7].
Extreme rains are strictly correlated to hydrometeorological disasters such as floods and landslides [8,9,10,11]. These hydrometeorological disasters often bring great social and economic losses to communities [12,13,14]. Hence, there is the need for accurate observations of extreme rainfall. The accurate observation of extreme rainfall is vital to identify the patterns, changes, and mechanisms of extreme rainfall in a region. This information is also critical in order to mitigate any hydrometeorological disasters and to plan for sustainable development.
The Indonesian Maritime Continent (IMC), located between the Indian Ocean and the Pacific Ocean and stretching along the equator with high intensity of solar radiation throughout the year, is an area characterized by high annual rainfall [15], with frequent high-intensity rain events [16,17,18,19,20]. Additionally, the IMC’s vulnerability to hydrometerological hazards means that such extreme rains frequently bring huge economic and human losses [21,22,23]. In 2020, the Indonesian National Board for Disaster Management (BNPB) noted that 55.18% of disasters that occurred in the IMC were hydrometeorology-related (e.g., floods, landslides, and droughts). As recorded, hydrometeorological disasters have had an impact on more than 5.4 million people in the IMC, with natural disasters being the leading cause of death in 2020 [24]. For the Maritime Continent (MC) area, the number of losses due to hydrometeorological disasters is expected to increase in the future along with the increasing number of extreme rain events as indicated by climate model projections of increasing extreme rain intensity (R50mm), maximum daily rainfall intensity (RX1day), and the number of consecutive dry days (CDDs) [25,26]. The mitigation of the impacts of hydrometeorological disasters caused by extreme rains in the IMC can be done by adopting countermeasures based on accurate predictions and supported by the availability of fine spatio-temporal resolution observations.
The analysis of the extreme rain can be done through several types of observational data and weather model outputs. Rain can be measured directly and indirectly using rain gauges and remote sensing techniques. The two most commonly used ground-based instruments are the rain gauge and the weather radar. Rain gauges are easy to operate and maintain, so this instrument is widely used for quantitative observations of rainfall made by weather services [27]. Rain gauge observations have been reprocessed with consistent correction procedures for a very long time and made available for climatological applications, including for observations of extreme rain [28,29]. Several studies have estimated the index of extreme rain in the IMC using rain gauge data [17,30]. However, rain gauge observations are limited to a given location, and most rain gauge data from weather services are stored on a daily scale. Extreme precipitation often takes place over short space (e.g., sub-kilometer) and time (e.g., sub-hourly) scales that are rarely resolved by daily precipitation observations from rain gauge networks, and such extreme precipitation can be observed by weather radars [31]. While the best accuracy of extreme rain observation can be obtained from a rain gauge, for areas with low rain gauge densities, such as in the IMC, rain-gauge-based observations of extreme rain at high spatial resolution are very limited [32]. Ground-based radars, which estimate precipitation based on electromagnetic waves energy reflected by precipitation particles in the atmosphere, provide areal precipitation estimates at high spatial (e.g., 1–2 km) and temporal resolutions (e.g., 5–10 min) [33]. Therefore, radar can offer an interesting alternative to rain gauge observation. In the IMC, comprehensive weather radar observations have only started in the last few years and have not covered all areas, especially the oceans [34]. Therefore, observations of extreme rain in IMC using weather radar are limited to certain cases [e.g., 35], and studies on the climatology of extreme precipitation in IMC based on weather radar data are not available. Another ground-based remote sensing instrument that can be used to estimate precipitation is lidar. Lidar uses laser energy to observe atmospheric backscattering as a function of range. Although lidar is designed to measure a specific atmospheric variable, including particles (aerosols), clouds, smoke, wind speed, and even the densities of oxygen or nitrogen, it is possible to estimate rainfall using lidar. The reliability of lidar to estimate rainfall depends on the intensity of the precipitation, and there have been several techniques to estimate rainfall from lidar data [36,37,38]. However, the use of lidar for rain observations, including extreme rain, is still very limited because of the sparseness of instrument observations. In the IMC, there were several lidar observations, but they were limited to a specific time period and location [e.g., 39]. Due to ground-based remote sensing observation limitations, data from earth-observing satellites are often used to provide precipitation data at a global scale, including in the IMC. Precipitation data from the satellite are beneficial for filling in data gaps that exist between rain gauge and ground-based remote sensing sites. Rainfall data from satellites have high spatial and temporal resolutions and can potentially be used for model validation and extreme rainfall observations at large scales. These data have been used extensively, including for extreme rain observations in the IMC [40,41,42]. However, such satellite observations still have several shortcomings in terms of the accuracy of the rainfall values obtained, particularly for extreme rain [43]. In addition to using observation data, extreme rain can also be studied using weather model results. Several studies have investigated extreme rainfall in the IMC using weather model outputs [25,26]. Model projections can provide predictions of extreme rain for the next few decades, but they require very high computational costs, especially for high spatial and temporal resolution runs [44], whose accuracy must be assessed using fine spatial and temporal resolution observation data [45].
The use of satellite rainfall data with high spatio-temporal resolution is commonly exploited in the validation of extreme rainfall analysis of regional weather models. Climate Hazards Group InfraRed Precipitation with Station data (CHIRPS) and TRMM (Tropical Rainfall Measuring Mission) Multi-satellite Precipitation Analysis (TMPA) data have been used for the Southeast Asia region [21,23]. The use of CHIRPS and TMPA was based upon their performance in extreme rain observations [43,46]. TMPA has also been used in the validation of rainfall simulation models in other regions [47,48,49]. The TRMM satellite stopped operating in 2015 and has been replaced by the Global Precipitation Measurement (GPM) satellite; correspondingly the TMPA product has been replaced by the Integrated Multi-satellite Retrievals for GPM (IMERG) product. A number of studies showed better performances of IMERG, particularly in the Maritime Continent (MC) [46,50,51]. In addition, the IMERG has a half-hourly temporal resolution and a spatial resolution of 0.1 degrees compared to the 3 hour temporal resolution and the 0.25 degree spatial resolution of TMPA [52]. In terms of spatial coverage, IMERG also shows a wider coverage, i.e., 60 S–60 N, while TMPA only covers 50 S–50 N. This highlights that IMERG data have great potential in observing the characteristics of extreme rain and acting as a validator for weather models in IMC. However, the quality of IMERG products in extreme rain must first be thoroughly assessed.
The validation of the IMERG’s ability in observing extreme rain has been carried out in several climate areas [43,53,54,55,56,57,58,59]. All of these studies showed that IMERG is very effective in extreme rain observations, but each study showed diverse performances. IMERG underestimated the extreme rainfall in Mexico [57] but overestimated it in Austria [59]. In addition, several regions also showed that the accuracy of IMERG in extreme rain observation has huge spatial variability [43,53,54,55,56]. In the Maritime Continent (MC) area, the validation of extreme rain has been carried out for Malaysia and Philippines [58]. The study found that IMERG overestimated the rainfall above the 95th percentile in Malaysia and the Philippines. Because of the different performances of the IMERG product in observing extreme rain in various regions, there is a need for more evaluations in other areas, including the IMC.
This study aimed to evaluate the ability of the GPM IMERG product in observing extreme rain in the IMC by using rain gauge data for a 5-year observation period (2016–2020). Validation was carried out on the latest version of IMERG (V06) for IMERG data types (Early, Late, and Final), whereas previous research in MC was only focused on the data of IMERG Final [58,60,61]. The main difference of the three data types is related to the delay in data availability, where Early data and Late data have a delay of 4 and 12 hours respectively, while Final data has a delay of 2.5–3.5 months [52]. The short delay in data availability from the data of IMERG Early and Late can be used as an early detection of disasters caused by extreme rain. This information about the accuracy of IMERG’s extreme rain observation is expected to be used as feedback to improve the performance of the IMERG algorithm in observing extreme rain, especially in the IMC.

2. Materials and Methods

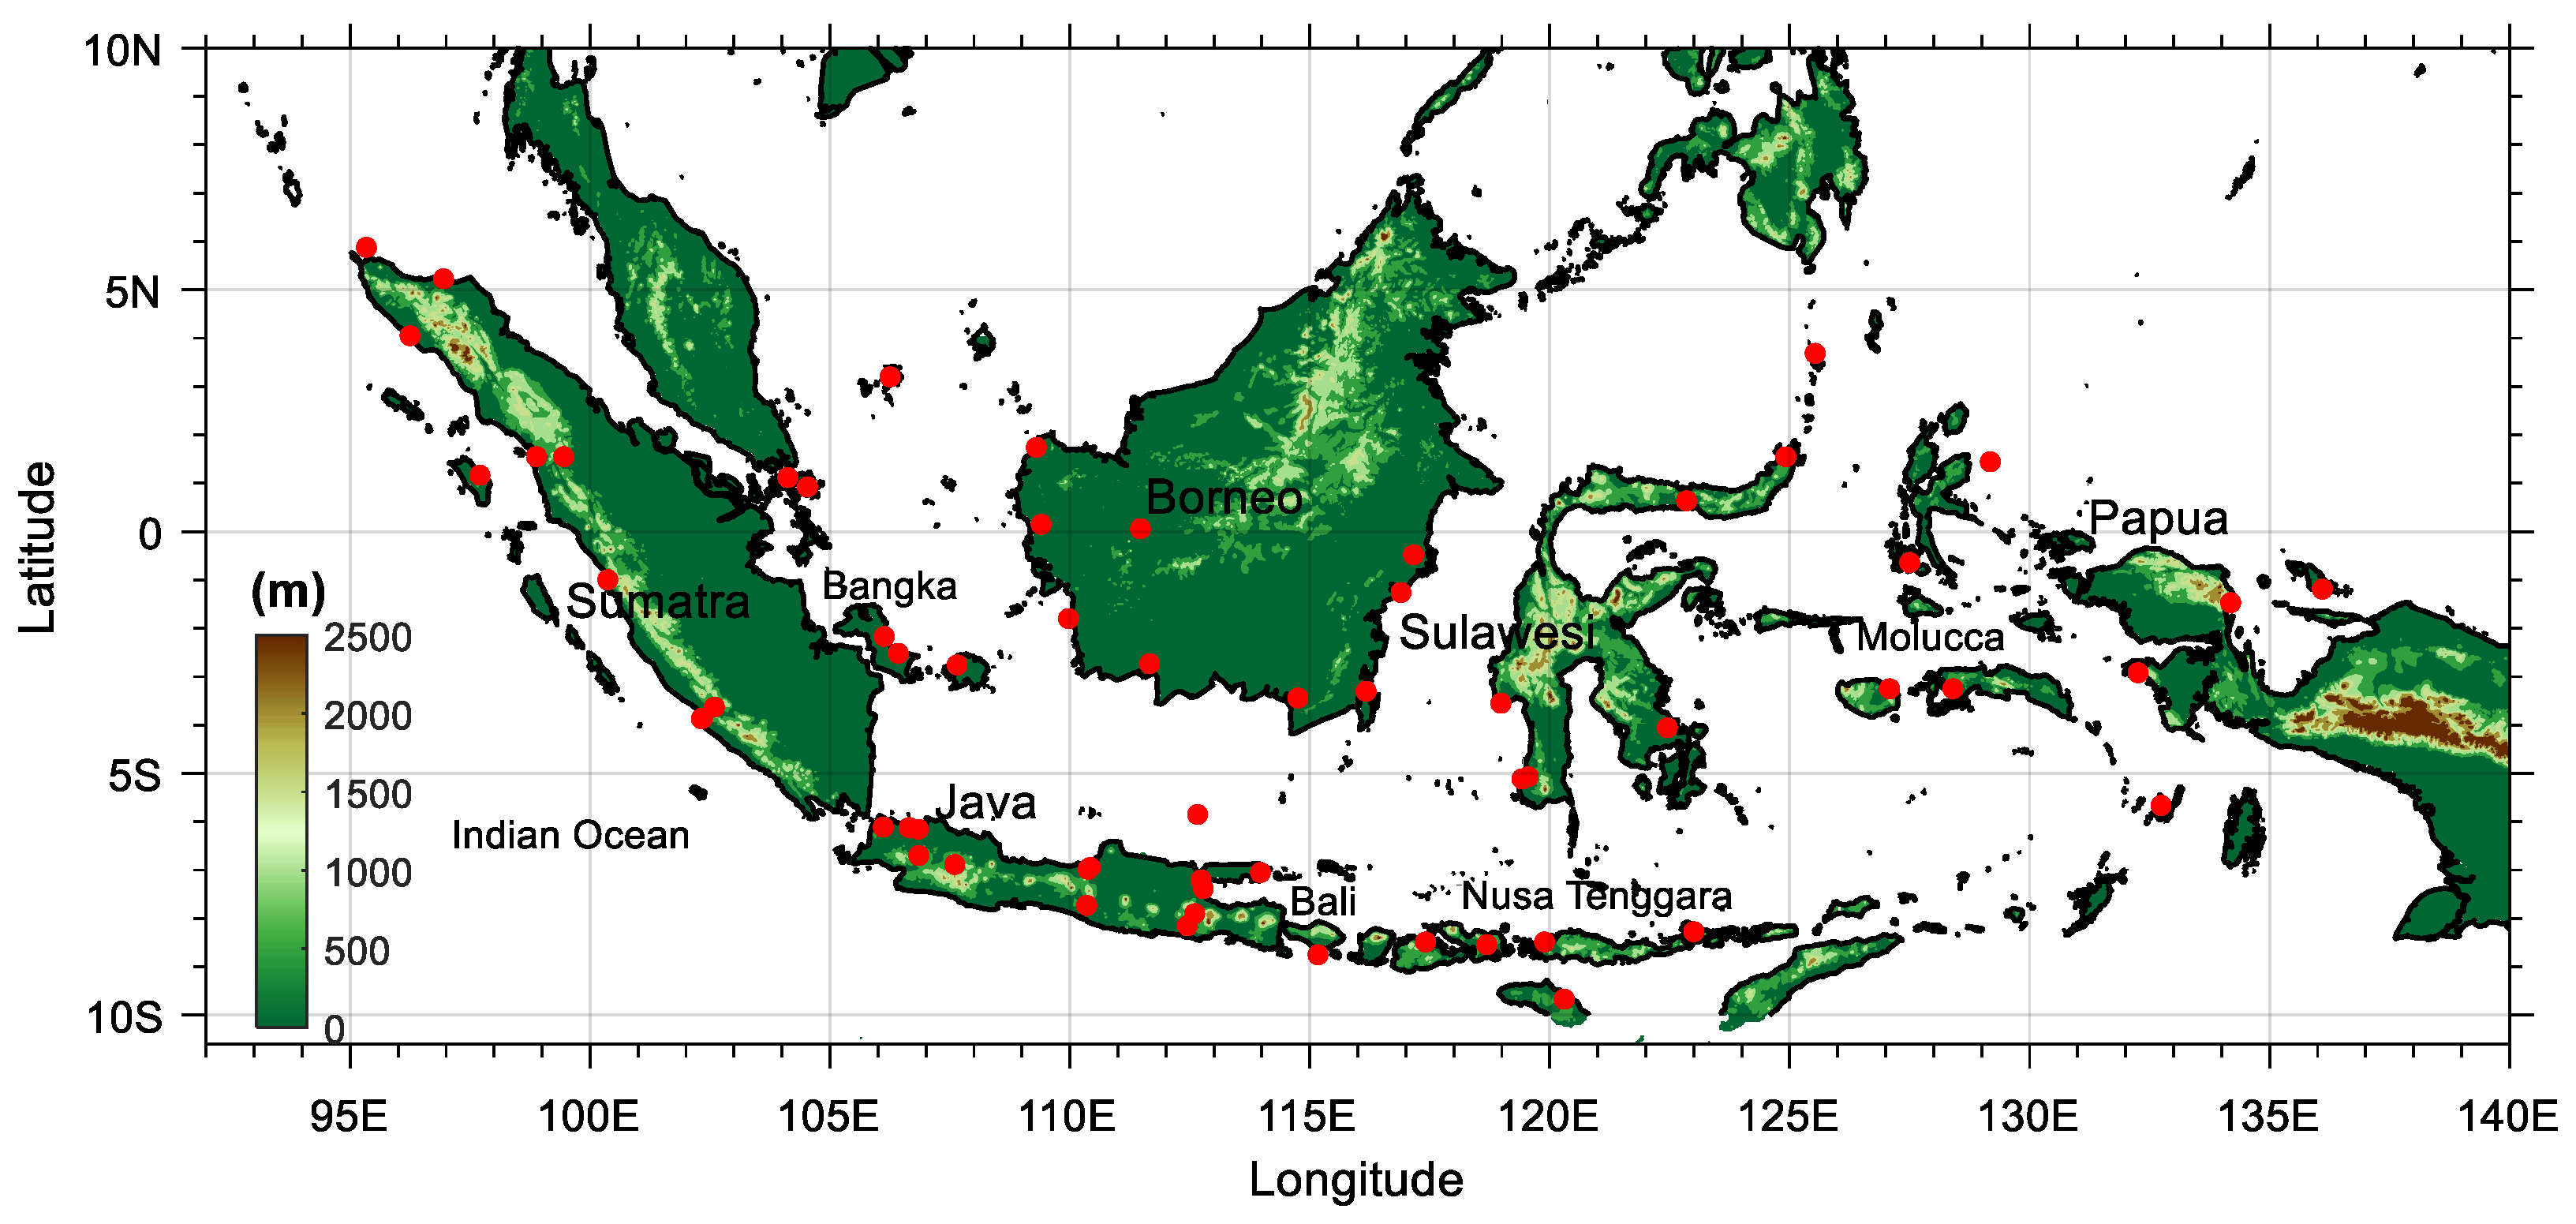
2.1. Study Area and Rain Gauge Data

The validation of extreme rain observation from IMERG observation was conducted for the IMC area located between 92 to 141 east longitude and 10 south latitude to 10 north longitude (Figure 1). IMC is the largest archipelagic country in the world, consisting of more than 17,000 islands, most of which are uninhabited, so that many of them are not equipped with surface rain gauges. The topography of the IMC varies with the elevation of 0 to 4884 m above sea level (ASL) (Figure 1). The variability of this topographical condition has made the rainfall pattern in the IMC greatly varied in each island [62].
IMERG’s validation in IMC was conducted using rain gauge (RG) data for 5 years from January 2016 to December 2020. The rain gauge used was a semi-automatic rain gauge installed in weather observation stations belonging to the Indonesia Agency for Meteorology, Climatology, and Geophysics (BMKG). The semi-automatic rain gauge used was the rain gauge of Hellman, which mechanically measures the rain using a pen and ink [63]. The temporal resolution of the RG was 1 hour with a threshold of 0.2 mm h−1.
The evaluation of the IMERG’s ability in observing the extreme rain in the IMC used the daily rainfall data, obtained from the summation of hourly rainfall from totally complete RG data for each day. A rigorous quality control procedure was carried out. All days with missing data or outliers were not included as IMERG validation data. The hourly rainfall was also carefully checked, excluding outliers. If necessary, we consulted with the BMKG staff directly to ascertain whether there were errors in data entry by the operator. At some stations, RG data were transferred manually to the BMKG online database, so there is the potential for entry errors. In addition, we also evaluated the quality of data from annual rainfall. West (NTB) and East Nusa Tenggara (NTT) regions have the smallest annual rainfall compared to other areas in Indonesia, around 500–1000 mm year−1. Some areas in Papua have very high rainfall, reaching more than 5000 mm year−1. This can be seen from the climatological rain map developed by BMKG using rain gauge data from 1981 to 2010 [65]. The rainfall interval from RG data [65] is similar to that obtained by TRMM 3G68/PR [66]. Therefore, we only used annual rainfall data within that interval. Based upon the quality of data control, finding 100% complete observation data for one year is very rare. Therefore, to evaluate the ability of IMERG’s GPM, we used RG data with annual observational data above 90%. In all, 63 RG stations met these criteria with the distribution as shown in Figure 1. The RG stations are scattered in almost all parts of the IMC, both in large and small islands in the IMC. The elevation of the RG varies from 0 to 787 m above sea level (ASL). The number of RGs located in the highlands (>300 m) is six stations.

2.2. GPM IMERG Precipitation Products

The GPM core observatory was launched on 27 February 2014 as a result of the collaboration of National Aeronautics Space Administration (NASA) and Japan Aerospace Exploration Agency (JAXA). GPM brings two core observations, i.e., dual-frequency radar (DPR) and multi-channel GPM microwave imager (GMI). The DPR operates on two radar frequency bands, i.e., the Ka-band precipitation radar with a frequency of 35.5 GHz and the Ku-band precipitation radar at a frequency of 13.6 GHz. On the other hand, the GMI brings 13 channels of microwave signal sensors operating in the range of 10 to 183 GHz. The number of these channels is higher than that in TRMM, which only has nine microwave sensor channels. The results of the analysis of the GPM core satellite observations are then combined with the observations from the GPM constellation of passive microwave radiometers [67] and from infrared geostationary sensors to produce the Integrated Multi-Satellite Retrievals for GPM (IMERG) Precipitation Product [52].
This study evaluated the ability of IMERG version 06 of Early, Late, and Final types in the period from 2016 to 2020 in the IMC. The algorithms of the three versions are described in detail by Huffman et al. [68]. IMERG version 06 is the latest version released on 13 March 2019 [68]. Previous research showed that IMERG version 06 is better than the previous version (Pradhan et al., 2021). IMERG version 06 provides PrecipitationCal, PrecipitationUnCal, HQprecipitation, and IRprecipitation rainfall data [68]. PrecipitationCal data refer to multi-satellite observation data after calibration with surface rainfall data from the Global Precipitation Climatology Center (GPCC), while PrecipitationUnCal is only from multi-satellite observation (IRprecipitation and HQprecipitation) [69,70]. In this study, PrecipitationCal was selected for its better ability to measure surface precipitation [71]. The data evaluation was carried out using the point-to-pixel approach that could work well under the conditions of low rain gauge density [46,72,73], as also found in the IMC. Since the lowest rainfall observed by RG was 0.2 mm h−1, the lowest value considered as rain for the IMERG product was 0.2 mm h−1. Figure 2 shows an example of a flood event as recorded by RG and IMERG in Padang City, West Sumatra, on 26 September 2018. The RG station is located at 0.996°S, 100.372°E, around the coast of Padang. The National Agency for Disaster Countermeasures (BNPB) reported flooding in Padang on that date [74]. RG and IMERG captured the daily precipitation’s temporal trend, which is consistent with another validation in West Sumatra [61,75]. Thus, the RG data can be used to validate extreme rain observations from IMERG.

2.3. Validation Metrics Assessment

Extreme weather and climate events have a low probability of occurring within a certain observation period. This requires the use of specific indicators to monitor such events. In the early 21st century, the World Meteorological Organization (WMO) and the Climate Research Program (WCRP) formed a team called the Expert Team on Climate Change Detection and Indices (ETCCDI) that defined 27 indicators for extreme weather observation [76]. Of the 27 main indices, 11 are the indices for extreme rain.
In this study, the ability of IMERG in observing extreme rain in the IMC was tested based upon the extreme indicators from the ETCCDI. Extreme indicators from the ETCCDI have been commonly used as a reference in observing and modeling extreme weather events in a given area [25,77,78,79]. To the 11 extreme rain indicators from the ETCCDI (see Table 1), we added the R85p indicator and the R1mm index to assess IMERG’s ability in quantifying extreme rain and the number of wet days, respectively [58,80]. Based on the characteristics of each index, we divided the index into four index categories: amount-based indices, duration-based indices, frequency-based indices, and intensity-based indices. Table 1 presents the details of each category, name, definition, and unit of each index used.
The validation matrix used to evaluate the IMERG’s ability in observing extreme indicators in the IMC was the Kling–Gupta efficiency (KGE) matrix [81]. The KGE test is widely used in evaluating the ability of grid rainfall data [48,82,83]. The KGE equation can be written as follows:
K G E = 1 ( 1 R ) 2 + ( 1 β ) 2 + ( 1 γ ) 2 ;
R = 1 N i = 1 N ( S i μ s ) ( O i μ o ) σ s σ o ;
β = μ s μ o ;
γ = σ s / μ s σ o / μ o ,
where N refers to the number of observed samples, Si (Oi) is the extreme rain index value from IMERG (rain gauge) for the i-th data, σs (σo) is the standard deviation of the extreme rain index from IMERG (rain gauge), and µs (µo) is the average value of the extreme rain index from IMERG (rain gauge). The KGE value ranges from −∞ to 1 with a perfect value of 1. R refers to the Pearson correlation coefficient describing the level of linear correlation between extreme index observation between IMERG and rain gauge with the values in the range of −1 and 1. An R value of −1 or 1 indicates perfect negative or positive correlation, while an R value equal to 0 indicates no correlation. Furthermore, β is the bias ratio, in which values greater than 1 indicate an overestimation, whereas β values lower than 1 indicate an underestimation of the value of the extreme rain index obtained by IMERG. Furthermore, the γ value or variance ratio indicates the ability of IMERG to observe the variability of the extreme index measurement compared to the rain gauge with a perfect value of 1. A γ value greater than 1 indicates an overestimation, while a value of lower than 1 indicates an underestimation of the measurement of the index variability of the extreme rain by IMERG.

3. Results and Discussion

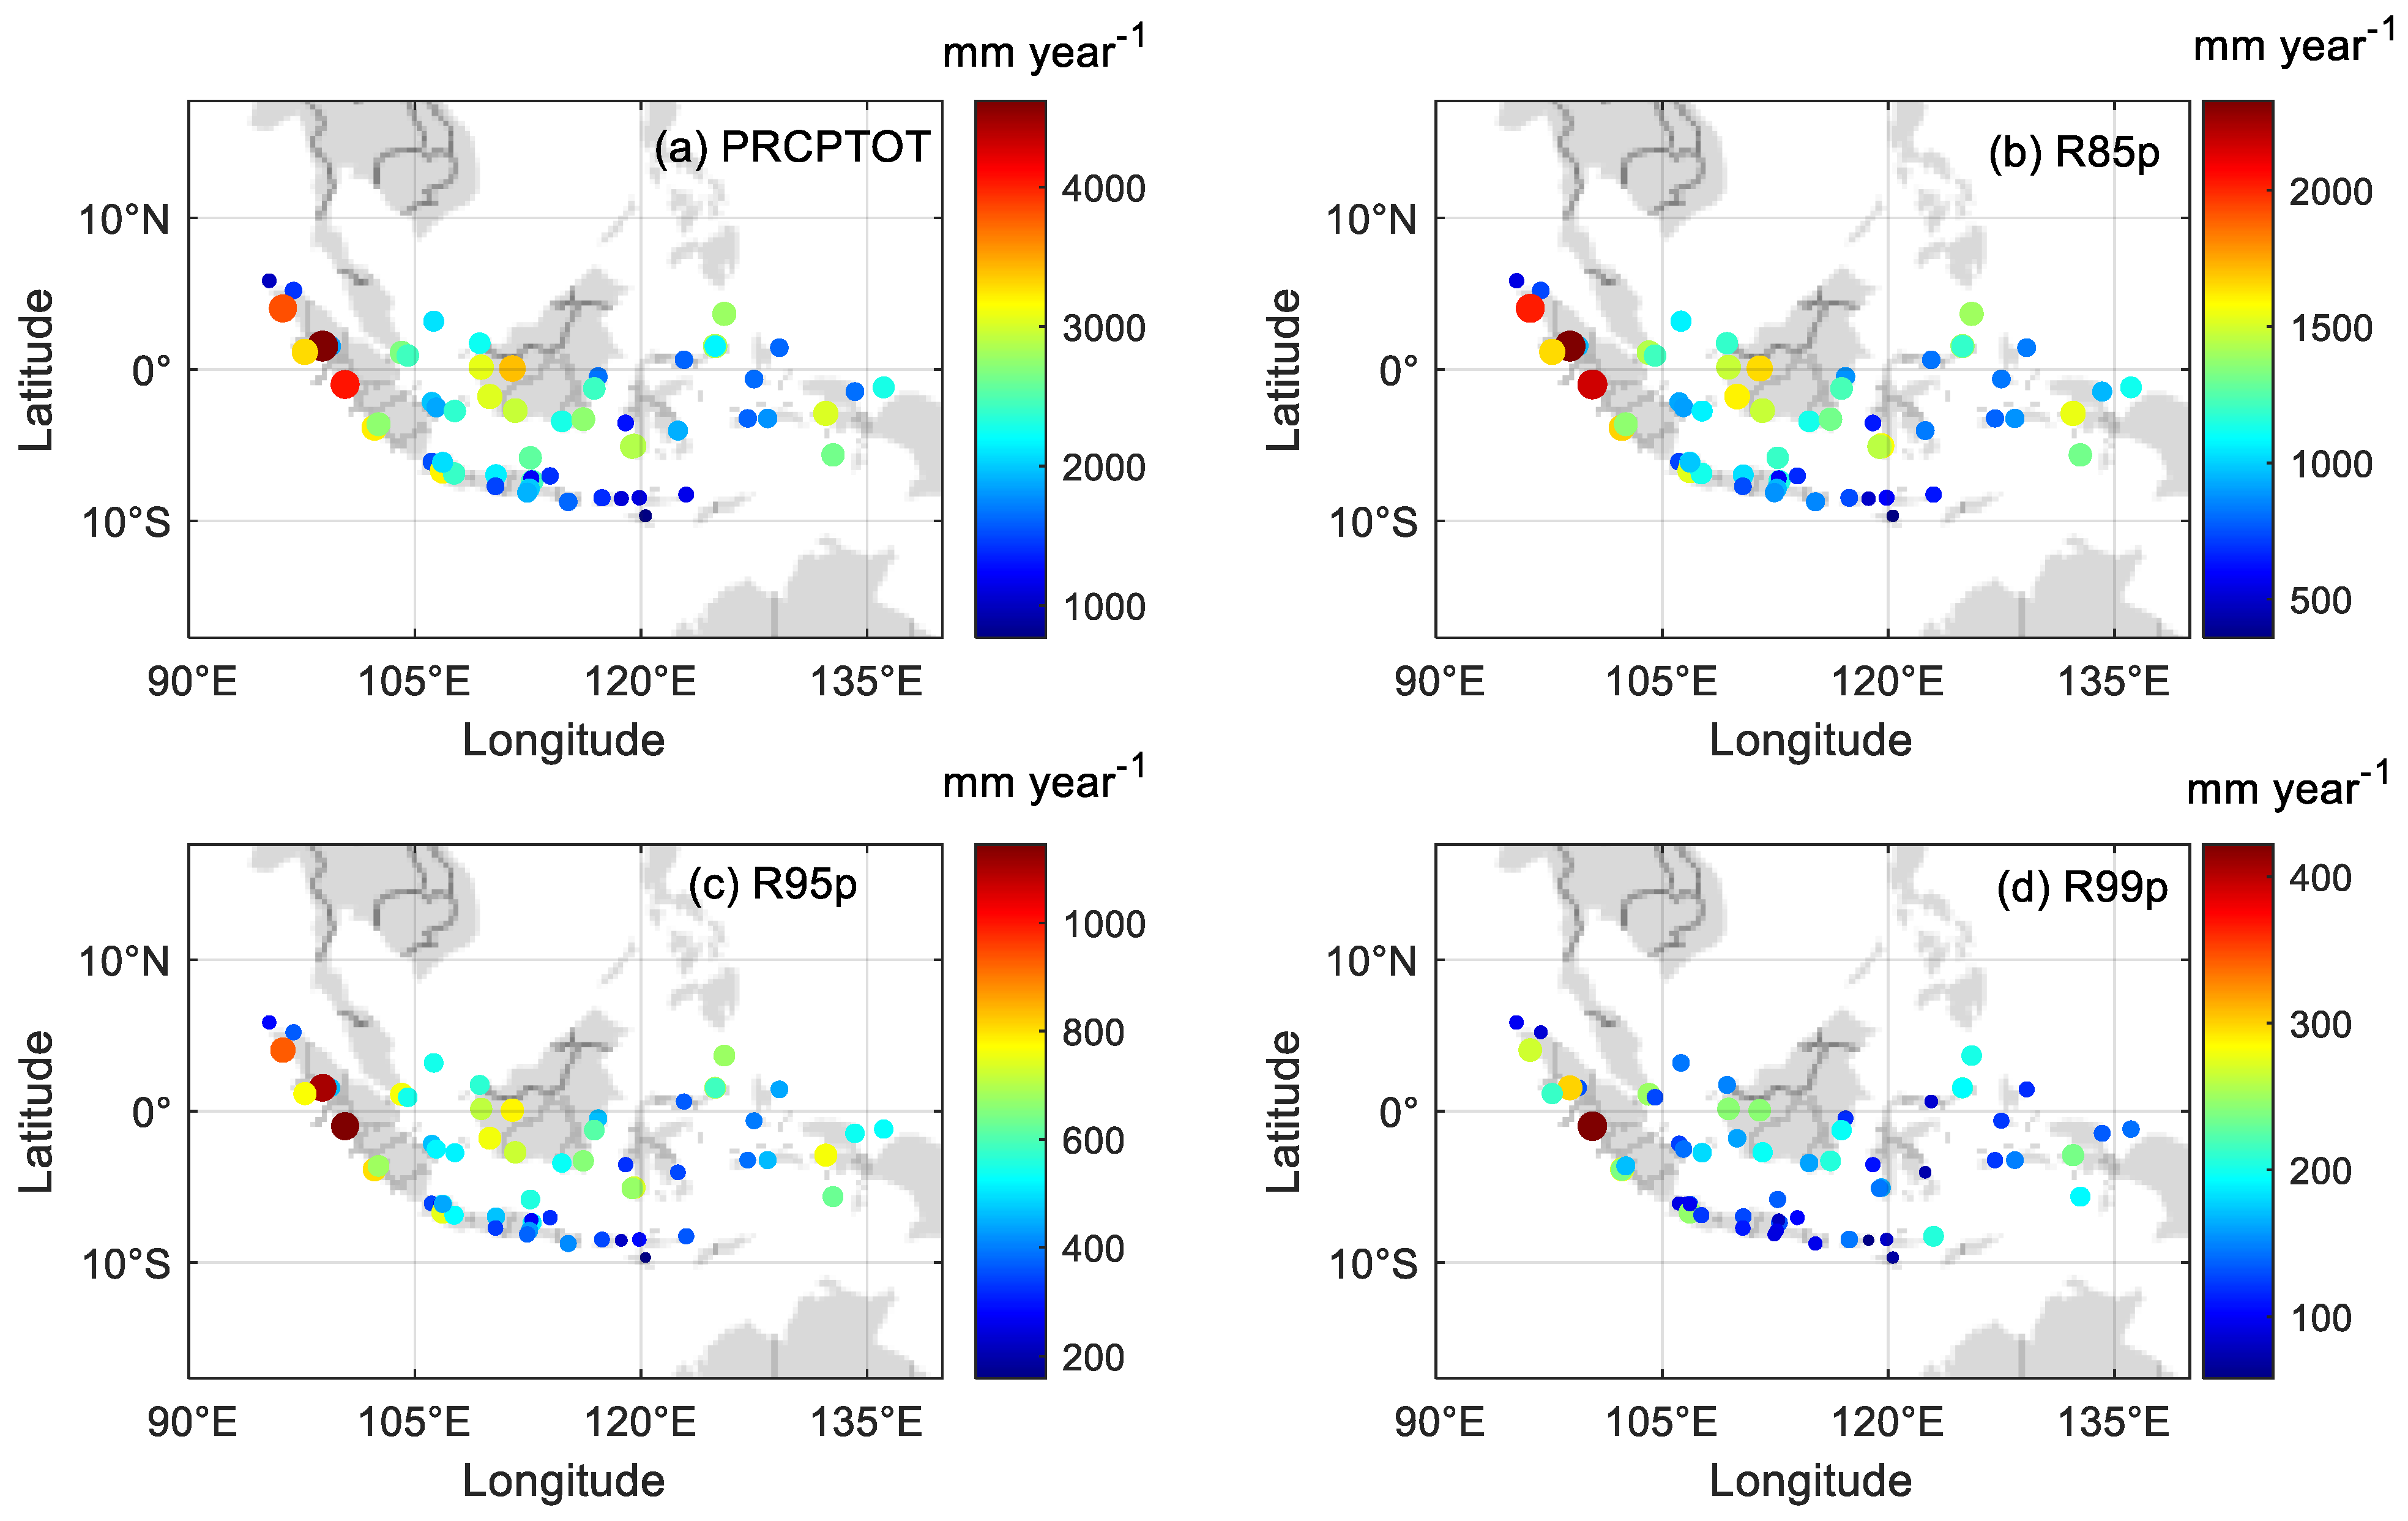
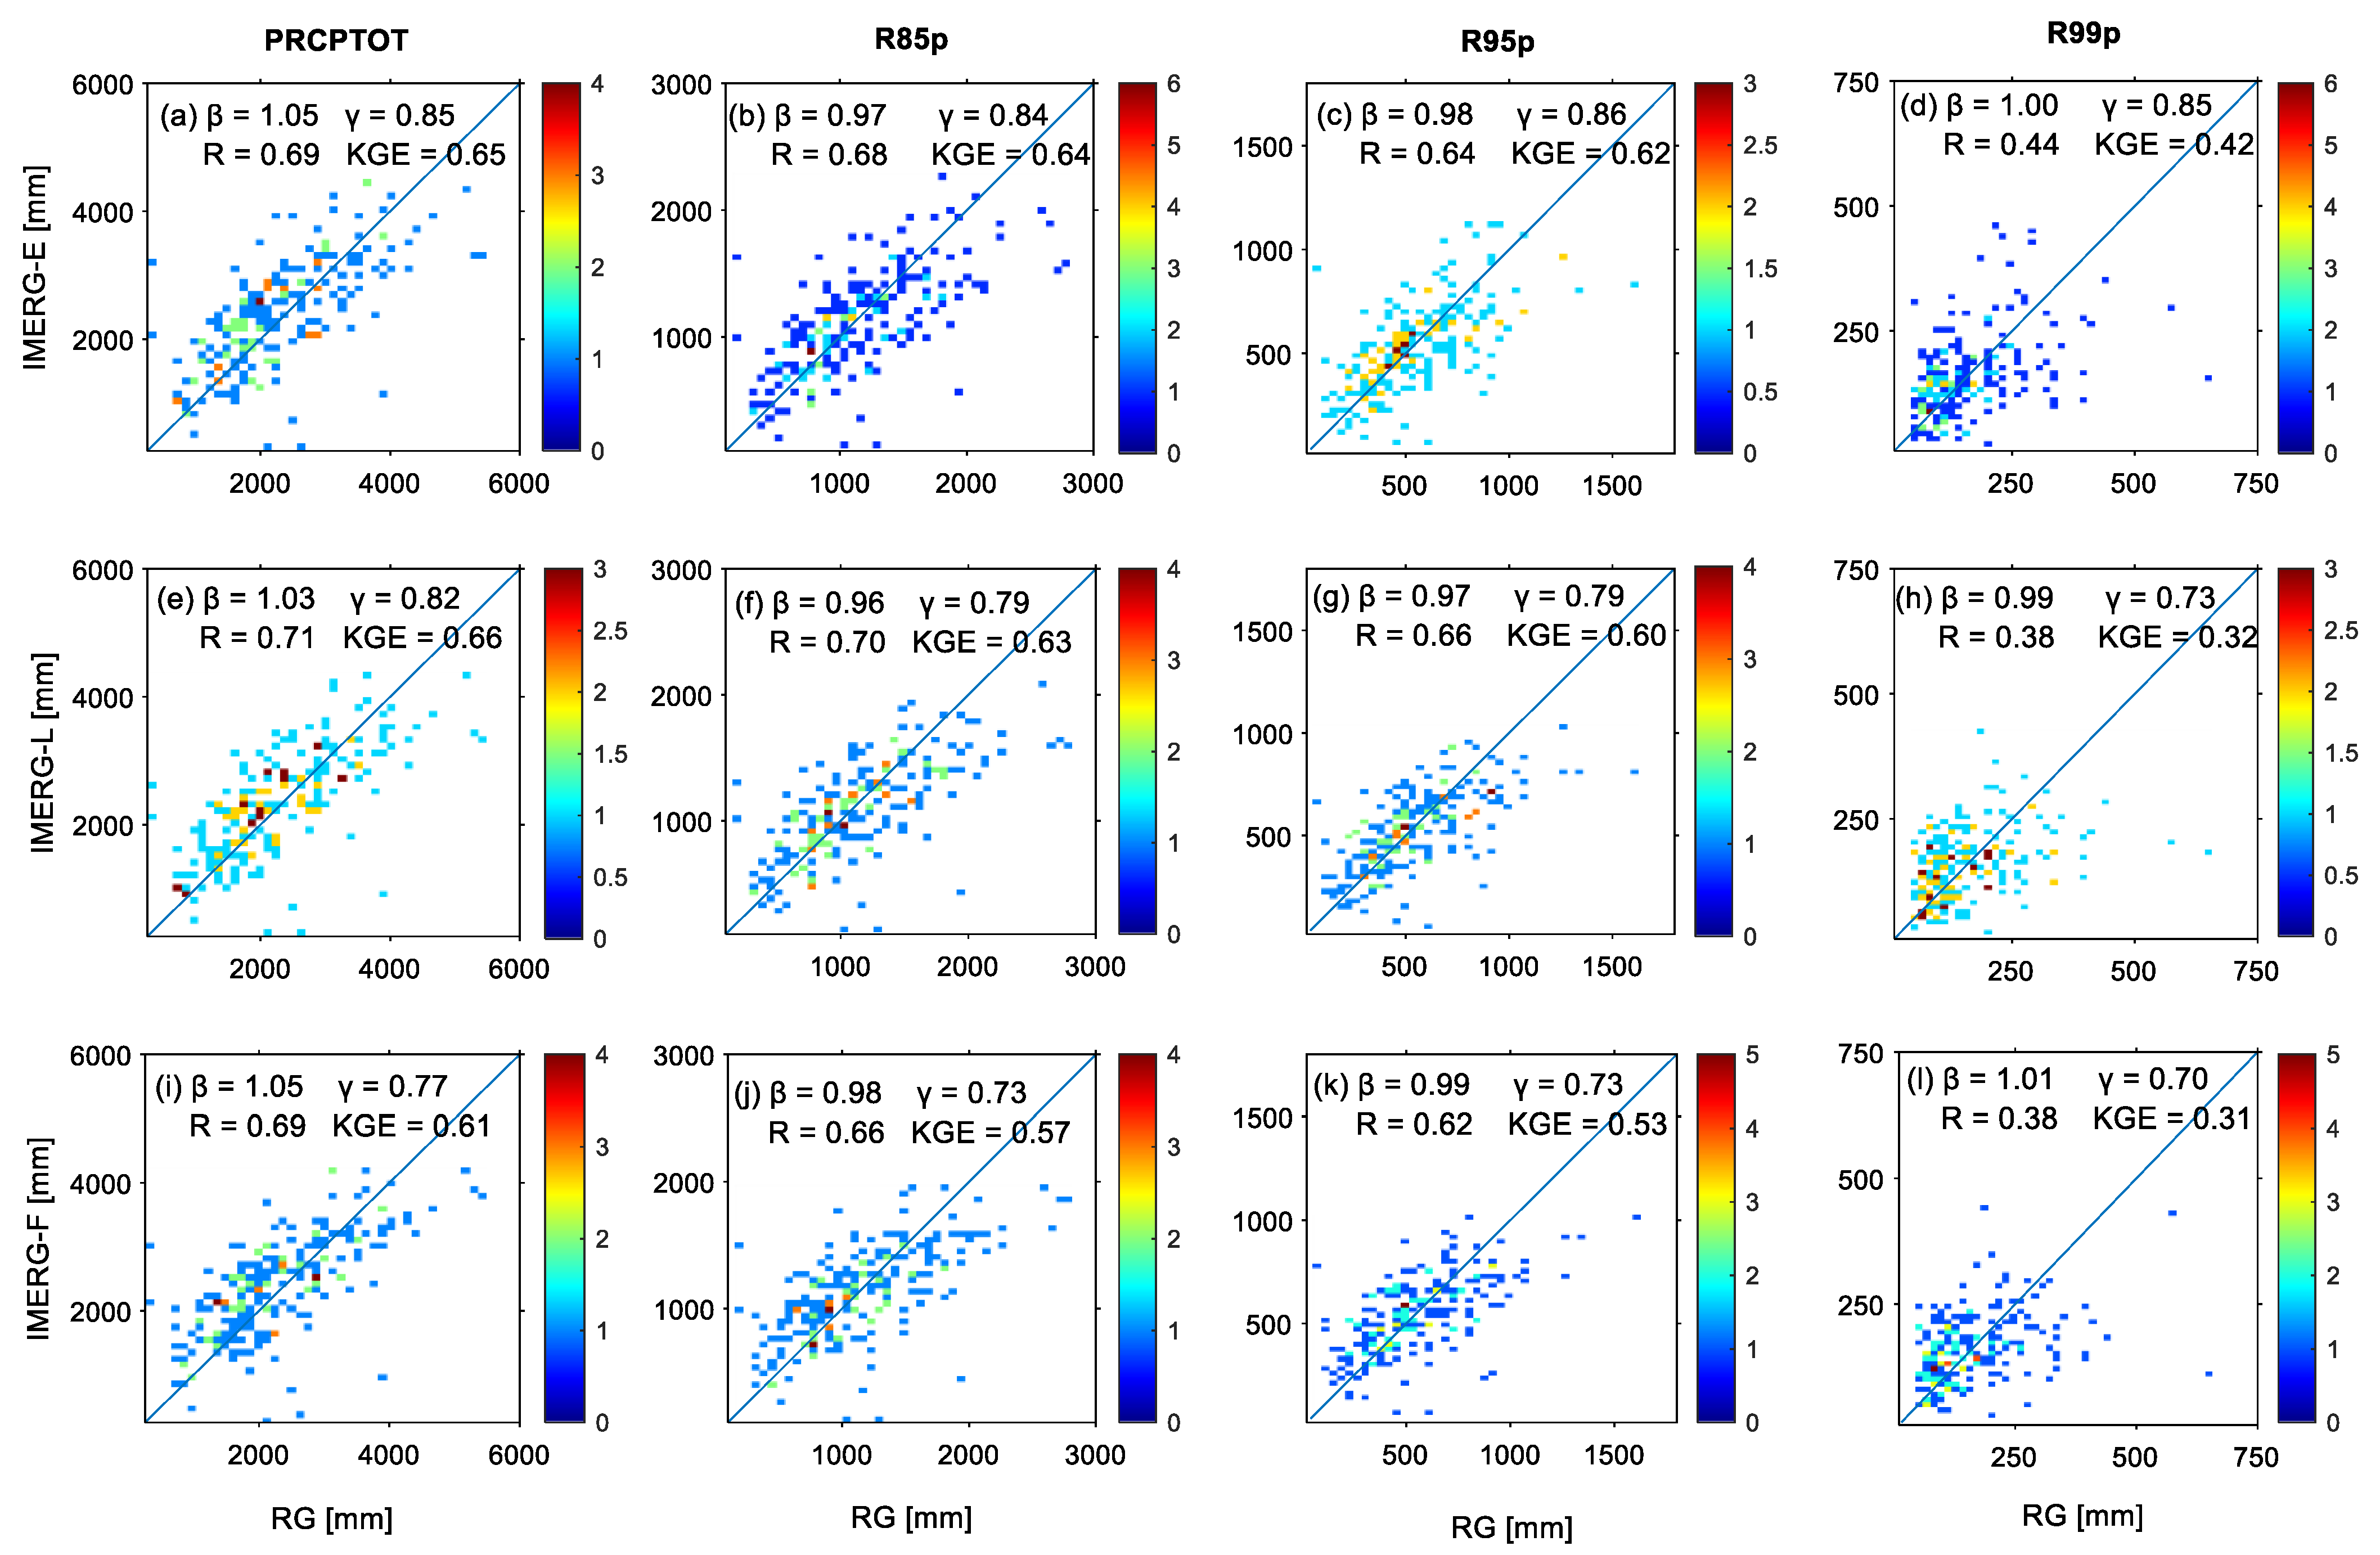
3.1. Precipitation-Amount-Based Indices’ Assessment

Precipitation-amount-based indices were observed using the indices of PRCPTOT, R85p, R95p, and R99p. From the overall observational data for RG stations in IMC, the average values of PRCPTOT, R85p, R95p, and R99p were 2220.8, 1110.5, 536.7, and 155.4 mm year−1, respectively. Figure 3 shows the distribution of the overall average value-based indices for each station in the IMC. RG observation showed that a large PRCPTOT of 4500 mm year−1 was observed in the western Sumatra and Kalimantan and a low PRCPTOT was observed in Bali and Nusa Tenggara (Figure 3a). The high PRCPTOT in western Sumatra and Kalimantan was consistent with the rain map developed by BMKG using rain gauge data from 1981 to 2010 [65] and the pattern of annual rainfall distribution from the TRMM-PR satellite observations, 1998–2000 [66]. This condition was most likely influenced by the Inter-Tropical Convergence Zone (ITCZ), while on the mainland of Kalimantan it was determined by the South Pacific Convergence Zone (SPCZ). In addition to ITCZ and SPCZ, topography has a significant role in the high PRCPTOT value in the region [62,66,84]. Lower PRCPTOT values were also observed in southern IMC and small islands in the IMC, and it was consistent with previous observations [84,85]. The distribution pattern of R85p, R95p, and R99p (Figure 3b–d) resembled to that of PRCPTOT. The R95p and R99p indices are commonly related to the extreme and very extreme rain events in a region [86]. The high values of R95p and R99p as observed in the western Sumatra had an impact on the high annual flood cases that occurred in the region [18,87].
Figure 4 shows the distribution of the amount-based indices’ values of the three types of IMERG data for each RG point observation. Some significant differences were observed in the R values of each index. A good correlation was observed in the PRCPTOT values (Figure 4a,e,i) and it was consistent with the good annual correlation values from the IMERG observations in the MC [46,50,51]. Overall, the correlation of the amount-based indices observed by IMERG was found to decrease with the increasing rainfall percentiles used (percentile 85, 95, and 99). The R values of R85p and R95p showed a moderate correlation (0.5–0.7) with the insignificant difference of the values in each station (Figure 4). A low correlation was observed on the R99p index with an R value < 0.5, because IMERG underestimated the extreme rainfall rate [53], as can be seen from the value of β. This can also be seen from Figure 2.
The observations of precipitation-amount-based indices by IMERG relative to RG showed varying β values (Figure 4). β values > 1 were obtained on the PRCPTOT index, while β values < 1 were found on the indices of R85p, R95p, and R99p. This showed that all IMERG products tend to overestimate annual rainfall but underestimate extreme event precipitation. Similarly, all products tend to underestimate the spread of the rainfall distribution, i.e., the γ parameters have values < 1. Although the difference in the β value and γ value was found to be insignificant, the KGE parameter values showed very different values for each amount-based index, mainly driven by the significant difference of the R parameter for each index. The best to the worst values were obtained for PRCPTOT, R85p, R95p, and R99p, respectively. Although the value of KGE R95p was found to be still lower than that of R85p, the KGE value of R95p obtained was still quite good (>0.5). This condition shows that the R95p value is still recommended in the use of extreme rainfall thresholds in the IMC. R95p was also recommended for other MC regions such as Malaysia and Philippines [58].
The difference in the accuracy of the observation of precipitation-amount-based indices was shown by the three types of IMERG data (Early, Late, and Final). Overall, IMERG-L showed the best performance in the observation of amount-based indices indicated by a higher KGE value (Figure 4). Meanwhile, the best observation of R99p was shown by IMERG-E (KGE = 0.42). Such a high KGE value for IMERG-E is caused by the tendency of IMERG-E to overestimate precipitation compared to IMERG-L and IMERG-F [88]. In addition, the low density of rain gauges in the IMC for GPCC data can also cause less perfect correction for IMERG-F data [32].
Although the three types of IMERG data showed the different accuracies of precipitation-amount-based indices in the IMC, the difference was insignificant. The good accuracy values of IMERG-E and IMERG-L in the observation of amount-based indices in IMC indicated that they are very promising in observing the amount of annual extreme rainfall in the IMC. This is supported by the faster IMERG-E and IMERG-L latency compared to that of IMERG-F. However, considerable biases exist in the IMERG data, as discussed above, and bias adjustment [89] needs to be done before the data are used for the hydrological applications.

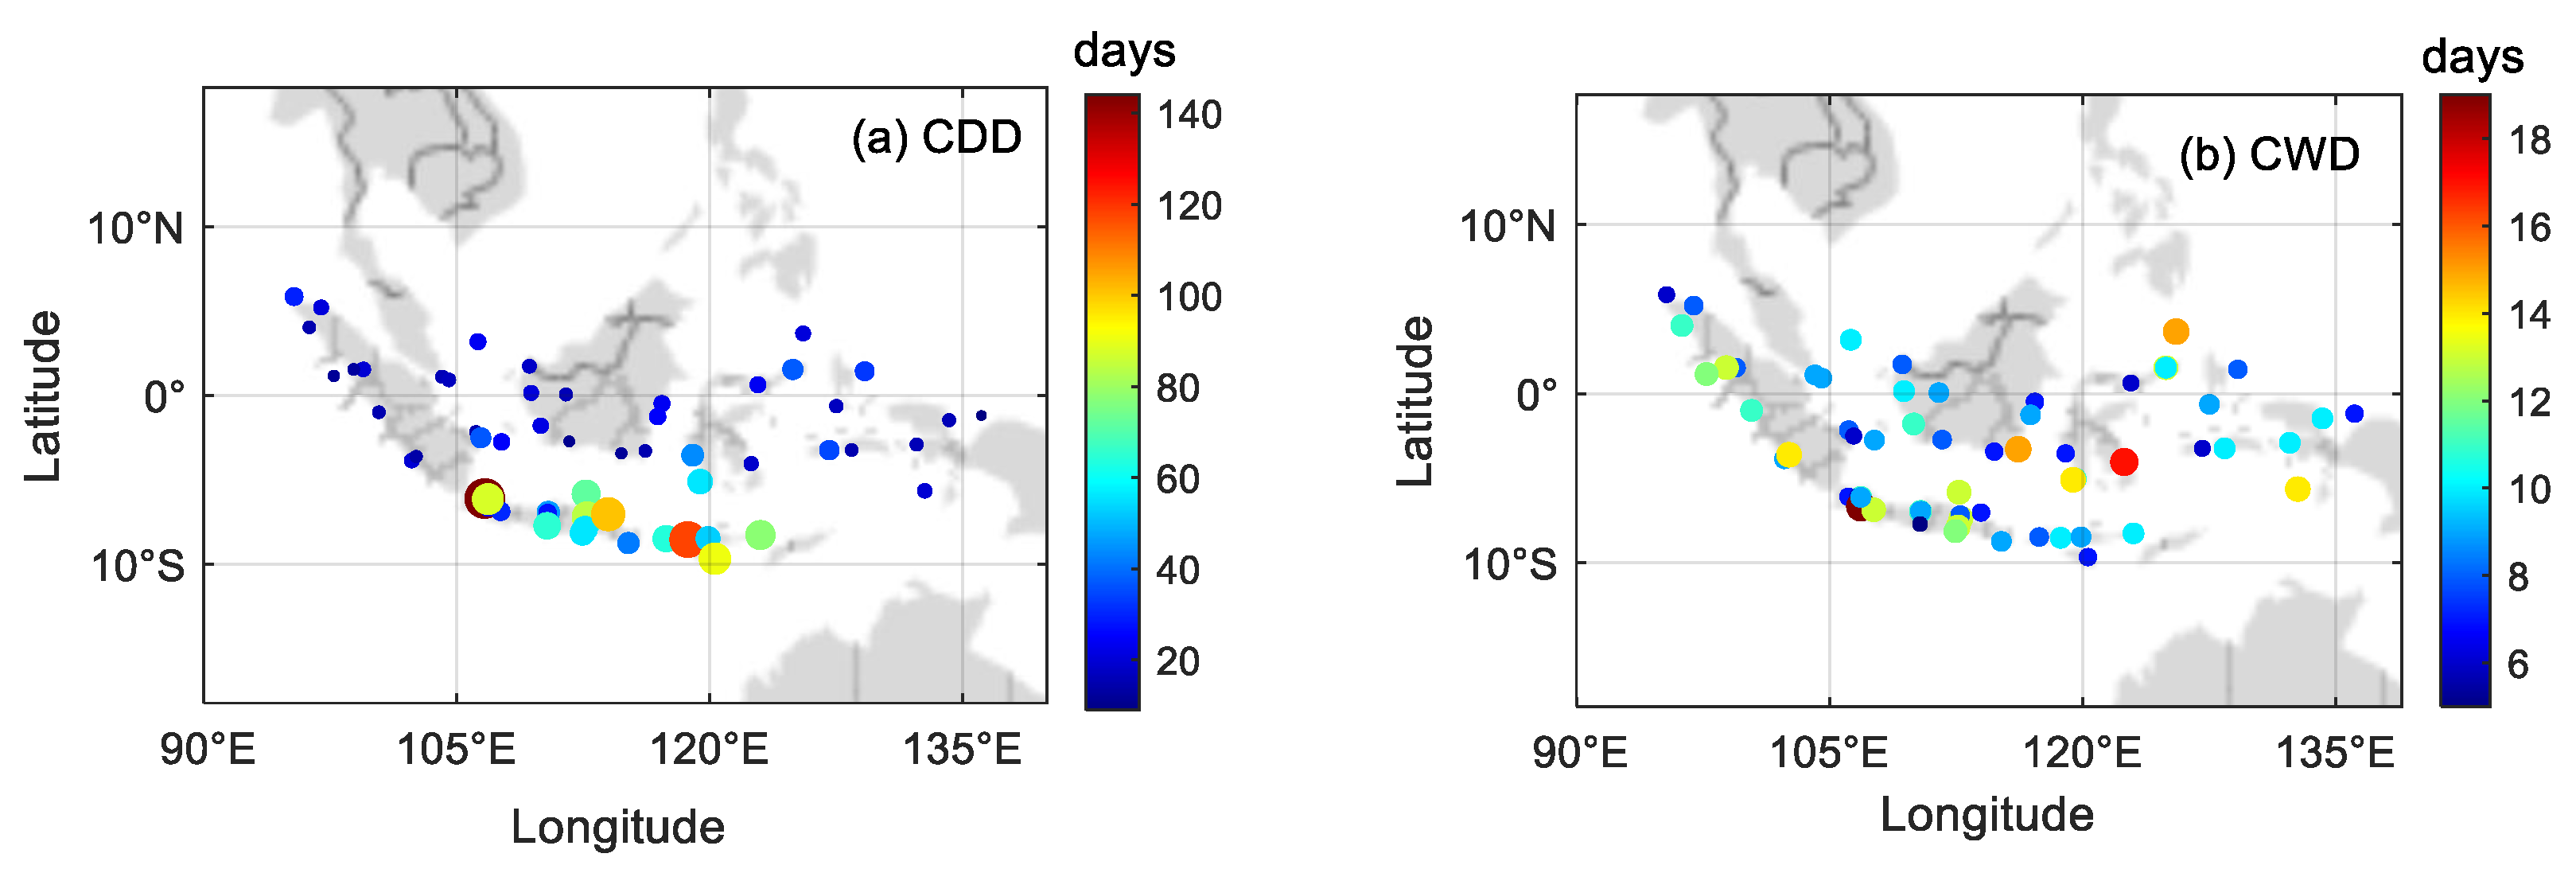
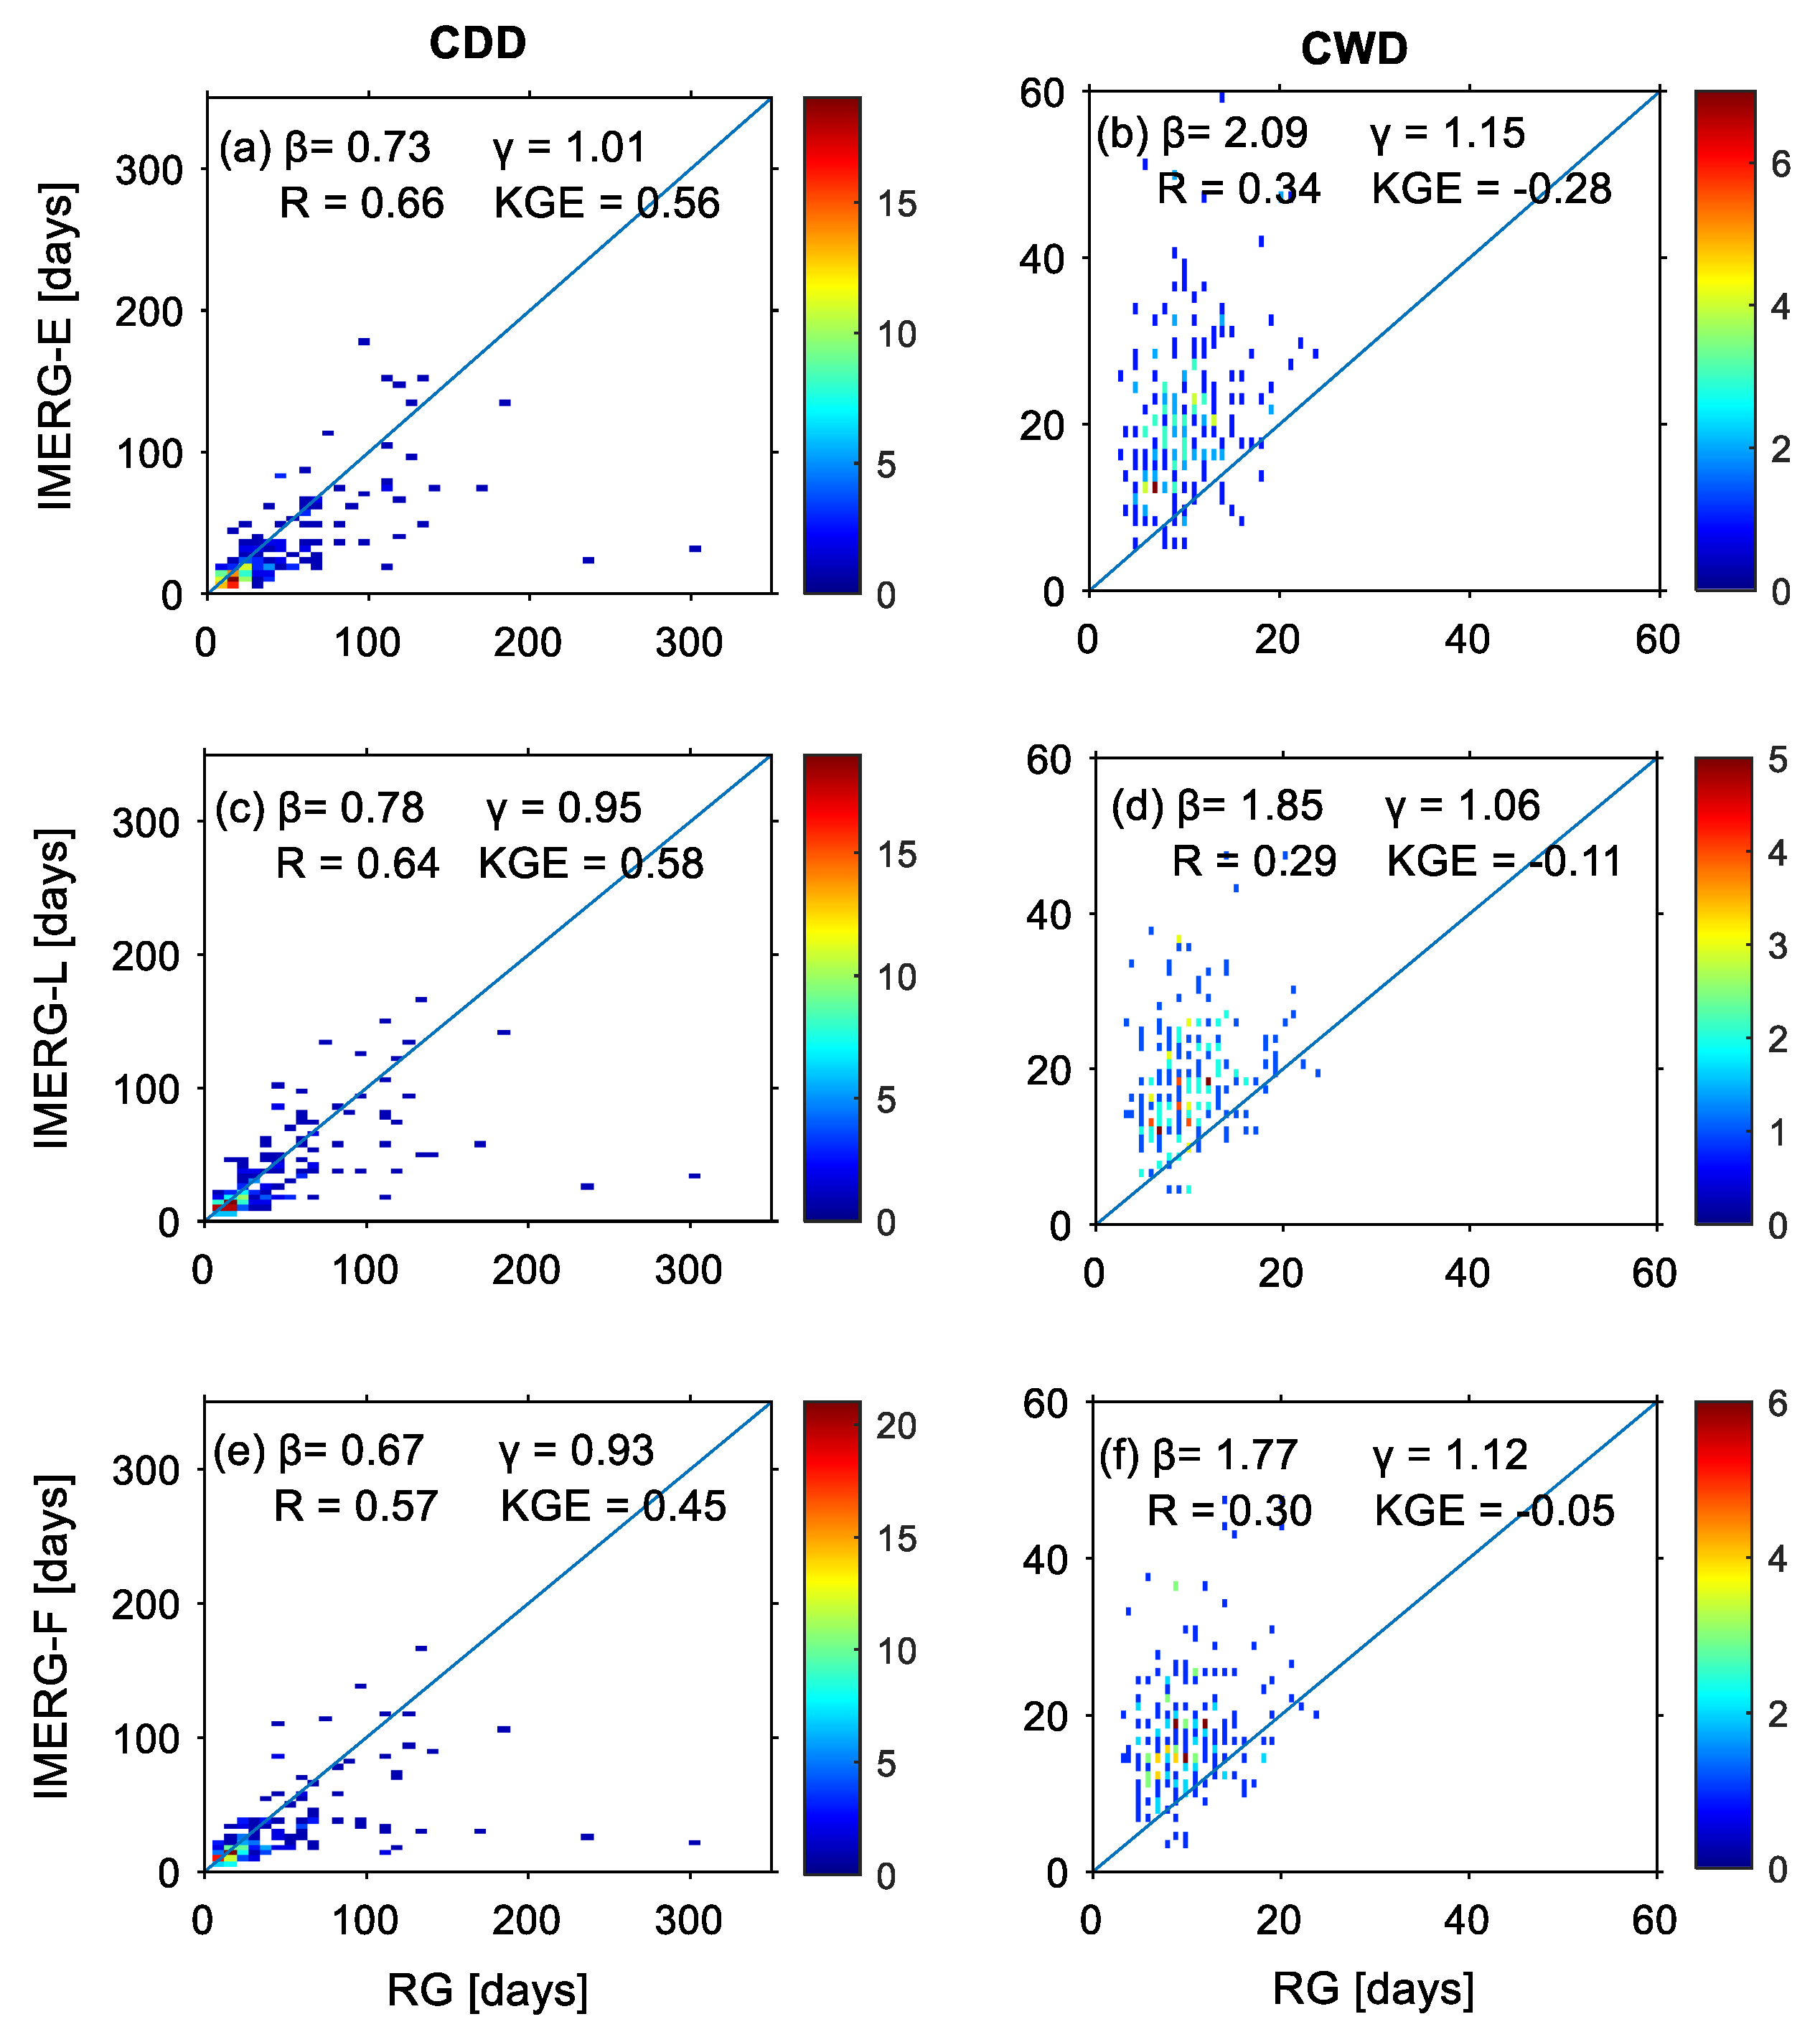
3.2. Precipitation-Duration-Based Indices’ Assessment

The duration of consecutive dry days (CDDs) and the duration of consecutive wet days (CWDs) were used as precipitation-duration-based indices. Figure 5 illustrates the distribution of the mean CDD and CWD values from the RG observations in the IMC. Overall, the mean CDD and CWD values in the IMC were 37 and 10 days. The high CDD value in the IMC is predicted to continue to increase in the next few decades [25,26]. More contrasting spatial patterns were observed in the CDD index compared to that in the CWD. The highest CDD values were observed in the southern part of the IMC, i.e., in Java, Bali, and Nusa Tenggara. This was due to the very dominant impact of the monsoon in the south of the IMC compared to other areas in the IMC [65,84]. The movement of the monsoon wind from the Australian continent to Asia has caused the regions of Java, Bali, and Nusa Tenggara to be frequently drier so that the number of consecutive dry days increases [40,90]. In addition, the low influence of the MJO in the Java region has also caused the minimal increase of rainfall in Java during the active phase of the MJO [42]. On the other hand, the varying CWD values for each region in the IMC were also the dominant local factors in the IMC [62,66,91].
Figure 6 shows the distribution of CDD and CWD values for the three types of IMERG data. The validation matrices of the two duration-based indices showed very different values. The correlation of CDD values of IMERG and RG showed a better value than the correlation of CWD values. CDD for the three types of IMERG data in IMC showed a moderate correlation (0.5 ≤ R ≤ 0.7) whereas CWD showed a low correlation (0.3 ≤ R ≤ 0.5). The highest (lowest) R value of CDD was observed in IMERG-E (IMERG-F) observations. A better correlation of CDD compared to that of CWD was also observed in other regions [92,93]. One of the reasons why CDD correlation was better than that of CWD was the tendency to overestimate IMERG at low rainfall [50,55]. Additionally, the high daily false alarm ratio (FAR) value of IMERG in the MC region also caused errors in the identification of wet days [46,50,51].
The tendency of overestimation of low rainfall and fairly high daily FAR values from IMERG also resulted in the underestimation of CDD observations and overestimation of CWD observations. This was indicated by the parameter value of β < 1 for the CDD index and β > 1 for the CWD index (Figure 6). The β value of duration-based indices was also found to vary for the three types of IMERG data. In the CDD index, the lowest underestimated value was observed in IMERG-F, while the highest one was observed in IMERG-L but with marginal differences (Figure 6a,c,e). A larger difference in the β value was observed in the CWD index observations (Figure 6b,d,f), with the highest value of β observed in IMERG-E (2.09) and the lowest one in IMERG-F (1.77). This showed that IMERG-F had a lower overestimation value than the other two IMERG data types. In addition to the varying values of β, the value of γ did not show any significant difference for each type of IMERG data and all duration-based indices (Figure 6). The γ value showed a very good value (~1) indicating that the spatial variability of duration-based indices from RG was almost the same as IMERG.
The variation in the values of R and β for each type of IMERG data and all duration-based indices also caused the variations in the KGE values obtained. The best KGE value was observed in CDD index, particularly for the data of IMERG-L (0.58). Low KGE values were also found in the CWD index for the three types of IMERG data (KGE < 0). This shows the need to improve the IMERG data, especially with regard to significantly overestimating very low rainfall [50,55] and the high daily FAR [46,50,51]. The use of a half-hourly rainfall of IMERG with the appropriate rainfall threshold value can also reduce the FAR from the satellite [94].

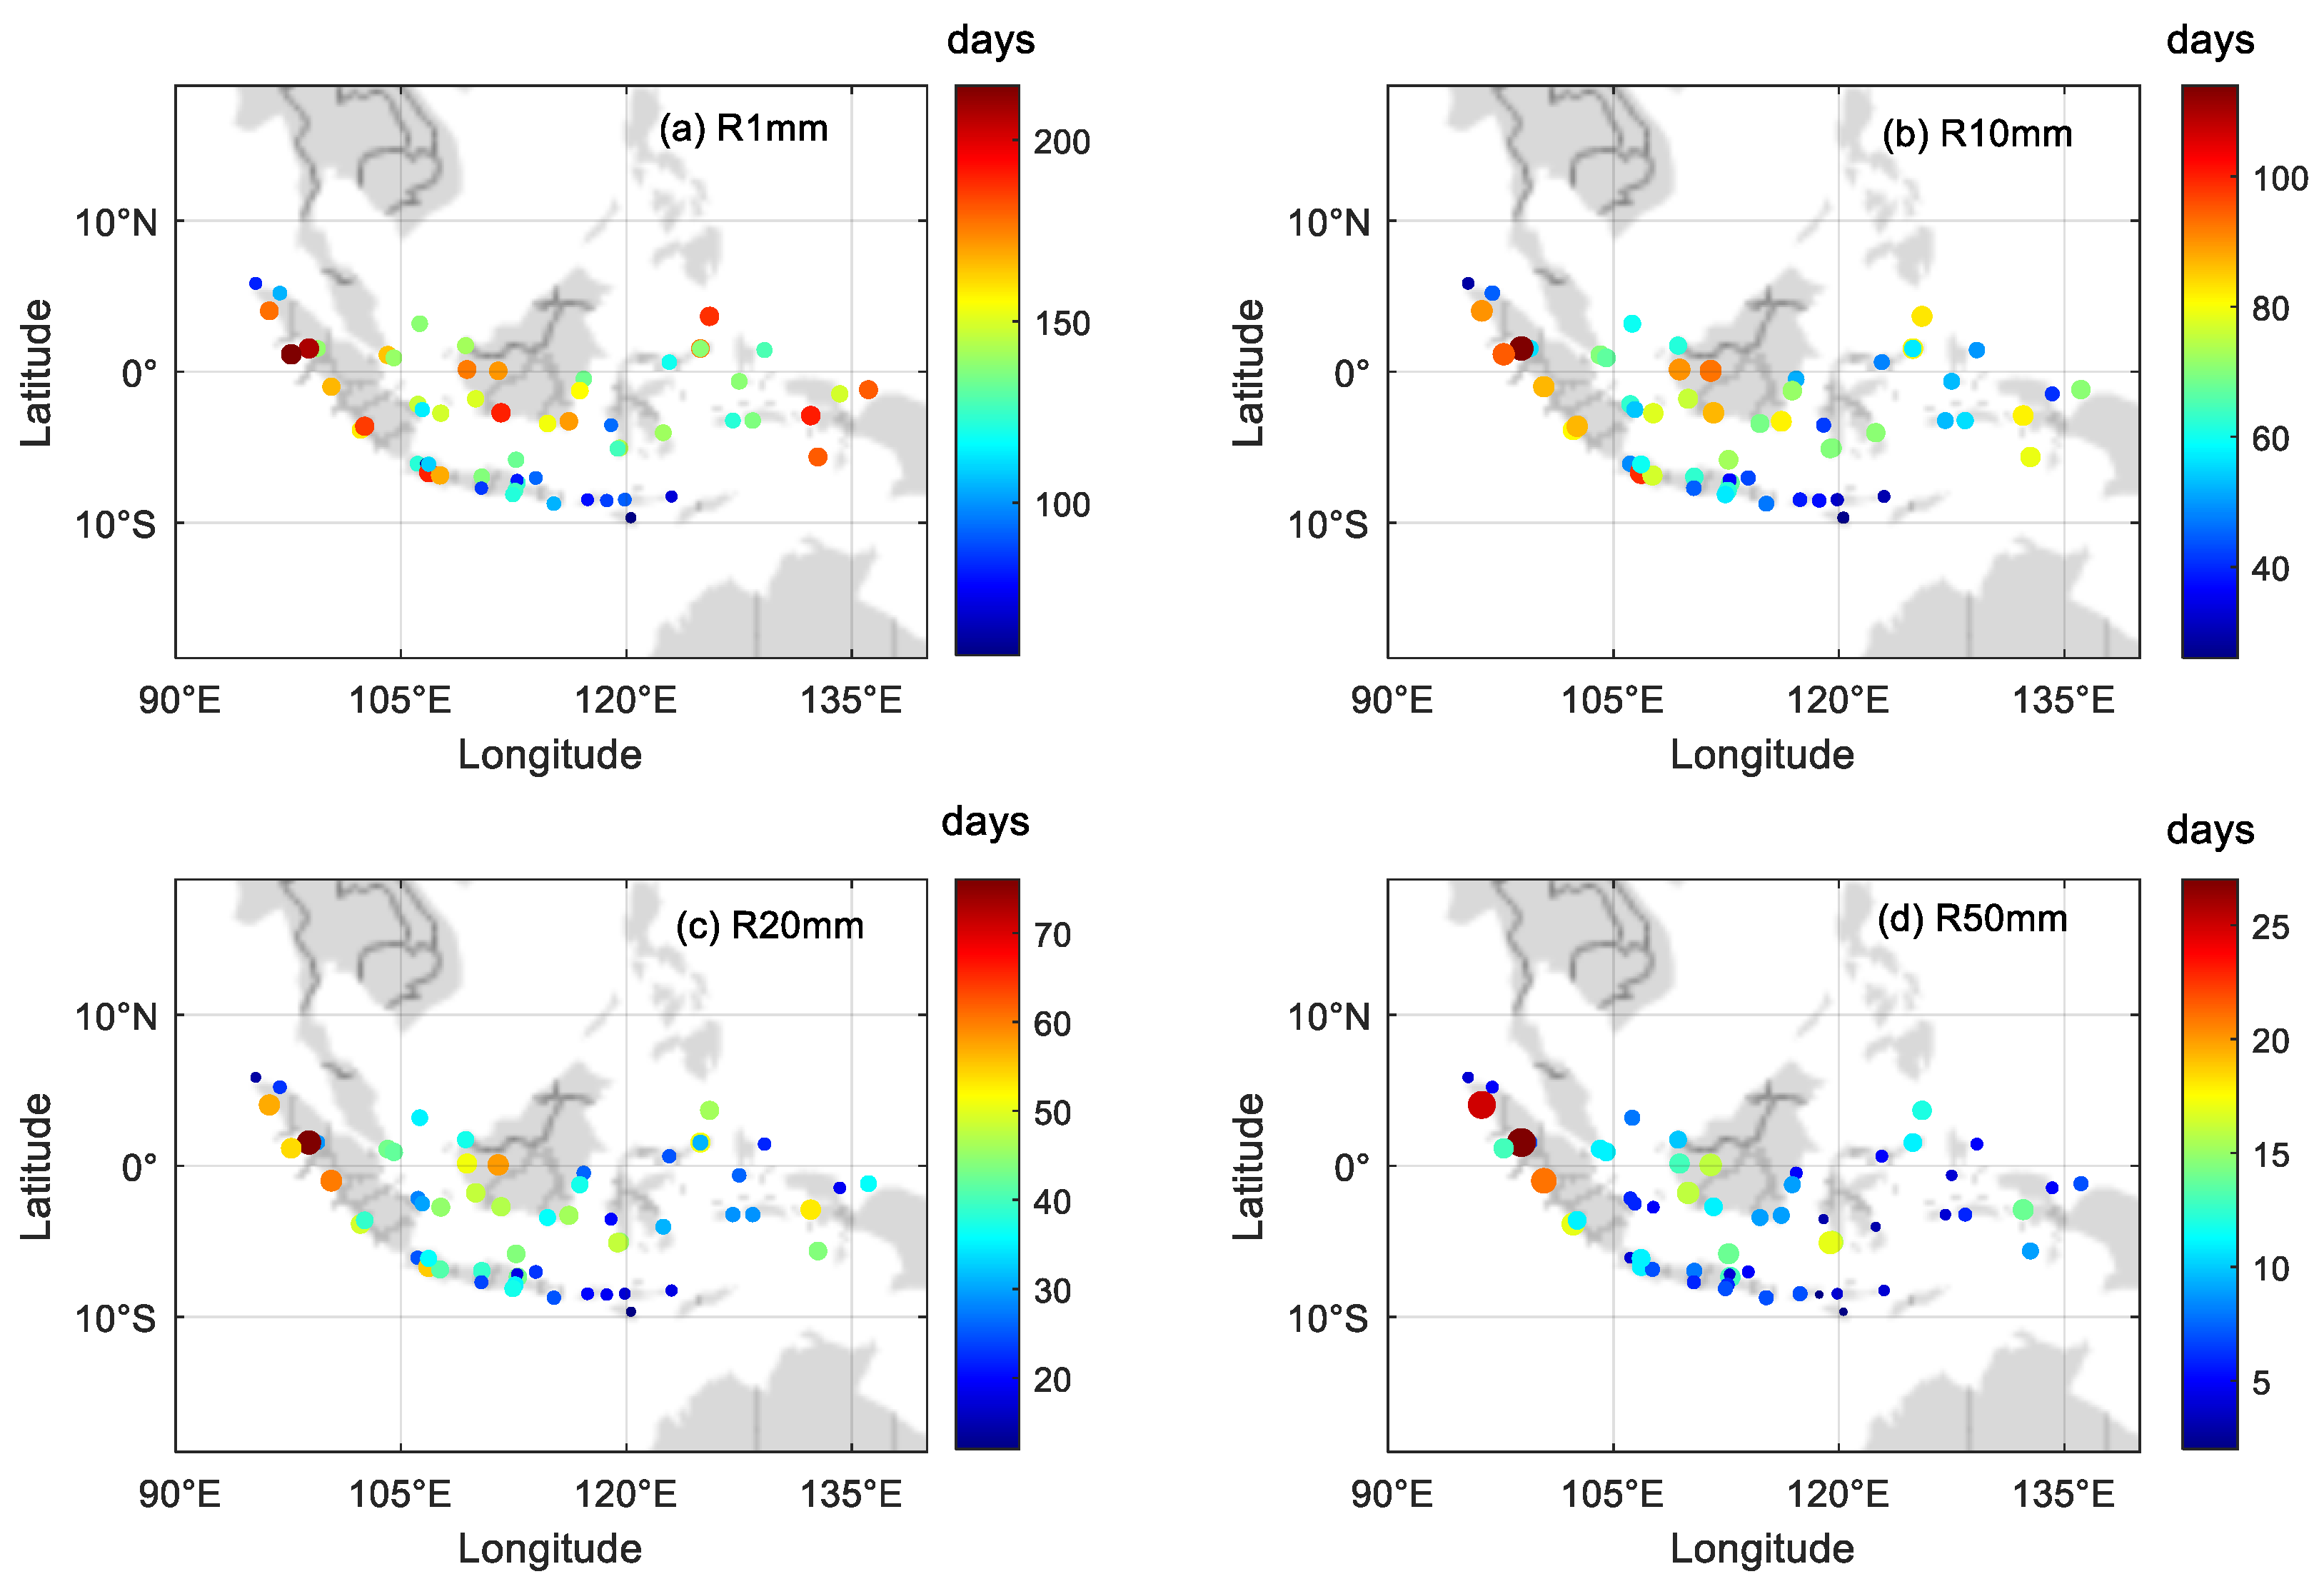
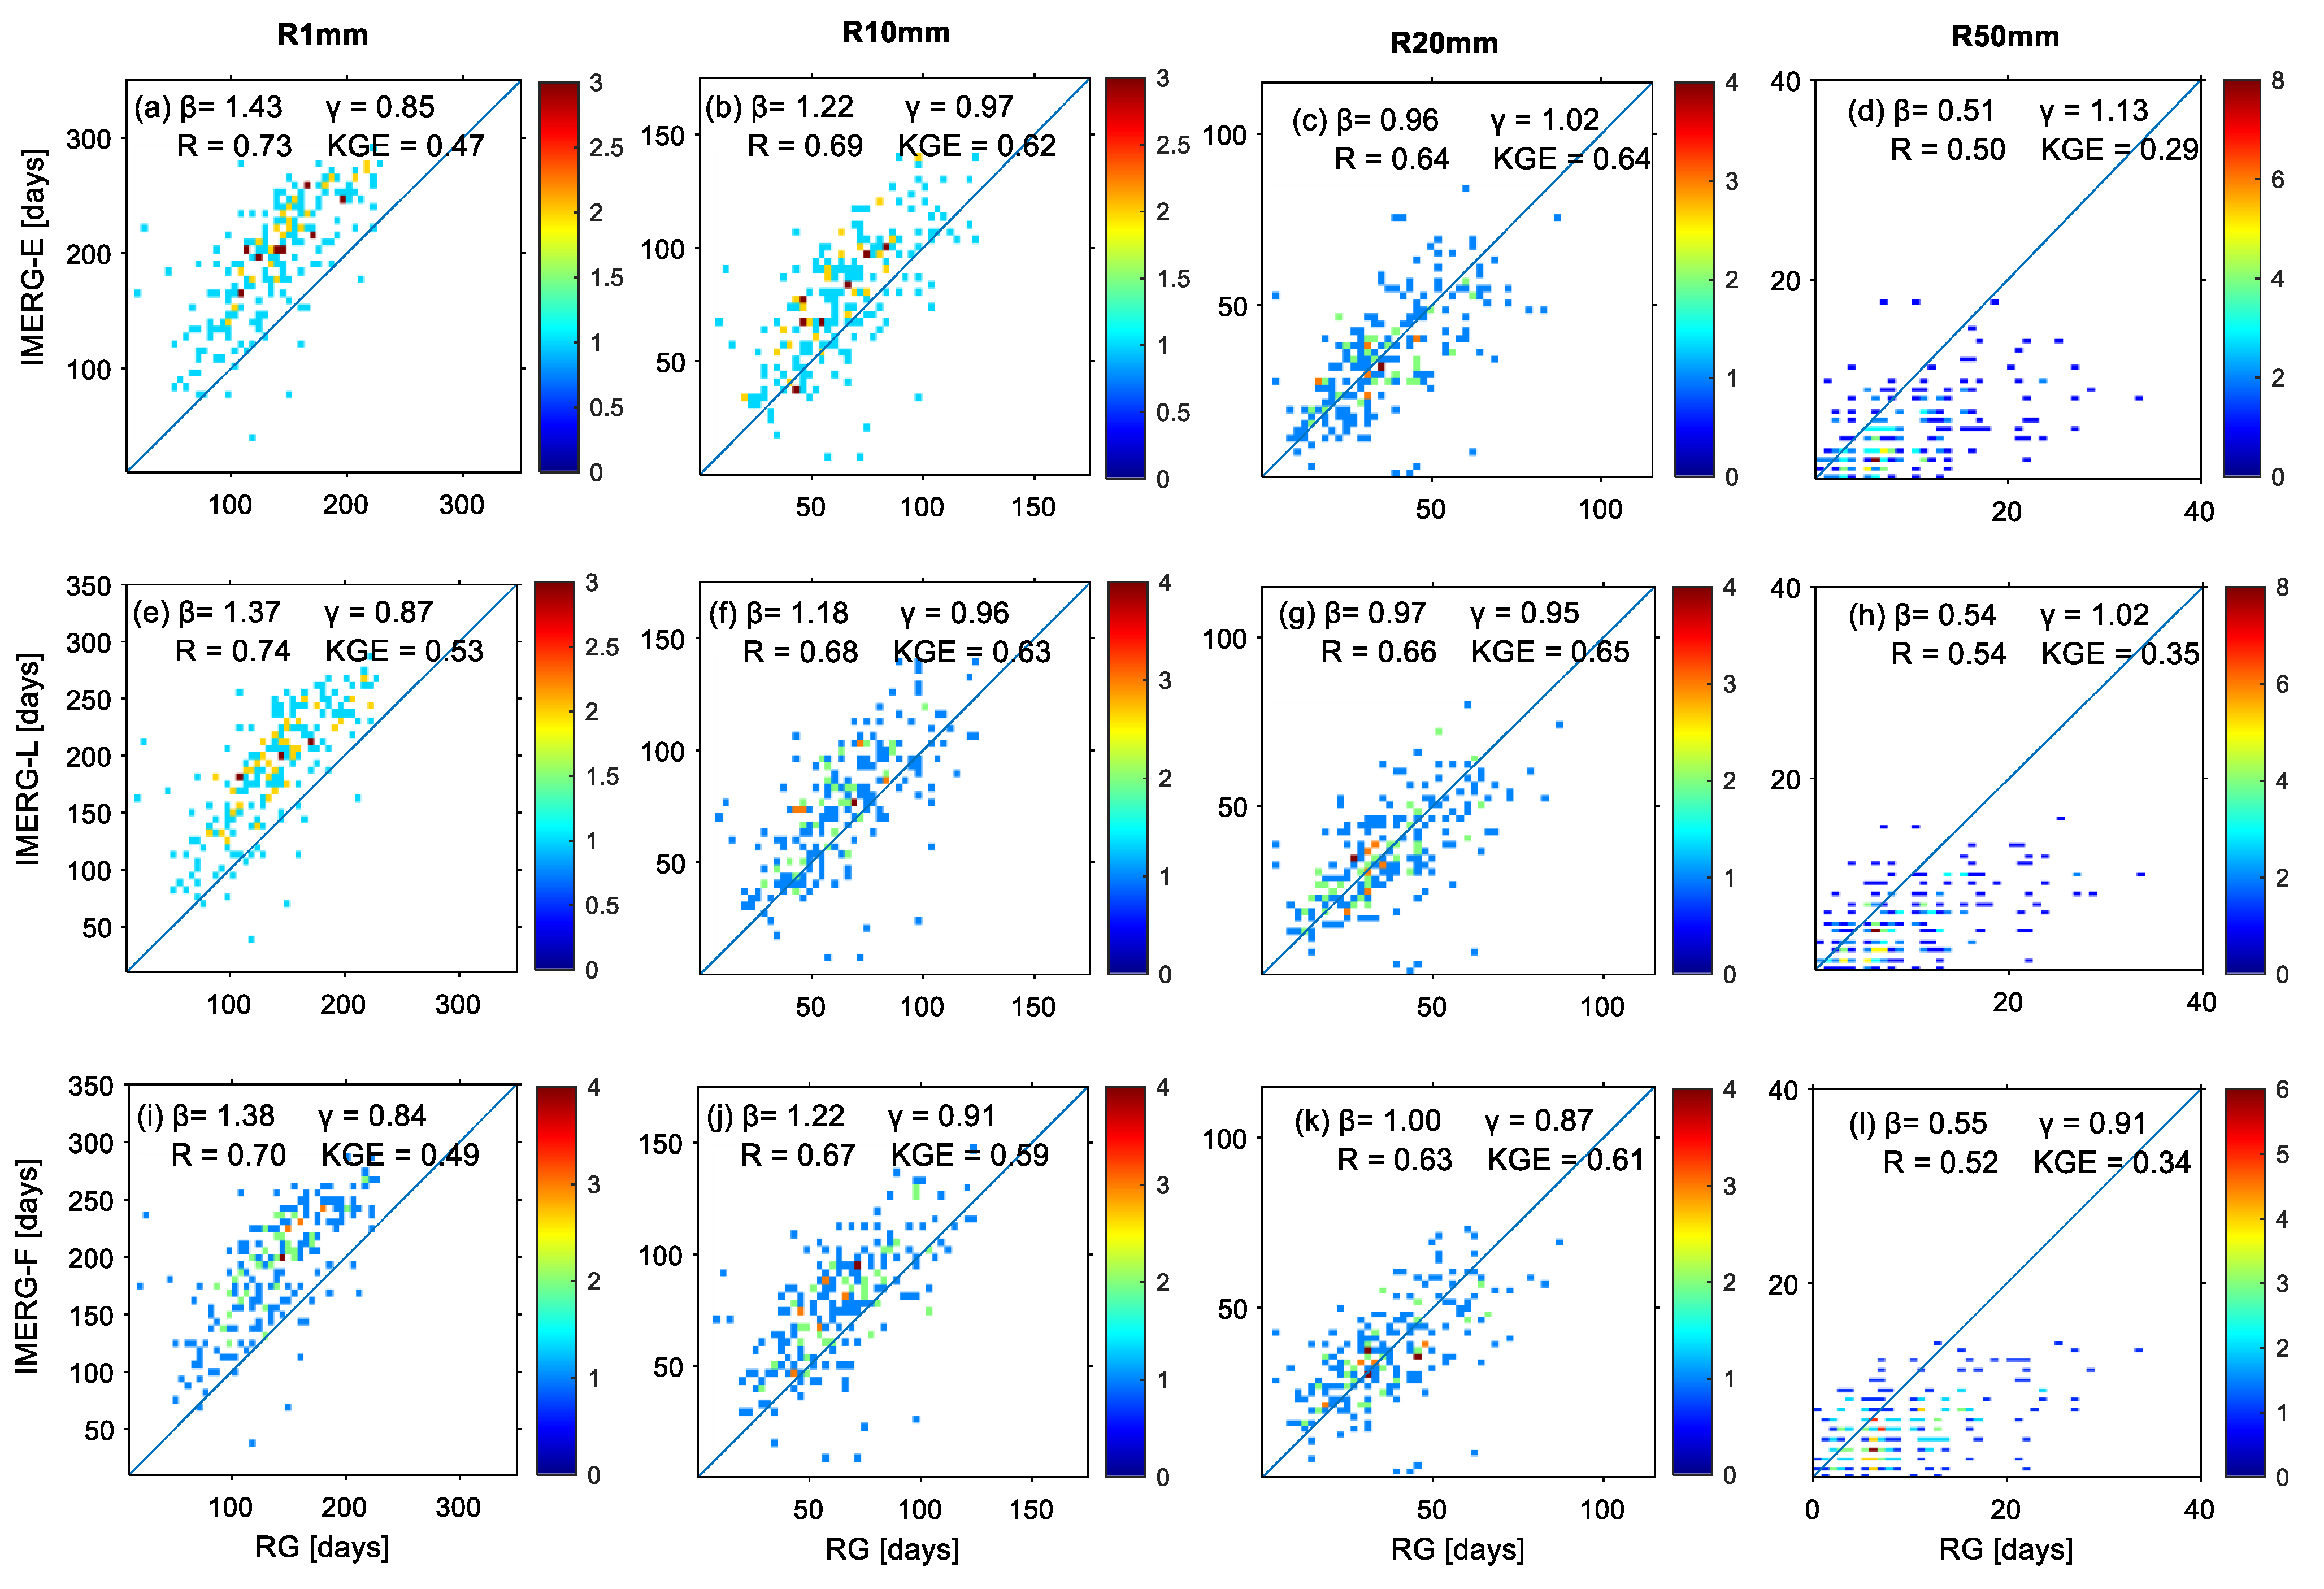
3.3. Precipitation-Frequency-Based Indices’ Assessment

The observations of precipitation-frequency-based indices were carried out using four rainfall thresholds, i.e., 1, 10, 20, and 50 mm day−1, abbreviated as R1mm, R10mm, R20mm, and R50mm, respectively. Each threshold represents a classification of daily rainfall, i.e., rainy day (1 mm day−1), heavy rain (10 mm day−1), very heavy rain (20 mm day−1), and extreme rain (50 mm day−1). The threshold of 50 mm day−1 was used as a percentile of extreme rainfall at IMC, as done in previous studies [17]. The mean values of the R1mm, R10mm, R20mm, and R50mm index observations in the IMC were 138, 64, 37, and 9 days, respectively. Figure 7 shows the distribution of the average value of frequency-based indices from each station in the IMC. Overall, the distribution of the average values of R1mm and R10mm in IMC (Figure 7a,b) showed a similar pattern to the PRCPTOT pattern (Figure 3a) indicating that the annual rainfall distribution pattern in the IMC was dominated by low rainfall. In addition, the distribution of R20mm values (Figure 7b) followed the distribution pattern of R85p, while R50mm (Figure 7d) followed the distribution pattern of R99p (Figure 3b–d). This similarity was correlated to the percentile values (R85p, R95p, and R99p) obtained, such that the value was close to the threshold value used in frequency-based indices.
Figure 8 presents the distribution of frequency-based indices’ values for all types of IMERG data. The observed R value of R1mm (Figure 8a) was found to be slightly better than that of PRCPTOT (Figure 4a) because the PRCPTOT measurement comprised all daily rainfall data, including rainfall below 1 mm day−1. This also became the reason for the use of a threshold of 1 mm day−1 in the validation of daily rainfall in several previous studies [82,95]. A good correlation (R > 0.7) was obtained for the observation of R1mm and a moderate correlation (0.5 ≤ R < 0.7) was obtained for R10mm, R20mm, and R50mm (Figure 8). The observed R values of all IMERG products showed insignificant differences for each frequency-based index. This indicated that the observation of frequency-based indices using IMERG data generally had a fairly good correlation with the RGs installed in the IMC.
A significant difference was observed in the value of the β parameter for each frequency-based index. The lower rainfall thresholds (R1mm and R10mm) tended toward overestimation as indicated by the β parameter value of >1 (Figure 8a,b,e,f,i,j), where the β value of for R1mm was found to be the highest. This overestimation tendency was consistent with the performances of IMERG found in other areas. Overestimation for rainfall between 1 to 20 mm day−1 and 1 to 50 mm day−1 were found in Singapore [50] and Malaysia [51], respectively. The overestimated IMERG capability in observing light to heavy rainfall was also observed in other areas [96,97,98]. In heavy rain (R20mm), the β value showed a very good value (~1) with a slight underestimation (Figure 8c,g,k). This was consistent with a study in Iran, where IMERG showed the best ability to observe daily rainfall with a threshold of 15 mm day−1 [59]. In the observation of very heavy rainfall (R50mm), IMERG observation tended toward underestimation (Figure 8d,h,l). The underestimation was highly significant with a value of ~0.52. The tendency of IMERG to underestimate rainfall above 50 mm day−1 was already reported in MC [50,51]. In contrast, the γ parameters of R20mm and R50mm indices, which tended to overestimate precipitation variability in the IMC, γ parameters of R1mm and R10mm indices tended to underestimate it (Figure 8). Thus, the spatial variability of IMERG was higher (lower) for the rainfall > 20 mm day−1 (<20 mm day−1), in comparison to RGs. This indicates that extreme rain comes from convective clouds, which tend to have a large spatial variability and short correlation distances [99]. Although there was a difference in the γ value from the observation of frequency-based indices by IMERG, the difference was insignificant and was close to the perfect value (~1), as also observed for all duration-based indices (Figure 6). These values indicated that IMERG could well observe the spatial variability of frequency-based indices in the IMC.
The variation of the parameter values of R, β, and γ in the observation of each precipitation-frequency-based index of each type of IMERG also resulted in the variation of the KGE values. The best KGE value was observed in the R10mm and R20mm indices and the lowest one was observed in the R50mm index. This value showed that the observation of frequency-based indices using IMERG was found to be at its best in the observation of the threshold of 10 and 20 mm day−1. While the observation of frequency-based indices by IMERG showed the poor results for the rain with a threshold of 50 mm day−1, in which it was also followed by the observations of R99p (Figure 4). In the observation of R1mm, the KGE value was found to be lower than that of R10mm and R20mm though the R value obtained was better. The low KGE value was determined by the high value of in the R1mm observation. This indicated a systematic error by IMERG in the observation of rainfall below 10 mm h−1. Meanwhile, the value of the validation matrices of frequency-based indices also did not show a significant difference from the three types of IMERG observations (Figure 8) indicating that all types of IMERG data had the similar capability in observing frequency-based indices.

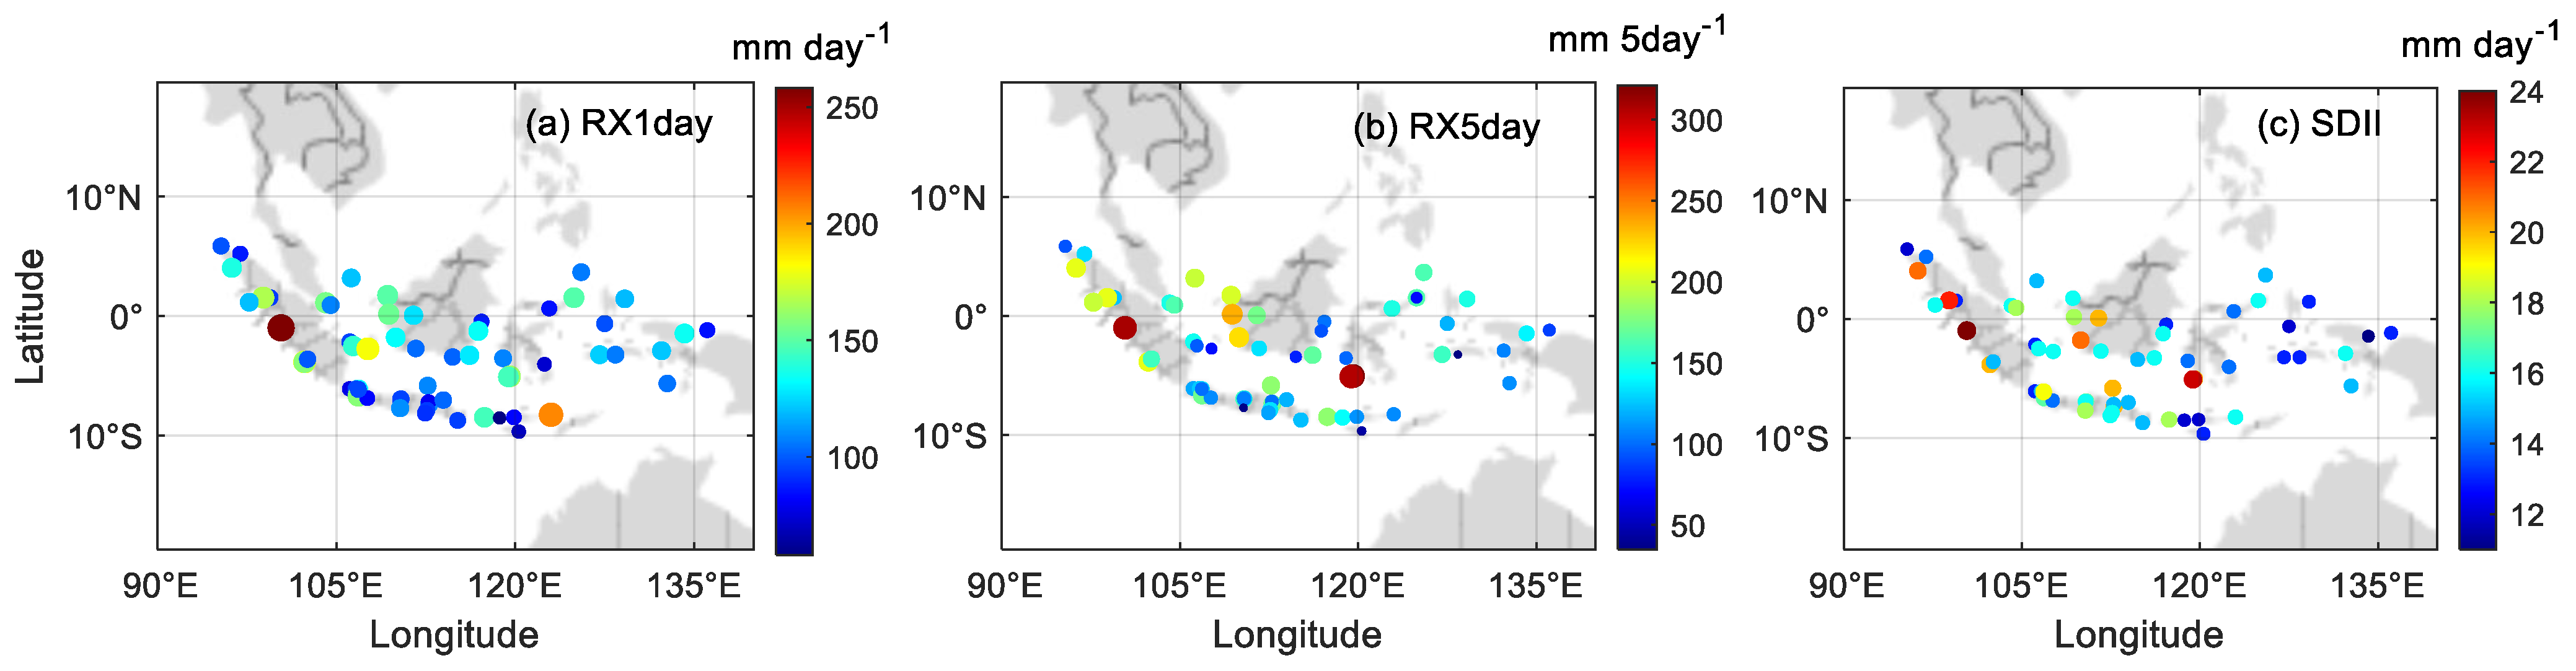
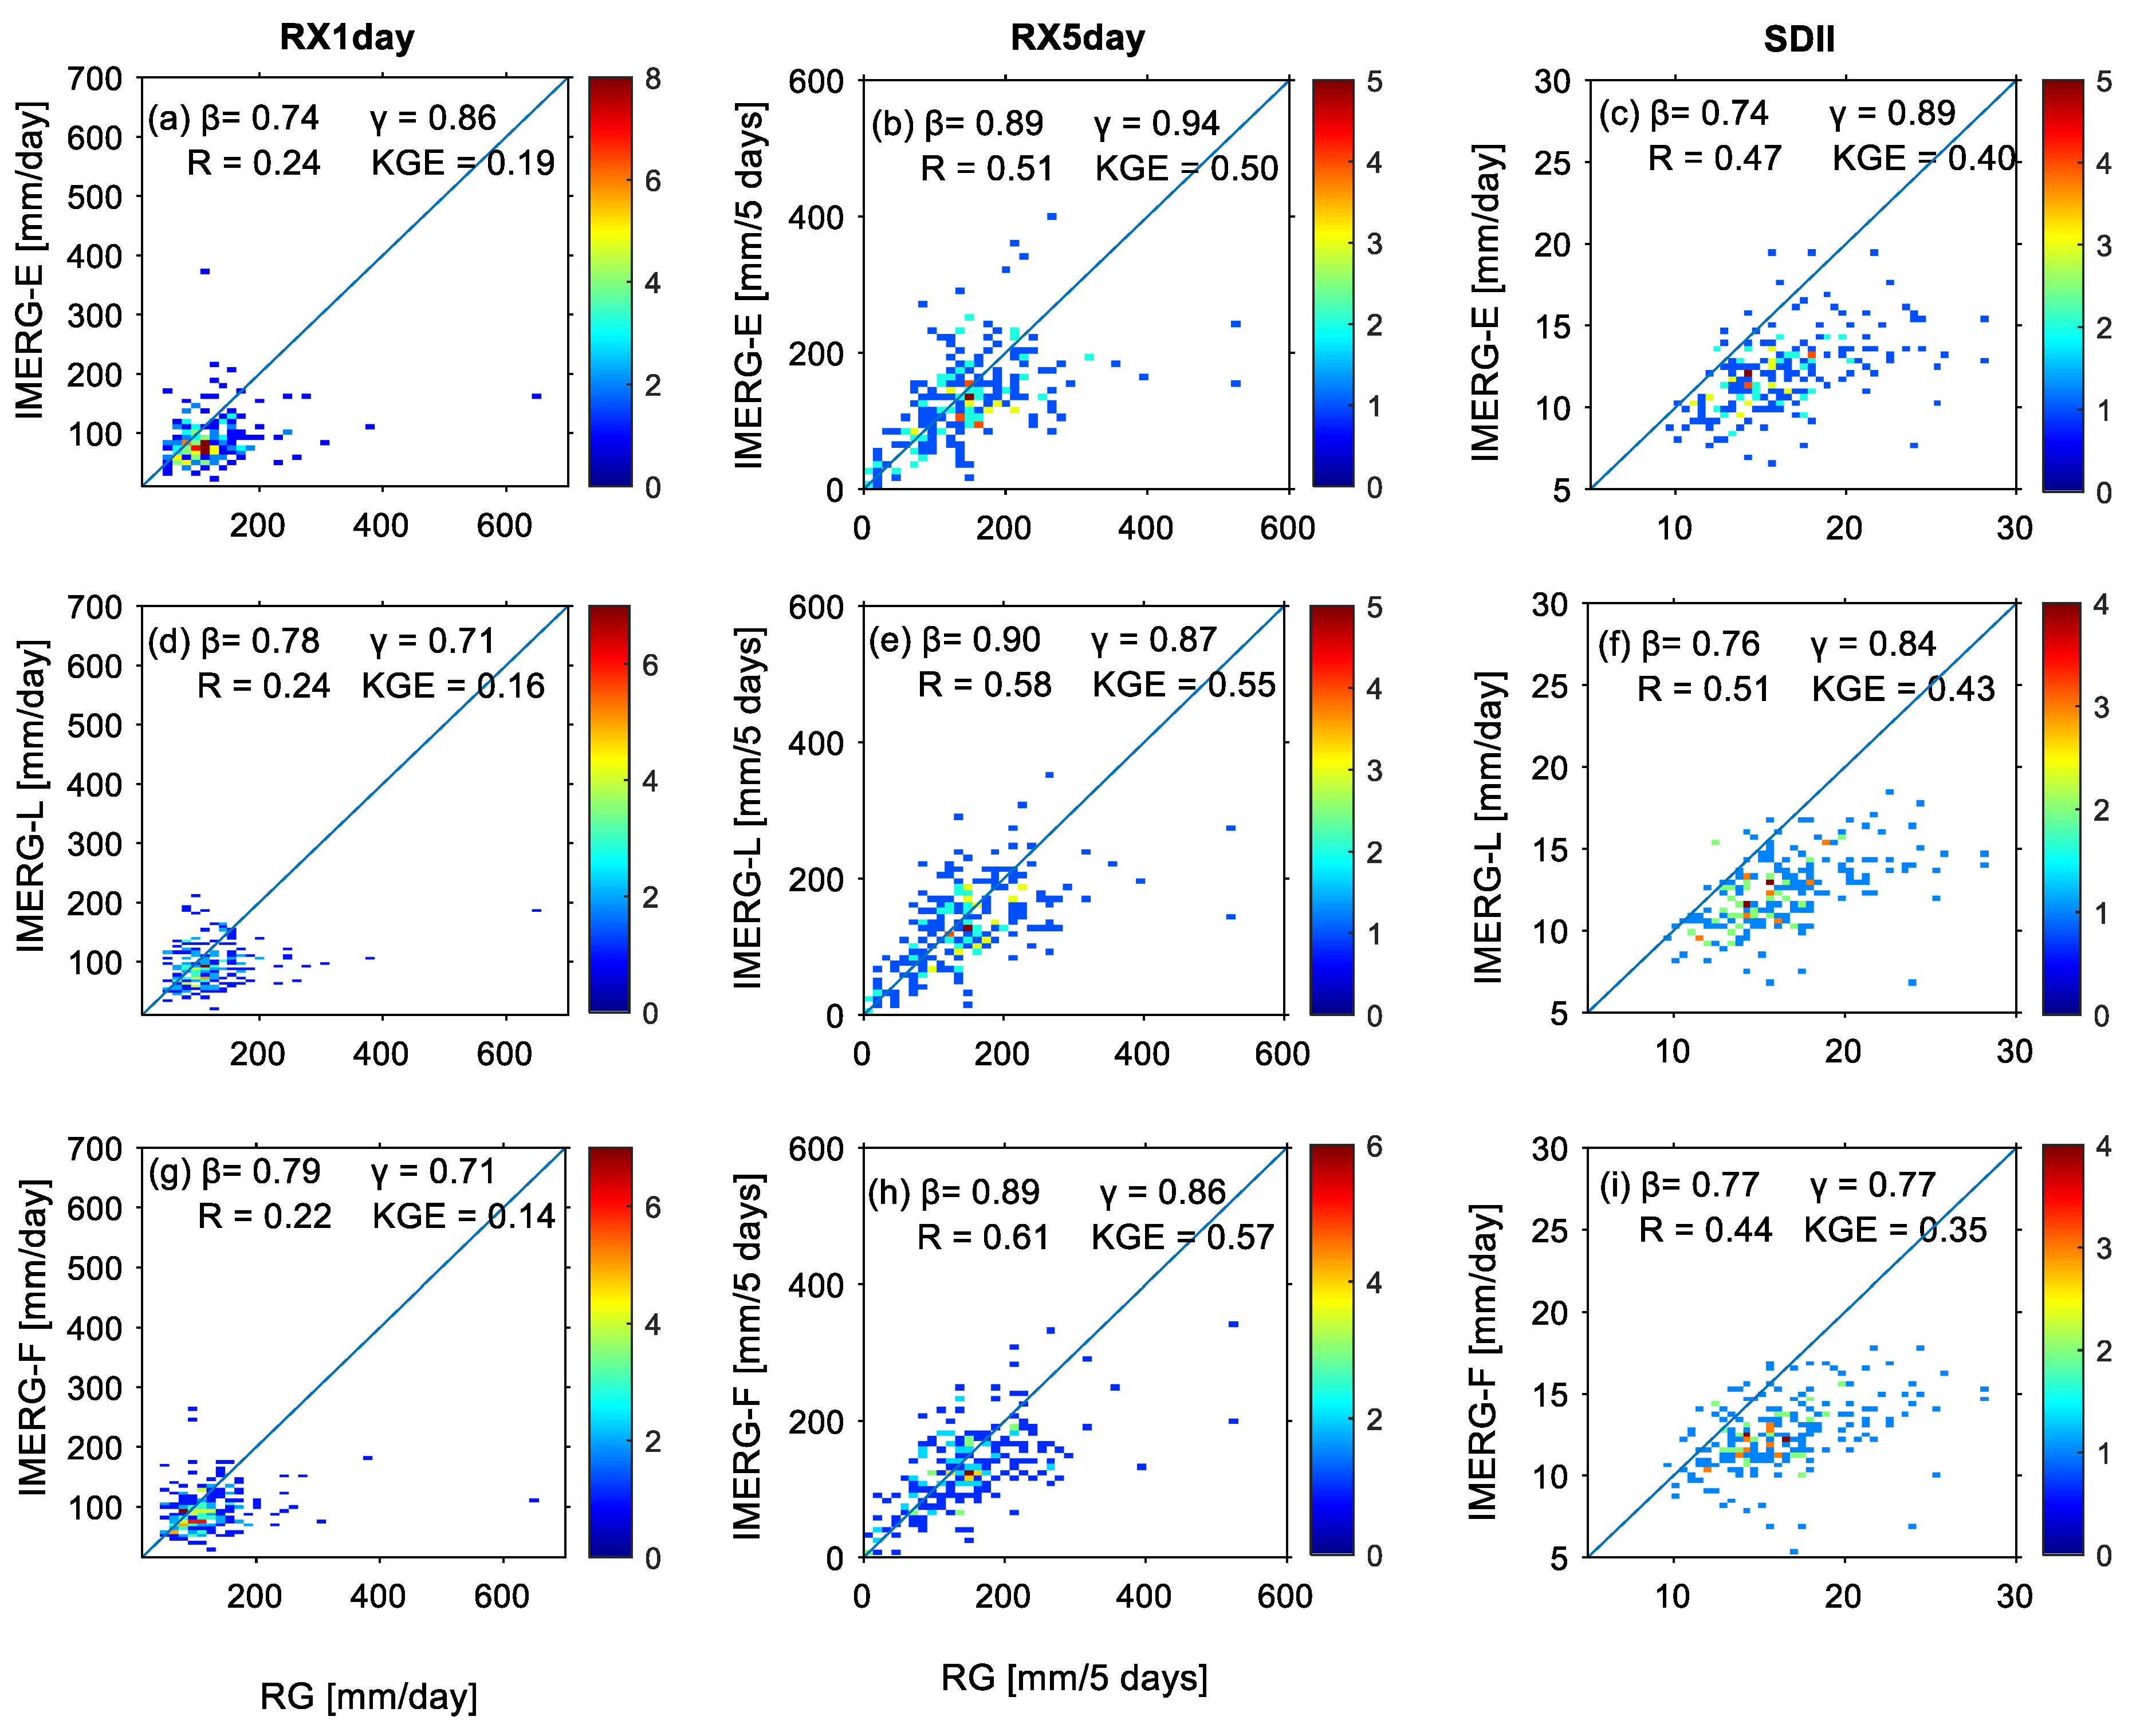
3.4. Precipitation-Intensity-Based Indices’ Assessment

The observation of precipitation-intensity-based indices was conducted for the maximum daily precipitation index (RX1day), maximum 5-day precipitation (RX5day), and the Simple Daily Intensity Index (SDII). The average value of RX1day, RX5day, and SDII from the RG stations in the IMC included 118.55 mm day−1, 148.15 mm 5 day−1, and 16.21 mm day−1, respectively. Figure 9 shows the distribution of the average values of RX1day, RX5day, and SDII from all RG stations. The distribution did not indicate any specific localization or zoning pattern of all intensity-based indices’ values in IMC. This was related to the dominant local convective system in the IMC area causing the peak of rainfall intensity to vary in each location [91]. The very high values of RX1day and RX5day were observed in West Sumatra, followed by a high R50mm, which resulted in high SDII values in the western region of Sumatra Island. The high frequency and intensity of extreme rain events in western Sumatra brought an impact on the high potential for floods and landslides in the area [18,87].
Figure 10 shows the distribution of the values of the intensity-based indices of IMERG and RG. A very low correlation (R < 0.3) was observed on RX1day, while RX5day showed a moderate correlation (0.5 < R < 0.7). This was consistent with a previous study in Bali [46]. Liu et al. [46] showed that IMERG had a much better correlation for 5-day data compared to daily data. This was related to the better ability of IMERG to observe the rainfall for longer temporal spans [100,101,102]. The correlation for SDII observations also showed a low value (R~0.47), which is consistent with the weak ability of IMERG in observing the R95p and R50mm indices. The higher the R95p and R50mm values, the higher the contribution of the two indices in SDII observations in IMC. Noted here, the SDII value refers to the ratio of the total annual rainfall to the total wet days.
All intensity-based indices showed an underestimated value, as seen from the value of β < 1 (Figure 10). The best value of β (~1) was observed in the RX5day index with a tendency of low underestimation. Though the value of RX5day was found to be better, the difference in the underestimated value of the overall intensity-based indices was insignificant. In addition, the observations of spatial variability intensity–based indices showed a good value (γ ~ 1) with a tendency to underestimate all indices for the IMERG products (E, L, and F). The underestimated value of intensity-based indices was related to the IMERG performance, which was less able to observe the extreme rainfall [53,58,103]. This was consistent with the observations of other extreme rain parameters such as R95p, R99p, and R50mm.
Several significant differences were observed in KGE parameters for all intensity-based indices due to the high difference in the R values of each index. The best KGE value was observed on the RX5day index (KGE > 0.5) and the lowest one was observed on the RX1day index (KGE < 0.2). This followed the distribution pattern as observed for the R values of RX5day and RX1day of IMERG (Figure 9). Overall, the observation of extreme rainfall intensity in 5 days was found to be much better than the daily one. Thus, the use of IMERG data with a 5-day timescale for observing extreme rain intensity at the IMC is more recommended than the daily timescale. Furthermore, the KGE value from SDII showed a fairly good value with a KGE value > 0.35. The observations of the three IMERG data types also did not show any significant differences for all intensity-based indices. Thus, the three IMERG data types had good capabilities in observing intensity-based indices.

4. Conclusions

IMERG showed differing capabilities in observing extreme rain in the IMC. Overall, IMERG was found to have good performances both for precipitation-amount-based and precipitation-frequency-based indices. A very good capability was found in the extreme rain index, with results worsening when moving from the R85p to the R95p, the R1mm, the R10mm, and the R20mm index, whereas worse skills were observed for the extreme rain index with high rainfall intensity (R99p, R50mm, RX1day). This was indicated by high KGE values (>0.4) for the PRCPTOT, R85p, R95p, R1mm, R10mm, R20mm, CDD, and RX5day indices with a tendency toward overestimation (β > 1). Furthermore, moderate KGE values (0–0.4) corresponded to the R99p, R50mm, RX1day, and SDII indices with an underestimation tendency (β < 1). Moreover, the observed low KGE values (<0) followed by a high overestimation (β ~ 1.9) were observed in the CWD index, caused by an overestimation of light rainfall and high FAR from IMERG daily rainfall data. IMERG was able to describe the spatial variability of extreme rain in the IMC, as seen from the variance ratio showing a very good value (γ ~ 1) for all extreme rain indices. From all the assessments carried out, IMERG-L showed the best capability in describing extreme rain in the IMC, but the difference with IMERG-E and IMERG-F was found to be insignificant. Thus, the data of IMERG-E and IMERG-L that have a much shorter latency than that of IMERG-F have the potential to be used in extreme rain observations and for flood modeling in the IMC. However, it can be seen that considerable biases exist in the IMERG data, so bias adjustment needs to be done before the data are used for the hydrological applications. Furthermore, the use of IMERG data to analyze extreme rain in IMC is highly dependent on the extreme index applied. For instance, because of the high FAR of the daily IMERG data, caution should be used when using and interpreting the CWD index based on IMERG data. In this work, we only validated the PrecipitationCal product, and a comparison of the current result with other IMERG products such as PrecipitationUnCal, HQprecipitation, and IRprecipitation rainfall as well as other satellite-based products will strengthen and complement the results of this study. In addition, a detailed analysis of several cases of extreme rain that caused natural disasters in the IMC will also provide a better insight in the value of IMERG products for early warning applications.

Author Contributions

Conceptualization, R.R. and M.M.; methodology, M.M and R.R.; software, R.R., H.Y. and M.M; validation, M.M.; formal analysis, R.R., M.M. and H.Y.; investigation, R.R., M.M. and H.Y.; resources, M.M, R.R., H.Y. and R.M.; data curation, M.M, R.R., H.Y. and R.M.; writing—original draft preparation, R.R. and H.Y.; writing—review and editing, M.M., R.R., W.S., S.S., R.M., M.V., A.B. and H.H.; visualization, R.R. and H.Y.; supervision, M.M., A.B., H.H., W.S. and S.S.; project administration, H.Y.; funding acquisition, M.M. All authors have read and agreed to the published version of the manuscript.

Funding

This study was supported by 2021–2022 Basic Research Grants from Indonesian Ministry of Education and Culture (contract no: 104/E4.1/AK.04.PT/2021).

Data Availability Statement

All data used in this study are available upon request.

Acknowledgments

Rain gauges (RGs) were operated by the Agency for Meteorology, Climatology and Geophysics of Republic Indonesia (BMKG). We also thank the National Aeronautics and Space Administration (NASA) for providing IMERG data.

Conflicts of Interest

The authors declare no conflict of interest.

References

  1. Dentener, F.J.; Easterling, D.R.; Cooper, O. Chapter 2: Observations: Atmosphere and Surface. In IPCC Climate Change 2013: The Physical Science Basis; IPCC: Geneva, Switzerland, 2013. [Google Scholar]
  2. Pfahl, S.; O’Gorman, P.A.; Fischer, S.P.E.M. Understanding the regional pattern of projected future changes in extreme precipitation. Nat. Clim. Chang. 2017, 7, 423–427. [Google Scholar] [CrossRef]
  3. Gao, L.; Huang, J.; Chen, X.; Chen, Y.; Liu, M. Contributions of natural climate changes and human activities to the trend of extreme precipitation. Atmos. Res. 2018, 205, 60–69. [Google Scholar] [CrossRef]
  4. Eekhout, J.P.C.; Hunink, J.E.; Terink, W.; de Vente, J. Why increased extreme precipitation under climate change negatively affects water security. Hydrol. Earth Syst. Sci. 2018, 22, 5935–5946. [Google Scholar] [CrossRef] [Green Version]
  5. Myhre, G.; Alterskjær, K.; Stjern, C.W.; Hodnebrog, Ø.; Marelle, L.; Samset, B.H.; Sillmann, J.; Schaller, N.; Fischer, E.; Schulz, M.; et al. Frequency of extreme precipitation increases extensively with event rareness under global warming. Sci. Rep. 2019, 9, 1–10. [Google Scholar] [CrossRef] [Green Version]
  6. Ossandón, Á.; Rajagopalan, , B.; Kleiber, W. Spatial-temporal multivariate semi-Bayesian hierarchical framework for extreme precipitation frequency analysis. J. Hydrol. 2021, 600, 126499. [Google Scholar] [CrossRef]
  7. Tabari, H. Climate change impact on flood and extreme precipitation increases with water availability. Sci. Rep. 2020, 10, 1–10. [Google Scholar] [CrossRef]
  8. Kirschbaum, D.B.; Adler, R.F.; Adler, D.S.; Peters-Lidard, C.; Huffman, G. Global Distribution of Extreme Precipitation and High-Impact Landslides in 2010 Relative to Previous Years. J. Hydrometeorol. 2012, 13, 1536–1551. [Google Scholar] [CrossRef] [Green Version]
  9. Ávila, A.; Justino, F.; Wilson, A.; Bromwich, D.; Amorim, M. Recent precipitation trends, flash floods and landslides in southern Brazil. Environ. Res. Lett. 2016, 11, 114029. [Google Scholar] [CrossRef]
  10. Spinoni, J.; Barbosa, P.; Bucchignani, E.; Cassano, J.; Cavazos, T.; Christensen, J.H.; Christensen, O.B.; Coppola, E.; Evans, J.; Geyer, B.; et al. Future Global Meteorological Drought Hot Spots: A Study Based on CORDEX Data. J. Clim. 2020, 33, 3635–3661. [Google Scholar] [CrossRef]
  11. Ulfah, S.; Marzuki, M.; Susilo, A. Analysis Vulnerability Disaster of Landslide in Lantan Village Using Geoelectric Data and Sentinel Image. J. Penelit. Pendidik. IPA 2021, 7, 794–801. [Google Scholar] [CrossRef]
  12. Trezzini, F.; Giannella, G.; Guida, T. Landslide and Flood: Economic and Social Impacts in Italy. In Landslide Science and Practice: Social and Economic Impact and Policies; Springer: Berlin/Heidelberg, Germany, 2013. [Google Scholar]
  13. Salvati, P.; Petrucci, O.; Rossi, M.; Bianchi, C.; Pasqua, A.A.; Guzzetti, F. Gender, age and circumstances analysis of flood and landslide fatalities in Italy. Sci. Total Environ. 2018, 610–611, 867–879. [Google Scholar] [CrossRef]
  14. Winter, M.G.; Peeling, D.; Palmer, D.; Peeling, J. Economic impacts of landslides and floods on a road network. AUC Geogr. 2019, 54, 207–220. [Google Scholar] [CrossRef] [Green Version]
  15. Simpson, J.; Keenan, T.D.; Ferrier, B.; Simpson, R.H.; Holland, G.J. Cumulus mergers in the maritime continent region. Theor. Appl. Clim. 1993, 51, 73–99. [Google Scholar] [CrossRef]
  16. Wu, P.; Arbain, A.A.; Mori, S.; Hamada, J.-I.; Hattori, M.; Syamsudin, F.; Yamanaka, M.D. The Effects of an Active Phase of the Madden-Julian Oscillation on the Extreme Precipitation Event over Western Java Island in January 2013. Sci. Online Lett. Atmos. 2013, 9, 79–83. [Google Scholar] [CrossRef] [Green Version]
  17. Supari; Tangang, F.; Juneng, L.; Aldrian, E. Observed changes in extreme temperature and precipitation over Indonesia. Int. J. Clim. 2017, 37, 1979–1997. [Google Scholar] [CrossRef]
  18. Baranowski, D.B.; Flatau, M.K.; Flatau, P.J.; Karnawati, D.; Barabasz, K.; Labuz, M.; Latos, B.; Schmidt, J.M.; Paski, J.A.I. Marzuki Social-media and newspaper reports reveal large-scale meteorological drivers of floods on Sumatra. Nat. Commun. 2020, 11, 1–10. [Google Scholar] [CrossRef] [PubMed]
  19. Marzuki, H.H.; Shimomai, T.; Randeu, W.L. Cumulative Distributions of Rainfall Rate Over Sumatra. Prog. Electromagn. Res. M 2016, 49, 1–8. [Google Scholar] [CrossRef] [Green Version]
  20. Marzuki, H.H.; Kozu, T.; Shimomai, T.; Shibagaki, Y.; Takahashi, Y. Precipitation microstructure in different Madden–Julian Oscillation phases over Sumatra. Atmos. Res. 2016, 168, 121–138. [Google Scholar] [CrossRef]
  21. Takama, T.; Aldrian, E.; Kusumaningtyas, S.D.A.; Sulistya, W. Identified vulnerability contexts for a paddy production assessment with climate change in Bali, Indonesia. Clim. Dev. 2016, 9, 110–123. [Google Scholar] [CrossRef]
  22. Muis, I.; Ismail; Erlangga, H. Engkus Post disaster social vulnerability: Policy analysis and implementation in communities in Indonesia. J. Crit. Rev. 2019, 6, 59–66. [Google Scholar] [CrossRef]
  23. Handayani, W.; Chigbu, U.E.; Rudiarto, I.; Putri, I.H.S. Urbanization and Increasing Flood Risk in the Northern Coast of Central Java—Indonesia: An Assessment towards Better Land Use Policy and Flood Management. Land 2020, 9, 343. [Google Scholar] [CrossRef]
  24. BNPB. Available online: https://dibi.bnpb.go.id/ (accessed on 17 November 2021).
  25. Tangang, F.; Supari, S.; Chung, J.X.; Cruz, F.; Salimun, E.; Ngai, S.T.; Juneng, L.; Santisirisomboon, J.; Santisirisomboon, J.; Ngo-Duc, T.; et al. Future changes in annual precipitation extremes over Southeast Asia under global warming of 2 °C. APN Sci. Bull. 2018, 8, 436. [Google Scholar] [CrossRef] [Green Version]
  26. Supari; Tangang, F.; Juneng, L.; Cruz, F.; Chung, J.X.; Ngai, S.T.; Salimun, E.; Mohd, M.S.F.; Santisirisomboon, J.; Singhruck, P.; et al. Multi-model projections of precipitation extremes in Southeast Asia based on CORDEX-Southeast Asia simulations. Environ. Res. 2020, 184, 109350. [Google Scholar] [CrossRef]
  27. Villarini, G.; Mandapaka, P.V.; Krajewski, W.F.; Moore, R.J. Rainfall and sampling uncertainties: A rain gauge perspective. J. Geophys. Res. Atmos. 2008, 113, 9214. [Google Scholar] [CrossRef]
  28. Boni, G.; Parodi, A.; Rudari, R. Extreme rainfall events: Learning from raingauge time series. J. Hydrol. 2006, 327, 304–314. [Google Scholar] [CrossRef]
  29. Nandargi, S.; Dhar, O.N. Extreme rainfall events over the Himalayas between 1871 and 2007. Hydrol. Sci. J. 2011, 56, 930–945. [Google Scholar] [CrossRef] [Green Version]
  30. Supari; Tangang, F.; Salimun, E.; Aldrian, E.; Sopaheluwakan, A.; Juneng, L. ENSO modulation of seasonal rainfall and extremes in Indonesia. Clim. Dyn. 2018, 51, 2559–2580. [Google Scholar] [CrossRef]
  31. Lengfeld, K.; Kirstetter, P.-E.; Fowler, H.J.; Yu, J.; Becker, A.; Flamig, Z.; Gourley, J.J. Use of radar data for characterizing extreme precipitation at fine scales and short durations. Environ. Res. Lett. 2020, 15, 085003. [Google Scholar] [CrossRef]
  32. Kidd, C.; Becker, A.; Huffman, G.; Muller, C.L.; Joe, P.; Skofronick-Jackson, G.; Kirschbaum, D. So, How Much of the Earth’s Surface Is Covered by Rain Gauges? Bull. Am. Meteorol. Soc. 2017, 98, 69–78. [Google Scholar] [CrossRef]
  33. Meischner, P. Weather Radar: Principles and Advanced Applications; Springer: Berlin/Heidelberg, Germany, 2005; ISBN 3540003282. [Google Scholar]
  34. Indonesian Agency for Meteorological. Climatological and Geophysics-Weather Radar. Available online: https://www.bmkg.go.id/cuaca/citra-radar.bmkg?lang=EN (accessed on 18 November 2021).
  35. Paski, J.A.I.; Alfahmi, F.; Permana, D.S.; Makmur, E.E.S. Reconstruction of Extreme Rainfall Event on September 19-20, 2017, Using a Weather Radar in Bengkulu of Sumatra Island. Sci. World J. 2020, 2020, 1–6. [Google Scholar] [CrossRef] [PubMed]
  36. Lewandowski, P.A.; Eichinger, W.E.; Kruger, A.; Krajewski, W.F. Lidar-Based Estimation of Small-Scale Rainfall: Empirical Evidence. J. Atmos. Ocean. Technol. 2009, 26, 656–664. [Google Scholar] [CrossRef]
  37. Shipley, S.T.; Eloranta, E.W.; Weinman, J.A. Measurement of Rainfall Rates by Lidar. J. Appl. Meteorol. 1974, 13, 800–807. [Google Scholar] [CrossRef] [Green Version]
  38. Mandapaka, P.V.; Lewandowski, P.; Eichinger, W.E.; Krajewski, W.F. Multiscaling analysis of high resolution space-time lidar-rainfall. Nonlinear Process. Geophys. 2009, 16, 579–586. [Google Scholar] [CrossRef] [Green Version]
  39. Mega, T.; Yamamoto, M.K.; Abo, M.; Shibata, Y.; Hashiguchi, H.; Nishi, N.; Shimomai, T.; Shibagaki, Y.; Yamamoto, M.; Yamanaka, M.D.; et al. First simultaneous measurement of vertical air velocity, particle fall velocity, and hydrometeor sphericity in stratiform precipitation: Results from 47 MHz wind-profiling radar and 532 nm polarization lidar observations. Radio Sci. 2012, 47, 4823. [Google Scholar] [CrossRef]
  40. Kurniadi, A.; Weller, E.; Min, S.; Seong, M. Independent ENSO and IOD impacts on rainfall extremes over Indonesia. Int. J. Clim. 2021, 41, 3640–3656. [Google Scholar] [CrossRef]
  41. Lubis, S.W.; Respati, M.R. Impacts of convectively coupled equatorial waves on rainfall extremes in Java, Indonesia. Int. J. Clim. 2021, 41, 2418–2440. [Google Scholar] [CrossRef]
  42. Muhammad, F.R.; Lubis, S.W.; Setiawan, S. Impacts of the Madden–Julian oscillation on precipitation extremes in Indonesia. Int. J. Clim. 2021, 41, 1970–1984. [Google Scholar] [CrossRef]
  43. Xiao, S.; Xia, J.; Zou, L. Evaluation of Multi-Satellite Precipitation Products and Their Ability in Capturing the Characteristics of Extreme Climate Events over the Yangtze River Basin, China. Water 2020, 12, 1179. [Google Scholar] [CrossRef] [Green Version]
  44. Kitoh, A.; Endo, H. Changes in precipitation extremes projected by a 20-km mesh global atmospheric model. Weather. Clim. Extremes 2016, 11, 41–52. [Google Scholar] [CrossRef] [Green Version]
  45. Jiang, S.; Liu, S.; Ren, L.; Yong, B.; Zhang, L.; Wang, M.; Lu, Y.; He, Y. Hydrologic Evaluation of Six High Resolution Satellite Precipitation Products in Capturing Extreme Precipitation and Streamflow over a Medium-Sized Basin in China. Water 2017, 10, 25. [Google Scholar] [CrossRef] [Green Version]
  46. Liu, C.-Y.; Aryastana, P.; Liu, G.-R.; Huang, W.-R. Assessment of satellite precipitation product estimates over Bali Island. Atmos. Res. 2020, 244, 105032. [Google Scholar] [CrossRef]
  47. Pinto, I.; Lennard, C.; Tadross, M.; Hewitson, B.; Dosio, A.; Nikulin, G.; Panitz, H.-J.; Shongwe, M.E. Evaluation and projections of extreme precipitation over southern Africa from two CORDEX models. Clim. Change 2015, 135, 655–668. [Google Scholar] [CrossRef] [Green Version]
  48. Jiang, L.; Bauer-Gottwein, P. How do GPM IMERG precipitation estimates perform as hydrological model forcing? Evaluation for 300 catchments across Mainland China. J. Hydrol. 2019, 572, 486–500. [Google Scholar] [CrossRef]
  49. Endo, H.; Kitoh, A.; Mizuta, R.; Ishii, M. Future Changes in Precipitation Extremes in East Asia and Their Uncertainty Based on Large Ensemble Simulations with a High-Resolution AGCM. Sci. Onilne Lett. Atmos. 2017, 13, 7–12. [Google Scholar] [CrossRef] [Green Version]
  50. Tan, M.L.; Duan, Z. Assessment of GPM and TRMM Precipitation Products over Singapore. Remote Sens. 2017, 9, 720. [Google Scholar] [CrossRef] [Green Version]
  51. Tan, M.L.; Santo, H. Comparison of GPM IMERG, TMPA 3B42 and PERSIANN-CDR satellite precipitation products over Malaysia. Atmos. Res. 2018, 202, 63–76. [Google Scholar] [CrossRef]
  52. Huffman, G.J.; Bolvin, D.T.; Braithwaite, D.; Hsu, K.; Joyce, R.; Kidd, C.; Nelkin, E.J.; Xie, P. NASA Global Precipitation Measurement (GPM) Integrated Multi-Satellite Retrievals for GPM (IMERG); Algorithm Theor. Basis Doc. Version 4.5; NASA: Washington, DC, USA, 2015. [Google Scholar]
  53. Fang, J.; Yang, W.; Luan, Y.; Du, J.; Lin, A.; Zhao, L. Evaluation of the TRMM 3B42 and GPM IMERG products for extreme precipitation analysis over China. Atmos. Res. 2019, 223, 24–38. [Google Scholar] [CrossRef]
  54. Zhou, C.; Gao, W.; Hu, J.; Du, L.; Du, L. Capability of IMERG V6 Early, Late, and Final Precipitation Products for Monitoring Extreme Precipitation Events. Remote Sens. 2021, 13, 689. [Google Scholar] [CrossRef]
  55. Yang, M.; Liu, G.; Chen, T.; Chen, Y.; Xia, C. Evaluation of GPM IMERG precipitation products with the point rain gauge records over Sichuan, China. Atmos. Res. 2020, 246, 105101. [Google Scholar] [CrossRef]
  56. Li, P.; Xu, Z.; Ye, C.; Ren, M.; Chen, H.; Wang, J.; Song, S. Assessment on IMERG V06 Precipitation Products Using Rain Gauge Data in Jinan City, Shandong Province, China. Remote Sens. 2021, 13, 1241. [Google Scholar] [CrossRef]
  57. Mayor, Y.G.; Tereshchenko, I.; Fonseca-Hernández, M.; Pantoja, D.A.; Montes, J.M. Evaluation of Error in IMERG Precipitation Estimates under Different Topographic Conditions and Temporal Scales over Mexico. Remote Sens. 2017, 9, 503. [Google Scholar] [CrossRef] [Green Version]
  58. Da Silva, N.A.; Webber, B.G.M.; Matthews, A.J.; Feist, M.M.; Stein, T.H.M.; Holloway, C.E.; Abdullah, M.F.A.B. Validation of GPM IMERG Extreme Precipitation in the Maritime Continent by Station and Radar Data. Earth Space Sci. 2021, 8, 1738. [Google Scholar] [CrossRef]
  59. Sharifi, E.; Steinacker, R.; Saghafian, B. Multi time-scale evaluation of high-resolution satellite-based precipitation products over northeast of Austria. Atmos. Res. 2018, 206, 46–63. [Google Scholar] [CrossRef]
  60. Ravidho, R.; Marzuki, M.; Helmi, Y.; Ayu, P.N.; Hiroyuki, H.; Toyoshi, S.; Vonnisa, M.; Ulfah, S.; Suryanto, W.; Sholihun, S. Ground validation of GPM IMERG-F precipitation products with the point rain gauge records on the extreme rainfall over a mountainous area of Sumatra Island. J. Penelit. Pendidik. IPA, 2022; 8, in press. [Google Scholar]
  61. Yusnaini, H.; Ramadhan, R.; Marzuki, M.; Ningsih, A.P.; Hashiguchi, H.; Shimomai, T.; Vonnisa, M.; Harmadi, H.; Suryanto, W.; Sholihun, S. Statistical Comparison of IMERG Precipitation Products with Optical Rain Gauge Observations over Kototabang, Indonesia. J. ILMU Fis. Univ. Andalas 2022, 14, 10–20. [Google Scholar]
  62. As-Syakur, A.R.; Osawa, T.; Miura, F.; Nuarsa, I.W.; Ekayanti, N.W.; Dharma, I.G.B.S.; Adnyana, I.W.S.; Arthana, I.W.; Tanaka, T. Maritime Continent rainfall variability during the TRMM era: The role of monsoon, topography and El Niño Modoki. Dyn. Atmos. Oceans 2016, 75, 58–77. [Google Scholar] [CrossRef]
  63. Kurniawan, A. Evaluasi Pengukuran Curah Hujan Antara Hasil Pengukuran Permukaan (AWS, HELLMAN, OBS) dan Hasil Estimasi (Citra Satelit =GSMaP) Di Stasiun Klimatologi Mlati Tahun. J. Geogr. Edukasi Lingkung. 2020, 4, 1–7. [Google Scholar] [CrossRef]
  64. GEBCO Gridded Bathymetry Data. Available online: https://www.gebco.net/data_and_products/gridded_bathymetry_data/ (accessed on 18 November 2021).
  65. Bappenas. RAN API Review: Scientific Base Study of Atmospheric Climate Projections; Bappenas: Jakarta, Indonesia, 2018. [Google Scholar]
  66. Mori, S.; Jun-Ichi, H.; Tauhid, Y.I.; Yamanaka, M.D.; Okamoto, N.; Murata, F.; Sakurai, N.; Hashiguchi, H.; Sribimawati, T. Diurnal Land–Sea Rainfall Peak Migration over Sumatera Island, Indonesian Maritime Continent, Observed by TRMM Satellite and Intensive Rawinsonde Soundings. Mon. Weather Rev. 2004, 132, 2021–2039. [Google Scholar] [CrossRef]
  67. Hou, A.Y.; Kakar, R.K.; Neeck, S.; Azarbarzin, A.A.; Kummerow, C.D.; Kojima, M.; Oki, R.; Nakamura, K.; Iguchi, T. The global precipitation measurement mission. Bull. Am. Meteorol. Soc. 2014, 95, 701–722. [Google Scholar] [CrossRef]
  68. Huffman, G.J.; Bolvin, D.T.; Braithwaite, D.; Hsu, K.; Joyce, R.; Kidd, C.; Nelkin, E.J.; Sorooshian, S.; Tan, J.; Xie, P. NASA Global Precipitation Measurement (GPM) Integrated Multi-Satellite Retrievals for GPM (IMERG); Algorithm Theoretical Basis Document (ATBD) Version; NASA: Washington, DC, USA, 2019. [Google Scholar]
  69. Schneider, U.; Becker, A.; Finger, P.; Meyer-Christoffer, A.; Ziese, M.; Rudolf, B. GPCC’s new land surface precipitation climatology based on quality-controlled in situ data and its role in quantifying the global water cycle. Arch. Meteorol. Geophys. Bioclimatol. Ser. B 2014, 115, 15–40. [Google Scholar] [CrossRef] [Green Version]
  70. Tan, J.; Huffman, G.J.; Bolvin, D.T.; Nelkin, E.J. IMERG V06: Changes to the Morphing Algorithm. J. Atmos. Ocean. Technol. 2019, 36, 2471–2482. [Google Scholar] [CrossRef]
  71. Huang, W.-R.; Chang, Y.-H.; Liu, P.-Y. Assessment of IMERG precipitation over Taiwan at multiple timescales. Atmos. Res. 2018, 214, 239–249. [Google Scholar] [CrossRef]
  72. Tan, M.L.; Samat, N.; Chan, N.W.; Roy, R. Hydro-Meteorological Assessment of Three GPM Satellite Precipitation Products in the Kelantan River Basin, Malaysia. Remote Sens. 2018, 10, 1011. [Google Scholar] [CrossRef] [Green Version]
  73. Hamza, A.; Anjum, M.; Cheema, M.M.; Chen, X.; Afzal, A.; Azam, M.; Shafi, M.K.; Gulakhmadov, A. Assessment of IMERG-V06, TRMM-3B42V7, SM2RAIN-ASCAT, and PERSIANN-CDR Precipitation Products over the Hindu Kush Mountains of Pakistan, South Asia. Remote Sens. 2020, 12, 3871. [Google Scholar] [CrossRef]
  74. Indonesian National Board for Disaster Management. Badan Nasional Penanggulangan Bencana. B. Indonesian Disaster Information Data. Available online: https://dibi.bnpb.go.id/xdibi/index (accessed on 18 November 2021).
  75. Marzuki, M.; Yusnaini, H.; Ramadhan, R.; Tangang, F.; Bin Amirudin, A.A.; Hashiguchi, H.; Shimomai, T.; Vonnisa, M. Characteristics of Precipitation Diurnal Cycle over a Mountainous Area of Sumatra Island including MJO and Seasonal Signatures Based on the 15-Year Optical Rain Gauge Data, WRF Model and IMERG. Atmosphere 2021, 13, 63. [Google Scholar] [CrossRef]
  76. ETCCDI. Climate Change Indices. Available online: http://etccdi.pacificclimate.org/list_27_indices.shtml (accessed on 18 November 2021).
  77. Yin, H.; Sun, Y. Characteristics of extreme temperature and precipitation in China in 2017 based on ETCCDI indices. Adv. Clim. Change Res. 2018, 9, 218–226. [Google Scholar] [CrossRef]
  78. Alexander, L.V.; Zhang, X.; Peterson, T.C.; Caesar, J.; Gleason, B.; Klein Tank, A.M.G.; Haylock, M.; Collins, D.; Trewin, B.; Rahimzadeh, F.; et al. Global observed changes in daily climate extremes of temperature and precipitation. J. Geophys. Res. Atmos. 2006, 111, D5. [Google Scholar] [CrossRef] [Green Version]
  79. Hong, Y.; Hsu, K.-L.; Moradkhani, H.; Sorooshian, S. Uncertainty quantification of satellite precipitation estimation and Monte Carlo assessment of the error propagation into hydrologic response. Water Resour. Res. 2006, 42, 42. [Google Scholar] [CrossRef] [Green Version]
  80. Sun, S.; Wang, J.; Shi, W.; Chai, R.; Wang, G. Capacity of the PERSIANN-CDR Product in Detecting Extreme Precipitation over Huai River Basin, China. Remote Sens. 2021, 13, 1747. [Google Scholar] [CrossRef]
  81. Gupta, H.V.; Kling, H.; Yilmaz, K.K.; Martinez, G.F. Decomposition of the mean squared error and NSE performance criteria: Implications for improving hydrological modelling. J. Hydrol. 2009, 377, 80–91. [Google Scholar] [CrossRef] [Green Version]
  82. Tang, G.; Clark, M.P.; Papalexiou, S.M.; Ma, Z.; Hong, Y. Have satellite precipitation products improved over last two decades? A comprehensive comparison of GPM IMERG with nine satellite and reanalysis datasets. Remote Sens. Environ. 2020, 240, 111697. [Google Scholar] [CrossRef]
  83. Hosseini-Moghari, S.-M.; Tang, Q. Validation of GPM IMERG V05 and V06 Precipitation Products over Iran. J. Hydrometeorol. 2020, 21, 1011–1037. [Google Scholar] [CrossRef] [Green Version]
  84. As-Syakur, A.R.; Tanaka, T.; Osawa, T.; Mahendra, M.S. Indonesian rainfall variability observation using TRMM multi-satellite data. Int. J. Remote Sens. 2013, 34, 7723–7738. [Google Scholar] [CrossRef]
  85. Love, B.S.; Matthews, A.J.; Lister, G.M.S. The diurnal cycle of precipitation over the Maritime Continent in a high-resolution atmospheric model. Q. J. R. Meteorol. Soc. 2011, 137, 934–947. [Google Scholar] [CrossRef] [Green Version]
  86. Wu, J.; Zhou, B.T.; Xu, Y. Response of precipitation and its extremes over China to warming: CMIP5 simulation and projection. Acta Geophys. Sin. 2015, 58, 461–473. [Google Scholar] [CrossRef]
  87. Adfy, D.M.; Marzuki, M. Analisis Kerawanan Bencana Longsor dari Karakteristik Hujan, Pergerakan Tanah dan Kemiringan Lereng di Kabupaten Agam. J. Fis. Unand 2021, 10, 8–14. [Google Scholar]
  88. Li, Z.; Tang, G.; Hong, Z.; Chen, M.; Gao, S.; Kirstetter, P.; Gourley, J.J.; Wen, Y.; Yami, T.; Nabih, S.; et al. Two-decades of GPM IMERG early and final run products intercomparison: Similarity and difference in climatology, rates, and extremes. J. Hydrol. 2021, 594, 125975. [Google Scholar] [CrossRef]
  89. Yang, Z.; Hsu, K.; Sorooshian, S.; Xu, X.; Braithwaite, D.; Verbist, K.M.J. Bias adjustment of satellite-based precipitation estimation using gauge observations: A case study in Chile. J. Geophys. Res. Atmos. 2016, 121, 3790–3806. [Google Scholar] [CrossRef] [Green Version]
  90. Aldrian, E.; Susanto, R.D. Identification of three dominant rainfall regions within Indonesia and their relationship to sea surface temperature. Int. J. Clim. 2003, 23, 1435–1452. [Google Scholar] [CrossRef]
  91. Marzuki, M.; Suryanti, K.; Yusnaini, H.; Tangang, F.; Muharsyah, R.; Vonnisa, M.; Devianto, D. Diurnal variation of precipitation from the perspectives of precipitation amount, intensity and duration over Sumatra from rain gauge observations. Int. J. Clim. 2021, 41, 4386–4397. [Google Scholar] [CrossRef]
  92. Nepal, B.; Shrestha, D.; Sharma, S.; Shrestha, M.S.; Aryal, D.; Shrestha, N. Assessment of GPM-Era Satellite Products’ (IMERG and GSMaP) Ability to Detect Precipitation Extremes over Mountainous Country Nepal. Atmosphere 2021, 12, 254. [Google Scholar] [CrossRef]
  93. Ning, S.; Song, F.; Udmale, P.; Jin, J.; Thapa, B.R.; Ishidaira, H. Error Analysis and Evaluation of the Latest GSMap and IMERG Precipitation Products over Eastern China. Adv. Meteorol. 2017, 2017, 1–16. [Google Scholar] [CrossRef] [Green Version]
  94. Chen, C.; Chen, Q.; Duan, Z.; Zhang, J.; Mo, K.; Li, Z.; Tang, G. Multiscale Comparative Evaluation of the GPM IMERG v5 and TRMM 3B42 v7 Precipitation Products from 2015 to 2017 over a Climate Transition Area of China. Remote Sens. 2018, 10, 944. [Google Scholar] [CrossRef] [Green Version]
  95. Yong, B.; Ren, L.-L.; Hong, Y.; Wang, J.-H.; Yong, B.; Jiang, S.H.; Chen, X.; Wang, W. Hydrologic evaluation of Multisatellite Precipitation Analysis standard precipitation products in basins beyond its inclined latitude band: A case study in Laohahe basin, China. Water Resour. Res. 2010, 46, 759–768. [Google Scholar] [CrossRef] [Green Version]
  96. Tang, G.; Ma, Y.; Long, D.; Zhong, L.; Hong, Y. Evaluation of GPM Day-1 IMERG and TMPA Version-7 legacy products over Mainland China at multiple spatiotemporal scales. J. Hydrol. 2016, 533, 152–167. [Google Scholar] [CrossRef]
  97. Tian, F.; Hou, S.; Yang, L.; Hu, H.; Hou, A. How Does the Evaluation of the GPM IMERG Rainfall Product Depend on Gauge Density and Rainfall Intensity? J. Hydrometeorol. 2018, 19, 339–349. [Google Scholar] [CrossRef]
  98. Mahmoud, M.; Mohammed, S.; Hamouda, M.; Mohamed, M. Impact of Topography and Rainfall Intensity on the Accuracy of IMERG Precipitation Estimates in an Arid Region. Remote Sens. 2020, 13, 13. [Google Scholar] [CrossRef]
  99. Henning, D. Cloud dynamics: E.M. Agee and T. Asai (Editors). Proceedings of a Symposium held at the Third General Assembly of IAMAP, Hamburg, West Germany, 17–28 August D. Reidel Publishing Co., Dordrecht, in co-edition with Terra Scientific Publishing Company, Tokyo, 1982, VII + 423 pp., Dfl.115.00, US$49.50, hardcover. Dyn. Atmos. Oceans 1987, 11, 90–92. [Google Scholar] [CrossRef]
  100. Manz, B.; Páez-Bimos, S.; Horna, N.; Buytaert, W.; Ochoa-Tocachi, B.; Lavado-Casimiro, W.; Willems, B. Comparative Ground Validation of IMERG and TMPA at Variable Spatiotemporal Scales in the Tropical Andes. J. Hydrometeorol. 2017, 18, 2469–2489. [Google Scholar] [CrossRef]
  101. Yuan, F.; Zhang, L.; Soe, K.M.W.; Ren, L.; Zhao, C.; Zhu, Y.; Jiang, S.; Liu, Y. Applications of TRMM- and GPM-Era Multiple-Satellite Precipitation Products for Flood Simulations at Sub-Daily Scales in a Sparsely Gauged Watershed in Myanmar. Remote Sens. 2019, 11, 140. [Google Scholar] [CrossRef] [Green Version]
  102. Freitas, E.D.S.; Coelho, V.; Xuan, Y.; Melo, D.D.C.; Gadelha, A.N.; Santos, E.A.; Galvão, C.D.O.; Filho, G.M.R.; Barbosa, L.R.; Huffman, G.J.; et al. The performance of the IMERG satellite-based product in identifying sub-daily rainfall events and their properties. J. Hydrol. 2020, 589, 125128. [Google Scholar] [CrossRef]
  103. Li, Z.; Chen, M.; Gao, S.; Hong, Z.; Tang, G.; Wen, Y.; Gourley, J.J.; Hong, Y. Cross-Examination of Similarity, Difference and Deficiency of Gauge, Radar and Satellite Precipitation Measuring Uncertainties for Extreme Events Using Conventional Metrics and Multiplicative Triple Collocation. Remote Sens. 2020, 12, 1258. [Google Scholar] [CrossRef] [Green Version]
Figure 1. Distribution of BMKG stations used in this study. Elevation data were gridded in 15-arc second by General Bathymetric Chart of the Oceans (GEBCO) [64].
Remotesensing 14 00412 g001
Figure 2. Time series of daily rainfall from RG at Padang, West Sumatra (0.996° S, 100.372° E), along with IMERG-E, IMERG-L, and IMERG-F data during 1–29 September 2018. The vertical dotted line indicates the flood of 26 September 2018.
Remotesensing 14 00412 g002
Figure 3. The mean value of precipitation-amount-based indices including PRCPTOT (a), R85p (b), R95p (c), and R99p (d), for 63 of BMKG stations in the IMC during 2016 to 2020.
Remotesensing 14 00412 g003
Figure 4. Scatter plot of precipitation-amount-based indices from IMERG and RG observation, namely PRCPTOT (a,e,i), R85p (b,f,j), R95p (c,g,k), and R99p (d,h,l), for IMERG-E (top), L (middle) and F (bottom). The color indicates the number of data counts.
Remotesensing 14 00412 g004
Figure 5. The mean value of precipitation-duration-based indices including CDD (a) and CWD (b), for 63 of BMKG stations in the IMC during 2016 to 2020.
Remotesensing 14 00412 g005
Figure 6. Scatter plot of precipitation-duration-based indices from IMERG and RG observation, namely CDD (a,c,e) and CWD (b,d,f), for IMERG-E (top), L (middle) and F (bottom). The color indicates the number of data counts.
Remotesensing 14 00412 g006
Figure 7. The mean value of precipitation-frequency-based indices including R1mm (a), R10mm (b), R20mm (c) and R50mm (d), for 63 of BMKG stations in the IMC during 2016 to 2020.
Remotesensing 14 00412 g007
Figure 8. Scatter plot of precipitation-frequency-based indices from IMERG and RG observation, namely, R1mm (a,e,i), R10mm (b,f,j), R20mm (c,g,k), and R50mm (d,h,l), for IMERG-E (top), L (middle) and F (bottom). The color indicates the number of data counts.
Remotesensing 14 00412 g008
Figure 9. The mean value of precipitation-intensity-based indices including RX1day (a), RX5day (b) and SDII (c), for 63 of BMKG stations in the IMC during 2016 to 2020.
Remotesensing 14 00412 g009
Figure 10. Scatter plot of precipitation-intensity-based indices from IMERG and RG observation, namely, RX1day (a,d,g), RX5day (b,e,h), and SDII (c,f,i), for IMERG-E (top), L (middle) and F (bottom). The color indicates the number of data counts.
Remotesensing 14 00412 g010
Table 1. List of the selected 13 extreme indices from ETCCDI used in this study.
CategoryNameDefinitionUnit
Precipitation-amount-based indicesPRCPTOTAnnual total precipitation in wet days (RR ≥ 1 mm)mm
R85pAnnual total precipitation when RR ≥ 85th percentile of wet daysmm
R95pAnnual total precipitation when RR ≥ 95th percentile of wet daysmm
R99pAnnual total precipitation when RR ≥ 99th percentile of wet daysmm
Precipitation-duration-based indicesCDDMaximum number of consecutive days with precipitation ≤1 mmdays
CWDMaximum number of consecutive days with precipitation ≥1 mmdays
Precipitation-frequency-based indicesR1mmAnnual count of days when precipitation ≥1 mmdays
R10mmAnnual count of days when precipitation ≥10 mmdays
R20mmAnnual count of days when precipitation ≥20 mmdays
R50mmAnnual count of days when precipitation ≥50 mmdays
Precipitation-intensity-based indicesRX1dayAnnual maximum 1-day precipitationmm day−1
RX5dayAnnual maximum consecutive 5-days precipitation amountmm 5 day−1
SDIIAnnual total precipitation divided by the number of wet days in the yearmm day−1
Publisher’s Note: MDPI stays neutral with regard to jurisdictional claims in published maps and institutional affiliations.

