1. Introduction
The FY-1C and FY-1D satellites are the second group of Chinese polar-orbiting meteorological satellites after FY-1A and FY-1B launched on 10 May 1999 and 15 May 2002. Compared with the main payload of the first generation, the number of bands of the visible-IR scanning radiometer (VIRR) increased from 5 to 10. The first six channels were designated as the Advanced Very High-Resolution Radiometer/3 (AVHRR/3) for many applications, whereas the remaining four channels were used for ocean water color and vapor content, as illustrated in
Table 1. The 10 bands acquired imagery with 5 spectral groups, including visible (VIS) bands 1, 7, 8, and 9, near-infrared (NIR) bands 2 and 10, short-wavelength infrared (SWIR) band 6, middle-wavelength infrared (MWIR) band 3, and long-wavelength infrared (LWIR) bands 4 and 5. Two types of data with different transmission rates are available: high-resolution picture transmission (HRPT) with 10 bands and global delayed picture transmission (GDPT) with 4 bands. VIRR is inherited by FY-3A, FY-3B, and FY-3C. Over 20 years of operation, the VIRR has captured enormous amounts of data, which is valuable for global observation and disaster preparedness.
Accurate band-to-band registration (BBR) is a key factor for producing scientific data from whisk-broom cameras. Tan et al. [
2] showed that misregistration caused by the improper aggregation of multiresolution bands affects the quality of moderate-resolution imaging spectroradiometer (MODIS) products. The point spread function-based aggregation method can reduce misregistration for both MODIS and the National Polar-orbiting Partnership (SNPP) [
3]. In theoretical analyses of Aqua MODIS, misregistration substantially impacted normalized difference indices, such as the normalized difference vegetation index [
4]. The band-to-band misregistration of onboard calibrators (OBCs) can also affect the calibration of Aqua MODIS. Indeed, after correcting for misregistration, the seasonal oscillation trend in the gain coefficient of the detector significantly improved [
5]. In addition, misregistration might change with the detector number if it is introduced by different effective focal lengths [
6].
Much effort has been devoted to monitoring the band-to-band registration of whisk-broom cameras for geometric calibration [
7,
8,
9,
10]. MODIS utilizes OBCs, specifically a spectro-radiometric calibration assembly, to provide instrument spatial registration information. In addition to OBCs, scheduled moon imaging can be used to estimate the onboard BBR for VIIRS [
11,
12]. Image correlation is another BBR evaluation approach [
13,
14]. Tilton et al. [
15] used normalized mutual information (NMI) to measure the BBR between the I and M bands of VIIRS. The latter experiments showed that the cross-correlation has a sharper and stronger peak relative to the NMI [
16].
Compared to MODIS and VIIRS, the BBR of VIRR showed a different pattern, even when only a single detector was deployed for each band. To investigate the error sources of misregistration, a physical BBR model is proposed in
Section 2, which illustrates the theoretical misregistration of VIRR. However, practical misregistration was corrected using an unknown preprocessing. To achieve a highly accurate BBR, a general co-registration model is proposed for the BBR of the VIRR in
Section 3. The validation experiments in
Section 4 show that the BBR of the VIRR can be significantly improved.
2. Band-to-Band Misregistration
2.1. Optical System of VIRR
Whisk-broom cameras are highly dynamic imaging systems with rotating mirrors that are designed to capture an image with a large field of view (FOV) in the across-track direction. With the movement of the satellite, periodic scanning generates two-dimensional images. For whisk-broom images, the sample coordinate s represents the scanning angle, while the line coordinate l indicates the index of the frame number and position in the frame of a single scan.
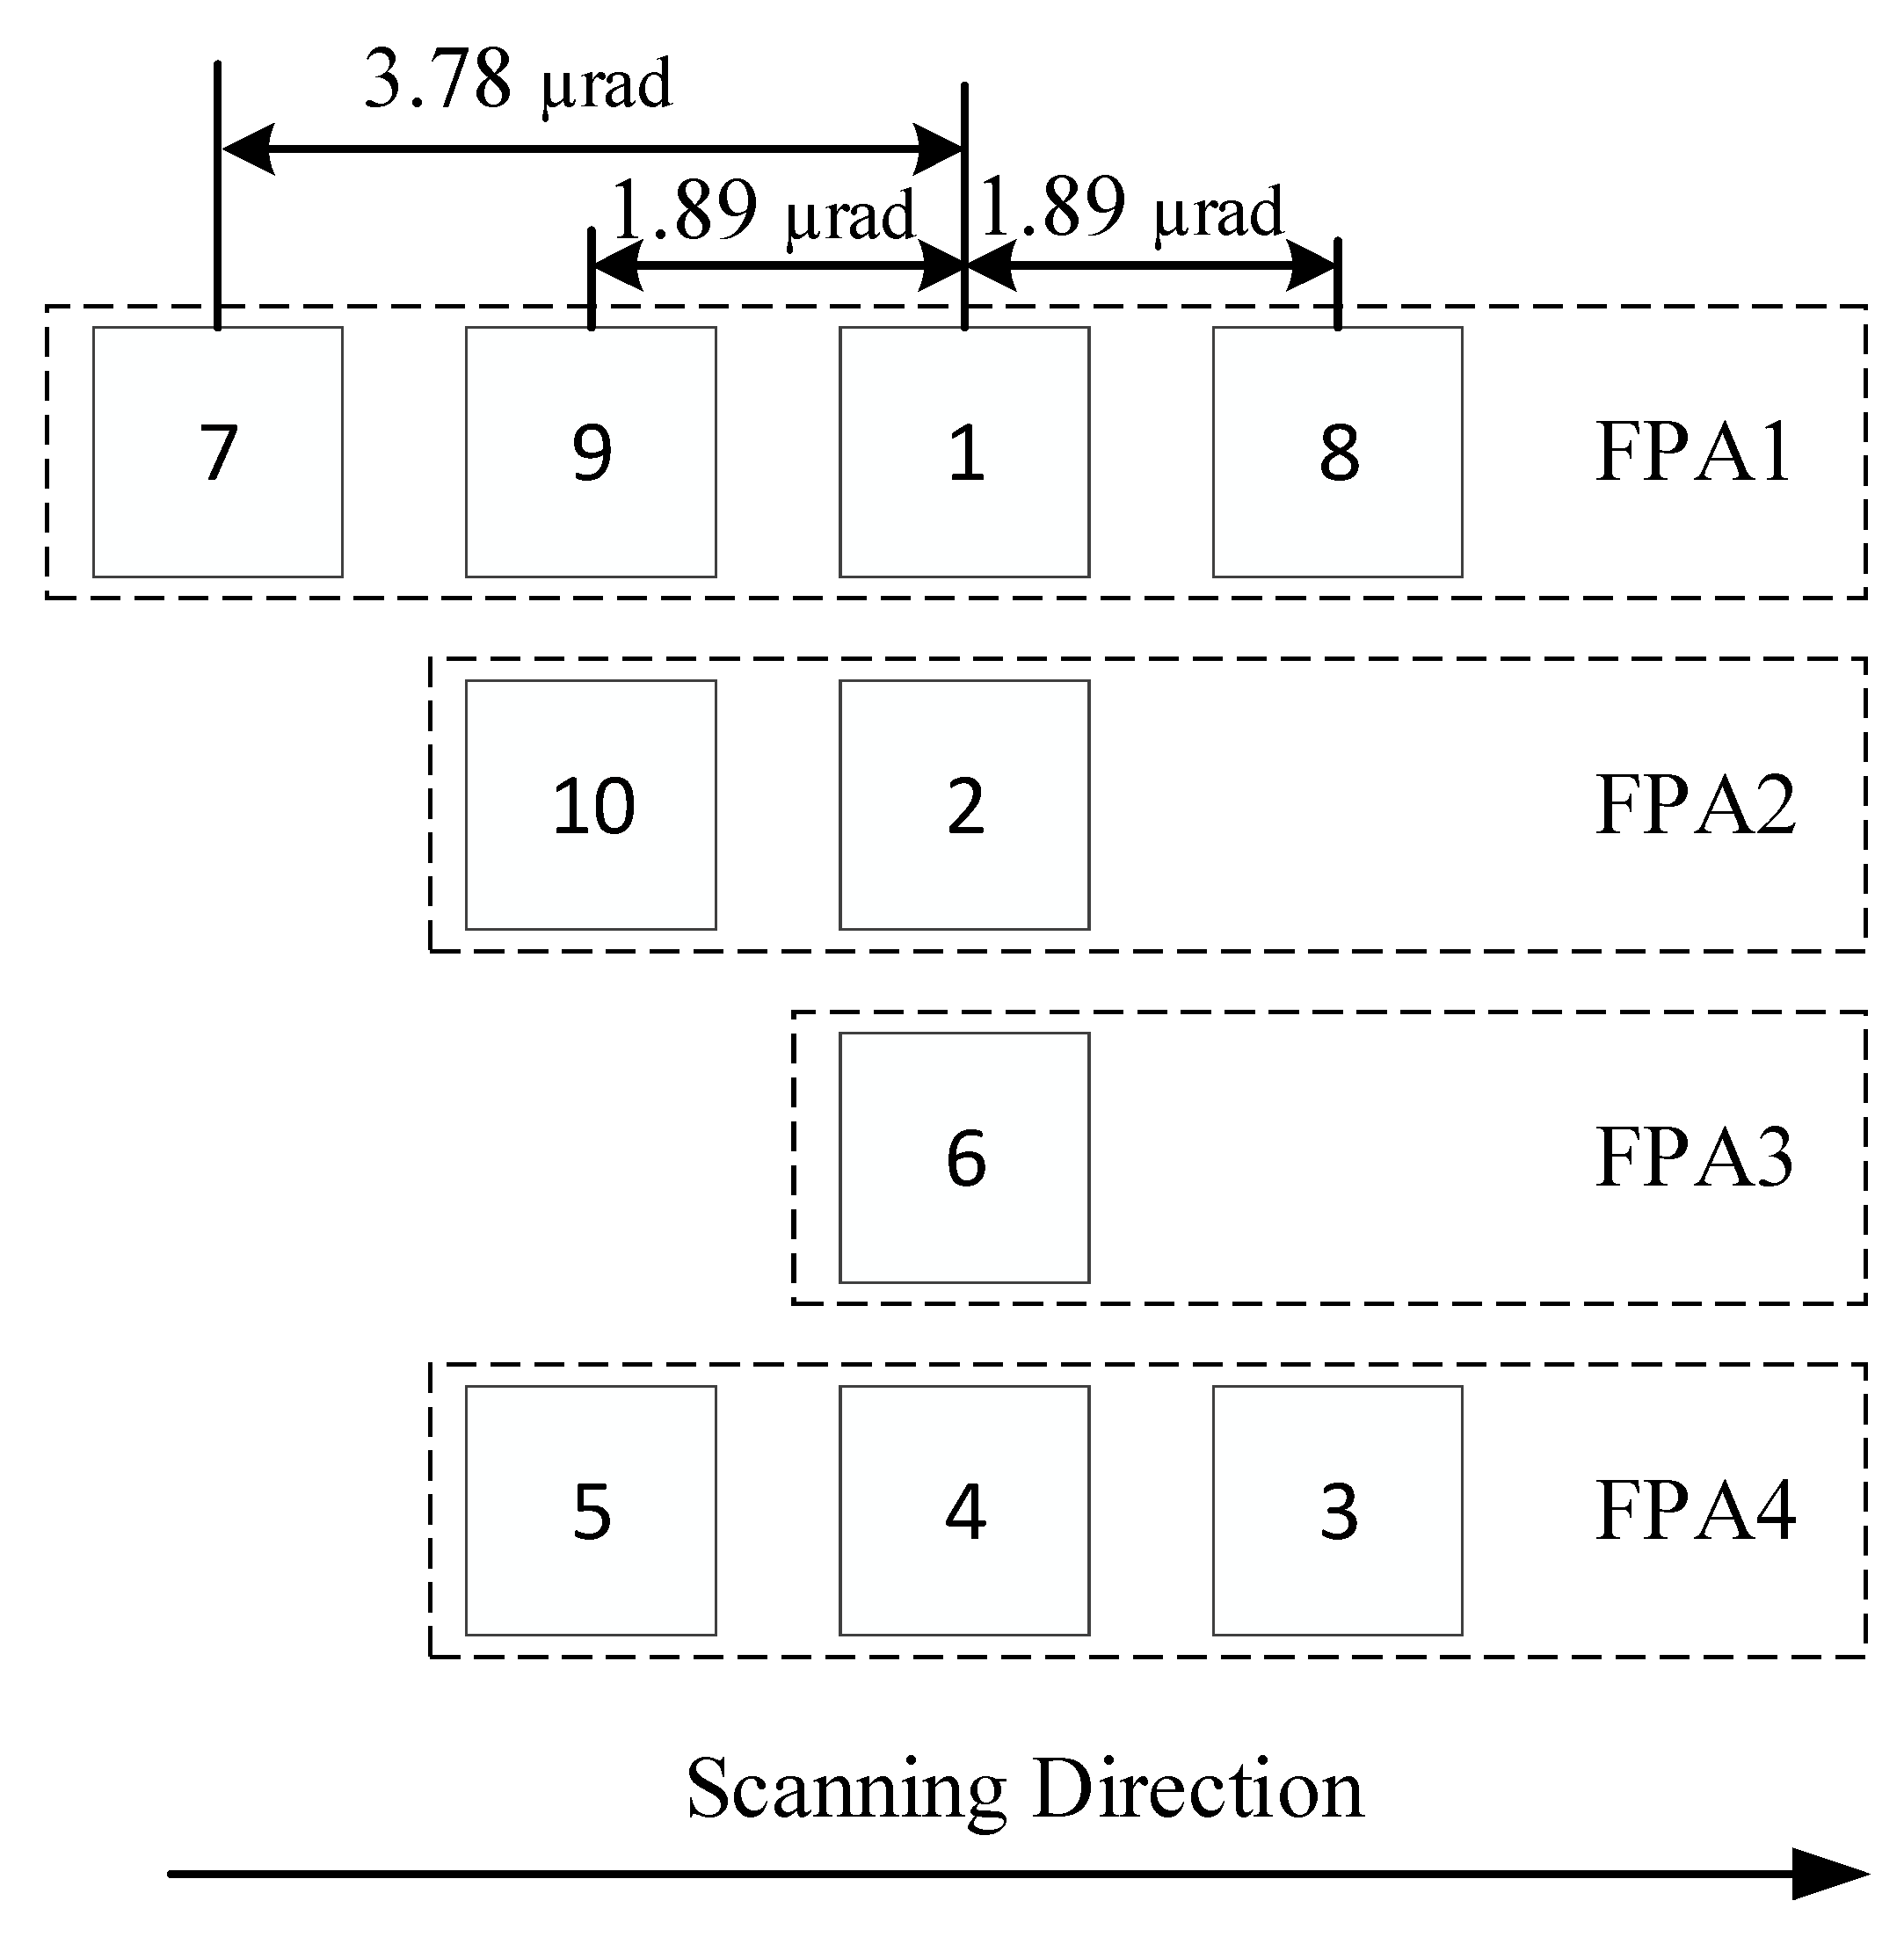
The 10 bands of VIRR use a 45° scanning mirror rotating at 360 rpm (rotations per minute) to image Earth. Due to the temperature requirement, detectors for different wavelengths were installed in four focal plane assemblies (FPAs). Therefore, the collected radiation was transformed into an electrical signal after being separated into four parts by splitters. There is only one detector with a 1.26 µrad instantaneous-field-of-view (IFOV) for each band, resulting in a 1.1 km ground sample distance (GSD) at nadir. The VIS bands 1, 7, 8, and 9 acquired imagery using silicon detectors in FPA1, while the NIR bands 2 and 10 correspond to the silicon detectors in FPA2. The PV-HgCdTe detector in FPA3 was used for the SWIR band 6, and the PC-HgCdTe detectors in FPA4 were used for the MWIR band 3 and LWIR bands 4 and 5. Bands 1, 2, 6, and 4 were placed on the optical axis to enable band registration. The detectors within the same FPAs are deployed along the scanning direction with 1.89 µrad (1.5 IFOV) for two sampling periods of approximately 50 μs. The layout of VIRR is shown in
Figure 1.
Misregistration () describes the displacement of the ground point (X, Y, Z) from the reference band to other bands. Therefore, misregistration in the along-scan direction can be replaced by the scan angle difference , where is the angle difference between two adjacent pixels. Misregistration in the flight direction is equal to , where μ is the pixel size. Due to the very small time interval (maximum of 0.1 ms) between different band acquisition times, the position and attitude of the different bands are assumed to be equal because the GSD spans hundreds of meters in length. Misregistration was introduced using different interior orientation parameters (IOPs).
2.2. Mathematical Problem
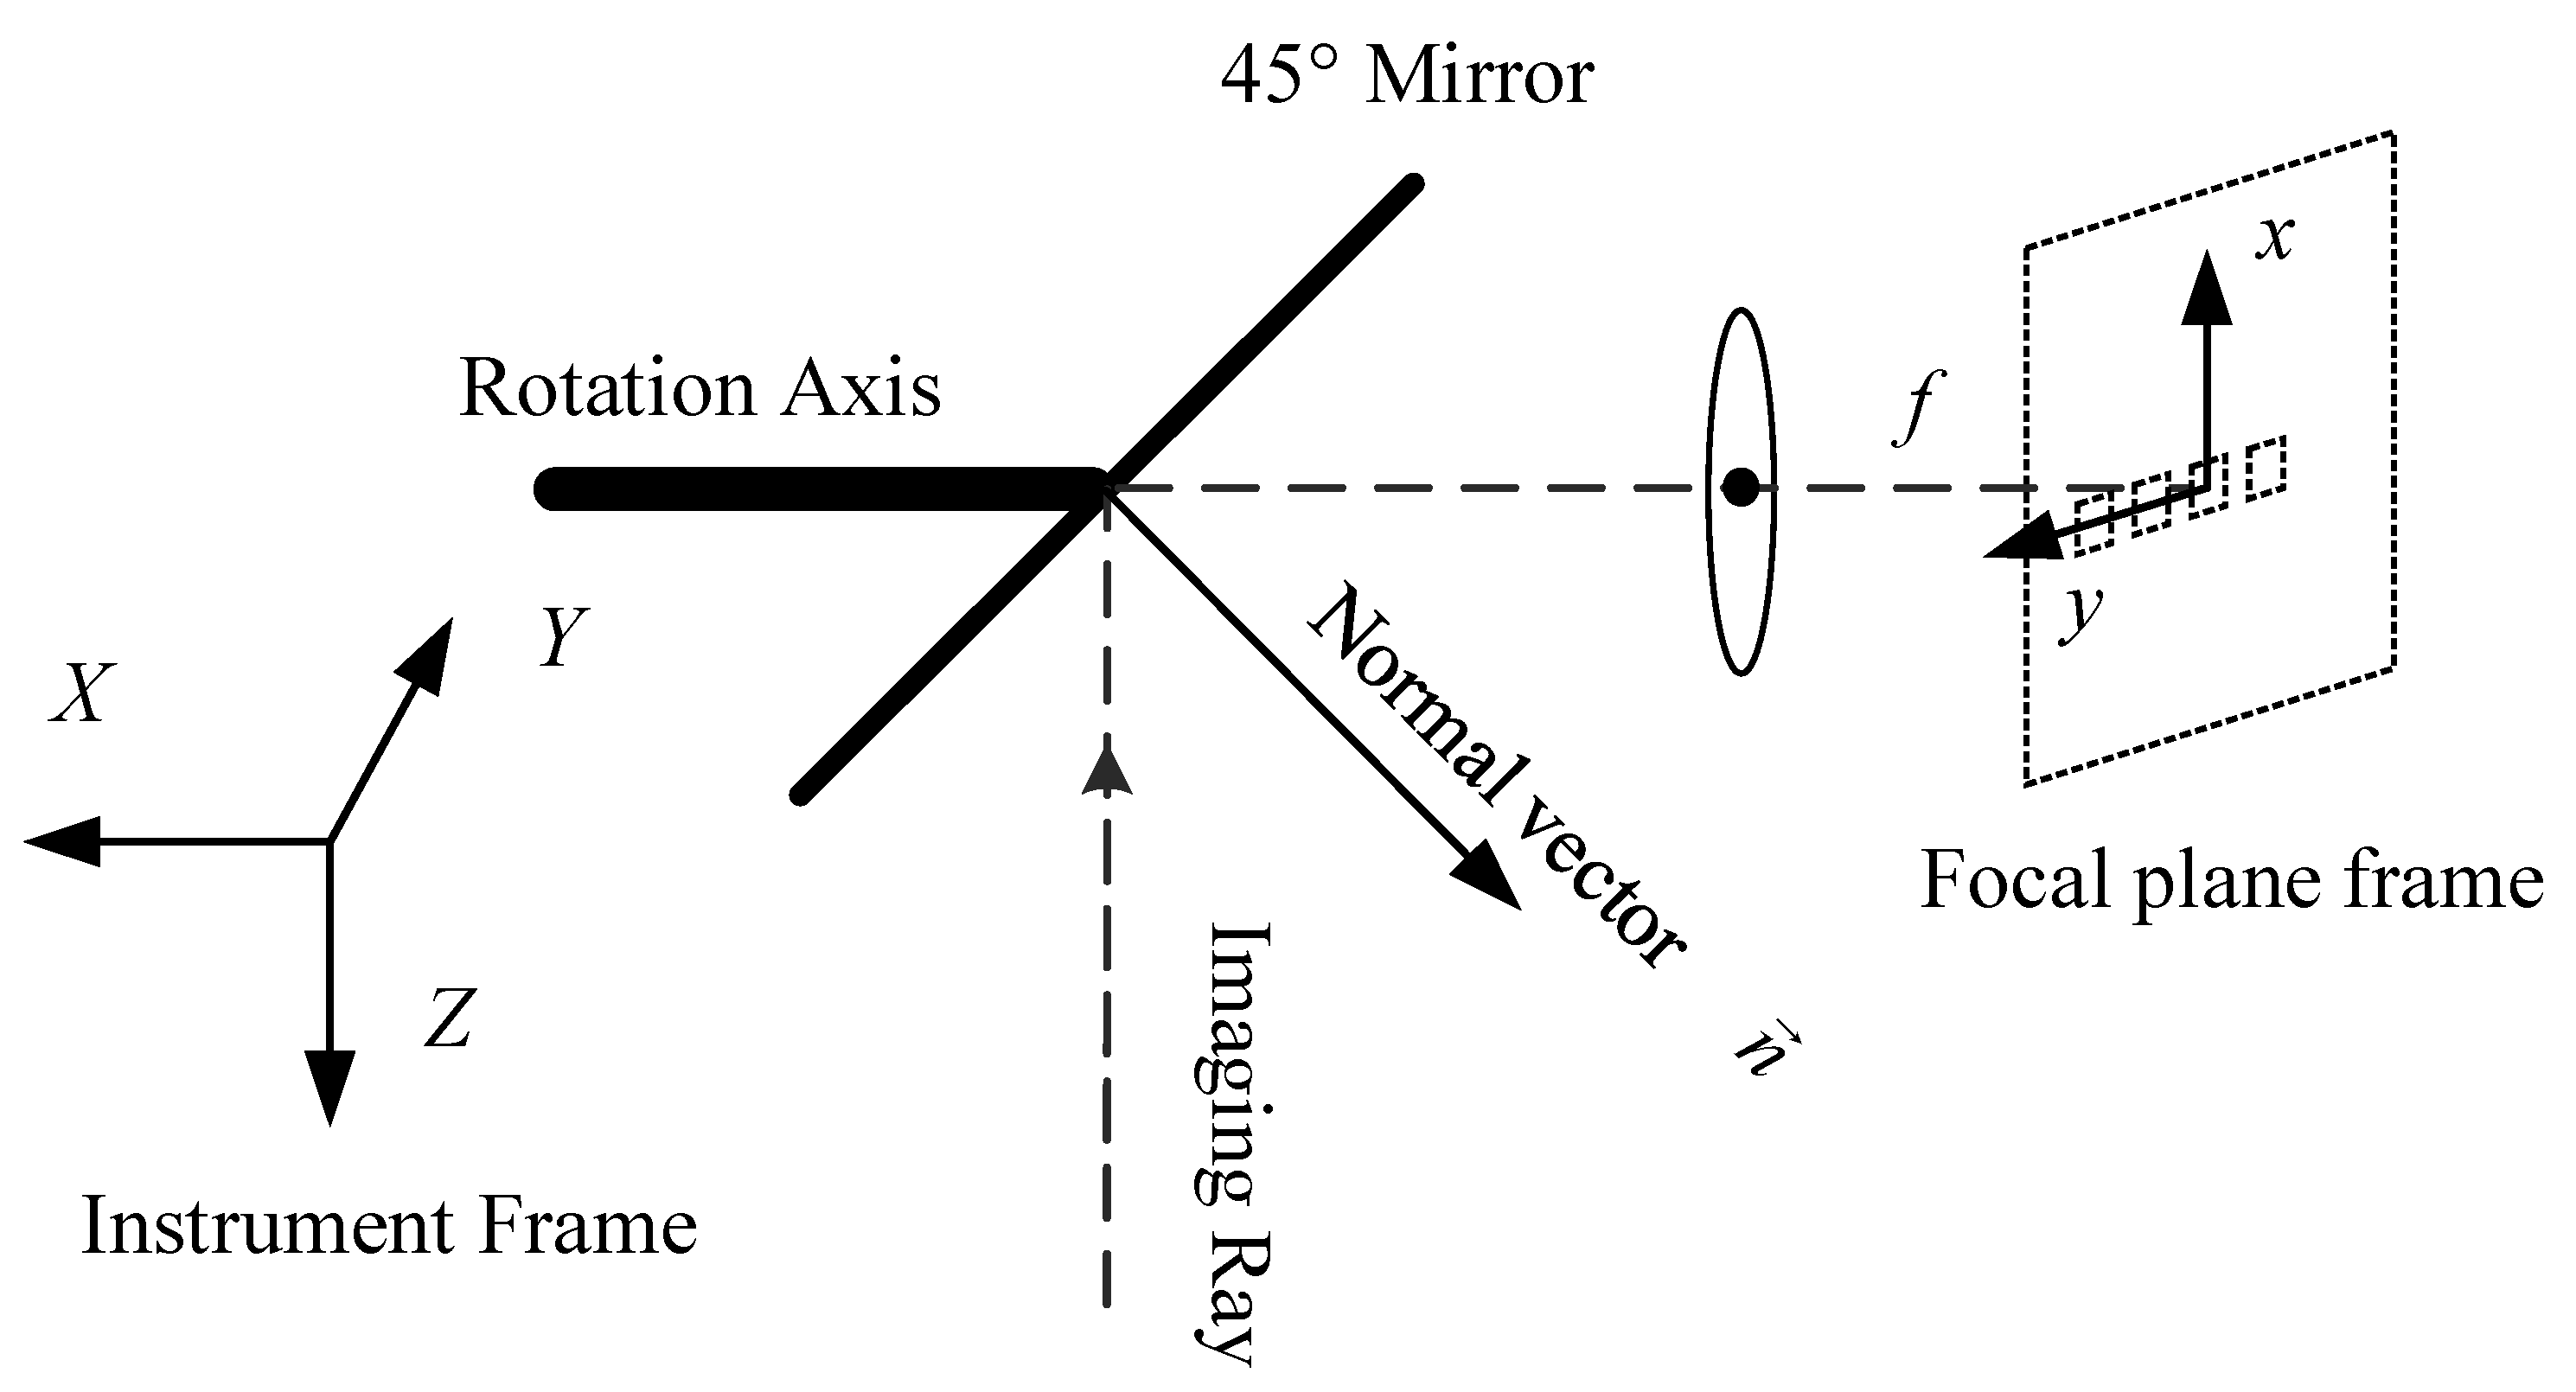
Ideally, the instrument frame model should be parallel to the body frame of the satellite, as illustrated in
Figure 2. The rotation axis of the scanning mirror is along the
X-axis of the instrument frame, which approximately points in the flight direction, and the
Z-axis points to the center of the Earth. The
Y-axis was determined using the right-hand rule. The normal vector of the 45° scanning mirror plots as a circle in the
YZ plane of the instrument frame. The scanning angle
, is defined as zero when the nadir imaging ray is reflected in the FPAs. In this case, the normal vector
, of the scanning mirror was
. In general, the normal vector is:
The reflection matrix
could be determined by the normal vector
.
For the sake of simplicity, a focal plane frame is perpendicular to the reflected optical axis, with the
x-axis parallel to the along-track direction and
y-axis in the along-scan direction, and the origin is the point at which the optical axis meets the FPA. Using the reflection matrix, another detector (
x0,
y0) in the focal plane frame can be transformed into a line-of-sight (LoS) in the body frame.
where
is the transformation matrix from the focal plane to the mirror frame and
are the positions of the detectors in the focal plane. For the reference band,
x0 = 0 and
y0 = 0. The ray in the body frame can be expressed as
.
The detector from the optical axis, with inner orientation parameters
, captures the point
at scan angle
θ, as shown in Equation (3). The differences in ephemeris and attitudes were ignored because of the short time intervals. To capture the same point, the optical axis should have different scan angles
and different positions
in the flight direction. In this case, the LoS of the reference band is:
Due to the same ground point, normalized Equation (3) is equal to normalized Equation (4). Given the small values of
and
, misregistration can be determined using Equation (5).
According to Equation (5), the misregistration in both the along-track and along-scan directions depends on the scan angle θ if the detector is deployed in the along-scan direction on the FPAs. Misregistration between different bands would be consistent if the detectors were deployed in the flight direction. In such cases, the scan rate of the scan mirror must be stable and accurate.
2.3. Misregistration of HRPT
To satisfy the Nyquist sample frequency, the sampling period of the HRPT data was 25 μs. The visible Earth within off the nadir can be imaged. Additionally, there were 2048 samples in each frame. Therefore, the view angle difference between two adjacent pixels is approximately 0.94 µrad, smaller than the IFOV, when the rotation mirror has a constant scan rate.
According to Equation (5), the misregistrations of HRPT
are:
The misregistration in the two directions has different scales: the misregistration in the along-track direction depends on the IFOV, whereas the misregistration in the across-track direction is related to the angle difference
. Therefore, pixel size can be calculated using
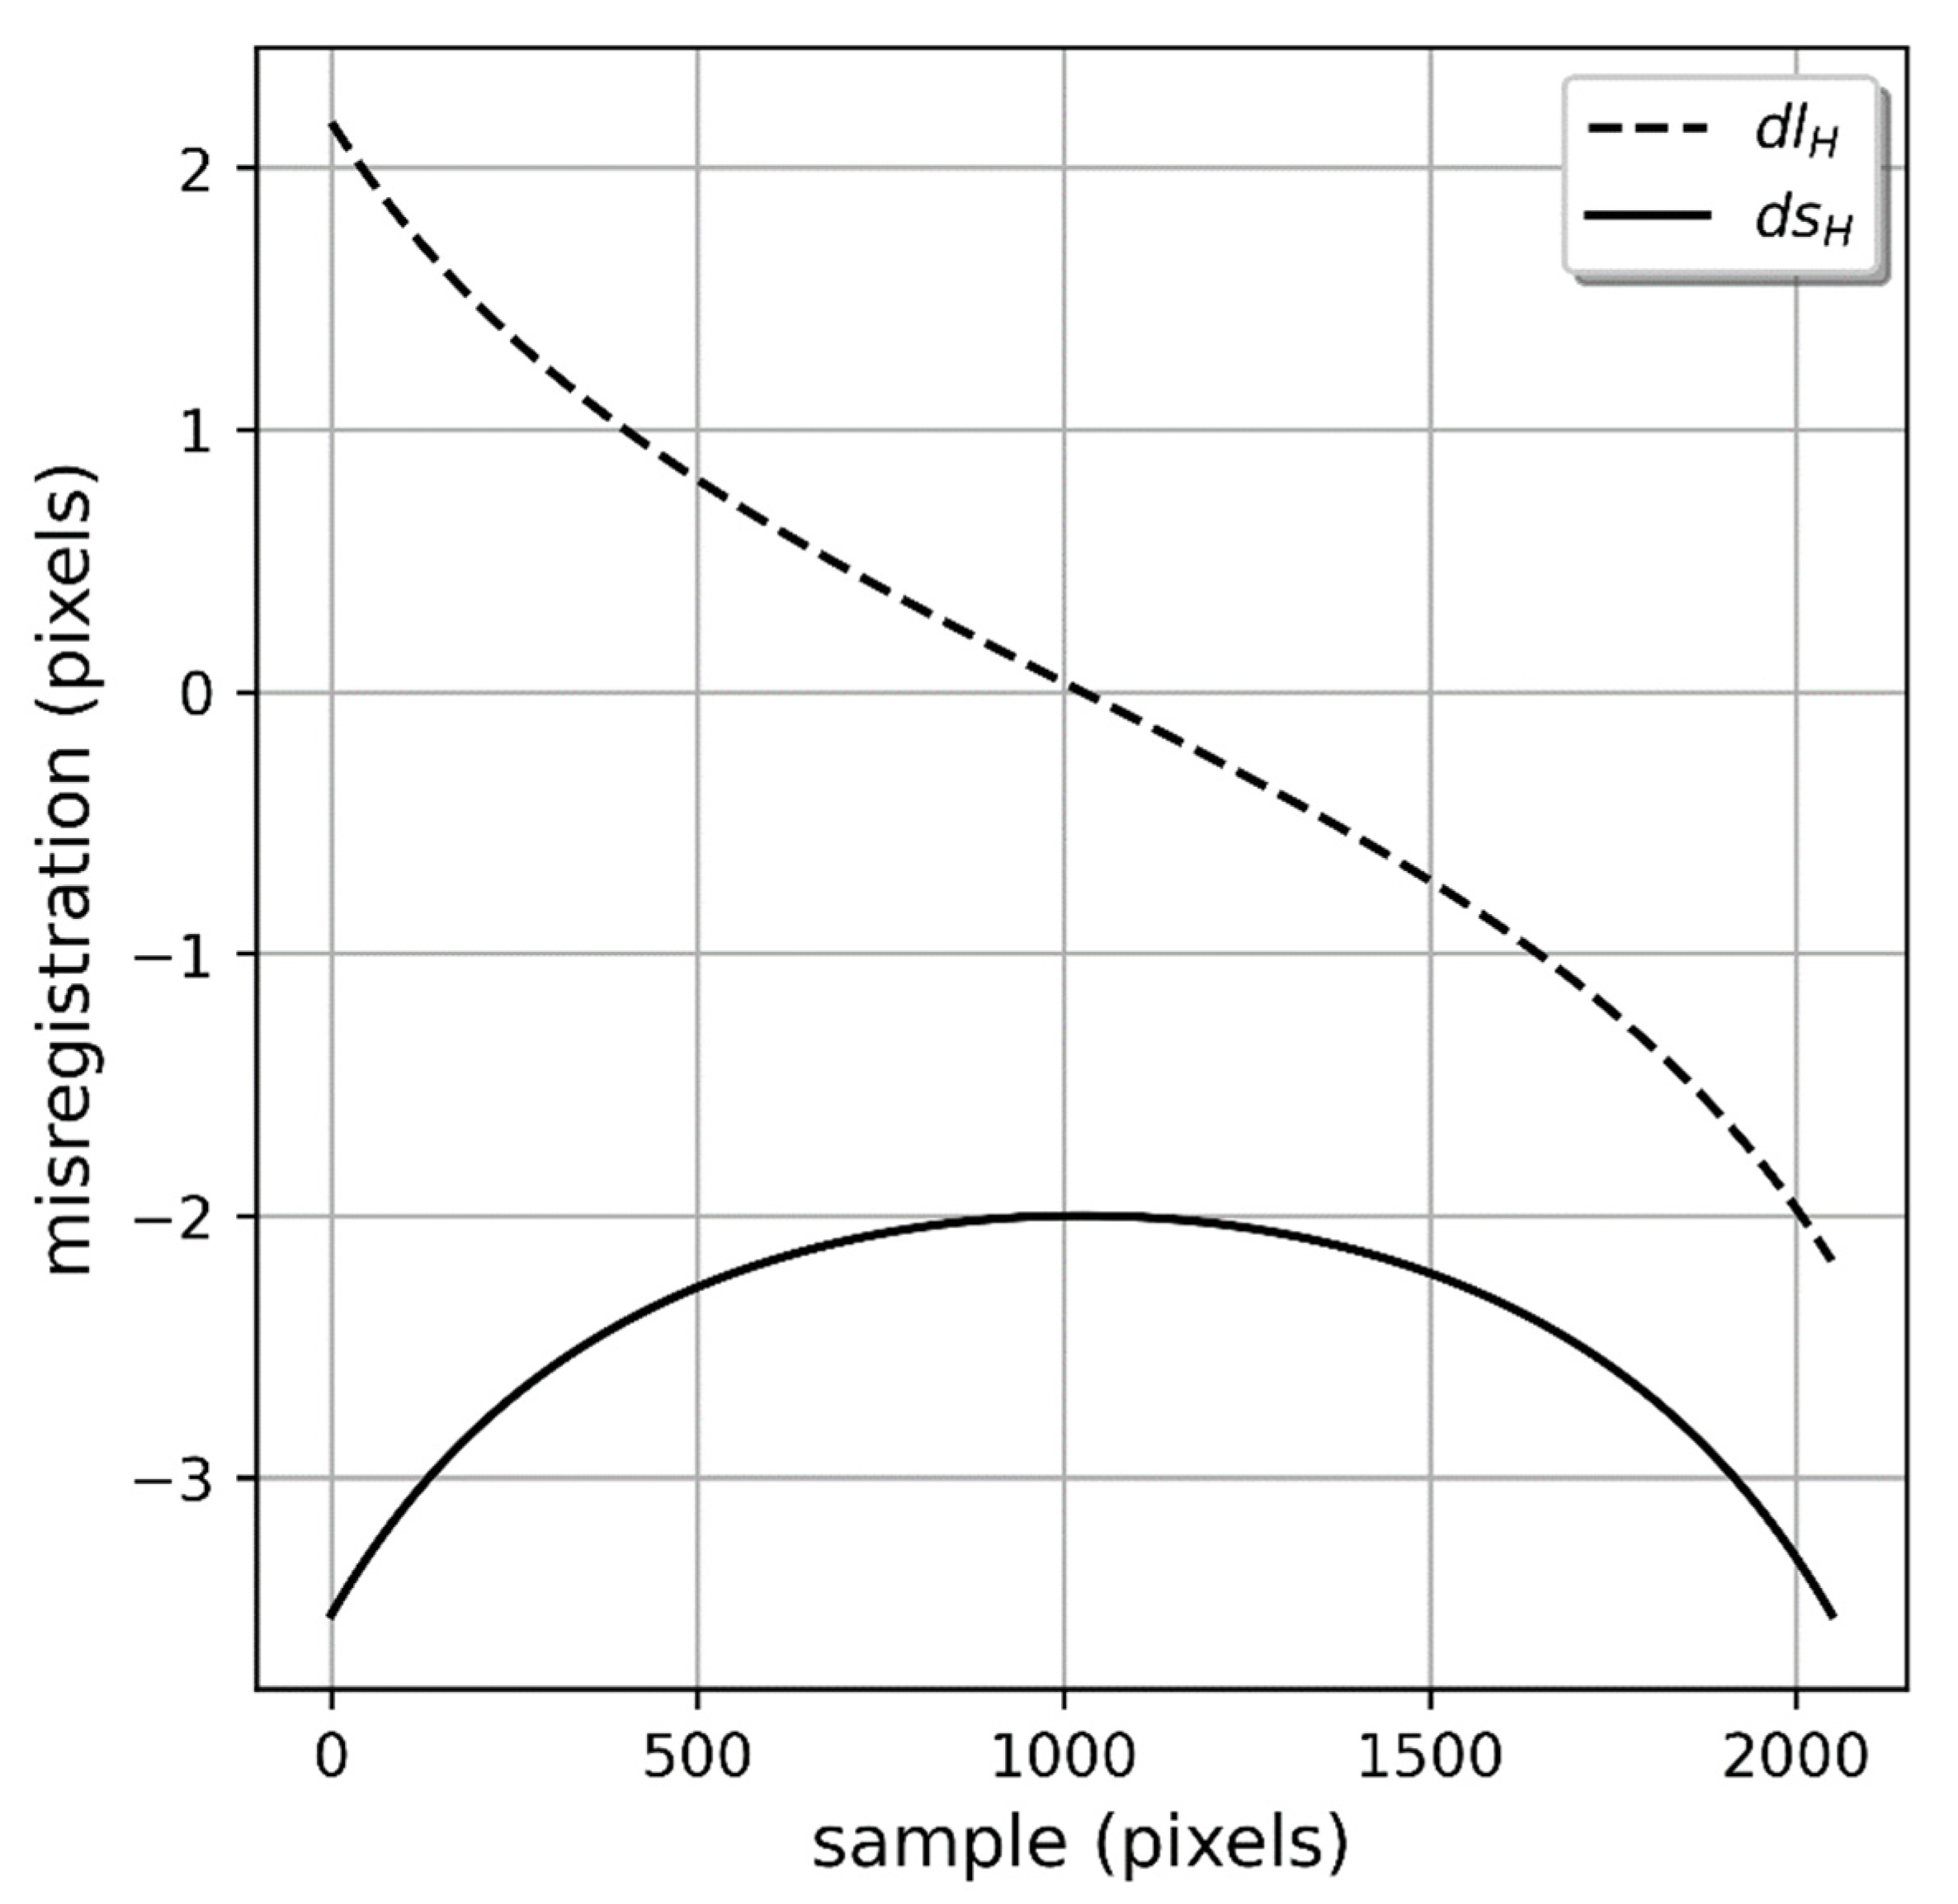
. Taking bands 1 and 8 as an example, band 1 is approximately
later than band 8, that is,
x0 = 0,
. Therefore, the misregistration between bands 1 and 8 is −2 pixels in the along-scan direction at the nadir, as shown in
Figure 3. The misregistration of HRPT data changes from −2 to −3.52 pixels in the along-scan direction and from −2.17 to 2.17 pixels in the along-track direction.
3. Band-to-Band Co-Registration
As demonstrated in
Section 2, the misregistration of VIRR varies with sample coordinate
s. To co-register different bands of VIRR, geometric calibration is required to estimate the IOPs accurately because, according to Equation (6), the IOPs are correlated to the misregistration of different bands. Misregistration is partially compensated for by the manufacturer of VIRR, Shanghai Institute of Technical Physics (SITP) at the Chinese Academy of Sciences; however, the compensation model is unknown, and there are persistent band-to-band misregistration errors. A general procedure is proposed for band-to-band co-registration of the VIRR, which adopts general polynomials to fit the misregistration. Generally, three steps are required for band-to-band co-registration: high-accuracy matching with reference bands, co-registration model estimation, and BBR matrix evaluation.
3.1. High-Accuracy Matching of Multimodal Images
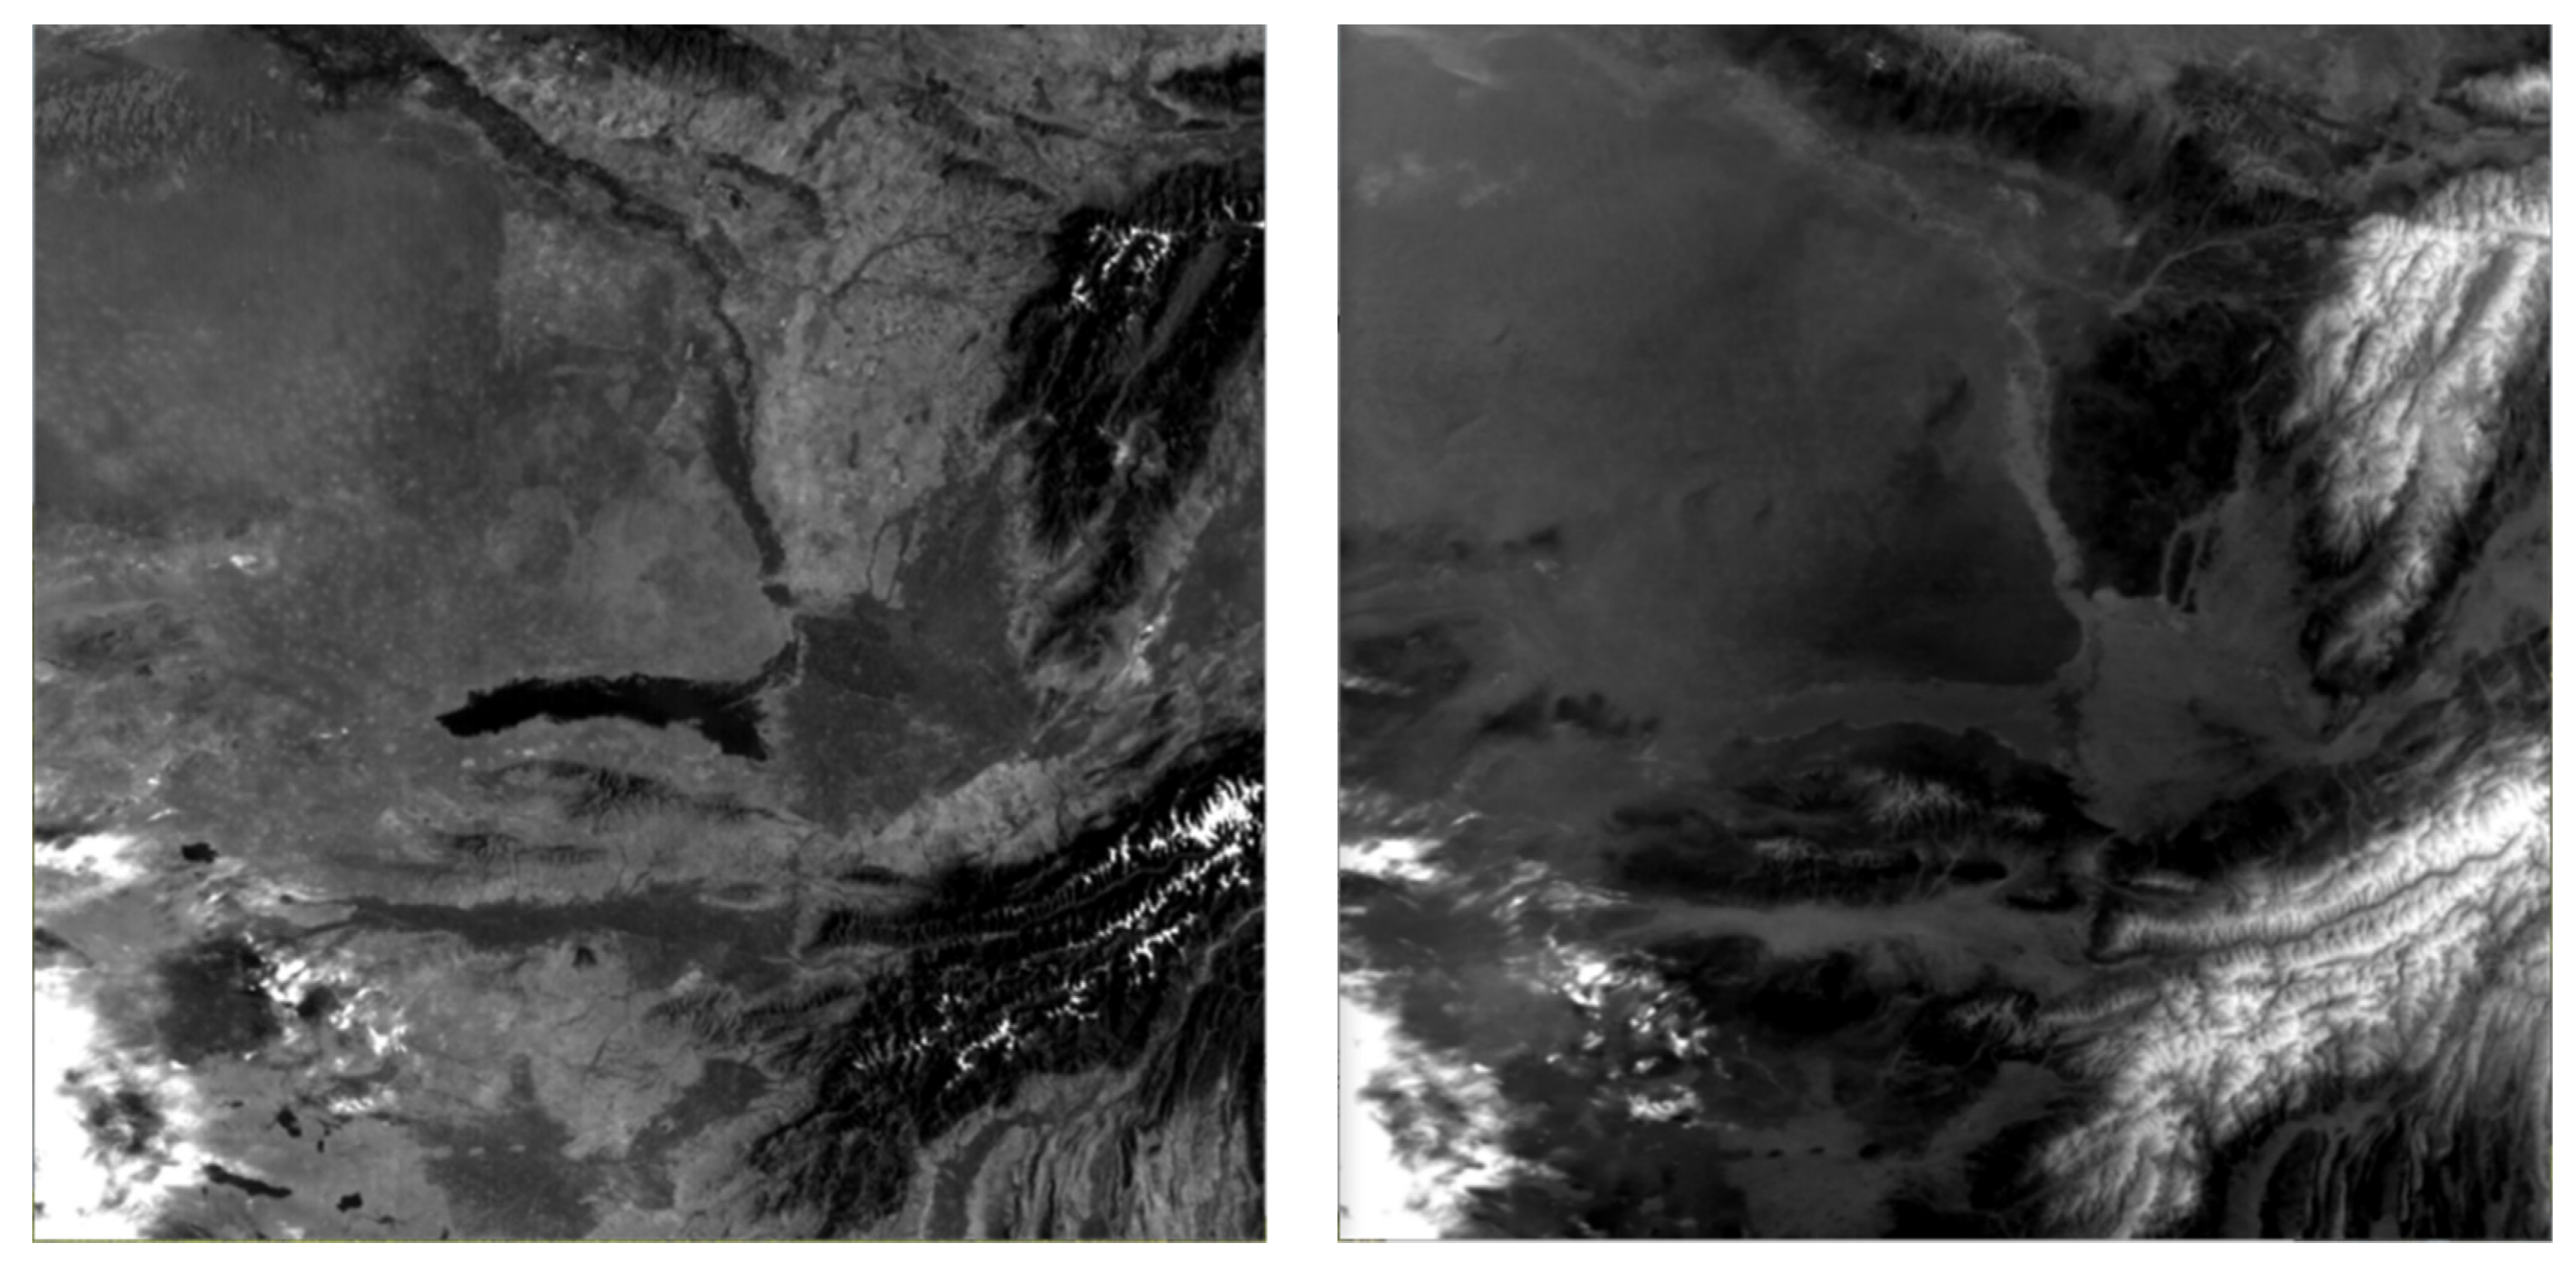
High-accuracy matching is critical in both model estimation and evaluation. Due to the different spectral properties of the 10 bands, as illustrated in
Figure 4, it is difficult to achieve high-accuracy matching. Therefore, the first band was used as the reference band for all reflective bands, whereas band 4 was selected as the reference band for emissive bands. Ideally, there is no BBR misregistration between bands 1 and 4 if both the detectors are situated along the optical axis. However, in practice, misregistration between the two reference bands should be considered. Therefore, nine pairs of bands were used to estimate the coregistration model.
Phase correlation is an attractive image-matching method for the BBR of VIRR. The misregistration between different bands changes slowly with the sample coordinates, as shown in Equation (5). Therefore, misregistration can be approximated by translation into a small local area. Spatial translation introduces a phase difference in frequency, which can be estimated with high accuracy of approximately 1/50 of the image nominal resolution. COSI-Corr [
17] is an excellent phase correlation software package used for band matching. For reflective bands with a high signal-to-noise ratio (SNR), the matching windows were 32 × 32 pixels, whereas the windows for the emissive bands were enlarged to 64 × 64 pixels.
Outliers were removed before the co-registration model was estimated. As proven in
Section 2, the misregistration was the same for each column. Therefore, a median filter was applied to each column to determine misregistration because it was more robust than the mean misregistration.
3.2. Co-Registration Model Estimation and Evaluation
Given the unknown compensation methods applied by the manufacturer, general polynomials were used to fit the remaining misregistration. To guarantee the BBR accuracy, the polynomials should achieve accuracy within 0.1 pixels to allow the fitting of physical models. According to the Maclaurin series of tangent and secant functions, fifth-degree and fourth-degree polynomials are used to model the misregistration in the flight and scanning directions, respectively. The rounding errors should be within 0.1 pixels when the scanning angle changes from −55.36° to 55.36°. The misregistration of the wrapping bands is:
where
s is the sample coordinate of the reference band. The co-registration models of the solar reflective bands can be estimated using Equation (7): The co-registration model of the emissive bands 4–1 is as follows:
where (
s4,
l4) and (
s1,
l1) are the image points in emissive bands 4 and 1, respectively; and
and
are the correction terms derived from Equation (7).
The co-registration models of bands 3 and 5 determined the transformation of band 4. Therefore, the co-registration models were transformed relative to the reflective reference band 1. Using emissive band 5 as an example, the co-registration model is as follows.
BBR should be evaluated for each pair of bands. In such a case, 90 pairs of bands should be co-registered. To reduce the impact of outliers, the median of each column was used to calculate the root mean square errors (RMSEs) for all scenes.
4. Experiments
Initially, the original BBR of FY-1C/1D was studied. In the presence of misregistration, the co-registration model can be estimated for each band and then used to resample the bands to the reference band. Finally, the BBR accuracy was evaluated for different datasets.
4.1. BBR of FY-1C and FY-1D
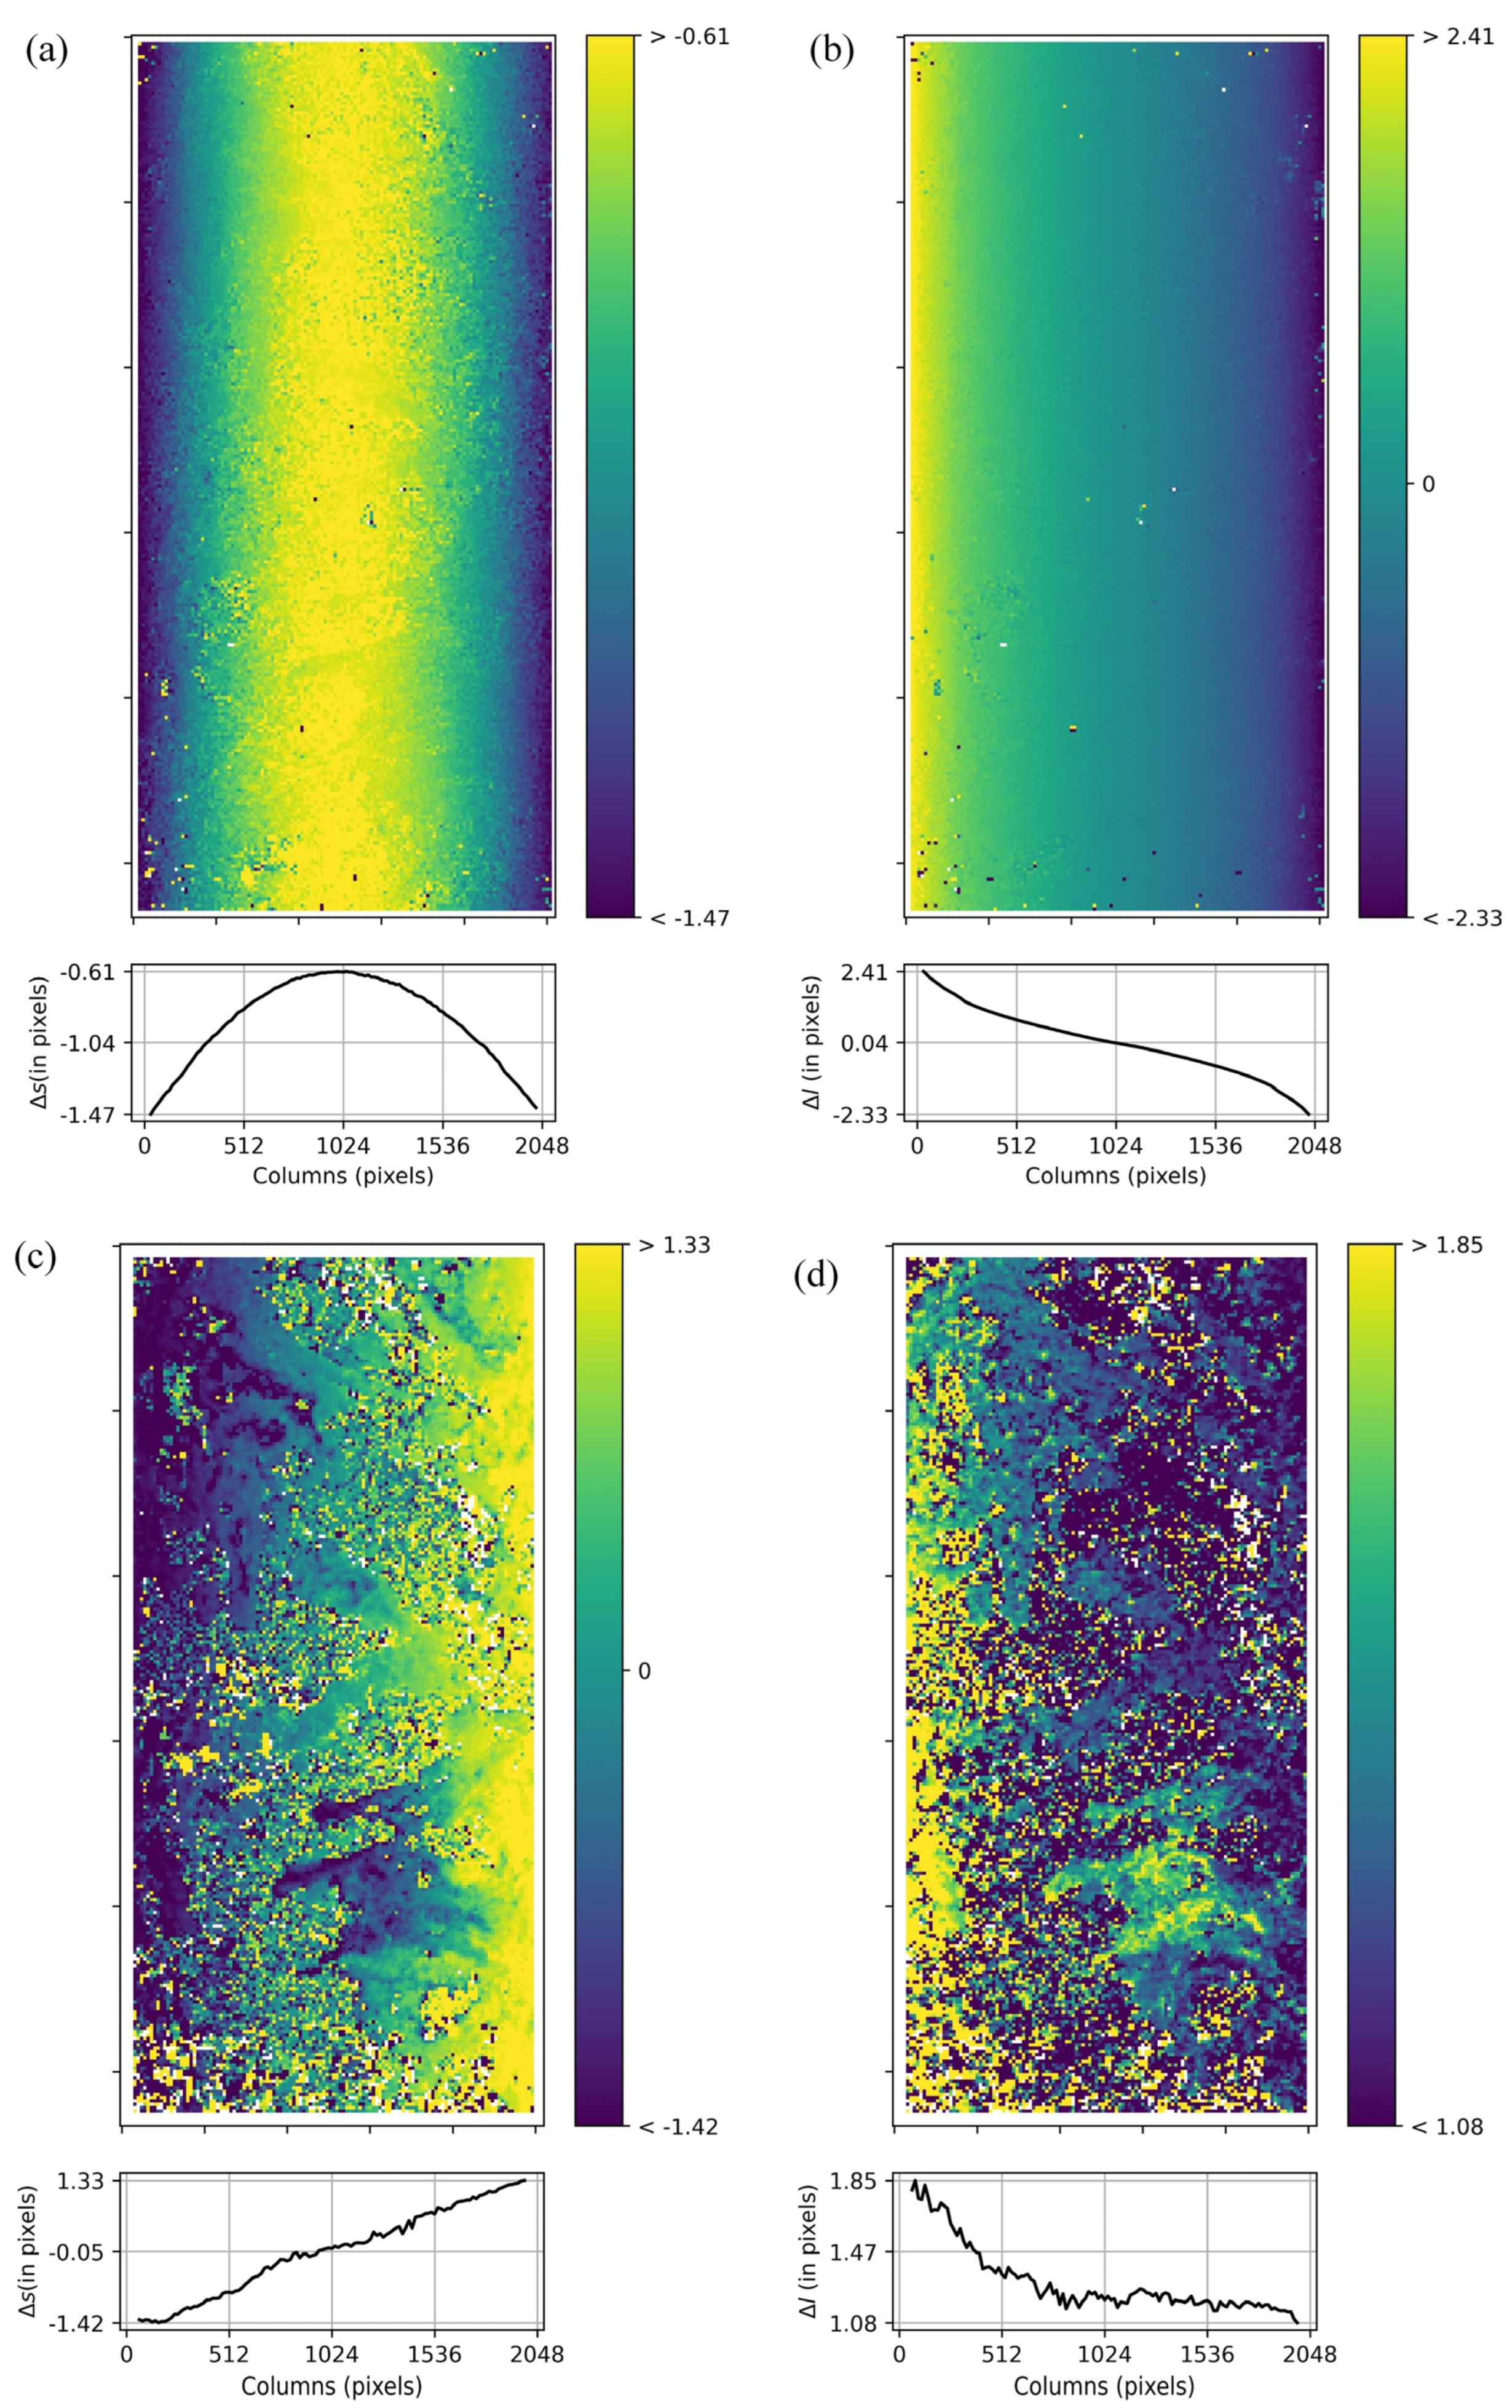
The dataset FY1D_AVHRR_HRPT_L1_ORB_MLT_NUL_20050701_0315_1100M_PJ was used in the experiments. The BBR of the nine pairs was calculated using phase correlation with COSI-Corr. Using band pairs 1 and 8 (B1B8) as an example, where band 1 is the reference band, and band 8 is the wrapping band, the misregistration in both the along-scan and along-track directions is illustrated in
Figure 5, where
Figure 5a,b show the misregistration of B1B8 and
Figure 5c,d show the misregistration of B1B4. Each pixel in the figure represents the overall translation in a 32 × 32 pixels window. Due to the image-matching windows, misregistration of the marginal image area was not possible. The phase-correlation method performed well for pairs of reflective bands in situations where the misregistration map was almost independent of the ground features. In addition, very few outliers were identified in the misregistration map. However, the phase correlation was negatively impacted by outliers in the multimodal images. Misregistration in mountainous areas was different from the others. To remove outliers, the median value of each column was calculated and plotted against a misregistration map. The RMSEs of the medians were calculated to indicate overall misregistration.
As shown in
Section 2.2 and
Section 2.3, there was tangent-style misregistration in the along-track direction and secant-style misregistration in the along-scan direction if the detectors were not aligned with each other. The misregistration of B1B8 in the along-track direction varied from −2.33 to 2.41 pixels, whereas in the along-scan direction, it varied from −1.47 to −0.61 pixels. The RMSEs were 0.94 pixels in the along-scan direction and 1.08 pixels in the along-track direction, respectively. The misregistration
, in the along-track direction, was larger than expected, which might be caused by the larger displacement of band 8 in the focal plane. In addition, the misregistration was not exactly symmetrically skewed at the center of the scanning angles. The misregistration,
, in the along-scan direction was smaller than expected because the global translation was carried out by SITP to maintain the misregistration within one pixel at the nadir. Nevertheless, the misregistration grew from the nadir to the scene edge with the same direction but different magnitudes when compared with the theory in
Section 2.2. The RMSEs of
depend on both global translation and other varying components.
Compared with B1B8, the misregistration of B1B4 showed different patterns in both the along-scan and along-track directions, as shown in
Figure 5c,d. The misregistration in the along-scan direction grew almost linearly with the along-scan coordinate, whereas the misregistration in the along-track direction did not seem to be as stable as B1B8. In addition, the number of outliers was much larger than that of B1B8, which limited the accuracy of the misregistration estimation. Due to the lack of sufficient information on preprocessing methods by SITP, the cause of differing misregistrations remains unclear. Therefore, general polynomials were used to model the remaining misregistration.
4.2. Co-Registration Model Estimation
The median of each column was used to estimate the co-registration models for FY-1C and FY-1D. Comparing
Figure 5a to
Figure 3, it is apparent that
cannot be modeled by Equation (6). Therefore, only
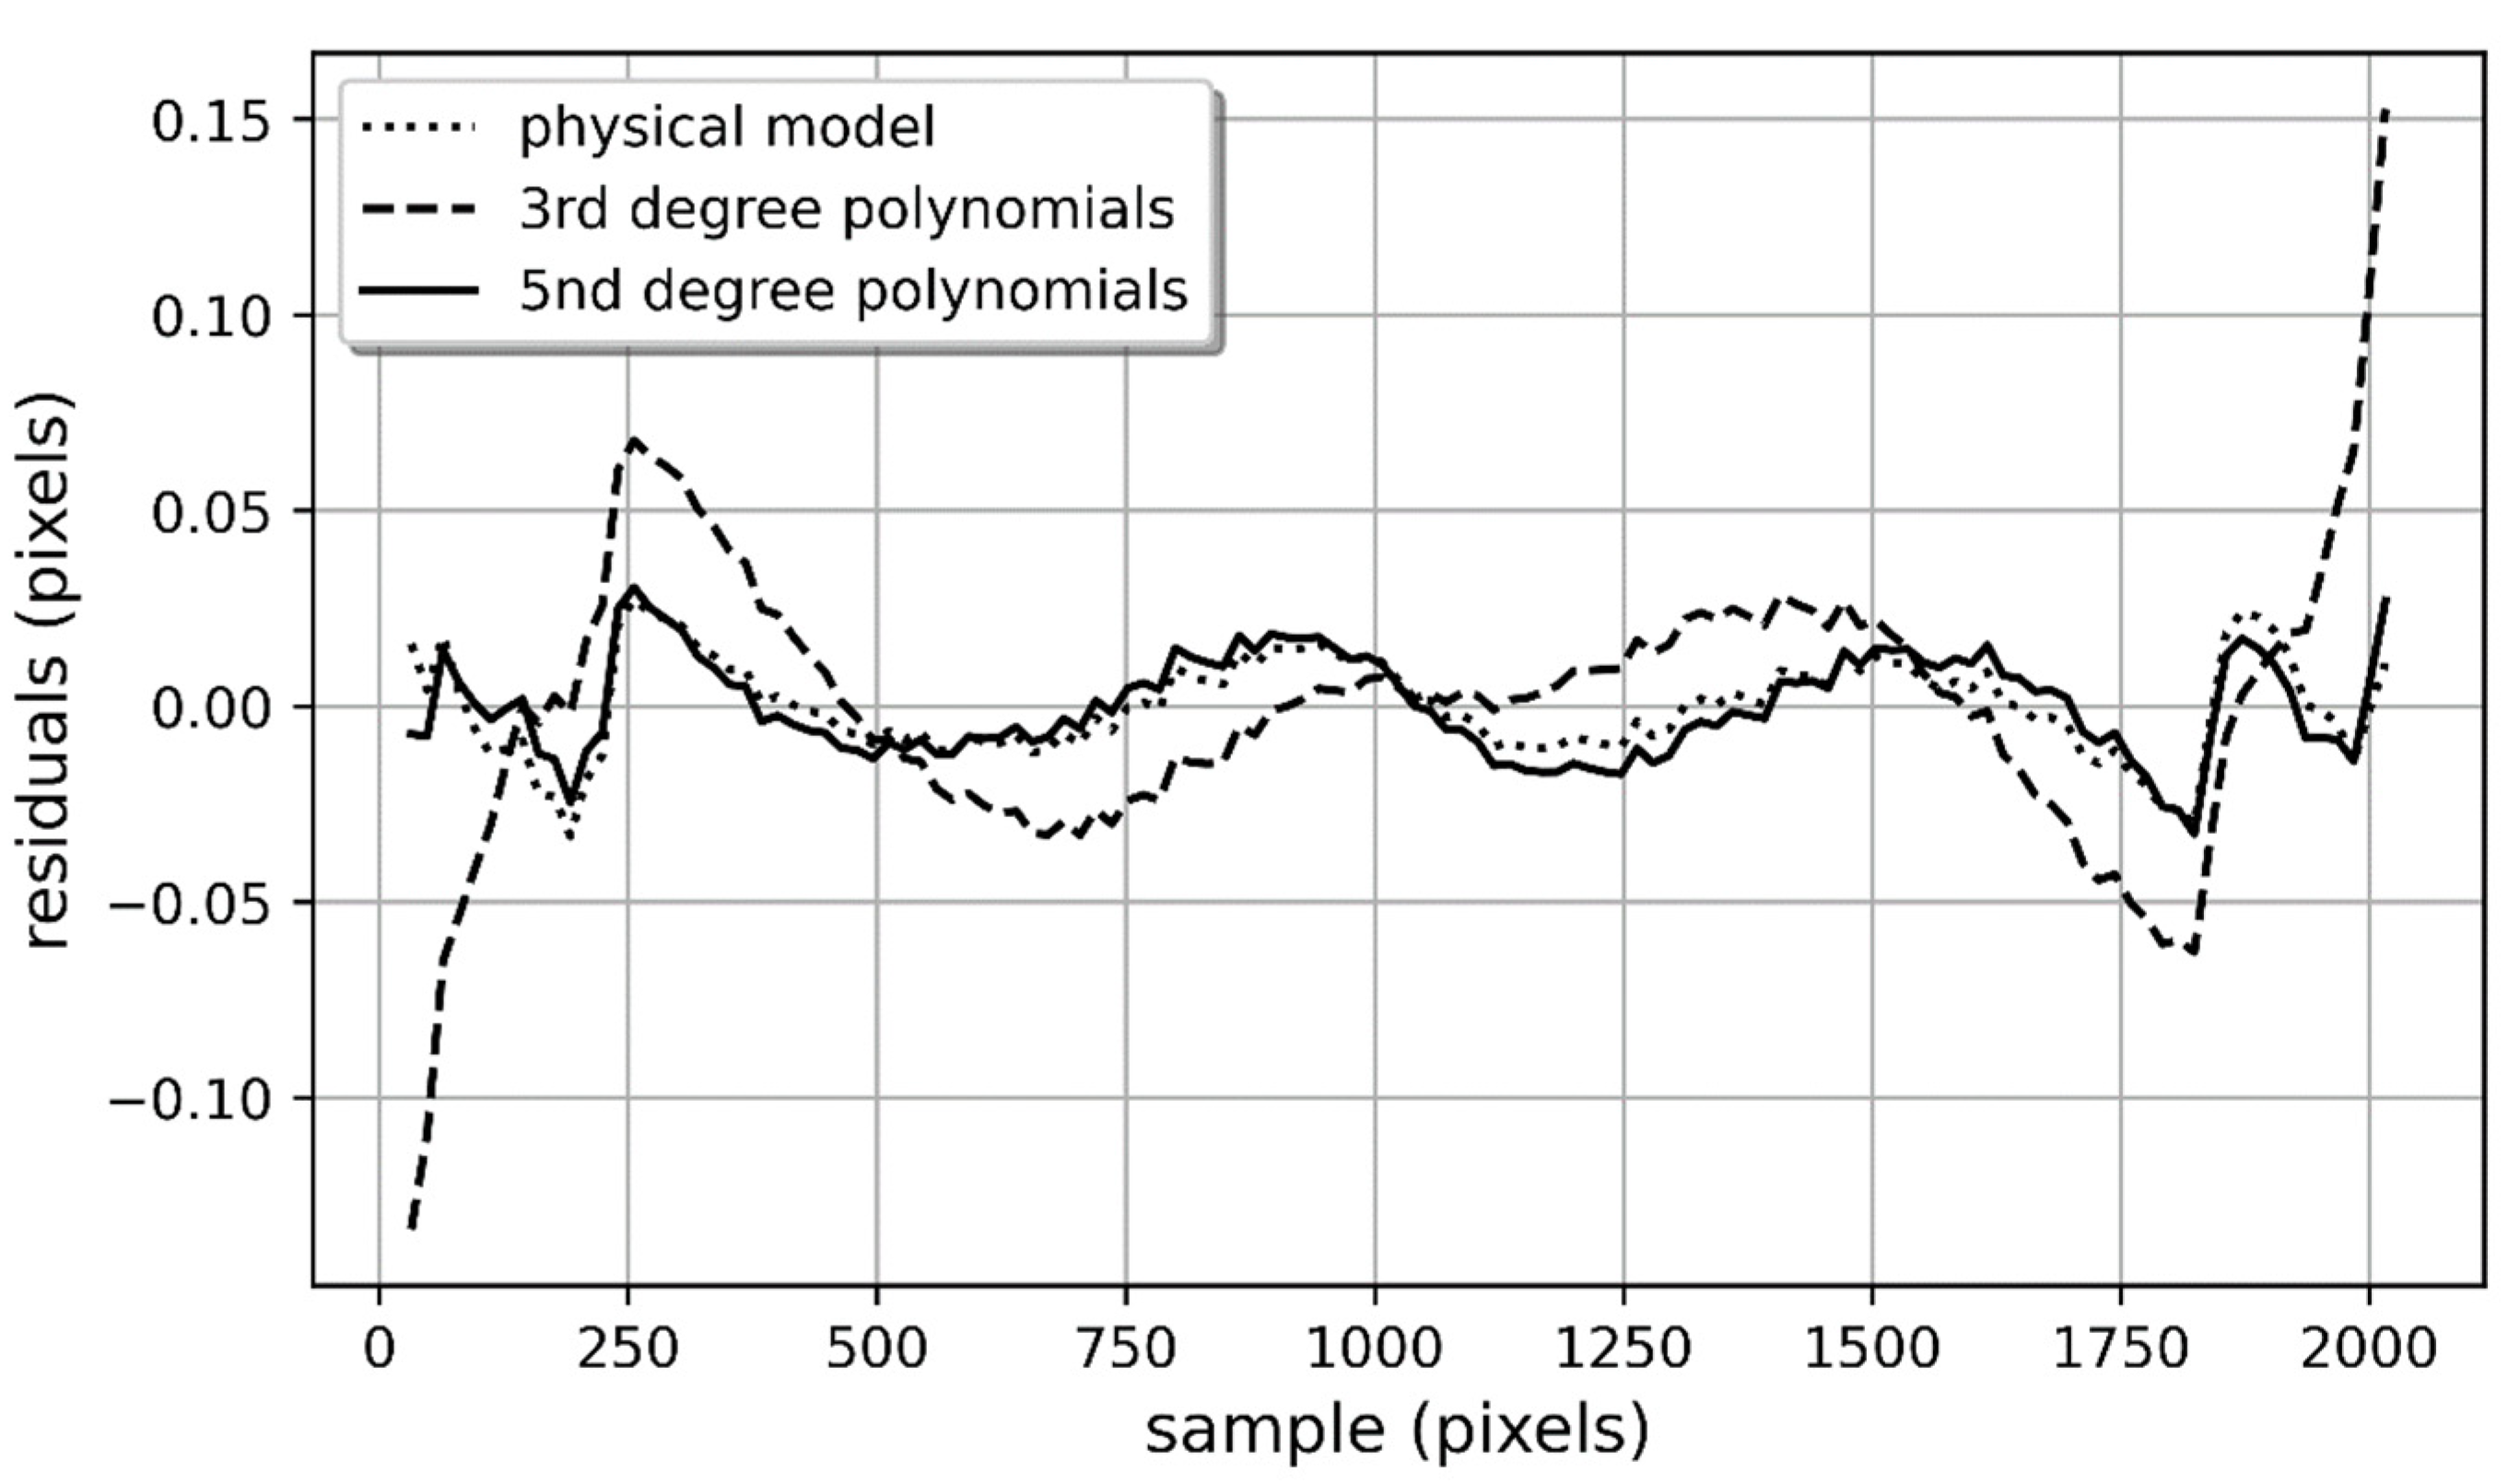
is used to estimate the physical models. Three co-registration models, the physical model, third-degree polynomials, and fifth-degree polynomials, were verified using misregistration residuals. The RMSEs of the three models are 0.012, 0.036, and 0.012 pixels, respectively. As illustrated in
Figure 6, the fifth-degree polynomials achieved accuracy similar to the physical model, whereas the maximum residuals of third-degree polynomials were over 0.1 pixels at large view angles. Due to the large rounding errors of third-degree polynomials, the fifth-degree polynomials were used to model misregistration.
The physical model adopts four general parameters to handle misregistration, as shown in Equation (6). For B1B8,
,
, and
rad. That is, the scanning view angle ranged from −66.09° to 65.33°, which was different from the actual values. This phenomenon indicates that there were other errors that caused misregistration, such as uneven scanning frequency. Matching accuracy is another limitation because resampling kernels may introduce undesirable errors [
17]. The point spread function of the VIRR in the along-scan direction was linear and not a sine function, as in the other satellite images. Therefore, a fourth-degree polynomial was used as the co-registration model in the along-scan direction.
4.3. BBR of VIRR
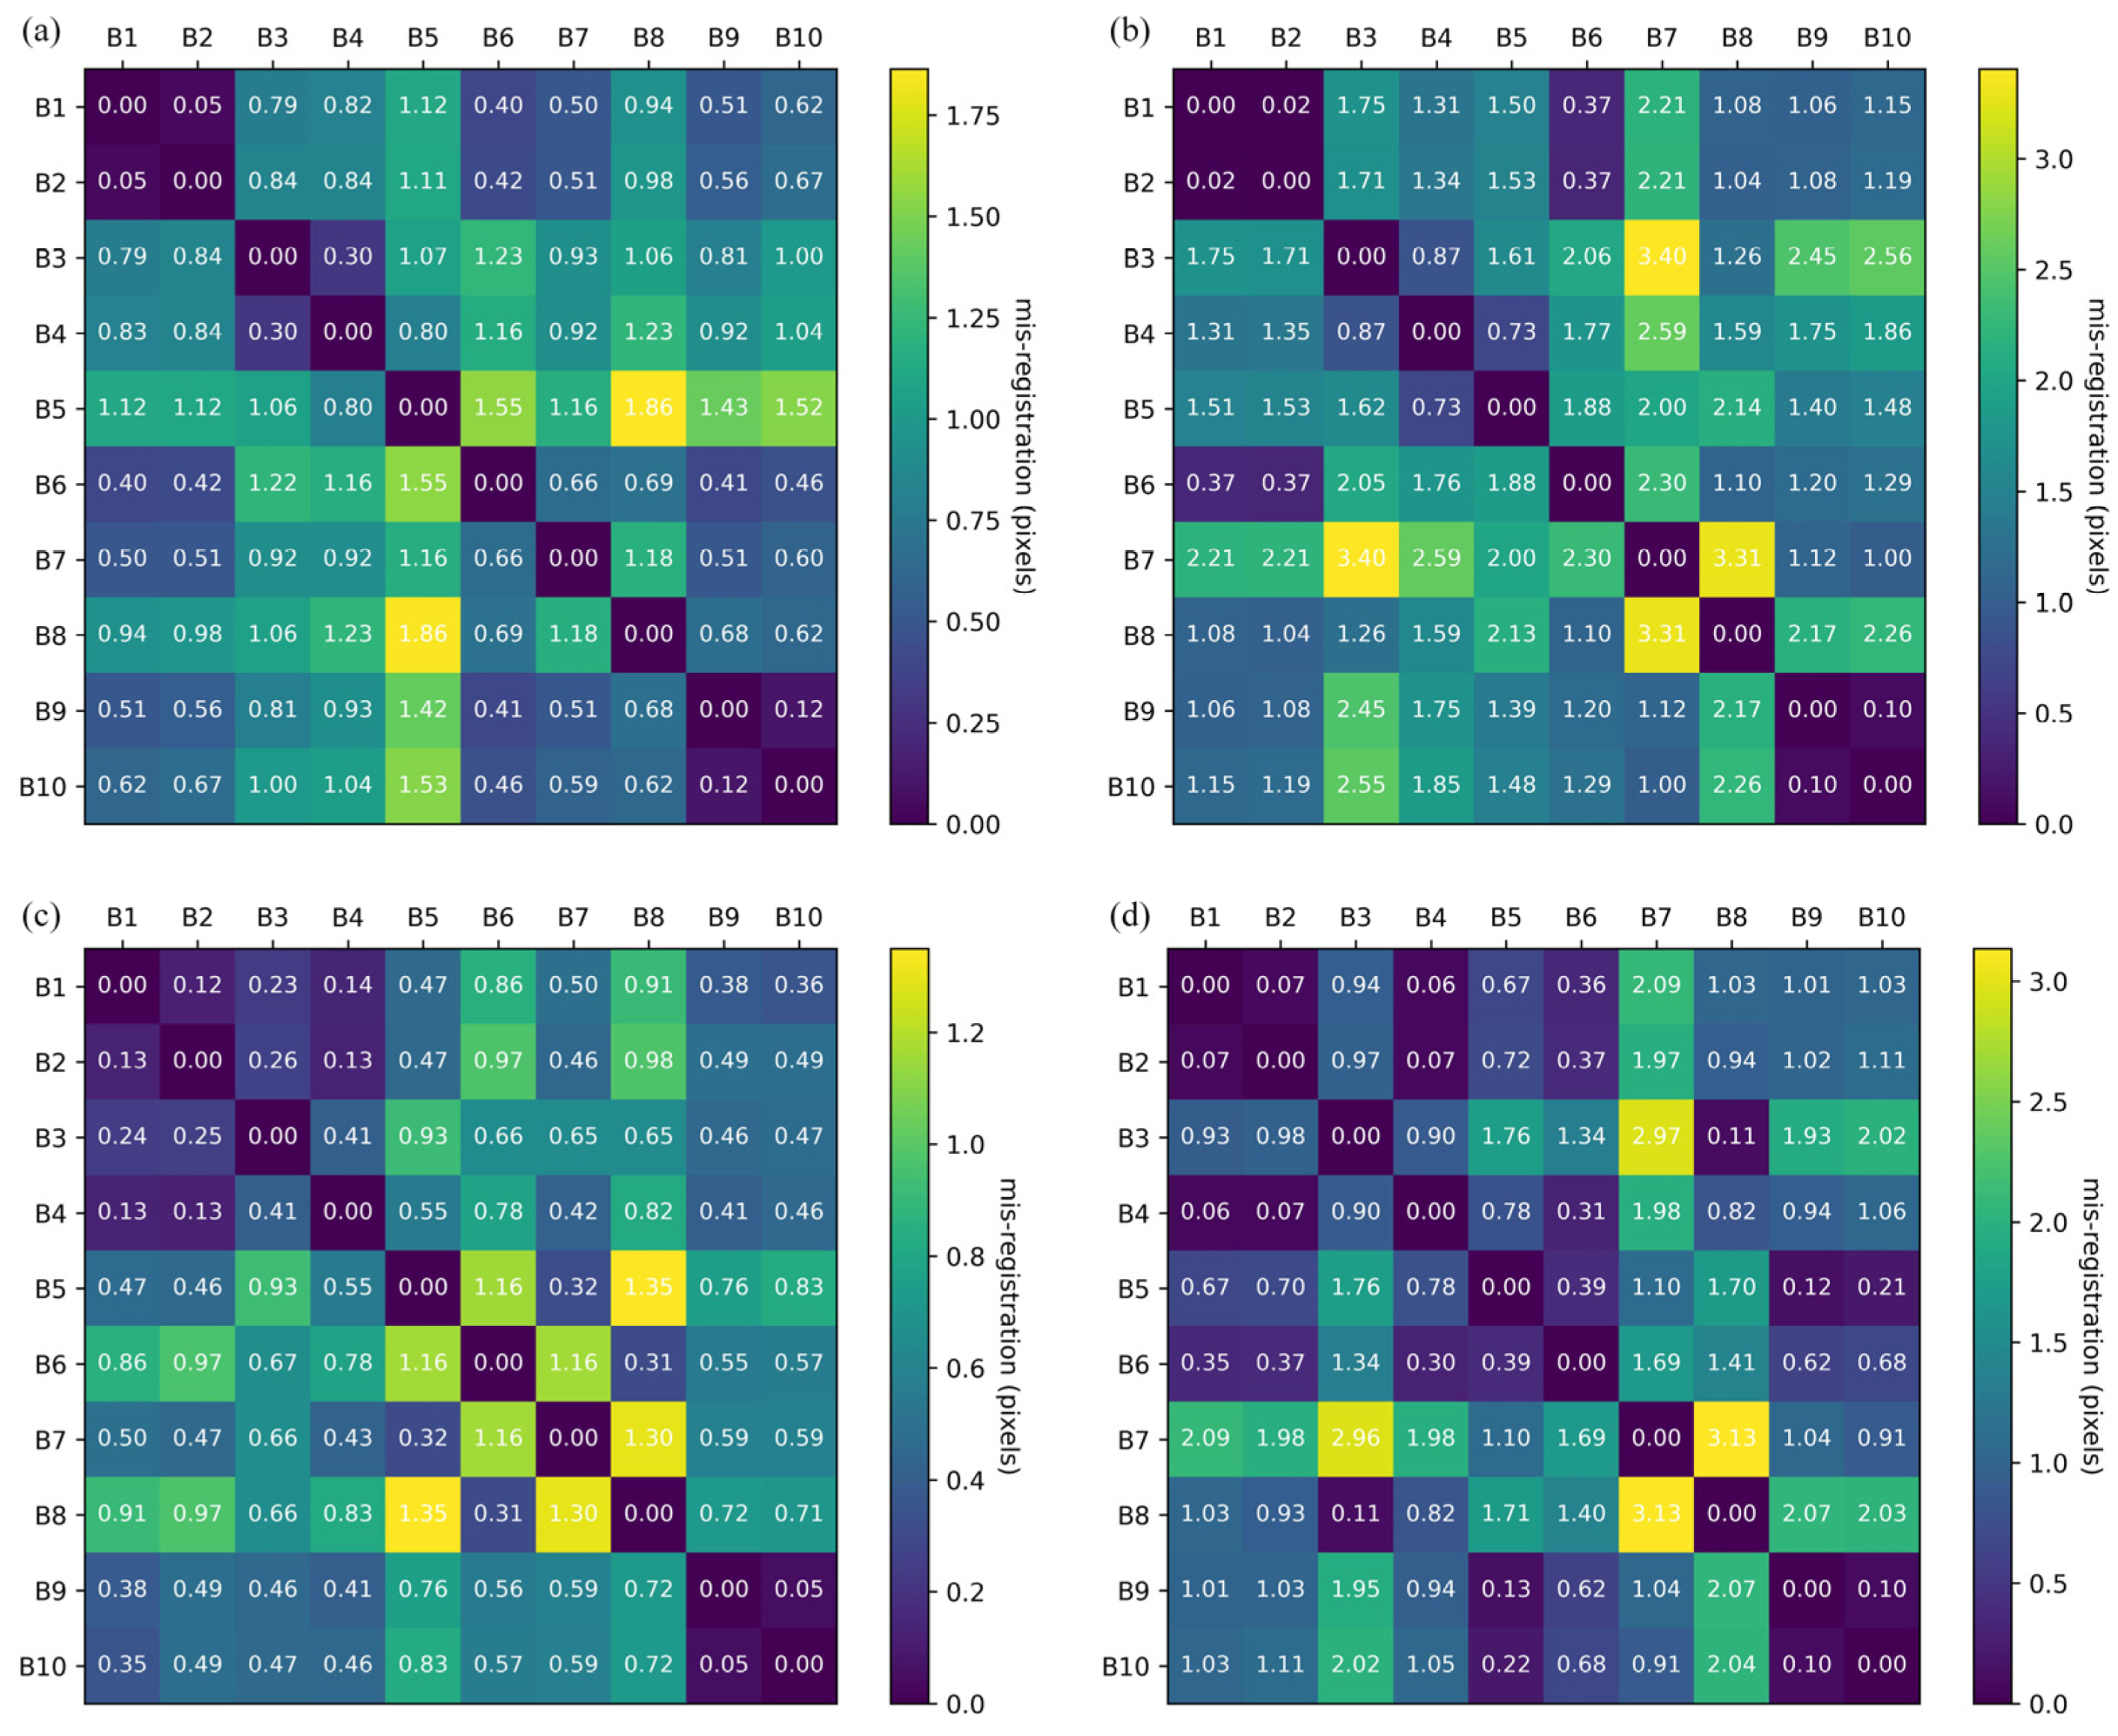
The misregistration of FY-1C/1D was calculated for each pair of bands, and the RMSEs of the median were calculated to indicate overall misregistration. A total of 90 band pairs for the VIRR were calculated. This is presented as a misregistration matrix in
Figure 7. In the misregistration matrix, (B1, B8) indicates the misregistration of B1B8.
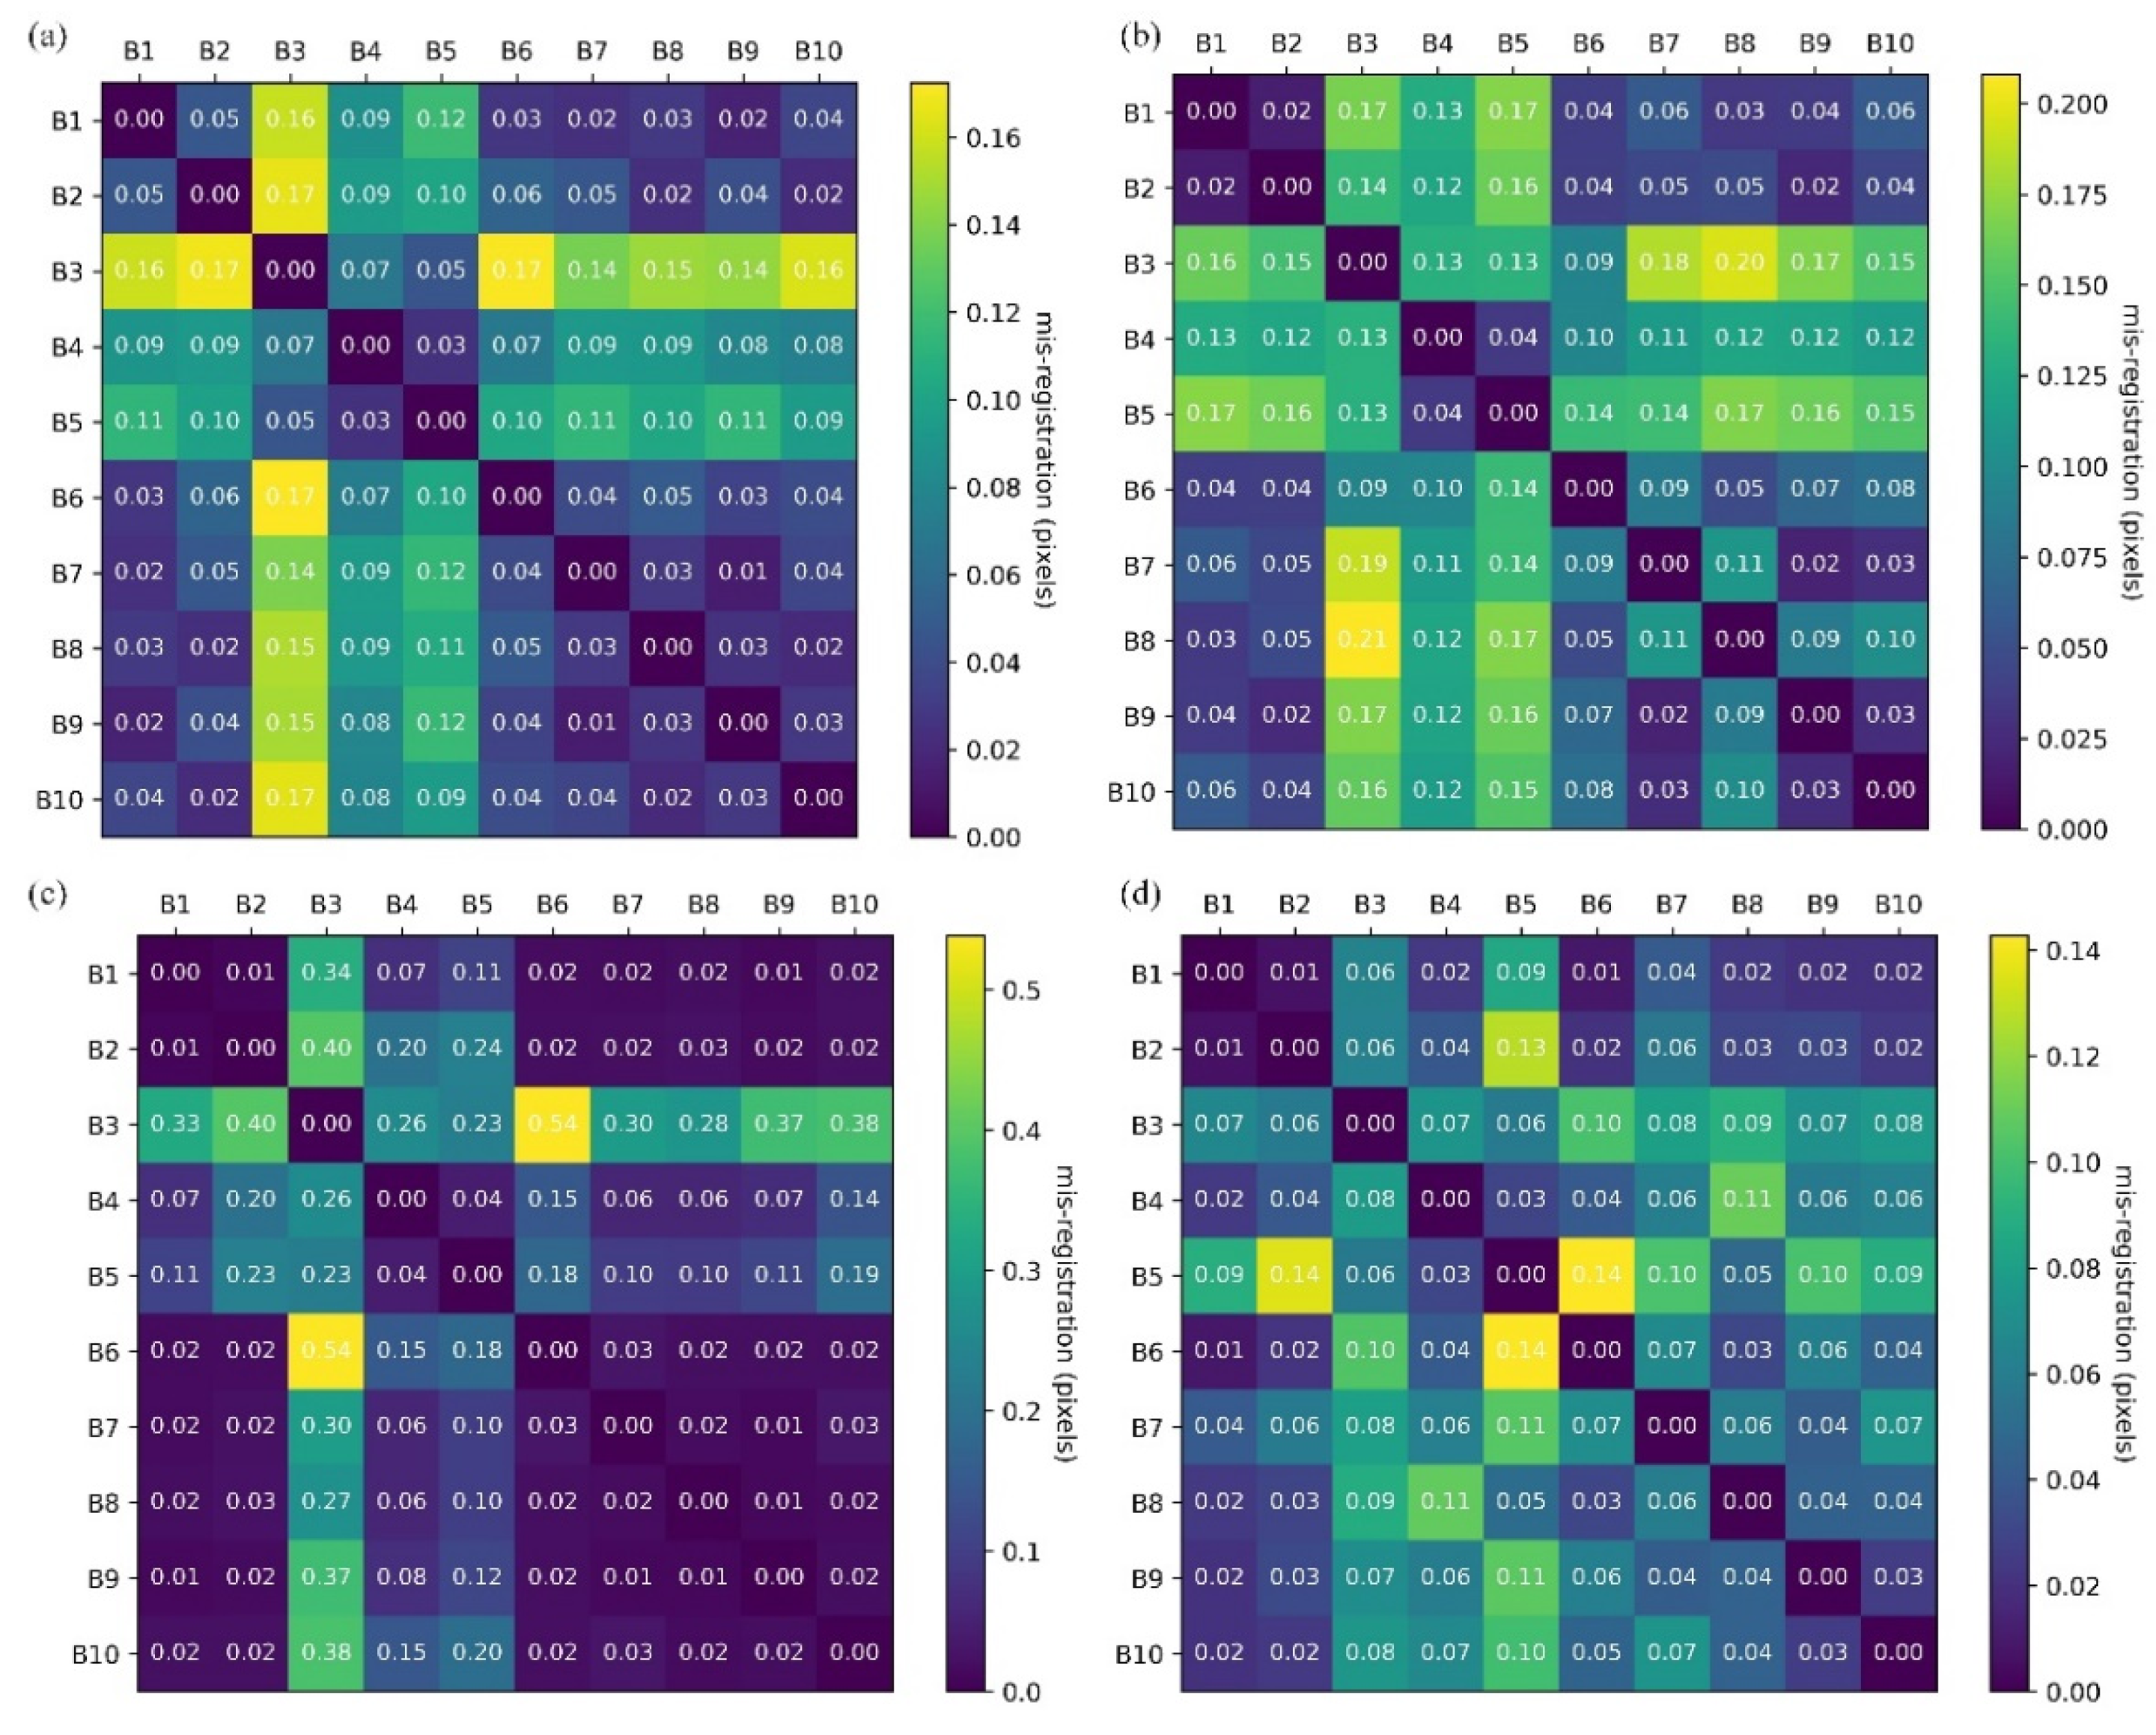
After estimating the co-registration model, image resampling was performed for the remaining nine bands. In this process, cubic splines were used as resampling kernels. Two datasets were used to validate the co-registration model. The misregistration of the bands is presented as a misregistration matrix in
Figure 8.
5. Discussion
Ideally, the misregistration matrix should be symmetrical; however, due to the different SNRs of the reference images, there is a slight difference between the conjugate pairs. As illustrated by the misregistration matrix in
Figure 7, B1B2 and B9B10 of FY-1D showed small misregistration, which proved that detectors B1 and B9 were aligned to B2 and B10, respectively. However, the misregistrations of B1B4 and B1B6 were (0.82, 1.31) and (0.40, 0.37), which indicate that detectors B4 and B6 were not situated along the optical axis, as indicated by the designs. The misregistrations of B7B9, B9B1, and B1B8 were close in the along-track direction because they had the same displacement in the focal plane. The maximum misregistration among the reflective bands was in B7B8, with 3.31 pixels in the along-track direction and 1.18 pixels in the along-scan direction, which was introduced by the largest
. The misregistration between the emissive bands and reflective bands was over 1 pixel, as there was large misregistration between the two base bands, as illustrated in
Figure 5c,d.
For pairs within the same FPA, the misregistration of FY-1C was close to that of FY-1D. In contrast, misregistration between the different FPAs was significantly different. The misregistration of B1B4 was small, indicating that the detector of band 4 was close to the optical axis. Therefore, the misregistration of MWIR and LWIR was smaller than that of FY1D. Based on the coincidence between the misregistration and deployment of FPAs, the major reason for misregistration is the image rotation caused by the 45° scanning mirrors.
As illustrated by the misregistration matrix in
Figure 8, the misregistration of the reflective bands was uniform and within 0.06 pixels in the along-scan and 0.11 pixels in the along-track direction for both FY-1C and FY-1D. The matching errors dominated the RMSEs for misregistration in the along-scan direction. Using the VIS bands as an example, misregistration was within 0.03 pixels. However, there were higher-order residuals in the along-track direction, which caused a larger error in the along-track direction.
In the case of thermal bands, the BBR of B4B5 was within 0.04 pixels in both directions, similar to the VIS bands. However, the misregistration between different spectral regions was much larger. For B3 and B5, the matching errors were accumulated twice. Therefore, the misregistrations of B3 and B5 are larger than that of B4. In addition, the matching errors were much larger for multimodal bands, especially band 3, which had a lower SNR. Ideally, if a similar matching accuracy can be achieved, the misregistration of B3B6 in FY-1C would not exceed the sum of B3B1 and B1B6. However, an extremely large misregistration of 0.54 pixels in the along-scan direction of the FY-1C was detected. From the misregistration map, the matching errors dominate the RMSEs. Using the same routines, the misregistration of FY-1D was much smaller than that of FY-1C in the along-scan direction.
6. Conclusions
The archived VIRR datasets are valuable for environmental monitoring, which requires an accurate BBR to generate high-quality products. However, the FY-1C and FY-1D VIRRs suffered from large misregistrations. In this study, we proposed a theoretical framework for analyzing the BBR of the VIRR. The theory proved that a 45° scanning mirror introduced tangent-style misregistration in the along-track direction and secant-style misregistration in the along-scan direction. The misregistration between bands 1 and 8 was derived according to the optical design. As demonstrated by the experiments, the misregistration within the same FPAs in the along-track direction was consistent with theory. The bands with large intervals in the along-scan direction exhibited large misregistration. Using bands 7 and 8 as examples, the maximum RMSEs in the along-track direction were greater than 3 pixels for both FY-1C and FY-1D. Due to preprocessing by SITP, the misregistration in the along-scan direction was smaller than expected. Moreover, different FPAs showed different patterns of misregistration. Therefore, polynomial-based co-registration models have been proposed to quantify the BBR of the VIRR. To achieve 0.1 pixel fitting accuracy, fourth-degree polynomials were used for the along-scan direction and fifth-degree polynomials for the along-track direction. With such methods, the BBR of reflective bands can be improved to 0.11 pixels for both directions. Limited by matching accuracy, the BBR of thermal bands can be 0.2 to 0.4 pixels, depending on the SNR.
The matching accuracy of the multimodal images is a major limitation of this method. In the future, more matching methods will be tested to improve BBR. After compensating via SITP, the misregistration of FY-3 VIRR was within 1 pixel, which was much smaller than that of FY-1. The residuals might be caused by inaccurate compensation models because the on-orbit parameters might change. The proposed method can be used to improve the BBR of the FY-3 VIRR.
Author Contributions
Conceptualization, H.P. and J.T.; data curation, J.W., C.L. and L.Y.; formal analysis, H.P.; funding acquisition, H.P.; investigation, H.P. and L.Y.; methodology, H.P., T.W. and C.L.; project administration, H.P.; resources, J.W., C.L. and L.Y.; software, H.P.; supervision, H.P.; validation, H.P., J.T. and J.W.; visualization, H.P. and J.W.; writing—original draft, H.P. and J.T.; writing—review and editing, H.P. and J.T. All authors have read and agreed to the published version of the manuscript.
Funding
This study was supported by the National Key R&D Program of China (2018YFB0504905), National Natural Science Foundation of China (NSFC) project (No. 41971418), and Gaofen Satellite Remote Sensing Surveying and Mapping Application Demonstration System (Phase II) of China (No. 42-Y30B04-9001-19/21).
Conflicts of Interest
The authors declare no conflict of interest.
References
- Gong, H.-X.; Zheng, Q.-B.; Weng, C.-J.; Zhang, E. 10-band visible-IR scanning radiometer on Chinese FY-1C meteorological satellite. J. Infrared Millim. Waves 2000, 19, 321–326. [Google Scholar]
- Tan, B.; Woodcock, C.E.; Hu, J.; Zhang, P.; Ozdogan, M.; Huang, D.; Yang, W.; Knyazikhin, Y.; Myneni, R.B. The impact of gridding artifacts on the local spatial properties of MODIS data: Implications for validation, compositing, and band-to-band registration across resolutions. Remote Sens. Environ. 2006, 105, 98–114. [Google Scholar] [CrossRef]
- Lin, G.; Tilton, J.C.; Wolfe, R.E.; Tewari, K.P.; Nishihama, M. SNPP VIIRS spectral bands co-registration and spatial response characterization. In Proceedings of the Earth Observing Systems XVIII, San Diego, CA, USA, 25–29 August 2013; International Society for Optics and Photonics: San Diego, CA, USA, 2013; p. 88661G. [Google Scholar]
- Xie, Y.; Xiong, X.; Qu, J.J.; Che, N.; Wang, L. Sensitivity Analysis of MODIS Band-to-Band Registration Characterization and Its Impact on the Science Data Products. In Proceedings of the Remote Sensing and Modeling of Ecosystems for Sustainability IV, San Diego, CA, USA, 28–29 August 2007; International Society for Optics and Photonics: San Diego, CA, USA, 2007; p. 667908. [Google Scholar]
- Wang, Z.; Xiong, X. Band-to-Band Misregistration of the Images of MODIS Onboard Calibrators and Its Impact on Calibration. IEEE Trans. Geosci. Remote 2017, 55, 2136–2143. [Google Scholar] [CrossRef] [PubMed]
- Lin, G.; Wolfe, R.; Tilton, J. Trending of SNPP Ephemeris and Its Implications on VIIRS Geometric Performance. In Proceedings of the Earth Observing Systems XXI, San Diego, CA, USA, 28 August–1 September 2016; Volume 9972, p. 99721K. [Google Scholar] [CrossRef] [Green Version]
- Lin, G.; Wolfe, R. JPSS-1 VIIRS At-Launch Geometric Performance. In Proceedings of the Earth Observing Systems XXI, San Diego, CA, USA, 28 August–1 September 2016; Volume 9972, p. 99721L. [Google Scholar] [CrossRef] [Green Version]
- Wolfe, R.E.; Lin, G.; Nishihama, M.; Tewari, K.P.; Tilton, J.C.; Isaacman, A.R. Suomi NPP VIIRS prelaunch and on-orbit geometric calibration and characterization. J. Geophys. Res. Atmos. 2013, 118, 11508–11521. [Google Scholar] [CrossRef] [Green Version]
- Lee, D.S.; Storey, J.C.; Choate, M.J.; Hayes, R.W. Four years of Landsat-7 on-orbit geometric calibration and performance. IEEE Trans. Geosci. Remote 2004, 42, 2786–2795. [Google Scholar] [CrossRef]
- Aksakal, S.K.; Neuhaus, C.; Baltsavias, E.; Schindler, K. Geometric Quality Analysis of AVHRR Orthoimages. Remote Sens. 2015, 7, 3293–3319. [Google Scholar] [CrossRef] [Green Version]
- Choi, T.; Shao, X.; Cao, C. NOAA-20 Visible Infrared Imaging Radiometer Suite (VIIRS) on-Orbit Band-To-Band Registration Estimation for Reflective Solar Band (RSB) Using Scheduled Lunar Collections. In Proceedings of the IGARSS 2019—2019 IEEE International Geoscience and Remote Sensing Symposium, Yokohama, Japan, 28 July–2 August 2019; pp. 9059–9062. [Google Scholar]
- Wang, Z.; Xiong, X.; Li, Y. Improved Band-to-Band Registration Characterization for VIIRS Reflective Solar Bands Based on Lunar Observations. Remote Sens. 2016, 8, 27. [Google Scholar] [CrossRef] [Green Version]
- Yang, K.; Fleig, A.J.; Wolfe, R.E.; Nishihama, M. MODIS band-to-band registration. In Proceedings of the 2010 IEEE International Geoscience and Remote Sensing Symposium, Honolulu, HI, USA, 20–30 July 2010; pp. 887–889. [Google Scholar]
- Kabir, S.; Leigh, L.; Helder, D. Vicarious Methodologies to Assess and Improve the Quality of the Optical Remote Sensing Images: A Critical Review. Remote Sens. 2020, 12, 4029. [Google Scholar] [CrossRef]
- Tilton, J.C.; Lin, G.; Tan, B. Measurement of the Band-to-Band Registration of the SNPP VIIRS Imaging System From On-Orbit Data. IEEE J. Sel. Top. Appl. Earth Obs. Remote Sens. 2017, 10, 1056–1067. [Google Scholar] [CrossRef] [PubMed] [Green Version]
- Tilton, J.C.; Wolfe, R.E.; Lin, G.; Dellomo, J.J. On-Orbit Measurement of the Effective Focal Length and Band-to-Band Registration of Satellite-Borne Whiskbroom Imaging Sensors. IEEE J. Sel. Top. Appl. Earth Obs. Remote Sens. 2019, 12, 4622–4633. [Google Scholar] [CrossRef] [PubMed]
- Leprince, S.; Barbot, S.; Ayoub, F.; Avouac, J.P. Automatic and Precise Orthorectification, Coregistration, and Subpixel Correlation of Satellite Images, Application to Ground Deformation Measurements. Geosci. Remote Sens. IEEE Trans. 2007, 45, 1529–1558. [Google Scholar] [CrossRef] [Green Version]
| Publisher’s Note: MDPI stays neutral with regard to jurisdictional claims in published maps and institutional affiliations. |
© 2022 by the authors. Licensee MDPI, Basel, Switzerland. This article is an open access article distributed under the terms and conditions of the Creative Commons Attribution (CC BY) license (https://creativecommons.org/licenses/by/4.0/).


