Article

The 8 January 2022, Menyuan Earthquake in Qinghai, China: A Representative Event in the Qilian-Haiyuan Fault Zone Observed Using Sentinel-1 SAR Images

The Second Monitoring and Application Center, China Earthquake Administration, 316 Xiying Rd., Xi’an 710054, China
*
Author to whom correspondence should be addressed.
Remote Sens. 2022, 14(23), 6078; https://doi.org/10.3390/rs14236078
Submission received: 1 November 2022 / Revised: 28 November 2022 / Accepted: 28 November 2022 / Published: 30 November 2022
(This article belongs to the Special Issue Monitoring Subtle Ground Deformation of Geohazards from Space)

Abstract

:
On 8 January 2022, a Ms 6.9 earthquake occurred in Menyuan, Qinghai, China. This event provided important geodetic data before and after the earthquake, facilitating the investigation of the slip balance along the seismogenic faults to understand seismogenic behavior and assess seismic risk. In this study, we obtained the interseismic (2016–2021) and coseismic deformation fields of the 2022 earthquake using Sentinel-1 synthetic aperture radar (SAR) images and estimated the slip rate, fault locking, and coseismic slip of the seismogenic faults. The results indicated that the seismogenic fault of the 2022 Menyuan earthquake, i.e., the Tuolaishan–Lenglongling Fault, had shallow locked areas before the earthquake; its long-term slip rate could reach 6 ± 1.2 mm/yr. The earthquake ruptured a sinistral strike-slip fault with a high dip angle; the maximum slip magnitude reached 3.47 m, with a moment magnitude of 6.6. The area of coseismic slip > 1.5 m was equivalent to the range of the isoline, with a locking value of 0.6. The interseismic locking region can limit the approximate scope of the coseismic slip distribution. The 2022 Menyuan earthquake released energy that had accumulated over 482 years in the stepover region between the Lenglongling and Tuolaishan faults. The accumulated elastic strain power of the Tuolaishan Fault was equivalent to an Mw 6.79 earthquake. These circumstances in terms of the strain energy balance demonstrate that interseismic locking, as constrained from the geodetic data, and the elapsed time from the previous paleoseismic event are useful for earthquake location and energy predictions.

1. Introduction

High-precision and -density geodetic observations can aid in the investigations of fault motion during the earthquake occurrence process and are crucial for location predictions of a potential earthquake (e.g., [1,2,3,4,5]). However, for continental earthquakes in China, there are only few examples with available high-density geodetic observations both before and after the earthquake.
According to the China Earthquake Networks Center (CENC), an Ms 6.9 earthquake occurred in Menyuan County, Qinghai Province, at 1:45 AM (Beijing time) on 8 January 2022, with a focal depth of 10 km. After the earthquake, different institutions obtained focal mechanism solutions that indicated that this earthquake is a high dip angle strike-slip rupture event. Combined with the geologic background of the seismogenic fault, it was preliminarily determined that the earthquake occurred in the stepover zone between the Lenglongling and Tuolaishan faults (Figure 1b; [6]). According to historical records, the most recent earthquakes with magnitudes of ≥6 in this region were the Menyuan Mw 6.0 earthquake in 1986, Menyuan Mw 5.9 earthquake in 2016, and Gulang Mw 7.7 earthquake in 1927 [7,8,9,10,11,12,13,14,15,16,17,18]. Both the 1986 and 2016 Menyuan earthquakes occurred on a secondary fault on the northern side of the Lenglongling Fault; their focal mechanisms both indicated low dip angle thrust earthquakes, which is inconsistent with the sinistral strike-slip motion of the Lenglongling Fault [8]. In addition, the 1927 Gulang earthquake occurred on the Huangcheng–Shuangta Fault, which is located far from the epicenter of the 2022 earthquake. Therefore, these earthquakes cannot be regarded as characteristic seismic events on the Lenglongling Fault. The strike-slip properties of the 2022 Menyuan earthquake are consistent with those of the Lenglongling and Tuolaishan faults; the earthquake epicenter was located at the intersection of these two strike-slip faults. Therefore, capturing the interseismic locking to explore the slip balance of the seismogenic faults is possible.
Interferometric synthetic aperture radar (InSAR) has been widely used to constrain seismic fault parameters [19,20,21,22,23,24,25,26,27,28]. Following the 2016 Menyuan earthquake, large quantities of early observation data were accumulated and extensive research was conducted. These previous studies established the 2022 Menyuan earthquake as a characteristic seismic event that yielded good InSAR deformation observations before and after the earthquake. The 2016 earthquake also differed from the 2021 Maduo Ms 7.4 earthquake [29], 2017 Jiuzhaigou Ms 7.0 earthquake [30] and 1986 and 2016 Menyuan earthquakes, which occurred on the secondary fault. The seismogenic faults are the main faults [31,32,33,34,35], exhibiting clear strain concentrations in the deformation field [36]. This provides an excellent opportunity to investigate the interseismic and coseismic behavior of the seismogenic faults while discussing the relationship between interseismic locking and coseismic deformation using high-density deformation data (Figure 1b). To date, many studies have focused on interseismic deformation of the Tuolaishan–Lenglongling–Haiyuan faults using Global Navigation Satellite System (GNSS) data [37,38,39]. However, owing to the low spatial resolution of GNSS data, identifying fine-scale strain distributions along the faults has remained difficult. In addition, previous studies using InSAR have mainly focused on the Haiyuan Fault, whereas negligible research has been conducted on the Tuolaishan–Lenglongling faults [40,41,42,43,44].
Based on these considerations, we obtained Sentinel-1 SAR images to determine the pre-earthquake deformation rate and coseismic deformation field of the 2022 Menyuan earthquake. We then constructed an angular dislocation model based on an elastic half-space to estimate the interseismic locking for the seismogenic faults, as well as the coseismic slip distribution of the earthquake. We also calculated the static Coulomb stress changes caused by the earthquake on the surrounding faults using the coseismic slip model. Finally, we discussed the seismic risks along the faults near the epicenter and the tectonic implications of this earthquake based on the geological and geophysical data.

2. Tectonic Setting

Since the initiation of the collision between India and Eurasia, the Indian continent has moved ~2500 km northward, resulting in large-scale N–S deformation of the Asian continent. The most substantial deformation zones are located along several large strike-slip faults, including the Karakoram, Jiali, Altyn, Xianshuihe, East Kunlun, and Qilian-Haiyuan faults (Figure 1a; [46,47]). These large strike-slip faults absorb the major deformation components that derive from the expanding Tibetan Plateau and control the strain partitioning [48,49]. Generally, the deformation width along these large strike-slip faults can reach up to 40 km [50] and does not directly affect the deformation of the areas between the faults. However, variations in the slip rates of the strike-slip faults can reflect the deformation state of the entire region. Therefore, determining accurate slip rates and investigating characteristic seismic events along large strike-slip faults is conducive to understanding the expansion mode of the Tibetan Plateau, referred to as “Block-like mode” and “Continued mode.” In block-like mode, the fault slip rates are large and only the seismic risk of faults is high; however, in continued mode, the fault slip rates are small, and seismic events scatter across a region, not confined to a fault [35,47,51].
The 2022 Menyuan Ms 6.9 earthquake occurred in the stepover zone between the Lenglongling and Tuolaishan faults on the northern margin of the Tibetan Plateau [6,52,53,54,55]. As part of the Qilian-Haiyuan Fault Zone, the Tuolaishan and Lenglongling faults share a large number of sinistral strike-slip motions [56,57,58]. The Tuolaishan Fault has a total length of >280 km, beginning at Halahu in the west and ending at Tianyugou in the east. The fault has an overall NWW trend and dips to the SW. The fault motion is mainly sinistral strike-slip, with a thrust component, at rates of 1–3 and 4–6 mm/yr on the western and eastern segments, respectively (Figure 1b) [34,35]. The Lenglongling Fault links with the Tuolaishan Fault in the west and with the Jinqianghe Fault in the east, characterized by a length of ~120 km and notable linear characteristics. Since the late Quaternary, the Lenglongling Fault has undergone sinistral strike-slip motion with a thrust component [7]. The late Quaternary slip rate of the Lenglongling Fault remains unclear, with estimates ranging from 19 ± 5 to 3.35–4.62 mm/yr [31,32,33,35]. GNSS observations have been used to constrain the slip rate of the Tuolaishan and Lenglongling faults, but only the slip rate of the entire segment can be obtained owing to sparse data. Zheng et al. [35] used the GNSS velocity field from 1999 to 2007 to determine that the strike-slip rate of the Tuolaishan Fault was ~4 mm/yr. Li et al. [38] calculated the slip rate and locking of the Qilian-Haiyuan Fault using the negative dislocation model, finding that the sinistral strike-slip rate decreased gradually from 5.5 mm/yr in the west to 4.5 mm/yr in the east. Li et al. [39] calculated the slip rates of all of the faults on the northern margin of the Tibetan Plateau using a block model, finding that the slip rates along the western and eastern segments of the Tuolaishan Fault were ~2.9 and 5.8 mm/yr, respectively, while the slip rates of the Lenglongling, Jinqianghe, and Haiyuan faults were ~5.3 mm/yr. The Haiyuan Fault has also been examined using InSAR deformation observations, which yielded slip rates from 4.2 to 11.5 mm/yr [40,41,42,43,44,59,60]. Overall, the Quaternary and geodetic slip rates of the seismogenic faults related to the Menyuan earthquake are quite different. Therefore, we must constrain the slip rates of these faults using more datasets.

3. Data and Methods

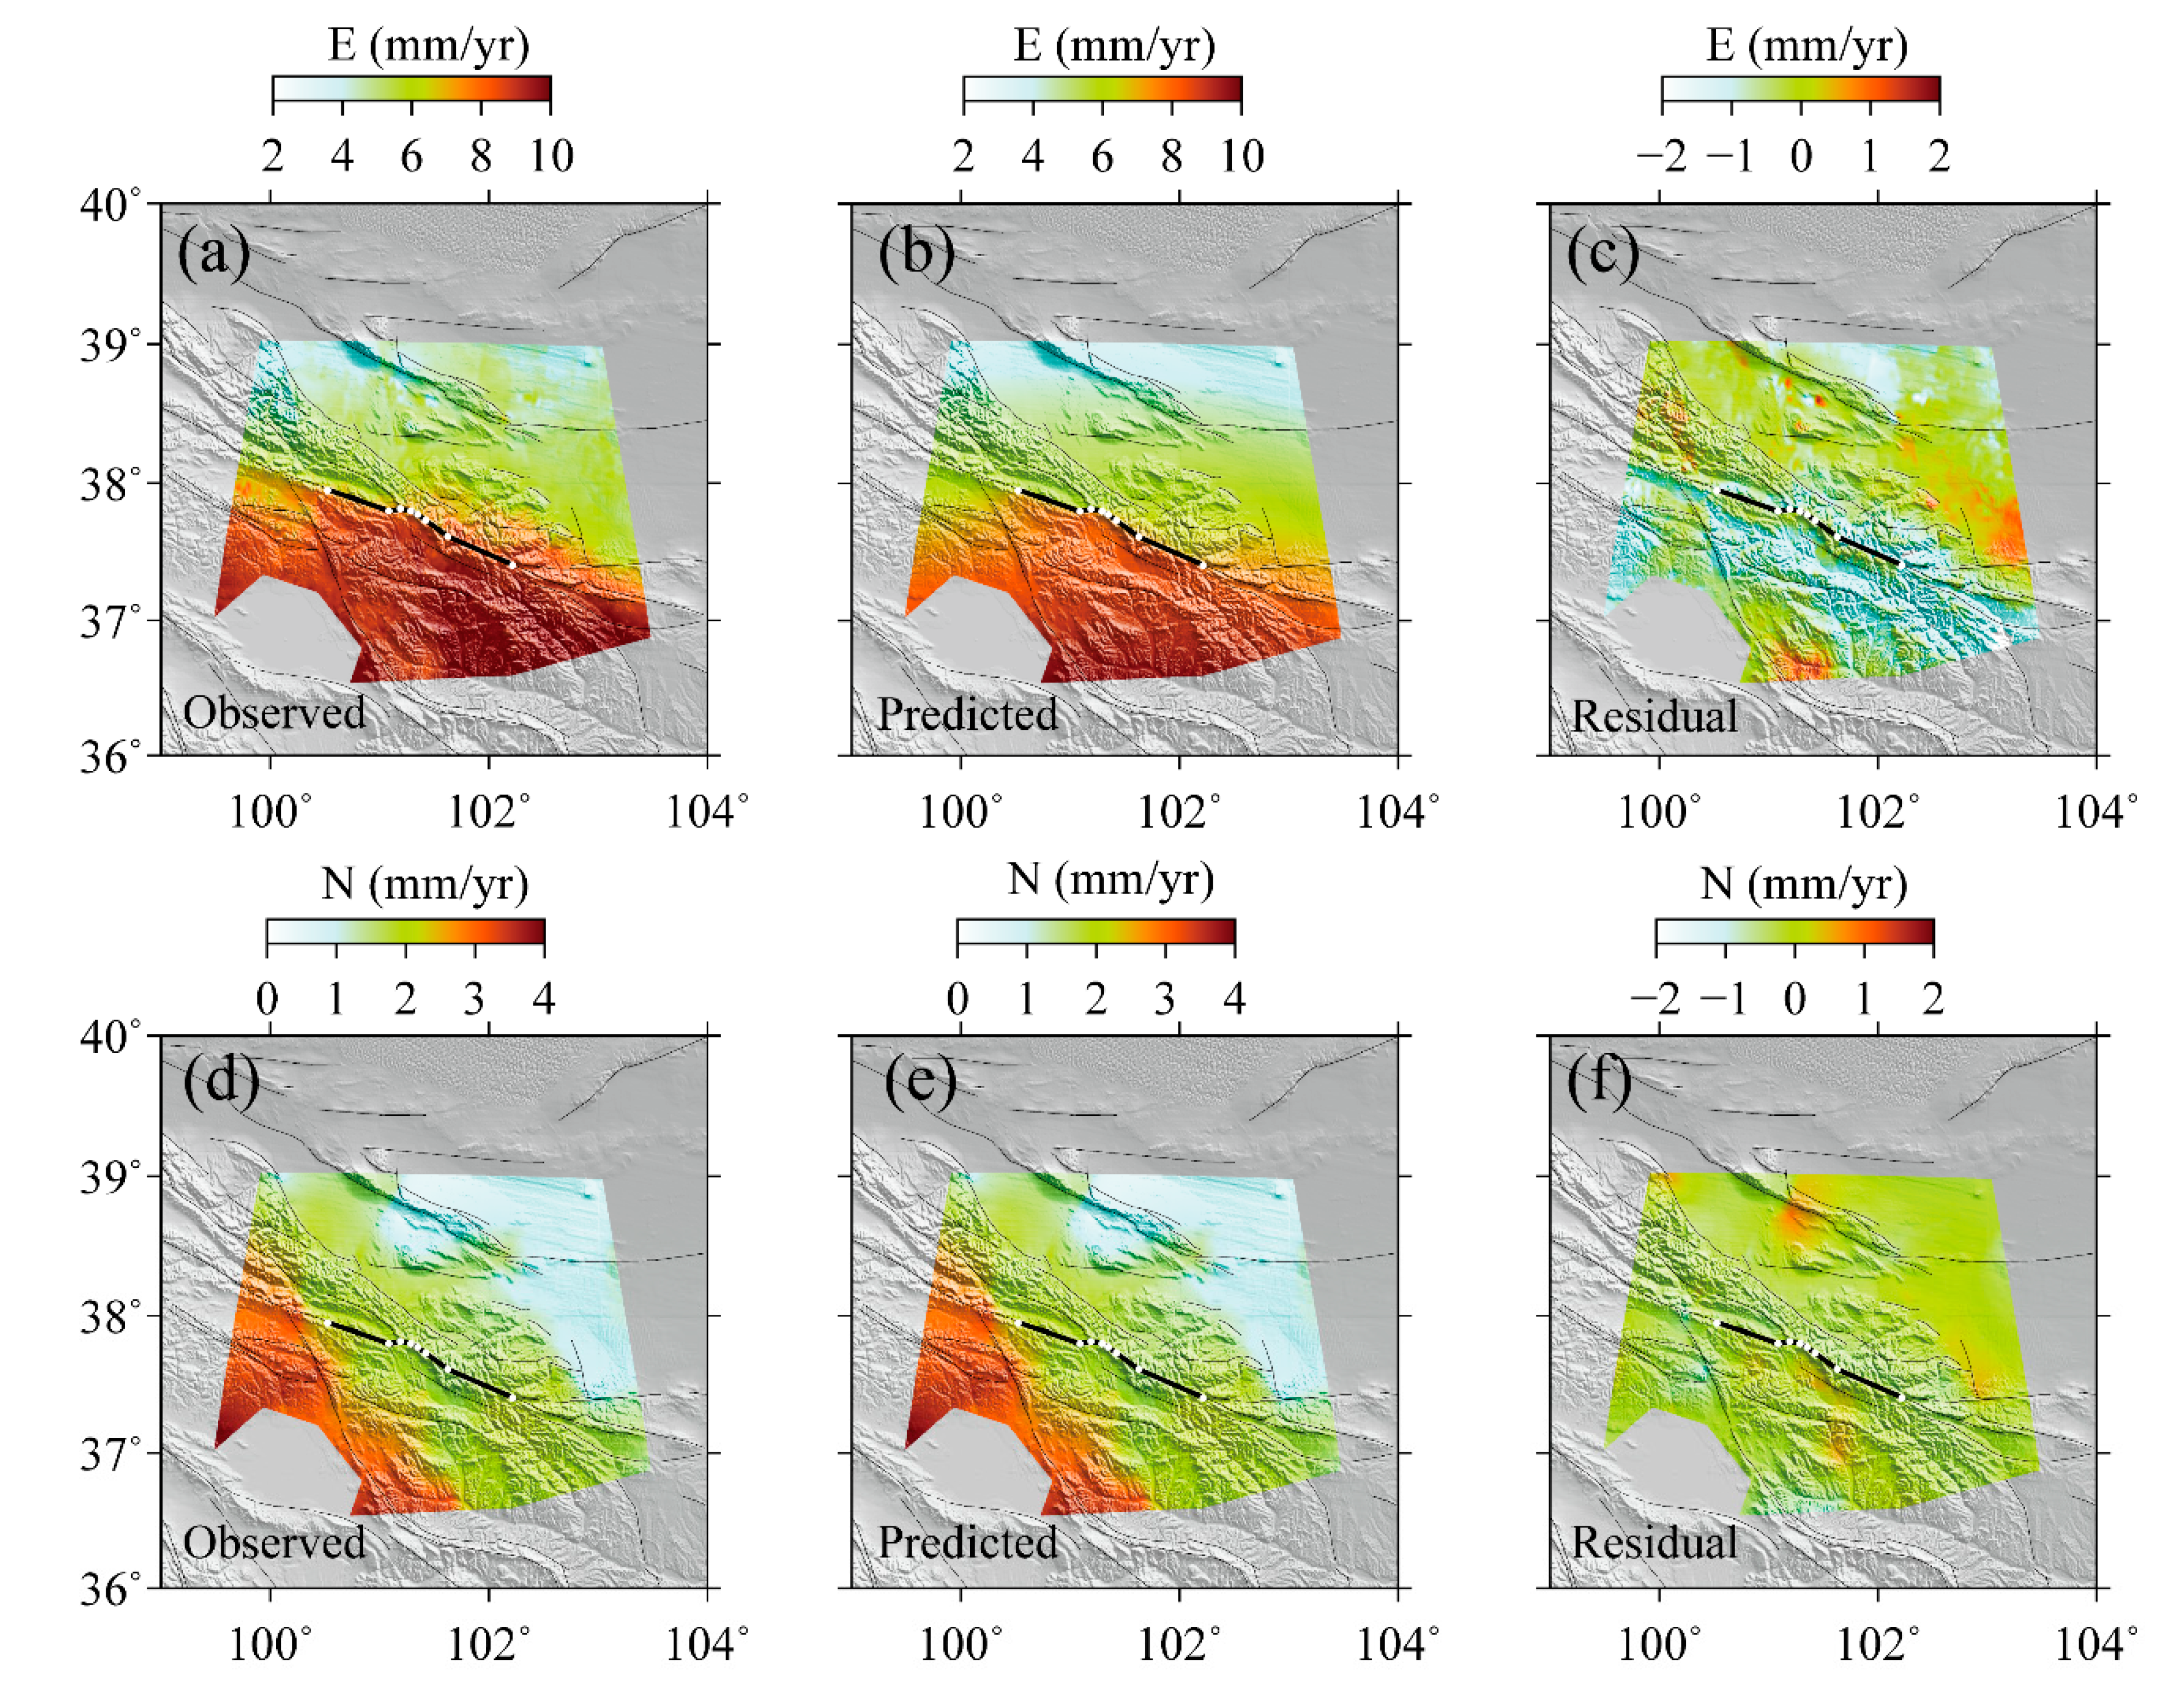
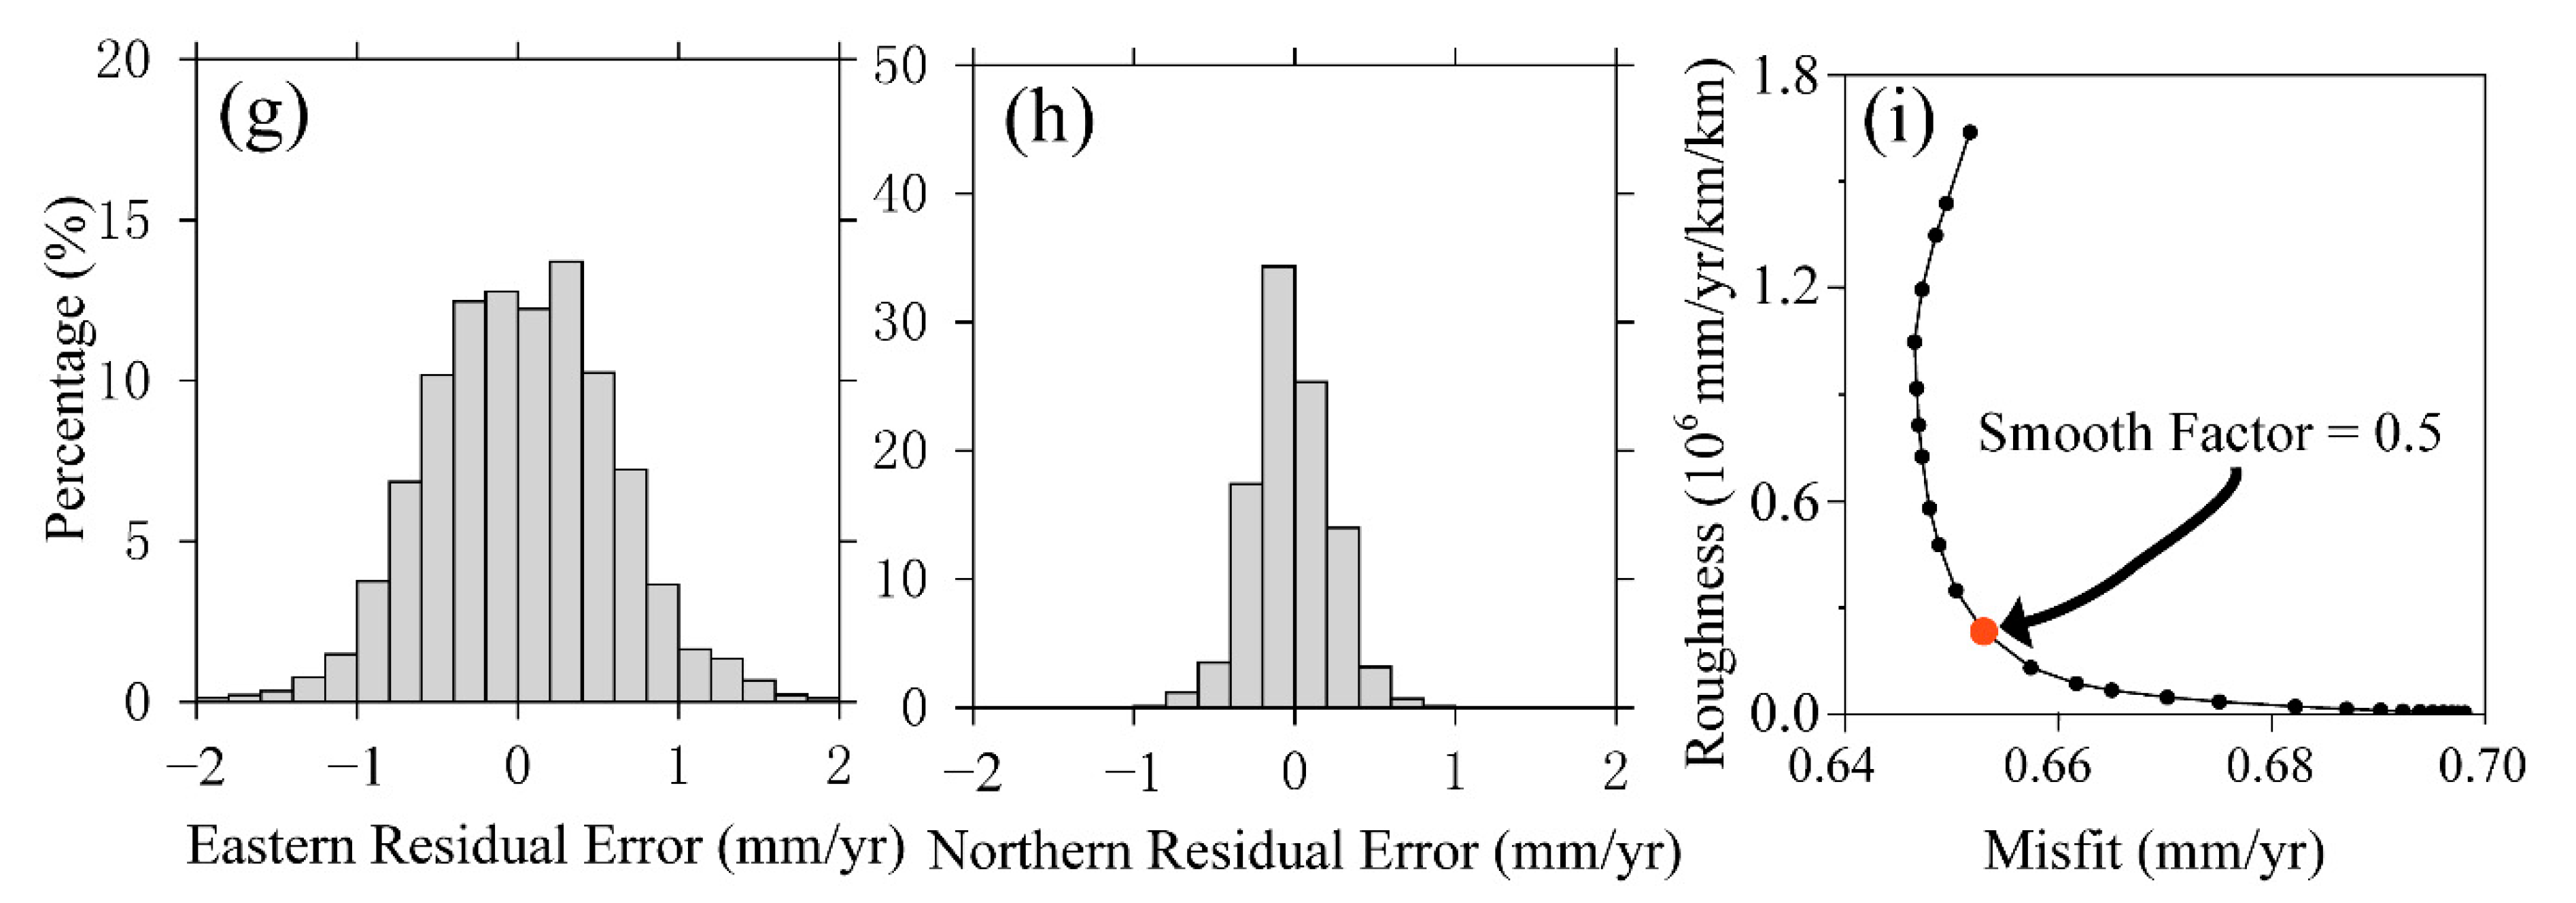
3.1. InSAR Interseismic Deformation Rates

Sentinel-1 SAR data covering the Tuolaishan and Lenglongling faults were obtained from July 2016 to July 2021, including descending orbit D033 and ascending orbit A128. (Figure 1b). The long-time baseline and short space baseline interference pair combination strategy was selected for this study (Table 1).
To accurately separate the interseismic deformation and long-wavelength error, we first used the Generic Atmospheric Correction Online Service for InSAR (GACOS) to correct the phase delay caused by the vertical stratification of atmospheric water vapor in the interferogram [61]. We then used existing GNSS deformation data [36,45,62,63,64] to construct an initial deformation model that included the interseismic deformation, followed by the removal of the long-wavelength error in the interferogram using the “removing the recovery” method. This preserved the interseismic deformation and short-wavelength deformation signals [65,66,67].
InSAR time-series analysis was conducted using the Sbas-InSAR technology framework [65]. The distribution of temporal and spatial baselines of the interferograms shown in Figure 2. The interseismic InSAR deformation field was obtained (Figure 3a,b). Figure 3a shows the deformation field in the line of sight (LOS) direction obtained from the D033 orbit, showing velocity differences along the red line and its extension, which indicates that the seismogenic fault of the 2022 Menyuan earthquake had a certain interseismic slip rate. Figure 3b also shows this feature, where a notable rate change is visible near the red line. This indicates that the InSAR interseismic deformation field obtained in this study captured the slip rate of the seismogenic fault, which is consistent with the results obtained using GNSS [35,39]. To reduce the coseismic impacts of the 2016 Menyuan earthquake, we only chose the datasets after the earthquake from July 2016 to July 2021.

3.2. InSAR and GNSS 3-D Deformation Rates

Although the deformation gradient along the Tuolaishan–Lenglongling fault was captured by the InSAR deformation field, other large local deformation gradients are also present in the deformation field; these local deformations may be related to glaciers, deserts, seasonally frozen soil, or other non-tectonic factors [68]. Therefore, reducing the influences of non-tectonic factors and obtaining reliable fault motion information is important in studies on fault motion using InSAR. The GNSS horizontal velocity has been widely used to constrain fault slip rates [35,51]. Therefore, we integrated the GNSS and InSAR deformation data to construct a 3-D deformation field, thus reducing the influence of non-structural factors on the InSAR deformation field, as well as adding N–S constraints [66].
To obtain reliable 3-D deformation fields, we utilized previously published GNSS observations [45,62] combined with the InSAR deformation observations obtained from the ascending and descending orbits. Under the assumption of a small strain, the study area was discretized into a triangulation network, in which each triangle was considered the target object with a constant strain rate. The 3-D velocity field of the three vertices of each triangle was used to represent any observed value inside the triangle, followed by establishing an observation equation [66]. We used the Helmet variance component estimation method to determine the weight ratio between the GNSS and InSAR data (InSAR:GNDSh:GNSSu = 1:5:1) (Figure 3c–e).
Figure 3c shows the E–W velocity component in the study area. A velocity gradient was observed along the Tuolaishan–Lenglongling–Jinqianghe faults, indicating that a shear strain rate concentration is located in this region. A dextral shear motion was also observed along the Riyueshan Fault (Figure 3d), as well as compression on the Tuolaishan–Lenglongling Fault; the compression-shortened component is located on both sides of the fault. Figure 3e shows that most regions have been uplifted, but the localization of this phenomenon is remarkable, indicating that the vertical motion may contain a large number of localized factors, including non-tectonic deformation. Therefore, we only considered the horizontal motion components and ignored the vertical motion component in this study.

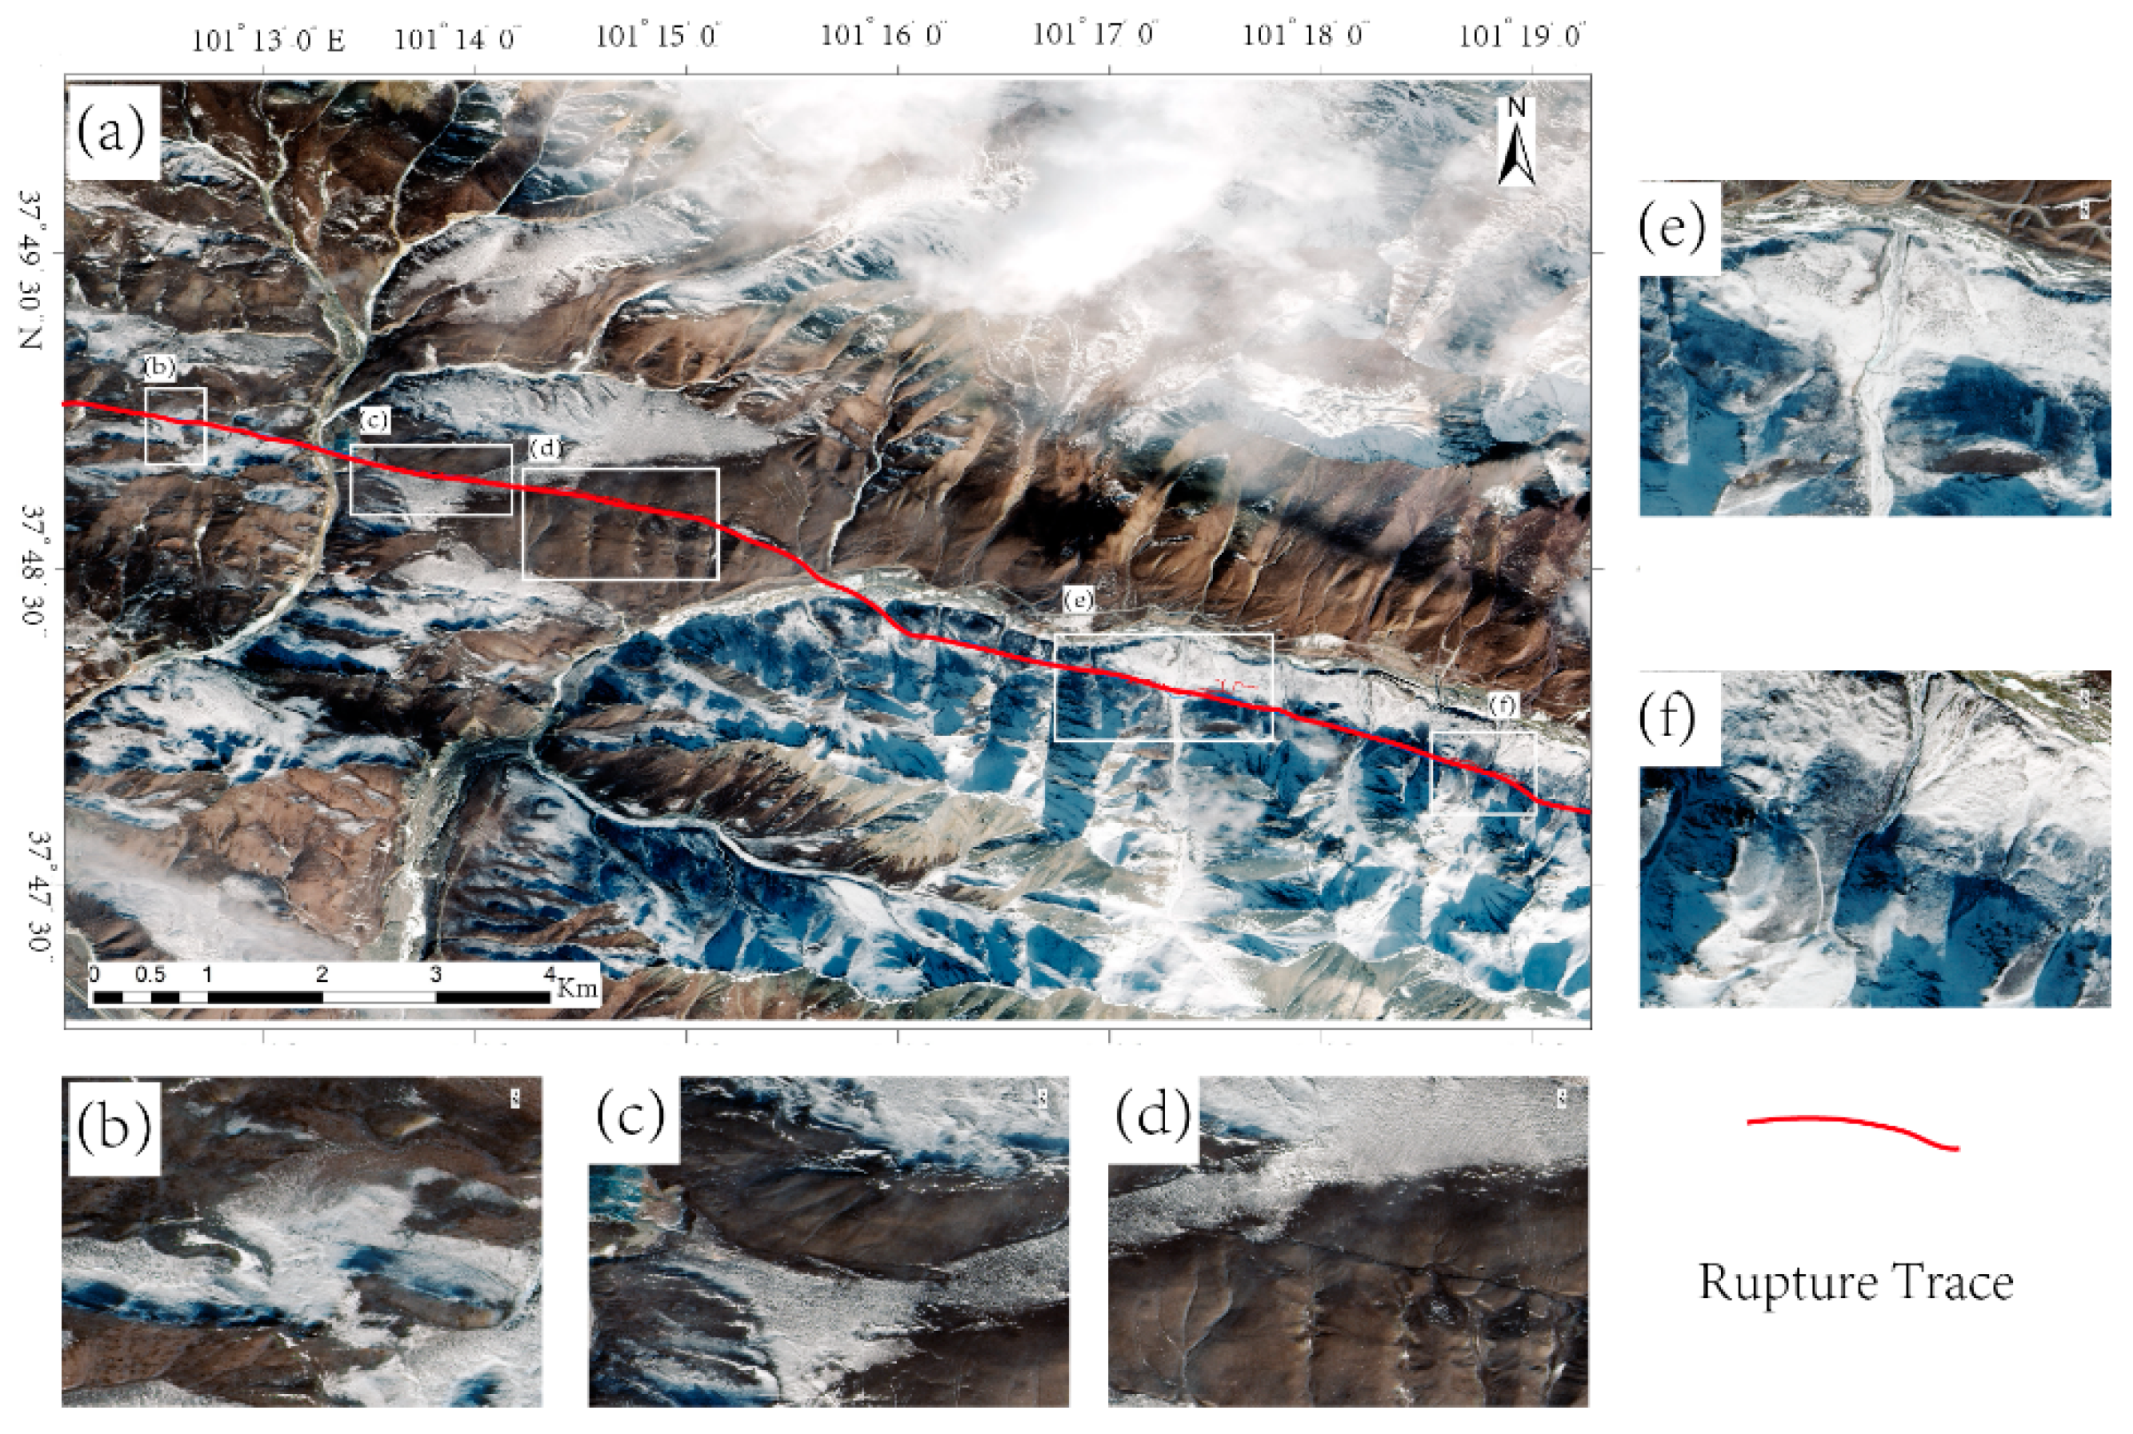
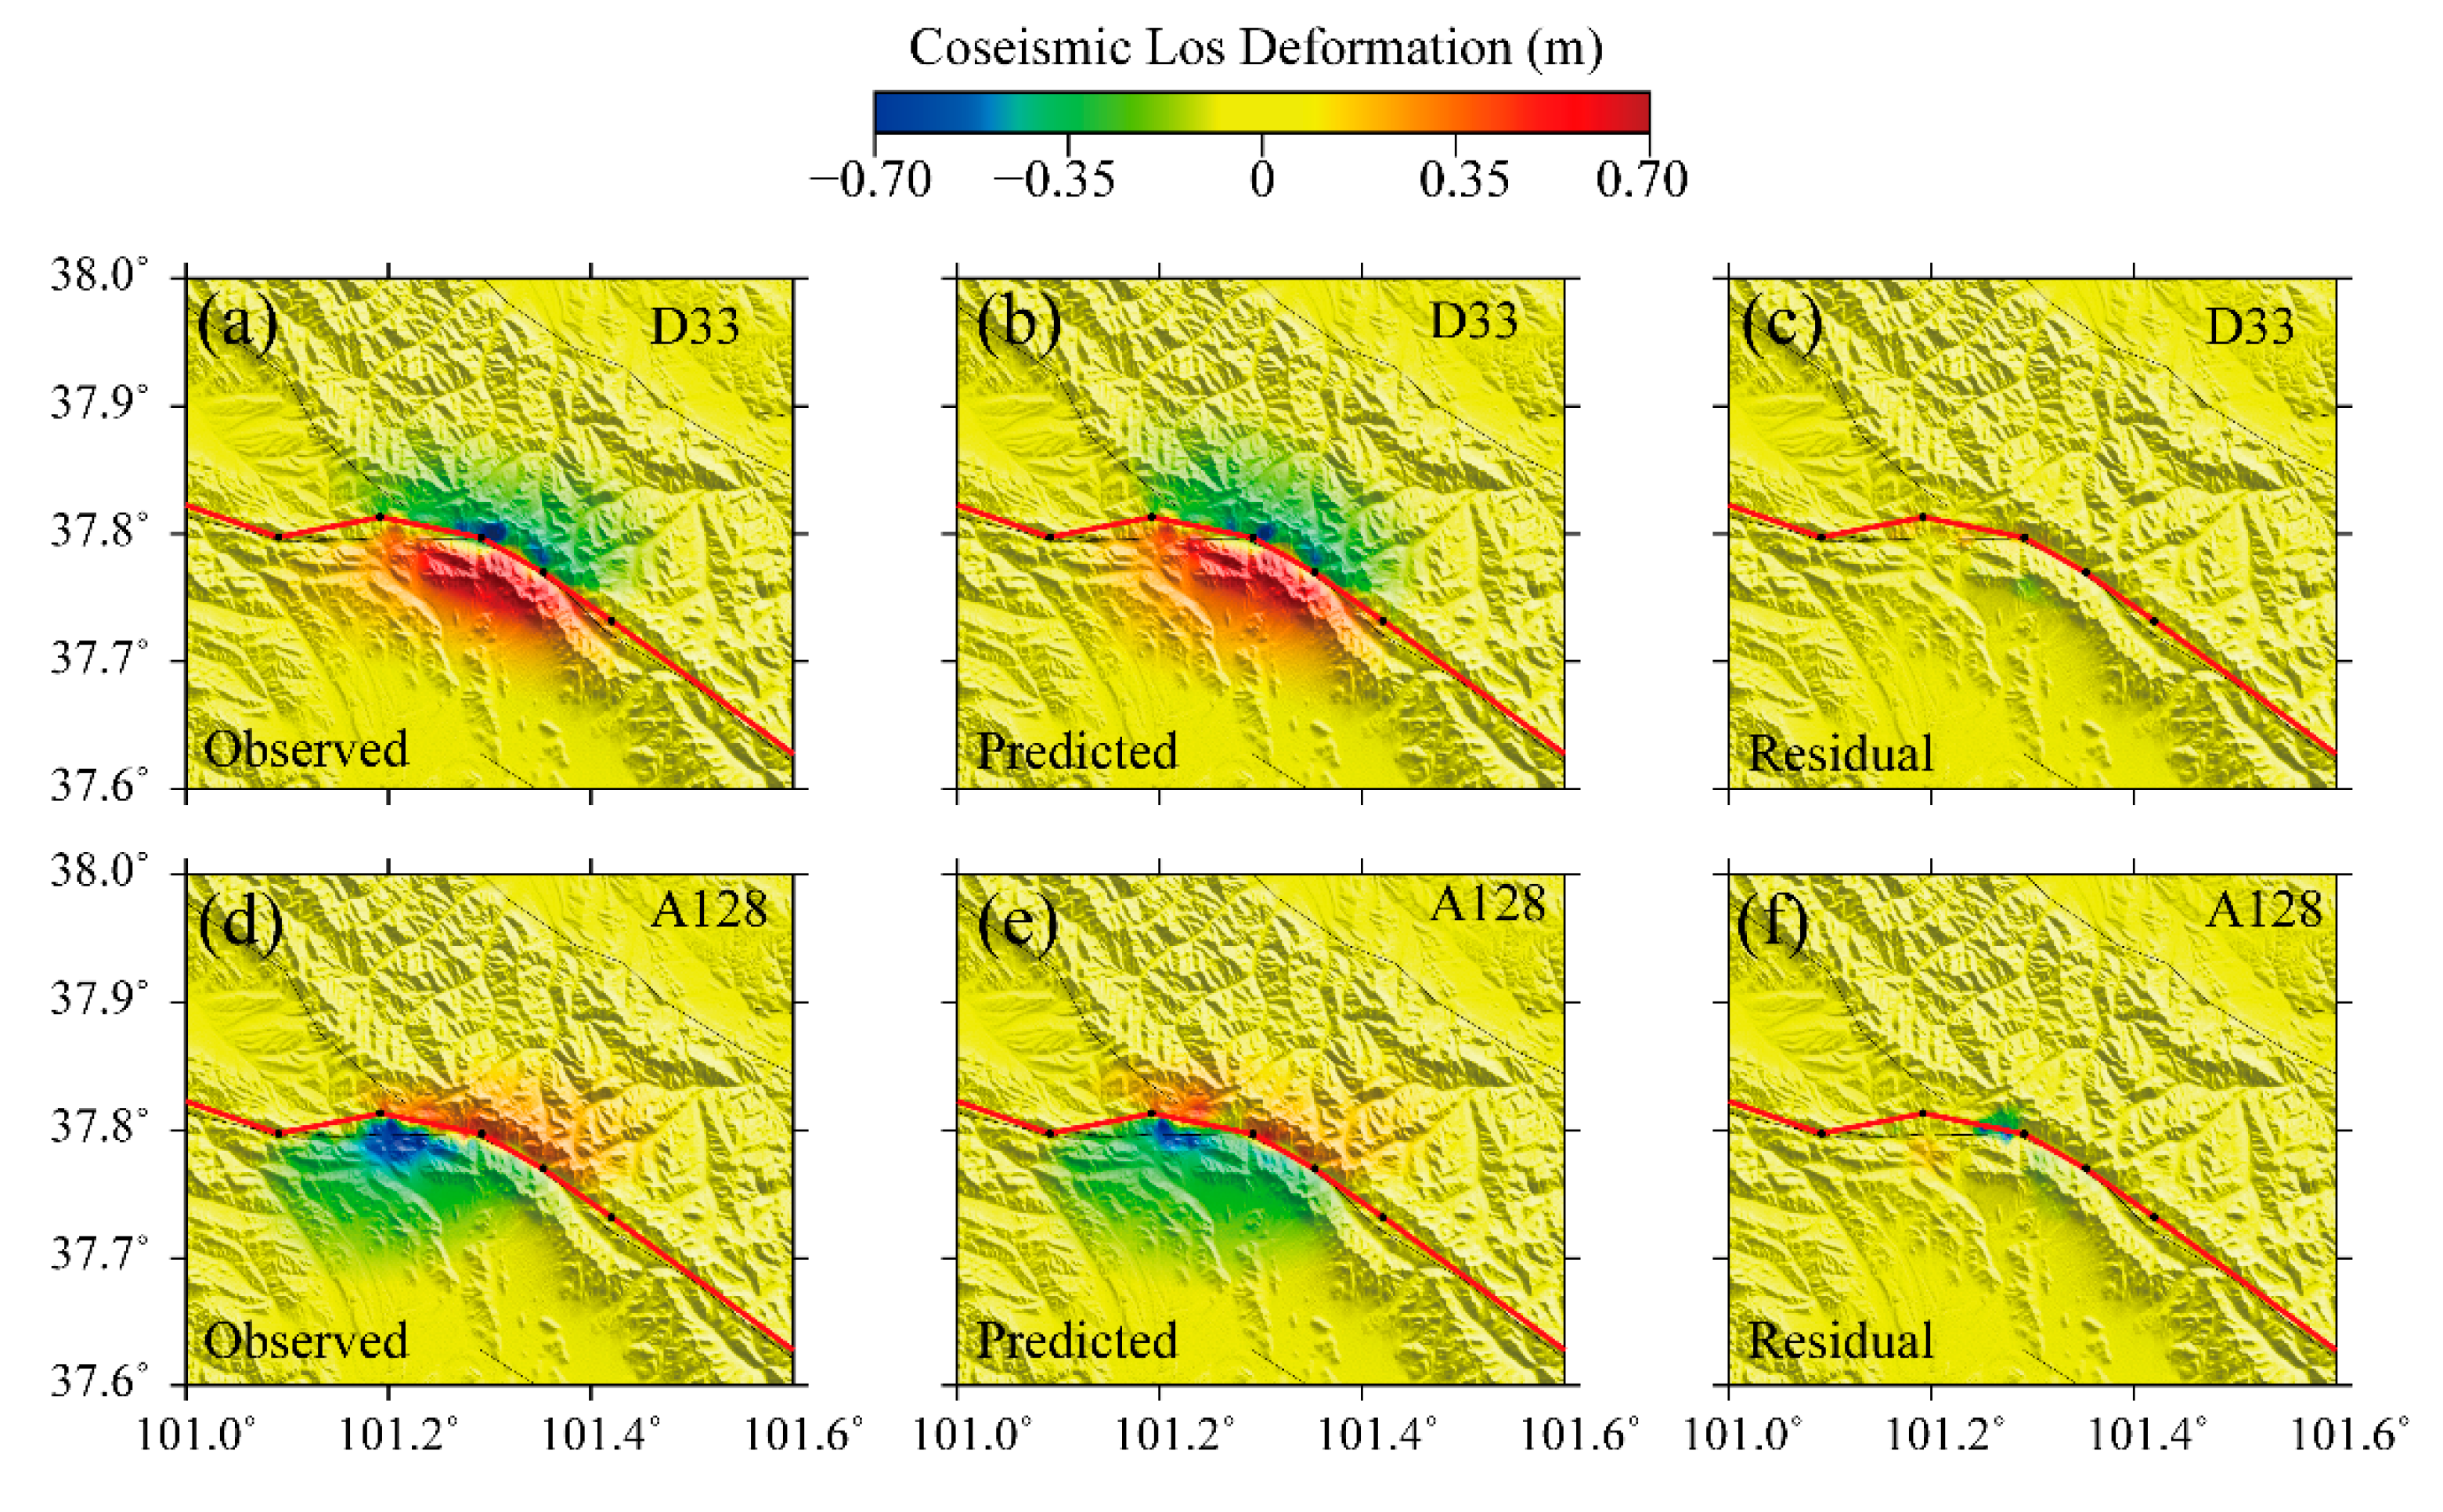
3.3. InSAR Coseismic Deformation

After the 2022 Menyuan earthquake, we obtained Sentinel-1 SAR image data covering two orbits in the seismogenic region and used the GAMMA software package [69] to generate coseismic deformation interferograms (Massonnet et al., 1998). We used the 30 m resolution Shuttle Radar Topography Mission (SRTM) digital elevation model released by NASA to assist with SAR image registration and terrain phase elimination. To suppress noise, the multi-view ratio of the interferogram was set to 8:2 during InSAR data processing; the interferogram was filtered twice using the weighted power spectrum method [70]. The filtering windows were 64 × 64 and 32 × 32, which improved the coherence of the interferogram [71]. Phase unwrapping adopts the minimum-cost flow algorithm to remove the residual orbital phase from the interferogram using quadratic polynomial fitting [72]. For the phase delay caused by the vertical stratification of atmospheric water vapor, we adopted an atmospheric phase delay model based on the existing digital elevation model and original interferogram. Single-look complex images in the geographic coordinate system were used for interference and unwrapping to reduce the overlay effect caused by topographic fluctuations in the epicentral region of the Menyuan earthquake on the InSAR phase unwrapping.
Figure 4 shows the InSAR coseismic deformation field. The descending D033 orbital image completely covered the seismogenic region of the 2022 Menyuan earthquake (Figure 4a). The displacement in the LOS direction ranged from 0.623 to −0.563 m, exhibiting a butterfly shape with upper and lower symmetries. The ascending A128 orbit also covered the seismogenic zone (Figure 4b). The deformation field of the A128 orbit contains opposite signs on both sides of the seismogenic zone, ranging from 0.406 to −0.621 m in the LOS direction. By comparing Figure 4a,b, we found that the upper and lower plates of the lifting rail coseismic deformation field exhibited opposing deformation trends; the lower and upper parts of the deformation field along the same track also exhibited opposing motions. This phenomenon indicates that the surface deformation caused by the 2022 Menyuan earthquake was mainly horizontal, which conforms to the characteristics of a strike-slip earthquake.
Figure 4c shows the E–W coseismic deformation field obtained from the 2-D decomposition of the coseismic deformation fields of the ascending and descending orbits. Black dots denote the precise locations of the aftershocks within nine days of the 2022 Menyuan earthquake [73]. We found that the aftershock coincided with the fault trace of the Lenglongling Fault. The aftershock distribution was upright (Figure 4h), such that we set the dip angle of the Lenglongling Fault to 90°. However, the main aftershocks in cross-section A–A” deviated from the fault trace defined by deformation (red curve in Figure 4c) and the surface rupture identified in Gaofen-7 satellite images provided by the National Academy of Natural Disaster Prevention and Control of the Ministry of Emergency Management of China (white curve in Figure 4c). The upright aftershock distribution (Figure 4f) indicates that the aftershocks were also primarily upright in cross-section A–A’ and did not intersect with the deep deformation trace (red line in Figure 4f). This bias may be related to the accuracy of the aftershock locations or the tectonic background of the epicenter. The red and blue areas in Figure 4c indicate eastward and westward motions, respectively. The intensity of motion on the south side of the fault was slightly greater than that on the north side. Figure 4d shows the vertical coseismic deformation obtained from the 2-D decomposition of the coseismic deformation fields of the ascending and descending orbits. Red and blue areas in Figure 4d indicate uplift and subsidence, respectively. Vertical deformation was concentrated on the south side of the seismogenic fault, in which the eastern region was characterized by a maximum uplift of 0.3 m. The northern side of the seismogenic fault experienced minor subsidence across a small area.
To further determine the dip angle of the seismogenic fault related to the 2022 Menyuan earthquake, we fused the Gaofen-7 panchromatic band and multi-spectral band data to obtain images with a resolution of 0.65 m. We then compared and visually interpreted the post-earthquake (8 January 2022) and pre-earthquake images (30 December 2021). The total length of surface rupture was interpreted to be ~18.99 km (red curve in Figure 5a), corresponding to the white rectangle in Figure 5a. According to the surface rupture trace, InSAR deformation boundary (Figure 4c), and aftershock profile (Figure 4f and h), we postulate that the seismogenic fault of the 2022 Menyuan earthquake was the western end of the Lenglongling Fault. The fault model was set as a 90° vertical fault according to the rupture trace of the seismogenic fault.

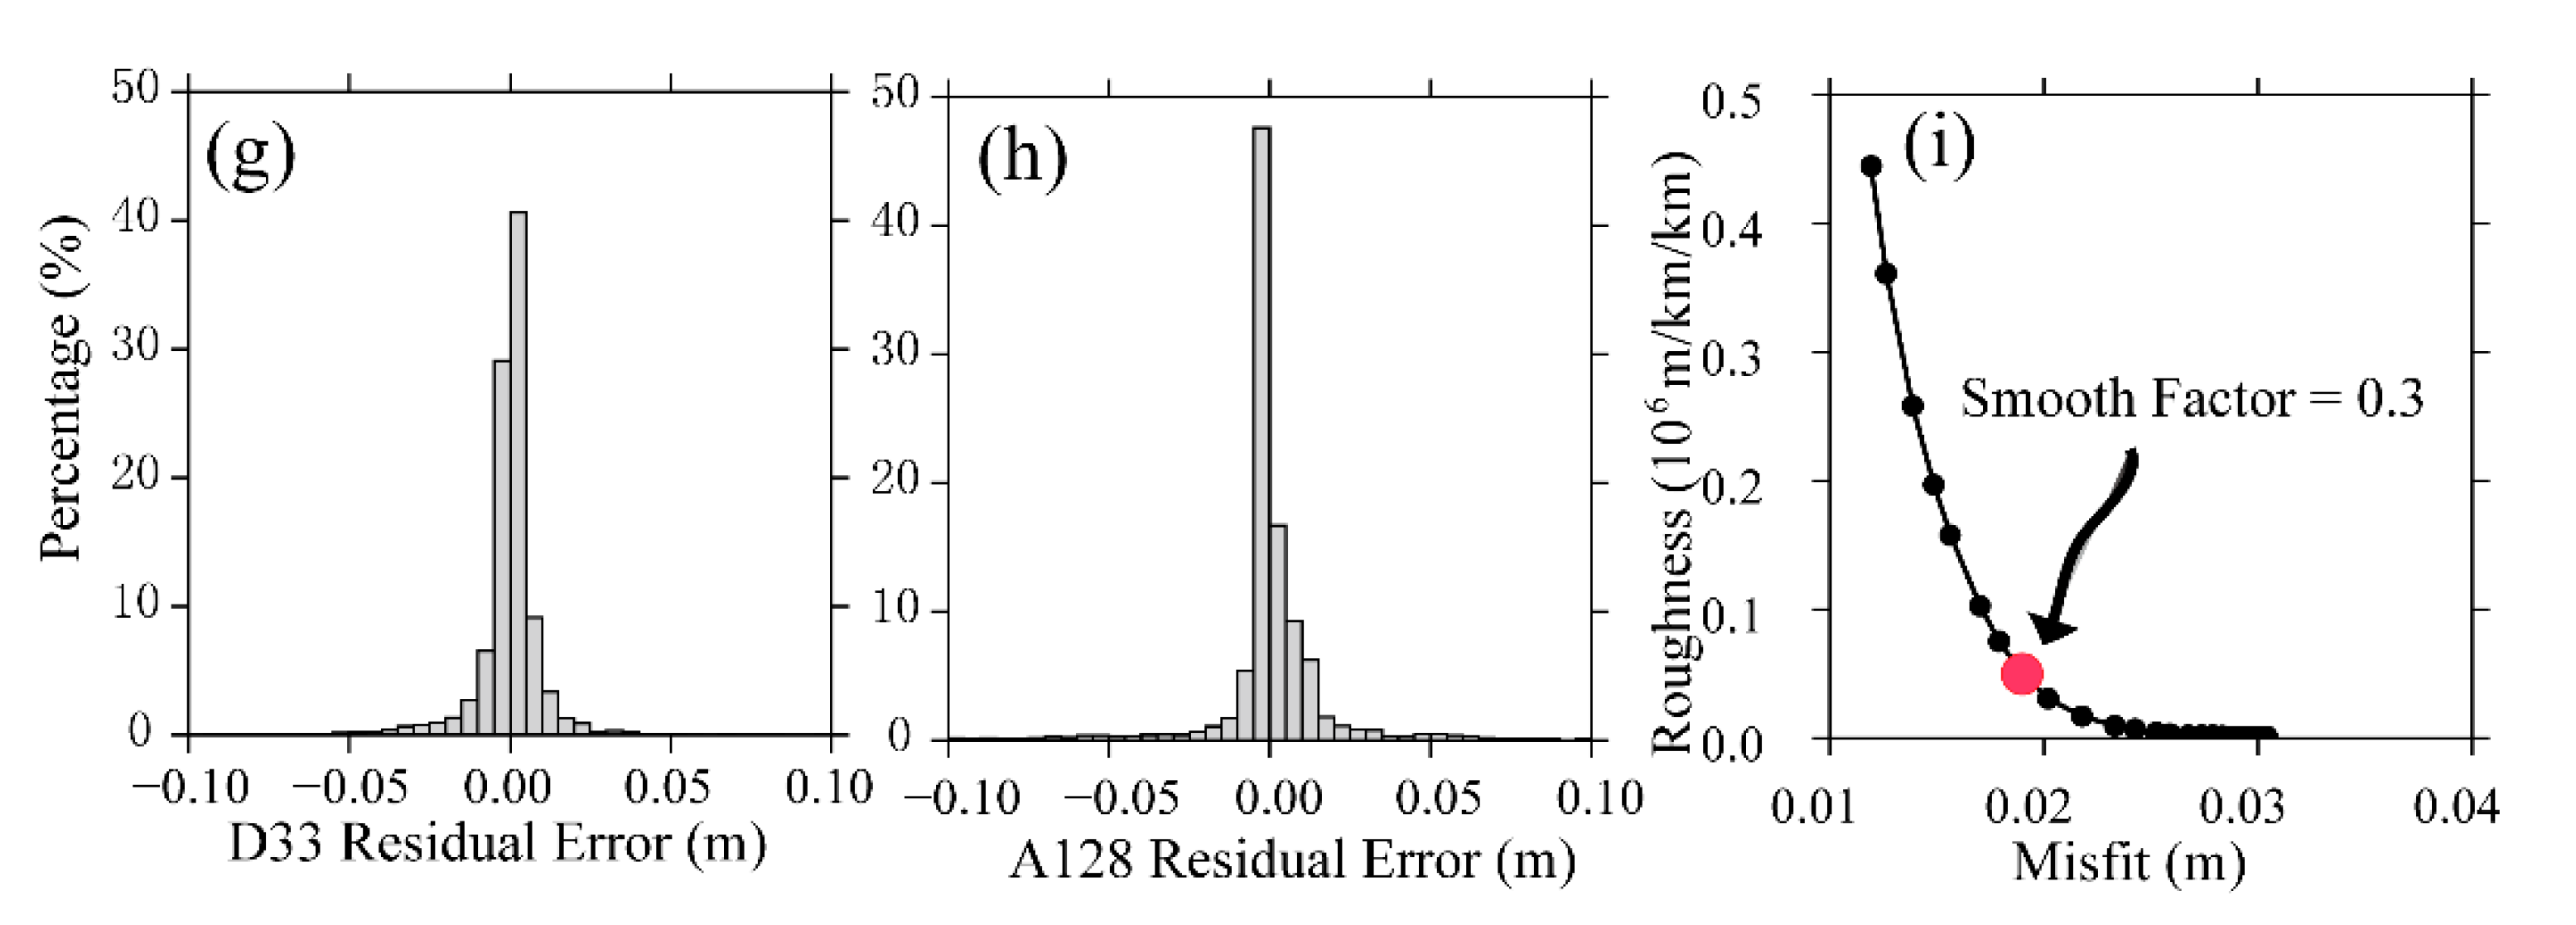
3.4. Inversion Methods for Distributed Slip along a Seismogenic Fault

In this study, the inversion process included an interseismic fault slip rate inversion and a coseismic slip inversion. The main difference between the inversions relates to whether they describe the contribution of long-term fault motion to surface displacement. For the interseismic inversion, the slip rate of a fault plane is generally smaller than the long-term fault motion. Therefore, the contribution of the long-term fault motion should be fitted with a block rotation [74,75] or second-order polynomial [42]. In our interseismic inversion, we utilized a second-order polynomial to fit the effect of long-term fault motion. However, for the coseismic inversion, the amount of coseismic slip was 10- to 100-fold larger than the amount of long-term fault motion. Thus, the contribution of long-term fault motion was negligible. Besides, there was also a datum deviation between the observation system and dislocation model. This bias was absorbed by the parameters of the second-order polynomial. Therefore, extra constraints should be considered for the interseismic inversion to exclude datum deviations. In other words, we could take advantage of the same model for the inversion of the distributed slip based on the displacement observation.
Based on the interseismic deformation field (Figure 3c,d), we calculated the Green’s function between the deep fault slip and surface displacement using the elastic half-space angular dislocation model. We then obtained the fault slip vector on the fault plane using the least squares method with constraints [75,76]. To compare the periods before and after the 2022 Menyuan earthquake, we maintained the consistency of the seismogenic fault geometry. Therefore, we selected part of the Tuolaishan Fault and part of the Lenglongling Fault as the target faults. We set five nodes (black dots in Figure 3c) near the epicenter according to the InSAR coseismic deformation gradient and surface rupture trace of the 2022 Menyuan earthquake. We set one node on the western side of the target fault according to the fault trace of the Tuolaishan Fault and two nodes on the eastern side according to the strike of the Lenglongling Fault. We set the dip angle of the Lenglongling Fault to 90° according to the aftershock distribution following the 2022 Menyuan earthquake on the Lenglongling Fault, which was close to vertical. As previous studies have confirmed that the Tuolaishan Fault is a high-angle strike-slip fault [34], we set the dip angle to 90°. In addition, as we only focused on the shallow elastic slip rate on the fault plane, we set the model depth to 20 km. The resolution of the surface line of the fault plane was set to 2 km and the resolution at 20 km was set to 5 km. Thus, the length of the mesh varied gradually from the top to the bottom of the grid. Compared with a traditional rectangular mesh, the triangular mesh increases the number of design matrix conditions, improves the inversion efficiency, and avoids tears caused by changes in the strike and dip angle of the fault [77].
After constructing the design matrix, the least squares method was used with constraints for the inversion calculations [2]. Similar to other geophysical inversion problems, smooth constraints must be added to the fault slip parameters to increase the number of conditions in the design matrix to solve the problem. Therefore, determining an appropriate smoothing factor to obtain the optimal model was necessary. The smoothing factor was determined to be 0.5 based on the trade-off between the misfits and the roughness (Figure 6i). Figure 6 shows the data fitting and error statistics of the optimal fault slip model, which indicate that, regardless of the E–W (Figure 6a–c) or N–S components (Figure 6d,e), the degree of data fitting was high while the residuals were within 1 mm/yr and had a normal distribution (Figure 6g,h). This indicates that the optimal sliding model established in this study can accurately explain the input observational data.
Similar to the calculation of the interseismic fault slip rate described above, the same fault model and a similar method were adopted to calculate the fault coseismic slip distribution using the coseismic displacement field of the 2022 Menyuan earthquake. The fault geometry was consistent with the interseismic inversion model. We also set the dip angle of the target fault to 90° and the resolutions of the shallow and deep regions of the fault to 2 and 5 km, respectively. We then also conducted a smooth-factor search to determine the optimal model. Figure 7i shows the L-curve obtained in this study. According to the results, we set the smoothing factor to 0.3, at which the model yields optimal compromises between the parameter resolution and residuals. Figure 7 shows the data fitting and error statistics for the optimal model. The statistical results indicate that the residual errors of the two orbits were within 50 mm and both had normal distributions.

4. Results

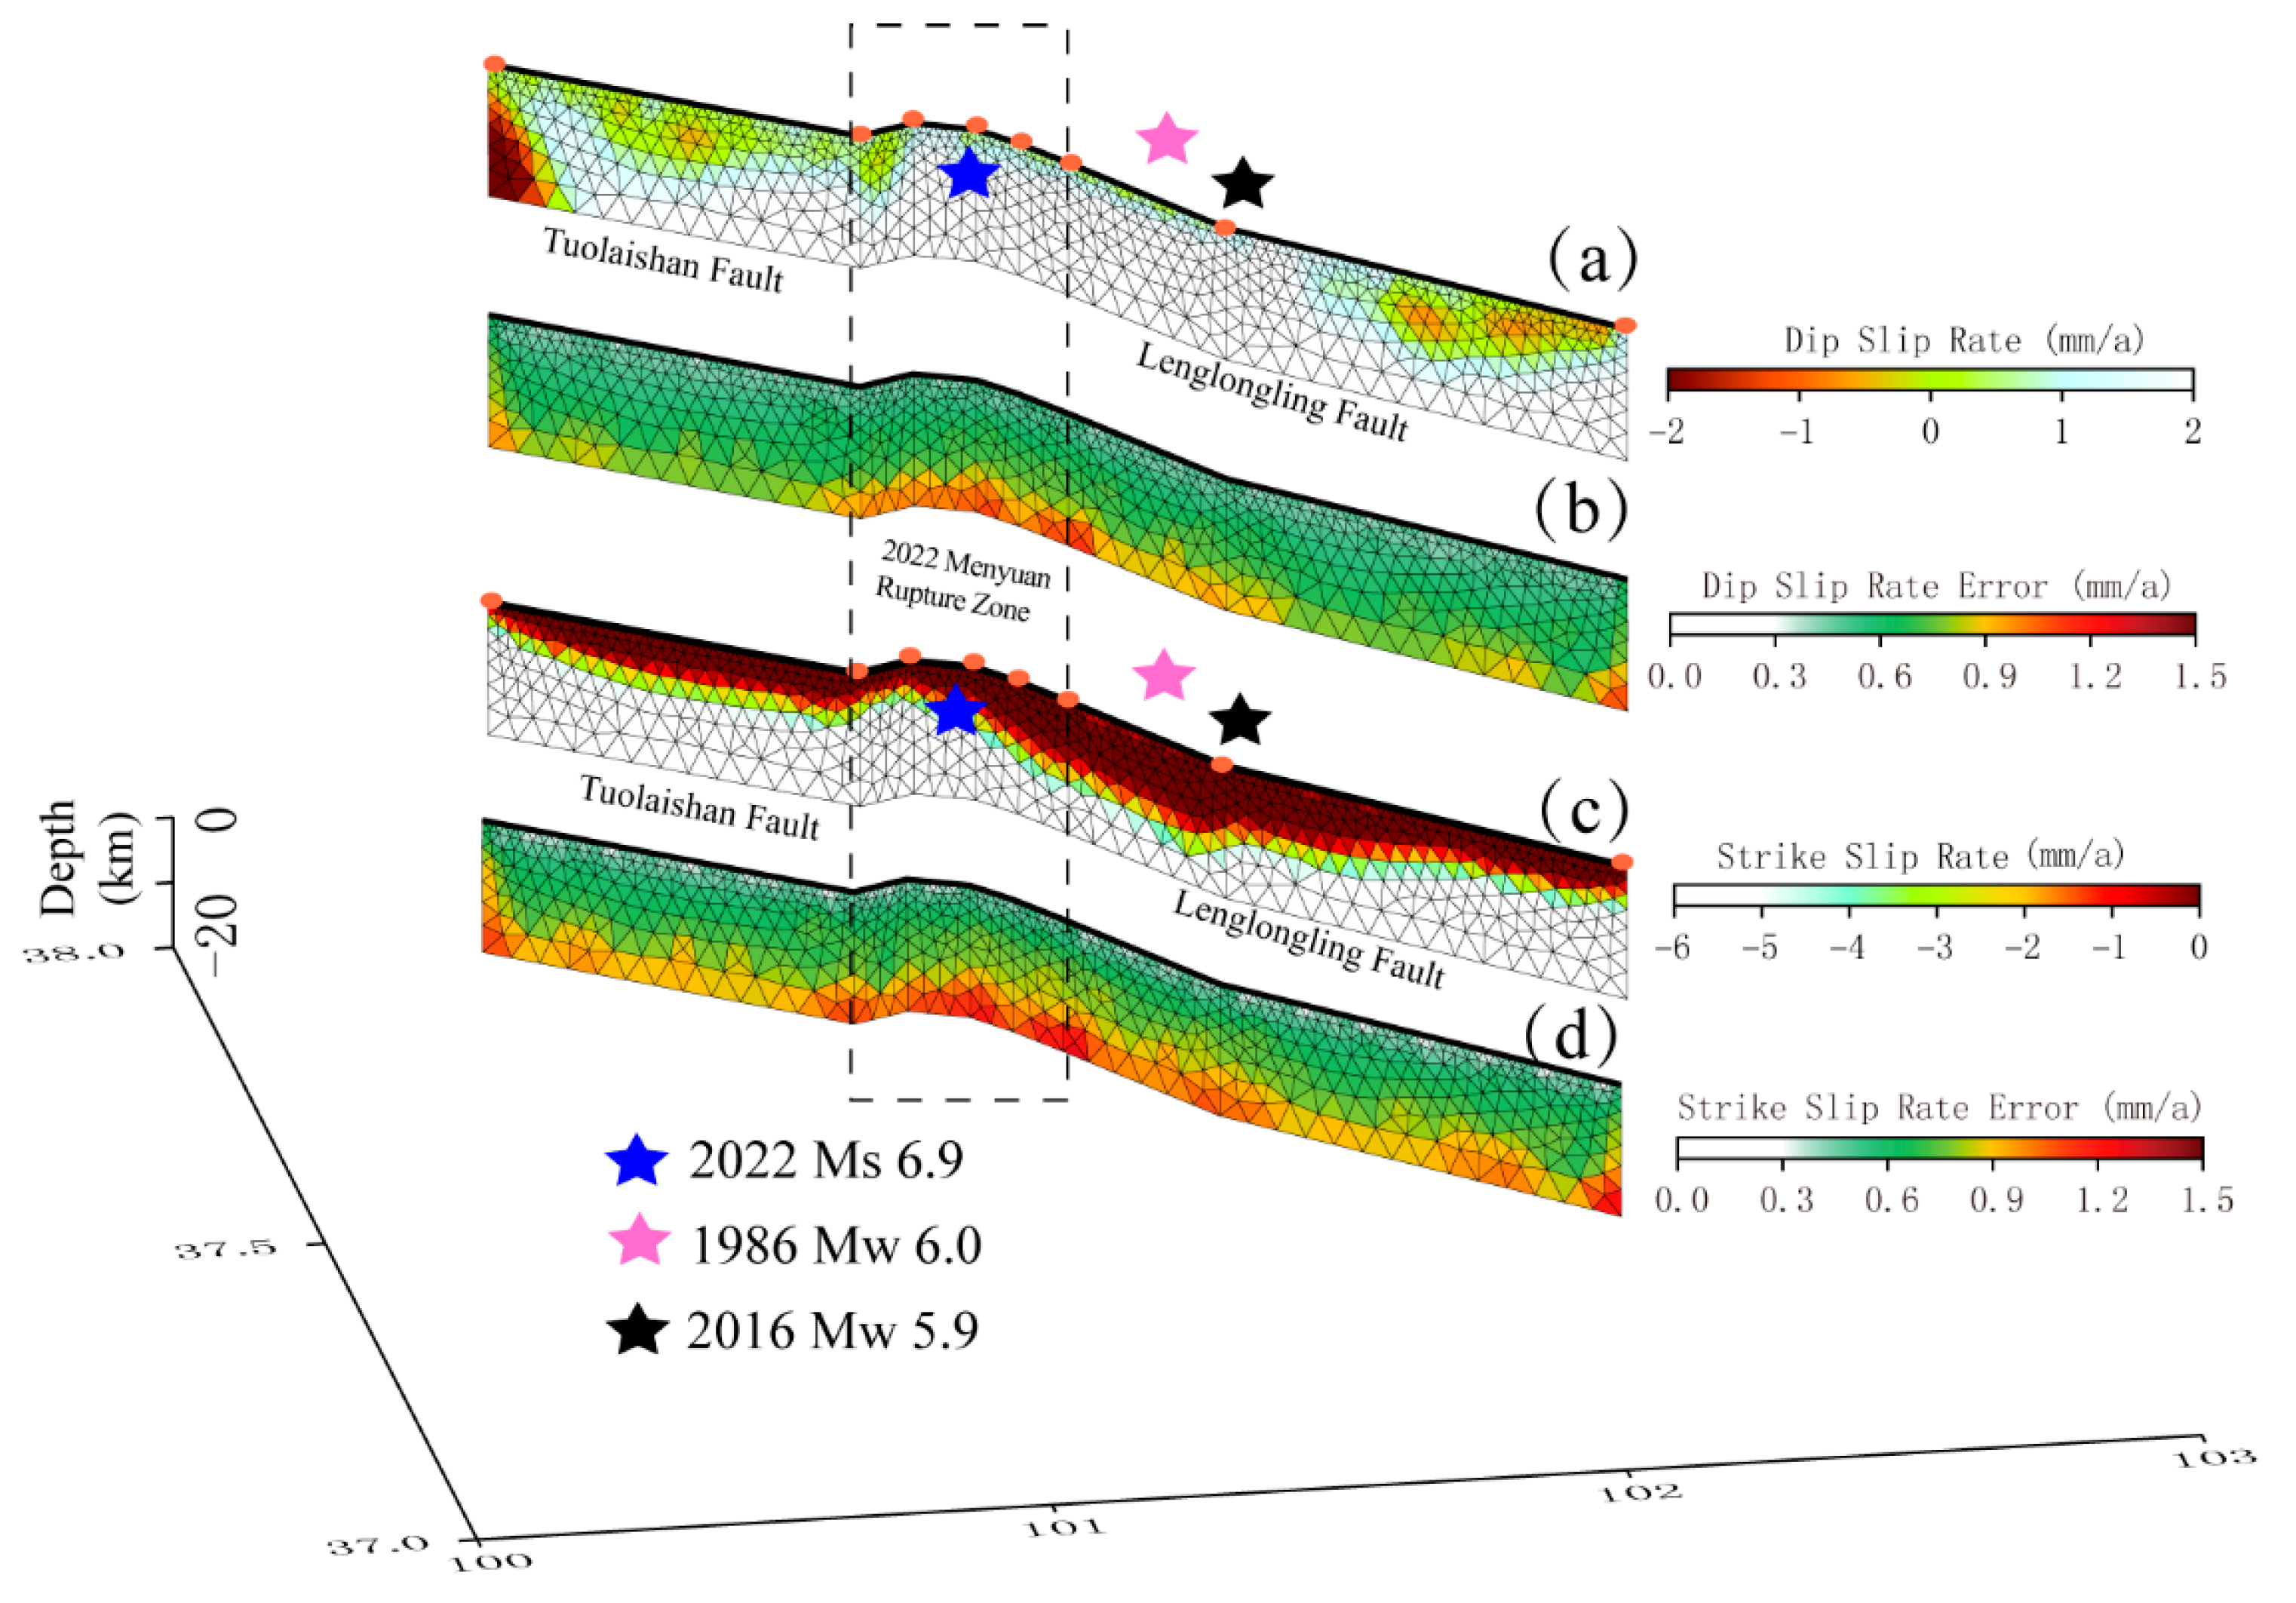
4.1. Interseismic Slip Rate Distribution along the Seismogenic Fault

Figure 8 shows the interseismic slip distribution obtained using the horizontal velocity field fused with the InSAR and GNSS data. Both the Tuolaishan and Lenglongling faults are sinistral strike-slip faults, with slip rates of ~6 mm/yr (Figure 8c). There is a low slip rate zone at a depth of ~7 km in the shallow part of the Tuolaishan fault while a deep low slip rate zone is located at depths of up to 10 km near the seismogenic region of the 1986 and 2016 Menyuan earthquakes, which gradually decreased on both sides (Figure 8c). The seismogenic region of the 2022 Menyuan earthquake also contained a shallow low slip rate zone at a depth of ~5–7 km. The dip-slip component (Figure 8a) indicates a reverse motion of ~2 mm/yr in most areas, which establishes that the Tuolaishan–Lenglongling fault system is compressive. However, local normal motion at 2 mm/yr was observed at the western end of the Tuolaishan Fault, which may be related to a right-lateral strike-slip motion along the Riyueshan Fault. In addition, normal motion at 1 mm/yr was observed on the shallow part of the Tuolaishan Fault, which may be related to the stepover zone, which was generated when there was a change in the strike of the strike-slip fault. Normal motion at 1 mm/yr was also observed on the shallow part of the eastern Lenglongling Fault, which may be related to the interactions of the surrounding faults. We found that the errors for both the dip-slip (Figure 8b) and strike-slip (Figure 8d) rates were ~0.6 mm/yr, whereas those in the deep part of the model reached ~1.2 mm/yr.
In this study, the sinistral strike-slip inteseismic slip rate is 6 mm/yr, errors of 1.2 mm/which is also consistent with previous works from GNSS and InSAR measurements. According the result of Liu et al. 2022, the slip rate near the 2022 Menyuan earthquake constrained from GNSS is about 4.5–4.8 mm/yr [37]. However, the slip rate from Huang et al. 2022 with InSAR data is about 3.7–6.3 mm/yr [60]. The minor difference exists possibly due to the distinct datasets and various forward models. For the distributed slip map of fault plane (Figure 8c), the pattern is different from the previous research, because the previous studies are mainly constrained from GNSS. Meanwhile, the result in our work is constrained from GNSS and InSAR. Therefore, our result is finer than previous work.

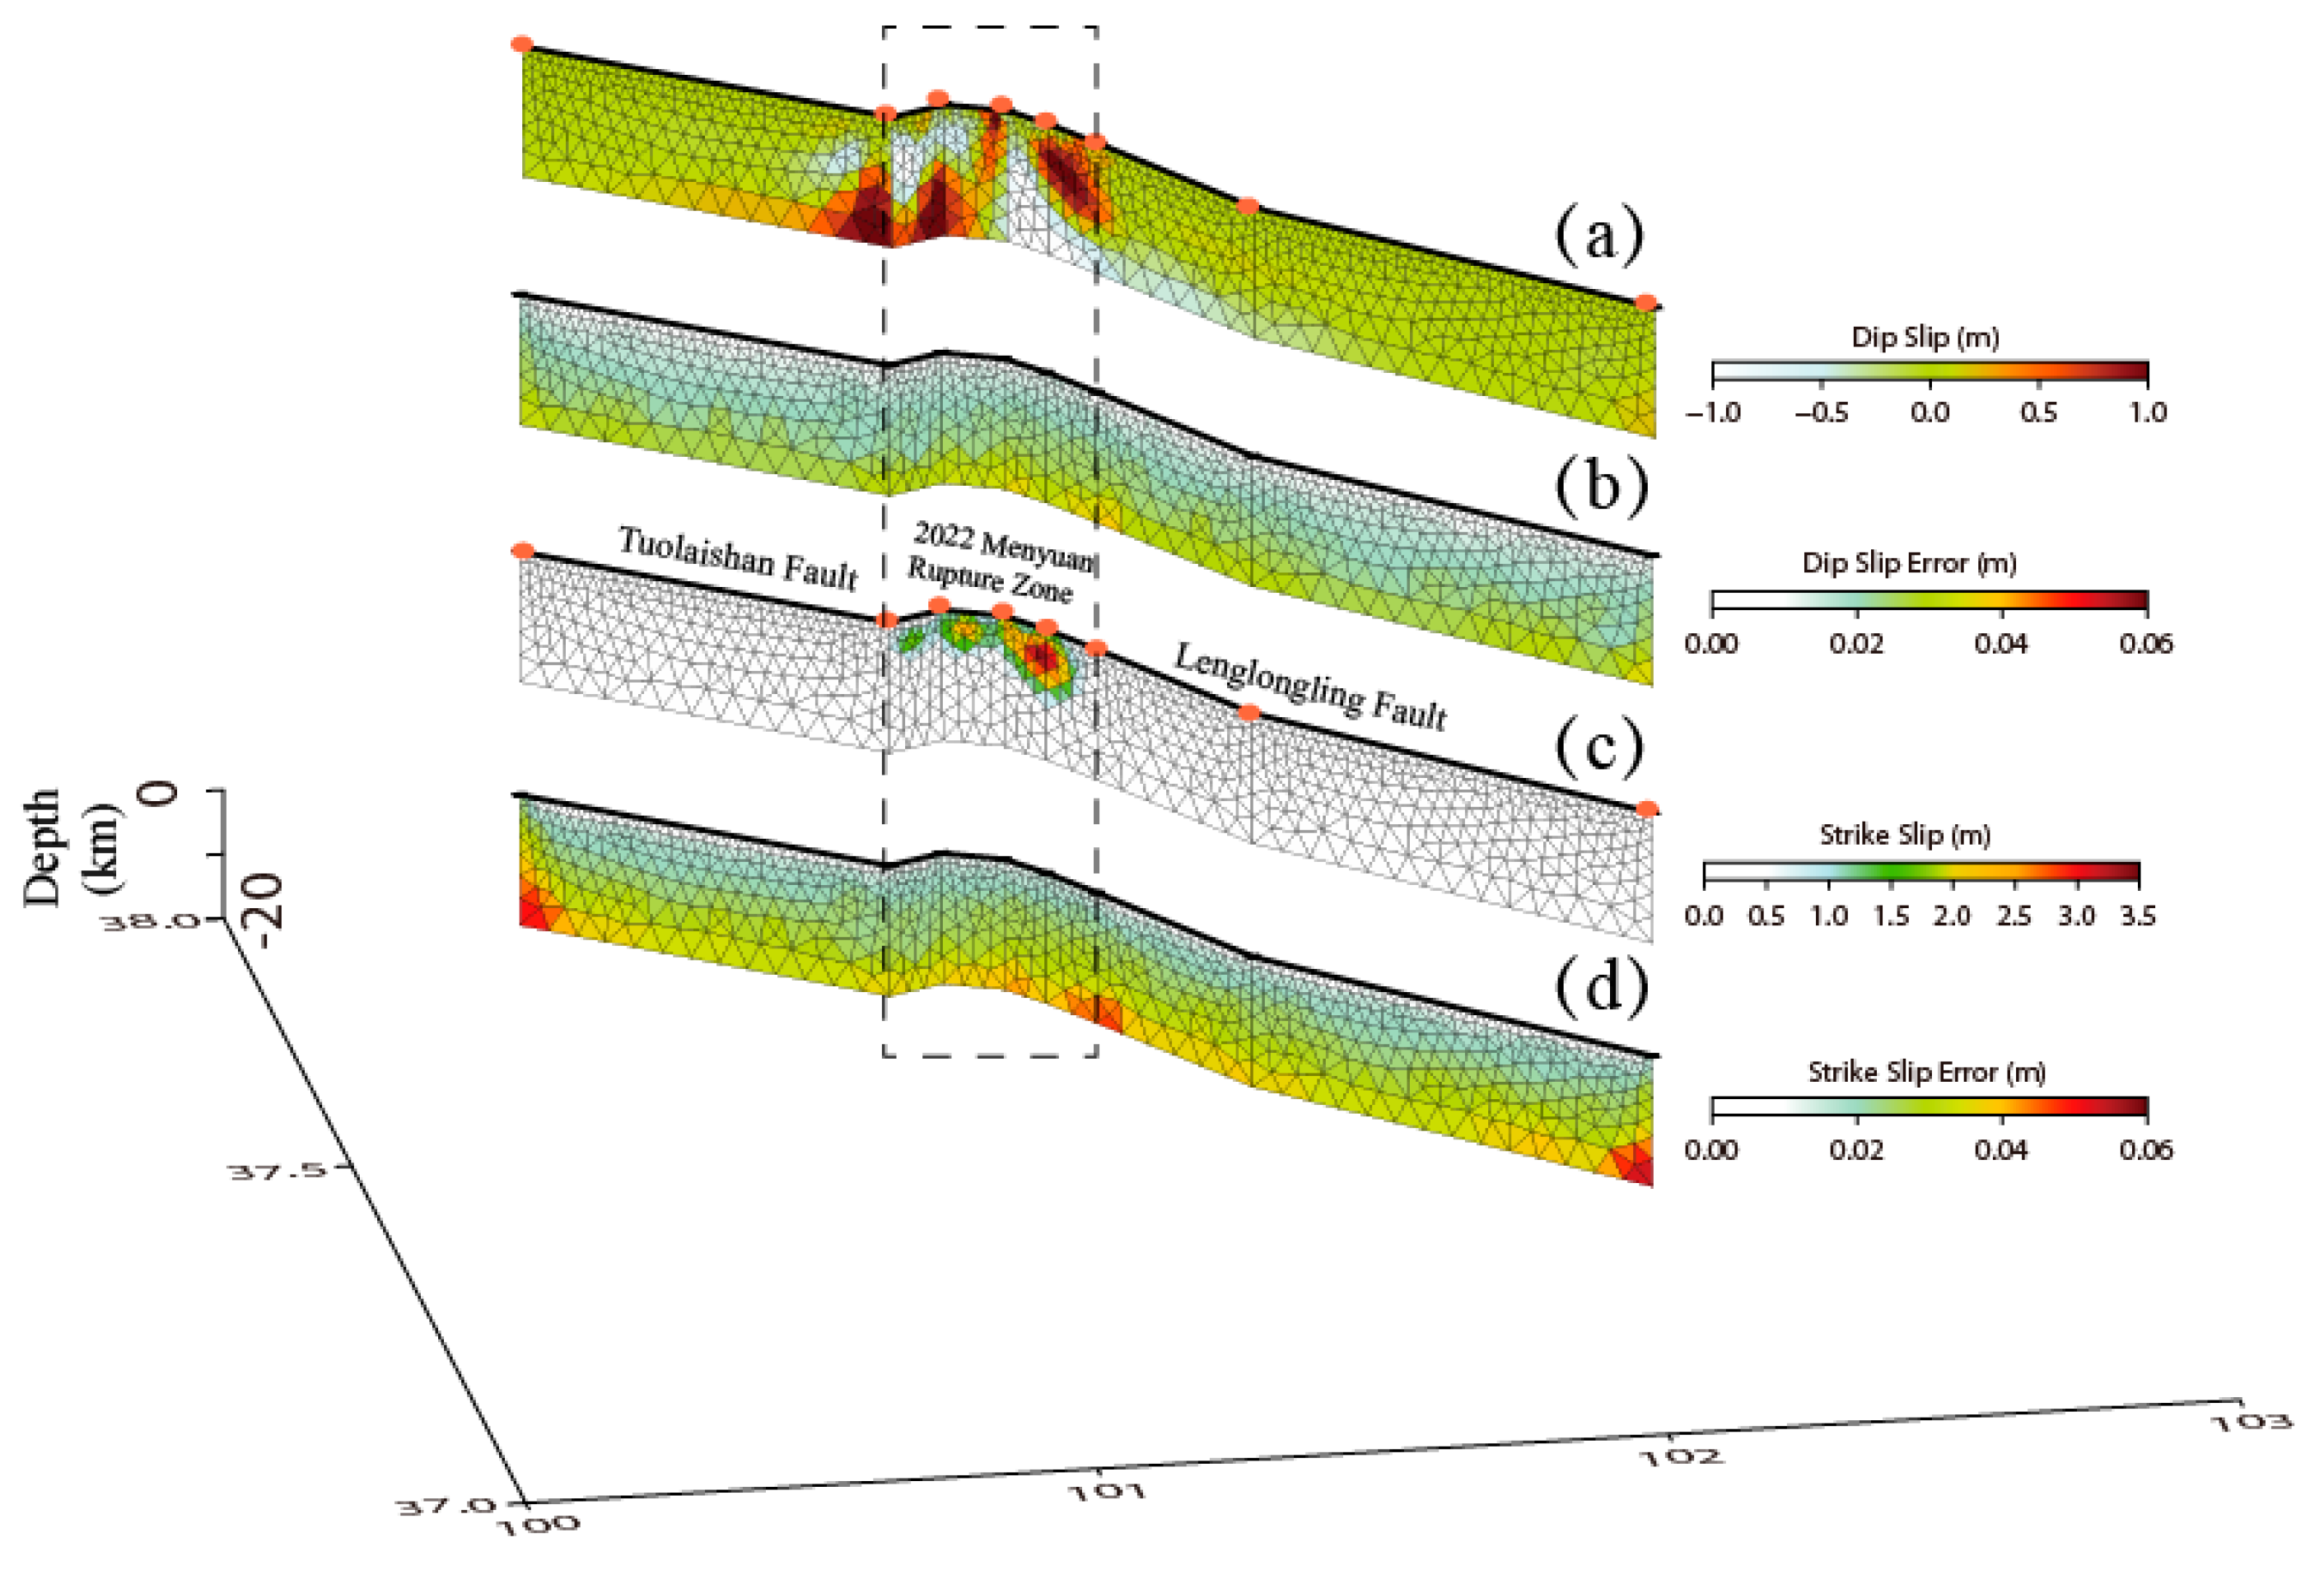
4.2. Coseismic Slip Distribution along the Seismogenic Fault

Figure 9 shows the coseismic slip distribution. The dip-slip pattern in the epicentral area appears in four quadrants. The shallow eastern region experienced an uplift of 0.5 m while the shallow western part experienced −0.5 m of subsidence. In contrast, the deep eastern region experienced −1 m of subsidence while the deep western region experienced an uplift of 1 m. This is consistent with a pattern where strike-slip motion controlled the seismogenic fault [59]. The maximum left-lateral strike-slip displacement of the optimal coseismic model was 3.39 m, which occurred at the intersection of two aftershock sequences (Figure 4c) located at a depth of ~5 km; most of the coseismic displacements were located in a depth range of 2–7 km (Figure 9c). The coseismic slip model constructed herein agrees with a previously published model [6]. Although the methods and data differ, the acquired results were essentially identical. Figure 9b and d shows the error distribution of the optimal model, from which we determined that the error along the coseismic fault slip was ~20 mm and the error of the dip-slip component was smaller than that of the strike-slip component.
Although many works that relate to the 2022 Menyuan earthquake have been published with different fault geometry (such as dip angle, fault trace) and observations in and abroad, the overall features of static deformation are similar. For example, the maximum slip is 3.5 m in Li et al. 2022, 4 m in Feng et al. 2022, 3.5 m in Luo et al. 2022, 4 m in Lü et al. 2022, and 3 m in our study [54,55,78,79]. Besides, the shape of the static distributed slip is same in essentials differing in detailed. Those demonstrate that our results constrained from GNSS and InSAR are capable of depicting rupture mode of the earthquake reliably.

5. Discussion

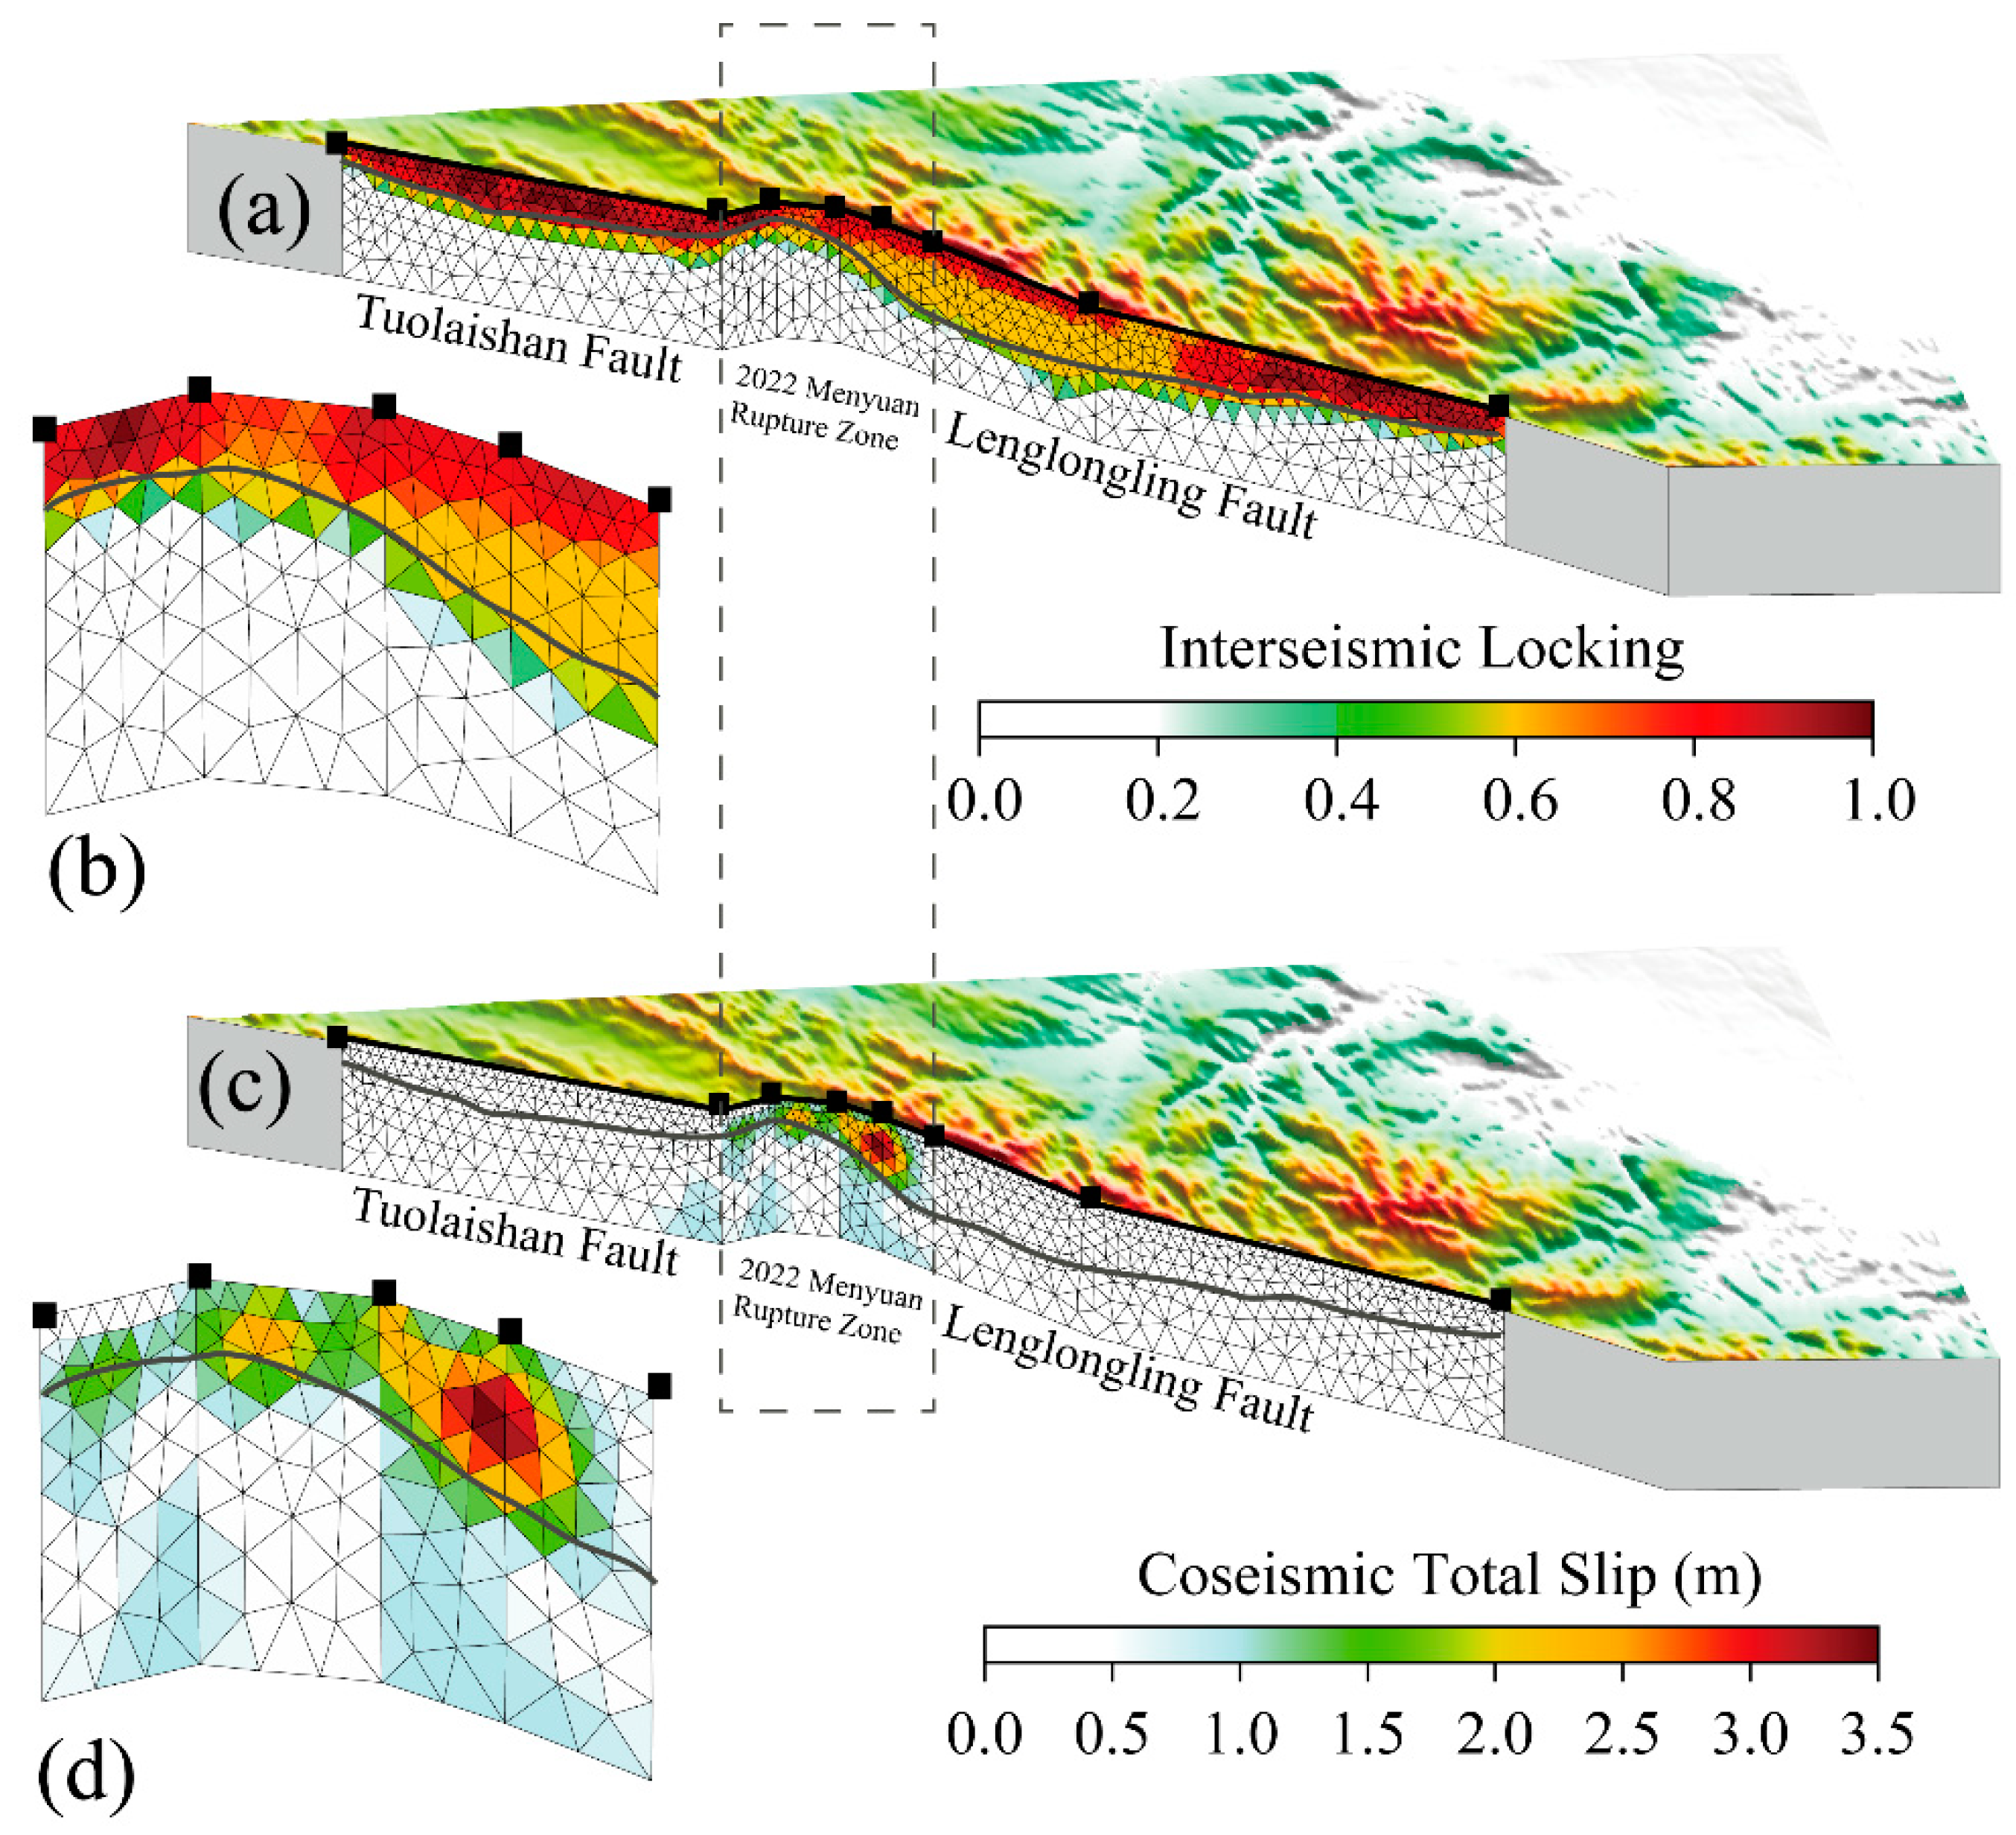
5.1. Comparison of Interseismic Locking and Coseismic Slip Distribution

Interseismic fault locking has been applied extensively to evaluate the risk of a seismogenic fault and estimate the potential magnitude of an earthquake [43,75,76,80,81,82,83,84,85]. However, whether interseismic locking can completely account for the coseismic rupture remains unclear. In this study, we calculated the interseismic locking using the distributed slip rate of the Tuolaishan–Lenglongling faults (Figure 10a). As shown in Figure 10a, locked areas (>0.6) were present in the shallow part of the Tuolaishan Fault up to 6 km. A locked area (>0.6) was also located in the shallow part of the fault near the epicenter of the 2022 Menyuan earthquake (dotted rectangle in Figure 10). The locked zone (>0.6) on the western segment of the Lenglongling Fault was significantly deeper than that of the Tuolaishan Fault, extending to 10 km, but the locked area, with values > 0.8, was relatively shallow (~5 km) (Figure 10a). This may be the result of differing influences of the 2016 Menyuan earthquake on the depth of the Lenglongling Fault [6,14]. Li et al. [6] calculated the static Coulomb stress variations caused by the 2016 Menyuan earthquake, finding that the Lenglongling Fault to the south of the 2016 earthquake experienced stress loading at a depth of 5 km while stress unloading occurred at a depth of 10 km. Therefore, fault locking on the western segment of the Lenglongling Fault includes such features. The eastern segment of the Lenglongling Fault also had similar locked features to that of the Tuolaishan Fault, whose locking depth (>0.8) reached 6 km.
Figure 10c shows the coseismic slip distribution of the 2022 Menyuan earthquake. The coseismic slip was located within 2–7 km of the seismogenic fault, with a maximum displacement of 3.47 m. The location of the maximum displacement was located at the intersection of two aftershock bands; part of the coseismic displacement > 1.5 m was within a depth of 10 km. In addition, we calculated the moment magnitude released by the 2022 Menyuan earthquake as Mw 6.60, which is consistent with Mw 6.7, as obtained by Li et al. [6]. In terms of the segment characteristics, the rupture zone (dotted rectangle in Figure 10) released energy equivalent to that of an earthquake with a moment magnitude of Mw 6.53.
To compare the coseismic slip pattern with the interseismic locking, we enlarged the epicentral region, as shown in Figure 10b and d. Except for some deviations in the western part of the epicentral region, all regions with coseismic slips > 1.5 m were above the 0.6 isoline curve. This indicates that an isoline with an interseismic locking value of 0.6 can delineate areas that experienced large coseismic slip. This phenomenon is widespread in other regions that have been thoroughly investigated, including the 2004 M6 Parkfield earthquake [4] and 2011 M9 Tohoku-Oki earthquake [3]. The frictional properties of the fault plane can also be constrained by interseismic fault locking, coseismic slip distribution, and post-seismic fault slip rate [86]. Yang et al. [5] used numerical simulations to confirm that interseismic locking places optimal constraints on the seismic rupture process.
Constraining the interseismic locked region using high-precision and high-density geodesy observations can define the approximate scope of the coseismic slip. Using the timing of the most recent earthquake event and the long-term fault slip rate, the moment magnitude of a potential earthquake can be estimated accurately. We calculated the energy balances of the seismogenic faults using the timing of the most recent large earthquake on each segment of the target fault. For the rupture zone of the 2022 Menyuan earthquake, Zheng et al. [87] determined that the most recent large earthquake occurred in 1540 in Liuhhuanggou [88]. Thus, elastic strain had accumulated for 482 years. For the Lenglongling Fault, Guo et al. [89] investigated the surface rupture of the 1927 Gulang earthquake using high-resolution satellite images and field surveys, concluding that the Mw 7.7 earthquake ruptured the Lenglongling Fault. Thus, elastic strain had accumulated along the Lenglongling Fault for 95 years. For the Tuolaishan Fault, historical seismic records are unclear. However, we believe that the most recent large earthquake predated 1540. Therefore, we also set the time of strain accumulation to 482 years. Then, using a fault slip rate of 6 mm/yr and a shear modulus of 30 GPa, the cumulative energy released by the Tuolaishan fault segment was determined to be equivalent to a Mw 6.79 earthquake. In addition, the cumulative energy released by the rupturing fault of the 2022 Menyuan earthquake was equal to a Mw 6.53 earthquake and the cumulative energy released by the Lenglongling Fault was equivalent to a Mw 6.01 earthquake. These findings are consistent with the occurrence of two recent seismic events in 2016 and 2022. The moment magnitude of the 2016 Menyuan earthquake was Mw 5.9 while that of the 2022 Menyuan earthquake, calculated using the coseismic slip model, was Mw 6.53. Thus, the energy that accumulated for 482 years in the stepover zone was released by the 2022 Menyuan earthquake. The strain that accumulated for 95 years on the Lenglongling Fault was released by the 2016 Menyuan earthquake. However, the Tuolaishan Fault still has a risk of a future Mw 6.79 earthquake.

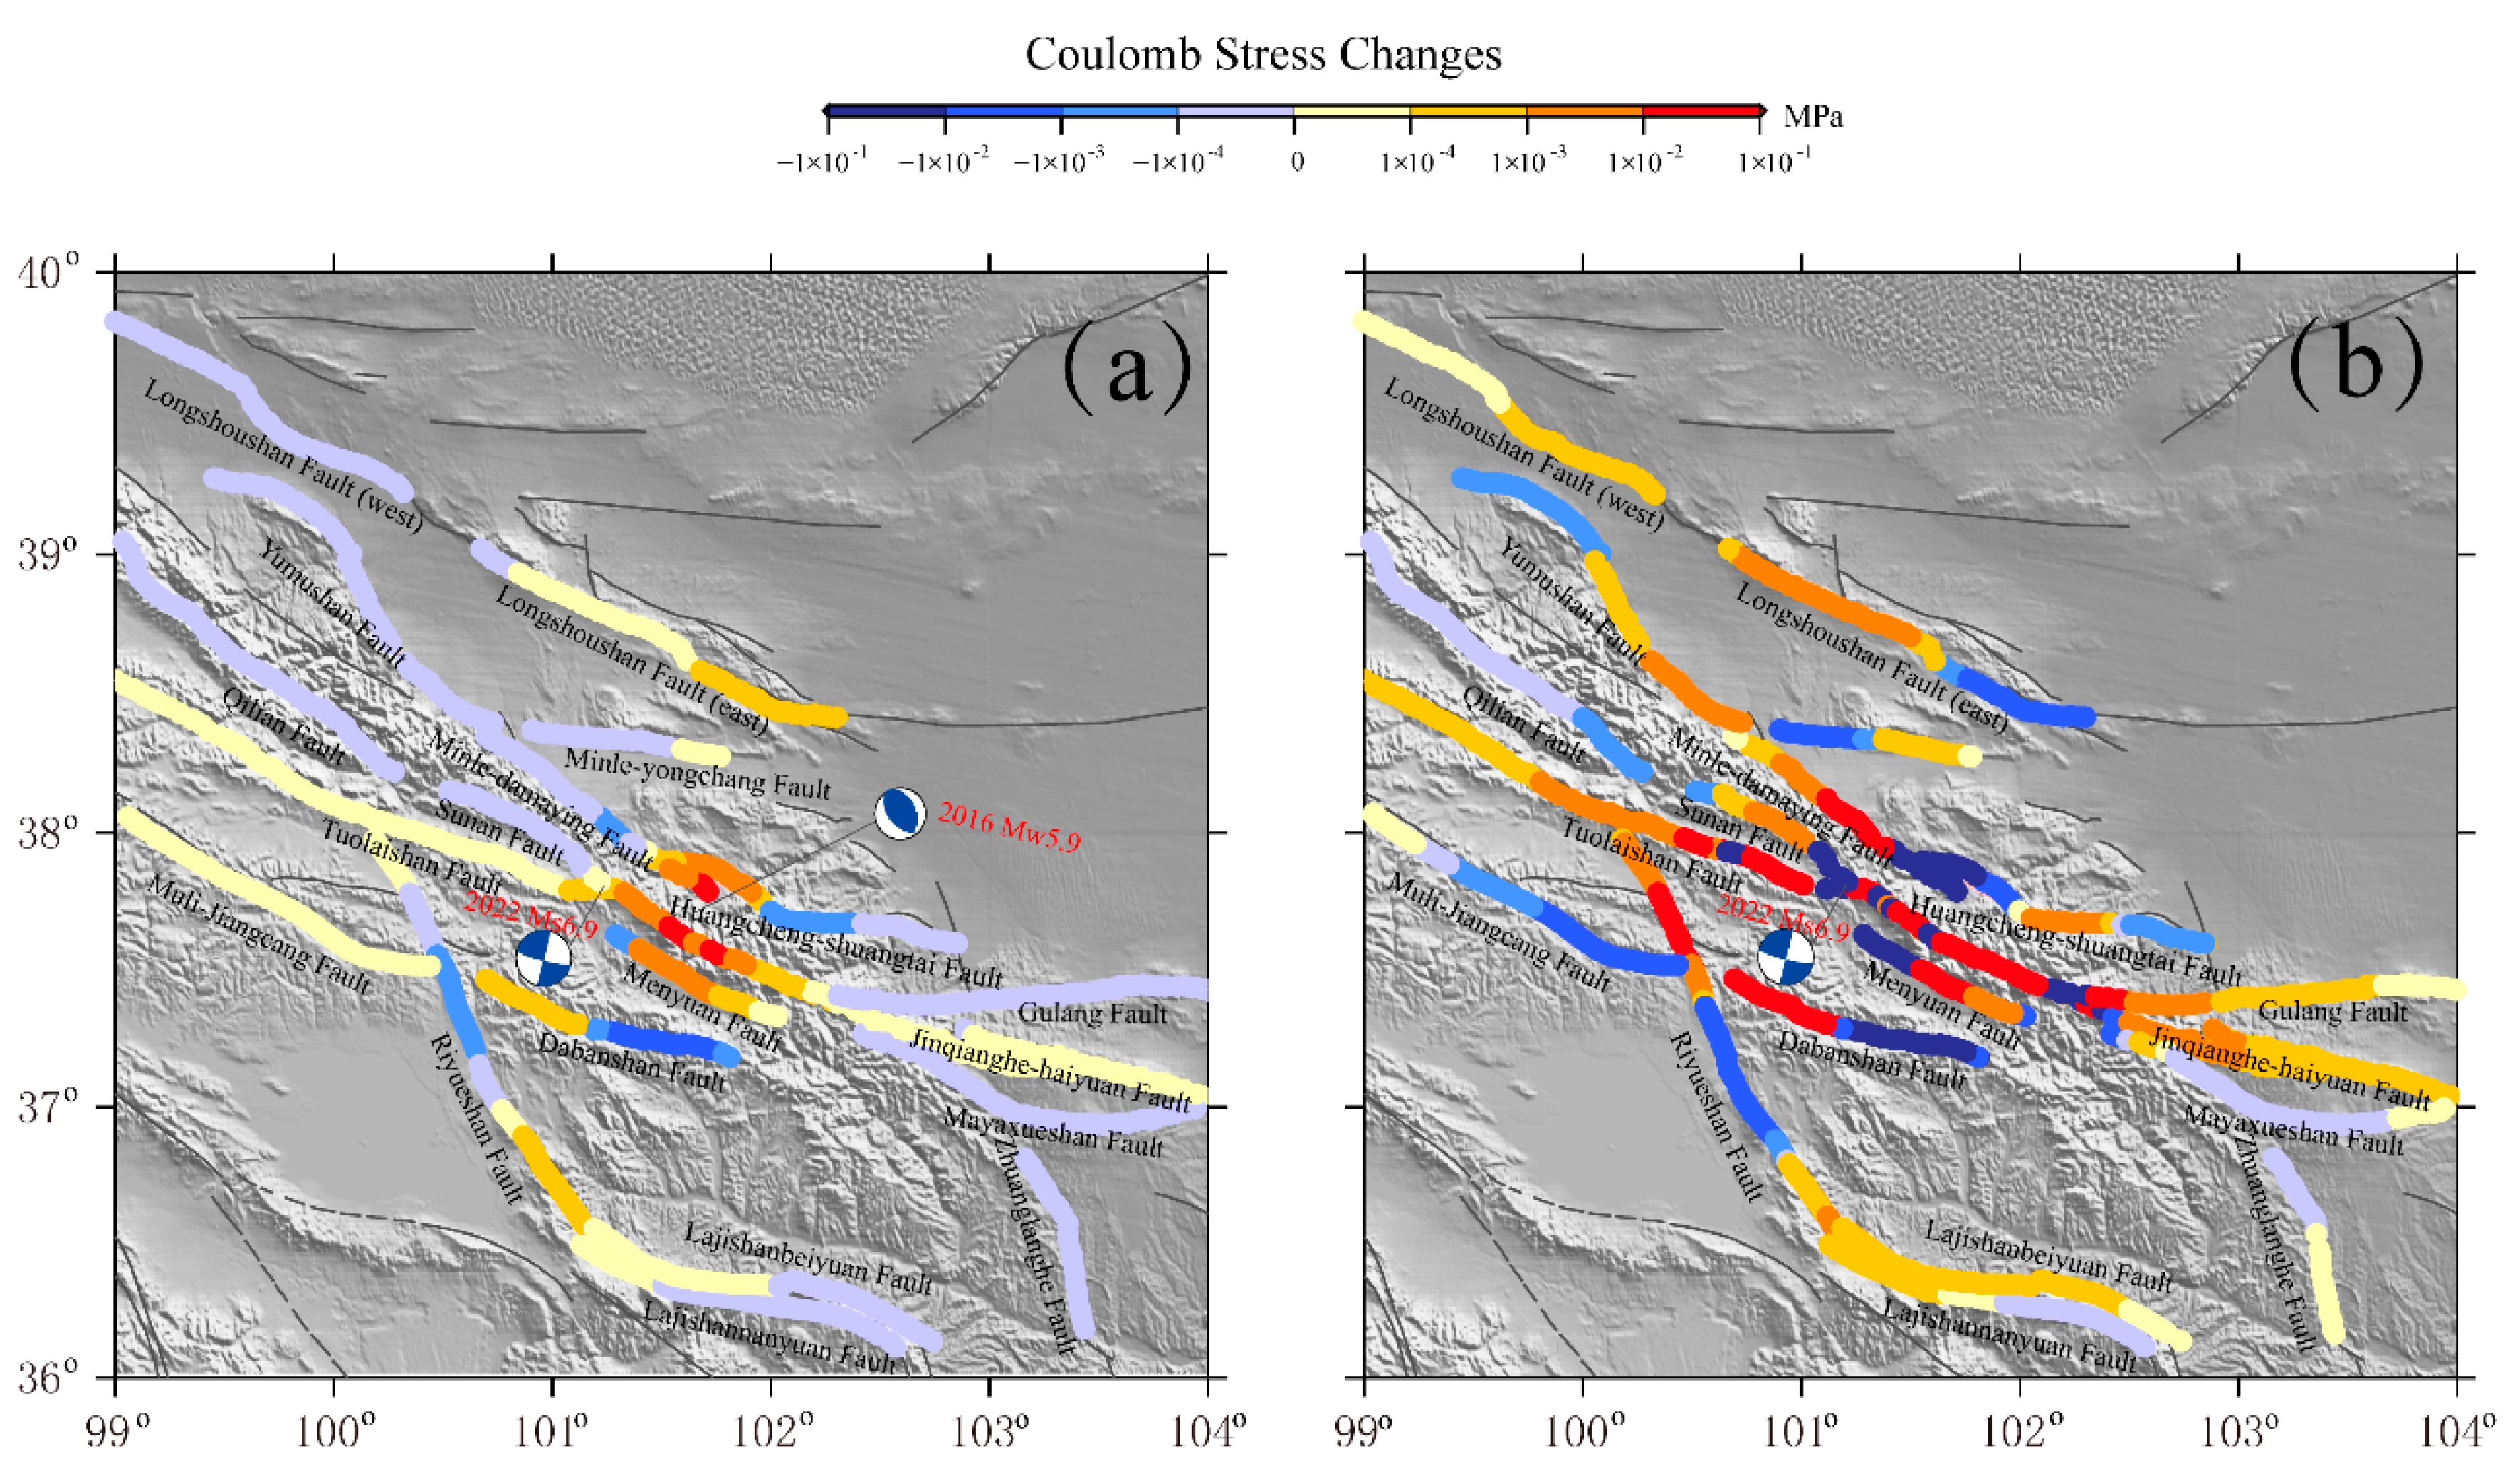
5.2. Coulomb Stress Changes Due to the 2016 and 2022 Menyuan Earthquakes

Following an earthquake, the initiation of another earthquake is of great concern. To address this problem, after the 2022 earthquake, we uniformly set the friction coefficient of the target fault to 0.3 and calculated the influence of the earthquake on the surrounding active faults [90]. Figure 11b shows the impacts of the 2022 Menyuan Ms 6.9 earthquake on the active faults in the region, indicating that the earthquake had a substantial loading effect on the Tuolaishan Fault west of the epicenter, as well as on the Lenglongling Fault east of the epicenter, at up to 0.1 MPa. Combined with interseismic locking (Figure 10a), earthquake energy release, and the long-term stress accumulation state [91], we postulate that the Tuolaishan Fault has a high probability of earthquake occurrence following the 2022 event. The 2022 Menyuan earthquake also had a loading effect on the Minle–Damaying Fault, the western segment of the Dabanshan Fault, and the northern segment of the Riyueshan Fault. In addition, the Jinqianghe–Haiyuan, Menyuan, Sunan, Gulang, Lajishan, Yumushan, and Longshoushan faults were also loaded, whereas the Huangcheng–Shuangta, Minle–Yongchang, Dabanshan, and Muli–Jiangcang faults were unloaded.
In addition, determining whether the 2016 Menyuan earthquake triggered the 2022 earthquake is another concern. To clarify this point, we calculated the coseismic and post-seismic Coulomb stress changes using a viscosity coefficient of 8 E18 [92,93]. The results (Figure 11a) indicate that the 2016 Menyuan earthquake had strong loading effects on the Tuolaishan, Lenglongling, and Jinqianghe–Haiyuan faults. Therefore, the 2016 Menyuan earthquake likely triggered the 2022 Menyuan earthquake, which is consistent with the findings of Li et al. [6] and Qu et al. [14].

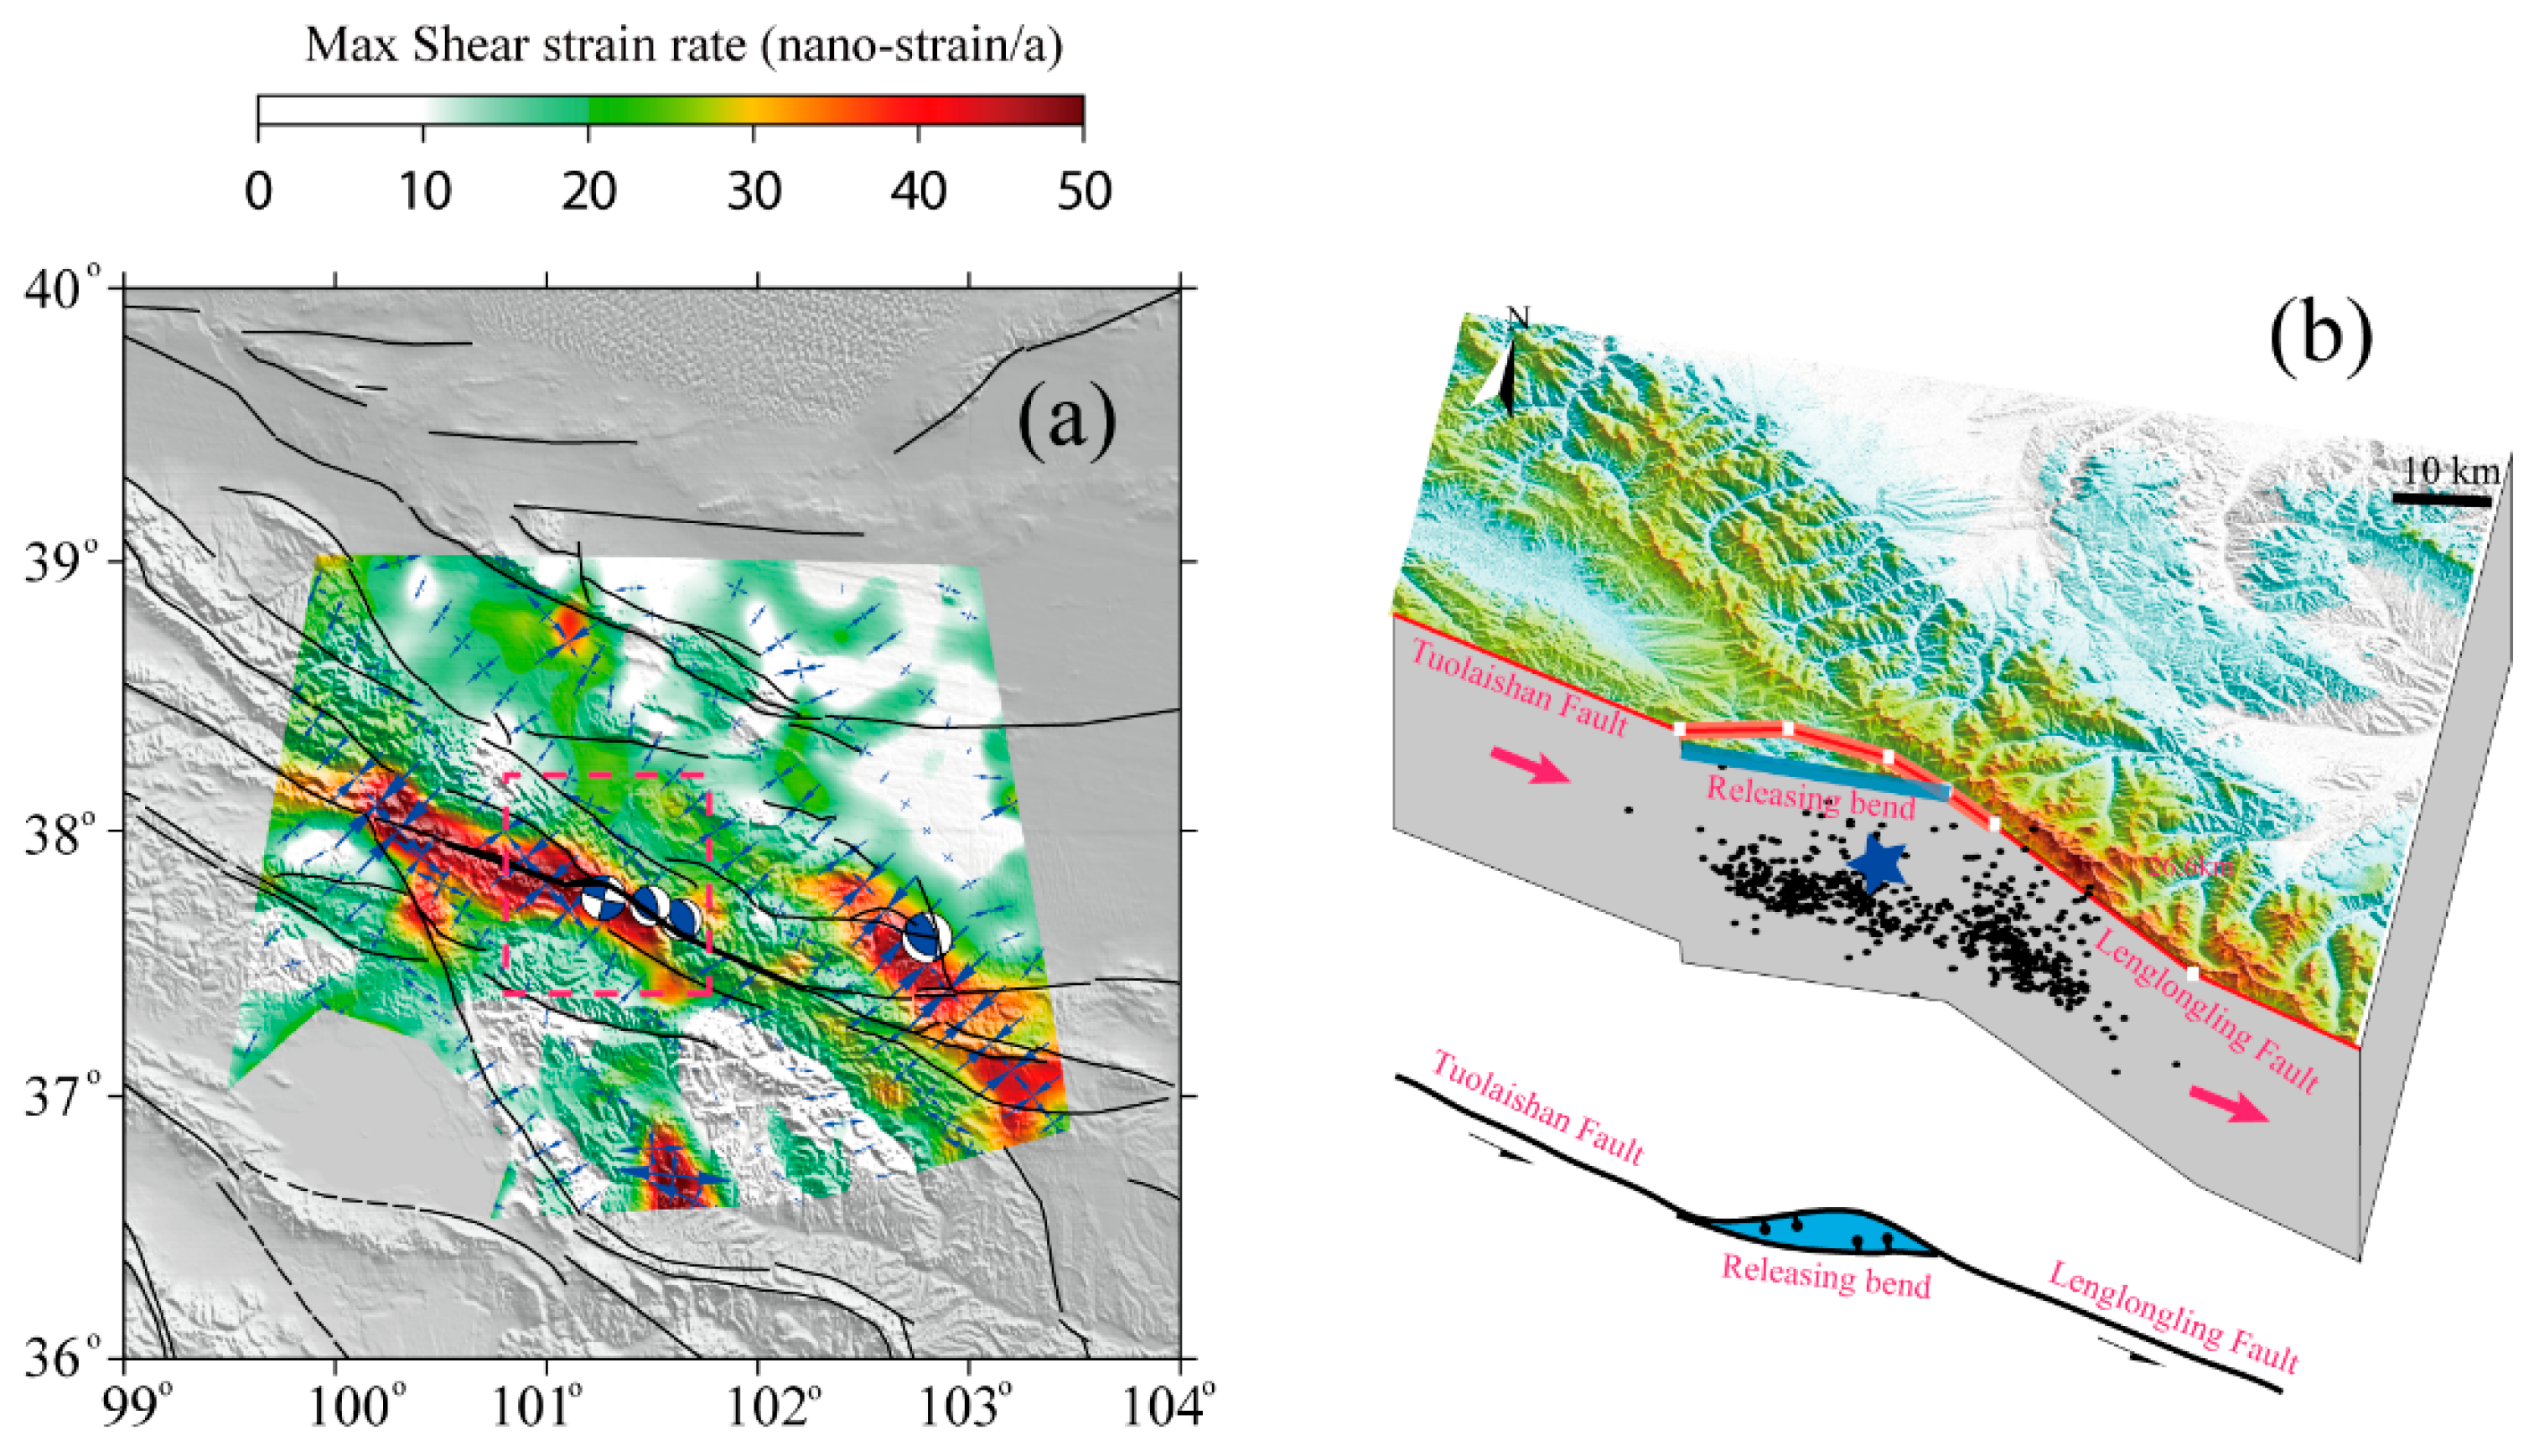
5.3. Tectonic Implications of the 2022 Menyuan Earthquake

The 2022 Menyuan earthquake occurred in the stepover region where the Tuolaishan and Lenglongling faults intersect. The earthquake was dominated by high-angle left-lateral strike-slip motion [6], which is consistent with previous geological survey results [31,32,33,35]. In addition, we obtained the aftershock catalog [73] within nine days after the 2022 Menyuan earthquake. Compared with the InSAR deformation field, we found that the aftershock catalog was consistent with the InSAR coseismic deformation gradient zone on the Lenglongling segment. However, the western part of the aftershock catalog was considerably different from the InSAR coseismic deformation gradient zone (Figure 4c). Based on the depth profiles, the aftershock catalogs of the two segments were upright, indicating that the dip angle of the seismogenic fault could not explain the differences between the two segments (Figure 4f,h). However, a blind fault may exist in the stepover zone between the Tuolaishan and Lenglongling faults. Following the 2022 Menyuan earthquake, such a blind fault could have reactivated and triggered numerous aftershocks. Examples of faults that have developed in such stepover zones between strike-slip faults are not uncommon. Ye et al. [94] conducted numerical simulations to confirm that branched faults developed at the bend in the San Andreas Fault in southern California, absorbing large quantities of strike-slip motion. Liu et al. [95] summarized the decomposition effect of the tail end of the strike-slip fault on the slip rate, which commonly develops branched faults in a left-lateral releasing stepover zone.
Figure 12a shows the maximum shear strain rate and principal strain rate obtained using the horizontal InSAR velocity field and GNSS deformation before the 2022 Menyuan earthquake. A large shear strain concentration was present in the data coverage area of the Tuolaishan and Lenglongling faults, with magnitudes of up to 50 nano-strains/a. This is consistent with the results obtained from the GNSS data [39,45,96]. A strain rate concentration was also observed on the western Haiyuan Fault, as well as a high shear strain rate in the region of the 1927 Gulang earthquake region. Guo et al. [89] investigated the surface rupture of the 1927 Gulang earthquake using high-resolution satellite images and field surveys, concluding that the Gulang earthquake ruptured the Lenglongling Fault. Thus, the present low shear strain rate may be related to fault healing from the 1927 Gulang earthquake.
In summary, the focal mechanism of the 2022 Menyuan earthquake, its aftershock distribution, and its shear strain rate concentrations demonstrate that the Lenglongling and Tuolaishan faults are interpenetrating (Figure 12b). According to historical seismic records, the low strain rate in the “Tianzhu Gap” may be related to the 1927 Gulang earthquake [89]. Therefore, the Tuolaishan–Lenglongling–Jinqianghe–Haiyuan fault system may be a consecutively active strike-slip fault system on the northern margin of the Tibetan Plateau. This indicates that large strike-slip faults absorbed and released energy during the expansion of the Tibetan Plateau.

6. Conclusions

Here, we demonstrated that the interseismic locking region can limit the approximate scope of the coseismic slip distribution. Combined with the elapsed time from the last seismic event, the potential seismic energy and location were determined based on high precision and high-density geodetic observations. For the Qilian-Haiyuan fault zone, the 2016 Menyuan earthquake released energy that had accumulated for 95 years along the Lenglongling Fault, while the 2022 Menyuan earthquake released energy that had accumulated for 482 years in the stepover region between the Lenglongling and Tuolaishan faults. The accumulated elastic strain energy on the Tuolaishan Fault was equivalent to a Mw 6.79 earthquake. Considering the changes in the coseismic static Coulomb stress related to the 2022 Menyuan earthquake, we postulate that the Tuolaishan Fault has a high likelihood of earthquake occurrence following the 2022 earthquake.
By combining the aftershock distributions and shear strain rate concentrations on the seismogenic faults, the Tuolaishan–Lenglongling–Jinqianghe–Haiyuan fault system may be a consecutively active strike-slip fault system on the northern margin of the Tibetan Plateau. This indicates that large strike-slip faults absorbed and released energy during the expansion of the Tibetan Plateau with earthquake and aseismic processes.
In our inversion model, we did not adopt the finite element model that can evaluate the influence of topography and medium anisotropy on the fault slip distribution. Additionally, with the continuous accumulation of postseismic observations, this study can provide a basis for constructing a physical model that links the interseismic, coseismic, and postseismic phases of the earthquake cycle to constrain the friction attributes of seismogenic faults and determine the earthquake recurrence period.

Author Contributions

All the authors participated in editing and reviewing the manuscript. L.Z., methodology, software, writing—review, editing and visualization; L.J., conceptualization; C.L., data curation; J.X., software; X.L., methodology; L.L., validation, Q.Z., visualization. All authors have read and agreed to the published version of the manuscript.

Funding

This research was funded by the Jilin Changbaishan Volcano National Observation and Research Station (No. NORSCBS20-01), the National Natural Science Foundation of China (Nos. 42104061, 41904007), and the Spark Programs of Earthquake Sciences granted by the China Earthquake Administration (Nos. XH20083, XH20081Y).

Data Availability Statement

The Sentinel-1 data used in this study are downloaded from the European Space Agency (ESA) through the ASF Data Hub website https://vertex.daac.asf.alaska.edu/ (accessed on 20 January 2022).

Acknowledgments

All Sentinel-1 data were obtained from the European Space Agency. Gaofen-7 satellite images were provided by the National Academy of Natural Disaster Prevention and Control of the Ministry of Emergency Management of China.

Conflicts of Interest

The authors declare no conflict of interest.

References

  1. Konca, A.O.; Avouac, J.P.; Sladen, A.; Meltzner, A.J.; Sieh, K.; Fang, P.; Li, Z.; Galetzka, J.; Genrich, J.; Chlieh, M.; et al. Partial rupture of a locked patch of the Sumatra megathrust during the 2007 earthquake sequence. Nature 2008, 456, 631–635. [Google Scholar] [CrossRef] [PubMed] [Green Version]
  2. Moreno, M.; Rosenau, M.; Oncken, O. 2010 Maule earthquake slip correlates with pre-seismic locking of Andean subduction zone. Nature 2010, 467, 198–202. [Google Scholar] [CrossRef] [PubMed]
  3. Loveless, J.; Meade, B. Spatial correlation of interseismic coupling and coseismic rupture extent of the 2011 MW = 9.0 Tohoku-Oki earthquake. Geophys. Res. Lett. 2011, 38. [Google Scholar] [CrossRef] [Green Version]
  4. Wang, L.; Hainzl, S.; Martin, P. Quantifying slip balance in the earthquake cycle: Coseismic slip model constrained by interseismic coupling. J. Geophys. Res. Solid Earth 2015, 120, 8383–8403. [Google Scholar] [CrossRef] [Green Version]
  5. Yang, H.; Yao, S.; He, B.; Newman, A.V.; Weng, H. Deriving Rupture Scenarios from Interseismic Locking Distributions along the Subduction Megathrust. J. Geophys. Res. Solid Earth 2019, 124, 10376–10392. [Google Scholar] [CrossRef]
  6. Li, Z.; Han, B.; Liu, Z.; Zhang, M.; Yu, C.; Chen, B.; Liu, H.; Du, J.; Zhang, S.; Zhu, W.; et al. Source Parameters and Slip Distributions of the 2016 and 2022 Menyuan, Qinghai Earthquakes Constrained by InSAR Observation. Geomat. Inf. Sci. Wuhan Univ. 2022, 47, 887–897. (In Chinese) [Google Scholar]
  7. Gaudemer, Y.; Tapponnier, P.; Meyer, B.; Peltzer, G.; Shunmin, G.; Zhitai, C.; Huagung, D.; Cifuentes, I. Partitioning of crustal slip between linked, active faults in the eastern Qilian Shan, and evidence for a major seismic gap, the ‘Tianzhu gap’, on the western Haiyuan Fault, Gansu (China). Geophys. J. Int. 1995, 120, 599–645. [Google Scholar] [CrossRef] [Green Version]
  8. Guo, P.; Han, Z.; An, Y.; Jiang, W.; Mao, Z.; Feng, W. Activity of the Lenglongling fault system and seismotectonics of the 2016 Ms 6.4 Menyuan earthquake. Sci. China Earth Sci. 2017, 60, 929–942. [Google Scholar] [CrossRef]
  9. He, X.; Zhang, Y.; Shen, X.; Zheng, W.; Zhang, P.; Zhang, D. Examination of the repeatability of two Ms6.4 Menyuan earthquakes in Qilian-Haiyuan fault zone (NE Tibetan Plateau) based on source parameters. Phys. Earth Planet. Inter. 2020, 299, 106408. [Google Scholar] [CrossRef]
  10. Hu, C.-Z.; Yang, P.-X.; Li, Z.-M.; Huang, S.-T.; Zhao, Y.; Chen, D.; Xiong, R.-W.; Chen, Q.-Y. Seismogenic mechanism of 21 January 2016 Menyuan, Qinghai Ms 6.4 earthquake. Chin. J. Geophys. 2016, 59, 211–221. (In Chinese) [Google Scholar]
  11. Li, Y.; Jiang, W.; Zhang, J.; Luo, Y. Space Geodetic Observations and Modeling of 2016 Mw 5.9 Menyuan Earthquake: Implications on Seismogenic Tectonic Motion. Remote Sens. 2016, 8, 519. [Google Scholar] [CrossRef] [Green Version]
  12. Liu, Y.; Zhang, G.; Zhang, Y.; Shan, X. Source parameters of the 2016 Menyuan earthquake in the northeastern Tibetan Plateau determined from regional seismic waveforms and InSAR measurements. J. Asian Earth Sci. 2018, 158, 103–111. [Google Scholar] [CrossRef]
  13. Liu, Y.; Xu, C.; Wen, Y. InSAR Observation of Menyuan Mw 5.9 Earthquake Deformation and Deep Geometry of Regional Fault Zone. Geomat. Inf. Sci. Wuhan Univ. 2020, 44, 1035–1042. [Google Scholar]
  14. Qu, W.; Liu, B.; Zhang, Q.; Gao, Y.; Chen, H.; Wang, Q.; Hao, M. Sentinel-1 InSAR observations of co- and post-seismic deformation mechanisms of the 2016 Mw 5.9 Menyuan Earthquake, Northwestern China. Adv. Space Res. 2021, 68, 1301–1317. [Google Scholar] [CrossRef]
  15. Tan, Y.; Dai, Z.; Zha, X. Deformation characteristics of the 2016 Mw 5.9 Menyuan (China) earthquake by modelling Sentinel-1A and auxiliary data. Int. J. Remote Sens. 2020, 41, 2725–2738. [Google Scholar] [CrossRef]
  16. Wang, H.; Liu-Zeng, J.; Ng, A.H.M.; Ge, L.; Javed, F.; Long, F.; Aoudia, A.; Feng, J.; Shao, Z. Sentinel-1 observations of the 2016 Menyuan earthquake: A buried reverse event linked to the left-lateral Haiyuan fault. Int. J. Appl. Earth Obs. Geoinf. 2017, 61, 14–21. [Google Scholar] [CrossRef]
  17. Xiong, W.; Chen, W.; Zhao, B.; Wen, Y.; Liu, G.; Nie, Z.; Qiao, X.; Xu, C. Insight into the 2016 Menyuan Mw 5.9 Earthquake with InSAR: A Blind Reverse Event Promoted by Historical Earthquakes. Pure Appl. Geophys. 2019, 176, 577–591. [Google Scholar] [CrossRef]
  18. Zhang, Y.; Shan, X.; Zhang, G.; Zhong, M.; Zhao, Y.; Wen, S.; Qu, C.; Zhao, D. The 2016 Mw 5.9 Menyuan Earthquake in the Qilian Orogen, China: A Potentially Delayed Depth-Segmented Rupture Following from the 1986 Mw 6.0 Menyuan Earthquake. Seismol. Res. Lett. 2020, 91, 758–769. [Google Scholar] [CrossRef]
  19. Elliott, J.R.; Walters, R.J.; England, P.C.; Jackson, J.A.; Li, Z.; Parsons, B. Extension on the Tibetan plateau: Recent normal faulting measured by InSAR and body wave seismology. Geophys. J. Int. 2010, 183, 503–535. [Google Scholar] [CrossRef] [Green Version]
  20. Feng, W.; Samsonov, S.; Qiu, Q.; Wang, Y.; Zhang, P.; Li, T.; Zheng, W. Orthogonal Fault Rupture and Rapid Postseismic Deformation Following 2019 Ridgecrest, California, Earthquake Sequence Revealed from Geodetic Observations. Geophys. Res. Lett. 2020, 47, e2019GL086888. [Google Scholar] [CrossRef]
  21. Ji, L.; Wang, Q.; Xu, J.; Ji, C. The July 11, 1995 Myanmar-China earthquake: A representative event in the bookshelf faulting system of southeastern Asia observed from JERS-1 SAR images. Int. J. Appl. Earth Obs. Geoinf. 2017, 55, 43–51. [Google Scholar] [CrossRef]
  22. Li, Z.; Elliott, J.R.; Feng, W.; Jackson, J.A.; Parsons, B.E.; Walters, R.J. The 2010 MW 6.8 Yushu (Qinghai, China) earthquake: Constraints provided by InSAR and body wave seismology. J. Geophys. Res. Solid Earth 2011, 116. [Google Scholar] [CrossRef] [Green Version]
  23. Luo, H.; Chen, T.; Xu, C.; Sha, H. Fault dip angle determination with the ji criterion and coulomb stress changes associated with the 2015 Mw 7.9 Gorkha Nepal earthquake revealed by InSAR and GPS data. Tectonophysics 2017, 714, 55–61. [Google Scholar] [CrossRef]
  24. Massonnet, D.; Feigl, K.L. Radar interferometry and its application to changes in the Earth’s surface. Rev. Geophys. 1998, 36, 441–500. [Google Scholar] [CrossRef] [Green Version]
  25. Ryder, I.; Burgmann, R. Spatial variations in slip deficit on the central San Andreas Fault from InSAR. Geophys. J. Int. 2008, 175, 837–852. [Google Scholar] [CrossRef] [Green Version]
  26. Shan, X.; Ma, J.; Wang, C.; Liu, J.; Song, X.; Zhang, G. Co-seismic ground deformation and source parameters of Mani M7.9 earthquake inferred from spaceborne D-InSAR observation data. Sci. China Ser. D. Earth Sci. 2004, 47, 481–488. [Google Scholar] [CrossRef]
  27. Shen, Z.K.; Sun, J.; Zhang, P.; Wan, Y.; Wang, M.; Bürgmann, R.; Zeng, Y.; Gan, W.; Liao, H.; Wang, Q. Slip maxima at fault junctions and rupturing of barriers during the 2008 Wenchuan earthquake. Nat. Geosci. 2009, 2, 718–724. [Google Scholar] [CrossRef]
  28. Sun, J.; Yue, H.; Shen, Z.; Fang, L.; Zhan, Y.; Sun, X. The 2017 Jiuzhaigou Earthquake: A Complicated Event Occurred in a Young Fault System. Geophys. Res. Lett. 2018, 45, 2230–2240. [Google Scholar] [CrossRef]
  29. He, L.; Feng, G.; Wu, X.; Lu, H.; Xu, W.; Wang, Y.; Liu, J.; Hu, J.; Li, Z. Coseismic and Early Postseismic Slip Models of the 2021 Mw 7.4 Maduo Earthquake (Western China) Estimated by Space-Based Geodetic Data. Geophys. Res. Lett. 2021, 48, e2021GL095860. [Google Scholar] [CrossRef]
  30. Ji, L.Y.; Liu, C.; Xu, J.; Liu, L.; Long, F.; Zhang, Z.-W. InSAR observation and inversion of the seismogenic fault for the 2017 Jiuzhaigou Ms 7.0 earthquake in China. Chin. J. Geophys. 2017, 60, 4069–4082. [Google Scholar]
  31. Guo, P.; Han, Z.; Mao, Z.; Xie, Z.; Dong, S.; Gao, F.; Gai, H. Paleoearthquakes and Rupture Behavior of the Lenglongling Fault: Implications for Seismic Hazards of the Northeastern Margin of the Tibetan Plateau. J. Geophys. Res. Solid Earth 2019, 124, 1520–1543. [Google Scholar] [CrossRef]
  32. He, W.G.; Liu, B.C.; Yuan, D.Y.; Yang, M. Research on slip rates of the Lenglongling active fault zone. Northwest. Seismol. J. 2000, 22, 90–97. [Google Scholar]
  33. Lasserre, C.; Gaudemer, Y.; Tapponnier, P.; Mériaux, A.S.; Van der Woerd, J.; Daoyang, Y.; Ryerson, F.J.; Finkel, R.C.; Caffee, M.W. Fast late Pleistocene slip rate on the Leng Long Ling segment of the Haiyuan fault, Qinghai, China. J. Geophys. Res. Solid Earth 2002, 107, ETG 4-1–ETG 4-15. [Google Scholar] [CrossRef]
  34. Yuan, D.Y.; Ge, W.P.; Chen, Z.W.; Li, C.Y.; Wang, Z.C.; Zhang, H.P.; Zhang, P.Z.; Zheng, D.W.; Zheng, W.J.; Craddock, W.H.; et al. The growth of northeastern Tibet and its relevance to large-scale continental geodynamics: A review of recent studies. Tectonics 2013, 32, 1358–1370. [Google Scholar] [CrossRef] [Green Version]
  35. Zheng, W.; Zhang, P.; He, W.; Yuan, D.; Shao, Y.; Zheng, D.; Ge, W.; Min, W. Transformation of displacement between strike-slip and crustal shortening in the northern margin of the Tibetan Plateau: Evidence from decadal GPS measurements and late Quaternary slip rates on faults. Tectonophysics 2013, 584, 267–280. [Google Scholar] [CrossRef]
  36. Gan, W.; Zhang, P.; Shen, Z.K.; Niu, Z.; Wang, M.; Wan, Y.; Zhou, D.; Cheng, J. Present-day crustal motion within the Tibetan Plateau inferred from GPS measurements. J. Geophys. Res. Solid Earth 2007, 112. [Google Scholar] [CrossRef] [Green Version]
  37. Liu, L.; Zhuang, W.; Ji, L.; Zhu, L.; Jiang, F. Fault locking of the Qilian-Haiyuan fault zone before the 2022 Menyuan Ms 6.9 earthquake and its seismic hazards in the future. Front. Earth Sci. 2022, 10, 929597. [Google Scholar] [CrossRef]
  38. Li, Y.; Shan, X.; Qu, C.; Wang, Z. Fault locking and slip rate deficit of the Haiyuan-Liupanshan fault zone in the northeastern margin of the Tibetan Plateau. J. Geodyn. 2016, 102, 47–57. [Google Scholar] [CrossRef]
  39. Li, Y.; Liu, M.; Wang, Q.; Cui, D. Present-day crustal deformation and strain transfer in northeastern Tibetan Plateau. Earth Planet. Sci. Lett. 2018, 487, 179–189. [Google Scholar] [CrossRef]
  40. Cavalie, O.; Lasserre, C.; Doin, M.P.; Peltzer, G.; Sun, J.; Xu, X.; Shen, Z. Measurement of interseismic strain across the Haiyuan fault (Gansu, China), by InSAR. Earth Planet. Sci. Lett. 2008, 275, 246–257. [Google Scholar] [CrossRef]
  41. Daout, S.; Jolivet, R.; Lasserre, C.; Doin, M.; Barbot, S.; Tapponnier, P.; Peltzer, G.; Socquet, A.; Sun, J. Along-strike variations of the partitioning of convergence across the Haiyuan fault system detected by InSAR. Geophys. J. Int. 2016, 205, 536–547. [Google Scholar] [CrossRef] [Green Version]
  42. Jolivet, R.; Lasserre, C.; Doin, M.P.; Guillaso, S.; Peltzer, G.; Dailu, R.; Sun, J.; Shen, Z.; Xu, X. Shallow creep on the Haiyuan Fault (Gansu, China) revealed by SAR Interferometry. J. Geophys. Res. 2012, 117. [Google Scholar] [CrossRef] [Green Version]
  43. Li, Y.; Nocquet, J.M.; Shan, X.; Song, X. Geodetic Observations of Shallow Creep on the Laohushan-Haiyuan Fault, Northeastern Tibet. J. Geophys. Res. Solid Earth 2021, 126, e2020JB021576. [Google Scholar] [CrossRef]
  44. Qiao, X.; Qu, C.; Shan, X.; Zhao, D.; Liu, L. Interseismic slip and coupling along the Haiyuan fault zone constrained by InSAR and GPS measurements. Remote Sens. 2021, 13, 3333. [Google Scholar] [CrossRef]
  45. Wang, M.; Shen, Z. Present-Day Crustal Deformation of Continental China Derived from GPS and its Tectonic Implications. J. Geophys. Res. 2020, 125, e2019JB018774. [Google Scholar] [CrossRef]
  46. Molnar, P.; England, P. Late Cenozoic uplift of mountain ranges and global climate change: Chicken or egg? Nature 1990, 346, 29–34. [Google Scholar] [CrossRef]
  47. Tapponnier, P.; Xu, Z.; Roger, F.; Meyer, B.; Arnaud, N.; Wittlinger, G.; Yang, J. Oblique stepwise rise and growth of the Tibet Plateau. Science 2001, 294, 1671–1677. [Google Scholar] [CrossRef]
  48. Yin, A.; Harrison, T.M. Geologic Evolution of the Himalayan-Tibetan Orogen. Annu. Rev. Earth Planet. Sci. 2000, 28, 211–280. [Google Scholar] [CrossRef] [Green Version]
  49. Zuza, A.V.; Yin, A. Continental deformation accommodated by non-rigid passive bookshelf faulting: An example from the Cenozoic tectonic development of northern Tibet. Tectonophysics 2016, 677, 227–240. [Google Scholar] [CrossRef] [Green Version]
  50. Savage, J.C.; Prescott, W.H. Asthenosphere readjustment and the earthquake cycle. J. Geophys. Res. Solid Earth 1978, 83, 3369–3376. [Google Scholar] [CrossRef]
  51. Zhang, P.; Shen, Z.; Wang, M.; Gan, W.; Bürgmann, R.; Molnar, P.; Wang, Q.; Niu, Z.; Sun, J.; Wu, J.; et al. Continuous deformation of the Tibetan Plateau from global positioning system data. Geology 2004, 32, 809–812. [Google Scholar] [CrossRef]
  52. Huang, C.; Zhang, G.; Zhao, D.; Shan, X.; Xie, C.; Tu, H.; Qu, C.; Zhu, C.; Han, N.; Chen, J. Rupture Process of the 2022 Mw 6.6 Menyuan, China, Earthquake from Joint Inversion of Accelerogram Data and InSAR Measurements. Remote Sens. 2022, 14, 5104. [Google Scholar] [CrossRef]
  53. Liu, J.; Hu, J.; Li, Z.; Ma, Z.; Shi, J.; Xu, W.; Sun, Q. Three-Dimensional Surface Displacements of the 8 January 2022 Mw 6.7 Menyuan Earthquake, China from Sentinel-1 and ALOS-2 SAR Observations. Remote Sens. 2022, 14, 1404. [Google Scholar] [CrossRef]
  54. Luo, H.; Wang, T. Strain partitioning on the western Haiyuan fault system revealed by the adjacent 2016 Mw 5.9 and 2022 Mw 6.7 Menyuan earthquakes. Geophys. Res. Lett. 2022, 49, e2022GL099348. [Google Scholar] [CrossRef]
  55. Li, Y.; Jiang, W.; Li, Y.; Shen, W.; He, Z.; Li, B.; Li, Q.; Jiao, Q.; Tian, Y. Coseismic Rupture Model and Tectonic Implications of the January 7 2022, Menyuan Mw 6.6 Earthquake Constraints from InSAR Observations and Field Investigation. Remote Sens. 2022, 14, 2111. [Google Scholar] [CrossRef]
  56. Li, C.; Zhang, P.Z.; Yin, J.; Min, W. Late Quaternary left-lateral slip rate of the Haiyuan fault, northeastern margin of the Tibetan Plateau. Tectonics 2009, 28. [Google Scholar] [CrossRef]
  57. Liu-Zeng, J.; Klinger, Y.; Xu, X.; Lasserre, C.; Chen, G.; Chen, W.; Tapponnier, P.; Zhang, B. Millennial recurrence of large earthquakes on the Haiyuan fault near Songshan, Gansu Province, China. Bull. Seismol. Soc. Am. 2007, 97, 14–34. [Google Scholar] [CrossRef] [Green Version]
  58. Shao, Y.; Liu-Zeng, J.; Van der Woerd, J.; Klinger, Y.; Oskin, M.E.; Zhang, J.; Wang, P.; Wang, P.; Wang, W.; Yao, W. Late Pleistocene slip rate of the central Haiyuan fault constrained from optically stimulated luminescence, 14C, and cosmogenic isotope dating and high-resolution topography. GSA Bull. 2021, 133, 1347–1369. [Google Scholar] [CrossRef]
  59. Okada, Y. Internal deformation due to shear and tensile faults in a half-space. Bull. Seismol. Soc. Am. 1992, 82, 1018–1040. [Google Scholar] [CrossRef]
  60. Huang, Z.; Zhou, Y.; Qiao, X.; Zhang, P.; Cheng, X. Kinematics of the ~1000 km Haiyuan fault system in northeastern Tibet from high-resolution Sentinel-1 InSAR velocities: Fault architecture, slip rates, and partitioning. Earth Planet. Sci. Lett. 2022, 583, 117450. [Google Scholar] [CrossRef]
  61. Yu, C.; Li, Z.; Penna, N.T.; Crippa, P. Generic Atmospheric Correction Model for Interferometric Synthetic Aperture Radar Observations. J. Geophys. Res. 2018, 123, 9202–9222. [Google Scholar] [CrossRef]
  62. Liang, S.; Gan, W.; Shen, C.; Xiao, G.; Liu, J.; Chen, W.; Ding, X.; Zhou, D. Three-dimensional velocity field of present-day crustal motion of the Tibetan Plateau derived from GPS measurements. J. Geophys. Res. Solid Earth 2013, 118, 5722–5732. [Google Scholar] [CrossRef]
  63. Pan, Y.; Shen, W.; Shum, C.K.; Chen, R. Spatially varying surface seasonal oscillations and 3-D crustal deformation of the Tibetan Plateau derived from GPS and GRACE data. Earth Planet. Sci. Lett. 2018, 502, 12–22. [Google Scholar] [CrossRef]
  64. Zheng, G.; Wang, H.; Wright, T.J.; Lou, Y.; Zhang, R.; Zhang, W.; Shi, C.; Huang, J.; Wei, N. Crustal Deformation in the India-Eurasia Collision Zone From 25 Years of GPS Measurements. J. Geophys. Res. 2017, 122, 9290–9312. [Google Scholar] [CrossRef] [Green Version]
  65. Biggs, J.; Wright, T.; Lu, Z.; Parsons, B. Multi-interferogram method for measuring interseismic deformation: Denali Fault, Alaska. Geophys. J. Int. 2007, 170, 1165–1179. [Google Scholar] [CrossRef]
  66. Wang, H.; Wright, T.J. Satellite geodetic imaging reveals internal deformation of western Tibet. Geophys. Res. Lett. 2012, 39. [Google Scholar] [CrossRef] [Green Version]
  67. Wei, M.; Sandwell, D.; Smith-Konter, B. Optimal combination of InSAR and GPS for measuring interseismic crustal deformation. Adv. Space Res. 2010, 46, 236–249. [Google Scholar] [CrossRef]
  68. Daout, S.; Dini, B.; Haeberli, W.; Doin, M.; Parsons, B. Ice loss in the Northeastern Tibetan Plateau permafrost as seen by 16 yr of ESA SAR missions. Earth Planet. Sci. Lett. 2020, 545, 116404. [Google Scholar] [CrossRef]
  69. Werner, C.; Wegmuller, U.; Strozzi, T. GAMMA SAR and interferometric processing software. In Proceedings of the ERS-ENVISAT Symposium, Gothenburg, Sweden, 16–20 October 2000. [Google Scholar]
  70. Goldstein, R.M.; Werner, C.L. Radar interferogram filtering for geophysical applications. Geophys. Res. Lett. 1998, 25, 4035–4038. [Google Scholar] [CrossRef] [Green Version]
  71. Nof, R.N.; Ziv, A.; Doin, M.P.; Baer, G.; Fialko, Y.; Wdowinski, S.; Eyal, Y.; Bock, Y. Rising of the lowest place on Earth due to Dead Sea water-level drop: Evidence from SAR interferometry and GPS. J. Geophys. Res. Solid Earth 2012, 117. [Google Scholar] [CrossRef] [Green Version]
  72. Rosen, P.A.; Hensley, S.; Zebker, H.A.; Webb, F.H.; Fielding, E.J. Surface deformation and coherence measurements of Kilauea Volcano, Hawaii, from SIR-C radar interferometry. J. Geophys. Res. Planets 1996, 101, 23109–23125. [Google Scholar] [CrossRef]
  73. Fan, L.; Li, B.; Liao, S.; Jiang, C.; Fang, L. High-precision relocation of the aftershock sequence of the January 8, 2022, MS6.9 Menyuan earthquake. Earthq. Sci. 2022, 35, 138–145. [Google Scholar] [CrossRef]
  74. McCaffrey, R.; Qamar, A.I.; King, R.W.; Wells, R.E.; Khazaradze, G.; Williams, C.A.; Stevens, C.W.; Vollick, J.J.; Zwick, P.C. Fault locking, block rotation and crustal deformation in the Pacific Northwest. Geophys. J. Int. 2007, 169, 1315–1340. [Google Scholar] [CrossRef] [Green Version]
  75. Meade, B.J. Present-day kinematics at the India-Asia collision zone. Geology 2007, 35, 81–84. [Google Scholar] [CrossRef]
  76. Zhu, L.; Ji, L.; Liu, C. Interseismic slip rate and locking along the Maqin–Maqu Segment of the East Kunlun Fault, Northern Tibetan Plateau, based on Sentinel-1 images. J. Asian Earth Sci. 2021, 211, 104703. [Google Scholar] [CrossRef]
  77. Feng, W.; Li, Z.; Elliott, J.R.; Fukushima, Y.; Hoey, T.; Singleton, A.; Cook, R.; Xu, Z. The 2011 MW 6.8 Burma earthquake: Fault constraints provided by multiple SAR techniques. Geophys. J. Int. 2013, 195, 650–660. [Google Scholar] [CrossRef] [Green Version]
  78. Feng, W.; He, X.; Zhang, Y.; Fang, L.; Samsonov, S.; Zhang, P. Seismic faults of the 2022 Mw 6.6 Menyuan, Qinghai earthquake and their implication for the regional seismogenic structures. Chin. Sci. Bull. 2022, 617. [Google Scholar] [CrossRef]
  79. Lü, M.; Chen, K.; Chai, H.; Geng, J.; Zhang, S.; Fang, L. Joint inversion of InSAR and high-rate GNSS displacement waveforms for the rupture process of the 2022 Qinghai Menyuan M6.9 earthquake. Chin. J. Geophys. 2022. [Google Scholar] [CrossRef]
  80. Ader, T.; Avouac, J.P.; Liu Zeng, J.; Lyon Caen, H.; Bollinger, L.; Galetzka, J.; Genrich, J.; Thomas, M.; Chanard, K.; Sapkota, S.N.; et al. Convergence rate across the Nepal Himalaya and interseismic coupling on the Main Himalayan Thrust: Implications for seismic hazard. J. Geophys. Res. Solid Earth 2012, 117. [Google Scholar] [CrossRef] [Green Version]
  81. Jiang, G.; Xu, X.; Chen, G.; Liu, Y.; Fukahata, Y.; Wang, H.; Yu, G.; Tan, X.; Xu, C. Geodetic imaging of potential seismogenic asperities on the Xianshuihe-Anninghe-Zemuhe fault system, southwest China, with a new 3-D viscoelastic interseismic coupling model. J. Geophys. Res. 2015, 120, 1855–1873. [Google Scholar] [CrossRef]
  82. Johnson, K.M.; Fukuda, J.I. New methods for estimating the spatial distribution of locked asperities and stress-driven interseismic creep on faults with application to the San Francisco Bay Area, California. J. Geophys. Res. 2010, 115, B12408. [Google Scholar] [CrossRef]
  83. Lindsey, E.O.; Almeida, R.; Mallick, R.; Hubbard, J.; Bradley, K.; Tsang, L.L.; Liu, Y.; Burgmann, R.; Hill, E.M. Structural control on downdip locking extent of the Himalayan megathrust. J. Geophys. Res. Solid Earth 2018, 123, 5265–5278. [Google Scholar] [CrossRef]
  84. Luca, D.Z.; Romain, J.; Ylona, V.D. Segmentation of the Main Himalayan Thrust Illuminated by Bayesian Inference of Interseismic Coupling. Geophys. Res. Lett. 2020, 47, e2019GL086424. [Google Scholar]
  85. Pollitz, F.; Banerjee, P.; Grijalva, K.; Nagarajan, B.; Bürgmann, R. Effect of 3-D viscoelastic structure on post-seismic relaxation from the 2004 M = 9.2 Sumatra earthquake. Geophys. J. Int. 2008, 173, 189–204. [Google Scholar] [CrossRef] [Green Version]
  86. Wang, L. The next M ~ 6 event in parkfield implied by a physical model linking interseismic, coseismic, and postseismic phase. J. Geophys. Res. Solid Earth 2018, 123, 8858–8873. [Google Scholar] [CrossRef]
  87. Zheng, W.; Yuan, D.; He, W. Preliminary study of the seismicity of paleo-earthquakes on Dongqingding segment of Huangcheng-Shuangta fault. J. Seismol. Res. 2004, 27, 66–73, (In Chinese with English abstract). [Google Scholar]
  88. Xu, X.W.; Wu, X.Y.; Yu, G.H.; Tan, X.B.; Li, K. Seismo-geological signatures for identifying M ≥ 7.0 earthquake risk areas and their premilimary application in mainland China. Dizhen Dizhi 2017, 39, 219–275. [Google Scholar]
  89. Guo, P.; Han, Z.; Gao, F.; Zhu, C.; Gai, H. A new tectonic model for the 1927 M8.0 Gulang earthquake on the NE Tibetan Plateau. Tectonics 2020, 39, e2020TC006064. [Google Scholar] [CrossRef]
  90. King, G.C.P.; Stein, R.S.; Lin, J. Static stress changes and the triggering of earthquakes. Bull. Seismol. Soc. Am. 1994, 84, 935–953. [Google Scholar]
  91. Shi, F.; Shao, Z.; Zhan, W.; Ding, X.; Zhu, L.; Li, Y. Numerical modeling of the shear modulus and stress state of active faults in the northeastern margin of the Tibetan plateau. Chin. J. Geophys. 2018, 61, 3651–3663. [Google Scholar]
  92. Shao, Z.G.; Fu, R.S.; Xue, T.X.; Huang, J.H. Numerical simulation and discussion on the mechanism of postseismic deformation after Kunlun Ms 8.1 earthquake. Chin. J. Geophys. 2008, 51, 584–596. [Google Scholar] [CrossRef]
  93. Liu, S.; Xu, X.; Klinger, Y.; Nocquet, J.M.; Chen, G.; Yu, G.; Jónsson, S. Lower crustal heterogeneity beneath the northern Tibetan Plateau constrained by GPS measurements following the 2001 Mw 7.8 Kokoxili earthquake. J. Geophys. Res. Solid Earth 2019, 124, 11992–12022. [Google Scholar] [CrossRef] [Green Version]
  94. Ye, J.; Liu, M. How fault evolution changes strain partitioning and fault slip rates in Southern California: Results from geodynamic modeling. J. Geophys. Res. Solid Earth 2017, 122, 6893–6909. [Google Scholar] [CrossRef]
  95. Liu, J.; Ren, Z.; Zhang, H.; Li, C.; Zhang, Z.; Zheng, W.; Li, X.; Liu, C. Slip rates along the Laohushan fault and spatial variation in slip rate along the Haiyuan fault zone. Tectonics 2022, 41, e2021TC006992. [Google Scholar] [CrossRef]
  96. Ge, W.-P.; Wang, M.; Shen, Z.K.; Yuan, D.Y.; Zheng, W.J. Intersiesmic kinematics and deformation patterns on the upper crust of Qaidam-Qilianshan block. Chin. J. Geophys. 2013, 56, 2994–3010. (In Chinese) [Google Scholar]
Figure 1. Tectonic setting of the 2022 Menyuan earthquake. (a) Main active faults in the Tibetan Plateau and the research scope of this study (red rectangle). (b) Active faults (black lines) and historical earthquakes located near the 2022 Menyuan earthquake and in the surrounding area. The bold black line represents the Qilian-Haiyuan Fault Zone (seismogenic fault of the 2022 earthquake), the red rectangle represents the Sentinel data range covering the study area, and the red beach ball diagram represents the 2022 Menyuan earthquake. The blue beach ball diagrams represent historical earthquakes in the study area, blue straight lines represent the range of fault slip rates obtained from the GNSS data, the blue star represents the range of fault slip rates obtained from the InSAR data, and blue dots and triangles represent the slip rates obtained using geological methods. Black arrows indicate the GNSS sliding rate in the study area [45].
Remotesensing 14 06078 g001
Figure 2. Distribution of temporal and spatial baselines of the interferograms. Crosses with purple labels represent images included in velocity calculations, whereas crosses with cyan labels represent images that were not included. Purple lines represent generated interferograms. (a) Track A128; (b) Track D33.
Remotesensing 14 06078 g002
Figure 3. InSAR interseismic deformation field (2016–2021) and three-dimensional crustal deformation field constructed using InSAR and GNSS (relative to a Eurasian reference frame) data. InSAR deformation field obtained from the (a) D033 and (b) A128 orbits. Black straight lines represent active faults, red lines and black dots represent the locations and nodes of the seismogenic fault zone, respectively, red beach ball diagram represents the 2022 Menyuan earthquake, and blue beach ball diagrams represent (from left to right) the 1980 Menyuan earthquake, 2016 Menyuan earthquake, and 1927 Gulang earthquake. (c) Velocity in the eastern direction. (d) Velocity in the northern direction. (e) Velocity in the vertical direction.
Remotesensing 14 06078 g003
Figure 4. InSAR coseismic deformation field and aftershock distribution following the 2022 Menyuan earthquake. (a) Deformation field from the D033 orbit. (b) Deformation field from the A128 orbit, in which black lines indicate active faults and red lines with black dots indicate rupture traces and turning points used in the InSAR coseismic inversion, respectively. (c,d) display the details within the blue rectangle in (a), in which black lines exhibit active faults, red lines with white dots indicate the fault trace and turning point, white lines indicate the surface rupture traces, black dots indicate fine positioning after aftershock distribution, and the purple star indicates the epicenter location determined from the focal mechanism. (c) E–W coseismic deformation field (red and blue represent eastward and westward motions, respectively), where the blue line indicates the aftershock profile. (d) Vertical coseismic deformation field (red and blue represent upward and downward motions, respectively). The black-dotted rectangle is the location of Figure 5. Aftershock distribution along the (e) A–A’ and (f) B–B’ cross-sections, where the red line indicates the location of the deformation trace and the blue line indicates the location of concentrated aftershocks. (g) Aftershock distribution along the C–C’ cross-section. (h) Aftershock distribution along the D–D’ cross-section, in which the blue line indicates the location of concentrated aftershocks.
Remotesensing 14 06078 g004
Figure 5. Surface rupture of the 2022 Menyuan earthquake identified in Gaofen-7 satellite optical images. (a) The red curve indicates the identified fracture trace. (bf) Enlarged details of the white rectangles in (a).
Remotesensing 14 06078 g005
Figure 6. Data fitting and error statistics for the optimal interseismic fault slip model. (a) Original and (b) predicted E–W velocities and (c) the residual of the E–W velocity. (d) Observed, (e) predicted, and (f) residual values of the N–S velocity. (g) Residual statistical distribution of the E–W velocity. (h) Residual statistical distribution of the N–S velocity. (i) The L-curve selected for the smoothing factor in the inversion model. The red dot represents the optimal smoothing factor.
Remotesensing 14 06078 g006aRemotesensing 14 06078 g006b
Figure 7. Data fitting and residual error statistics for the optimal coseismic model. The (a) original observations, (b) predicted values, and (c) residual errors for the D033 and (df) A128 orbits, respectively. (g) Statistical distribution of the residual error for the D033 and (h) A128 orbits. (i) L-curve showing the selected smooth-factor used in the coseismic inversion model.
Remotesensing 14 06078 g007aRemotesensing 14 06078 g007b
Figure 8. Distribution of the fault slip rates during interseismic periods. (a) Dip-slip rates, in which the red (negative) values represent downward motion. White (positive) values indicate upward motion. (b) Error distribution of the dip-slip component of the fault. (c) Strike-slip rates, in which negative values indicate left-lateral strike-slip motion to the east. (d) Error distribution of the strike-slip rate, in which stars represent the three seismic events near the Lenglongling Fault and the dotted rectangle indicates the rupture area of the 2022 Menyuan earthquake.
Remotesensing 14 06078 g008
Figure 9. Coseismic slip distribution of the 2022 Menyuan earthquake. (a) Dip-slip component, in which red (positive) values indicate upward motion and white (negative) values indicate downward motion. (b) Errors in the dip-slip component. (c) Left-lateral strike-slip component. (d) Error for the strike-slip component.
Remotesensing 14 06078 g009
Figure 10. Coseismic slip distribution and fault locking. (a) Interseismic locking and (b) the locking state of the epicentral region of the 2022 Menyuan earthquake. (c) Coseismic slip distribution of the 2022 Menyuan earthquake and (d) in the epicentral region. Black curves represent the 0.6 isoline of fault locking while the dotted rectangle indicates the rupture area of the earthquake.
Remotesensing 14 06078 g010
Figure 11. Coulomb stress changes caused by the 2016 and 2022 Menyuan earthquakes. (a) Co- and post-seismic Coulomb stress changes for the 2016 Mw 5.9 earthquake and (b) coseismic Coulomb stress changes for the 2022 Ms 6.9 earthquake.
Remotesensing 14 06078 g011
Figure 12. Distribution of the maximum shear strain rates (a) and a schematic diagram of the stepover zone between the Tuolaishan and Lenglongling faults (b). In (a), black curves indicate active faults and the bold curve indicates the fault segment. Blue focal mechanism solutions are (from left to right) for the 2022 Menyuan earthquake, the 1986 Menyuan earthquake, the 2016 Menyuan earthquake, and the 1927 Gulang earthquake. The blue arrow indicates the magnitude and direction of the principal strain rate while the red-dashed line indicates the zone of (b). In (b), the thin red lines indicate the locations of the active faults and the thick red line is the rupture and deformation trace of the 2022 Menyuan earthquake. The thick blue line represents the aftershock trace after relocation while the black dots indicate the aftershock distribution. The blue star indicates the epicenter of the 2022 Menyuan earthquake.
Remotesensing 14 06078 g012
Table 1. Temporal and spatial baseline thresholds.
No.Temporal Baseline (days) ΔTPerpendicular Baseline (m) ΔB
1ΔT < 90 dΔB < 10 m
2275 d < ΔT < 455 dΔB < 100 m
3N + 275 d < ΔT < N + 455 d *ΔB < 200 m
* N is an integer multiple of 365.
Publisher’s Note: MDPI stays neutral with regard to jurisdictional claims in published maps and institutional affiliations.

