Article

Rupture Process of the 2022 Mw6.6 Menyuan, China, Earthquake from Joint Inversion of Accelerogram Data and InSAR Measurements

1
State Key Laboratory of Earthquake Dynamics, Institute of Geology, China Earthquake Administration, Beijing 100029, China
2
School of Earth Sciences, Yunnan University, Kunming 650091, China
3
Seismological Bureau of Qinghai, Qinghai 810001, China
4
Guangdong Key Laboratory of Urban Informatics and Guangdong Laboratory of Artificial Intelligence and Digital Economy (SZ), School of Architecture & Urban Planning, Shenzhen University, Shenzhen 518000, China
5
Seismological Bureau of Shanghai, Shanghai 200062, China
*
Author to whom correspondence should be addressed.
Remote Sens. 2022, 14(20), 5104; https://doi.org/10.3390/rs14205104
Submission received: 15 September 2022 / Revised: 9 October 2022 / Accepted: 10 October 2022 / Published: 12 October 2022
(This article belongs to the Special Issue Monitoring Subtle Ground Deformation of Geohazards from Space)

Abstract

:
We obtained the rupture process and slip distribution of the 2022 Mw6.6 Menyuan earthquake by jointly inverting accelerogram data and InSAR measurements. The near-field InSAR measurements provide good constraints on the shallow slip distributions (<6 km). The accelerogram data enable us to better resolve the deeper coseismic slip (>6 km). The combination of two types of data provided improved constrains on slip distribution of the 2022 Menyuan earthquake. The results from joint inversion of InSAR and accelerogram data reveal a 26-km-long rupture length, which roughly agrees with the mapped length from the optically identified surface rupture trace and the InSAR deformation field. We imaged a major asperity with a dimension of 14 × 6 km at 4 km depth updip of the hypocenter. The maximum slip is estimated to be 3.8 m at 4 km depth. The duration of the 2022 Menyuan earthquake is ~14 s, and 90% of the seismic moment is released in the first 10 s. The total seismic moment is estimated to be 1.31 × 1 × 1019 N·m, equivalent to a moment magnitude of Mw6.7. Our results highlight that the moderate but shallow rupture during the 2022 Menyuan earthquake could intensify the seismic damage on the surface, confirmed by field investigations.

1. Introduction

At 17:45 on 7 January 2022 (UTC), a strong earthquake with a surface-wave magnitude (Ms) of 6.9 struck the Menyuan County, Qinghai, on the northeastern Tibetan Plateau. According to the quick report from the China Earthquake Network Center (CENC), the epicenter of the earthquake was located at (101.26E, 37.77N), with a focal depth of 10 km. It occurred near the Lenglongling fault and the Tuolaishan fault, both of which are recognized to be two large segments of the Haiyuan fault system (Figure 1). According to the field investigations conducted immediately after the mainshock, the whole length of the mapped surface rupture reached ~26 km and the earthquake was dominated by a left-lateral strike-slip motion, with localized and minor thrust components along the ruptures [1].
The Menyuan area is located in the Qilian block on the northeastern margin of the Tibetan Plateau. Due to the ongoing collision between the Indian and the Eurasian plates, the Tibetan Plateau moves northeastward but is blocked by the rheologically strong Tarim basin, the Alxa block and the Ordos block, resulting in the formation of a series of large-scale fault systems with both thrusting and left-lateral strike-slip movements in this area, such as the Altyn fault and the Qilian–Haiyuan fault (Figure 1).
The Qilian-Haiyuan fault system is a large-scale left-lateral strike-slip fault, which is composed of six segments, the Tuolaishan fault, the Lenglongling fault, the Jinqianghe fault, the Maomaoshan fault, the Laohushan fault and the Haiyuan fault, from west to east (Figure 1). The Qilian–Haiyuan fault system governs the tectonic pattern, evolution and earthquake activities along the northeastern margin of the Tibetan Plateau [2,3], and accommodates the spatially varied collision and compression between the Tibetan Plateau and the Alxa block [4,5]. It is thus one of the most active and important fault systems on the northeastern edge of the Tibetan Plateau.
Ubiquitous active structures (faults, folds and mountains) are developed in this area, and the accumulated significant tectonic strain are released via large earthquakes. Interestingly, the 2016 Ms6.4 Menyuan earthquake with the dominant thrust component occurred only ~40 km to the east of the 2022 Menyuan earthquake. In between the 2016 and 2022 earthquakes, the 1986 Ms6.4 earthquake likely filled the gap between two ruptured segments. Although both the 2016 Menyuan earthquake and the 1986 Wuwei earthquake are close to the 2022 Menyuan earthquake (<40 km), the focal mechanisms are remarkably different, implying significant partitioning due to oblique collision between adjoining blocks. Neither of these two earthquakes ruptured to the surface, only the 2022 Menyuan earthquake broke the surface and connected the Lenglongling and Tuolaishan faults, giving us a good opportunity to study the structure of the two faults.
On the Qilian–Haiyuan fault system, the 1920 M > 8 Haiyuan earthquake and the 1927 M > 8 Gulang earthquake (Figure 1) caused numerous casualties and collapse of houses [4,6]. The geometrically complex fault systems in this area at the junction of blocks have attracted extensive attention [7]. Some previous studies, including the rupture model of historical earthquakes [8,9], the co- and post-seismic Coulomb failure stress evolution associated with historical earthquakes [10] and the extensive studies of fault coupling distributions [11], consistently shows that the Qilian–Haiyuan fault system, especially the ‘Tianzhu’ seismic gap, has a high seismic potential. Four large-scale asperities are resolved by geodetic observations along the Qilian–Haiyuan fault system [12], although such results do not account well for the complex fault geometries in the area. Two of them are situated on the Tuolaishan fault and another one is located on the Lenglongling fault, indicating considerable strain accumulation. According to the focal mechanisms provided by USGS, the hypocenter of the 2022 earthquake is close to an asperity to the east of the Tuolaishan fault. Some worldwide studies have obtained detailed rupture behavior of earthquakes through inversion of the rupture process, such as 2011 Tohoku-oki earthquake [13], 2020 Samos earthquake [14], 2021 Maduo earthquake [15], which is helpful to provide a research basis for tectonic stress and risk assessment in this area.
According to the quick report from the USGS and field investigations [1], the 2022 Menyuan earthquake ruptured the Lenglongling fault and bifurcated on the west side of the Lenglongling fault, turned ~25° south to the eastern part of the Tuolaishan fault, supporting the notion that the two faults are geometrically connected. Bifurcation of slip is a common feature of a number of continental strike-slip earthquakes, such as 1999 M7.1 Hector Mine [16], 2002 M7.9 Denali earthquake [17] and 2019 M7.1 Ridgecrest earthquake [18]. To better understand the kinematic characteristics of the Qilian–Haiyuan fault system, and to analyze the rupture process of the 2022 Menyuan earthquakes, it is imperative to perform detailed rupture process inversion. Near-field InSAR measurements and far-field teleseismic waveforms are often combined for the joint inversion of rupture process [19,20]. InSAR measurements are characterized by high density along with high precision, which can well constrain the coseismic slip distributions and maximum slip value, especially on the shallow portion of the fault, whereas InSAR data are not capable of resolving the dynamic rupture, because its temporal resolution is limited. Teleseismic data involves both temporal and spatial information, which are suitable for constraining the rupture process of earthquakes. However, for minor and moderate earthquakes, whose amplitude is relatively small, high-frequency information within teleseismic wave data can be easily lost due to the effect of ground filtering and the pollution by noise during traverse of wave in the crust.
Studies on the 2022 Ms6.9 Menyuan earthquake is mostly based on InSAR observations and field investigations, which are used to probe the slip distribution [1,21,22,23]. The detailed rupture process of this earthquake has not been well examined. In this work, we derived the rupture process of this earthquake using InSAR measurements and accelerogram data. The InSAR data are capable of constraining the pattern of slip distribution and the amplitude. The accelerogram data, which are used to obtain displacement waveform, include the evolution of the dynamic rupture. It also retains the high-frequency information of seismic waves, which can be used to invert the details of the rupture process more accurately. Then, we proceeded to study the rupture behavior and formation causes of the 2022 Menyuan earthquakes on the geometrically complex causative faults. We ultimately calculated the stress perturbations to the surrounding crust informed by the Coulomb stress change based on the preferred coseismic slip model of this earthquake. Our result helps to better understand the kinematics surrounding the Lenlongling fault and has implications for the seismic hazard in this seismically active area.

2. Data and Methods

2.1. InSAR Data and Processing

The ascending and descending unwrapped interferograms of the 2022 Menyuan earthquake were downloaded from the COMET-LiCSAR website https://comet.nerc.ac.uk/earthquakes/us7000g9zq.html (accessed on August 1, 2022), which were processed by the GAMMA2016 software developed by GAMMA Remote Sensing Research and Consulting AG corporation, Swiss. [24]. We use the interferogram formed by the acquisitions on 20220105 and 20220117 from the ascending track and the interferogram formed by SAR images on 20,211,229 and 20220110 from the descending track (Figure 2). The extent of InSAR observations fully cover the seismic area of the Menyuan earthquake. We converted the unwrapped phase into the line-of-sight (LOS) displacement for ascending and descending observations. We subsequently performed quadtree sampling on the displacement field to reduce the number of data points and to improve the efficiency of inversion. We noted a serious phase incoherence in the very near-field area of the fault (Figure 2). Thus, the pixels in the near-fault incoherent area were masked, and the sampled displacement fields are shown in Figure 2.
The coseismic displacement field obtained from the Sentinel-1 SAR images shows that the maximum LOS displacement from the ascending track is −57 cm on the southwestern side of the fault, and the maximum LOS displacement from the descending track is 60 cm to the southwest of the fault. The phase discontinuities due to large displacement gradients of InSAR measurements suggest the trace of surface rupture with an overall trend of NW-SE. Overall, the deformations on both sides of the fault are symmetrical. A bifurcation with location marked by a red ellipse in Figure 2c can be identified at the western end of the surface rupture, indicating a complex fault geometry.

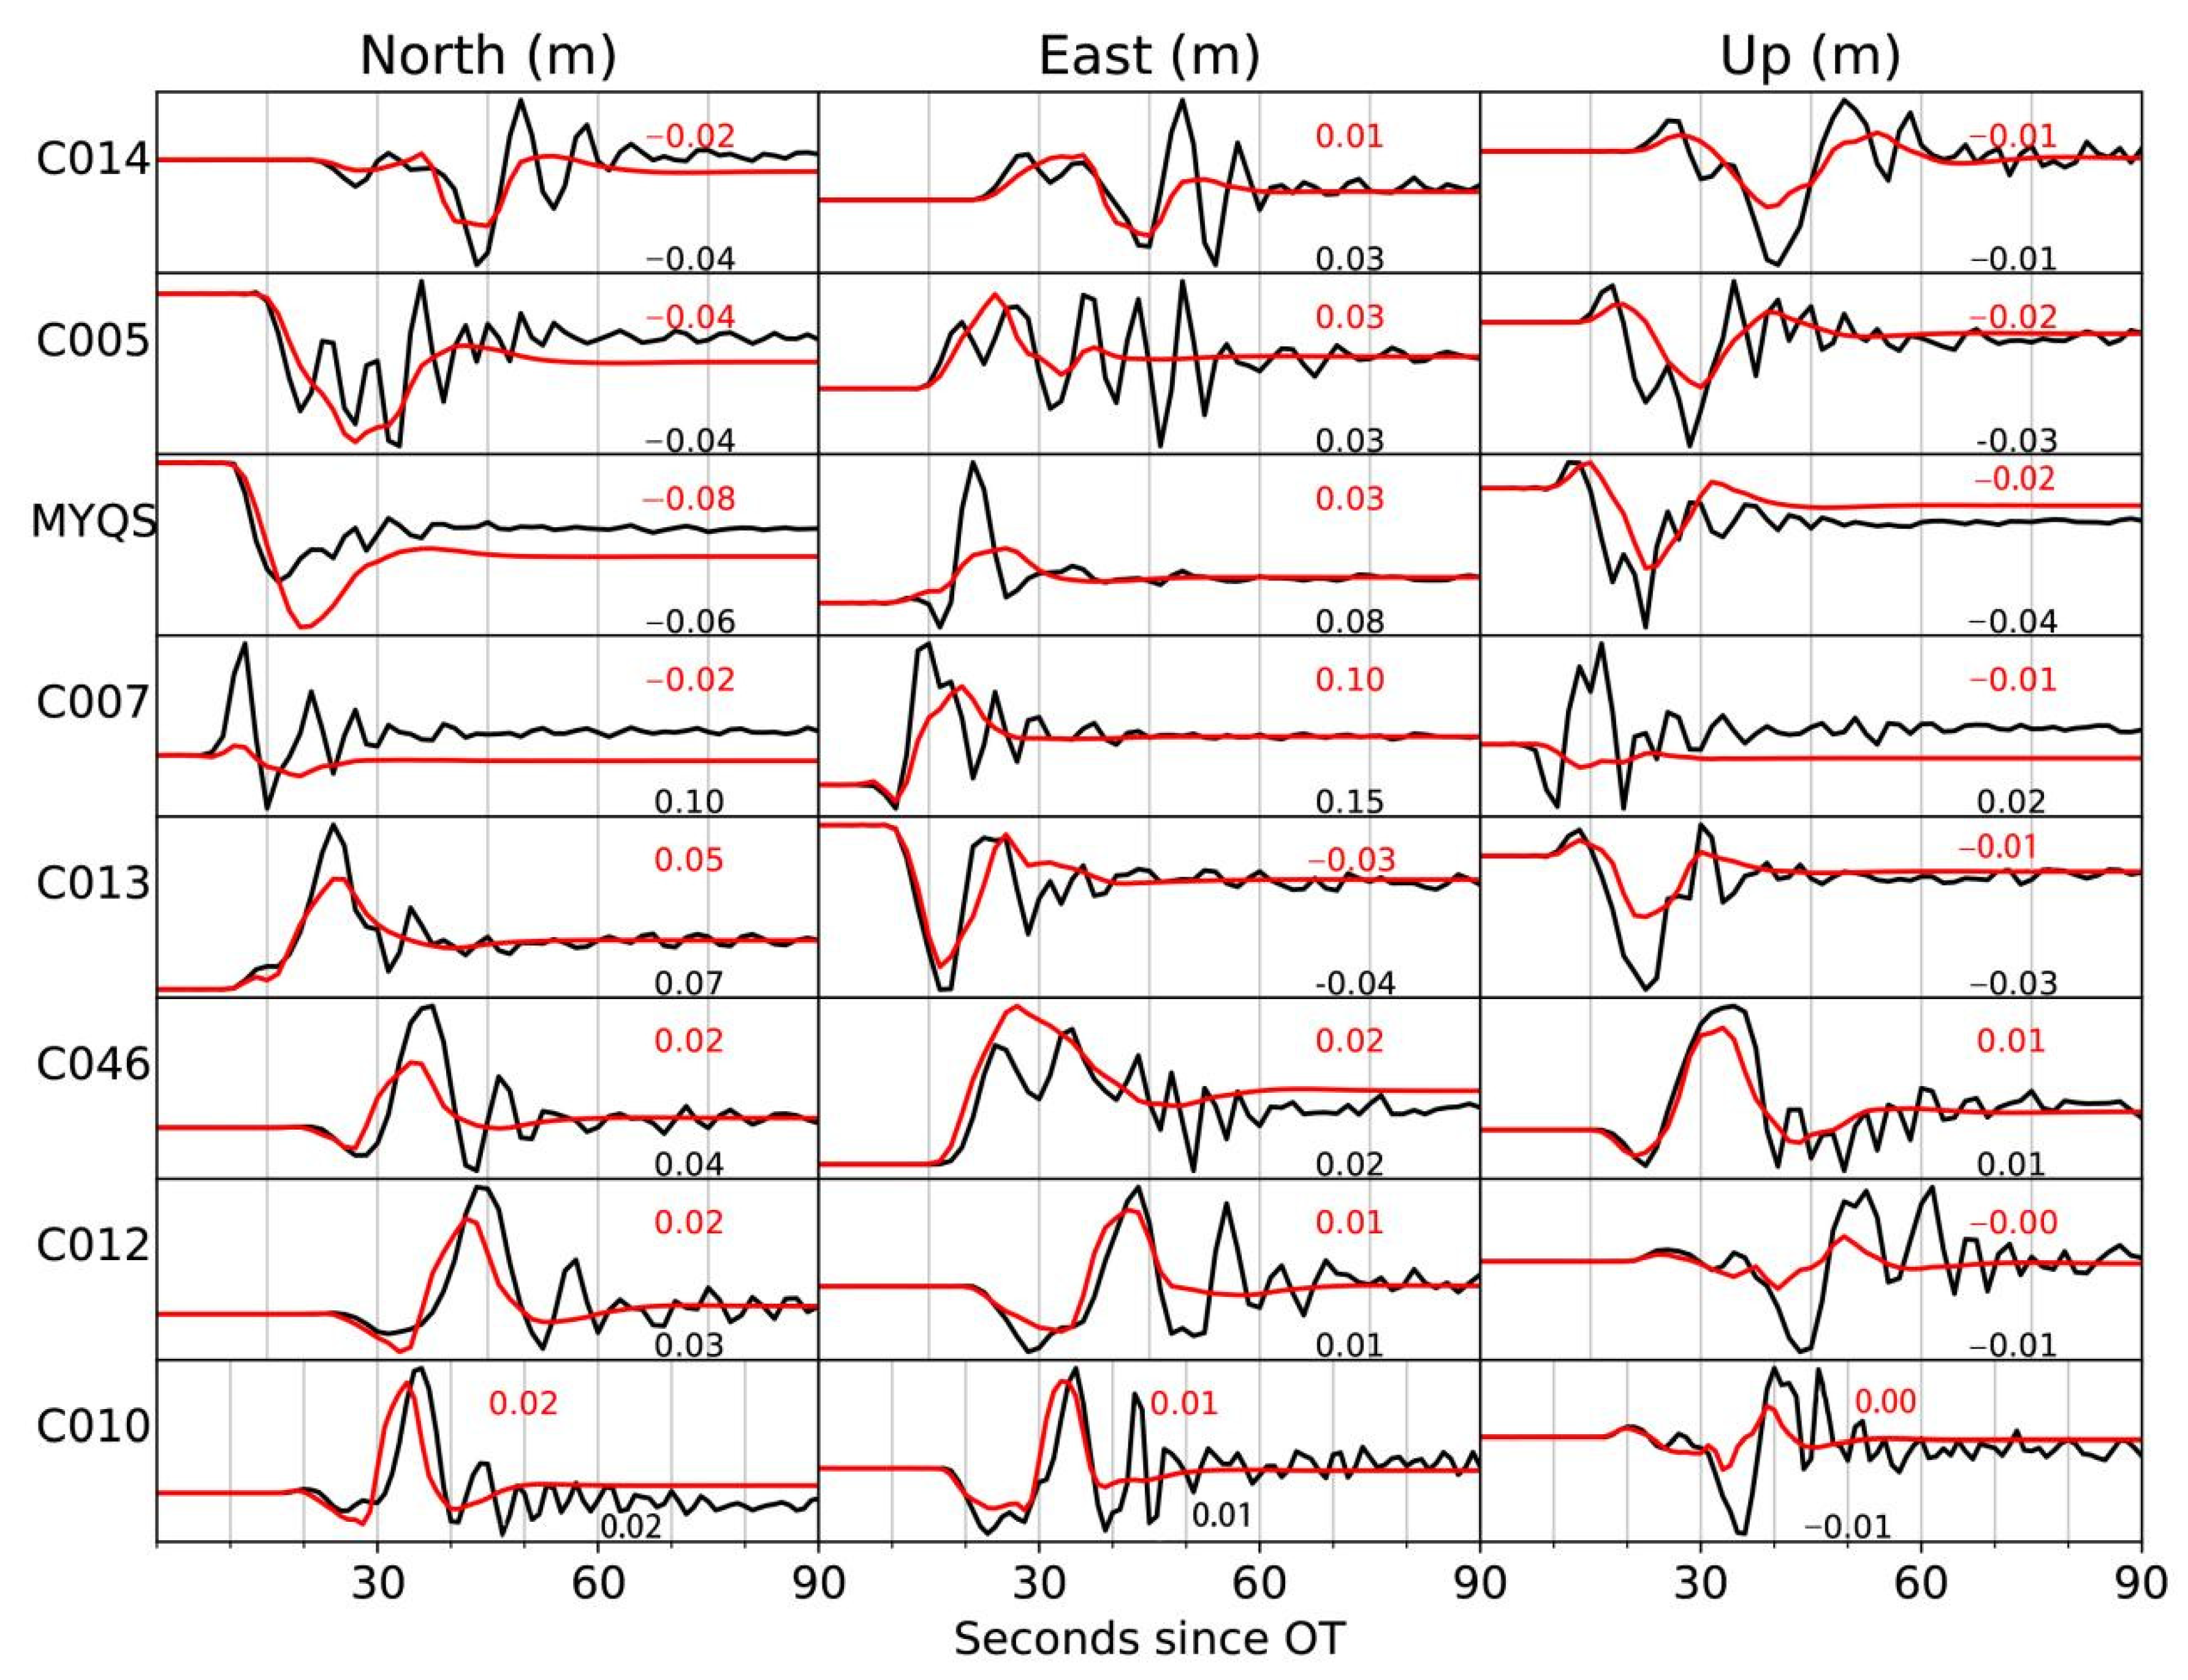
2.2. Baseline Correction of Accelerogram Data

We collected 31 intensity meters installed around the 2022 Menyuan earthquake, mostly in the far-field of the fault (Figure 1). Considering the distance from the station to the epicenter and the quality of accelerogram recorded at stations, a total of 24 acceleration components from 8 stations (Figure 1 and Figure 2) were selected to resolve the rupture process. The distance from each station to the epicenter ranges from 25 to 100 km.
Prior to utilization of the accelerogram data for inversion, we converted the acceleration waveforms into displacement waveforms. We note that the direct integrating of the acceleration measurements by twice will lead to a significant baseline drift, which was caused by dynamic movements of rotation and translation. As a consequence, we performed baseline correction to mitigate such effect [25,26]. We used three components of acceleration records at 8 stations to perform automatic empirical baseline correction through the SMBLOC software developed by Professor Wang Rongjiang of GFZ to obtain reliable displacement waveforms [27]. We illuminate the result at one of the stations, C007 (marked in Figure 1), which is closest to the epicenter (25 km), in Figure 3. The total static deformation was ~5.4 cm. We find that the motion at this station was dominated by eastward movement by inspecting the static displacement, which was in line with the characteristics of the southward movement of a left-lateral strike-slip fault. The waveform of the accelerogram indicated that the duration of the earthquake was about 16 s (Figure 3).
In order to validate the reliability of the derived displacement waveforms after baseline correction, we extracted the three-component static displacement recorded at each station, and projected them into the line-of-sight (LOS) direction of the InSAR observations on both ascending and descending tracks using the following formula:
a = b · e
where b is the vector of the static displacement of the waveform, e is the unit vector of the LOS direction of the InSAR observations on ascending or descending tracks. Eight pixels in the InSAR displacement field were extracted and averaged at each position of the station. The resultant comparison is demonstrated in Figure 4. We found that the LOS-converted static displacement after baseline correction was in good agreement with the InSAR observations. The largest difference was observed at the station, C007, with the largest displacement difference of ~0.9 cm. The error of InSAR is also millimeter level, so we consider the station C007 with the largest error to be within the normal observational uncertainty [28]. We therefore confirm the consistency between the two types of data and the good quality of our accelerogram observations. Accelerogram data, which retains the high-frequency information of seismic waves, has not been formally used for the inversion for the dynamic inversion of the 2022 Menyuan earthquake. It can use to get details of the rupture process.

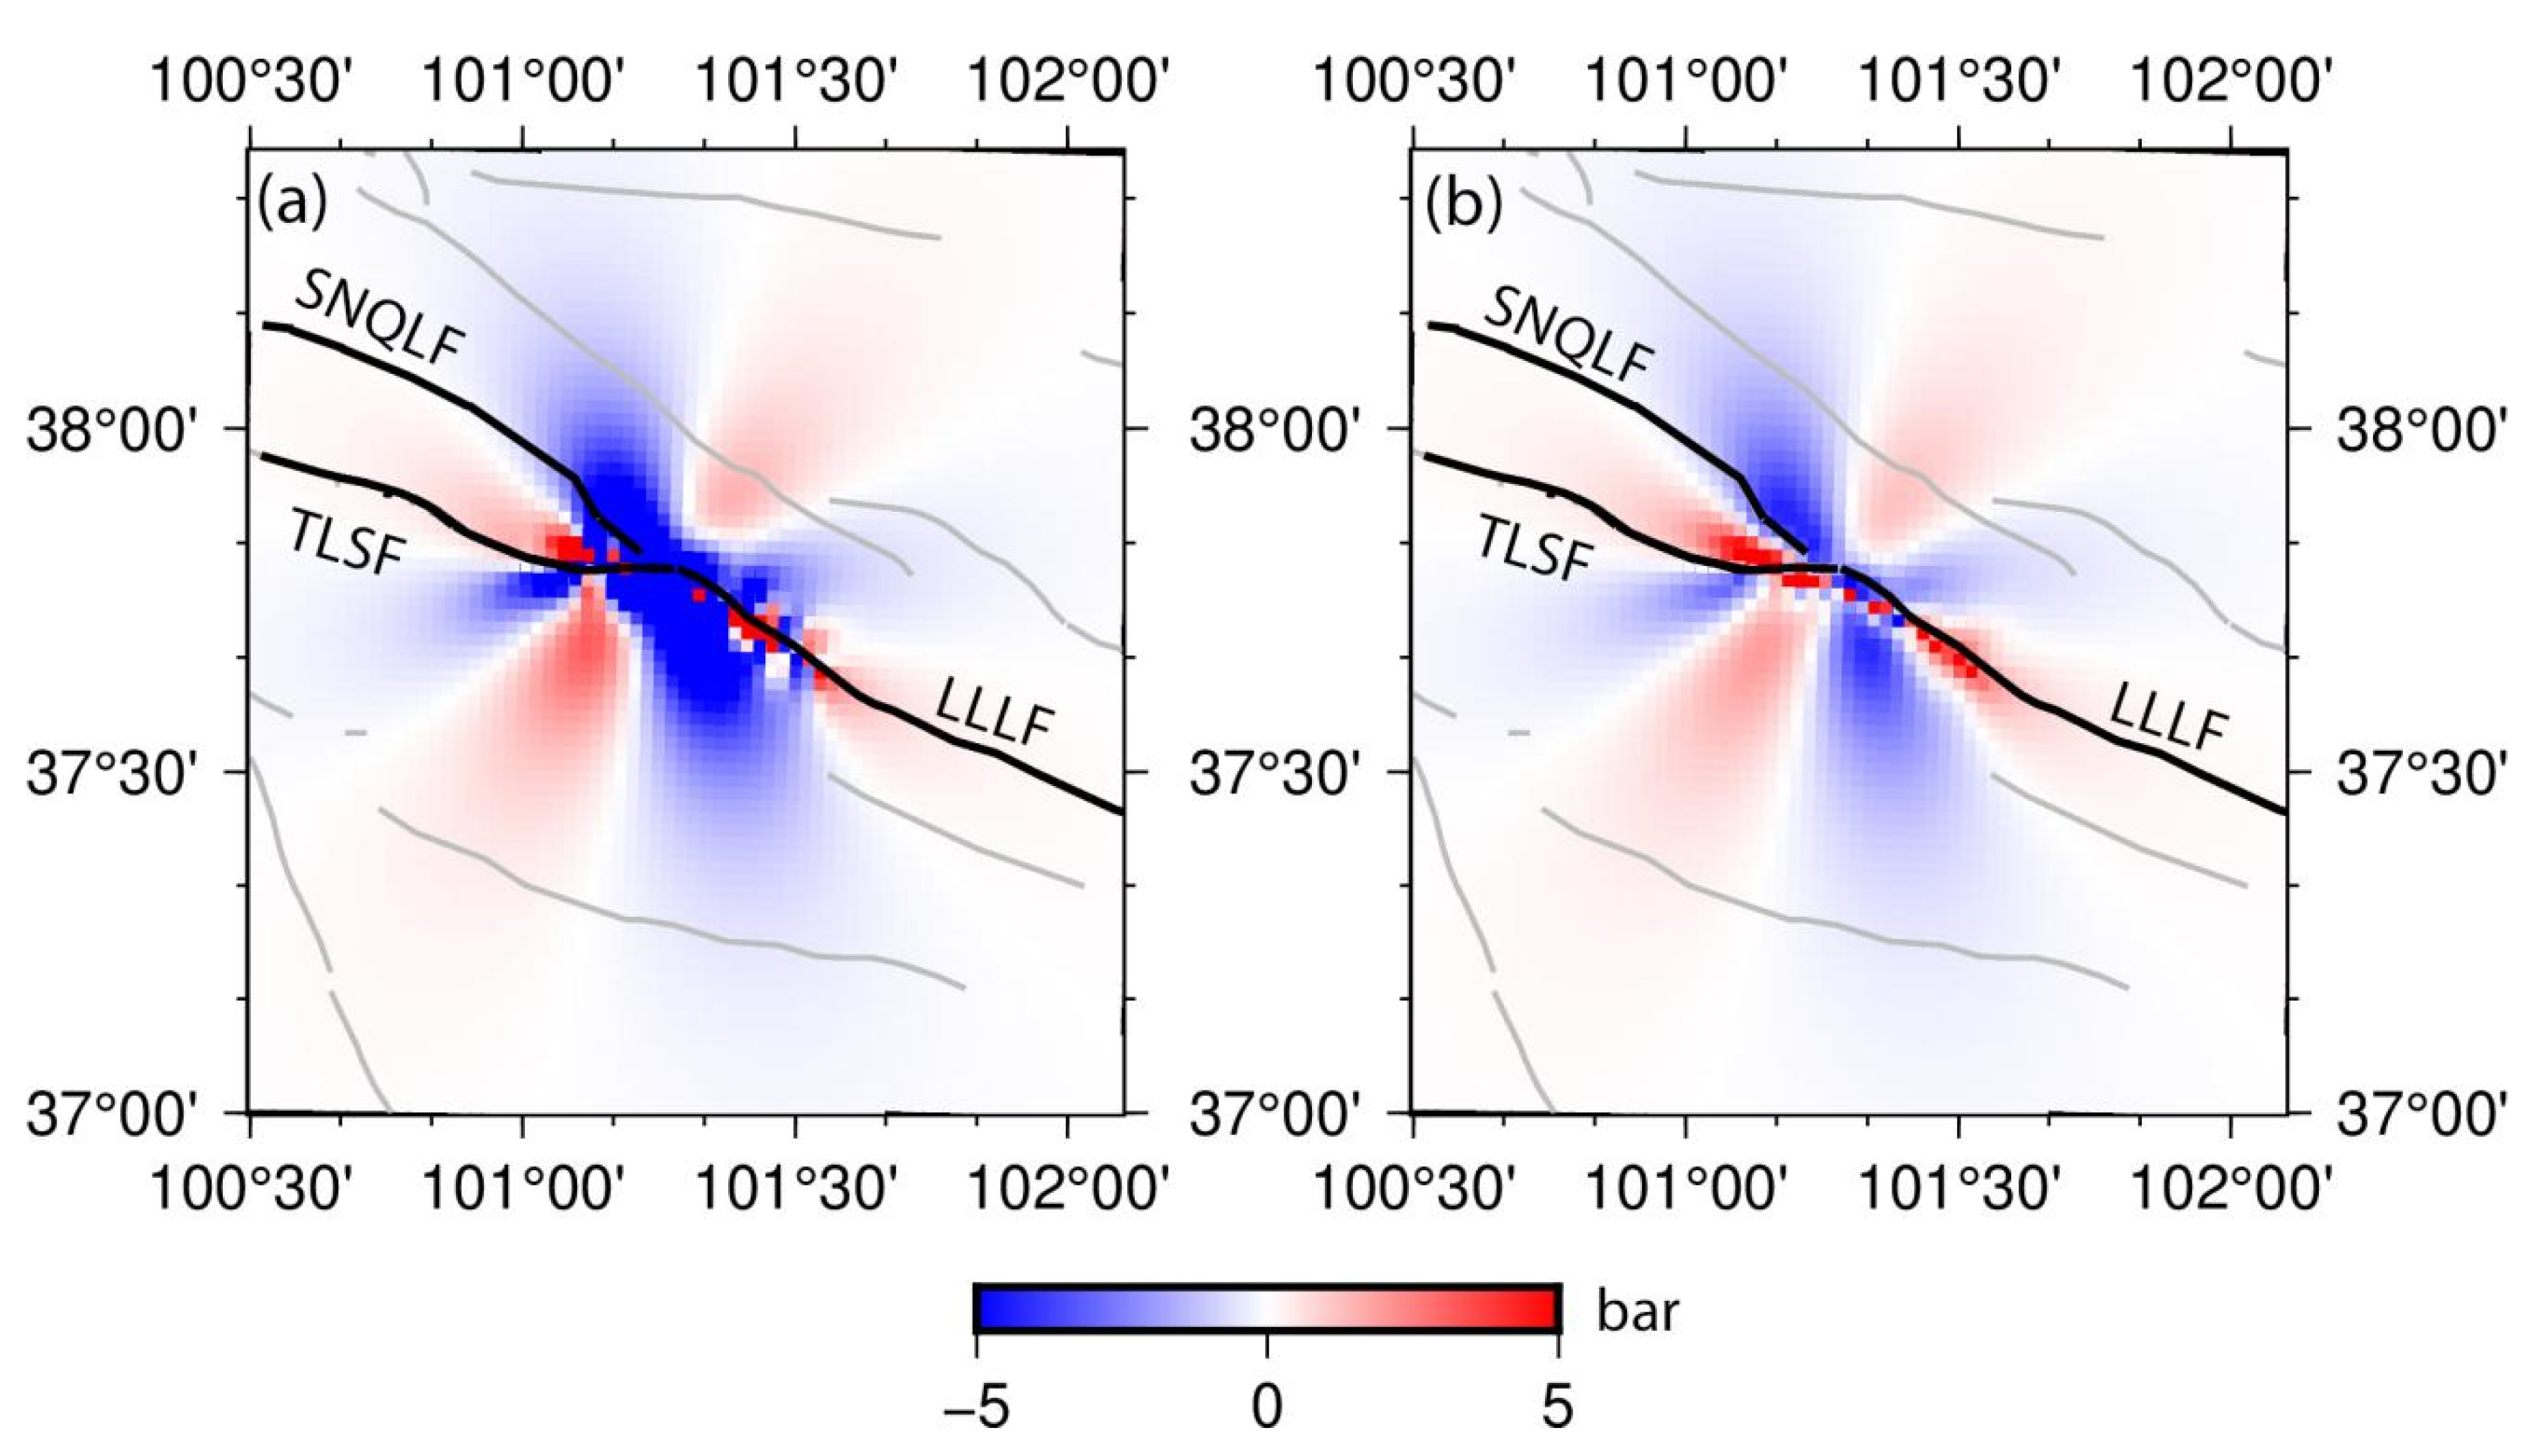
2.3. Coulomb Stress Change Calculation Method

After obtaining the best-fitting slip distribution, we used the Coulomb3.3 software developed by U.S. Department of the Interior and U.S. Geological Survey to conduct Coulomb stress change analysis [29]. In our analysis, we inputted the slip distribution from the joint inversion as the source, and we used the Tuolaishan fault and the Lenglongling fault as the receiving faults (strike: 120°, dip: 90°, rake: 0°). We calculated the static Coulomb stress change CFF caused by the 2022 Menyuan earthquake at depths of 5 and 10 km, respectively. The CFF   with simplifying assumptions to account for pore pressure effects is [30]:
CFF = τ +   u σ n
where τ is the shear stress change on a given fault plane, σ n is the fault-normal stress change and   u is the friction coefficient. Poisson’s ratio was set to be 0.25 and the friction coefficient was set to be 0.4. Based on the slip distribution calculation, the Coulomb stress changes in the surrounding area caused by the 2022 Menyuan earthquake were obtained, and we analyze the stress perturbations of this earthquake on the surrounding areas.

3. Rupture Process Inversion

3.1. Fault Geometry

Due to the fact that InSAR observations of the 2022 earthquake suffered from large-area near-fault decorrelation (Figure 2), we were impeded to remotely map the surface rupture trace by InSAR observations only. Alternatively, we relied on the trace of surface rupture from optical image cross correlation of the Gaofen-7 data to build our fault geometry (Figure 5). Informed by the field investigations [1,21], coseismic rupture of the 2022 earthquake had generated identified and traceable surface ruptures, which could be mapped by clear displacement discontinuities in the optical image correlation results. In addition to the relatively long main fault strand, a small-scale secondary fault (~4 km) with a nearly EW-trending could be identified at the western end, which was clearly observed in the InSAR deformation field (Figure 2). This secondary fault was geometrically connected to the main fault, generating a bifurcation at the western end of the rupture.
Through a guided trial and error approach, we found that the model predictions obtained by using a single main fault geometry cannot match the observed data (Figure 6), with large residuals concentrated along the secondary fault to the west. Li Zhenhong et al. set the inversion model as two straight faults based on the surface rupture results of optical interpretation and InSAR co-seismic deformation field. Luo Heng et al. used six straight faults to approach the surface trace mapped from SAR pixel offsets [22,31]. Therefore, we used rupture traces to generate a more complex fault geometry that includes both the main and secondary faults. Yang et al. (2022) generated a relocated aftershock catalog for this earthquake and they found that most of the aftershocks were distributed on the southern side of the fault (Figure 5a) [23]. Projecting all the aftershocks to the profiles perpendicular to the fault strike clearly showed a south-dipping fault geometry (Figure 5b). As a result, we simplified the seismogenic fault with a near-vertical south-dipping fault geometry, as indicated in Figure 5b. Through the grid search method, we also relied on the InSAR data only to test the potential influence from dip angle variations in the range of 80–90 degrees. The best fit dip angle of the fault was determined at 82 degrees, which was inputted in our subsequent dynamic rupture modelling. We fixed the base depth of the fault at 20 km depth because the distribution of aftershocks of the 2022 Menyuan earthquake is basically above 20 km (Figure 5), and we fixed the length of the fault at 40 km for the main fault and 10 km for the secondary fault because the length of rupture trace for optical identification and field investigation was about 26 km (Figure 5). We discretized the main and the secondary fault into patches with a dimension of 2 by 2 km and we have 250 patches in total.

3.2. Inversion Method

We used the Mudpy code package developed by Melgar and Bock (2015) to invert the rupture process of the 2022 Menyuan earthquake [32]. This approach was based on the linear multi-time window inversion method [33]. This method allows the fault patches to slip by multiple times, which enables us to simulate more complex source time functions and to achieve variable rupture velocities. This method requires a prescribed one-dimensional velocity model, the geometry of the fault, and the location of the hypocenter. For the velocity model, we used the velocity structure in the Menyuan area from the Crust1.0 model [34]. We discreted the whole fault according to the aforementioned fault geometry incorporating both the main and secondary faults. The location of the hypocenter, given by the China Seismological Network (CSN), was (101.26E, 37.77N, 10 km), while the location of the hypocenter given by the USGS is (101.266E, 37.784N, 6 km). We noted a difference of up to 4 km in depth between the two reports. Based on the formal tests, we found that the adoption of the focal depth of 6 and 10 km in inversions leaded to no diagnostic discrepancy in the data fitting of InSAR and displacement waveform. For the prescribed initial source location from the USGS and CSN, however, the final source time function had remarkable variations, and the ruptures all started at a depth of about 8 km, indicating that the inversion is not very sensitive to the initial source location. We therefore determined the focal mechanism as (101.26E, 37.77N, 8 km) in this inversion. We used the relative method to determine the weight of acceleration data and InSAR measurements. Firstly, the weight of InSAR measurements was assumed to be 1. By constantly testing the weight of acceleration data, we find that when the weight of acceleration data is 5, the residuals of both types of data are relatively low, In the end, the weight ratio between the acceleration data and the InSAR data is 5:1.
We calculated the Green’s functions by the frequency wavenumber integration method developed by Zhu et al. (2002), using six time windows with a rise time of 2 s [35]. The average rupture velocity given by USGS was 2.38 km/s. Informed by several formal tests, we found that the data fitting could not be significantly improved if the rupture velocity exceeds 3 km/s. Therefore, it was reasonable to prescribe the rupture velocity to be 3 km/s. We evaluated the data fitting using root mean square (RMS), as defined by:
RMS = i = 1 N ( d obs i d syn i ) 2 N
where d obs is observation vector and d syn is the model prediction vector at ith stations or pixels ( N in total). A scalar seismic moment minimum constraint is used to find a first-order norm minimum solution. The smoothness constraint in the inversion was performed using Tikhonov spatiotemporal regularization, and the optimal regularization parameter was determined according to the ABIC (Akaike’s Bayesian information criterion) criterion [33]:
ABIC = 2 × logL ( σ 2 , σ 1 2 , σ 2 2 )
where σ is covariance of the error Gaussian distribution, σ 1 and σ 2 are the covariance of smoothing of the temporal and spatial constraint.

4. Inversion Results

The best-fitting spatiotemporal distribution and evolution of the dynamic slip was obtained by the linear multi-time window method mentioned in the previous section. Figure 7 shows the comparison between inversion results constrained by accelerogram data only (Figure 7a,b), InSAR data only (Figure 7c,d), and a joint inversion of two types of data (Figure 7e,f). All three inversion results showed that the earthquake was dominated by a left-lateral motion, with a small amount of thrust component, with good consistency. The maximum slip value of the three inversion results is about 3.8 m. The inverted slip distribution using the accelerogram data only had a slip of >1 m in the uppermost potion of the fault. The inverted coseismic slip constrained by the accelerogram data were mainly concentrated on the southeast side of the hypocenter at a depth of ~9 km. InSAR data could provide the dense and high-precision near-field observation and a good constraint in the shallow portion of the fault. According to the inversion results obtained by InSAR data alone, the coseismic slip broke the surface, and the large slip was mainly concentrated at the depth of <6 km with the maximum slip of ~3.9 m at 4 km depth. By comparing the inversion slip distribution results using acceleration data alone and InSAR data alone with the field survey results, we believe that InSAR data has higher resolution for near-field slip distribution.
The distribution of coseismic slip from the joint inversion was similar to that using the InSAR data alone, mainly concentrated <6 km, and the surface rupture is ~26 km. The maximum slip of 3.8 m is located at a depth of 4 km. In the joint inversion, the two types of data complemented each other and could improve the accuracy of the inversion results. We found a large-scale deepening of coseismic slip depth on the secondary faults (Figure 7), which is obvious in the results using accelerogram data alone (Figure 7a) and joint inversion (Figure 7e).
Figure 8 shows the rupture process from the joint inversion with a time interval of 2.3 s. The rupture nucleated at the hypocenter, and propagated both updip and bilaterally along the strike in the first 2.3 s. From 2.3 to 4.6 s and from 4.6 to 6.9 s, the dynamic rupture broke the surface, and continued to propagate bilaterally along the strike. The rupture at the western bifurcation propagated mainly along the secondary fault.
The moment rate reached their peaks at about 5 s after the nucleation, then the energy release rate began to decline. The duration of the whole rupture was about 14 s in the Menyuan earthquake. Concentrated slip areas are mainly located at 0–6 km depth and the length of the whole rupture is estimated to be ~14 km. It can be seen from the seismic moment rate graph that 90% of the energy was released in the first 10 s (Figure 8). The total seismic moment was estimated to be ~1.3 × 1 × 1019 N·m, equivalent to a moment magnitude of Mw6.7, consistent with the estimates of the moment magnitude from the USGS.
The fitting to the displacement waveform data is shown in Figure 9. In general, the model predictions fitted well with the observation. Particularly, the calculated displacement waveforms at three selected stations in the near-field, C007, C013, and MYQS, also satisfactorily fitted the observed displacement waveforms. However, the static displacement fitting at the NS component at the station C007 and the NS component at the station MYQS was relatively poor. Additionally, the model predictions matched the InSAR deformation field well (Figure 10).
Numerous previous studies have provided evidence for the static or dynamic triggering relationship between earthquakes [36,37,38]. After a strong earthquake, the Coulomb failure stress change would either promote or hold back the occurrence of earthquakes in surrounding areas, depending on the stress state and the geometry of the surrounding faults. Figure 11 shows the spatial distribution of the Coulomb failure stress change in the Menyuan area at 5 and 10 km depth. The positive values represent stress loading, indicating that the possibility of future earthquakes may increases. We identified four areas with positive Coulomb stress changes. Two are on the northeast and southeast sides, and the other two are on the northwest and southwest sides. The magnitude of the Coulomb stress change at a depth of 5 km is larger than that at a depth of 10 km. The Sunan-Qilian fault is located in the region of Coulomb stress unloading, indicating that the 2022 Menyuan earthquake did not increase the seismic risk of Sunan-Qilian fault. The Tuolaishan fault to the west and the Lenglongling fault to the east are located in the increased Coulomb stress region, and we posit that the risk of future earthquakes likely increases, which requires continued attention to the area.

5. Discussion

As they are inexpensive and easy to maintain, intensity meters and strong motion station are widely distributed in tectonically active areas around the world. The empirical baseline correction method can quickly obtain the velocity and displacement waveforms from the acceleration waveforms. When an earthquake comes, the velocity and displacement information can be quickly obtained by the above method, so as to obtain the earthquake magnitude, fault geometry, source rupture process and other information. The joint inversion of InSAR data and acceleration data can complement each other to obtain a more accurate rupture process. The reliability of the inversion results is affected by many factors, such as model simplification and data quality. According to field investigations, the surface rupture was observed and measured to be roughly ~26 km, but the inversion results using the acceleration data alone indicate that the surface rupture is nearly 40 km. This discrepancy showed that the resolving power of accelerogram data at the shallow depth of the fault is limited (Figure 7b). We noted the slip deepening on the northeastern edge of the secondary fault, which is likely to be a false signal. The possible reason is that the multi-fault geometry failed in smoothing at the fault junctions during our waveform inversion. Therefore, the slip deepening on the secondary fault is the most pronounced when inversion was constrained by accelerogram data alone. The main fault slip distribution is compared with the results of field investigation, and InSAR data of shallow slip distribution has the very good constraint, and we believe that the slip distribution constrained by InSAR data has higher credibility, as its maximum slip is around 4 km depth. Furthermore, there is a slip deficit, which is a common phenomenon in strike-slip earthquakes.
In the waveform fitting, the overall fitting is good, but we can still see that the predicted waveform frequency and the peaks and troughs are lower than the observed waveforms (Figure 9). Four reasons accounted for the relatively poor fitting of the displacement waveforms at these stations. First, the displacement waveform was obtained by baseline correction of the acceleration data. That was achieved by an automatic scheme for an empirical baseline correction. Empirical methods aimed to estimate the baseline shift based on the abnormal behavior of the uncorrected velocity or displacement history after integration, without any assumption related to the physical sources of the baseline shift. This kinematic simplification could lead to the discrepancy between the observed and calculated waveforms [27]. Second, the acquisition frequency of the accelerometer was 200 Hz, and low-pass filtering is performed at 1 Hz. As a result, the observed waveform had more high-frequency information than the model prediction. Third, in the joint inversion of InSAR and accelerometer data, the inversion result is a compromise between the two data sets. In addition, the smoothing constraints would lead to model uncertainties. Fourth, the model we established is an over-simplification of faults in nature, such as fault geometry and velocity of crustal layers. That likely produced inconsistencies between inversion results and the observations. We also noted that the largest residuals of the best-fitting model were mainly distributed near the fault rupture trace (Figure 10), which may be due to the error caused by over-simplification of the near-surface fault geometry and large unwrapping uncertainties in the near-fault regions in InSAR measurements.
The 2022 Menyuan earthquake occurred at the junction area between the Tuolaishan fault and the Lenglongling fault. Even though the 2022 Menyuan earthquake produced observable surface ruptures, its source fault is not straightforward to identify based on these discontinuous surface ruptures alone. According to the results of field investigation, the 2022 Menyuan earthquake ruptured the two disconnected faults, the Tuolaishan fault and the Lenglongling fault (Figure 5a). When we use single faults in modeling, we noted large residuals near the secondary Tuolaishan faults (Figure 5). When we included a secondary fault representing the Tuolaishan fault to the west of the main fault, the data fitting of InSAR has improved significantly. In addition, the historical seismicity in the Menyuan area, including the 2022 Menyuan event, along with the 1986 and 2016 Menyuan quakes, clearly showed the connectivity of the two faults. In a data-driven perspective, we conclude that both the Tuolaishan fault and the Lenglongling fault were coseismically involved in the 2022 Menyuan earthquake.
Our results confirm that the 2022 Menyuan earthquake ruptures two fault segments. There are two possible reasons for the multi-segment rupture during the 2022 Menyuan earthquake at the bifurcation. One is that the stress perturbation generated by the rupture accumulates at the bifurcation, causing the rupture to propagate in the direction of the Tuolaishan fault. Another reason may be that the Tuolaishan fault and the Lenglongling fault are connected directly, and the 2022 Menyuan earthquake just ruptured the fault to the surface. At present, there are few geologic studies focusing on the Tuolaishan fault and the Lenglongling fault, due to the fact that the late Quaternary strata are not very developed [5]. The interseismic slip rate, based on interseismic observation of the Tuolaishan fault is estimated to be 3.7 ± 0.2 mm/yr, while the slip rate of the Lenglongling fault is 4.6 ± 0.2 mm/yr [39]. Differences in the parameters of the two faults indicate that they do not belong to the same fault. Therefore, we believe that the reason why the rupture turns southwards 25° along the Tuolaishan fault is that the stress accumulates in this direction, which is different from the direction of Lenglongling fault [31]. The model proves that the Tuolaishan fault and the Lenglongling fault are more likely to be directly geometrically connected. This implies that the westward extension of the Haiyuan fault system will bend at the Lenglongling fault and follow the Tuolaishan fault, rather than directly along the Sunan-Qilian fault.
In the past 40 years, several moderate and strong earthquakes have occurred along the Haiyuan fault system, including the Ms6.4 earthquake in 1986 and the Ms6.4 earthquake in 2016 (Figure 1), indicating that this region is highly active [40,41,42]. These earthquakes are all distributed near the western section of Lenglongling, which is located in the “Tianzhu earthquake gap” (Figure 1). Geodetic studies constrained by GPS velocities spanning the 1997–2007 shows that the Tuolaishan fault, the Lenglongling fault, and the Jinqianghe fault in the western segment of the Qilian-Haiyuan fault zone are strongly locked (>0.8), with a locking depth of about 15 km. Among them, the slip rate deficit of the Tuolaishan fault is the largest, reaching 6 mm/yr [11]. The 2016 Ms6.4 Menyuan earthquake produced positive Coulomb stress loading on both the Lenglongling fault and the Tuolaishan fault [22], the Menyuan earthquake in 2022 still produced positive Coulomb stress on the Tuolaishan fault and Lenglongling fault. By calculating the Coulomb stress of co-seismic and post-earthquake relaxation loading near the Tianzhu earthquake gap, it is concluded that the cumulative Coulomb stress loading of the Tuolaishan fault is as high as 1.0 MPa [10]. We noticed that the recent three earthquakes in the Menyuan area all occurred near the Lenglongling fault, which relieved the stress accumulation of the Lenglongling fault to a certain extent. In particular, the main asperity of the 2022 Menyuan earthquake is located in the west of the Lenglongling fault. All pieces of evidences show that the Tuolaishan fault has a high seismic potential and it is necessary to continuously monitor and assess the seismic risk in this area in the future.

6. Conclusions

This study used accelerogram data and InSAR measurements to jointly invert the rupture process of the 2022 Menyuan earthquake. The method of subjecting the acceleration data to automatic empirical baseline correction and then integrating twice to obtain the displacement waveform is very stable. Through the comparison of separate inversion and joint inversion, we found that different data sets have different resolution capabilities. The InSAR data has better constraints on the near surface, and the accelerogram data have better constraints near the focal depth. The fault slip distribution obtained by joint inversion shows that the maximum slip value is 3.8 m at a depth of 4 km. An asperity of 14 by 6 km exists at a depth of 3 km on the main fault. According to the source time function of the joint inversion, the duration time of this earthquake lasted 14 s, 90% of the energy was released in the first 10 s, and the total released seismic moment was 1.31 × 1 × 1019 N·m, equivalent to a moment magnitude of Mw6.7.

Author Contributions

Conceptualization, G.Z. and D.Z.; methodology, C.H. and G.Z.; software, C.H. and N.H.; validation, G.Z., D.Z., C.X., C.Q. and X.S.; formal analysis, C.H. and D.Z.; data curation, C.H. and H.T.; writing—original draft preparation, C.H.; writing—review and editing, C.H., G.Z., D.Z., and X.S.; visualization, C.H., N.H. and J.C.; supervision, G.Z.; project administration, G.Z. and C.Z.; funding acquisition, G.Z., C.Z. and X.S. All authors have read and agreed to the published version of the manuscript.

Funding

This resarch was funded by the National Key Research and Development Program of China (Grant No. 2019YFC1509203 & No. 2019YFC1509205), the Basic Scientific Funding of Institute of Geology, China Earthquake Administration (grant No. IGCEA2005), and the National Natural Science Foundation of China (grant No. U2139202 & 42274046).

Data Availability Statement

The moment tensor solutions of the 2021 Ms 6.9 Menyuan earthquake come from China Earthquake Networks Center (CNEC; https://www.cenc.ac.cn/, accessed on 15 June 2022) and United States Geological Survey (USGS; https://www.usgs.gov/, accessed on 15 June 2022). The InSAR measurement of the 2021 Ms 6.9 Menyuan earthquake come from the COMET-LiCSAR website https://comet.nerc.ac.uk/earthquakes/us7000g9zq.html (accessed on 1 August 2022).

Acknowledgments

Thanks to all colleagues who were involved in the construction, maintenance and data collection at Intensity meters. Thanks to Hongfeng Yang for supporting the relocated aftershock sequence of Ms 6.9 Menyuan earthquake. Mudpy software package comes from https://github.com/dmelgarm/MudPy/. Coulomb3.3 software package comes from United States Geological Survey (USGS; https://www.usgs.gov/). All figures were made using the Generic Mapping Tools (GMT) software package (https://www.soest.hawaii.edu/gmt). All websites were last accessed on 15 June 2022.

Conflicts of Interest

The authors declare no conflict of interest.

References

  1. Liang, K.; He, Z.T.; Jiang, W.L.; Li, Y.S.; Liu, Z.M. Surface rupture characteristics of the Menyuan, M.6.9 earthquake on January 8, 2022, Qinghai Province. Seismol. Geol. 2022, 44, 256–278. [Google Scholar]
  2. Shi, Y.; Gao, Y.; Shen, X.Z.; Liu, K.H. Multiscale spatial distribution of crustal seismic anisotropy beneath the northeastern margin of the Tibetan plateau and tectonic implications of the Haiyuan fault. Tectonophysics 2020, 774, 228274. [Google Scholar] [CrossRef]
  3. Zheng, W.J.; Zhang, P.Z.; He, W.G.; Yuan, D.Y.; Shao, Y.X.; Zheng, D.W.; Ge, W.P.; Min, W. Transformation of displacement between strike-slip and crustal shortening in the northern margin of the Tibetan Plateau: Evidence from decadal GPS measurements and late Quaternary slip rates on faults. Tectonophysics 2013, 584, 267–280. [Google Scholar] [CrossRef]
  4. Gaudemer, Y.; Tapponnier, P.; Meyer, B.; Peltzer, G.; Shunmin, G.; Zhitai, C.; Huagung, D.; Cifuentes, I. Partitioning of crustal slip be-tween linked, active faults in the eastern Qilian Shan, and evidence for a majorseismic gap, the‘Tianzhu gap’, on the western Haiyuan Fault, Gansu (China). Geophys. J. Int. 1995, 120, 599–645. [Google Scholar] [CrossRef] [Green Version]
  5. Lasserre, C.; Gaudemer, Y.; Tapponnier, P.; Mériaux, A.S.; Van der Woerd, J.; Daoyang, Y.; Ryerson, F.J.; Finkel, R.C.; Caffee, M.W. Fast late Pleistocene slip rate on the Leng Long Ling segment of the Haiyuan fault, Qinghai, China. J. Geophys. Res. Solid Earth 2002, 107, ETG 4-1–ETG 4-15. [Google Scholar] [CrossRef]
  6. Hou, K. Characteristics of ground ruptures caused by 1927 Gulang M8earthquake and their causative mechanisms. Seism. Geol. 1998, 20, 19–26. [Google Scholar]
  7. Han, S.; Wu, Z.H.; Gao, Y.; Lu, H. Surface rupture investigation of the 2022 Menyuan MS 6.9 earthquake, Qinghai, China: Implications for the fault behavior of the Lenglongling fault and regional intense earthquake risk. J. Geomech. 2022, 28, 155–169. [Google Scholar] [CrossRef]
  8. Fu, Z.X.; Liu, G.P.; Chen, Q.F. Dynamic analysis on interaction between the Haiyuan-Gulang-Changma great earthquake inthe north boundary of the Tibetan Plateau. Seismol. Geol. 2001, 23, 35–42. [Google Scholar]
  9. Wan, Y.G.; Shen, Z.K.; Zeng, Y.H.; Sheng, S.Z. Evolution of cumulative Coulomb failure stress in northeastern Qinghai-Xizang (Tibetan) Plateau and its effect on large earthquake occurrence. Acta Seismol. Sin. 2007, 20, 117–132. [Google Scholar] [CrossRef]
  10. Zhu, L.; Dai, Y.; Shi, F.Q.; Shao, H.C. Coulomb stress evolution and seismic hazard along the Qilian-Haiyuan faultzone. Acta Seismol. Sin. 2022, 44, 223–236. [Google Scholar] [CrossRef]
  11. Li, Y.; Shan, X.; Qu, C.; Zhang, Y.; Song, X.; Jiang, Y.; Zhang, G.; Nocquet, J.M.; Gong, W.; Gan, W.; et al. Elastic block and strain modeling of GPS data around the Haiyuan-Liupanshan fault, northeastern Tibetan Plateau. J. Asian Earth Sci. 2017, 150, 87–97. [Google Scholar] [CrossRef]
  12. Wang, X.; Zhou, Z.; Xu, C.; Wen, Y.; Liu, H. Dual threshold search method for asperity boundary determination based on geodetic and seismic catalog data. Geod. Geodyn. 2022, 13, 301–310. [Google Scholar] [CrossRef]
  13. Yagi, Y.; Fukahata, Y. Rupture process of the 2011 Tohoku-oki earthquake and absolute elastic strain release. Geophys. Res. Lett. 2011, 38, L19307. [Google Scholar] [CrossRef]
  14. Chousianitis, K.; Konca, A.O. Rupture Process of the 2020 Mw7.0 Samos Earthquake and its Effect on Surrounding Active Faults. Geophys. Res. Lett. 2021, 48, e2021GL094162. [Google Scholar] [CrossRef]
  15. Yue, H.; Shen, Z.K.; Zhao, Z.; Wang, T.; Cao, B.; Li, Z.; Bao, X.; Zhao, L.; Song, X.; Ge, Z.; et al. Rupture process of the 2021 M7.4 Maduo earthquake and implication for deformation mode of the Songpan-Ganzi terrane in Tibetan Plateau. Proc. Natl. Acad. Sci. USA 2022, 119, e2116445119. [Google Scholar] [CrossRef] [PubMed]
  16. Fialko, Y.; Simons, M.; Agnew, D. The complete (3-D) surface displacement field in the epicentral area of the 1999MW7.1 Hector Mine Earthquake, California, from space geodetic observations. Geophys. Res. Lett. 2001, 28, 3063–3066. [Google Scholar] [CrossRef] [Green Version]
  17. Haeussler, P.J.; Schwartz, D.P.; Dawson, T.E.; Stenner, H.D.; Lienkaemper, J.J.; Sherrod, B.; Cinti, F.R.; Montone, P.; Craw, P.A.; Crone, A.J.; et al. Personius. Surface Rupture and Slip Distribution of the Denali and Totschunda Faults in the 3 November 2002 M 7.9 Earthquake, Alaska. Bull. Seismol. Soc. Am. 2004, 94, 23–52. [Google Scholar] [CrossRef]
  18. Jin, Z.; Fialko, Y. Finite Slip Models of the 2019 Ridgecrest Earthquake Sequence Constrained by Space Geodetic Data and Aftershock Locations. Bull. Seismol. Soc. Am. 2020, 110, 1660–1679. [Google Scholar] [CrossRef]
  19. Chen, K.; Xu, W.; Mai, P.M.; Gao, H.; Zhang, L.; Ding, X. The 2017 Mw 7.3 Sarpol Zahāb Earthquake, Iran: A compact blind shallow-dipping thrust event in the mountain front fault basement. Tectonophysics 2018, 747–748, 108–114. [Google Scholar] [CrossRef] [Green Version]
  20. Zhang, G.; Shan, X.; Delouis, B.; Qu, C.; Balestra, J.; Li, Z.; Liu, Y.; Zhang, G. Rupture history of the 2010 Ms 7.1 Yushu earthquake by joint inversion of teleseismic data and InSAR measurements. Tectonophysics 2013, 584, 129–137. [Google Scholar] [CrossRef]
  21. Gai, H.L.; Li, Z.M.; Yao, S.H.; Li, X. Preliminary investigation and research on surface rupture characteristics of the 2022 Qinghai Menyuan Ms 6.9 earthquake. Seismol. Geol. 2022, 44, 238–255. [Google Scholar]
  22. Li, Z.H.; Han, B.Q.; Liu, Z.J. Source Parameters and Slip Distributions of the 2016 and 2022 Menyuan, Qinghai Earthquakes Constrained by InSAR Observations. Geomat. Inf. Sci. Wuhan Univ. 2022, 47, 887–897. [Google Scholar] [CrossRef]
  23. Yang, H.; Wang, D.; Guo, R.; Xie, M.; Zang, Y.; Wang, Y.; Yao, Q.; Cheng, C.; An, Y.; Zhang, Y. Rapid report of the 8 January 2022 MS 6.9 Menyuan earthquake, Qinghai, China. Earthq. Res. Adv. 2022, 2, 100113. [Google Scholar] [CrossRef]
  24. Lazecký, M.; Spaans, K.; González, P.J.; Maghsoudi, Y.; Morishita, Y.; Albino, F.; Elliott, J.; Greenall, N.; Hatton, E.; Hooper, A.; et al. LiCSAR: An Automatic InSAR Tool for Measuring and Monitoring Tectonic and Volcanic Activity. Remote Sens. 2020, 12, 2430. [Google Scholar] [CrossRef]
  25. Lin, Y.; Zong, Z.; Tian, S.; Lin, J. A new baseline correction method for near-fault strong-motion records based on the target final displacement. Soil Dyn. Earthq. Eng. 2018, 114, 27–37. [Google Scholar] [CrossRef]
  26. Boore, D.M.; Stephens, C.D.; Joyner, W.B. Comments on Baseline Correction of Digital Strong-Motion Data:Examples from the 1999 Hector Mine, California, Earthquake. Bull. Seismol. Soc. Am. 2002, 92, 1543–1560. [Google Scholar] [CrossRef] [Green Version]
  27. Wang, R.; Schurr, B.; Milkereit, C.; Shao, Z.; Jin, M. An Improved Automatic Scheme for Empirical Baseline Correction of Digital Strong-Motion Records. Bull. Seismol. Soc. Am. 2011, 101, 2029–2044. [Google Scholar] [CrossRef]
  28. Reeves, J.A.; Knight, R.; Zebker, H.A. An Analysis of the Uncertainty in InSAR Deformation Measurements for Groundwater Applications in Agricultural Areas. IEEE J. Sel. Top. Appl. Earth Obs. Remote Sens. 2014, 7, 2992–3001. [Google Scholar] [CrossRef]
  29. Toda, S. Forecasting the evolution of seismicity in southern California: Animations built on earthquake stress transfer. J. Geophys. Res. 2005, 110. [Google Scholar] [CrossRef]
  30. Cocco, M. Pore pressure and poroelasticity effects in Coulomb stress analysis of earthquake interactions. J. Geophys. Res. 2002, 107, ESE-2. [Google Scholar] [CrossRef]
  31. Luo, H.; Wang, T. Strain Partitioning on the Western Haiyuan Fault System Revealed by the Adjacent 2016 Mw 5.9 and 2022 Mw 6.7 Menyuan Earthquakes. Geophys. Res. Lett. 2022, 49, e2022GL099348. [Google Scholar] [CrossRef]
  32. Melgar, D.; Bock, Y. Kinematic earthquake source inversion and tsunami runup prediction with regional geophysical data. J. Geophys. Res. Solid Earth 2015, 120, 3324–3349. [Google Scholar] [CrossRef]
  33. Ide, S.; Takeo, M.; Yoshida, Y. Source process of the 1995 Kobe earthquake: Determination of spatio-temporal slip distribution by Bayesian modeling. Bull. Seismol. Soc. Am. 1996, 86, 547–566. [Google Scholar]
  34. Laske, G.; Masters, G.; Ma, Z.; Pasyanos, M. Update on CRUST1.0—A 1-degree Global Model of Earth’s Crust. Geophys. Res. Abstr. 2013, 15, 2013–2658. [Google Scholar]
  35. Zhu, L.; Rivera, L.A. A note on the dynamic and static displacements from a point source in multilayered media. Geophys. J. Int. 2002, 148, 619–627. [Google Scholar] [CrossRef]
  36. Stein, R.S. The Role of Stress Transfer in Earthquake Occurrence. Nature 1999, 402, 605–609. [Google Scholar] [CrossRef]
  37. Shan, B.; Zheng, Y.; Liu, C.; Xie, Z.; Kong, J. Coseismic Coulomb failure stress changes caused by the 2017 M7.0 Jiuzhaigou earthquake, and its relationship with the 2008 Wenchuan earthquake. Sci. China Earth Sci. 2017, 60, 2181–2189. [Google Scholar] [CrossRef]
  38. Ji, L.Y.; Liu, C.J.; Xu, J. InSAR Observation and Inversion of the Seismogenic Fault for the 2017 Jiuzhaigou Ms7.0 Earthquake in China. Chin. J. Geophys. 2017, 60, 4069–4082. [Google Scholar]
  39. Huang, Z.; Zhou, Y.; Qiao, X.; Zhang, P.; Cheng, X. Kinematics of the ∼1000 km Haiyuan fault system in northeastern Tibet from high-resolution Sentinel-1 InSAR velocities: Fault architecture, slip rates, and partitioning. Earth Planet. Sci. Lett. 2022, 583, 117450. [Google Scholar] [CrossRef]
  40. Guo, P.; Han, Z.; Gao, F.; Zhu, C.; Gai, H. A New Tectonic Model for the 1927 M8.0 Gulang Earthquake on the NE Tibetan Plateau. Tectonics 2020, 39, e2020TC006064. [Google Scholar] [CrossRef]
  41. Ou, Q.; Kulikova, G.; Yu, J.; Elliott, A.; Parsons, B.; Walker, R. Magnitude of the 1920 Haiyuan Earthquake Reestimated Using Seismological and Geomorphological Methods. J. Geophys. Res. Solid Earth 2020, 125, e2019JB019244. [Google Scholar] [CrossRef]
  42. Wang, H.; Liu-Zeng, J.; Ng, A.H.M.; Ge, L.; Javed, F.; Long, F.; Aoudia, A.; Feng, J.; Shao, Z. Sentinel-1 observations of the 2016 Menyuan earthquake: A buried reverse event linked to the left-lateral Haiyuan fault. Int. J. Appl. Earth Obs. Geoinf. 2017, 61, 14–21. [Google Scholar] [CrossRef]
Figure 1. (a) Major active faults on the northeastern margin of the Tibetan Plateau. ATF: Altyn Tagh fault; KLF: Kunlun fault; QHF: Qianlian–Haiyuan fault. (b) Tectonic setting of the 2022 Menyuan earthquake, gray and purple dots are historical earthquakes. The red star is the epicenter of the 2022 Menyuan earthquake from the USGS. Black triangles are locations of intensity meter used in this study. Thick red line is the Tianzhu seismic gap. SNQLF: Sunan–Qilian fault; TLSF: Tuolaishan fault; LLLF: Lenglongling fault; JQHF: Jinqianghe fault; MMSF: Maomaoshan fault; LHSF: Laohushan fault.
Remotesensing 14 05104 g001
Figure 2. InSAR line-of-sight (LOS) displacement field from ascending (a) and descending (b) tracks with the distribution of intensity meter (black triangles) shown. InSAR LOS displacement field of ascending (c) and descending (d) tracks sampled by quadtree. The black lines mark the surface trace of the fault hosing the Menyuan earthquake. Red ellipses mark the fault bifurcation at the western end of the rupture.
Remotesensing 14 05104 g002
Figure 3. (a) Three components of accelerogram at the station, C007 (see location in Figure 1). (b) The effect of baseline correction for displacement waveform at the same station, C007 as (a). Solid lines are the displacement waveforms after baseline correction, and dashed lines are the displacement waveforms without baseline corrections. Two black vertical lines mark the start and end time of the 2022 Menyuan earthquake.
Remotesensing 14 05104 g003
Figure 4. Comparison of static displacement between InSAR and accelerogram data projected in the line-of-sight (LOS) direction. The red shows the observation from InSAR ascending track and the black demonstrate the observation from InSAR descending track. The numbers in the figure correspond to the distance from each station to the epicenter.
Remotesensing 14 05104 g004
Figure 5. Fault surface trace and relocated aftershocks distribution. (a) Optically recognized surface rupture trace (red line), surface trace of fault geometry used in inversion (blue line) and aftershock distributions (gray dots). (b) Cross sections of aftershock distributions along profile AB. Courtesy to Hongfeng Yang from the Chinese University of Hong Kong.
Remotesensing 14 05104 g005
Figure 6. InSAR line-of-sight (LOS) displacement residual from ascending (a) and descending (b) tracks using only single fault (main fault only) inversion. The blue line is the fault geometry used in the modelling. Black ellipse in (a) and (b) marks significant residuals at the western end of the main fault, implying a secondary fault strand.
Remotesensing 14 05104 g006
Figure 7. (a,b) Slip distributions from accerogram data only. (c,d) Slip distribution from InSAR data only. (e,f) Slip distribution from a joint inversion. (g) Three−dimension view of fault slip distribution from the joint inversion, shown in (e,f).
Remotesensing 14 05104 g007
Figure 8. Rupture process in the first 9.2 s during the 2022 Menyuan earthquake. (ah) Snapshots of the rupture process during sequential periods. Red stars indicate the hypocenter of the Menyuan earthquake. (i) Source time function showing the evolution of moment rate over time.
Remotesensing 14 05104 g008
Figure 9. Data fitting using the preferred rupture model (Figure 7) of the 2022 Menyuan earthquake between the displacement waveforms (black lines) and model predictions (red lines). The peaks of corresponding data are marked on each subplot.
Remotesensing 14 05104 g009
Figure 10. (a,d) The downsampled InSAR LOS displacements. (b,e) The modelled LOS displacements from the joint inversion. (c,f) Residuals based on the preferred rupture model (Figure 7). Blue lines are surface projections of the fault model used in the joint inversion.
Remotesensing 14 05104 g010
Figure 11. Static Coulomb stress change in surrounding region caused by the 2022 Menyuan earthquake. Static Coulomb stress change at a depth of 5 km. (a) Static Coulomb stress change at a depth of 10 km. (b) TLSF: Tuolaishan fault; LLLF: Lenglongling fault; SNQLF: Sunan–Qilian fault.
Remotesensing 14 05104 g011
Publisher’s Note: MDPI stays neutral with regard to jurisdictional claims in published maps and institutional affiliations.

