Article

Characterizing Spatiotemporal Patterns of Snowfall in the Kaidu River Basin from 2000–2020 Using MODIS Observations

1
Collaborative Innovation Centre on Forecast and Evaluation of Meteorological Disasters, Key Laboratory for Aerosol-Cloud-Precipitation of China Meteorological Administration, School of Atmospheric Physics, Nanjing University of Information Science and Technology, Nanjing 210044, China
2
Jiangsu Collaborative Innovation Center of Atmospheric Environment and Equipment Technology (CICAEET), Nanjing University of Information Science & Technology, Nanjing 210044, China
3
School of Internet of things Engineering, Wuxi University, Wuxi 214105, China
4
School of Automation, Nanjing University of Information Science and Technology, Nanjing 210044, China
*
Author to whom correspondence should be addressed.
Remote Sens. 2022, 14(22), 5885; https://doi.org/10.3390/rs14225885
Submission received: 8 October 2022 / Revised: 11 November 2022 / Accepted: 16 November 2022 / Published: 20 November 2022

Abstract

:
Characterizing spatiotemporal patterns of snowfall is essential for understanding cryosphere responses to warming climate stress. The changes in snowfall and topographic controls in mountain regions still need to be clarified. This study proposes a general parsimonious methodology to obtain the frequency of snowfall in mountainous areas. The methodology employed is easily transferable to any other mountain region. Utilizing daily MODIS observations from June 2000 to May 2020 and the snowfall event detection algorithm, we monitored the frequency of snowfall in a long time series in the Kaidu river basin. The results are as follows: (1) The method for detecting the frequency of snowfall has high accuracy. The annual detected results agreed with surface observations, with an R2 of 0.65 and RMSE of 3.39. (2) The frequency of snowfall events increased monotonically with elevation. The influence of slope angle on snowfall gradually decreased with increasing elevation. (3) The frequency of snowfall events in the Kaidu river basin was dominated by an increasing trend. The trends showed a pronounced topographic dependence. This study reveals the distribution characteristics and changing snowfall trends in mountain regions. The results provide a reference for snowfall research in mountainous areas.

1. Introduction

Quantifying the frequency and magnitude of snowfall in mountain regions is critical for understanding climate change’s current state and water cycle analysis [1]. As the essential component of solid precipitation, snowfall transfers moisture and latent energy between the atmosphere and the land. It directly impacts the energy balance by modifying surface albedo and emissivity [2,3]. Furthermore, snowfall is a material source of seasonal snow cover and mountain glaciers. Billions of people around the world depend on seasonal snow and ice meltwater. A detailed understanding of temporal and spatial variations in snowfall is crucial for regional water security [4,5,6]. Snowfall and its accumulation are sensitive indicators of climate change. The quantitative distribution of snowfall variability, mainly driven by meteorological parameters, depends on the latitude, altitude, and season [7]. A warmer climate will significantly change the frequency and magnitude of snowfall [8]. Recent studies have shown that the temperature increase in mountainous regions is twice the global average [9,10]. This finding has a remarkable impact on the regional climate of an area, especially in snow-dominated areas. Thus, the study of snowfall spatiotemporal patterns in mountainous regions is significant [11,12,13,14].
Because of the spatial and temporal limitations of the data, quantifying the frequency and magnitude of snowfall at different scales is challenging. The familiar data source for the snowfall variation study is gauge-based observations in the weather station. Deng et al. estimated spatial and temporal snowfall variations at 71 stations across the Tibetan Plateau from 1960 to 2014. They found that winter snowfall has increased, but summer snowfall has decreased in the Tibetan Plateau [15]. Yang et al. revealed the spatiotemporal variability of snowfall and its concentration over northern Xinjiang, northwest China based on 26 meteorological stations during 1961–2017 [16]. Using a precipitation dataset of 27 meteorological stations in the Tienshan Mountains, Li et al. investigated the variety of snowfall proportions in precipitation in the alpine regions of Central Asia during 1960–2017 [17]. Based on 93 Cooperative Observer Program stations from 1931 to 2012, Hartnett et al. concluded that the snowfall trend in central New York State showed a substantial increase from 1931 to 1971 but a lesser decrease from 1972 to 2012 [18]. Marty and Blanchet used annual snowfall data from 25 stations collected from 1930 to 2010 to reveal temporal trends of annual snowfall in Switzerland [19]. However, despite recent advancements in measurement technology, snowfall measurements are still subject to significant uncertainties and biases, especially in windy and frozen conditions. Beyond accuracy issues, weather stations are very sparse or nonexistent in remote and mountainous regions [20,21].
Reanalysis data make up for the lack of spatial representation of in situ observations. With the continuous progress of data assimilation in recent decades, more reanalysis data has been applied to study snowfall spatiotemporal variability. The widely used reanalysis datasets include ERA5 (~31 km, 1950 to present) [22], JRA-55 (~55 km, 1958 to present) [23], and MERRA-2 (~50 km,1980 to present) [24]. Daloz et al. examined four widely used reanalysis datasets to estimate the fraction of snow that falls in the world’s mountains from 2007 to 2016. The results showed that 4%-5% of the global snowfall accumulates over the world’s mountains [25]. Boisvert et al. investigated precipitation estimates over the Arctic Ocean from widely used reanalysis datasets from 2000 to 2016. They found that the phase, frequency, and magnitude of precipitation vary enormously and an increasing trend of rainfall was observed [26]. Palerme et al. evaluated Antarctic snowfall using reanalysis datasets from between 2007 and 2010. The seasonal variability of Antarctic snowfall showed higher rates in spring and summer and the minimum rate in winter [27]. However, the coarse spatial resolution of reanalysis data has an important limitation, which generates significant errors in evaluating snowfall over mountainous areas.
Given these shortcomings in gauge-based and reanalysis data, studies on snowfall distribution in remote locations, especially mountainous areas, ordinarily depend on satellite-based remote sensing [28,29]. Currently, two commonly used spaceborne platforms with microwave instruments are available for observing snowfall: CloudSat and the Global Precipitation Measurement Core Observatory (GPM CO) spacecraft. CloudSat, launched in 2006, is a polar-orbiting satellite reaching up to 82°N/S and revisits particular locations every 16 d. The onboard Cloud Profiling Radar (CPR) is a nadir-looking radar at 94 GHz with a spatial resolution of 1.7 km × 1.4 km [30,31]. CloudSat observations have been applied to evaluate snowfall occurrence and intensity locally and globally. Daloz et al. concluded a total amount of 1773 km3yr−1 of snow falls on the world mountains in CloudSat observations [25]. Based on CloudSat observations, Lemonnier et al. explored the snowfall rate in Antarctica from 2007 to 2010. The results show snowfall rates depending on the regions and their interactions with topography [32]. Edel et al. examined the frequency of snowfall over the Arctic using CloudSat observations from 2007 to 2010. They found that 70% and 95% of precipitation over the Arctic Ocean and Greenland is solid precipitation, and the maximum snowfall rate is located over Greenland’s southeast coast [33]. Nevertheless, the orbital revisit of CloudSat and the narrow swath (1.4 km) of CPR are limitations for snowfall monitoring in mid- and high-latitudes. Moreover, CloudSat has suffered from a battery issue since 2011, limiting its observation to daylight only. GPM CO launched in 2014 and has a non-sun-synchronous orbit and higher inclination angle (65°). Instruments on GPM CO include the dual-frequency precipitation radar (DPR), which operates at Ku (13.6 GHz) and Ka (35.5 GHz) bands, and a multifrequency GPM Microwave Imager (GMI) (10–183 GHz, ~6 to ~26 km). Those allow GPM CO to sense liquid and solid precipitation from the tropics to the Arctic and Antarctic circles [34]. Using the Ku-band of GPM CO from 2014 to 2017, Adhikari et al. revealed the seasonal and daily variations of snow features over northern and southern hemispheric land and ocean separately [35]. You et al. quantified the snowfall detection performance of GMI and Ka bands over land. The results showed that the low-frequency channels (≤37 GHz) involve finite snow detection information. Much better performance is apparent using the high-frequency-channel set (≥89 GHz) [36]. Recently, the Integrated Multi-satellitE Retrievals for GPM (IMERG) has aimed to produce global solid precipitation products at the 0.1° resolution and in 30 min using all sensors in GPM eras [37]. However, all the passive microwave measurements (PMW)-sensed snowfall rates are falling snow. Falling snow detection over land is challenging because of different background emissivity associated with land types. At the same time, the coarse resolution of PMW data limits the snowfall detection ability in mountainous areas and captures orographic enhancements of snowfall at basin scales [29].
At the basin scale over mountainous regions, a study on spatiotemporal characteristics of snowfall needs a temporal resolution of fewer than seven days to capture highly dynamic snow process information and a spatial resolution of less than 1 km to resolve complex topographic variability. Meanwhile, robust analysis of snowfall trends requires at least 20 years of consistent long-term data [10,38]. Therefore, Moderate Resolution Imaging Spectroradiometer (MODIS) instruments on Terra, launched in 2000, satisfy these three criteria to monitor long-term snowfall patterns on Earth’s mountains at the basin scale. Shrestha et al. used MODIS data to optimize an altitude-based snowfall correction factor in northeast Japan’s humid Yagisawa Basin of the Upper Tone River. The results correct snowfall and estimate its distribution in poorly gauged basins [39]. Sugg et al. analyzed 122 snowfall events from 2006 to 2012 in the southern Appalachian Mountains to examine the suitability of fractional snow cover maps from MODIS and determined the spatial extent of snowfall according to synoptic-scale circulation [40]. Wiebe et al. analyzed the time series of MODIS-retrieved snow grain size on the Ross Ice Shelf in Antarctica in January 2010. The results showed that snowfall events could be detected by a sudden decrease in snow grain size [41]. The primary purpose of this study is to propose a snowfall detection method using MODIS observations and characterize the spatiotemporal distribution and trend of snowfall in mountain areas. Furthermore, our goal was to identify the spatiotemporal factors that affect snowfall, such as season, elevation, slope, and aspect. Studying snowfall in the mountainous region can help us fully understand the mountains’ climate change and the water cycle.

2. Study Area and Data

2.1. Study Area

The Kaidu River Basin (KRB), which lies in a region of complex topography, is located at the southern slope of the central Tianshan Mountains in northwestern China (Figure 1). The basin can represent many arid and semiarid basins throughout the midlatitudes. The KRB covers an area of approximately 18,641 km2. The altitude ranges between 1348 and 4709 m above sea level (m a.s.l.). Based on the vertical elevation, the KRB was divided into four zones: a montane zone (elevation less than 2400 m a.s.l.), an alpine steppe zone (elevation between 2400 and 2800 m a.s.l.), an alpine meadow zone (elevation from 2800 to 3500 m a.s.l.), and a snow zone (elevation greater than 3500 m a.s.l.). The basin features a typical mid-temperate semiarid continental climate, with a mean annual precipitation of 280.5 mm, an average annual temperature of only 4.6 °C, and an extreme minimum temperature of −48.1 °C. Snow accumulation lasts from November to March of the next year. The annual number of snow cover days reaches 139.3 days, and an enormous annual average snow depth is 12 cm. With increasing temperatures during April and May, seasonal snowmelt water begins to supply the river. The annual average runoff volume is 34.21 × 10⁸ m3 at the Dashankou hydrological station, of which snow and ice runoff make up approximately 14.1%. Melting snow and ice contribute to most of the spring runoff and streamflow in the Kaidu River [42,43,44,45].

2.2. Satellite Images

In this study, we used the MODIS images from the Terra satellite. Terra, orbiting at a 10:30 a.m. local descending node, carries five remote sensors designed to monitor the status of the Earth’s environment and ongoing climate changes. The objectives of the MODIS are to provide continuous images of the Earth’s surface for various Earth science applications. The MODIS captures the image in 36 spectral bands ranging in wavelength from 0.4 μm to 14.4 μm and at varying spatial resolutions (250 m, 500 m, and 1 km). Together, the instruments image the entire Earth every 1 to 2 days. This study used two MODIS V006 global daily products: surface reflectance products (MOD09GA) and snow cover products (MOD10A1). MOD09GA provides daily surface reflectance at a 500 m resolution [46]. MOD10A1 is well-suited for regional snow cover mapping and is derived from cloud-free observations [47]. We obtained the products (daily, 1 June 2000 to 31 May 2020) from the Google Earth Engine platform (https://earthengine.google.com, accessed on 1 January 2021) to analyze the spatiotemporal patterns of snowfall over the KRB.

2.3. Topography Data

The Shuttle Radar Topography Mission (SRTM) data were used in this study. The SRTM Digital Elevation Database v4.1 was initially processed to fill data voids and was produced by NASA. The resolution for SRTM data is three arc seconds (approximately 90 m at the equator). The data are in decimal degrees, as is the WGS84 datum [48]. The raw SRTM data were resampled to a spatial resolution of 500 m consistent with MODIS through nearest-neighbor interpolation. Figure 2 displays the topographic characteristics of the study area. Figure 2a shows the hypsometric curve of the study area. The montane, alpine steppe, alpine meadow, and snow zones cover 6.1%, 35.4%, 41.0%, and 17.5% of the study area, respectively, with an overall mean altitude of 2997 m a.s.l. Figure 2b shows the distribution of slope aspects. The total areas with east-, south-, west-, and north-facing orientations account for 40.2%, 13.2%, 35.3%, and 11.3% of the KRB, respectively. Figure 2c shows the distribution of slope angles. The total areas with slopes <5°, [5°,15°), [15°,25°), and ≥25° account for 38.0%, 29.2%, 16.1%, and 16.7% of the KRB, respectively.

2.4. Meteorological Data

The only meteorological station in the study area is Bayinbulak Weather Station, at an elevation of 2458.9 m a.s.l. (Figure 1). The National Meteorological Information Center of China Meteorological Administration (http://data.cma.cn/en, accessed on 1 July 2021) provided primary meteorological data such as daily precipitation, temperature, and snow depth. The mean monthly temperature, precipitation, and snow depth for the normal period 2000–2019 for Bayanbulak are presented in Figure 3a. In this period, the mean annual precipitation was 308.84 mm. The precipitation was mainly concentrated in summer (June–July–August). In this season, more than two-thirds of the precipitation occurred. Because the mean monthly Tmin was above 0 °C, the precipitation was liquid. However, the mean monthly precipitation sum was only 32.1 mm from October to March. Because the mean monthly Tmax was below 0 °C, solid precipitation was mainly concentrated in this period. Figure 3b shows the time series of daily snow depth from January 2000 to December 2019. The most outstanding snow depth values (35 cm) were found in the winter of 2011. A monthly histogram of mean snow depth is shown in the inset figure. There was snow every month except July. The mean monthly snow depth increased from 0.06 to 10.62 cm from August to February and decreased from 7.1 to 0.05 cm from March to June.

3. Methodology

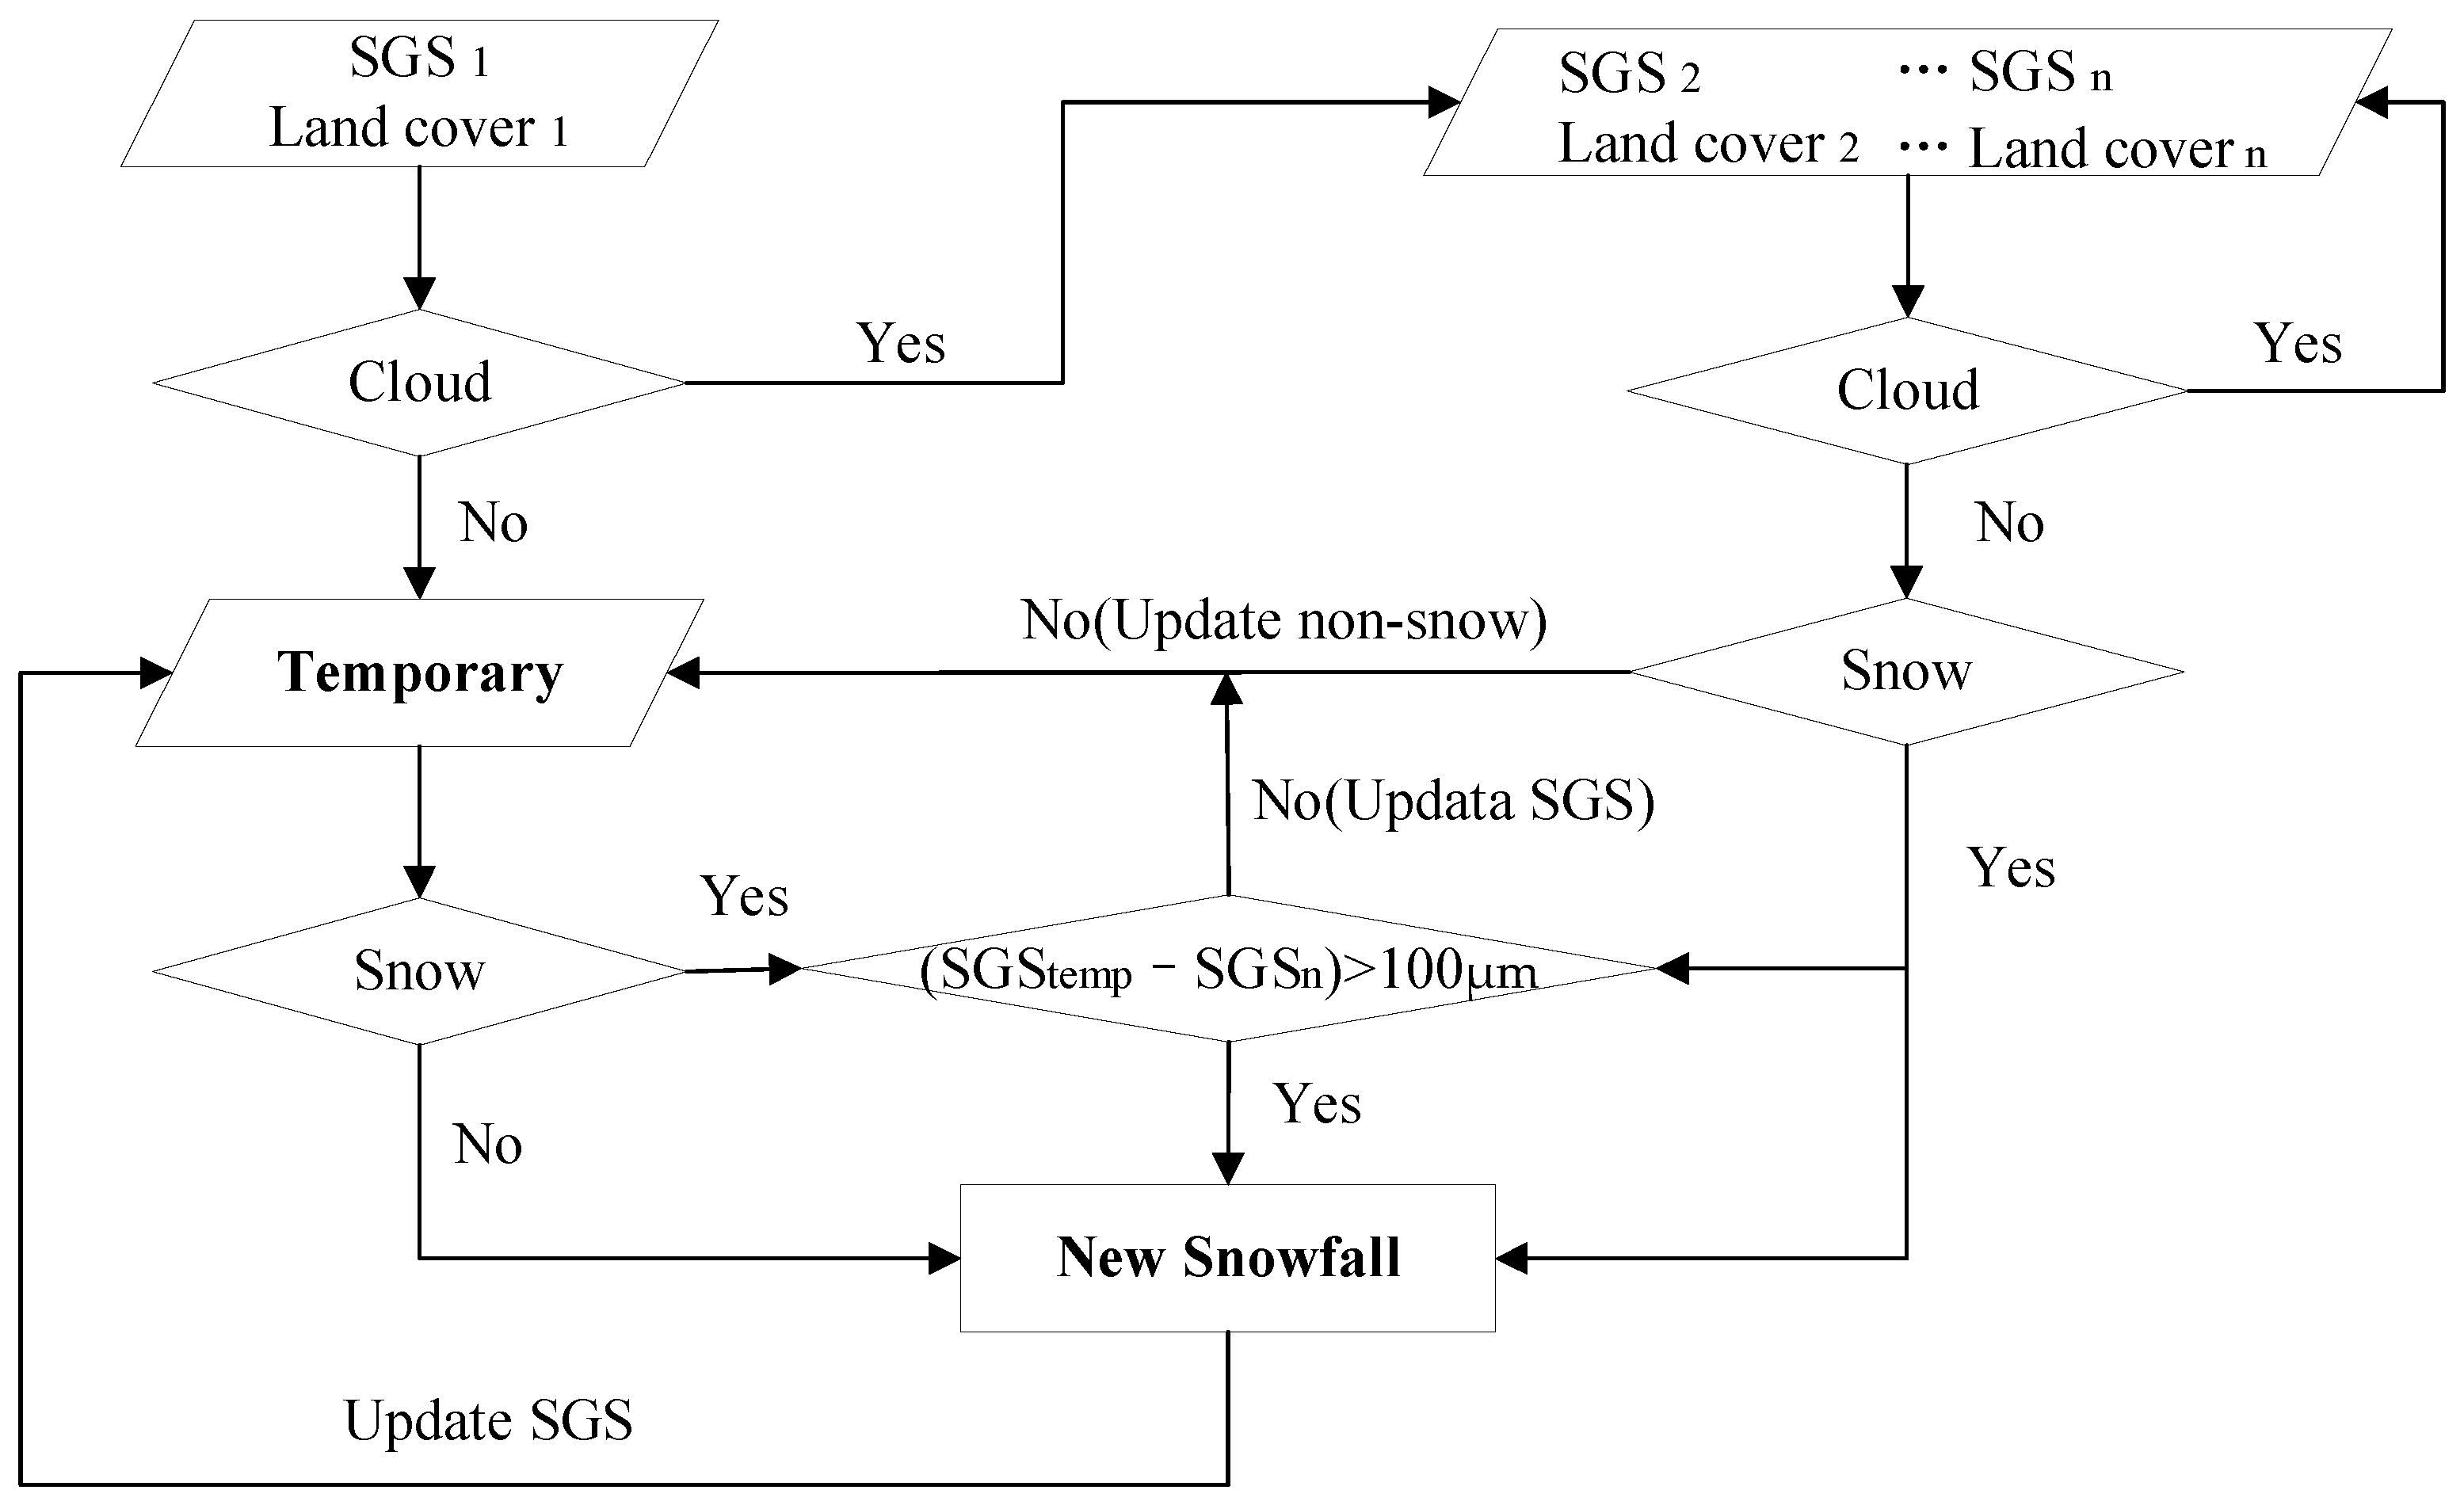
3.1. Snowfall Detection

Our approach for snowfall detection is to identify the snowflakes that fall on the surface. Based on the temporal changes of the differentiated pixels, the method can determine the frequency of snowfall events. When a remote sensing image is obtained, only three objects are represented by pixels: snow, non-snow, and cloud. The snow recognition accuracy of MODIS snow products can reach more than 90% under clear sky conditions [47]. Therefore, when a pixel is non-snow the day before and then becomes snow, it is easy to determine that a snowfall event has occurred in the pixel by existing MODIS snow products. However, a complex situation arises when there is snow in the pixel for two days before and after. It is impossible to distinguish whether the snow is new-fallen or old snow. This condition is common in mountainous areas, especially at higher altitudes. In response to this problem, we designed a method to detect snowfall events using snow grain size (SGS) temporal change. The SGS is an essential microphysical parameter to characterize the hydrothermal state of snow cover, and it is the interface of Earth–atmosphere interaction [3,49]. After the snowflakes fall to the ground, the SGS will continue to increase under the nonstop action of metamorphism [50]. Field-measured SGS can be divided into five terms, i.e., very fine (≤100 μm), fine (100–250 μm), medium (250–500 μm), coarse (500–1000 μm), and very coarse (≥1000 μm) [51]. Wang et al. validated MODIS and estimated snow grain size with in situ measurements collected from field campaigns in mountainous areas of the Tianshan Mountains, China during snow accumulation and ablation periods from 2011 to 2015. The R2 of 0.90 and root mean squared error (RMSE) of 80.42 μm were obtained [52]. Therefore, they combined ground snow grain size classification and ground verification results. The authors set a threshold for snow grain size reduction of 100 μm to determine snow events that occur on pixels. The detailed flow chart of snowfall detection is shown in Figure 4.

3.2. Snow Grain Size Estimation

This study adopted the snow grain size and pollution amount (SGSP) algorithm to estimate SGS from MODIS data. The SGSP algorithm uses an analytical asymptotic solution of the radiative transfer and geometrical optics for the optical properties of snow to evaluate SGS from optical satellite data. The SGSP’s feature is that it can calculate the SGS of the non-spherical shape of grains and realize real-time estimation [53,54]. Verified by ground survey data, SGSP has ideal accuracy in estimating SGS, even in areas with solar zenith angles up to 75° and complex topography [41,52,55]. Figure 5 shows the main datasets and methods for estimating snow grain size. We obtained surface reflectance and observation geometry from MOD09GA, used MOD10A1 to distinguish between snow and no snow, and added DEM to correct the observed geometry affected by terrain.

3.3. Trend Analysis

The study used the Mann–Kendall test and Sen’s slope to analyze the trends of the variations in the frequency of snowfall over the KRB from June 2000 to May 2020. The World Meteorological Organization recommends these two nonparametric methods to analyze the trends of changes in meteorological and hydrological elements [56]. The Mann–Kendall test S is calculated as:
S = i = 1 n 1 j = i + 1 n sgn ( x j x i )
where n is the total number of data points to be analyzed, x i and x j are the frequency of snowfall in time series i and j (j > i), respectively, and sgn ( x j x i ) is the sign function as:
sgn ( x j x i ) = {     1 , if ( x j x i ) > 0       0 , if ( x j x i ) = 0 1 , if ( x j x i ) < 0
The variance statistic is given as:
Var ( S ) = n ( n 1 ) ( 2 n + 5 ) 18
The test statistic Z c is computed as:
Z c = { S     1 Var ( S ) ,       S > 0         0 ,                   S = 0       S   +   1 Var ( S ) ,       S < 0
When Z c is positive, the trend is increasing, while negative values of Z c indicate decreasing trends. In addition, the absolute values of Z c represent the significance of the trend. If the absolute value of Z c is greater than 1.96, the trend is significant at the 0.05 level.
The Sen’s slope estimator is as follows:
SS = Median ( ( x j x i ) / ( j i ) ) j > i
where x i and x j are the frequency of snowfall in time series i and j, respectively.

4. Results

4.1. Validation of Detection Results

The meteorological data from June 2000 to May 2019 validated the snowfall detection results. This period includes 19 complete hydrological years. Figure 6 shows the annual detected numbers of snowfall events using MODIS observations against station-observed results. The annual detected number of snowfall events is consistent with the surface observations. The R2 is 0.65, and the root mean square error (RMSE) is 3.39. The regression line has a slope of 0.52 and an intercept of 8.16, and the results suggest that the detected snowfall events using MODIS observations can provide reliable data for characterizing spatiotemporal patterns of snowfall in the study area.

4.2. Annual Distribution Pattern of Snowfall

The mean frequency of snowfall events over the KRB from June 2000 to May 2020 was 43.71, and their spatial distribution is shown in Figure 7a. Snowfall covered the entire basin, and the mean frequency of snowfall was unevenly distributed, with an apparent terrain gradient. In the lowest zone, the mean frequency of snowfall was below 30, while it increased to more than 100 in the highest zone. Figure 7b shows the variation in the frequency of snowfall with elevation in the KRB over the 20 hydrological years. The frequency increased remarkably with elevation. In the montane zone, the mean frequency of snowfall was 11.18, and the standard deviation was 6.46. In the alpine steppe zone, the mean frequency of snowfall was 36.5, and the standard deviation was 1.73. The mean frequency of snowfall did not vary significantly with elevation in this zone. In the alpine meadow zone, the mean frequency of snowfall was 48.29, and the standard deviation was 7.41. In the snow zone, the mean frequency of snowfall was 73.25, and the standard deviation was 7.79. The minimum frequency of snowfall (black bottom line) had a standard deviation of 19.91; the highest value was 76 at 4600 m, and the lowest value was one at 1700 m. The standard deviation of the maximum frequency of snowfall (top black line) was 29.0. The peak frequency of snowfall was 107, observed at 4300 m, and the lowest number was 8, found at 1300 m. The median frequency of snowfall (middle black line) had a standard deviation of 26.91. Its maximum value was 82 at 4100 m, 87.6% above the mean. Its minimum value was 6 at 1300 m, 86.27% below the mean. These results indicate that the frequency of snowfall over the KRB dramatically varied with elevation.
Figure 7c shows snowfall’s minimum, median, and maximum frequency with aspects in four elevation zones over the KRB from June 2000 to May 2020. In the montane zone, the mean median frequency of snowfall on the four aspects was 23.75, and the standard deviation was 7.27. The maximum median value was 29 on the north-facing slopes, and the minimum was 13 on the south-facing slopes. In the alpine steppe zone, the mean median frequency of snowfall was 36.75, and the standard deviation was 1.71. Its maximum value was 39 on the north-facing slopes, and its minimum was 35 on the south-facing slopes. In this zone, the variation in the frequency of snowfall with aspect was not noticeable. In the alpine meadow zone, the mean median frequency of snowfall on the four aspects was 45.0, and the standard deviation was 7.44. Its maximum value was 52 on the north-facing slopes, and its minimum was 35 on the south-facing slopes. In the snow zone, the mean median frequency of snowfall on the four aspects was 64.25, and the standard deviation was 5.91. Its maximum value was 52 on the north-facing slopes, and its minimum value was 35 events on the south-facing slopes. In all zones, the maximum frequency of snowfall appeared on the east-facing slopes. In contrast, the minimum appeared on the west-facing slopes.
Figure 7d shows snowfall’s minimum, median, and maximum frequency with slope angle in four elevation zones over the KRB. The influence of slope angle on snowfall gradually decreases with increasing elevation. With increasing elevation, the standard deviations of the median numbers of snowfall events were 10.18, 8.3, 1.89, and 1 in the montane, alpine steppe, alpine meadow, and snow zones, respectively. In the montane zone, the maximum of the median numbers of snowfall events and the maximum frequency of snowfall appeared on slopes less than 5°, with values of 31 and 57, respectively. In contrast, in the alpine steppe zone, the maximum median and maximum numbers of snowfall events appeared on slopes less than 15° and greater than 5°, with 38 and 64 events, respectively. The median and minimum frequency of snowfall appeared on slopes greater than 25°, with 20 and 2 events, respectively. The median and maximum values’ variations were not apparent in the other two higher zones.
Figure 8 shows the spatial distribution of trends in the frequency of snowfall over the KRB from June 2000 to May 2020. With a mean trend of 0.158/yr and a standard deviation of 0.411/yr, an increasing trend dominated the frequency of snowfall in the KRB. More than half of the whole basin (55.75%) presented an overall upward trend, and 5.5% of the study area showed a significant increasing trend (p < 0.05). In contrast, 28.39% of the study area showed a downward trend, and 1.81% of the basin showed a significant decreasing trend (p < 0.05). Moreover, the frequency of snowfall was unchanged in 16.14% of the KRB. The trends in the frequency of snowfall showed a pronounced topographic dependence. An upward trend was generally found in the valleys and plains.
In contrast, a downward trend in snowfall was generally found in the high-elevation mountains. With increasing elevation, the mean snowfall trends were 0.432, 0.395, −0.006, and −0.04 events/yr in the montane, alpine steppe, alpine meadow, and snow zones, respectively. The upward trend in the KRB was mainly contributed to by the montane and alpine steppe zones, which were 173.4% and 150.0% above the mean trend of the whole study area, respectively. In contrast, the snowfall trends were negative in the alpine meadow and snow zones, which were 103.8% and 125.3% below the mean trend of the KRB, respectively. In addition, the standard deviations of the trends in the montane, alpine steppe, alpine meadow, and snow zones were 0.436, 0.381, 0.337, and 0.314 events/yr, respectively. These show that the higher the elevation, the more stable the change in the frequency of snowfall.
The trends in snowfall did not decrease monotonically with slope angle. With increasing slope angles, the mean trends of the numbers of snowfall events in the KRB were 0.388, 0.048, −0.018, and −0.007 events/yr at slope angles of <5°, 5–15°, 15–25°, and >25°, respectively. Only the snowfall trend at slope angles less than 5° was more significant than the mean trend of the whole study area, which was 145.6% above the mean value. This means that flatter areas contributed to the upward trend of the number of snowfall events in the KRB. At slope angles of 5–15°, 15–25°, and >25°, the trends were 69.6%, 111.4%, and 104.4% less than the mean trend in the KRB, respectively. The minimum trend appeared in the areas with slope angles greater than 15° and less than 25°. The top trends in the four elevation zones all appeared in the areas with slope angles less than 5°. The minimum trend in the montane zone occurred in areas with slope angles greater than 25°. In the other zones, the minimum trends appeared in the areas with slope angles greater than 15° and less than 25°. Depending on the standard deviation of the number of snowfall events on different slopes, the steeper the slope, the more stable the change in the frequency of snowfall events.
Compared with the influences of elevation and slope angle, the influence of the slope aspect on the trends of the number of snowfall events was minor. All the snowfall trends on different slope aspects were positive in the study area. The mean snowfall trends on the east- and north-facing slopes were 0.220 and 0.198 events/yr, 39.2% and 25.3% above the mean trend of the whole study area, respectively. On the south- and west-facing slopes, the mean trends of the snowfall were 0.118 and 0.088 events/yr, which were 25.3% and 44.3% below the mean trend of the KRB, respectively. In different elevation zones, the mean trends of the numbers of snowfall events on the east- and north-facing slopes were more significant than the mean trends in the elevation zones. The maximum fluctuations in the snowfall trends occurred on the east-facing slopes. All the snowfall trends on the north-facing slopes were positive and had more minor fluctuations than those on other slope aspects.

4.3. Seasonal Distribution Pattern of Snowfall

The spatial distribution patterns of snowfall differ significantly at the seasonal scale. Figure 9 illustrates the spatial distributions of the seasonal mean frequency of snowfall over the KRB from June 2000 to May 2020. Snowfall mainly occurs during winter (December–January–February). This season, the snowfall numbers and extent were the largest, with almost the whole study area having a mean number of snowfall events more significant than four. In contrast, snow covered 55.62% of the study area in summer (June–July–August).
Figure 10 shows the seasonal median snowfall at each elevation zone, slope, and aspect over the KRB from June 2000 to May 2020. Elevation was the main factor that influenced snowfall. This phenomenon was most evident in summer. In the montane zone, the median number of snowfall events was 1, the standard deviation was 1.24, and snow-covered 7.9% of the area in summer. In the alpine steppe and meadow zones, snowfall had no apparent variations in summer, but 15.38% and 78.64% of the regions were snow-covered, respectively. In the snow zone, the median number of snowfalls, standard deviation, and percentage of snow-covered area sharply increased to 9, 6.76, and 99.88%, respectively. In autumn (September–October–November) and spring (March–April–May), snowfall had a similar pattern of variation, growing with elevation and having an almost stable standard deviation in different elevation zones. The difference in the median number of snowfall events in different zones was the smallest in winter among the seasons. With increasing elevation, the values were 16, 21, 19, and 19 in the montane, alpine steppe, alpine meadow, and snow zones, respectively. Generally, the minimum and maximum snowfall events were found where slope angles were less than 5° and greater than 25°, respectively. For example, in autumn, the median numbers of snowfall events with an increasing slope were 6, 11, 13, and 14 at <5°, 5–15°, 15–25°, and >25°, respectively. In winter, the median numbers of snowfall events with increasing slope angles were 21, 19, 18, and 15 at <5°, 5–15°, 15–25°, and >25°, respectively. In addition, the standard deviations of the numbers of snowfall events increased monotonically with increasing slope angles in the four seasons. For example, in spring, the standard deviations with increasing slope angles were 3.92, 5.12, 5.58, and 5.93 at <5°, 5–15°, 15–25°, and >25°, respectively. The slope aspect was the least influential among the three factors affecting snowfall. In summer, the median number of snowfall events on the four slope aspects was 2, and the standard deviations on east-, south-, west-, and north-facing slopes were 5.84, 5.35, 5.44, and 5.60, respectively. In winter, the median number of snowfall events on the four slope aspects was nearly 20, and the standard deviations on east-, south-, west-, and north-facing slopes were 5.07, 7.47, 6.57, and 4.12, respectively. Snowfall fluctuated most on the south-facing slopes. In spring and autumn, the minimum snowfall events were found on the south-facing slopes, 8 and 7, respectively; in contrast, the maximums were found on the north-facing slopes, 14 and 11, respectively. Over the KRB from June 2000 to May 2020, the green areas in the inset figure represent significant trends at a 95% (p < 0.05) confidence level.
Figure 11 illustrates the seasonal spatial distributions of the trends in snowfall over the KRB from June 2000 to May 2020. The results indicate that the frequency of snowfall in the KRB was dominated by increasing trends in the autumn, winter, and spring, with mean trends of 0.083, 0.075, and 0.036 events/yr, respectively. In autumn, winter, and spring, 52.63%, 47.84%, and 40.81% of the areas showed upward trends, and 3.05%, 1.72%, and 0.76% of the areas showed region-significant upward trends. In the summer, a decreasing trend dominated the number of snowfalls in the study area, with a mean direction of −0.014 events/yr, 22.51% of the areas showed regions and trends this season, and 0.23% showed a significant downward trend.
The trend of snowfall varied greatly with elevation. The montane zone had the most apparent upward snowfall trends in the four seasons. In the autumn, winter, spring, and summer seasons, the mean snowfall trends were 0.16, 0.20, 0.11, and 0.03 events/yr, and the upward trends covered 68.63%, 63.82%, 57.80%, and 6.26% of the area, respectively. The mean snowfall trends in the alpine steppe zone were 0.16, 0.17, and 0.08 events/yr in autumn, winter, and spring, respectively. The trend was almost unchanged in summer. In the alpine meadow zone, two seasons showed upward trends. In the autumn and winter seasons, the mean snowfall trends were 0.049 and 0.015 events/yr, and 42.54% and 37.47% of the area were snow-covered, respectively. In contrast, in the spring and summer seasons, the mean trends of snowfall were −0.001 and −0.023 events/yr, and 29.64% and 23.01% of the area were snow-covered, respectively. Only the spring season had an upward trend in the number of snowfall events in the snow zone, with a mean trend of 0.024 events/yr. The snowfall trends in summer, autumn, and winter were −0.019, −0.018, and −0.002 events/yr, respectively.
The different aspects affected the snowfall trend. All the mean snowfall trends in the summer were negative in the four aspects. On the east- and north-facing slopes, the top trends of the snowfall events were observed in the winter season, with values of 0.108 and 0.094 events/yr, respectively. On the west- and south-facing slopes, the top trends of the snowfall events were observed in the autumn season, with values of 0.073 and 0.074 events/yr, respectively.
The slope also affected the snowfall trends. The flatter areas had a trend of increasing snowfall. On slope angles less than 5°, the mean trends of the snowfall events were 0.148, 0.181, 0.081, and −0.014 events/yr in autumn, winter, spring, and summer, respectively. The mean trends of snowfall decreased as the slope angle increased. On slope angles greater than 15° and less than 25°, the mean trends of snowfall events were 0.033, −0.007, −0.001, and −0.012 events/yr in autumn, winter, spring, and summer, respectively.

4.4. Monthly Distribution Pattern of Snowfall

Analysis of the monthly snowfall distribution and trends offers a more detailed picture of snowfall changes in the region over the study period. Figure 12 shows the monthly allocations of snowfall in the KRB from June 2000 to May 2020. Snowfall was distributed unevenly across these months. From October to March of the following year, the proportion of snow covered area was greater than 90%.. The maximum was observed in November, reaching 98.39%. This period corresponds to the period of stable snow cover. From April to July, the snow-covered area gradually decreased. The minimum snow-covered area discovered in July was 15.75% of the site. The snow-covered areas were 27.39% and 64.62% in August and September, respectively. Regarding snowfall frequency, the mean snowfall event gradually increased from 2.60 to 6.04 from August to January and decreased from 5.27 to 2.45 from February to June. The standard deviations of the numbers of snowfall events were relatively stable at approximately two.
Figure 13 shows the monthly median frequency of snowfall and SCA at each elevation zone (a), slope (b), and aspect (c) over the KRB from June 2000 to May 2020. Elevation was the main factor that influenced the number of snowfall events. In the montane zone, the mean monthly snowfall events and SCA were 2.41 and 45.34%, respectively. Snowfall was concentrated between October and March, with the mean number of snowfall events and SCA being 3.8 and 80.28%, respectively. In contrast, the mean snowfall events and SCA were 1 and 10.40% between April and September. In the alpine steppe zone, the mean monthly snowfall events and SCA were 3.08 and 59.67%, respectively. Snowfall was concentrated between October and April. In the alpine meadow zone, the mean monthly snowfall events and SCA were 3.67 and 78.10%, respectively. The months of snowfall were further prolonged. Among the four elevation zones, the fluctuations in the number of snowfall events and SCA were the smallest in the snow zone throughout the year. The mean monthly snowfall events and SCA were 5.17 and 96.84%, respectively. The most significant fluctuations in snowfall event frequency and SCA were observed at slope angles less than 5°. The minimum and maximum snowfall events and SCA were all found within this range of slope angles. From April to September, the SCA was less than the mean in the KRB at all slope angles except for slope angles less than 5°. The aspect was the least influential among the three factors affecting snowfall. The snowfall events and the SCA did not fluctuate much with the aspect. The number of snowfall events and SCA had the smallest values and the most significant variations on the south-facing slopes compared with other elements.
Figure 14 illustrates the monthly spatial distributions of the trends in snowfall over the KRB from June 2000 to May 2020. The results indicate that the frequency of snowfall events in the KRB was dominated by decreasing trends in April, May, and June, with mean trends of −0.018, −0.002, and −0.010/yr, respectively. In the other months, the directions were positive. The highest trend in the number of snow events occurred in March with a value of 0.049/yr. In March, 42.20% of the area showed an upward trend, and 1.34% of the area showed an apparent upward trend. Variation in the frequency of snowfall events varies widely with altitude. In the montane zone, all the mean directions of the number of snowfall events were positive, showing an increasing trend in the number of snowfall events. In the alpine steppe zone, the mean trends of snowfall events were −0.008 and −0.0003/yr in April and September, respectively. In other months, the directions were positive. Five months had negative trends in the alpine meadow zone: February, April, May, June, and July. The minimum change in snowfall frequency for snow regions was −0.023/yr, observed in November. The trends were negative in February, April, June, and December.

5. Discussion

5.1. Unaffected by Cloud Obscuration

Cloud obscuration causes spatiotemporal discontinuities in MODIS snow products, which are more pronounced in mountainous regions [57]. The snowfall detection method proposed in this study can effectively solve the effect of cloud obscuration. Within a pixel, the method continuously updates the surface state based on MODIS cloud-free observations, such as no snow, snow, or snow grain size. After a snowfall, the weather is usually sunny due to the reduced water humidity in the atmosphere and the control of the cold high pressure. This clear weather after snowfall provides suitable conditions for monitoring pixel feature types. After snowflakes have fallen to the ground, snow is metamorphosed through three processes: equi-temperature metamorphism, temperature gradient metamorphism, and melt-freeze metamorphism. The snow grain size will increase monotonically until snowfall occurs [49,50]. Snowfall occurrence is detected by monitoring land type changes from no snow to snow or rapid declines in snow grain size through time-series MODIS observations. Figure 15 shows the cloudy days, snow grain size, and in situ increased snow depth records observed by the Bayinbulak weather station in the 2017 hydrological year. The Bayinbulak weather station was covered by clouds for 202 of the 365 days, accounting for 55.34%. Cloud coverage varies in different seasons. In the summer, autumn, winter, and spring of the 2017 hydrological year, the cloud coverage was 41.30%, 41.76%, 71.11%, and 67.39%, respectively. Sunny days can occur within a day or two after the snow depth has increased. This is beneficial for MODIS to obtain cloud-free ground observation data. According to the observed increased snow depth, there were 19 snowfalls in the 2017 hydrological year at the Bayinbulak weather station. There were 26 snowfalls detected by satellites. From April to October, the minimum temperature is above 0 °C, and the snowfall detection based on land type changes from no snow to snow. From November to March of the following year, the maximum temperature is below 0 °C, and snowfall monitoring can be performed by comparing the snow grain size.

5.2. Applicability

In the context of global warming, mountain regions are markedly sensitive to climate change. Many studies have revealed that mountainous areas’ warming rates are elevation-dependent or amplified with elevation, which we know as elevation-dependent warming [9,14,58]. Notwithstanding the important role of temperature changes, precipitation is also a critical indicator of mountain climate changes. In the Qinghai–Tibet Plateau, Deng et al. found that the effect of altitude on snowfall trends is pronounced, with most high-/low-elevation stations increasing/decreasing, respectively. The altitude between 3000 and 3400 m is the critical threshold [15]. In the Tien Shan Mountains, the threshold elevation of about 2500 m is lower than the value of the Qinghai–Tibet Plateau [57]. These were conducted based on in situ observations, but uncertainties still exist in high-elevation regions due to a lack of high-spatial-resolution observations. This study proposed a method to obtain the annual, seasonal, and monthly spatiotemporal distributions and trends of snowfall frequency at the mountainous river basin using MODIS data. It is a powerful tool for studying elevation-dependent changes in snowfall at the basin scale. Figure 16 shows the average frequency of snowfall over the KRB derived by MODIS, ERA5, and GPM from June 2000 to May 2020. Unlike EAR5 and GPM, the MODIS result captures orographic enhancements of snowfall in the study area. Orographic enhancements of precipitation have been studied at an extensive range of scales for mountain regions worldwide. The mainly used datasets for the enhancements are high-density weather stations or LiDAR data [59,60]. However, these data do not cover the world’s mountainous regions like the MODIS data. The snowfall monitoring results we propose based on MODIS data can effectively make up for this deficiency. On an annual scale, the snowfall frequency showed an increasing trend in the low-altitude regions, while the opposite trend was observed in the high-altitude regions of the study area (Figure 8). This phenomenon is more pronounced in winter than in other seasons (Figure 11). The difference is that there is an increasing trend of snowfall at higher altitudes in summer because there is no snowfall at lower altitudes, especially in July and August (Figure 14).

6. Conclusions

To ascertain the spatial and temporal distribution characteristics and regularity of snowfall in mountainous regions, we presented a detection algorithm for monitoring the frequency of snowfall in long time series at the basin scale. This study is the first to monitor snowfall in the Kaidu river basin, which provides a reference for solid precipitation research in mountainous regions. In this study, the spatial resolution of the monitoring results reached 500 m (MODIS images) and agreed with surface observations, with an R2 of 0.65 and RMSE of 3.39.
The monitoring results showed that the frequency of snowfall increased monotonically with elevation. The influence of slope angle on snowfall gradually decreased with increased elevation. The maximum number of snowfall events appeared on the east-facing slopes. In contrast, the minimum number of snowfall events appeared on west-facing slopes. Moreover, the number of snowfall events in the KRB was dominated by an increasing trend, with a mean trend of 0.158/yr. The directions of the frequency of snowfall showed a pronounced topographic dependence. An upward trend of snowfall was generally found in the valleys and plains. In contrast, a downward snowfall trend was generally found in the high-elevation mountains. This study revealed the spatial and temporal distribution characteristics of snowfall events at the basin scale in mountainous regions, which supports further research on the hydrological characteristics in this region and offers scientific guidance for the construction of water conservancy projects and spring irrigation in this region. We also obtained the change trends of snowfall in the Kaidu river basin to provide a reference for investigating the impact of climate warming.
Moreover, the optical remote sensing images also limit the ability to generate characteristics of snowfall amounts. In the future, combining ground observations with climate modeling approaches could further improve our understanding of the functions of snowfall in mountainous regions.

Author Contributions

Conceptualization, J.W.; methodology, J.W.; validation, J.W., W.H., K.S. and F.T.; formal analysis, J.W.; investigation, J.W.; resources, J.W. and Y.Z.; data curation, J.W. and W.H.; writing—original draft preparation, J.W. and L.Z.; writing—review and editing, J.W. and L.Z.; visualization, J.W., K.S. and F.T.; supervision, J.W.; project administration, J.W.; funding acquisition, J.W. and Y.Z. All authors have read and agreed to the published version of the manuscript.

Funding

This research was funded by the National Key Research and Development Program of China, grant number 2021YFE0116900, and the National Natural Science Foundation of China, grant numbers 41871238, 41875027, and 41971293.

Data Availability Statement

The data supporting the findings of this study are available from the first author (J.W.).

Acknowledgments

We are immensely grateful to the editor and anonymous reviewers for their comments on the manuscript. The authors would like to thank Wei Ding and Shuai Chen for their help with data acquisition.

Conflicts of Interest

The authors declare no conflict of interest.

References

  1. Masson-Delmotte, V.; Zhai, P.; Pirani, A.; Connors, S.L.; Péan, C.; Berger, S.; Caud, N.; Chen, Y.; Goldfarb, L.; Gomis, M.I.; et al. IPCC, 2021: Climate Change 2021: The Physical Science Basis. Contribution of Working Group I to the Sixth Assessment Report of the Intergovernmental Panel on Climate Change; IPCC: Cambridge, UK, 2021. [Google Scholar]
  2. Stephens, G.L.; O’Brien, D.; Webster, P.J.; Pilewski, P.; Kato, S.; Li, J.-L. The albedo of Earth. Rev. Geophys. 2015, 53, 141–163. [Google Scholar] [CrossRef] [Green Version]
  3. Henderson, G.R.; Peings, Y.; Furtado, J.C.; Kushner, P.J. Snow–atmosphere coupling in the Northern Hemisphere. Nat. Clim. Chang. 2018, 8, 954–963. [Google Scholar] [CrossRef]
  4. Barnett, T.P.; Adam, J.C.; Lettenmaier, D.P. Potential impacts of a warming climate on water availability in snow-dominated regions. Nature 2005, 438, 303–309. [Google Scholar] [CrossRef]
  5. Viviroli, D.; Dürr, H.H.; Messerli, B.; Meybeck, M.; Weingartner, R. Mountains of the world, water towers for humanity: Typology, mapping, and global significance. Water Resour. Res. 2007, 43, W07447. [Google Scholar] [CrossRef] [Green Version]
  6. Rodell, M.; Famiglietti, J.S.; Wiese, D.N.; Reager, J.T.; Beaudoing, H.K.; Landerer, F.W.; Lo, M.H. Emerging trends in global freshwater availability. Nature 2018, 557, 651–659. [Google Scholar] [CrossRef]
  7. Pörtner; Roberts, D.C.; Masson-Delmotte, V.; Zhai, P.; Tignor, M.; Poloczanska, E.; Mintenbeck, K.; Alegría, A.; Nicolai, M.; Okem, A.; et al. IPCC Special Report on the Ocean and Cryosphere in a Changing Climate; IPCC: Cambridge, UK, 2019; Available online: https://www.ipcc.ch/report/srocc/ (accessed on 1 June 2021).
  8. Mankin, J.S.; Diffenbaugh, N.S. Influence of temperature and precipitation variability on near-term snow trends. Clim. Dynam. 2014, 45, 1099–1116. [Google Scholar] [CrossRef]
  9. Pepin, N.; Bradley, R.S.; Diaz, H.F.; Baraer, M.; Caceres, E.B.; Forsythe, N.; Fowler, H.; Greenwood, G.; Hashmi, M.Z.; Liu, X.D.; et al. Elevation-dependent warming in mountain regions of the world. Nat. Clim. Chang. 2015, 5, 424–430. [Google Scholar] [CrossRef] [Green Version]
  10. Notarnicola, C. Hotspots of snow cover changes in global mountain regions over 2000–2018. Remote Sens. Environ. 2020, 243, 111781. [Google Scholar] [CrossRef]
  11. National Academies of Sciences, Engineering. Thriving on Our Changing Planet: A Decadal Strategy for Earth Observation from Space; The National Academies Press: Washington, DC, USA, 2018. [Google Scholar]
  12. Tamang, S.K.; Ebtehaj, A.M.; Prein, A.F.; Heymsfield, A.J. Linking Global Changes of Snowfall and Wet-Bulb Temperature. J. Clim. 2020, 33, 39–59. [Google Scholar] [CrossRef]
  13. Kraaijenbrink, P.D.A.; Stigter, E.E.; Yao, T.; Immerzeel, W.W. Climate change decisive for Asia’s snow meltwater supply. Nat. Clim. Chang. 2021, 11, 591–597. [Google Scholar] [CrossRef]
  14. Pepin, N.C.; Arnone, E.; Gobiet, A.; Haslinger, K.; Kotlarski, S.; Notarnicola, C.; Palazzi, E.; Seibert, P.; Serafin, S.; Schöner, W.; et al. Climate Changes and Their Elevational Patterns in the Mountains of the World. Rev. Geophys. 2022, 60, e2020RG000730. [Google Scholar] [CrossRef]
  15. Deng, H.; Pepin, N.C.; Chen, Y. Changes of snowfall under warming in the Tibetan Plateau. J. Geophys. Res. Atmos. 2017, 122, 7323–7341. [Google Scholar] [CrossRef] [Green Version]
  16. Yang, T.; Li, Q.; Liu, W.; Liu, X.; Li, L.; De Maeyer, P. Spatiotemporal variability of snowfall and its concentration in northern Xinjiang, Northwest China. Theor. Appl. Climatol. 2019, 139, 1247–1259. [Google Scholar] [CrossRef]
  17. Li, Z.; Chen, Y.; Li, Y.; Wang, Y. Declining snowfall fraction in the alpine regions, Central Asia. Sci. Rep. 2020, 10, 3476. [Google Scholar] [CrossRef] [Green Version]
  18. Hartnett, J.J.; Collins, J.M.; Baxter, M.A.; Chambers, D.P. Spatiotemporal Snowfall Trends in Central New York. J. Appl. Meteorol. Climatol. 2014, 53, 2685–2697. [Google Scholar] [CrossRef]
  19. Marty, C.; Blanchet, J. Long-term changes in annual maximum snow depth and snowfall in Switzerland based on extreme value statistics. Clim. Chang. 2011, 111, 705–721. [Google Scholar] [CrossRef] [Green Version]
  20. Kochendorfer, J.; Earle, M.; Rasmussen, R.; Smith, C.; Yang, D.; Morin, S.; Mekis, E.; Buisan, S.; Roulet, Y.-A.; Landolt, S.; et al. How Well Are We Measuring Snow Post-SPICE? Bull. Am. Meteorol. Soc. 2022, 103, E370–E388. [Google Scholar] [CrossRef]
  21. Goodison, B.; Louie, P.; Yang, D. The WMO Solid Precipitation Measurement Intercomparison; WMO TD: Geneve, Switzerland, 1998; pp. 65–70. [Google Scholar]
  22. Hersbach, H.; Bell, B.; Berrisford, P.; Hirahara, S.; Horányi, A.; Muñoz-Sabater, J.; Nicolas, J.; Peubey, C.; Radu, R.; Schepers, D.; et al. The ERA5 global reanalysis. Q. J. R. Meteorol. Soc. 2020, 146, 1999–2049. [Google Scholar] [CrossRef]
  23. Kobayashi, S.; Ota, Y.; Harada, Y.; Ebita, A.; Moriya, M.; Onoda, H.; Onogi, K.; Kamahori, H.; Kobayashi, C.; Endo, H.; et al. The JRA-55 Reanalysis: General Specifications and Basic Characteristics. J. Meteorol. Soc. Jpn. Ser. II 2015, 93, 5–48. [Google Scholar] [CrossRef] [Green Version]
  24. Gelaro, R.; McCarty, W.; Suarez, M.J.; Todling, R.; Molod, A.; Takacs, L.; Randles, C.; Darmenov, A.; Bosilovich, M.G.; Reichle, R.; et al. The Modern-Era Retrospective Analysis for Research and Applications, Version 2 (MERRA-2). J. Clim. 2017, 30, 5419–5454. [Google Scholar] [CrossRef]
  25. Daloz, A.S.; Mateling, M.; L’Ecuyer, T.; Kulie, M.; Wood, N.B.; Durand, M.; Wrzesien, M.; Stjern, C.W.; Dimri, A.P. How much snow falls in the world’s mountains? A first look at mountain snowfall estimates in A-train observations and reanalyses. Cryosphere 2020, 14, 3195–3207. [Google Scholar] [CrossRef]
  26. Boisvert, L.N.; Webster, M.A.; Petty, A.A.; Markus, T.; Bromwich, D.H.; Cullather, R.I. Intercomparison of Precipitation Estimates over the Arctic Ocean and Its Peripheral Seas from Reanalyses. J. Clim. 2018, 31, 8441–8462. [Google Scholar] [CrossRef]
  27. Palerme, C.; Claud, C.; Dufour, A.; Genthon, C.; Wood, N.B.; L’Ecuyer, T. Evaluation of Antarctic snowfall in global meteorological reanalyses. Atmos. Res. 2017, 190, 104–112. [Google Scholar] [CrossRef]
  28. Levizzani, V.; Laviola, S.; Cattani, E. Detection and Measurement of Snowfall from Space. Remote Sens. 2011, 3, 145–166. [Google Scholar] [CrossRef] [Green Version]
  29. Levizzani, V.; Cattani, E. Satellite Remote Sensing of Precipitation and the Terrestrial Water Cycle in a Changing Climate. Remote Sens. 2019, 11, 2301. [Google Scholar] [CrossRef] [Green Version]
  30. Stephens, G.L. The CloudSat mission and the A-Train: A new dimension of space-based observations of clouds and precipitation. Bull. Amer. Meteor. Soc. 2002, 83, 1771–1790. [Google Scholar] [CrossRef] [Green Version]
  31. Stephens, G.L.; Vane, D.G.; Tanelli, S.; Im, E.; Durden, S.; Rokey, M.; Reinke, D.; Partain, P.; Mace, G.G.; Austin, R.; et al. CloudSat mission: Performance and early science after the first year of operation. J. Geophys. Res. 2008, 113. [Google Scholar] [CrossRef]
  32. Lemonnier, F.; Madeleine, J.-B.; Claud, C.; Palerme, C.; Genthon, C.; L’Ecuyer, T.; Wood, N.B. CloudSat-Inferred Vertical Structure of Snowfall Over the Antarctic Continent. J. Geophys. Res. Atmos. 2020, 125, e2019JD031399. [Google Scholar] [CrossRef] [Green Version]
  33. Edel, L.; Claud, C.; Genthon, C.; Palerme, C.; Wood, N.; L’Ecuyer, T.; Bromwich, D. Arctic Snowfall from CloudSat Observations and Reanalyses. J. Clim. 2020, 33, 2093–2109. [Google Scholar] [CrossRef]
  34. Skofronick-Jackson, G.M. The Global Precipitation Measurement (GPM) for science and society. Bull. Amer. Meteor. Soc. 2017, 98, 1679–1695. [Google Scholar] [CrossRef]
  35. Adhikari, A.; Liu, C.; Kulie, M.S. Global Distribution of Snow Precipitation Features and Their Properties from 3 Years of GPM Observations. J. Clim. 2018, 31, 3731–3754. [Google Scholar] [CrossRef]
  36. You, Y.; Wang, N.-Y.; Ferraro, R.; Rudlosky, S. Quantifying the Snowfall Detection Performance of the GPM Microwave Imager Channels over Land. J. Hydrometeorol. 2017, 18, 729–751. [Google Scholar] [CrossRef]
  37. Huffman, G.J.; Bolvin, D.T.; Braithwaite, D.; Hsu, K.-L.; Joyce, R.J.; Kidd, C.; Nelkin, E.J.; Sorooshian, S.; Stocker, E.F.; Tan, J.; et al. Integrated Multi-satellite Retrievals for the Global Precipitation Measurement (GPM) Mission (IMERG). In Satellite Precipitation Measurement: Volume 1; Levizzani, V., Kidd, C., Kirschbaum, D.B., Kummerow, C.D., Nakamura, K., Turk, F.J., Eds.; Springer International Publishing: Cham, Switzerland, 2020; pp. 343–353. [Google Scholar] [CrossRef]
  38. Bormann, K.J.; Brown, R.D.; Derksen, C.; Painter, T.H. Estimating snow-cover trends from space. Nat. Clim. Chang. 2018, 8, 924–928. [Google Scholar] [CrossRef]
  39. Shrestha, M.; Wang, L.; Koike, T.; Tsutsui, H.; Xue, Y.; Hirabayashi, Y. Correcting basin-scale snowfall in a mountainous basin using a distributed snowmelt model and remote-sensing data. Hydrol. Earth Syst. Sci. 2014, 18, 747–761. [Google Scholar] [CrossRef] [Green Version]
  40. Sugg, J.W.; Perry, L.B.; Hall, D.K.; Riggs, G.A.; Badurek, C.A. Satellite perspectives on the spatial patterns of new snowfall in the Southern Appalachian Mountains. Hydrol. Process. 2014, 28, 4602–4613. [Google Scholar] [CrossRef]
  41. Wiebe, H.; Heygster, G.; Zege, E.; Aoki, T.; Hori, M. Snow grain size retrieval SGSP from optical satellite data: Validation with ground measurements and detection of snow fall events. Remote Sens. Environ. 2013, 128, 11–20. [Google Scholar] [CrossRef]
  42. Zhenniang, Y. Glacier Water Resources in China; Gansu Science and Technology Press: Lanzhou, China, 1991. [Google Scholar]
  43. Haiyan, C.; Yaning, C.; Weihong, L.; Xinming, H.; Yupeng, L.; Qifei, Z. Identifying evaporation fractionation and streamflow components based on stable isotopes in the Kaidu River Basin with mountain-oasis system in north-west China. Hydrol. Process. 2018, 32, 2423–2434. [Google Scholar] [CrossRef]
  44. Chen, Z.; Chen, Y.; Li, B. Quantifying the effects of climate variability and human activities on runoff for Kaidu River Basin in arid region of northwest China. Theor. Appl. Climatol. 2012, 111, 537–545. [Google Scholar] [CrossRef]
  45. Hu, R.J. The Natural Geography of Tianshan Mountain in China; China Environmental Science Press: Beijing, China, 2004. [Google Scholar]
  46. Vermote, E.; Wolfe, R. MYD09GA MODIS/Aqua Surface Reflectance Daily L2G Global 1km and 500 m SIN Grid; NASA GSFC and MODAPS SIPS-NASA: Greenbelt, MD, USA, 2015.
  47. Hall, D.K.; Salomonson, V.V.; Riggs, G.A. MODIS/Terra Snow Cover Daily L3 Global 500 m Grid. Version 6; NASA National Snow and Ice Data Center Distributed Active Archive Center: Boulder, CO, USA, 2016.
  48. Jarvis, A.; Reuter, H.I.; Nelson, A.; Guevara, E. Hole-filled SRTM for the globe Version 4. In CGIAR-CSI SRTM 90 m Database; NASA/CGIAR: Cali, CO, USA, 2008. [Google Scholar]
  49. Flanner, M.G.; Zender, C.S. Linking snowpack microphysics and albedo evolution. J. Geophys. Res. 2006, 111. [Google Scholar] [CrossRef]
  50. Colbeck, S.C. An Overview of Seasonal Snow Metamorphism. Rev. Geophys. 1982, 20, 45–61. [Google Scholar] [CrossRef]
  51. Fierz, C.; Armstrong, R.L.; Durand, Y.; Etchevers, P.; Greene, E.; McClung, D.M.; Nishimura, K.; Satyawali, P.K.; Sokratov, S.A. The International Classification for Seasonal Snow on the Ground; IHP-VII Technical Documents in Hydrology N°83, IACS Contribution N°1; UNESCO-IHP: Paris, France, 2009. [Google Scholar]
  52. Wang, J.; Feng, X.; Xiao, P.; Ye, N.; Zhang, X.; Cheng, Y. Snow Grain-Size Estimation Over Mountainous Areas From MODIS Imagery. IEEE Geosci. Remote Sens. Lett. 2018, 15, 97–101. [Google Scholar] [CrossRef]
  53. Kokhanovsky, A.A.; Zege, E.P. Scattering optics of snow. Appl. Opt. 2004, 43, 1589–1602. [Google Scholar] [CrossRef] [PubMed]
  54. Zege, E.P.; Katsev, I.L.; Malinka, A.V.; Prikhach, A.S.; Heygster, G.; Wiebe, H. Algorithm for retrieval of the effective snow grain size and pollution amount from satellite measurements. Remote Sens. Environ. 2011, 115, 2674–2685. [Google Scholar] [CrossRef]
  55. Kokhanovsky, A.A.; Aoki, T.; Hachikubo, A.; Hori, M.; Zege, E.P. Reflective properties of natural snow: Approximate asymptotic theory versus in situ measurements. IEEE Trans. Geosci. Remote Sens. 2005, 43, 1529–1535. [Google Scholar] [CrossRef]
  56. Gocic, M.; Trajkovic, S. Analysis of changes in meteorological variables using Mann-Kendall and Sen’s slope estimator statistical tests in Serbia. Glob. Planet. Chang. 2013, 100, 172–182. [Google Scholar] [CrossRef]
  57. Hall, D.K.; Riggs, G.A.; Foster, J.L.; Kumar, S.V. Development and evaluation of a cloud-gap-filled MODIS daily snow-cover product. Remote Sens. Environ. 2010, 114, 496–503. [Google Scholar] [CrossRef] [Green Version]
  58. Yao, T.; Xue, Y.; Chen, D.; Chen, F.; Thompson, L.; Cui, P.; Koike, T.; Lau, W.K.M.; Lettenmaier, D.; Mosbrugger, V.; et al. Recent Third Pole’s Rapid Warming Accompanies Cryospheric Melt and Water Cycle Intensification and Interactions between Monsoon and Environment: Multidisciplinary Approach with Observations, Modeling, and Analysis. Bull. Am. Meteorol. Soc. 2019, 100, 423–444. [Google Scholar] [CrossRef]
  59. Grünewald, T.; Bühler, Y.; Lehning, M. Elevation dependency of mountain snow depth. Cryosphere 2014, 8, 2381–2394. [Google Scholar] [CrossRef] [Green Version]
  60. Napoli, A.; Crespi, A.; Ragone, F.; Maugeri, M.; Pasquero, C. Variability of orographic enhancement of precipitation in the Alpine region. Sci. Rep. 2019, 9, 13352. [Google Scholar] [CrossRef]
Figure 1. Location of the study area of Kaidu River Basin.
Remotesensing 14 05885 g001
Figure 2. The topographic characteristics of the study area. (a) Plot of percentage distribution with an elevation over the KRB; (b) The percentage distribution of slope aspects; (c) The percentage distribution of slopes.
Remotesensing 14 05885 g002
Figure 3. (a) The monthly mean precipitation and temperature at the Bayanbulak meteorological station from January 2000 to December 2019. (b) Bayanbulak meteorological station time series of daily snow depth, with a monthly histogram of mean snow depth from January 2000 to December 2019 in the inset figure.
Remotesensing 14 05885 g003
Figure 4. Flowchart for snowfall detection.
Remotesensing 14 05885 g004
Figure 5. Flowchart for estimating snow grain size.
Remotesensing 14 05885 g005
Figure 6. Comparison of annual detected numbers of snowfall events using MODIS and observations from the Bayanbulak meteorological station for each hydrological year from 2000 to 2018. The dashed line denotes the best-fit line from linear regression. The coefficient of determination (R2), root mean square error (RMSE), and sample size (N) are also given.
Remotesensing 14 05885 g006
Figure 7. (a) Spatial distribution of the mean frequency of snowfall from June 2000 to May 2020 over the KRB; (b) the minimum, mean, and maximum frequency of snowfall events with an elevation over the KRB during 20 hydrological years; (c) the minimum, the mean, and maximum frequency of snowfall with aspect in four elevation zones over the KRB during 20 hydrological years; and (d) the minimum, the mean, and maximum frequency of snowfall with slope angle in four elevation zones over the KRB during 20 hydrological years.
Remotesensing 14 05885 g007
Figure 8. The spatial distribution of the annual trend in the number of snowfall events over the Kaidu River Basin from June 2000 to May 2020, where the green areas in the inset figure represent significant trends at a 95% (p < 0.05) confidence level.
Remotesensing 14 05885 g008
Figure 9. Spatial distribution of the seasonal median frequency of snowfall over the Kaidu River Basin from June 2000 to May 2020. SCA = snow-covered area, Mean = the mean value of the median snowfall frequency, and SD = the standard deviation of the median snowfall frequency.
Remotesensing 14 05885 g009
Figure 10. Seasonal frequency of snowfall at each elevation zone, slope angle, and slope aspect over the Kaidu River Basin from June 2000 to May 2020. Solid lines are the median snowfall at each elevation zone, slope angle, and slope aspect. Dashed lines are the median snowfall in the four seasons of the study area. MZ = montane zone, ASZ = alpine steppe zone, AMZ = alpine meadow zone, and SZ = snow zone.
Remotesensing 14 05885 g010
Figure 11. Spatial distributions of the seasonal trends in the frequency of snowfalls over the KRB from June 2000 to May 2020, where the green areas in the inset figure represent significant trends at a 95% (p < 0.05) confidence level.
Remotesensing 14 05885 g011
Figure 12. Spatial distributions of the monthly median snowfall events over the KRB from June 2000 to May 2020. SCA = Snow-covered area, Mean = mean value of the median snowfall events, and SD = standard deviation of the median numbers of snowfall events.
Remotesensing 14 05885 g012
Figure 13. Monthly median frequency of snowfall and snow-covered areas (SCAs) at each elevation zone (a), slope (b), and aspect (c) over the KRB from June 2000 to May 2020. MZ = montane zone, ASZ = alpine steppe zone AMZ = alpine meadow zone, and SZ = snow zone.
Remotesensing 14 05885 g013
Figure 14. Spatial distributions of the trends in the monthly snowfall events over the KRB from June 2000 to May 2020. Mean = mean value of the median numbers of snowfall events.
Remotesensing 14 05885 g014
Figure 15. The MODIS-observed cloudy days, snow grain size, and in situ snow depth records at the Bayanbulak meteorological station for the 2017 hydrological year.
Remotesensing 14 05885 g015
Figure 16. The average frequency of snowfall over the KRB derived by MODIS, ERA5, and GPM datasets from June 2000 to May 2020.
Remotesensing 14 05885 g016
Publisher’s Note: MDPI stays neutral with regard to jurisdictional claims in published maps and institutional affiliations.

