Article

Effect of Cloud Mask on the Consistency of Snow Cover Products from MODIS and VIIRS

1
Heihe Remote Sensing Experimental Research Station, Key Laboratory of Remote Sensing of Gansu Province, Northwest Institute of Eco-Environment and Resources, Chinese Academy of Sciences, Lanzhou 730000, China
2
University of Chinese Academy of Sciences, Beijing 100049, China
3
Surveying Department, Gansu Industry Polytechnic College, Tianshui 741025, China
4
State Key Laboratory of Tibetan Plateau Earth System, Resources and Environment (TPESRE), Institute of Tibetan Plateau Research, Chinese Academy of Sciences, Beijing 100049, China
5
State Key Laboratory of Grassland Agro-Ecosystems, College of Pastoral Agriculture Science and Technology, Lanzhou University, Lanzhou 730020, China
*
Author to whom correspondence should be addressed.
Remote Sens. 2022, 14(23), 6134; https://doi.org/10.3390/rs14236134
Submission received: 24 September 2022 / Revised: 26 November 2022 / Accepted: 30 November 2022 / Published: 3 December 2022

Abstract

:
Snow cover has significant impacts on the global water cycle, ecosystem, and climate change. At present, satellite remote sensing is regarded as the most efficient approach to detect long-term and multiscale observations of snow cover extent. The Visible Infrared Imaging Radiometer Suite (VIIRS) sensor onboard Joint Polar Satellite System (JPSS) satellites will replace the Moderate-Resolution Imaging Spectroradiometer (MODIS) to prolong data recording in the future. Therefore, it is a fundamental task to analyze and evaluate the consistency of the snow cover products retrieved from these two sensors. In this study, we performed comparisons and a consistency evaluation between the MODIS and VIIRS snow cover products in three major snow distribution regions in China: Northeast China (NE), Northwest China (NW) and the Qinghai–Tibet Plateau (QT). The results demonstrated that (1) the normalized difference snow index (NDSI)-derived snow cover products showed suitable consistency between VIIRS and MODIS under clear sky conditions, with a mean difference value of less than 5%; (2) the VIIRS snow cover product presented much more snow and fewer clouds than that of MODIS in the snow season due to the differences in cloud-masking algorithms; (3) cloud mask strongly affects the potential of snow cover observation, and presents seasonal pattern in the test regions; and (4) VIIRS is able to distinguish clouds from snow with greater accuracy. The comparisons indicated that the greater the difference in cloud cover, the poorer the agreement in snow cover. This evaluation implies that perfecting the cloud-masking algorithm of VIIRS to update the MODIS would be the best solution to achieve better consistency for long-term and high-quality snow cover products.

Graphical Abstract

1. Introduction

Snow cover is one of the most crucial components in the cryosphere [1]. Spatial–temporal variation in snow cover plays a critical role in energy balance and climate change due to its high albedo, heat insulation and absorbing properties [2,3,4,5]. Additionally, snow cover is of great significance in regional/global water resources [6]. Meltwater from mountain snowpacks flows to some of the world’s most densely populated areas, benefiting more than one billion people [7], and can also cause glacier ice break. The onset, duration and melt date of snow cover are important parameters for hydrological modeling [8,9,10]. Therefore, accurate monitoring of the spatial distribution of snow is crucial for studies of the global water cycle, climate change, water resource management, hydrological processes and so on.
Satellite-based remote sensing technology is a powerful tool to study the Earth’s snow cover and allows for the detection and mapping of the snow cover extent (SCE) at regional and global scales with the advantages of multiple spatial and temporal scales. Snow cover products from the Moderate-Resolution Imaging Spectroradiometer (MODIS) instrument have been archived and distributed by the National Snow and Ice Data Center (NSIDC) since 2000 [11,12]. At present, the MODIS instruments onboard the Terra (EOS-AM1) and Aqua (EOS-PM1) satellites are still functional, providing more than 20 years of snow cover products with global, daily snow coverage at a 500 m and 0.05° resolution [13,14,15]. Many time-series studies that have been undertaken have validated its accuracy [16,17]. The long-term record and medium spatial resolution of MODIS make it an effective and reliable option to monitor the spatial and temporal variability of SCE at regional and hemispheric/global scales [18,19].
Unfortunately, these two aging satellites will be retired in the coming years due to changes in their orbits and sensor degradation. Following the legacy of MODIS, the Visible Infrared Imaging Radiometer Suite (VIIRS) onboard the Suomi National Polar-orbiting Partnership (SNPP) satellite was launched on 28 October 2011 [20,21,22,23]. The VIIRS sensor enables a new generation of operational moderate-resolution imaging capabilities, and provides high-quality multidecade, daily satellite observation. In order to create an Earth Science Data Record (ESDR) and monitor global changes, the new sensor serves as a bridge between NASA’s Earth Observing System (EOS) of satellites and the next-generation Joint Polar Satellite System (JPSS) satellites [24,25].
As the main data sources for SCE with long-term and high temporal resolutions, MODIS and its successor, VIIRS, will play important roles in providing long time-series data records of the Earth system. Therefore, to develop continuous land product datasets, it is necessary to investigate the consistency of MODIS and VIIRS products due to discrepancies in their sensor performance, observation geometry, spatial resolution, spectral coverage and band settings. Great efforts have been devoted to evaluating and validating the consistency of VIIRS and MODIS products, such as the leaf area index (LAI) and fraction of photosynthetically active radiation absorbed by vegetation (FPAR) [26], normalized difference vegetation index (NDVI) [27], cross-calibration of near-infrared bands [28], land surface temperature and emissivity [29] and bidirectional reflectance distribution function (BRDF) [30]. These cross-comparison studies of these land data products showed satisfactory continuity between the products.
To verify the consistency between MODIS and VIIRS long time-series SCE products, several cross-comparisons have been performed. The continuity of MODIS/Aqua, MODIS/Terra and VIIRS/SNPP SCE products was evaluated using cell-to-cell comparisons of two adjacent tiles in the western United States over two days and found a 90–97% agreement in the SCE on different landscapes under a clear sky [31]. Two hundred and forty-four swath snow products from MODIS/Aqua (MYD10_L2) and VIIRS Environmental Data Records (EDR) (VSCMO/binary) were compared for the 2016 hydrological year in the North American region, indicating that these two binary snow cover products with different thresholds showed an overall agreement of approximately 98% when excluding all cloudy pixels [32]. The accuracies of the MODIS/Terra, MODIS/Aqua and VIIRS/SNPP snow cover products were all adequate under clear sky conditions on the Tibetan Plateau (TP) but poor when the snow depth was lower than 5 cm [33]. Furthermore, the VIIRS daily snow cover product showed much better accuracy than MODIS/Aqua but lower accuracy than MODIS/Terra on the TP [34]. The VIIRS NASA Snow Cover Product Validation team conducted comparisons between MODIS Collection 6 and VIIRS Collection 1 NDSI-derived SCE cloud-free maps in the Wind River Range in Wyoming. They detected a small difference in the snow cover due to differences in the sensors, viewing geometry and acquisition times, with the overall agreement of 97% [35]. However, the limitations of these studies were as follows: (1) comparisons were implemented under cloud-free conditions or with very few clouds; (2) binary snow products produced by different NDSI thresholds may have brought uncertain disagreement, and thus the comparisons lacked a uniform standard; and (3) the quantitative analysis of the impact of cloud cover on snow cover consistency was inadequate. Furthermore, the generation of snow cover products was based on cloud mask products retrieved by different cloud-masking algorithms [36,37,38]. Though the temporal/spatial smoothing method can obtain the true snow presence across cloudy periods [39], too much difference in the cloud mask will impede these smoothing technologies and break the consistency. Hence, ignoring the influence of cloud cover may have resulted in biased conclusions on the snow cover agreement.
It is commonly recognized that clouds limit information acquisition from the ground and create daily data gaps from optical-based sensors [40,41,42,43]. Additionally, researchers have concentrated on the accuracy of cloud mask products, discrimination of clouds and snow and the effect of clouds on snow/ice identification [44,45,46,47]. Previous research revealed that the mean accuracy of the cloud mask used in the MODIS/Terra 8-day snow cover product in the snow season was low (19%) [48]. The issue of cloud obstruction was highlighted using MODIS daily snow cover products, which suffered from the influence of overcast conditions mainly in mountains and during the melting period [40]. An approximately 100 km stretch of a river that was up to 1.6 km wide was examined with daily data sampled at a 500 m resolution, and the results showed substantial differences between MODIS and VIIRS cloud mask products, especially when the river was ice-covered [49]. The performance of Landsat 8 OLI and MODIS cloud masks was assessed with the conclusion that snow-cloud discrimination caused the poor performance of cloud masks over snow cover [50]. Therefore, it is necessary to extensively analyze the impact of cloud cover on the consistency of snow cover products.
The primary objective of this research was to evaluate the impact of cloud mask on the consistency between VIIRS and MODIS snow cover products. This paper is organized as follows. Section 2 introduces the study areas, datasets and methods. Section 3 examines the consistency between MODIS and VIIRS snow cover products and analyzes the impact of cloud-masking algorithm differences. Section 4 compares the discrepancies of band tests in cloud-masking algorithms and discusses the seasonality of cloud cover difference. Finally, Section 5 presents the conclusions and discusses future developments of the cloud-masking algorithm.

2. Datasets and Methods
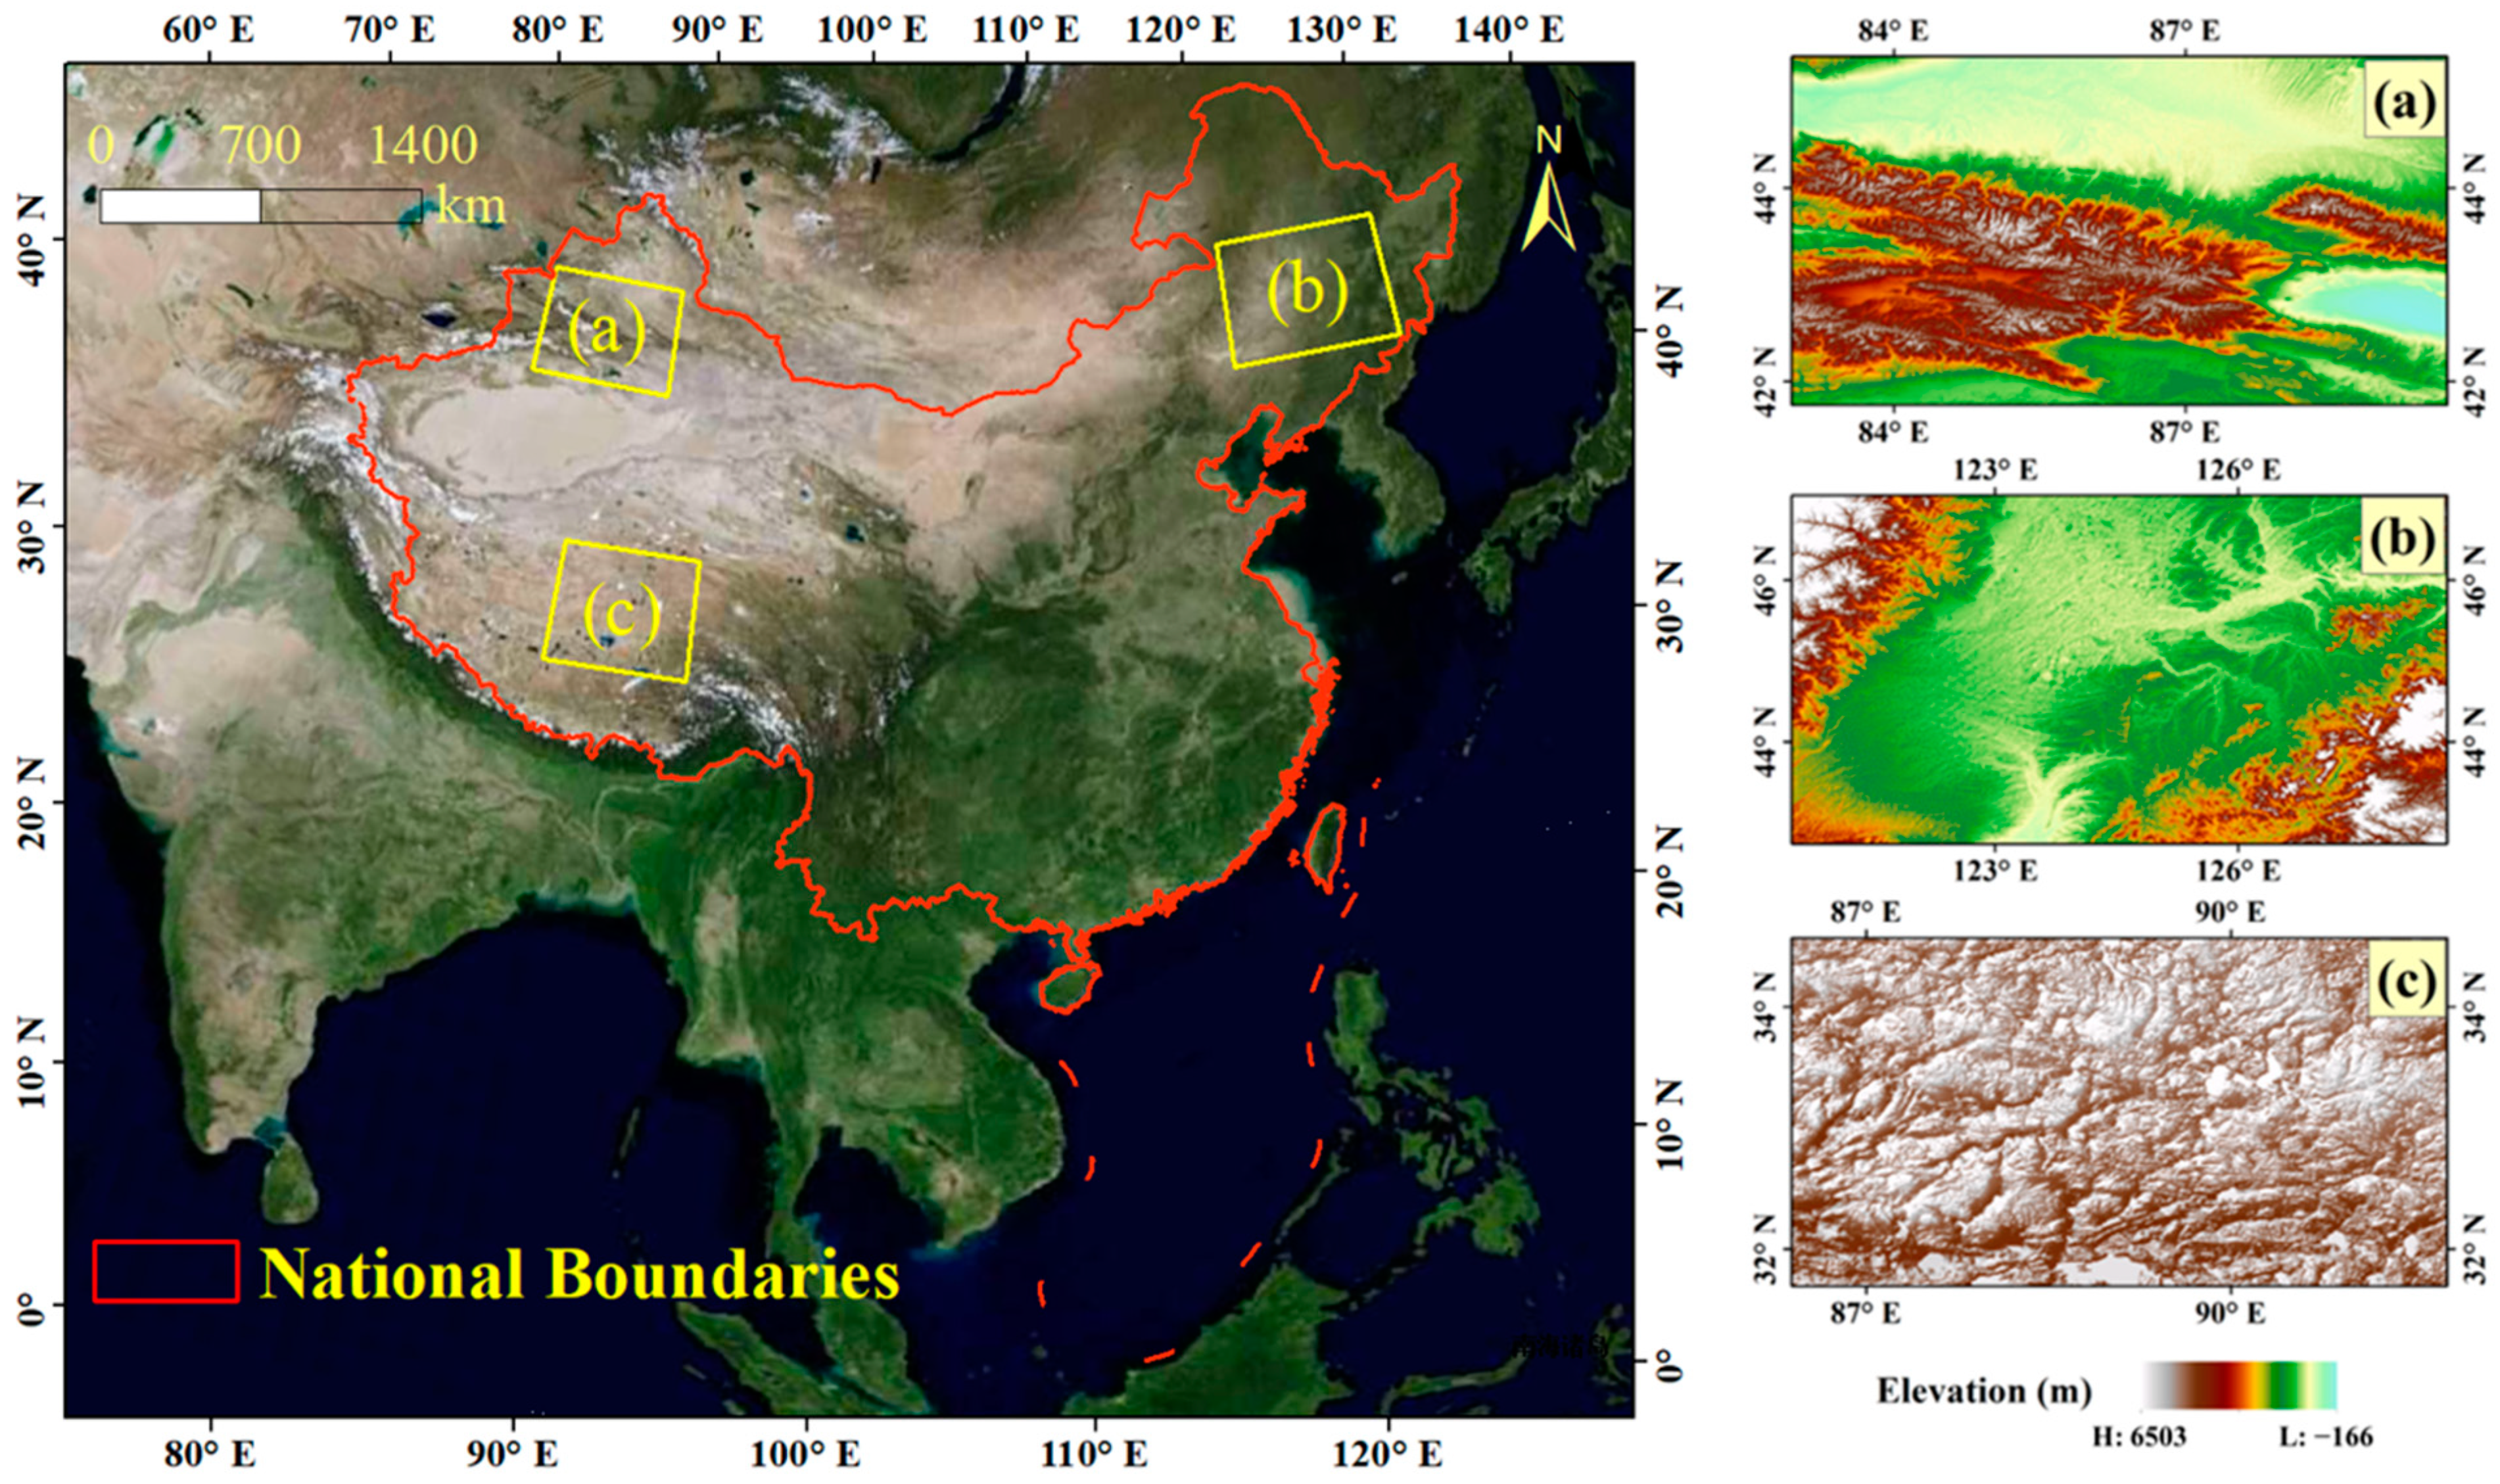
2.1. Study Regions

To evaluate the continuity of MODIS and VIIRS snow cover products, three test areas representing typical snow cover characteristics in China were chosen: Northeast China (NE), Northwest China (NW) and the Qinghai–Tibet Plateau (QT) (Figure 1) [51].
The predominant topography in NE China is mountains and plains. Boreal forests are widespread in the mountains, and farmland is located in the central plain. As the coldest region in China, the seasonal snow cover has a duration of approximately five months from November to March of the following year. Snowmelt runoff is an important water resource and is crucial for local agriculture development [52]. The NW is a typical arid and semi-arid area. In the NW, high mountains and their ranges and basins form complicated terrain. Mountains, plains and deserts are three major geographic components. The mean duration of snow cover is about 120 days, with a maximum of 1~2 m snow depth in some mountainous areas [53]. Seasonal snow cover is relatively stable both in NE and NW China [54]. The QT is known as the Asian water tower, with a mean elevation of more than 4000 m. It is rich in snow, and snowmelt water plays a critical role in river runoff and water supply. The QT has large areas of thin and unstable snowpack. Deep and persistent snowpack is present in some mountainous areas. Because of special climate conditions, snow cover is widely distributed with a short duration [55,56].

2.2. Datasets

In this study, two snow cover products, MYD10A1 (MODIS/AQUA Snow Cover Map Daily L3 Global 500 m SIN Grid Day) of Collection-6.1 (C6.1) [57,58] and VNP10A1 (VIIRS/SNPP Snow Cover Map Daily L3 Global 375 m SIN Grid Day) of Collection-1 (C1) [59,60], named using Earth Science Data Type (ESDT) conventions, were used to perform an intercomparison of snow cover consistency and evaluate the influence of cloud masks. The duration of one entire hydrological year and a snow season defined as from December to February was chosen. The MODIS onboard Aqua and the VIIRS onboard SNPP are recognized as quasi-synchronized, with equator-crossing times of approximately 1:30 pm (ascending) and 1:45 pm (ascending), respectively.
Both the VNP10A1 and MYD10A1 algorithms selected the best swath observation of the day for the ‘NDSI_Snow_Cover’ parameter. Pixels with ‘NDSI_Snow_Cover’ values in the range of 10–100, which is scaled by 100, were interpreted as snow, while pixels with values equal to 250 were interpreted as clouds. To facilitate cell-to-cell comparisons, the two datasets were reprojected onto a geographic grid, converted to a Geo-TIF format and resized to 500 m resolution using the nearest-neighbor method so that they would be well matched.

2.3. Methods

We aimed to evaluate the consistency of snow cover products between MODIS and VIIRS considering the impact of cloud mask. The comparison was conducted in three typical snow-covered test regions for one entire hydrological year (353 days, with 12 days missing due to Aqua’s data gap from 1 September 2019 to 31 August 2020) and the snow season (91 days from 1 December 2019 to 29 February 2020). The data from the ‘NDSI_Snow_Cover’ layers in VNP10A1 and MYD10A1 snow cover products were used. The snow season in this study was defined as the duration from December to February, which had the higher percentage of snow cover [61]. More detailed descriptions of snow phenology of the three test regions can be found in [62,63,64,65].
To quantify the consistency between MODIS and VIIRS, a quantitative accuracy analysis was performed with the following indicators. The mean bias between MODIS and VIIRS was represented as mBIAS, and RMSE represents the root mean square error. The correlation coefficient (R) had a range of [−1, +1], and a value closer to 1 indicated a stronger correlation between the two variables. The formulas of the accuracy indicators were as follows:
m B I A S = i = 1 N ( x i y i ) N
R M S E = 1 N i = 1 N ( x i y i ) 2
R = N i = 1 N x i y i i = 1 N x i i = 1 N y i N i = 1 N x i 2 ( i = 1 N x i ) 2 N i = 1 N y i 2 ( i = 1 N y i ) 2
where xi and yi are the values of NDSI snow cover pixel i in VIIRS and MODIS, respectively, and N is the number of snow cover pixels.
The MODIS and VIIRS cloud-masking algorithms are represented as MYD35 [66] and VIIRS Cloud Mask (VCM) [38], respectively. In the cloud-masking algorithms, the cloud mask confidence classification and snow/ice processing flags are critical to identify the cloud pixels, which were stored in binary format. We used the data directly and compared the differences in confidence classification and flags. The accuracy of cloud masks was verified by the algorithms, and also by [67]. Each cloud mask pixel with a 1 km spatial resolution in MYD35 was applied to the four corresponding 500 m pixels in MYD10A1. In parallel, each 750 m gridded cloud mask pixel in the VCM was applied to the four corresponding 375 m pixels in VNP10A1. The pixels of cloud mask were identified by the MODIS and VIIRS cloud-masking algorithms, and labeled in the snow cover products with the value of 250, and the pixels with no clouds were labeled as ‘snow’ or ‘not snow’ in both products. Here, the NDSI threshold of 0.1 was chosen to label the pixels as snow [34,65]. The pixels were labeled as snow in both products were considered to be under clear sky conditions.
A paired comparison was performed using the binary snow and cloud maps on their corresponding grid cells, respectively. Using the classified MODIS binary map as a reference, a confusion matrix was calculated. The confusion matrix was utilized to determine the overall agreement (OA) and disagreement (OD) between VIIRS and MODIS. OD was used to assess the differences in snow/cloud confusion between VIIRS and MODIS. The values in the confusion matrix represented average percentages over research days. The formulas were as follows:
O A = T P + T N T P + T N + F P + F N × 100 %;
O D = F N + F P T P + T N + F P + F N × 100 %;
where the true positive (TP) means that both VIIRS and MODIS were labeled as snow or both as clouds; true negative (TN) means that neither VIIRS nor MODIS were labeled as snow or as clouds; false positive (FP) means that VIIRS was labeled as no snow or clouds while MODIS was labeled as snow or clouds; and false negative (FN) means that VIIRS was labeled as snow/clouds while MODIS was labeled as no snow or clouds [68].

3. Results

3.1. NDSI Consistency under Clear Sky Conditions

The comparisons were made with NDSI-derived snow maps under clear sky conditions. The statistics are listed for both the entire hydrological year and snow season in Table 1, with all clouds excluded. The mean R-value was affected by the fact that there were fewer snow cover pixels in the entire hydrological year than the snow season, which could cause the R-value to be very small, even negative, and eventually lead to an overall reduction. If the three lowest values of R were discarded in the snow season due to the limited number of snow pixels caused by cloud obstruction, the range of R values increased from the original values of 0.74 and 0.79 to 0.77 and 0.81 in the NE and NW, respectively. Additionally, in the NE, NW and QT, the RMSE was lower than 0.1, and the mBIAS ranged from −0.013 to 0.041 both in the entire hydrological year and the snow season, respectively.
From the data in Table 1, it was clear that both the RMSE and mBIAS showed good agreement with high accuracy. In general, the NDSI snow cover under clear sky conditions was consistent between MODIS and VIIRS. Three images in the snow season were randomly selected, and the distributions of snow and clouds in MODIS and VIIRS are depicted in Figure 2a,b, respectively. The VIIRS-MODIS difference map is shown on the right column of Figure 2c, and ‘NA’ (black color in the difference map) shows neither VIIRS nor MODIS labeled as snow pixels. The NDSI snow cover map differences between VIIRS and MODIS were minor, with differences of −0.0079, +0.0410 and +0.0005 in the NE, NW and QT regions, respectively. Similarly, a negative difference indicated that the mean MODIS NDSI was lower than the mean VIIRS NDSI.

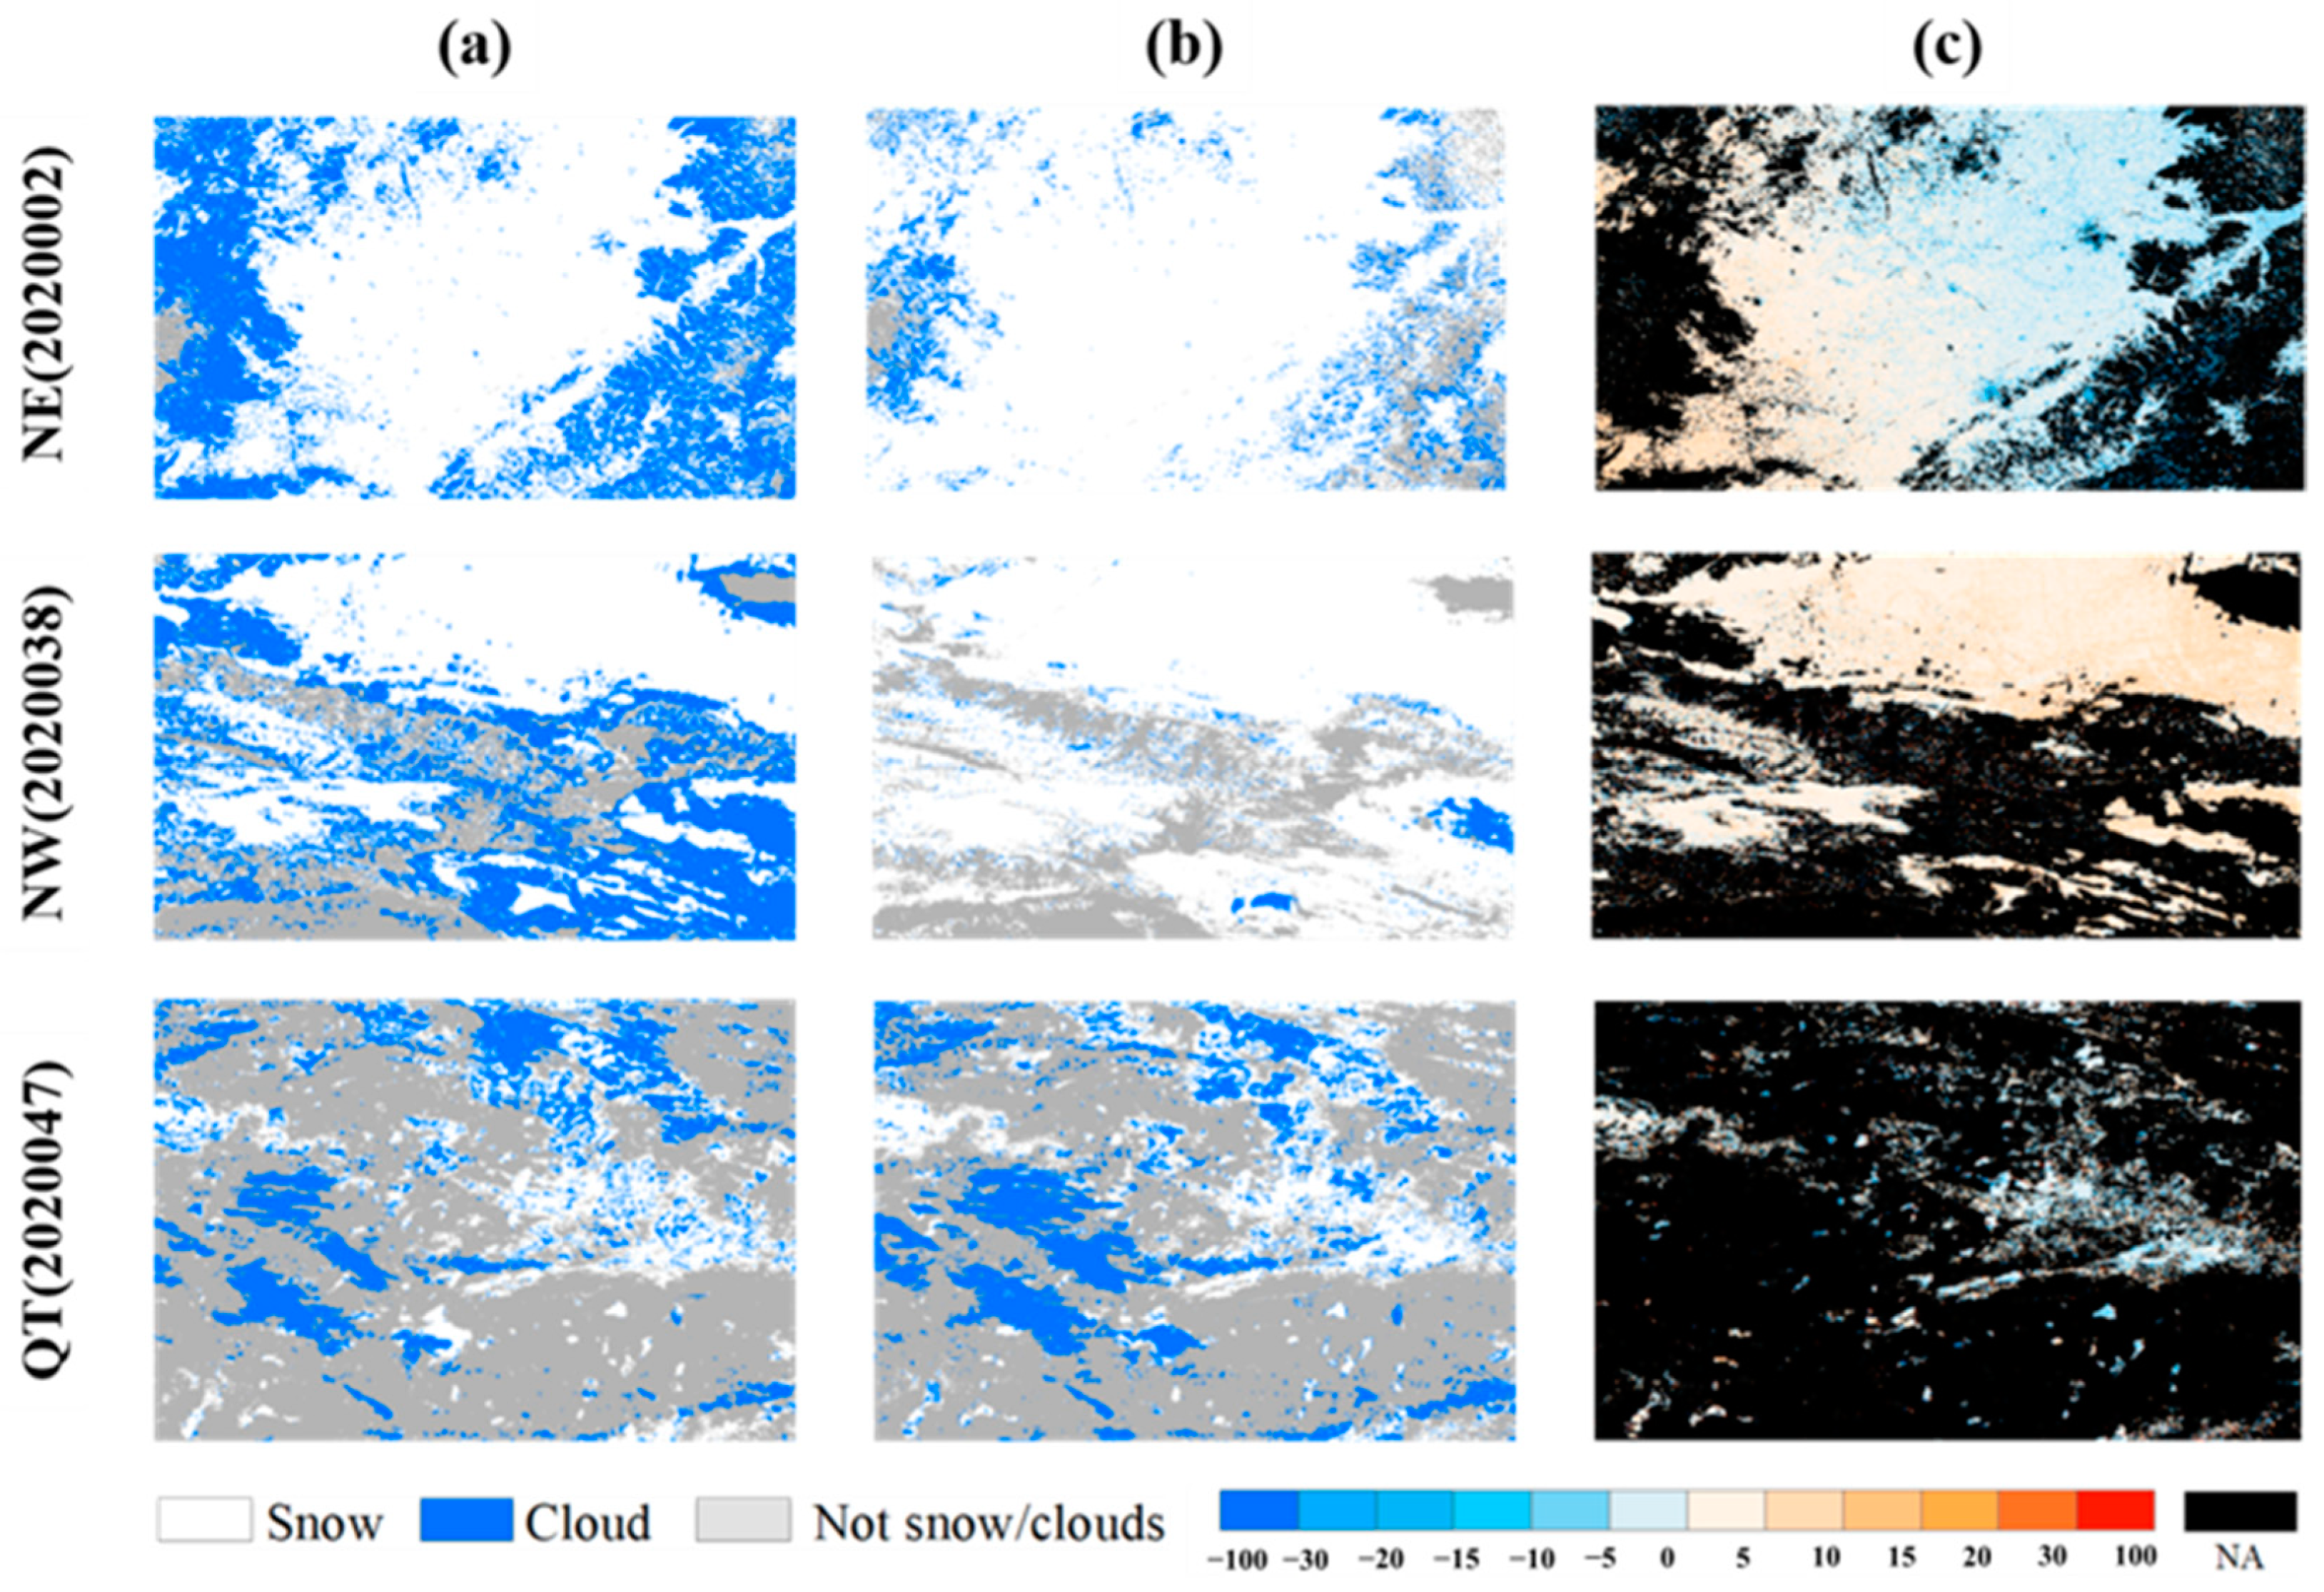
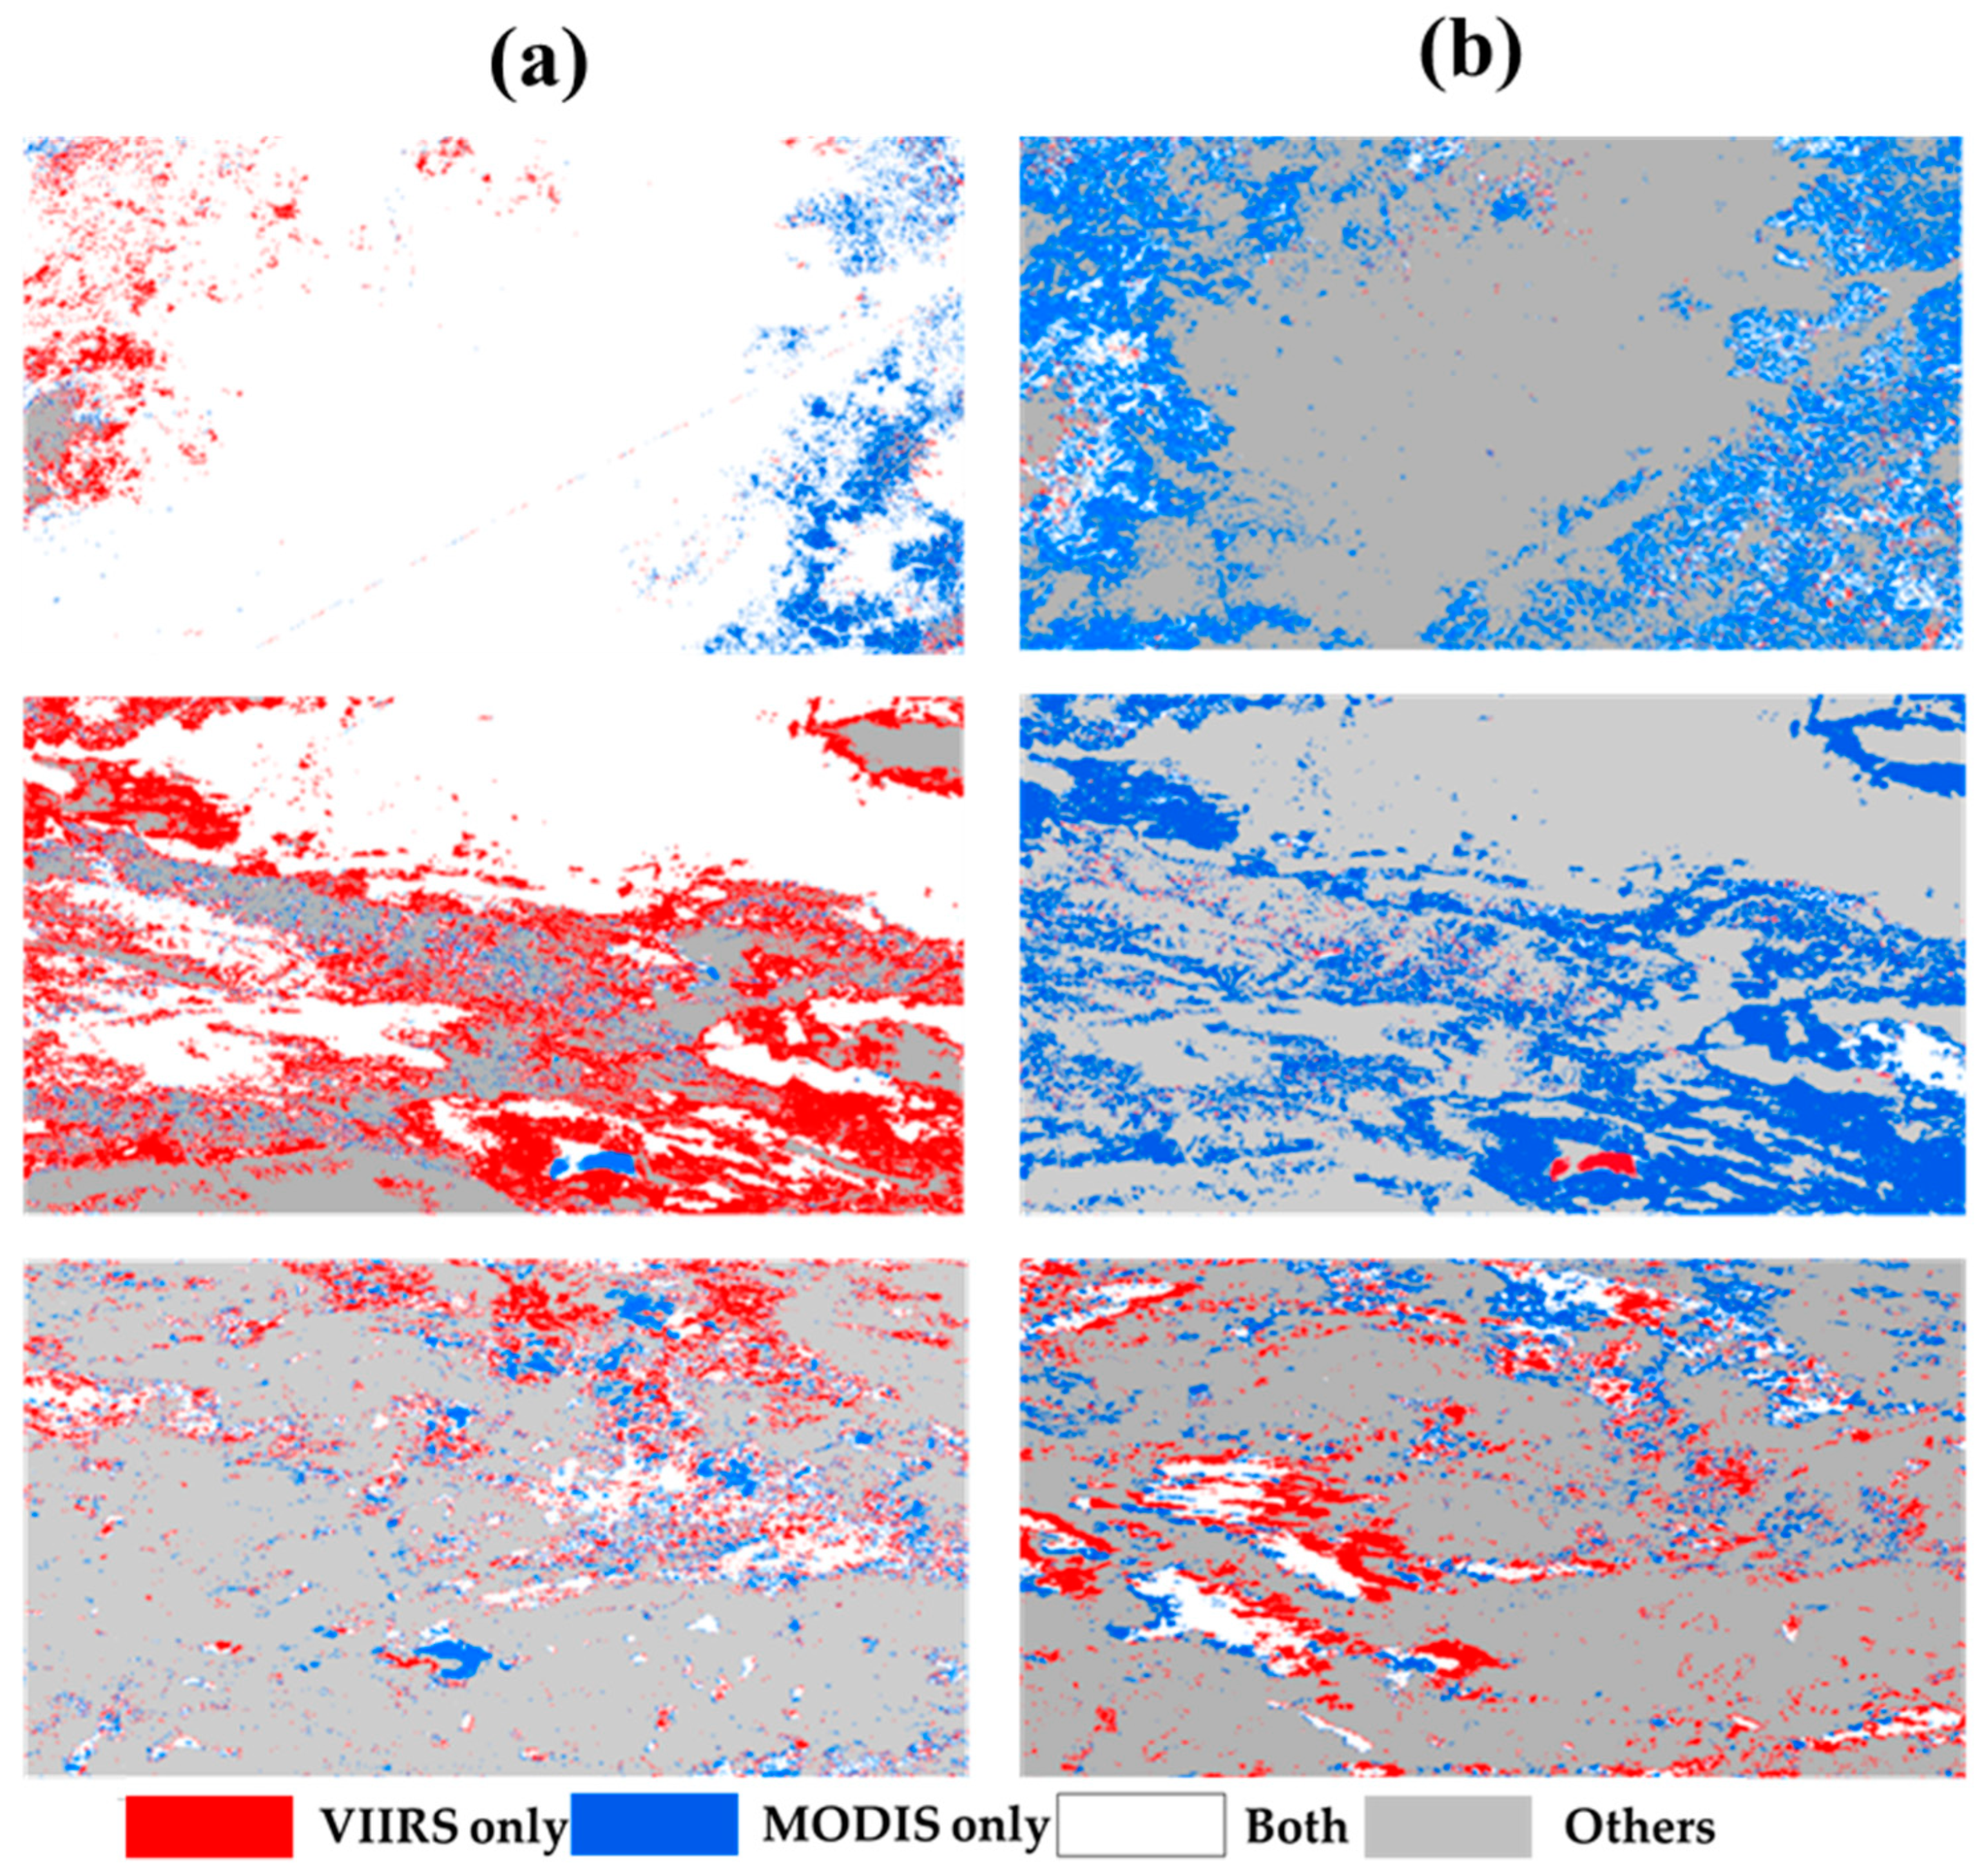
3.2. Consistency Analysis of Snow, Cloud and No Snow/Cloud Cover

Snow-covered areas (SCAs) in the three test areas were calculated from VIIRS and MODIS binary snow maps and displayed throughout the snow season (between 1 December 2019 and 29 February 2020) (Figure 3). In VIIRS and MODIS, the average SCA values were 9.6 × 10⁴ km2 and 5.1 × 10⁴ km2 in the NE, 6.2 × 10⁴ km2 and 3.4 × 10⁴ km2 in the NW and 3.2 × 10⁴ km2 and 2.1 × 10⁴ km2 on the QT, respectively. The SCA was clearly larger in VIIRS than in MODIS, especially in the NE and NW.
The snow-covered percentages (SCPs) from MODIS and VIIRS were also compared throughout the entire hydrological year and snow season. Scatter plots of daily SCPs in the three test regions illustrated that the SCP in VIIRS was higher than that in MODIS, especially in the snow season (Figure 4), with several days of lower SCPs only in the QT. The statistical results indicated that in the NE and NW, the average SCP in VIIRS was nearly twice as much as that in MODIS, both in the entire hydrological year and snow season, while the difference was slightly smaller in the QT.
Binary cloud maps were used to evaluate and analyze the consistency of cloud cover products through the entire hydrological year and snow season. Scatter plots of the daily cloud cover percentage (CCP) in the three test regions are illustrated between VIIRS and MODIS in Figure 5. On each day of the snow season, the CCP in MODIS was higher than that in VIIRS both in the NE and NW, with several days of lower CCPs only in the QT. The statistics demonstrate that in the NE and NW, the average CCP in MODIS was nearly twice as high as that in VIIRS in the snow season. The difference was slightly smaller on the QT. ‘No snow/no cloud’ cover pixels included pixels showing lakes and other land cover types, excluding all other pixels of snow or clouds. Scatter plots of the daily no snow or no cloud cover percentages in the three test regions are illustrated between VIIRS and MODIS in Figure 6. The percentage of no snow/no cloud cover in VIIRS was close to that in MODIS, especially in the NE and NW in the snow season.

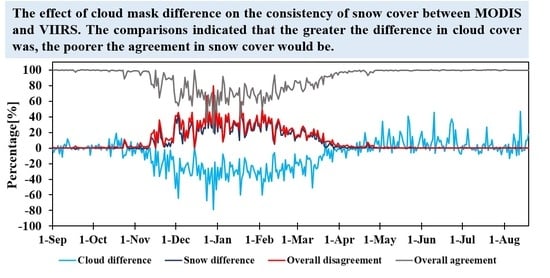
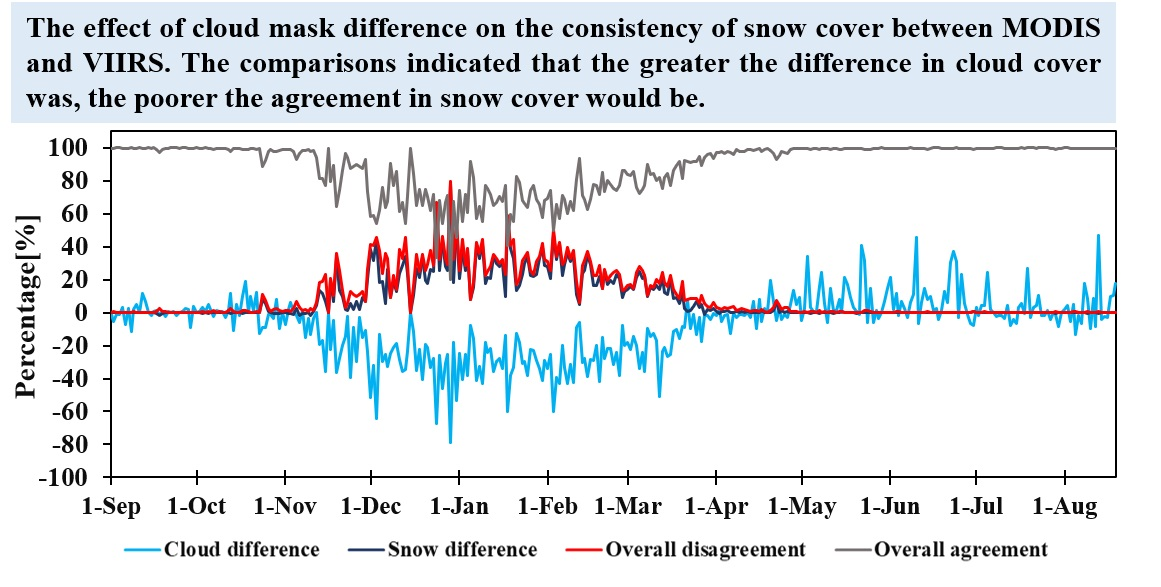
3.3. Impact of Cloud Mask on Snow Cover Consistency

Three selected images were used to interpret the distribution difference of snow and clouds. The snow and cloud cover distribution difference map (Figure 7) demonstrated that VIIRS presented much more snow, whereas MODIS showed many more clouds on the whole.
The significant influence of cloud cover on snow cover consistency was quantitatively evaluated. Considerable differences have been found under clear sky conditions and real scenarios with cloud cover (Table 2). It was clearly demonstrated that under clear sky conditions, the OA was significantly improved by approximately 10% in the entire hydrological year and by 15% to 30% in the snow season compared to the OA under cloudy conditions. Cloud obscuration has a significant impact on snow cover consistency, as evidenced by the dramatic increase in OA. In the NE and NW, there was a large increment in the OA. A possible reason may be the disagreement of snow and cloud cover due to low solar declination [69]. In the QT, the dominant no-snow pixels contributed to the smaller increment in the OA under cloudy and clear sky conditions.

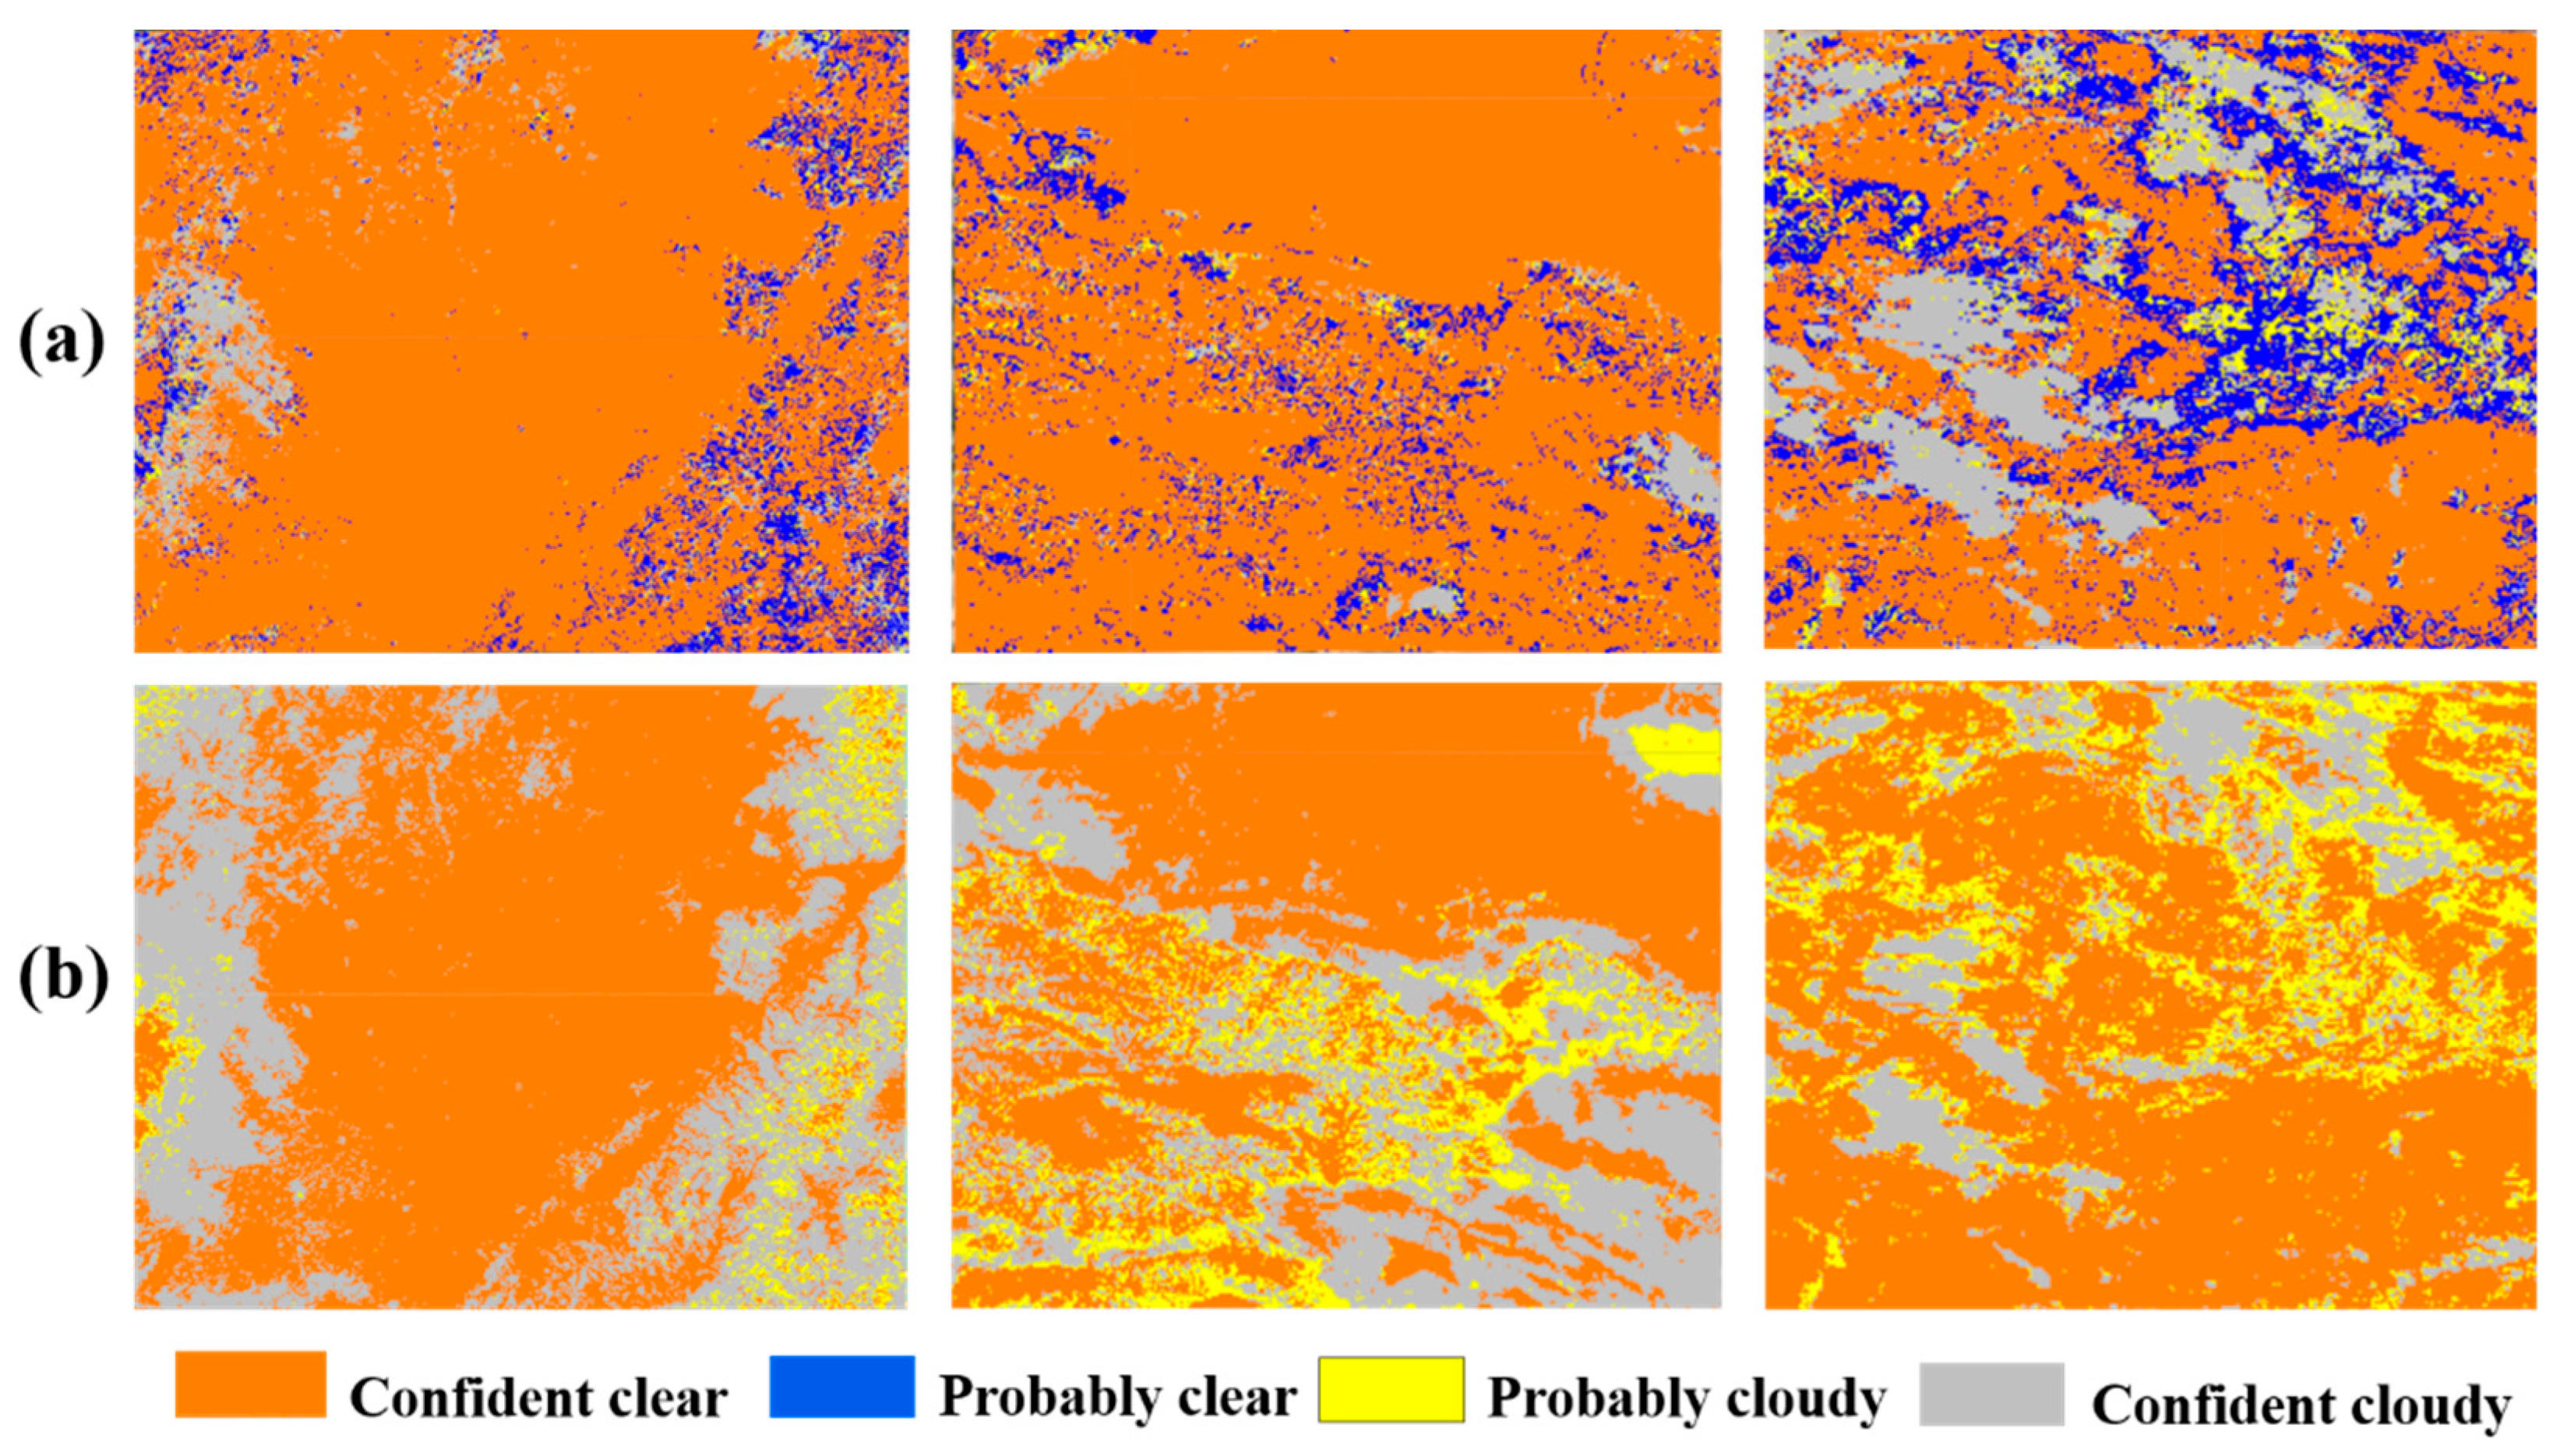
3.4. Cloud Mask Confidence Classification Strategy

In the cloud-masking algorithm, there were four possible confidence levels, which were labeled as unobstructed field-of-view (FOV) flags: confidently clear (confidence > 0.99), probably clear (0.99 ≥ confidence > 0.95), probably cloudy (0.95 ≥ confidence > 0.66) and confidently cloudy (confidence ≤ 0.66).
The cloud mask confidence classification strategy is different between VCM and MYD35. For the VCM, the confidence levels of probably cloudy, confidently clear and probably clear were assumed to represent clear sky conditions, while only the confidently cloudy conditions were considered to represent clouds. In MYD35, the confidence levels of confidently clear and probably clear were categorized as clear sky, while those of confidently cloudy and probably cloudy were classified as clouds. It can be seen that the clear sky conservative approach was utilized in MYD35. Three images were used to illustrate the cloud mask confidence levels. From the confidence level maps (Figure 8), the probably cloudy level was categorized as a cloud mask in MYD35, which made MODIS show many more clouds than VIIRS to a certain extent. The probably clear level was rare in MODIS/Aqua all over the world, so it was absent here. In MODIS, the level flags with probably cloudy conditions were dispersed, especially in cloud transition regions, and contributed to the large cloud coverage. As a result, greater amounts of clouds in some situations were observed in MODIS than in VIIRS.

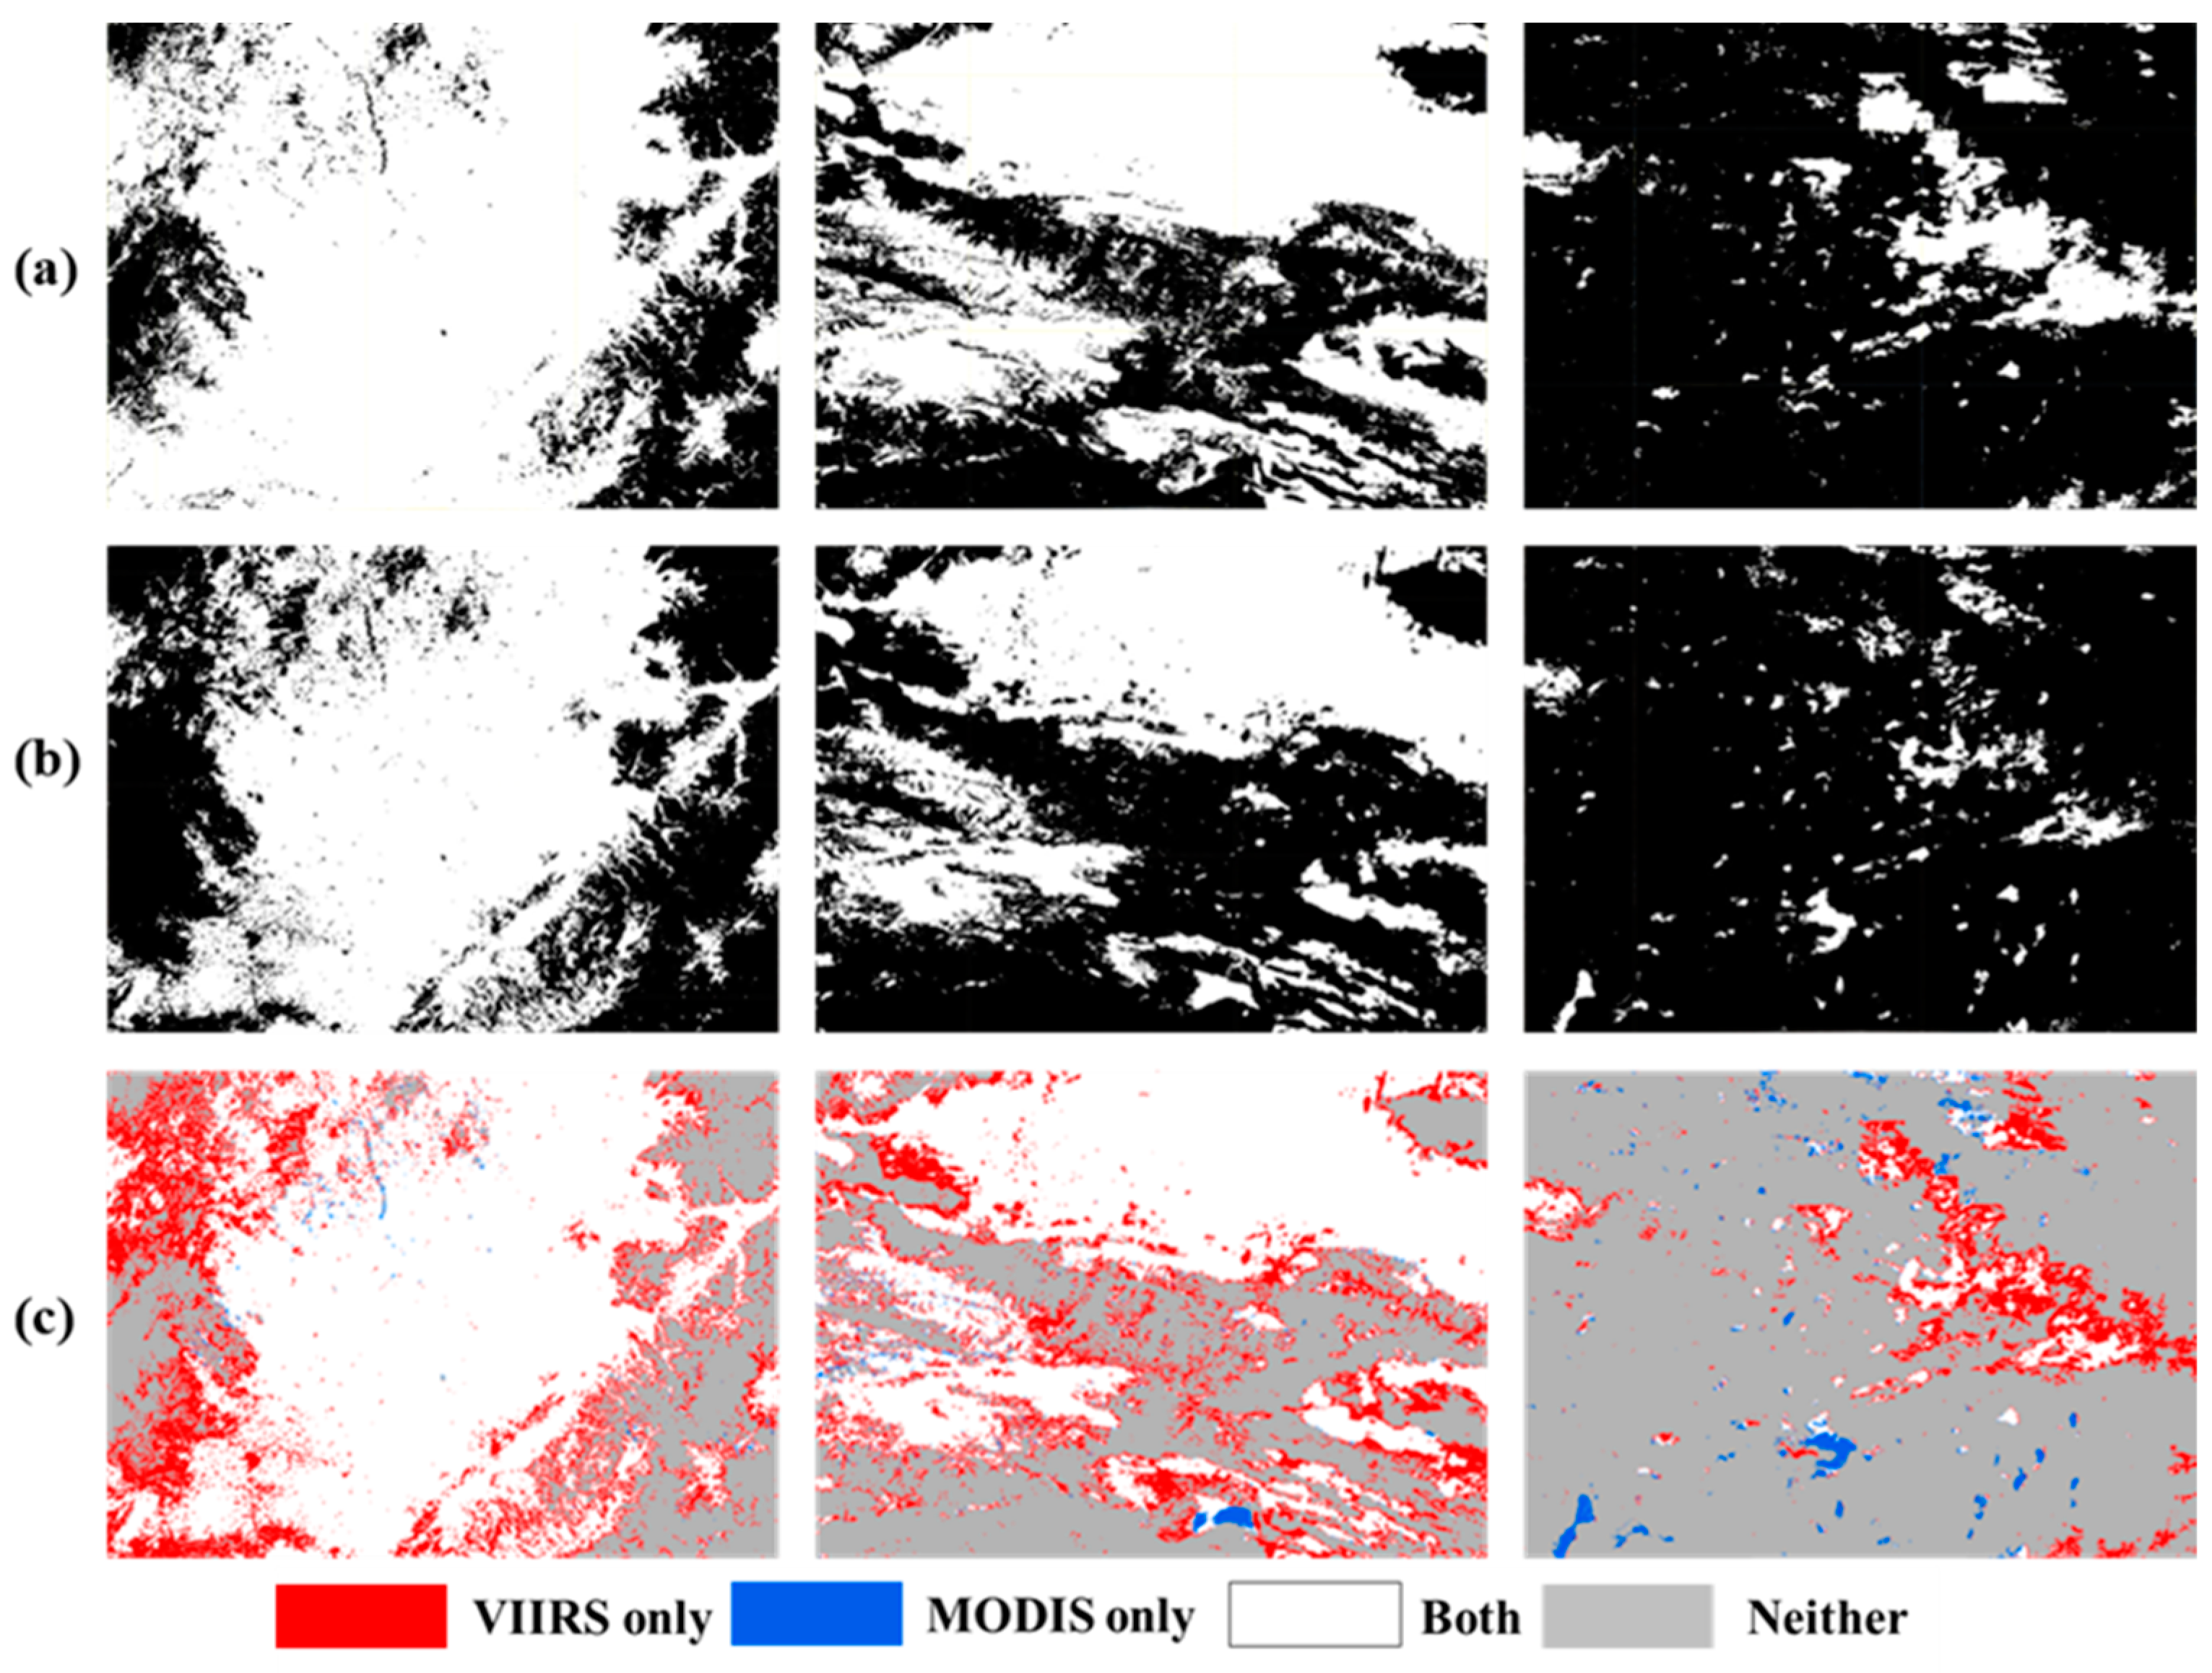
3.5. Snow/Ice Flags in Cloud Mask Algorithm Processing

In the cloud mask algorithm processing, determining surface background conditions is a preliminary step. Snow/ice flags are used to label the surface types of snow/ice. Both in VCM and MYD35, the operation for detecting snow/ice takes precedence over all other surface-type processing paths, such as coast, desert, land, and water.
In daytime conditions, in VCM, a temperature test was first used to judge the snow pixels. Then, the NDSI (with a ratio of band I1 centered at 0.56 µm and band I3 centered at 1.64 µm) and reflection threshold tests were used to prevent missing certain snow pixels. In MYD35, just the NDSI (with a ratio of band 4 centered at 0.55 µm and band 7 centered at 2.13 µm) was used to identify snow- or ice-covered areas. In warmer parts of the globe, the National Snow and Ice Data Center (NSIDC) ancillary snow and ice dataset was used as a check on the NDSI algorithm in MODIS [66,70]. Therefore, the difference in snow/ice flags between VIIRS and MODIS probably caused the difference in cloud identification. Three days of snow/ice flags were illustrated in the NE, NW and QT regions (Figure 9a,b). It was obvious that comparable discrepancies (Figure 9c) in snow/ice flags produced unclear disagreement in cloud identification.

4. Discussion

4.1. Band Tests in Cloud-Masking Algorithms

Given the inherent differences between MODIS and VIIRS sensors in sensor performance and band settings, the 36-channel MODIS offers the opportunity for multispectral approaches to cloud detection, while the VIIRS has a subset of these in 21 bands plus a day/night panchromatic band [71,72]. To produce the cloud mask, 16 out of 22 bands in VIIRS are utilized, while 22 out of 36 bands in MODIS are used [73].
The cloud-masking algorithms both in VIIRS and MODIS apply many ‘fuzzy logic’ tests to a pixel. A series of visible (VIS)/near-infrared (NIR) thresholds and ratio tests, as well as brightness temperature (BT) thresholds and brightness temperature difference (BTD) tests, were performed to determine whether a pixel is obstructed by a cloud or is cloud-free. The cloud detection band tests are categorized into five groups: IR and VIS/NIR reflectance threshold tests, BTD tests, and NIR and IR thin cirrus tests. These tests are grouped so that independence between them is maximized. When all the tests within a group have been performed, the minimum resulting confidence among them is considered to be representative of that group. A final step is to combine the group confidences, which are assumed to be independent, by multiplying them and taking the Nth root.
The band tests differences in the five test groups between MYD35 and VCM (Table 3) demonstrated that different numbers of bands and band combinations were utilized in cloud-masking algorithms. Therefore, MODIS and VIIRS may produce conflicting results for cloud cover in various scenarios.

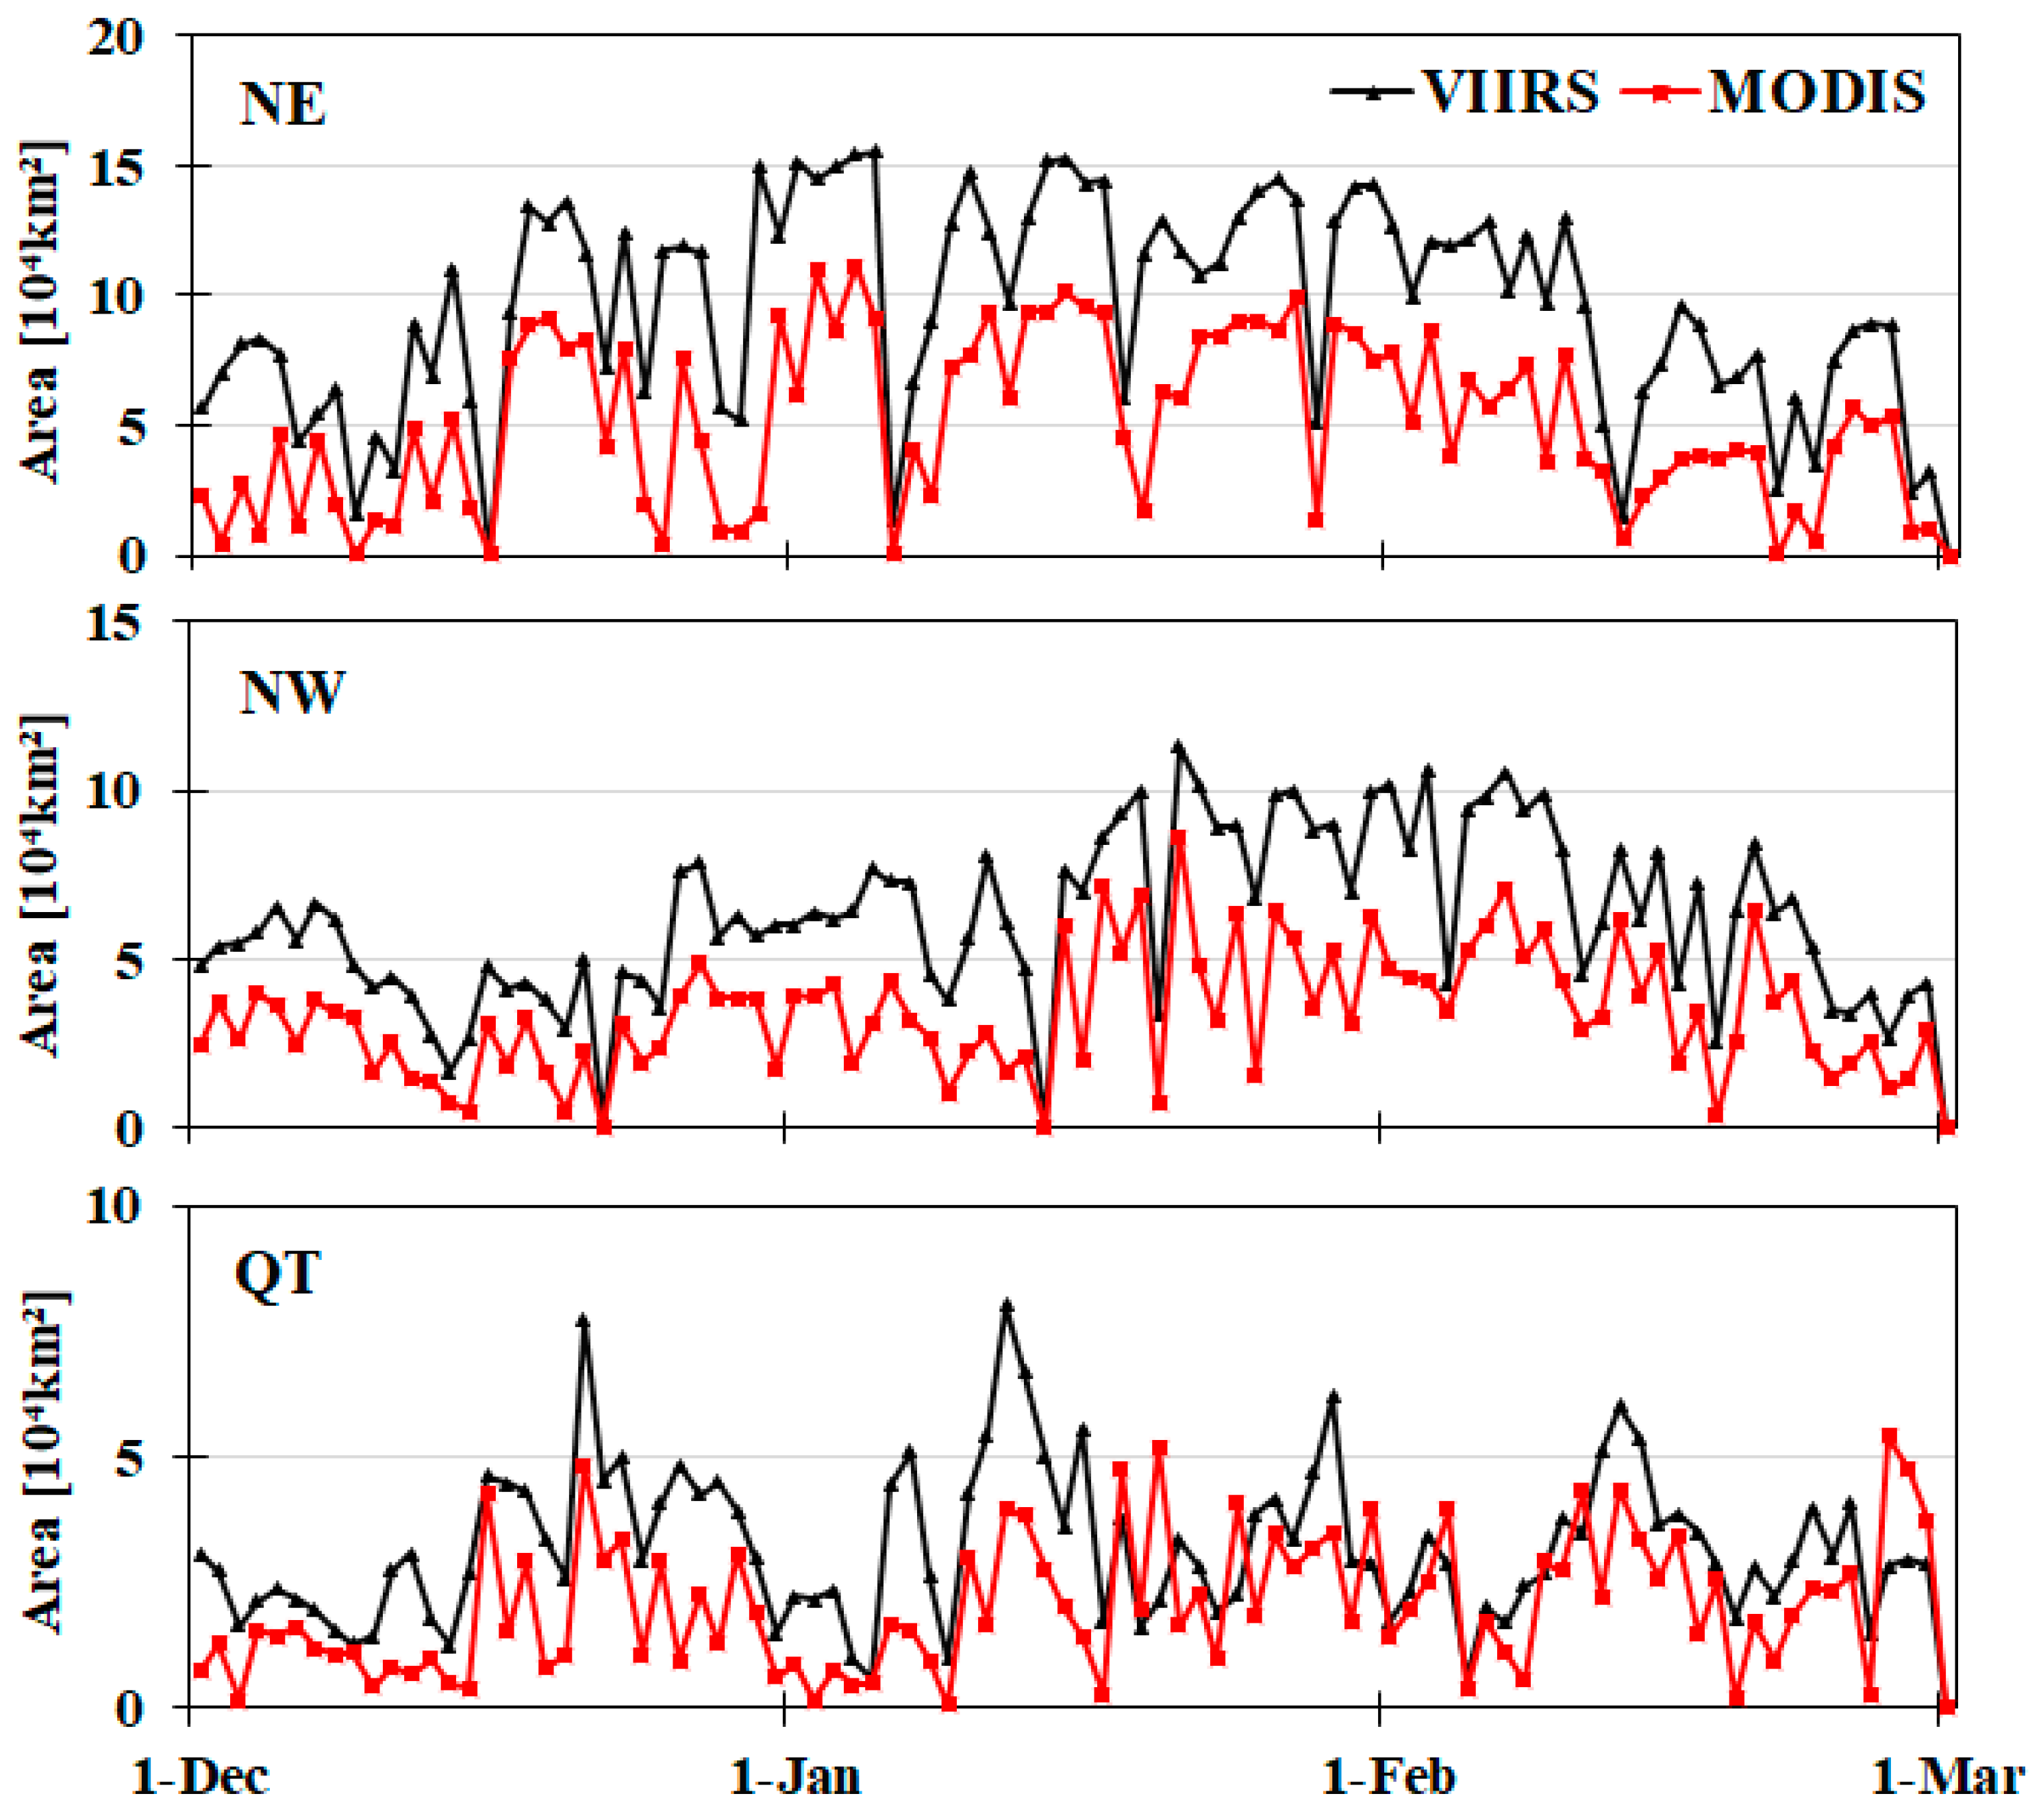
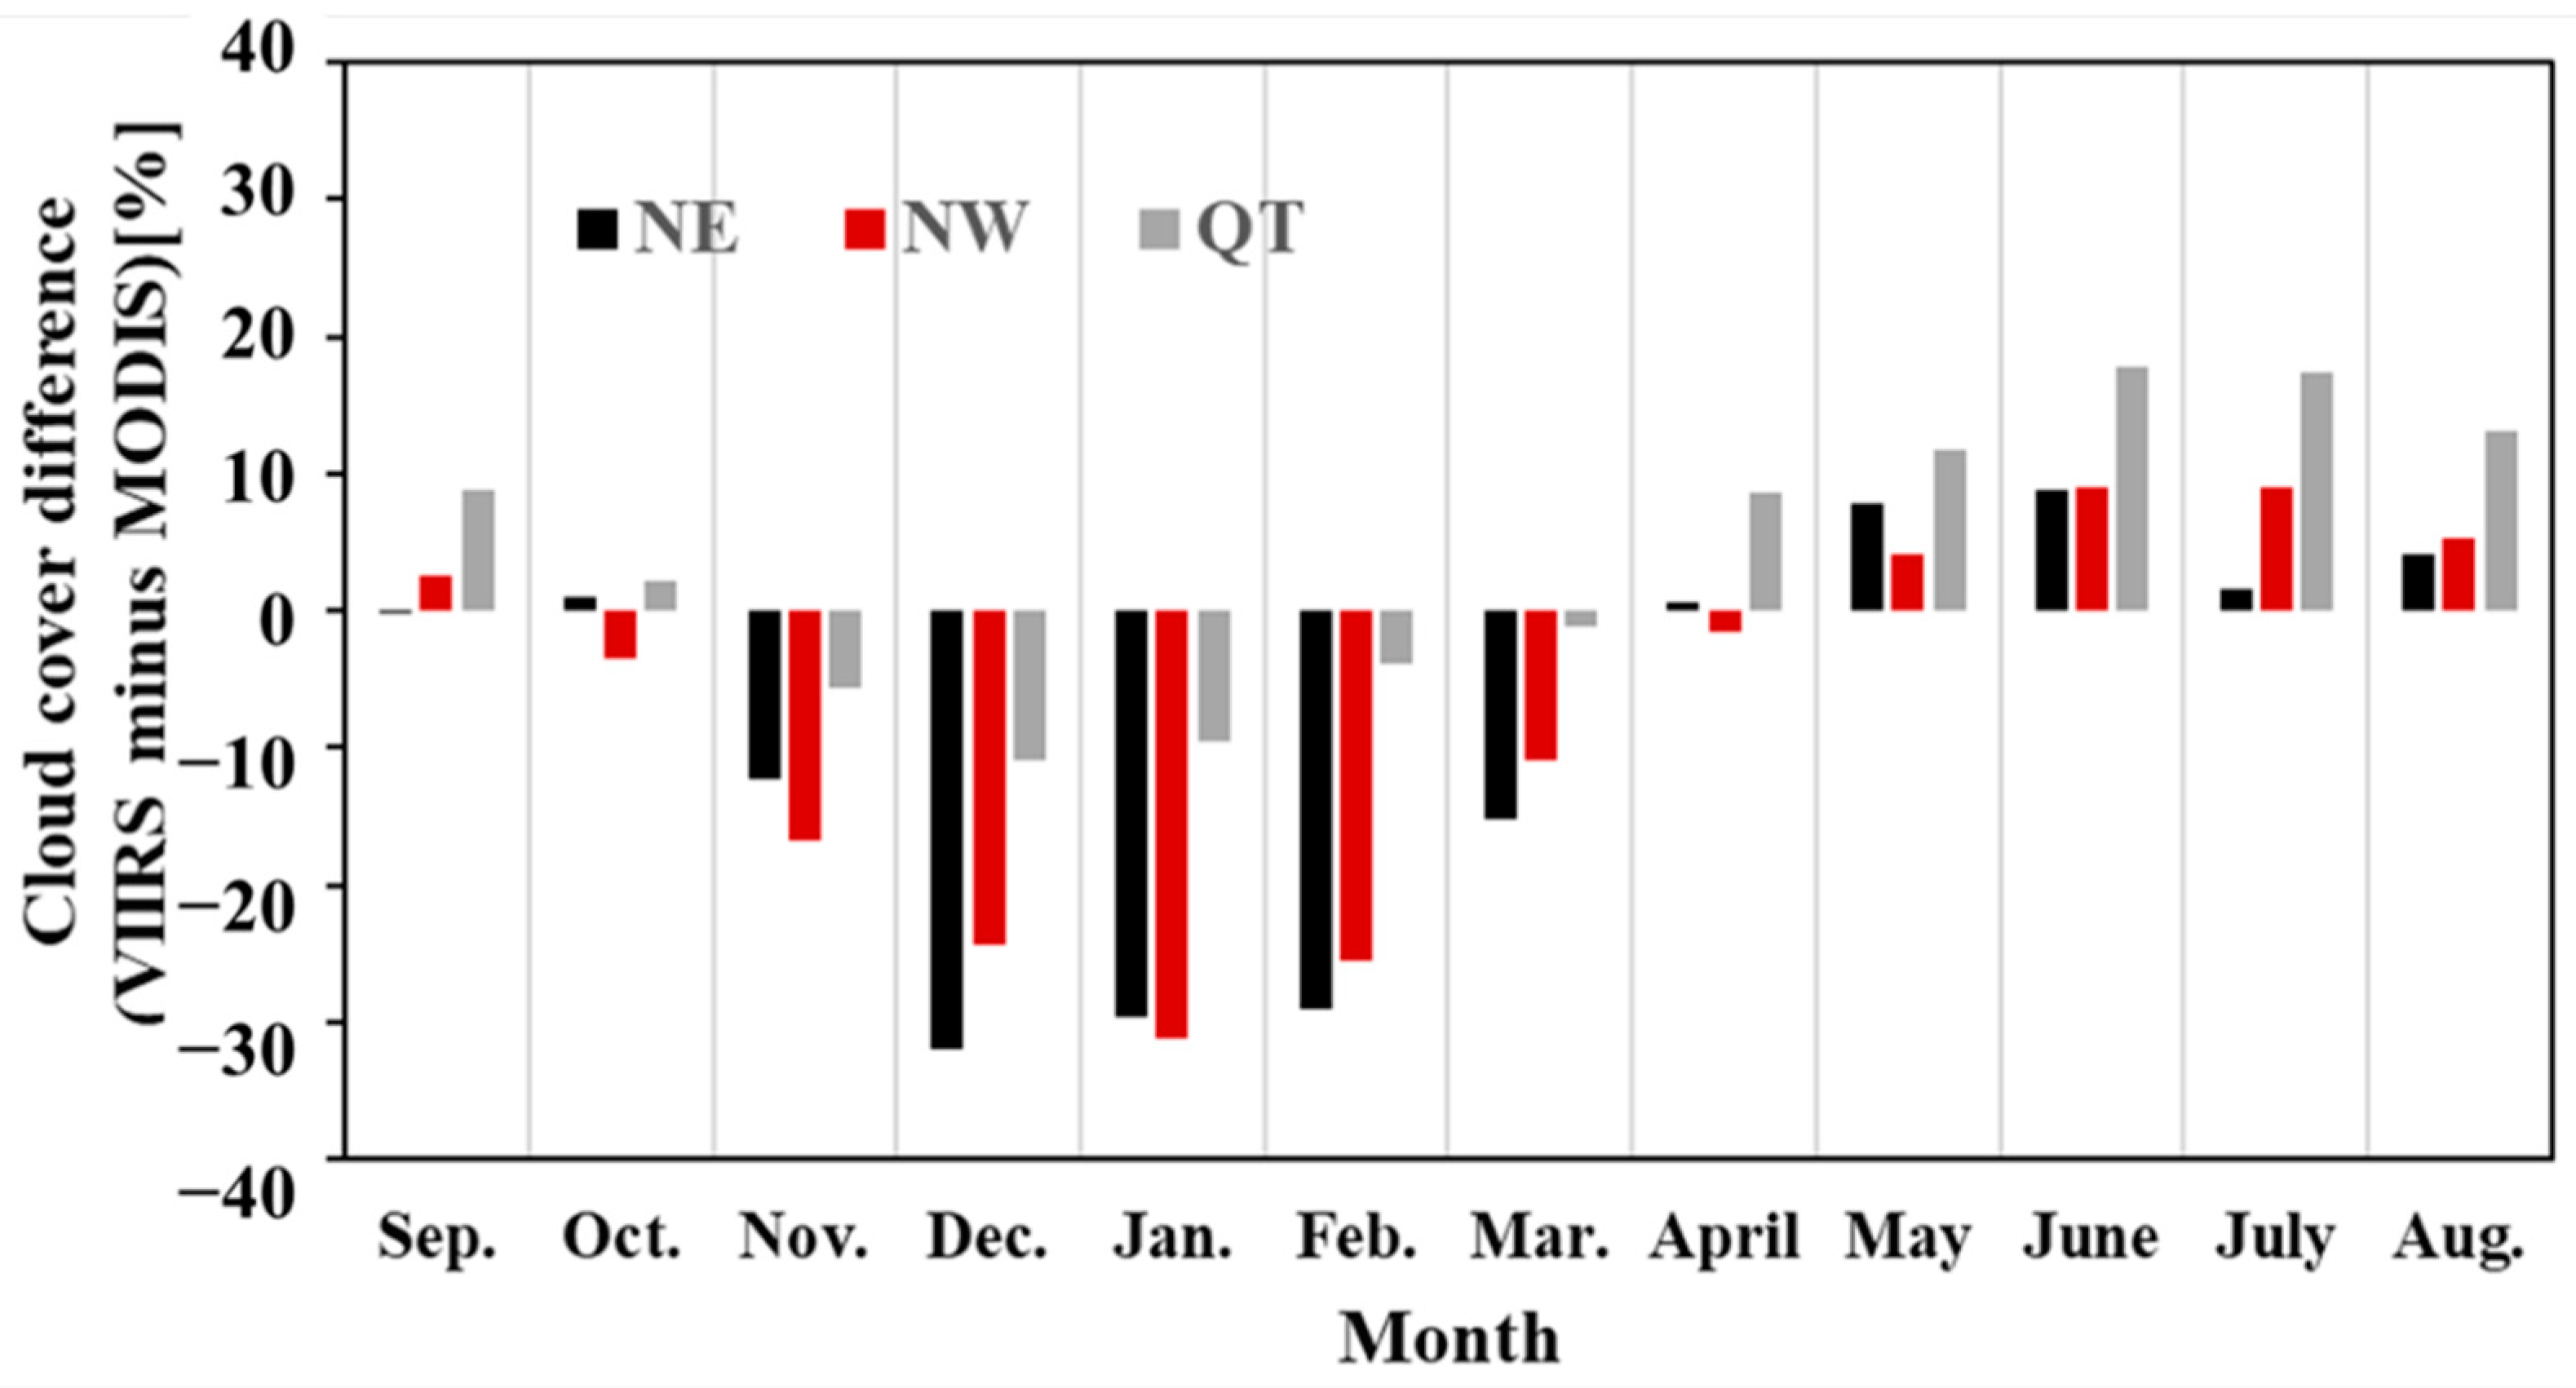
4.2. Seasonality of Cloud Cover Difference

As mentioned above, the differences in cloud-masking algorithms result in discrepancies in cloud cover products, which further affect the consistency of snow cover products. Therefore, the improvement of cloud-masking algorithm consistency is crucial to the consistency of snow cover products.
However, the seasonal fluctuations in cloud cover difference are remarkable between VIIRS and MODIS in the three test regions (Figure 10). It is obvious that negative differences exist during the snow season (from October to March) and positive differences exist during the non-snow season (from April to September). This indicates that the existence and gradual increase in snow cover result in larger cloud cover differences between VIIRS and MODIS. It is unfeasible to develop a seasonally changing cloud identification algorithm in snow product production. The MODIS-VIIRS cloud-masking algorithm (MVCM) probably provides a feasible approach to maintain cloud cover consistency with VIIRS and MODIS and uses only the limited common bands in both sensors [67]. The MVCM algorithm is under development, and more extensive validation studies and improvements are needed to establish confidence in it. For MODIS, the strict cloud discrimination algorithm causes the product to capture less snow than VIIRS, which is able to distinguish clouds from snow with greater accuracy. Therefore, in order to assure the consistency of snow cover between VIIRS and MODIS, the better way is to learn from the cloud-masking algorithm of VIIRS and further improve the MODIS cloud detection algorithm, which is confused by snow seasonality.

5. Conclusions

This study extensively analyzed and evaluated the impact of cloud-masking algorithms on the consistency of snow cover products from VIIRS and MODIS. The important conclusions are as follows:
(1)
Cloud cover condition strongly affects the potential of snow cover observation.
(2)
Cloud cover presents seasonal patterns in NE, NW and QT regions.
(3)
VIIRS presents higher performance than MODIS in cloud detection in the snow season.
(4)
In particular, MODIS shows significantly more clouds than does the VIIRS product from November to March because of the clear sky conservative approach in MODIS. The usage of the cloud mask of VIIRS may produce acceptable performance in the consistency of the two snow cover products.
The comprehensive analysis of cloud-masking algorithms supports the reduction in the impact of cloud mask on the consistency of MODIS and VIIRS snow cover products. In the future, in order to ensure the consistency of snow cover between VIIRS and MODIS, perfecting the cloud-masking algorithm appears to be the best solution to improve snow classification accuracy. The optimization and usage of the VIIRS cloud-masking algorithm to update the MODIS would be a better choice in order to obtain a long time-series snow cover product. Additionally, a long time-series data should be performed to further investigate the relationship between cloud-masking algorithms and snow cover.

Author Contributions

Conceptualization, T.C.; Methodology, A.L., T.C. and L.D.; Supervision, J.W. and J.D.; Writing—original draft, A.L.; Writing—review and editing, T.C., X.H. and L.D. All authors have read and agreed to the published version of the manuscript.

Funding

This research was funded by the National Natural Science Foundation of China (grant no. 42125604, 42171143 and 41971293), the Second Tibetan Plateau Scientific Expedition and Research Program (STEP) (grant no. 2019QZKK0201) and the Natural Science Foundation of Gansu Province (grant no. 22JR5RE1042).

Data Availability Statement

The VNP10A1 and MYD10A1 data for the three test regions are downloaded from the National Snow and Ice Data Center.

Acknowledgments

The authors thank the editors and anonymous reviewers for their constructive comments and suggestions for improving this paper.

Conflicts of Interest

The authors declare no conflict of interest.

References

  1. IPCC. IPCC Special Report on the Ocean and Cryosphere in a Changing Climate: Summary for Policymakers; IPCC: Geneva, Switzerland, 2019. [Google Scholar]
  2. Henderson, G.R.; Peings, Y.; Furtado, J.C.; Kushner, P.J. Snow–atmosphere coupling in the Northern Hemisphere. Nat. Clim. Chang. 2018, 8, 954–963. [Google Scholar] [CrossRef]
  3. Kumar, O.S.R.U.B. Eurasian snow cover and seasonal forecast of Indian summer monsoon rainfall. Hydrol. Sci. J. 1988, 33, 515–525. [Google Scholar] [CrossRef] [Green Version]
  4. Groisman, P.Y.; Karl, T.R.; Knight, R.W. Observed Impact of Snow Cover on the Heat Balance and the Rise of Continental Spring Temperatures. Science 1994, 263, 198–200. [Google Scholar] [CrossRef] [PubMed]
  5. Cohen, J.; Rind, D. The Effect of Snow Cover on the Climate. J. Clim. 1991, 4, 689–706. [Google Scholar] [CrossRef]
  6. Barnett, T.P.; Adam, J.C.; Lettenmaier, D.P. Potential impacts of a warming climate on water availability in snow-dominated regions. Nature 2005, 438, 303–309. [Google Scholar] [CrossRef]
  7. Immerzeel, W.W.; Van Beek, L.P.H.; Bierkens, M.F.P. Climate change will affect the Asian Water Towers. Science 2010, 328, 1382–1385. [Google Scholar] [CrossRef]
  8. Pulliainen, J.; Luojus, K.; Derksen, C.; Mudryk, L.; Lemmetyinen, J.; Salminen, M.; Ikonen, J.; Takala, M.; Cohen, J.; Smolander, T.; et al. Patterns and trends of Northern Hemisphere snow mass from 1980 to 2018. Nature 2020, 581, 294–298. [Google Scholar] [CrossRef]
  9. Lievens, H.; Demuzere, M.; Marshall, H.-P.; Reichle, R.H.; Brucker, L.; Brangers, I.; De Rosnay, P.; Dumont, M.; Girotto, M.; Immerzeel, W.W.; et al. Snow depth variability in the Northern Hemisphere mountains observed from space. Nat. Commun. 2019, 10, 4629. [Google Scholar] [CrossRef] [Green Version]
  10. Donald, J.R.; Soulis, E.D.; Kouwen, N.; Pietroniro, A. A Land Cover-Based Snow Cover Representation for Distributed Hydrologic Models. Water Resour. Res. 1995, 31, 995–1009. [Google Scholar] [CrossRef]
  11. Hall, D.K.; Kelly, R.E.J.; Riggs, G.A.; Chang, A.T.C.; Foster, J.L. Assessment of the relative accuracy of hemispheric-scale snow-cover maps. Ann. Glaciol. 2002, 34, 24–30. [Google Scholar] [CrossRef]
  12. Hall, D.K.; Riggs, G.A.; Salomonson, V.V. Development of methods for mapping global snow cover using moderate resolution imaging spectroradiometer data. Remote Sens. Environ. 1995, 54, 127–140. [Google Scholar] [CrossRef]
  13. Barnes, W.; Xiong, X.; Salomonson, V. Status of terra MODIS and aqua modis. Adv. Space Res. 2003, 32, 2099–2106. [Google Scholar] [CrossRef]
  14. Justice, C.; Townshend, J.; Vermote, E.; Masuoka, E.; Wolfe, R.; Saleous, N.; Roy, D.; Morisette, J. An overview of MODIS Land data processing and product status. Remote Sens. Environ. 2002, 83, 3–15. [Google Scholar] [CrossRef]
  15. Salomonson, V.V.; Barnes, W.; Masuoka, E.J. Introduction to MODIS and an Overview of Associated Activities. In Earth Science Satellite Remote Sensing; Springer: Berlin/Heidelberg, Germany, 2006; Volume 1, pp. 12–32. [Google Scholar] [CrossRef]
  16. Immerzeel, W.; Droogers, P.; de Jong, S.; Bierkens, M. Large-scale monitoring of snow cover and runoff simulation in Himalayan river basins using remote sensing. Remote Sens. Environ. 2009, 113, 40–49. [Google Scholar] [CrossRef]
  17. Pu, Z.; Xu, L.; Salomonson, V.V. MODIS/Terra observed seasonal variations of snow cover over the Tibetan Plateau. Geophys. Res. Lett. 2007, 34, L06706. [Google Scholar] [CrossRef] [Green Version]
  18. Riggs, G.A.; Hall, D.K.; Román, M.O. Overview of NASA’s MODIS and Visible Infrared Imaging Radiometer Suite (VIIRS) snow-cover Earth System Data Records. Earth Syst. Sci. Data 2017, 9, 765–777. [Google Scholar] [CrossRef] [Green Version]
  19. Filonchyk, M.; Hurynovich, V. Validation of MODIS Aerosol Products with AERONET Measurements of Different Land Cover Types in Areas over Eastern Europe and China. J. Geovis. Spat. Anal. 2020, 4, 1–11. [Google Scholar] [CrossRef]
  20. Hillger, D.; Kopp, T.; Lee, T.; Lindsey, D.; Seaman, C.; Miller, S.; Solbrig, J.; Kidder, S.; Bachmeier, S.; Jasmin, T.; et al. First-Light Imagery from Suomi NPP VIIRS. Bull. Am. Meteorol. Soc. 2013, 94, 1019–1029. [Google Scholar] [CrossRef]
  21. Justice, C.O.; Román, M.O.; Csiszar, I.; Vermote, E.F.; Wolfe, R.E.; Hook, S.J.; Friedl, M.; Wang, Z.S.; Schaaf, C.B.; Miura, T.; et al. Land and cryosphere products from Suomi NPP VIIRS: Overview and status. J. Geophys. Res. Atmos. 2013, 118, 9753–9765. [Google Scholar] [CrossRef]
  22. Wolfe, R.E.; Lin, G.; Nishihama, M.; Tewari, K.P.; Tilton, J.C.; Isaacman, A.R. Suomi NPP VIIRS prelaunch and on–orbit geometric calibration and characterization. J. Geophys. Res. Atmos. 2013, 118, 11508–11521. [Google Scholar] [CrossRef] [Green Version]
  23. Cao, C.; Zhang, B.; Shao, X.; Wang, W.; Uprety, S.; Choi, T.; Blonski, S.; Gu, Y.; Bai, Y.; Lin, L.; et al. Mission-Long Recalibrated Science Quality Suomi NPP VIIRS Radiometric Dataset Using Advanced Algorithms for Time Series Studies. Remote Sens. 2021, 13, 1075. [Google Scholar] [CrossRef]
  24. Goldberg, M.D.; Kilcoyne, H.; Cikanek, H.; Mehta, A. Joint Polar Satellite System: The United States next generation civilian polar–orbiting environmental satellite system. J. Geophys. Res. Atmos. 2013, 118, 13463–13475. [Google Scholar] [CrossRef]
  25. Zhou, L.; Divakarla, M.; Liu, X.; Layns, A.; Goldberg, M. An Overview of the Science Performances and Calibration/Validation of Joint Polar Satellite System Operational Products. Remote Sens. 2019, 11, 698. [Google Scholar] [CrossRef] [Green Version]
  26. Xu, B.; Park, T.; Yan, K.; Chen, C.; Zeng, Y.; Song, W.; Yin, G.; Li, J.; Liu, Q.; Knyazikhin, Y.; et al. Analysis of Global LAI/FPAR Products from VIIRS and MODIS Sensors for Spatio-Temporal Consistency and Uncertainty from 2012–2016. Forests 2018, 9, 73. [Google Scholar] [CrossRef] [Green Version]
  27. Skakun, S.; Justice, C.O.; Vermote, E.; Roger, J.-C. Transitioning from MODIS to VIIRS: An analysis of inter-consistency of NDVI data sets for agricultural monitoring. Int. J. Remote Sens. 2017, 39, 971–992. [Google Scholar] [CrossRef]
  28. Barnes, B.B.; Hu, C.; Bailey, S.W.; Pahlevan, N.; Franz, B.A. Cross-calibration of MODIS and VIIRS long near infrared bands for ocean color science and applications. Remote Sens. Environ. 2021, 260, 112439. [Google Scholar] [CrossRef]
  29. Hulley, G.C.; Malakar, N.K.; Islam, T.; Freepartner, R.J. NASA’s MODIS and VIIRS Land Surface Temperature and Emissivity Products: A Long-Term and Consistent Earth System Data Record. IEEE J. Sel. Top. Appl. Earth Obs. Remote Sens. 2017, 11, 522–535. [Google Scholar] [CrossRef]
  30. Liu, Y.; Wang, Z.; Sun, Q.; Erb, A.M.; Li, Z.; Schaaf, C.; Zhang, X.; Román, M.O.; Scott, R.; Zhang, Q.; et al. Evaluation of the VIIRS BRDF, Albedo and NBAR products suite and an assessment of continuity with the long term MODIS record. Remote Sens. Environ. 2017, 201, 256–274. [Google Scholar] [CrossRef]
  31. Riggs, G.; Hall, D. Continuity of MODIS and VIIRS Snow Cover Extent Data Products for Development of an Earth Science Data Record. Remote Sens. 2020, 12, 3781. [Google Scholar] [CrossRef]
  32. Thapa, S.; Chhetri, P.K.; Klein, A.G. Cross-Comparison between MODIS and VIIRS Snow Cover Products for the 2016 Hydrological Year. Climate 2019, 7, 57. [Google Scholar] [CrossRef] [Green Version]
  33. Zhou, M.; Wang, Y.; Liang, H.; Zeng, T.; Huang, W.; Wang, J.; Huang, X. Comparative analysis of the snow coverage products of Soumi-NPP and MODIS in the Qinghai-Tibet Plateau. J. Glaciol. Geocryol. 2019, 41, 36–44. [Google Scholar] [CrossRef]
  34. Zhang, H.; Zhang, F.; Che, T.; Wang, S. Comparative evaluation of VIIRS daily snow cover product with MODIS for snow detection in China based on ground observations. Sci. Total Environ. 2020, 724, 138156. [Google Scholar] [CrossRef] [PubMed]
  35. NASA. VIIRS Land Validation Status. Available online: https://viirsland.gsfc.nasa.gov/Val_overview.html. (accessed on 10 September 2022).
  36. Ackerman, S.; Strabala, K.I.; Menzel, W.P.; Frey, R.A.; Moeller, C.C.; Gumley, L.E. Discriminating clear sky from clouds with MODIS. J. Geophys. Res. Atmos. 1998, 103, 32141–32157. [Google Scholar] [CrossRef]
  37. Ackerman, S.; Frey, R.; Strabala, K.; Liu, K.; Gumley, L.; Baum, B.; Menzel, W.P. Discriminating Clear-Sky from Clouds with MODIS Algorithm Theoretical Basis Document (MOD35); Cooperative Institute for Meteorological Satellite Studies, University of Wisconsin-Madison: Madison, WI, USA, 2002. [Google Scholar]
  38. NASA. Joint Polar Satellite System (JPSS) Operational Algorithm Description (OAD) Document for VIIRS Cloud Mask (VCM) Intermediate Product (IP) Software. 2015. Available online: https://www.datarefuge.org/dataset/5609d82c-d980-4120-a6b3-5edc1fcfebfc/resource/2001746f-9d78-4a4c-af95-ed2dccd3a9d0/download/474-00062_oad-viirs-cloud-mask-ip_i.pdf. (accessed on 24 November 2022).
  39. Lindsay, C.; Zhu, J.; Miller, A.E.; Kirchner, P.; Wilson, T.L. Deriving Snow Cover Metrics for Alaska from MODIS. Remote Sens. 2015, 7, 12961–12985. [Google Scholar] [CrossRef] [Green Version]
  40. Da Ronco, P.; De Michele, C. Cloud obstruction and snow cover in Alpine areas from MODIS products. Hydrol. Earth Syst. Sci. 2014, 18, 4579–4600. [Google Scholar] [CrossRef] [Green Version]
  41. Riggs, G.A.; Hall, D.K. Reduction of cloud obscuration in the MODIS snow data product. In Proceedings of the 59th Eastern Snow Conference, Stowe, VT, USA, 5–7 June 2002; Available online: https://modis-snow-ice.gsfc.nasa.gov/uploads/pap_cloud_obs02.pdf (accessed on 9 September 2022).
  42. Mao, K.; Yuan, Z.; Zuo, Z.; Xu, T.; Shen, X.; Gao, C. Changes in Global Cloud Cover Based on Remote Sensing Data from 2003 to 2012. Chin. Geogr. Sci. 2019, 29, 306–315. [Google Scholar] [CrossRef] [Green Version]
  43. Wylie, D.; Jackson, D.L.; Menzel, W.P.; Bates, J. Trends in Global Cloud Cover in Two Decades of HIRS Observations. J. Clim. 2005, 18, 3021–3031. [Google Scholar] [CrossRef]
  44. Zhu, Z.; Woodcock, C.E. Automated cloud, cloud shadow, and snow detection in multitemporal Landsat data: An algorithm designed specifically for monitoring land cover change. Remote Sens. Environ. 2014, 152, 217–234. [Google Scholar] [CrossRef]
  45. Goodwin, N.R.; Collett, L.J.; Denham, R.J.; Flood, N.; Tindall, D. Cloud and cloud shadow screening across Queensland, Australia: An automated method for Landsat TM/ETM+ time series. Remote Sens. Environ. 2013, 134, 50–65. [Google Scholar] [CrossRef]
  46. Dozier, J. Spectral signature of alpine snow cover from the landsat thematic mapper. Remote Sens. Environ. 1989, 28, 9–22. [Google Scholar] [CrossRef]
  47. Wang, X.; Han, C.; Ouyang, Z.; Chen, S.; Guo, H.; Wang, J.; Hao, X. Cloud–Snow Confusion with MODIS Snow Products in Boreal Forest Regions. Remote Sens. 2022, 14, 1372. [Google Scholar] [CrossRef]
  48. Wang, X.; Xie, H.; Liang, T. Evaluation of MODIS snow cover and cloud mask and its application in Northern Xinjiang, China. Remote Sens. Environ. 2008, 112, 1497–1513. [Google Scholar] [CrossRef]
  49. Kraatz, S.; Khanbilvardi, R.; Romanov, P. A Comparison of MODIS/VIIRS Cloud Masks over Ice-Bearing River: On Achieving Consistent Cloud Masking and Improved River Ice Mapping. Remote Sens. 2017, 9, 229. [Google Scholar] [CrossRef] [Green Version]
  50. Stillinger, T.; Roberts, D.A.; Collar, N.M.; Dozier, J. Cloud Masking for Landsat 8 and MODIS Terra Over Snow-Covered Terrain: Error Analysis and Spectral Similarity Between Snow and Cloud. Water Resour. Res. 2019, 55, 6169–6184. [Google Scholar] [CrossRef] [PubMed] [Green Version]
  51. Wang, J.; Che, T.; Li, z. Investigation on snow characteristics and their distribution in China. Adv. Eeath Sci. 2018, 33, 12–26. [Google Scholar] [CrossRef]
  52. Niu, Z.; Sun, P.; Li, X.; He, Y.; Huang, C.; He, M.-Y.; Huang, H.; Wang, N. Spatial characteristics and geographical determinants of mercury and arsenic in snow in northeastern China. Atmos. Pollut. Res. 2020, 11, 2068–2075. [Google Scholar] [CrossRef]
  53. Liang, T.G.; Huang, X.D.; Wu, C.X.; Liu, X.Y.; Li, W.L.; Guo, Z.G.; Ren, J.Z. An application of MODIS data to snow cover monitoring in a pastoral area: A case study in Northern Xinjiang, China. Remote Sens. Environ. 2008, 112, 1514–1526. [Google Scholar] [CrossRef]
  54. Che, T.; Li, X.; Jin, R.; Armstrong, R.; Zhang, T. Snow depth derived from passive microwave remote-sensing data in China. Ann. Glaciol. 2008, 49, 145–154. [Google Scholar] [CrossRef] [Green Version]
  55. Dai, L.; Che, T.; Ding, Y.; Hao, X. Evaluation of snow cover and snow depth on the Qinghai–Tibetan Plateau derived from passive microwave remote sensing. Cryosphere 2017, 11, 1933–1948. [Google Scholar] [CrossRef]
  56. Ma, Y.; Huang, X.; Feng, Q.; Liang, T. Alpine Grassland Reviving Response to Seasonal Snow Cover on the Tibetan Plateau. Remote Sens. 2022, 14, 2499. [Google Scholar] [CrossRef]
  57. Hall, D.K.; Riggs, G.A. MODIS/Aqua Snow Cover Daily L3 Global 500m SIN Grid; Version 61; NSIDC: Boulder, CO, USA, 2021. [Google Scholar] [CrossRef]
  58. Riggs, G.A.; Hall, D.K.; Roman, M.O. MODIS Snow Products Collection 6.1 User Guide. Available online: https://modis-snow-ice.gsfc.nasa.gov/uploads/snow_user_guide_C6.1_final_revised_april.pdf (accessed on 9 September 2022).
  59. Riggs, G.A.; Hall, D.K.; Roman, M.O. NASA S-NPP VIIRS Snow Cover Products Collection 1 User Guide. Available online: https://viirsland.gsfc.nasa.gov/PDF/VIIRS_snow_products_user_guide_version_8.pdf (accessed on 9 September 2022).
  60. Riggs, G.A.; Hall, D.K.; Roman, M.O. VIIRS/NPP Snow Cover Daily L3 Global 375m SIN Grid; Version 1; NSIDC: Boulder, CO, USA, 2019. [Google Scholar] [CrossRef]
  61. Huang, X.; Deng, J.; Ma, X.; Wang, Y.; Feng, Q.; Hao, X.; Liang, T. Spatiotemporal dynamics of snow cover based on multi-source remote sensing data in China. Cryosphere 2016, 10, 2453–2463. [Google Scholar] [CrossRef] [Green Version]
  62. Huang, X.; Liang, T.; Zhang, X.; Guo, Z. Validation of MODIS snow cover products using Landsat and ground measurements during the 2001–2005 snow seasons over northern Xinjiang, China. Int. J. Remote Sens. 2011, 32, 133–152. [Google Scholar] [CrossRef]
  63. Zhao, Q.; Hao, X.; Wang, J.; Luo, S.; Shao, D.; Li, H.; Feng, T.; Zhao, H. Snow Cover Phenology Change and Response to Climate in China during 2000–2020. Remote Sens. 2022, 14, 3936. [Google Scholar] [CrossRef]
  64. Zou, Y.; Sun, P.; Ma, Z.; Lv, Y.; Zhang, Q. Snow Cover in the Three Stable Snow Cover Areas of China and Spatio-Temporal Patterns of the Future. Remote Sens. 2022, 14, 3098. [Google Scholar] [CrossRef]
  65. Hao, X.; Huang, G.; Zheng, Z.; Sun, X.; Ji, W.; Zhao, H.; Wang, J.; Li, H.; Wang, X. Development and validation of a new MODIS snow-cover-extent product over China. Hydrol. Earth Syst. Sci. 2022, 26, 1937–1952. [Google Scholar] [CrossRef]
  66. Ackerman, S.; Frey, R.; Strabala, K.; Liu, Y.H.; Gumley, L.; Baum, B.; Menzel, P. Discriminating Clear-Sky from Clouds with MODIS Algorithm Theoretical Basis Document (MOD35); Cooperative Institute for Meteorological Satellite Studies, University of Wisconsin: Madison, WI, USA, 2010. [Google Scholar]
  67. Frey, R.A.; Ackerman, S.A.; Holz, R.E.; Dutcher, S.; Griffith, Z. The Continuity MODIS-VIIRS Cloud Mask. Remote Sens. 2020, 12, 3334. [Google Scholar] [CrossRef]
  68. Rittger, K.; Painter, T.H.; Dozier, J. Assessment of methods for mapping snow cover from MODIS. Adv. Water Resour. 2013, 51, 367–380. [Google Scholar] [CrossRef]
  69. Metsämäki, S.; Mattila, O.-P.; Pulliainen, J.; Niemi, K.; Luojus, K.; Böttcher, K. An optical reflectance model-based method for fractional snow cover mapping applicable to continental scale. Remote Sens. Environ. 2012, 123, 508–521. [Google Scholar] [CrossRef]
  70. Klein, A.G.; Hall, D.K.; Riggs, G.A. Improving snow cover mapping in forests through the use of a canopy reflectance model. Hydrol. Process. 1998, 12, 1723–1744. [Google Scholar] [CrossRef]
  71. Oudrari, H.; McIntire, J.; Xiong, X.; Butler, J.; Lee, S.; Lei, N.; Schwarting, T.; Sun, J. Prelaunch Radiometric Characterization and Calibration of the S–NPP VIIRS Sensor. IEEE Trans. Geosci. Remote Sens. 2014, 53, 2195–2210. [Google Scholar] [CrossRef]
  72. Xiong, X.; Butler, J.; Chiang, K.; Efremova, B.; Fulbright, J.; Lei, N.; McIntire, J.; Oudrari, H.; Sun, J.; Wang, Z.; et al. VIIRS on–orbit calibration methodology and performance. J. Geophys. Res. Atmos. 2013, 119, 5065–5078. [Google Scholar] [CrossRef]
  73. Kopp, T.J.; Thomas, W.; Heidinger, A.K.; Botambekov, D.; Frey, R.A.; Hutchison, K.D.; Iisager, B.D.; Brueske, K.; Reed, B. The VIIRS Cloud Mask: Progress in the first year of S-NPP toward a common cloud detection scheme. J. Geophys. Res. Atmos. 2014, 119, 2441–2456. [Google Scholar] [CrossRef]
Figure 1. Three test regions in China and their elevations. Three major snow cover regions in China, namely (a) Northwest China (NW), (b) Northeast China (NE) and (c) the Qinghai–Tibet Plateau (QT), are shown as yellow boxes on the left. On the right are elevation maps of the study areas.
Remotesensing 14 06134 g001
Figure 2. The distribution of snow and cloud cover in MODIS (a) and VIIRS (b). (c) NDSI difference (VIIRS minus MODIS); the values are scaled by 100 and ‘NA’, meaning ‘not available’, represents neither VIIRS nor MODIS labeled as snow pixels. The three test regions NE (2020002), NW (2020038) and QT (2020047) are shown from top to bottom, along with the day of the year (DOY).
Remotesensing 14 06134 g002
Figure 3. SCA with respect to VIIRS and MODIS in the snow season (1 December 2019 to 29 February 2020). The NE, NW and QT test regions are shown from top to bottom, respectively.
Remotesensing 14 06134 g003
Figure 4. Scatter plots of daily SCPs in three test areas illustrating VIIRS with respect to MODIS in (a) the entire hydrological year and (b) the snow season. Each column represents the NE, NW and QT test regions from left to right. Avg. (VIIRS) represents the average SCP in VIIRS, and Avg. (MODIS) represents the average SCP in MODIS. The red line is the fitting line with the coefficient of determination (R2), and N is the number of days.
Remotesensing 14 06134 g004
Figure 5. Scatter plots of daily CCPs in three test areas illustrating VIIRS with respect to MODIS in (a) the entire hydrological year and (b) the snow season. Each column represents the results in the NE, NW and QT regions from left to right. Avg. (VIIRS) represents the average CCP in VIIRS, and Avg. (MODIS) represents the average CCP in MODIS. The red line is the fitting line with the coefficient of determination (R2), and N is the number of days.
Remotesensing 14 06134 g005
Figure 6. Scatter plots of daily no snow/no cloud cover percentage in three test regions illustrating VIIRS with respect to MODIS in (a) the entire hydrological year and (b) the snow season. Each column represents the results in the NE, NW and QT regions from left to right. Avg. (VIIRS) represents the average percentage of no snow/no cloud cover in VIIRS and Avg. (MODIS) represents the average percentage of no snow/no cloud cover in MODIS. The red line is the fitting line with the coefficient of determination (R2), and N is the number of days.
Remotesensing 14 06134 g006
Figure 7. Snow and cloud cover distribution differences. (a) Snow cover distribution difference map, with the red color indicating snow in VIIRS only and the blue color showing snow in MODIS only. (b) Cloud cover distribution difference map, with the red color indicating clouds in VIIRS only and the blue color showing clouds in MODIS only. Three images were randomly chosen in the NE (2020002), NW (2020038) and QT (2020047) regions, shown from top to bottom. VIIRS (MODIS) represents the snow or clouds in VIIRS (MODIS) only. ‘Both’ represents snow or clouds in both products.
Remotesensing 14 06134 g007
Figure 8. The confidence level distribution in (a) VIIRS and (b) MODIS. The test regions with DOY are shown from left to right: NE (2020002), NW (2020038) and QT (2020047).
Remotesensing 14 06134 g008
Figure 9. The snow/ice flag distribution and difference in VIIRS and MODIS. The snow/ice flag is represented in white in (a) VIIRS and (b) MODIS; (c) difference map in snow/ice flags with legend shown below. The red color shows snow/ice flags in VIIRS only, blue shows those in MODIS only, white represents those in both VIIRS and MODIS and gray shows those in neither. The test regions and the DOY are shown from left to right: NE (2020002), NW (2020038) and QT (2020047).
Remotesensing 14 06134 g009
Figure 10. The seasonal fluctuations of cloud cover difference by monthly averages (VIIRS minus MODIS) from September to August next year.
Remotesensing 14 06134 g010
Table 1. Mean values of the accuracy indicators of snow cover consistency in three test regions across the entire hydrological year and snow season. Note: The raw NDSI values from 0 to 1 were used for calculations.
Entire Hydrological YearSnow Season
RRMSEmBIASRRMSEmBIAS
NE0.550.063−0.0130.810.0620.016
NW0.640.0830.0400.770.0640.016
QT0.640.0880.0370.800.0810.041
Table 2. The OD and OA of snow cover under clear and cloudy sky conditions.
Entire Hydrological YearSnow Season
Under Clear SkyUnder Cloudy SkyUnder Clear SkyUnder Cloudy Sky
ODOA (%)ODOA (%)ODOA (%)ODOA (%)
NE0.999.110.489.61.698. 431.268.8
NW1.898.211. 688.42.697.427.972.1
QT2.897.211.188.93.496.619.280.8
Table 3. The differences in band tests between MYD35 and VCM. Note that ‘R’ represents the calibrated top of the atmosphere reflectance, while the numbers following the letters ‘BT’ and ‘R’ are the central wavelengths in µm.
MYD35VCM
Test group
(MODIS)
MYD35Test group
(VIIRS)
VCM
Group 1
(Simple IR threshold test)
BT11Group 1
(Emission threshold)
BT10.76
BT13.9
BT6.7
Group 2
(Brightness temperature difference)
BT8.6-BT11Group 2
(Emission difference)
BT3.70-BT4.05
BT11-BT12BT10.76-BT3.7
BT7.3-BT11BT8.55-BT10.76
BT11-BT3.9BT10.76-BT12.01
BT8.6-BT7.3
Group 3
(Solar reflectance tests)
R0.65 OR R0.86Group 3
(Reflectance threshold)
R0.412
R0.86/R0.65R0.672
R0.865
R0.865/R0.672
Group 4
(NIR thin cirrus)
R1.38Group 4
(Reflectance thin cirrus)
R1.38
Group 5
(IR thin cirrus)
BT3.9-BT12Group 5
(Emission thin cirrus)
BT10.76-BT12.01
BT3.70-BT12.01
Publisher’s Note: MDPI stays neutral with regard to jurisdictional claims in published maps and institutional affiliations.

