Article

Surface Water Mapping and Flood Monitoring in the Mekong Delta Using Sentinel-1 SAR Time Series and Otsu Threshold

1
College of Resources, Environment and Tourism, Capital Normal University, 105 West Third Ring Road North, Haidian District, Beijing 100048, China
2
College of Geospatial Information Science and Technology, Capital Normal University, 105 West Third Ring Road North, Haidian District, Beijing 100048, China
3
Southern Institute for Water Resources Planning (SIWRP), 271/3 An Duong Vuong Street, District 5, Ho Chi Minh City 748000, Vietnam
4
Geospatial Science Center of Excellence, Department of Geography and Geospatial Sciences, South Dakota State University, Brookings, SD 57007, USA
5
Department of Geoscience and Remote Sensing, Delft University of Technology, 2600 GA Delft, The Netherlands
6
State Key Laboratory of Remote Sensing Sciences, Aerospace Information Research Institute, Chinese Academy of Sciences, Beijing 100101, China
*
Author to whom correspondence should be addressed.
Remote Sens. 2022, 14(22), 5721; https://doi.org/10.3390/rs14225721
Submission received: 23 September 2022 / Revised: 20 October 2022 / Accepted: 10 November 2022 / Published: 12 November 2022

Abstract

:
The annual flood and the alteration in hydrological regimes are the most vital concerns in the Vietnamese Mekong Delta (VMD). Although synthetic aperture radar (SAR) Sentinel-1 imagery is widely used for water management, only a few studies have used Sentinel-1 data for mapping surface water and monitoring flood events in the VMD. This study developed an algorithm to implement (i) automatic Otsu threshold on a series of Sentinel-1 images to extract surface water and (ii) time series analyses on the derived surface water maps to detect flood water extent in near-real-time (NRT). Specifically, only cross-polarized VH was selected after an assessment of different Sentinel-1 polarizations. The dynamic Otsu thresholding algorithm was applied to identify an optimal threshold for each pre-processed Sentinel-1 VH image to separate water from non-water pixels for producing a time series of surface water maps. The derived Sentinel-1 surface water maps were visually compared with the Sentinel-2 Full Resolution Browse (FRB) and statistically examined with the Sentinel-2 Multispectral Instrument (MSI) surface water maps, which were generated by applying the Otsu threshold on the normalized difference water index (NDWI) and modified normalized difference water index (MNDWI) images. The visual comparison showed a strong correspondence between the Sentinel-1 surface water maps and Sentinel-2 FRB images in three periods, including rice’s sowing season, flood period, and rice’s maturation stage. A good statistical agreement suggested that the performance of the dynamic Otsu thresholding algorithm on Sentinel-1 image time series to map surface water is effective in river areas (R2 = 0.97 and RMSE = 1.18%), while it is somewhat lower in paddy field areas (R2 = 0.88 and RMSE = 3.88%). Afterward, a flood mapping algorithm in NRT was developed by applying the change-detection-based time series analyses on the derived Sentinel-1 surface water maps. Every single pixel at the time t   is respectively referred to its state in the water/non-water and flooded/non-flooded maps at the previous time t 1 to be classified into a flooded or non-flooded pixel. The flood mapping algorithm enables updates at each time step to generate temporal flood maps in NRT for monitoring flood water extent in large-scale areas. This study provides a tool to rapidly generate surface water and flood maps to support water management and risk reduction in the VMD. The future improvement of the current algorithm is discussed.

1. Introduction

Vietnam is a country in Southeast Asia that covers an area of 331,210 km2. With a population of over 97 million inhabitants, Vietnam ranks 15th on the list of the most populous countries in the world (the World Population Review in 2019). In addition, Vietnam’s economy has significantly thrived, with a GDP growth of 7% in 2018 (the highest in ten years) and similar growth forecasts for 2019, as said by the World Bank in 2019. Remarkably, Vietnam is one of the richest agricultural countries, 2nd largest rice exporter (after India), and 7th largest rice consumer worldwide in 2020/2021 [1,2]. However, more than other countries, Vietnam has been facing tremendous challenges with climate change and ranked 6th out of 10 countries most affected following the Global Climate Risk Index 2019—Germanwatch eV [3].
Specifically, the Vietnamese Mekong Delta (VMD) is the third-largest delta in the world, with around 2 million hectares of flood-prone land and 64% of the total land is dominant by agricultural activities such as rice farming and aquacultural farming [4,5]. It is well known as the major economic region and the heart of rice production in Vietnam, accounting for approximately half of the country’s total annual rice production and 90% of rice exports, which contribute to nearly 20% of the national GDP [6]. However, the low average elevation (~0.8 m) makes it the most vulnerable deltas to global sea-level rise and climate change [7,8]. Veettil et al. [9] predicted that 45.2% of mangrove and 60.9% of cultivated rice area could be lost if the sea-level increases by 1 m. The hydrological regime has become increasingly unusual and unpredictable in the last few decades, causing huge losses in people and properties for approximately 20 million inhabitants in the VMD [8,10,11,12]. The most hazardous flood on record occurred in 2000, with the highest peak of 5.06 m at Tan Chau station on the Mekong River. There were 539 deaths, more than 890,000 houses destroyed, over half a million people required emergency relief, and 224,000 ha of rice, 86,000 ha of other crops, and 14,000 ha of aquaculture were damaged. The total damage was estimated at approximately 200 million US dollars [13]. In contrast, the worst drought event occurred in 2015–2016 [4], when discharges at Tan Chau and Chau Doc stations on the Mekong River were only 57–85% of the annual average. The salinity intrusion rapidly expanded landward and caused significant damage throughout 13 coastal provinces of the VMD, even worse than a historic salinity intrusion in 1998. Moreover, hydroelectric-dam construction in the upper Mekong River has directly affected the hydrological systems, leading to severe impacts on agriculture, aquaculture, and ecology in the VMD [14,15,16,17,18,19]. Thus, water management and adaptive water governance play a key role in all activities in the VMD to guarantee safe and sustainable development in the future [20,21,22]. More importantly, observing water dynamics in flood-prone areas is highly prioritized to provide essential information such as surface water maps, flood extent maps, statistics, flood warnings, and damage estimation [23,24,25,26,27]. Among these, surface water and flood maps are commonly used to assist in planning and conducting flood-adaptive projects [28,29], which aim to increase the protection and productivity of agricultural and aquacultural activities [30,31] and to improve the quality of life in these flood-prone residential areas [31,32,33,34].
The VMD has a seasonal monsoon climate with temperatures all year round about 25–28 °C with only slight variations. There are two apparent seasons a year: the dry season (December to April) and the rainy season (May to November). Specifically, the rain-bearing southerly monsoon winds arrive in May or June when the Mekong’s flow starts to increase and rapidly surges in August and September. Local rainfall and heavy water discharge from upstream generate the annual monsoon floods in the lower Mekong Delta. In contrast, the flow is ordinarily at its lowest in April. More importantly, mapping and monitoring surface water during flood events have been complicated and difficult in the past because of the flood’s widespread devastation and high frequency, as well as the lack of gauge stations [35,36]. The development of earth observation systems in the last five decades has made surface water mapping and flood water extent monitoring feasible and effective on a large scale [36,37,38,39,40]. Although optical satellite imagery is a popular source for waterbodies extraction [39,41,42,43], it is barely applicable in the VMD, for example, MODerate resolution Imaging Spectroradiometer (MODIS) data [44,45] or integration of Landsat-7, Landsat-8, and Sentinel-2 data [26]. This is mainly because of the high probability of cloud cover and rainy season in tropical areas with monsoon climates [46]. Specifically, 85% to 95% of the VMD is covered by a persistent cloud during the wet season, making it infeasible or low accuracy for various applications, such as land use land cover (LULC) classification and waterbodies extraction [47,48]. As a result, synthetic aperture radar (SAR) satellite systems have been developed using a completely different way to observe the Earth’s surface by actively transmitting/receiving microwave signals rather than utilizing solar light as with optical satellite systems. With almost all-weather conditions and day-night operations, SAR has been widely used for water and flood detection, especially in areas with high cloud coverage and rainy season in the tropical climate [49,50,51,52]. In the VMD, the historical 1996 flood event was investigated using European Remote Sensing Satellites (ERS-2) SAR data with a spatial resolution of 26 m using the color combination of three scenes, including before, during, and after the flood event. The multi-temporal image technique was applied to detect the flood extent and analyze the impact of the flood on the agricultural fields [53]. Moreover, time series analyses have been applied to the Envisat ASAR Wide Swath Mode satellite data of 150 m spatial resolution from 2007 to 2011 in order to understand the flood regime in the Mekong Delta based on a histogram processing approach. The study also assessed the impact of the dike system on flood water and examined the relationship between retrieved flood occurrence patterns and land use [54]. Pham et al. [55] developed a neural network classification algorithm using Sentinel-1 SAR data and training data derived from the optical Landsat-8 Operational Land Imager (OLI) data to delineate surface water in the VMD. A strong correlation was found between the surface water maps derived from the 10 m Sentinel-1 SAR, 30 m Landsat-8 OLI, and 500 m MODIS/Terra. Likewise, a simple pixel-based thresholding method was utilized for three data sources from Sentinel-1 SAR, Sentinel-2 Multispectral Instrument (MSI), and Landsat-8 OLI to generate cloud-free water masks at 10 m pixel and 10-day intervals in the VMD [56].
Supervised and unsupervised classification methods have been popularly applied for mapping surface water using satellite imagery [57,58,59,60]. While Xie et al. [57] obtained an accuracy of 96% using the unsupervised classification method on the 30 m Landsat imagery for water extraction, Pradhan et al. [61] obtained a relatively low accuracy for flooded pixels on 3 m TerraSAR-X data, which was identified by the influence of vegetation in the inundated area. Although the supervised classification method is able to map waterbodies effectively, the ground truth dataset is required to train the algorithm for classifying other unknown pixels and validate classification results [62]. However, collecting training and testing samples usually involves field visits, which are expensive, time-consuming, and challenging in remote and inaccessible regions [63]. This process is even more complex or unable to be conducted in areas with high water dynamics or severe flood events such as the VMD. In contrast, image thresholding (rule-based classification) is an efficient method (fast, cost-effective, and accurate) to delineate waterbodies [64,65]. A specific threshold is determined based on various factors, including atmospheric conditions, mixture of pixels, pixel size, and viewing angle of an image scene to separate water pixels from non-water pixels. Thus, finding a robust threshold working for different sites and different acquisition dates is challenging [66,67,68]. Alternatively, the Otsu thresholding algorithm can obtain an optimal threshold automatically by maximizing the inter-class variance and minimizing the weighted within-class variance [69]. It has been demonstrated as the most simple and efficient method for surface water mapping [65,70,71], even for complex waterbodies areas (e.g., submerged vegetation, sedimented, and turbid water) [62]. It should be noted that recent methods using classical machine learning (support vector machine, decision tree, and random forest) and deep learning (deep neural networks, convolutional neural networks, and recurrent neural network) have been increasingly applied in many research activities with high overall accuracy, such as LULC classification, crop monitoring, and water detection [55,62,63,72,73]. However, these methods are commonly supervised learning, which is computationally costly, hard to employ for large scales, and require ground truth samples [74,75,76]. Thus, supervised learning methods could be less effective for applications that demand swift action and in near real-time (NRT) (e.g., flood monitoring). Nevertheless, machine-learning-based or deep-learning-based algorithms could be applicable for assessing pre and post-flooding events accurately [77].
Currently, the Sentinel-1 SAR data is a widely-used data for surface water mapping and flood monitoring because of its high spatial resolution (10 m), short revisit time (6 days with a constellation of Sentinel-1A and Sentinel-1B satellites (Sentinel-1B has been decommissioned since December 2021)), free of cost, and all-weather and day-night operations [78,79,80]. However, very few studies using Sentinel-1 SAR data for flood mapping and monitoring have been conducted in the VMD, although this area is extremely vulnerable to the alternation of hydrological regimes and global climate changes. Moreover, these studies generally apply an empirical and static threshold for all the Sentinel-1 scenes to separate waterbodies from non-water areas [55,56]. Meanwhile, the VMD is an extremely complex area with 80% of rice fields and up to three cycles of rice production every year that cause a large temporal variation in backscatter intensity derived from the Sentinel-1 SAR data [81]. Thus, the dynamic threshold is needed for each scene (each acquisition date) to separate waterbodies from non-water areas. Second, Bangira et al. [62] compared the Otsu threshold and machine learning methods, revealing the ability to use the automatic Otsu threshold on Sentinel-1 SAR data for water detection. It could achieve a high overall water classification accuracy of 89.3%, even in the complexities of waterbodies with flooded vegetation, sedimented, and turbid water. Hence, the automatic Otsu threshold could be a potential option to replace the empirical and fixed threshold for detecting surface water in the VMD. Third, flood monitoring in the VMD highly relies on the data from a few gauge stations along large branches of the Mekong rivers and the results from hydrological models. However, flood forecasts obtained from the hydrological models become more challenging because of serial factors, such as artificial construction, land subsidence, sea-level rises, and environmental and climate changes [82]. As a result, an automatic model using satellite observations is necessary for mapping surface water and monitoring flood events in the VMD.
We took into account the characteristics of the VMD and the findings from previous studies to develop an algorithm for mapping surface water and monitoring flood water extent in the VMD, including (i) investigating the combination of the automatic Otsu method and Sentinel-1 imagery for surface water delineation in a complex area of the VMD (flooded vegetation (e.g., rice cultivation), sediments, and high dynamic of the hydrological regime), (ii) comparing water delineations between using the Otsu thresholding on Sentinel-1 SAR data and Sentinel-2 data, (iii) employing dynamic Otsu thresholding algorithm to a time series of Sentinel-1 SAR images, rather than a static threshold for the entire period, to separate water from non-water pixels for producing surface water maps, and (iv) applying time series analyses based on change detection approach to the derived Sentinel-1 surface water maps in order to generate temporal flood maps for monitoring flooded water extent in NRT on a large scale.

2. Study Area and Datasets
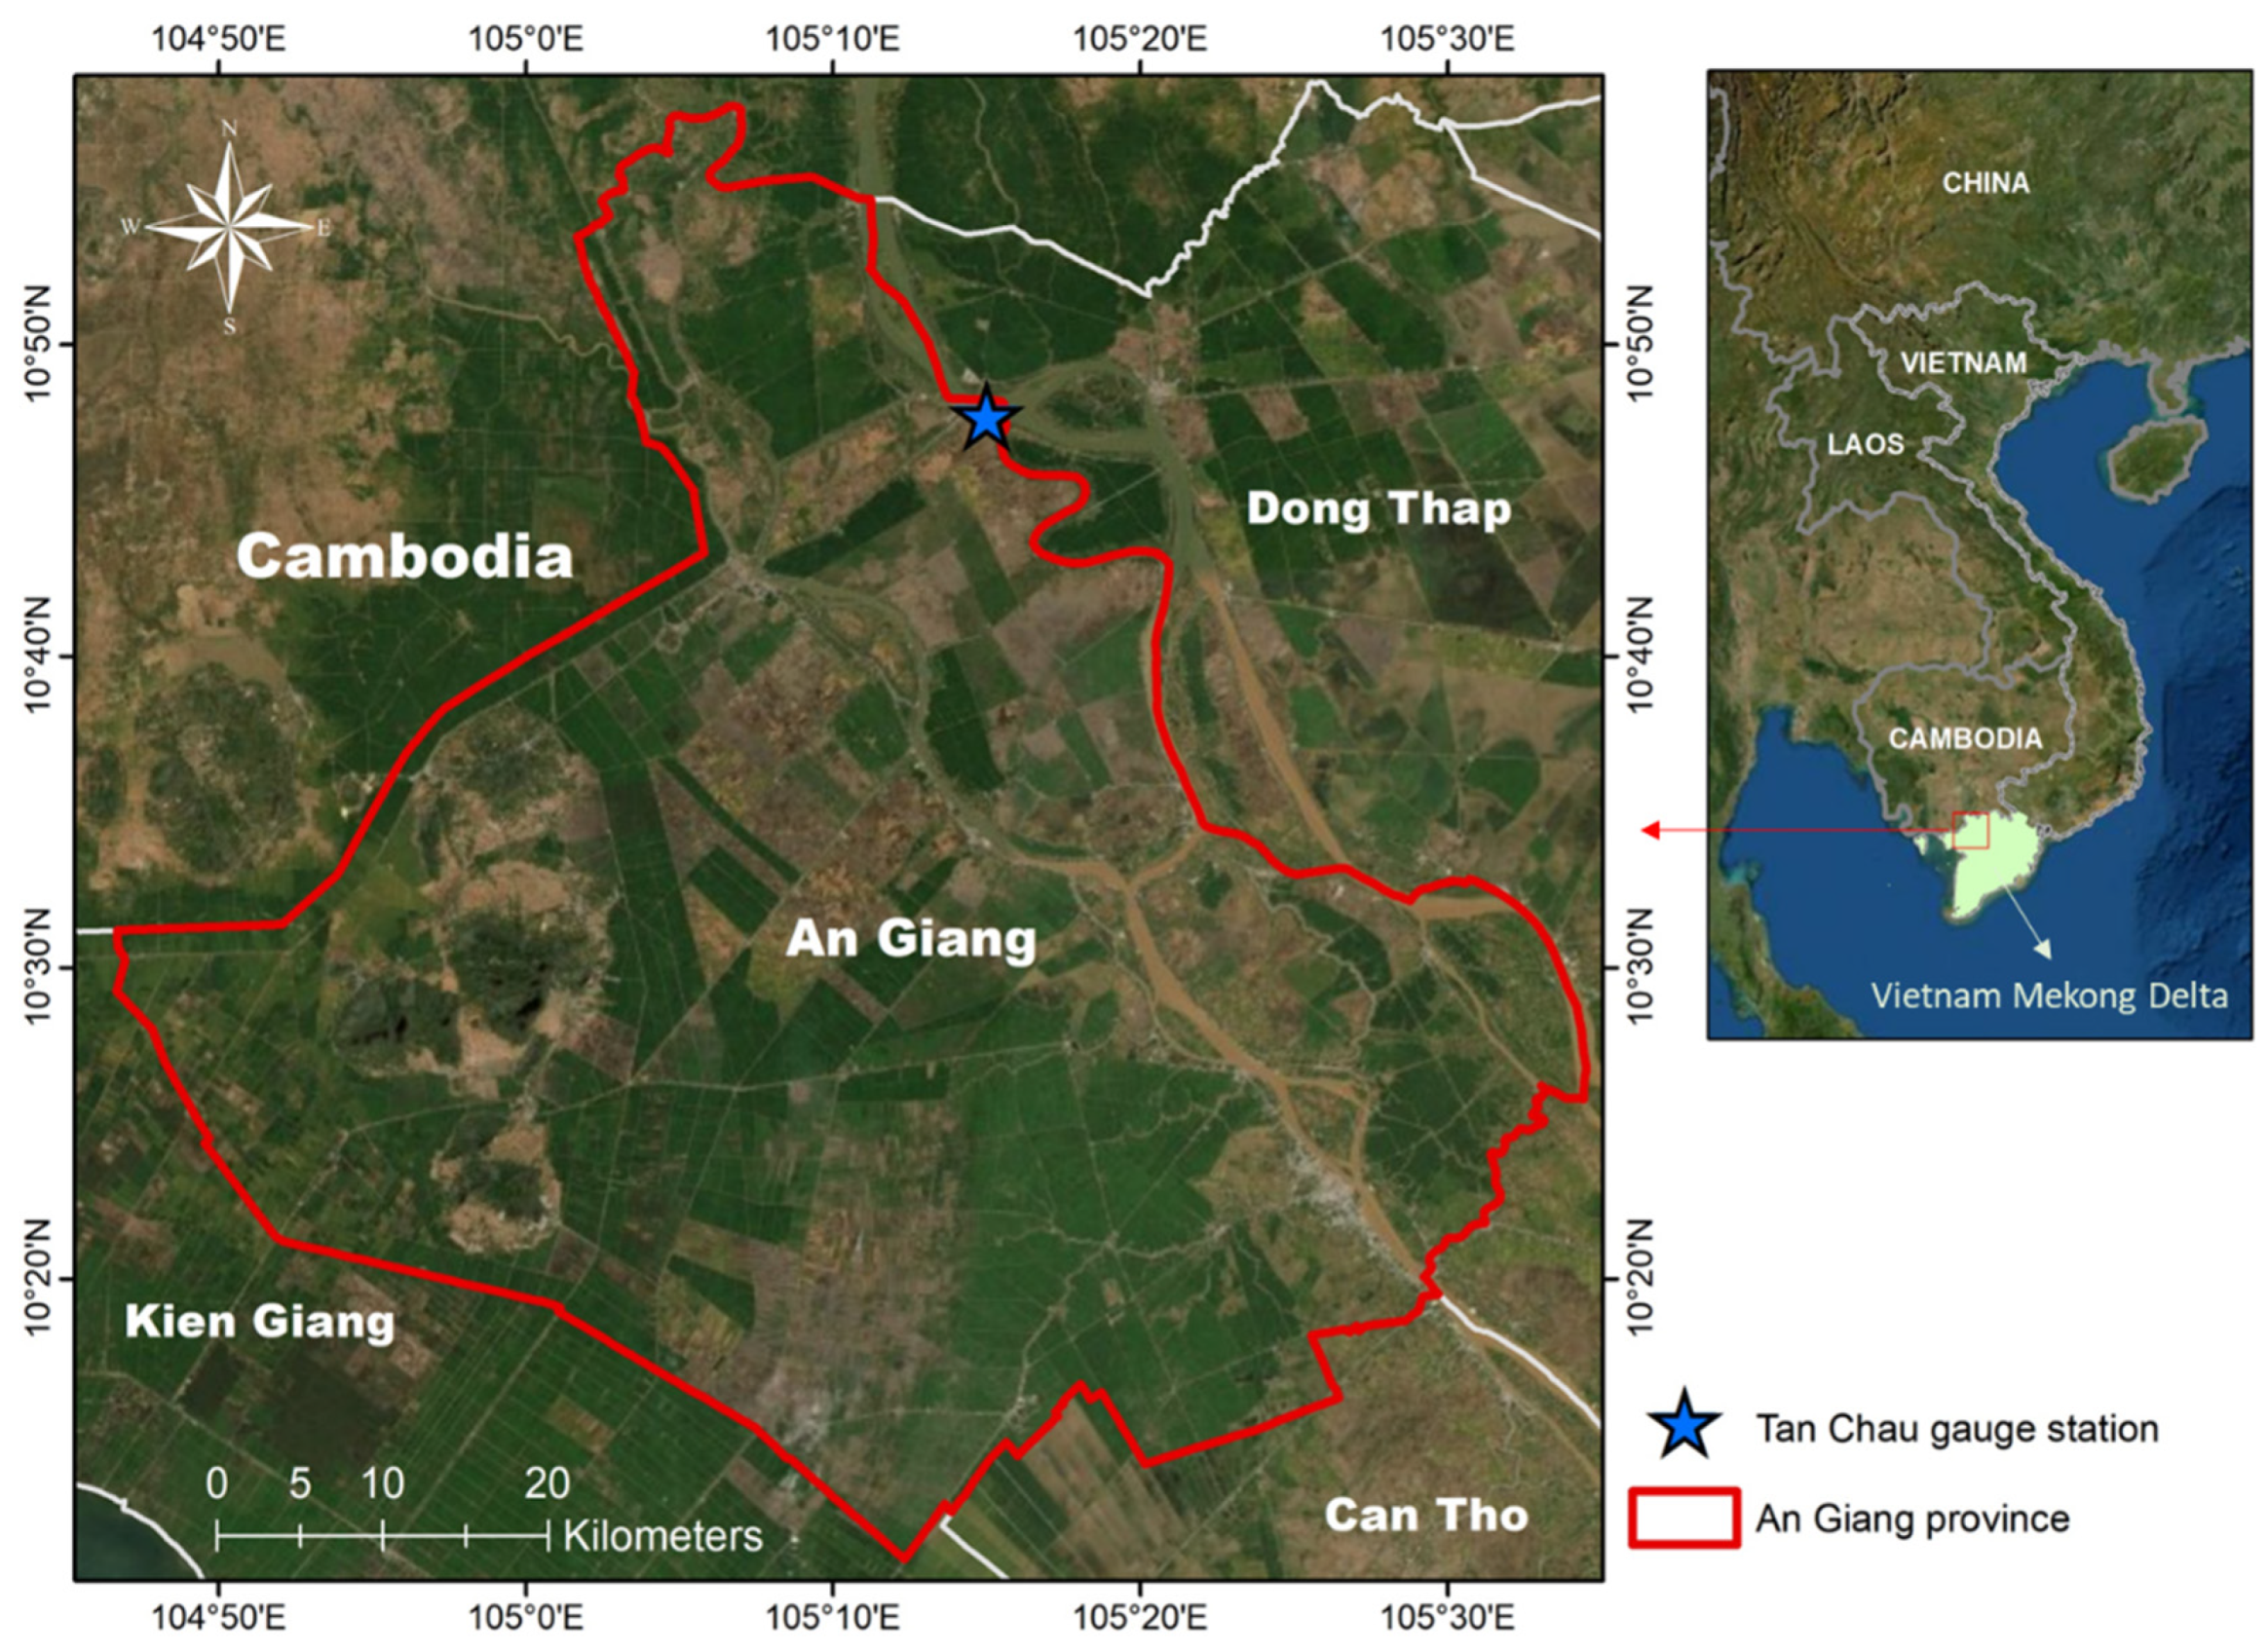
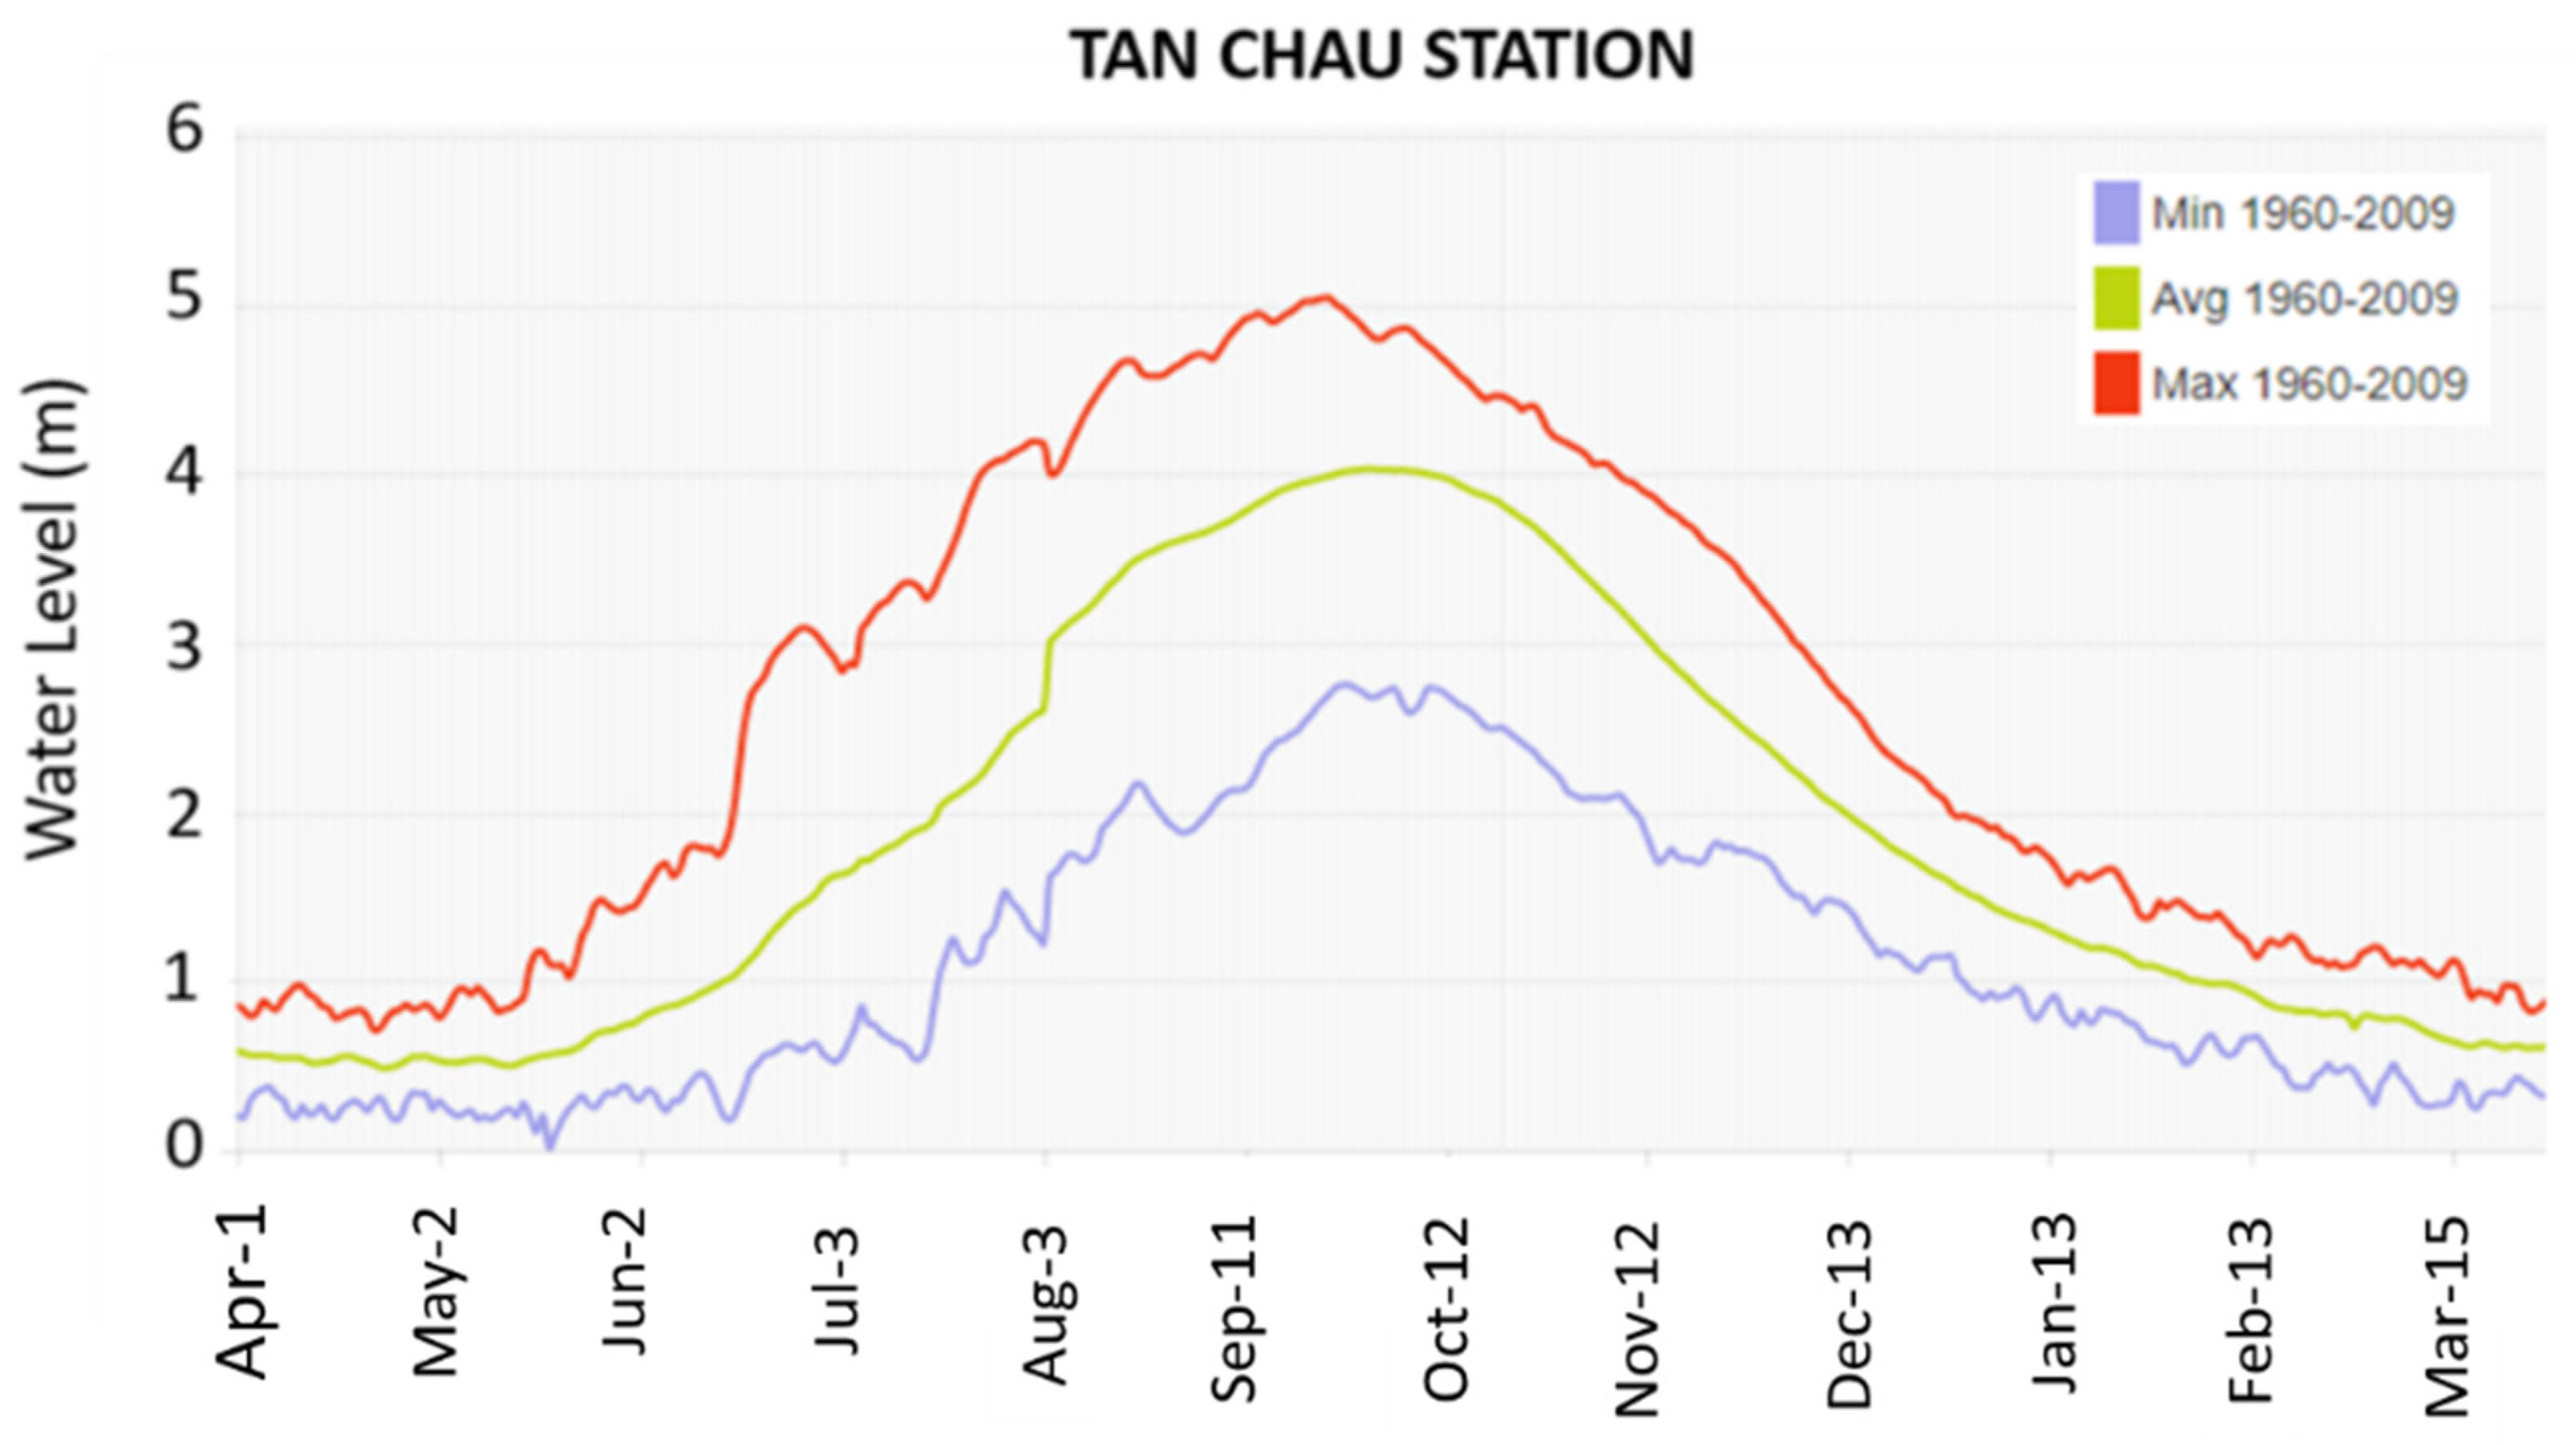
2.1. Study Area

An Giang province was selected as the study area (Figure 1) (i) because it is the most complex region with significant dynamics in the hydrological regimes due to irrigation activity and flood events and (ii) to reduce the amount of data and processing time. This province has an area of more than 3500 km2 and the highest population in the Mekong Delta provinces, with over 2.4 million people. An Giang is in the geographical latitude of 10°–11°N, which features a distinct tropical monsoon climate. The monsoon season is often between May and October, with high recorded rainfall and humid southwest wind. An Giang province is located in the upper reaches of the Mekong Delta of Vietnam, bordering the northwest by Cambodia, the southwest by Kien Giang province, the south by Can Tho province, and the east by Dong Thap province. Most of the area is moderately flat, except for hills and mountains in the northwest. The study area is crossed by the two largest branches of the Mekong River (Tien and Hau rivers), many canals, and small rivers. An Giang province is well known as the country’s major agricultural and aquacultural province, especially in rice production (3.9 million tons in 2017) [83]. Particularly, An Giang has been regularly selected for a case study in numerous research activities [44,82,84,85].
Figure 2 indicates the water level at Tan Chau gauge station in An Giang province from 1960 to 2009 (http://portal.mrcmekong.org/charts/chart, accessed on 1 January 2020). The flood events usually start in August, gradually increase and reach the flood peak in September and October, and then slowly decrease until November. During the flood period at Tan Chau station, the maximum water level could reach up to 5 m and the minimum water level is approximately 3 m. Because of hydrological complications, the government built a dominant dike system in An Giang province for water management purposes. The dike system helps farmers protect their paddy fields from flood events and increases from one rice season as a traditional practice to two or three rice seasons a year, including winter-spring, summer-autumn, and autumn-winter seasons [86]. However, this region continues to be seriously affected by the alternation of the hydrological schemes, such as drought events [16], severe landslides along the rivers [87], and unpredictable flood events [88]. These impacts have caused substantial losses in properties and lives in An Giang as well as in the VMD in general.

2.2. Datasets

2.2.1. Sentinel-1 SAR Data

A constellation of Sentinel-1 satellites (1A and 1B), developed and operated by the European Space Agency (ESA), could function in date-nighttime and almost in all weather conditions. It provides free-of-cost high spatial resolution images (10 m) in a short revisit (6 days). The specification of acquisition data includes Ground Range Detected High Resolution (GRDH), SAR C-band (5.405 GHz) sensor, Interferometric Wide swath (IW), incidence angles from 30.4° to 46.2°, large swath widths (250 km), pixel size at 10 m, and dual-polarization (vertical transmit/horizontal receive VH and vertical transmit/vertical receive VV) [78,79,80]. A total of 128 Sentinel-1 images were downloaded from March 2017 to March 2018 through ESA’s Scientific Data Hub (https://scihub.copernicus.eu/dhus/, accessed on 1 January 2020) and the Alaska Satellite Facility (https://asf.alaska.edu/, accessed on 1 January 2020) (Table 1). Two Sentinel-1 images are needed to fully cover each scene of An Giang province. Note that the Sentinel-1 SAR data (our main data) will be used for mapping surface water and monitoring flood water extent. Unfortunately, after we conducted the study, the Sentinel-1B satellite experienced an issue related to the instrument electronics power supply and could not continue to deliver data. It has been decommissioned since December 2021, which is a huge loss for the remote sensing community. We are looking forward to the launch of Sentinel-1C in 2023 (https://www.esa.int/Applications/Observing_the_Earth/Copernicus/Sentinel-1/Ride_into_orbit_secured_for_Sentinel-1C, accessed on 1 September 2022).

2.2.2. Optical Sentinel-2 Data
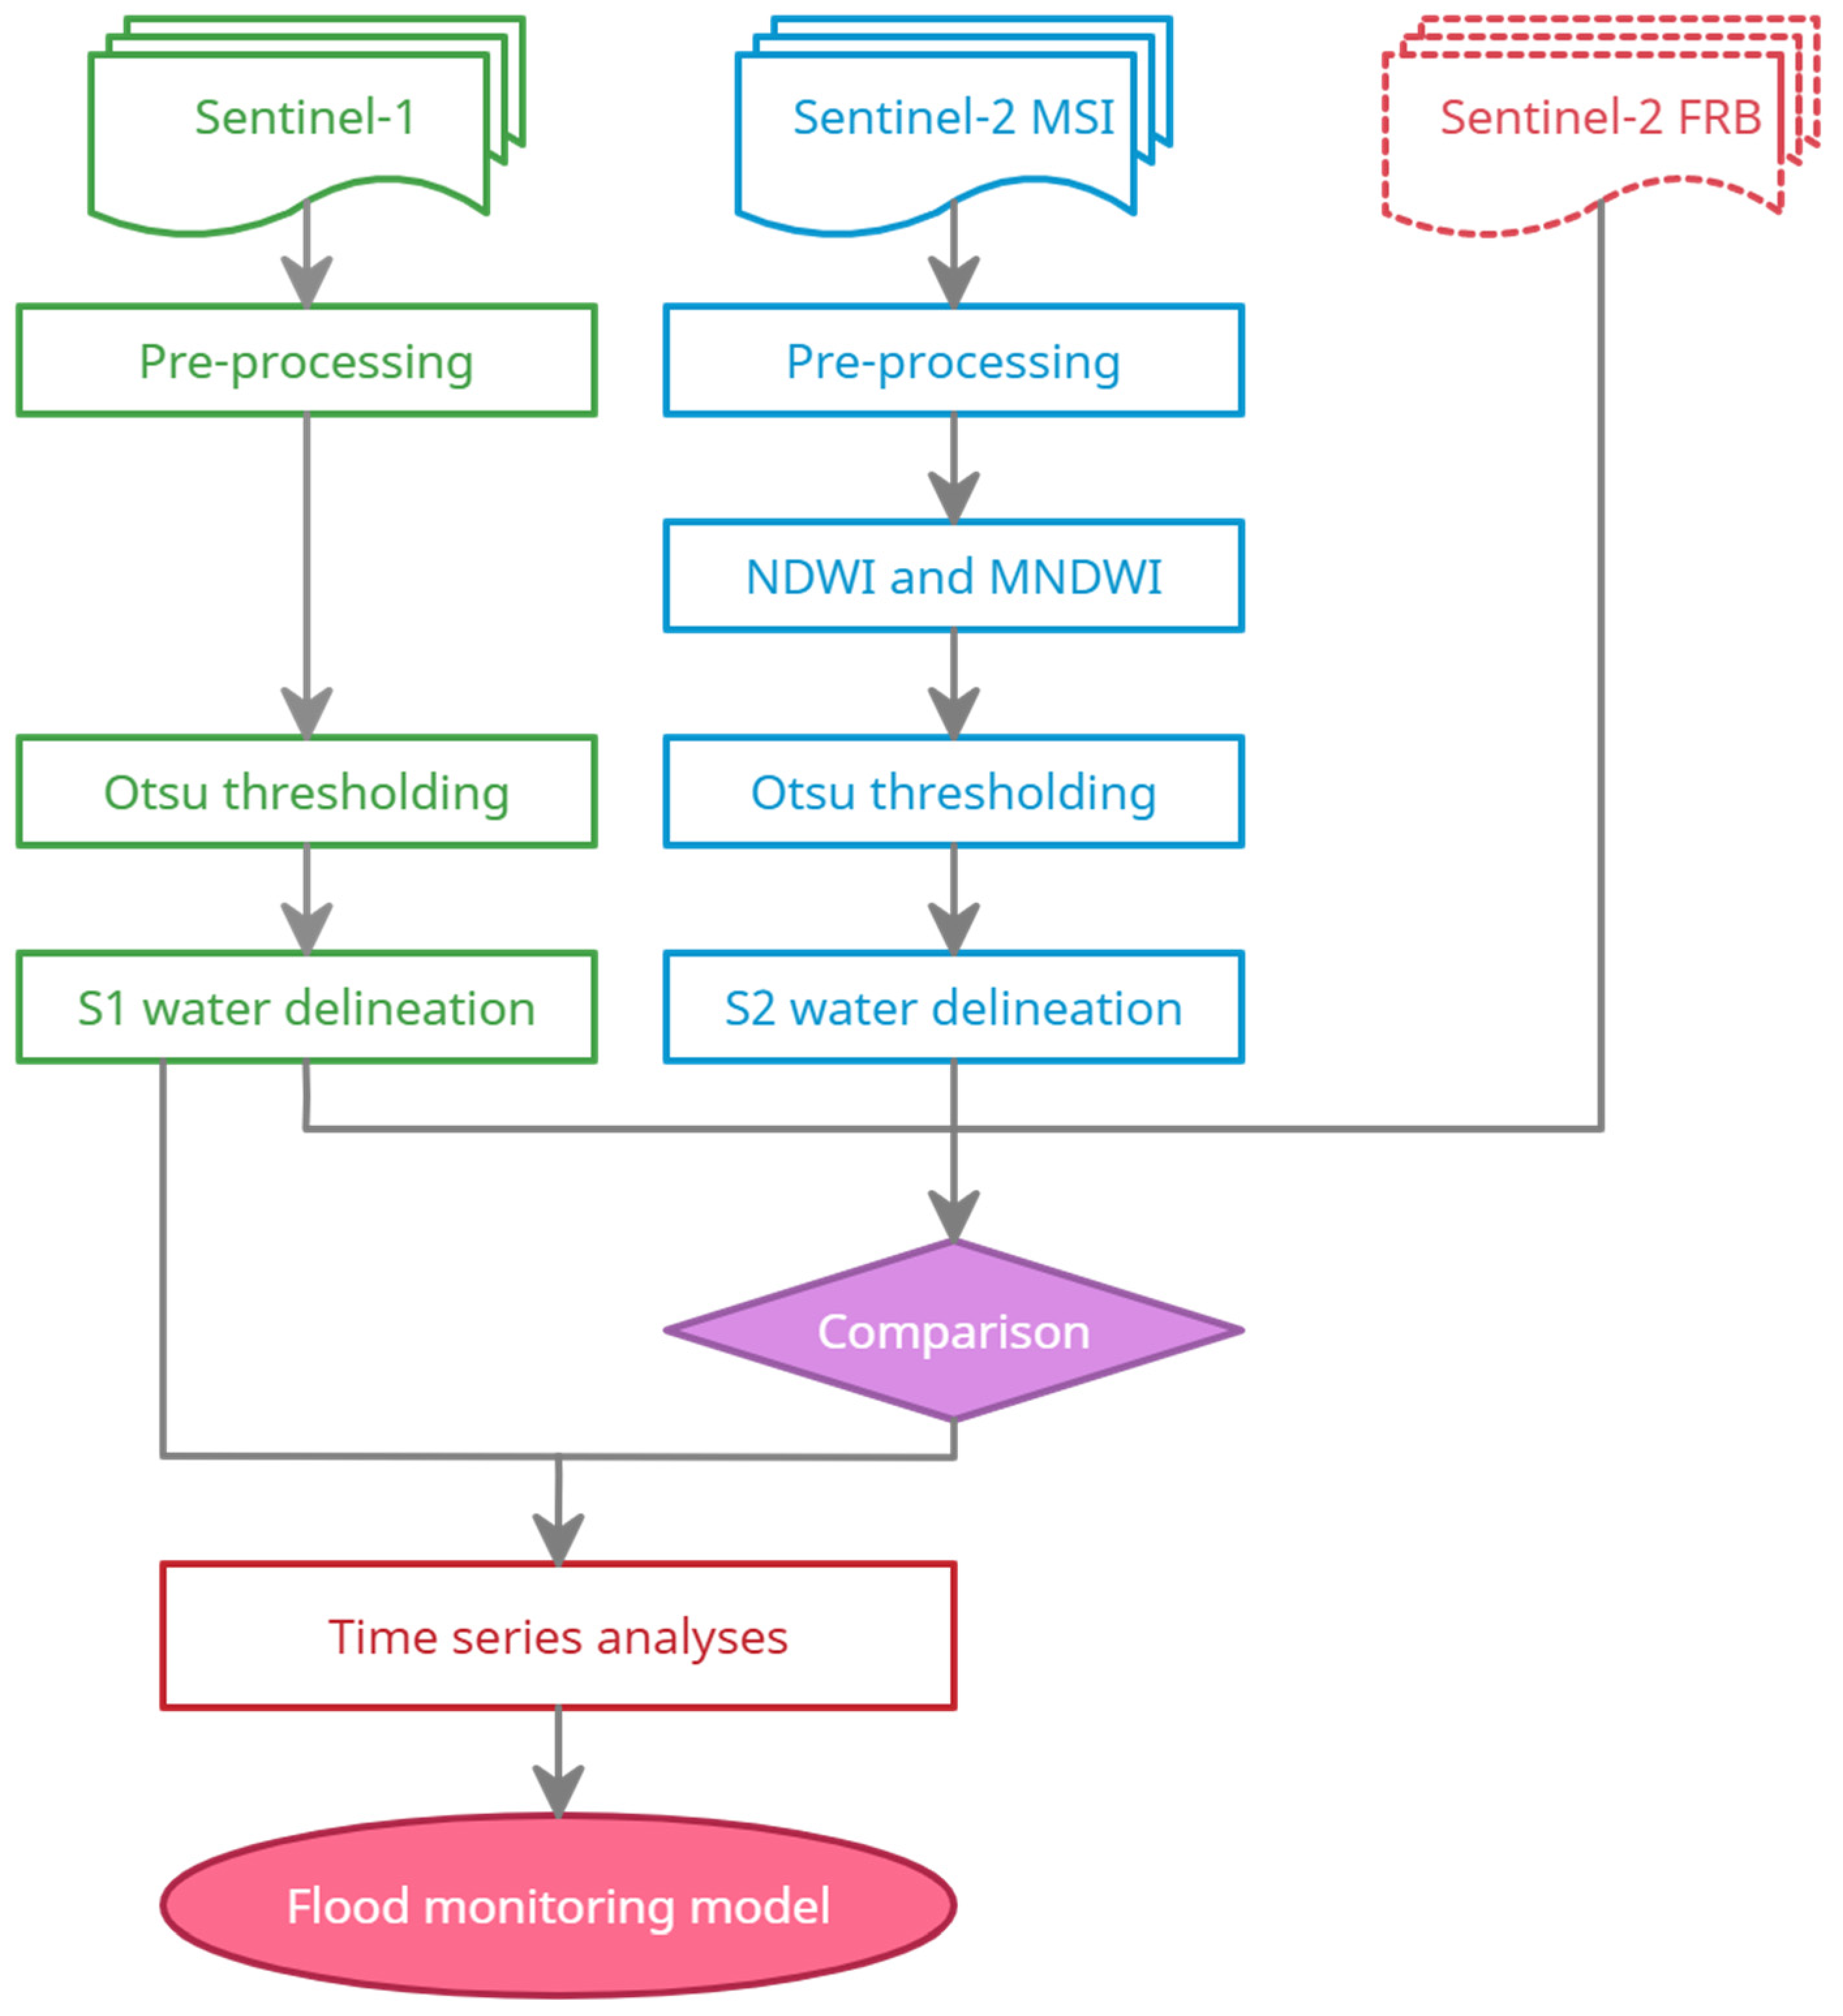
A constellation of two twin satellites, Sentinel-2A/2B, also developed and operated by the ESA, provides optical observations at high spatial resolution from 10 to 60 m and in 5 days revisit to support land and sea monitoring. The Sentinel-2 image is tiled using the Military Grid Reference System (MGRS) grid and projected in the Universal Transverse Mercator (UTM) map projection, with each tile covering 109 × 109 km. The Sentinel-2 MSI has ten bands designed for land applications, including four 10 m bands (band 2—blue (490 nm), band 3—green (560 nm), band 4—red (665 nm), and band 8—near-infrared (NIR) (842 nm)), four 20 m vegetation red edge bands (band 5 (705 nm), band 6 (740 nm), band 7 (783 nm), and band 8A (865 nm)), and two 20 m shortwave infrared bands (band 11 (1610 nm) and band 12 (2190 nm)) [63,89]. The 20 m Scene Classification (SCL) band is also produced by the Sen2Cor algorithm and included in the Sentinel-2 data to provide a classification map at 20 m pixels (snow, ice, cloud, cloud shadows, saturation, vegetation, not vegetated, and water), which will be nearest-neighbor resampled to 10 m to define cloud-free observations in our study. Although ESA provides both level 1C (the Top of Atmosphere (TOA) and level 2A (The Bottom of Atmosphere (BOA) or surface reflectance (SR)) products, the BOA product is only available globally after December 2018. Thus, the Sentinel-2 level 1C images were downloaded from the ESA’s Scientific Data Hub (https://scihub.copernicus.eu/dhus/, accessed on 1 January 2020) and then converted to surface reflectance using the ESA’s Sentinel Applications Platform (SNAP) (https://step.esa.int/main/toolboxes/snap/, accessed on 1 January 2020). The cloud-free Sentinel-2 MSI data will be used for generating surface water maps, which will be used to statistically compare with surface water maps derived from the Sentinel-1 SAR data. Specifically, we assumed there is a minor difference in the surface water in a pair of Sentinel-1 and Sentinel-2 images if they are acquired under similar conditions or have less than a 1-day difference in acquisition date. This assumption is to mitigate the dynamics of hydrological regimes in the study area (e.g., irrigation activities, water level change, and flood events). Considerably, ten Sentinel-2 images with less than 50% cloud cover are available (Table 2). Moreover, the Sentinel-2 MSI bands are compressed and stretched to create optimized natural-looking (false color) images called the Full Resolution Browse (FRB), which were downloaded from the United States Geological Survey (USGS) (https://earthexplorer.usgs.gov/, accessed on 1 January 2020) and will be used for visually comparing the water delineations from both Sentinel-1 SAR data and Sentinel-2 MSI data.

3. Methodology

Figure 3 shows the flowchart of surface water mapping and flood monitoring using the Sentinel-1 image time series. Green section, Sentinel-1 images are pre-processed and then applied the automatic Otsu thresholding algorithm for water delineation. Blue section, Sentinel-2 MSI images are first pre-processed to generate normalized difference water index (NDWI) and modified normalized difference water index (MNDWI) products. The automatic Otsu threshold is then applied similarly on the derived NDWI and MNDWI products for water delineation. Next, a comparison between surface water maps derived from Sentinel-1 SAR data, optical Sentinel-2 MSI data, and Sentinel-2 FRB images is performed to estimate the ability to apply the Otsu thresholding algorithm on Sentinel-1 SAR data for mapping surface water. Finally, a flood mapping algorithm is developed for monitoring flood water extent in NRT using a sequence of time series analyses based on the change detection approach.

3.1. Surface Water Delineation Using Sentinel-1 Data

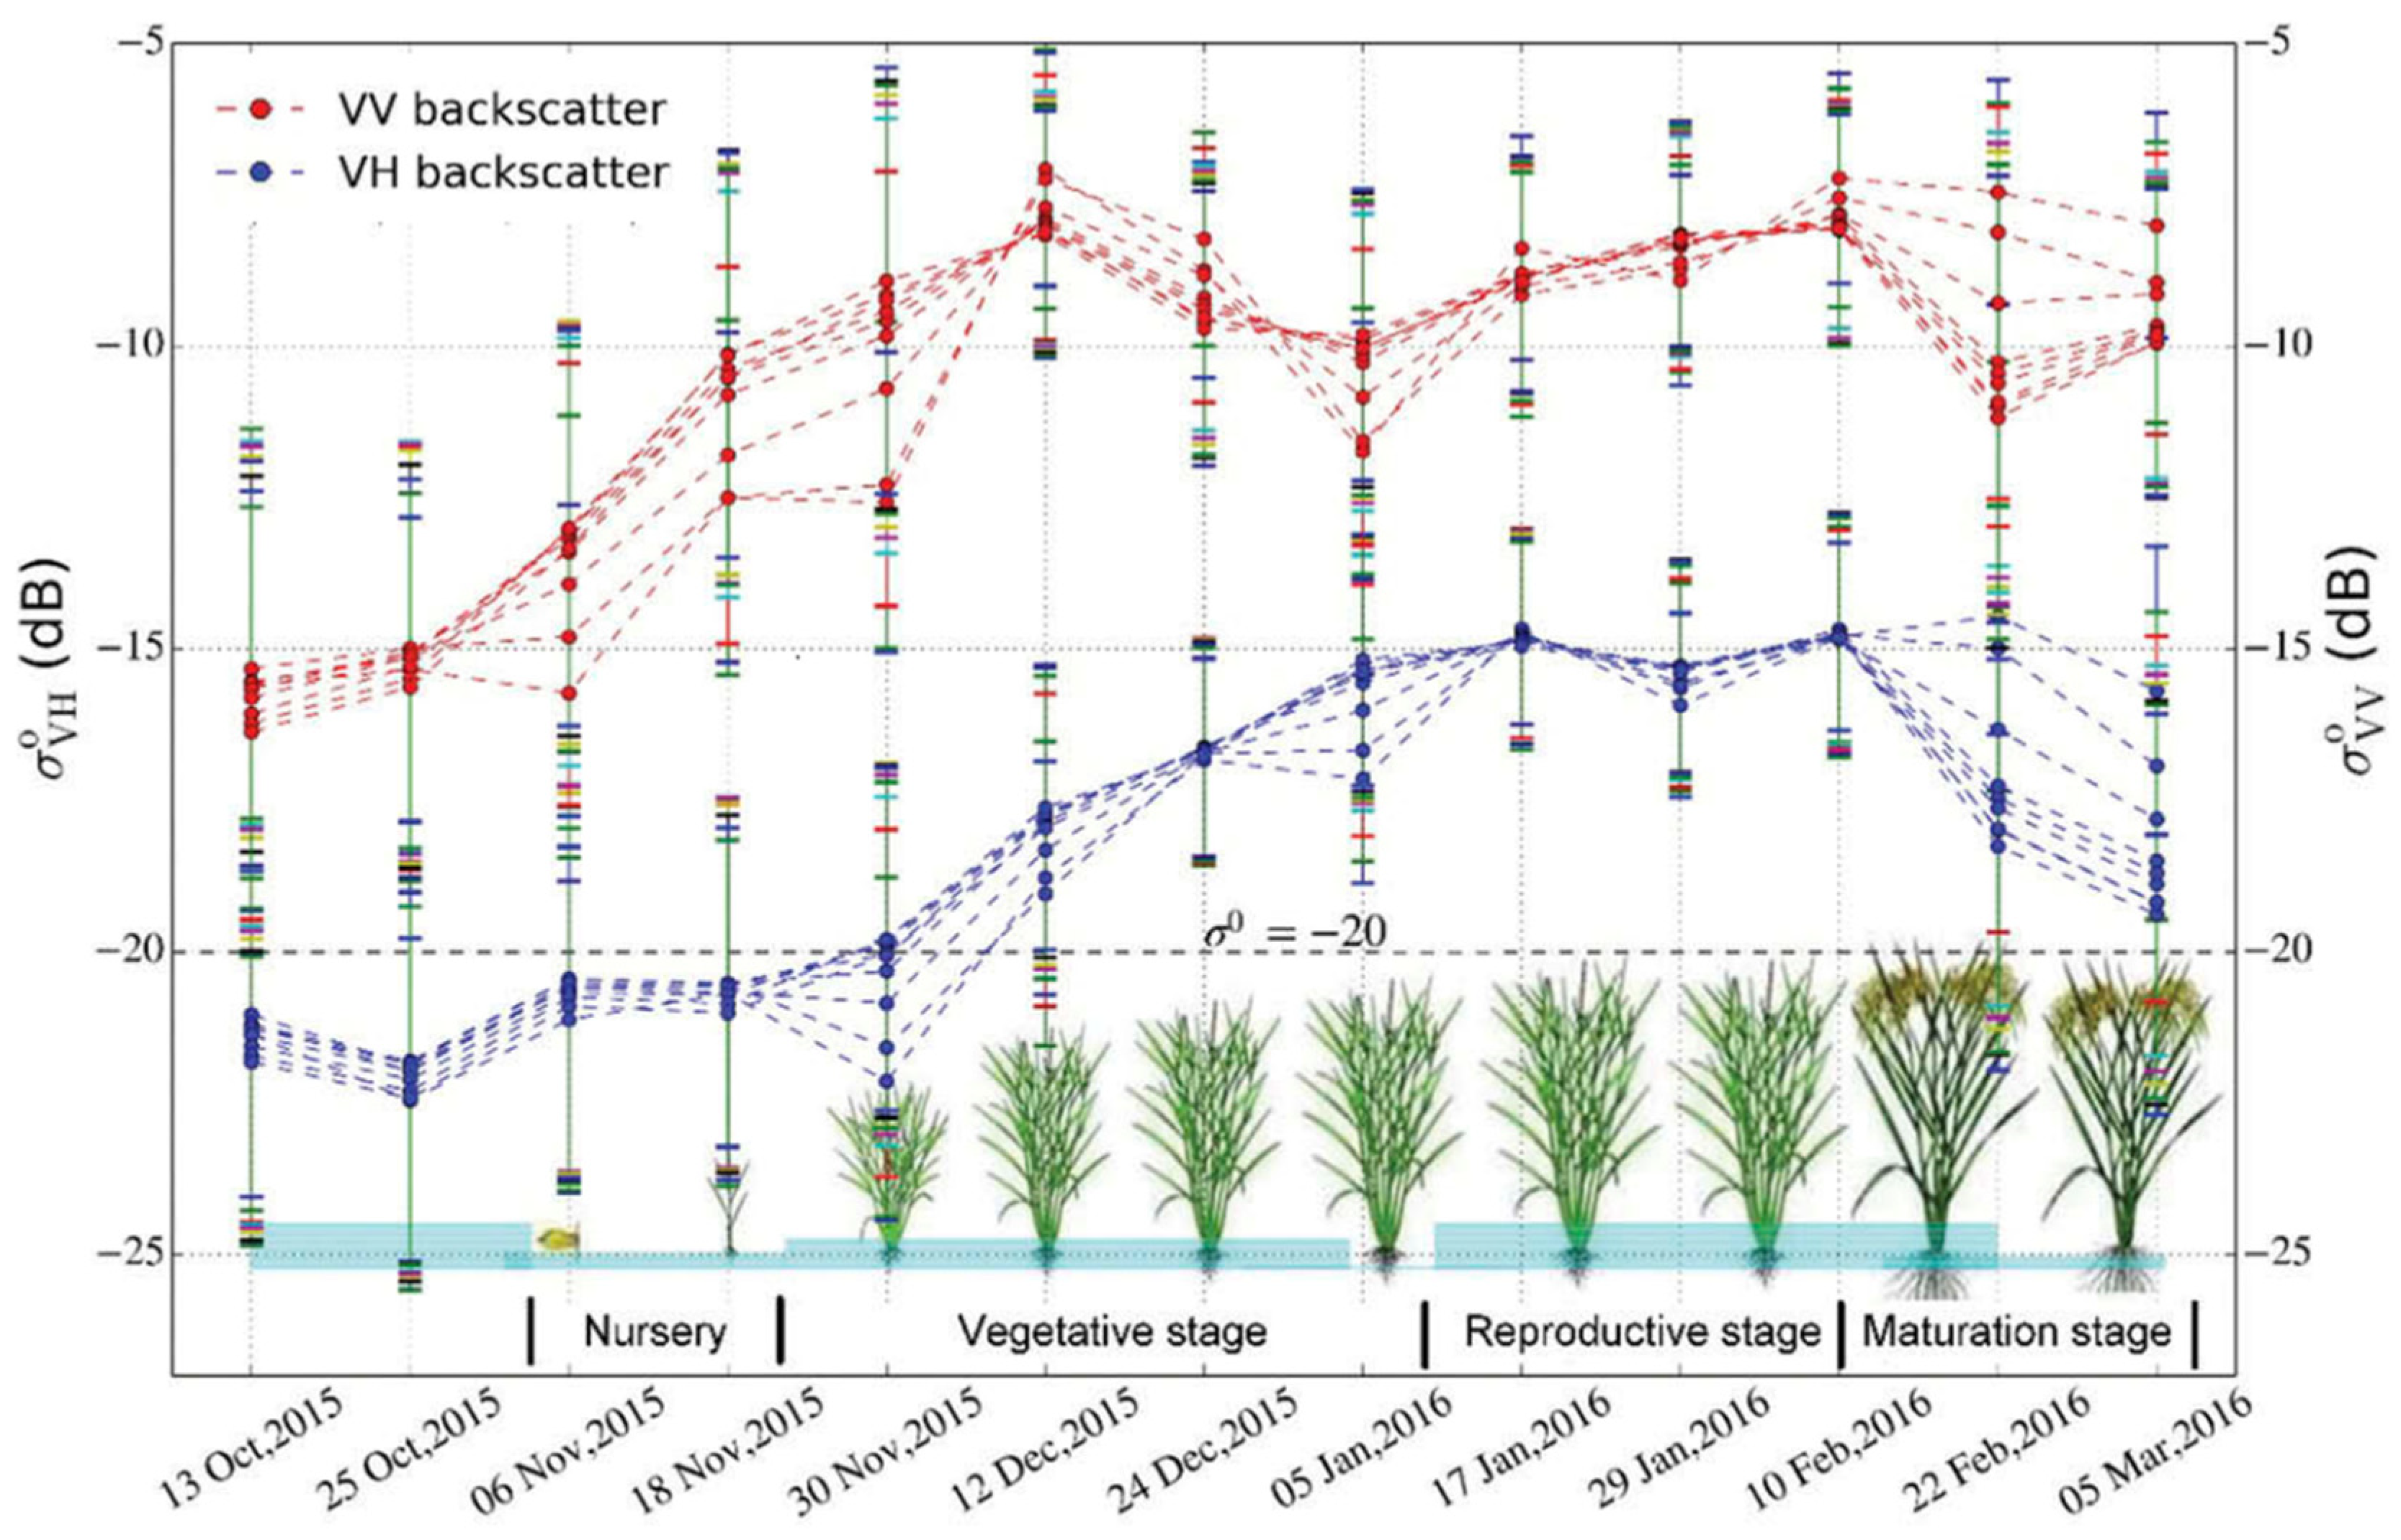
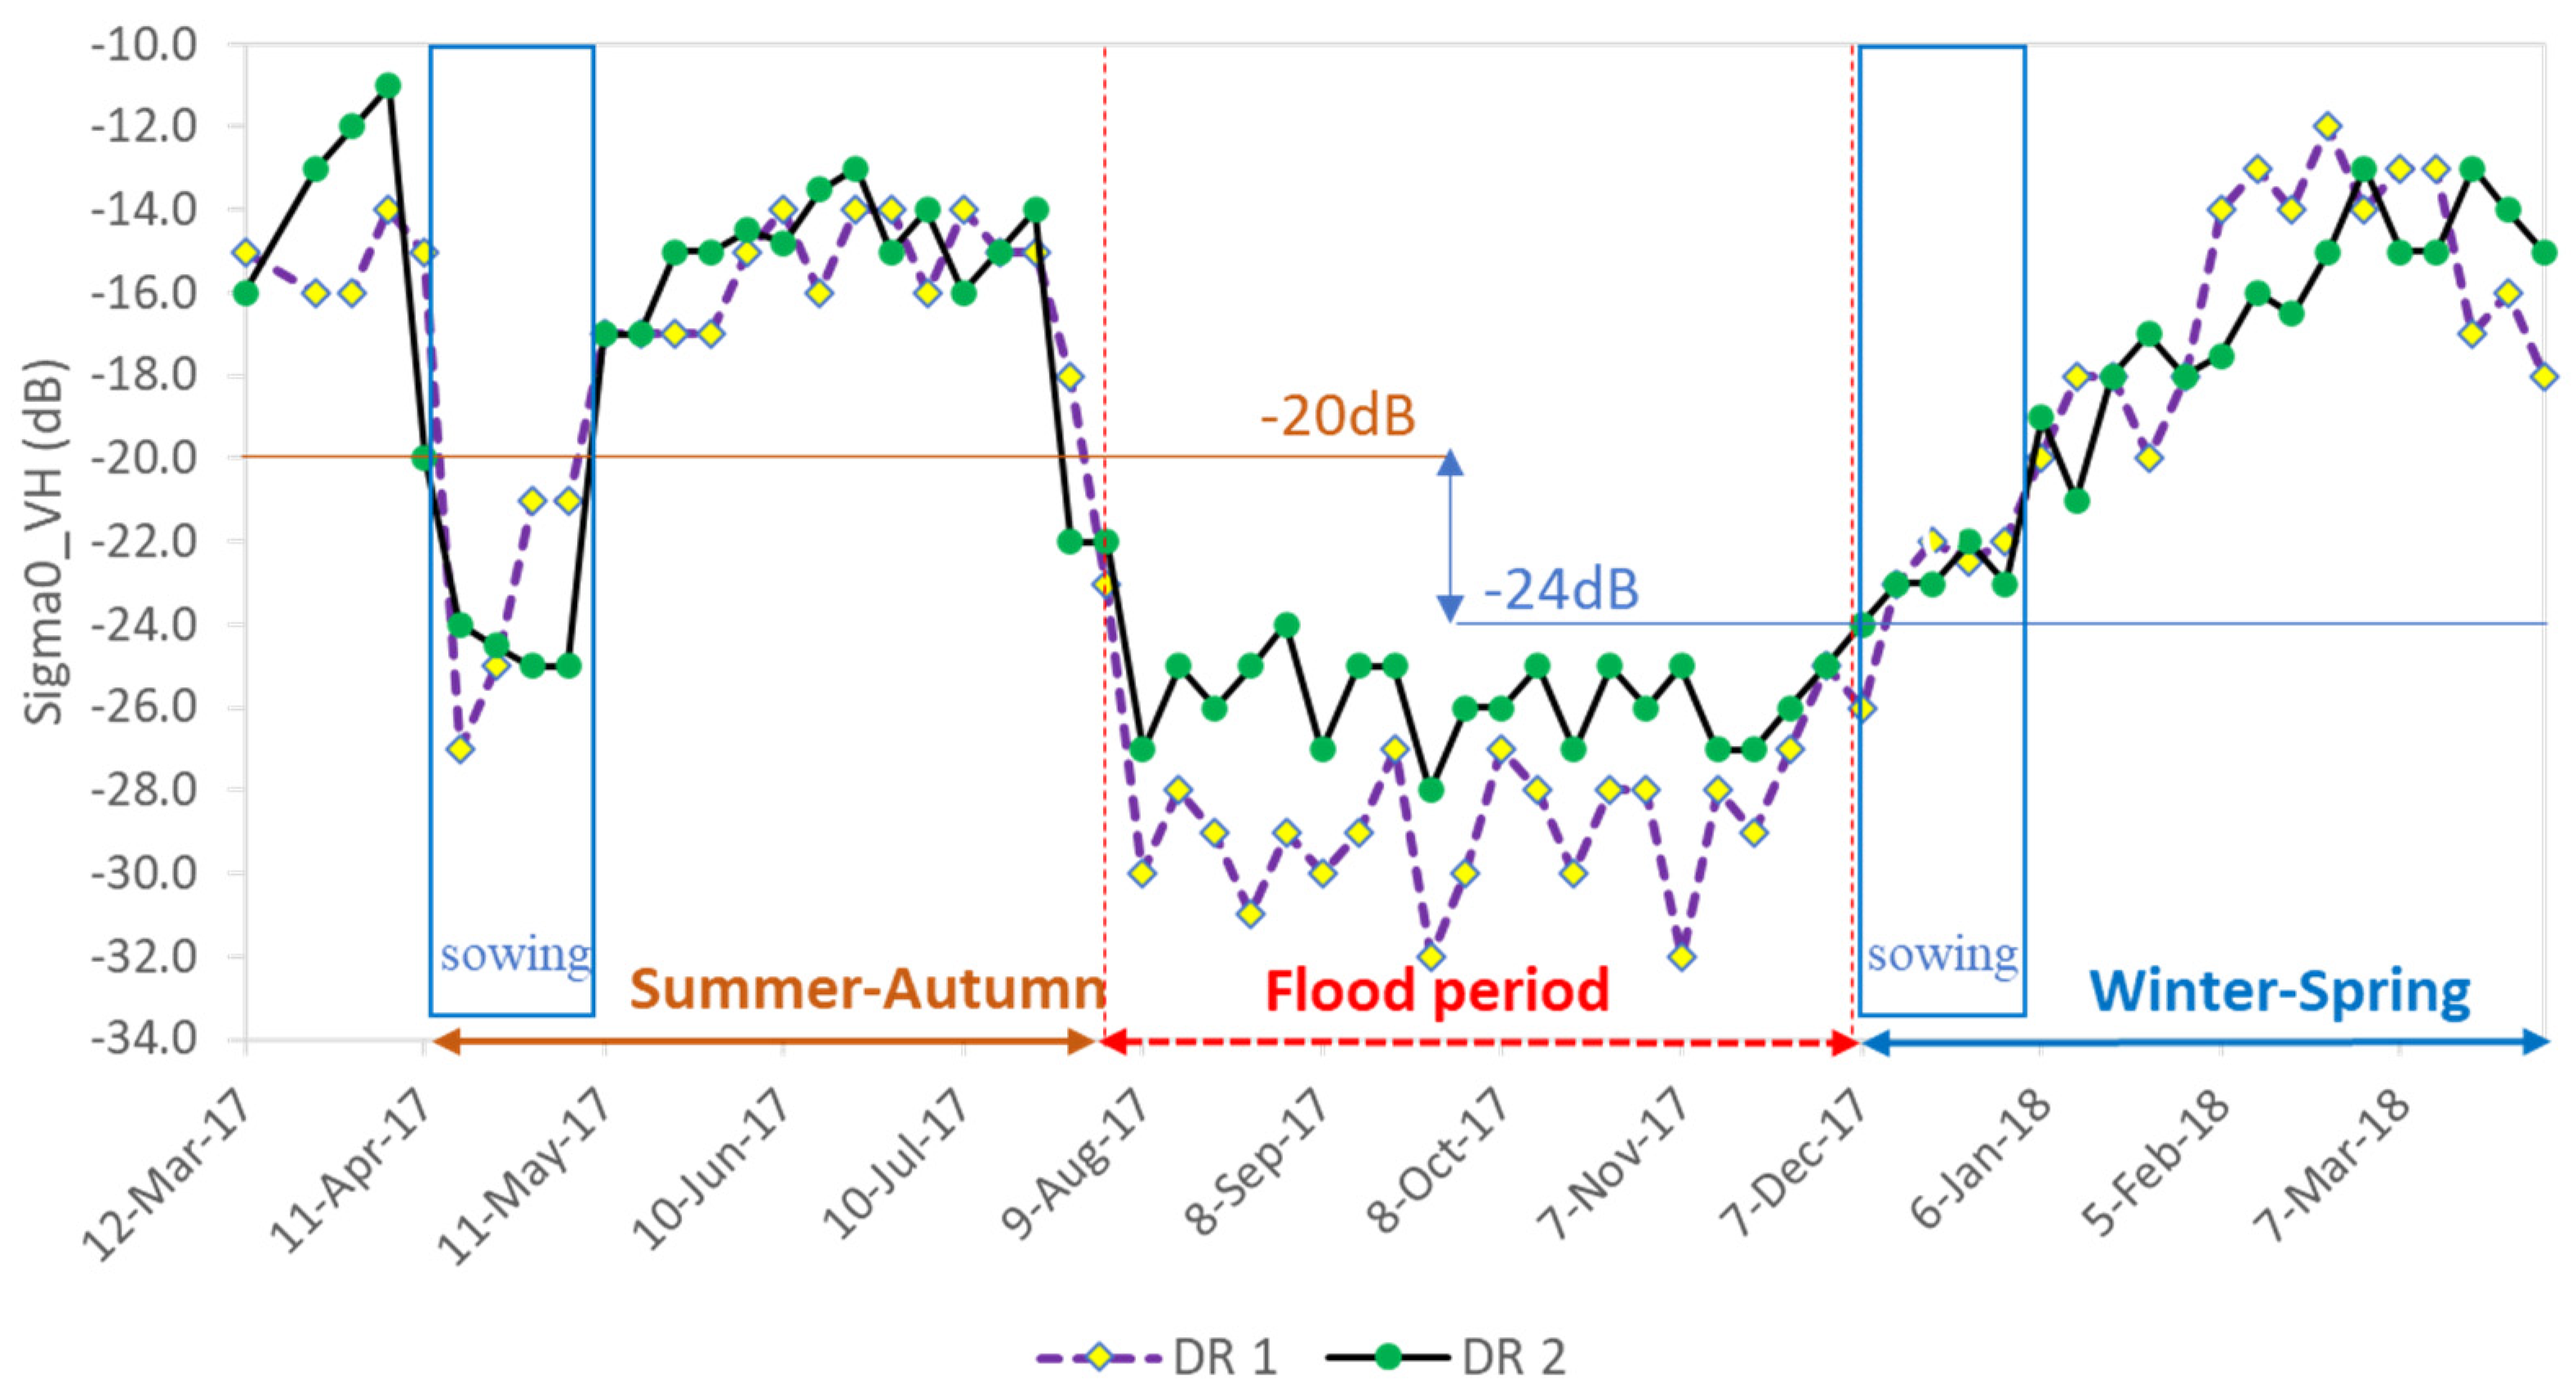
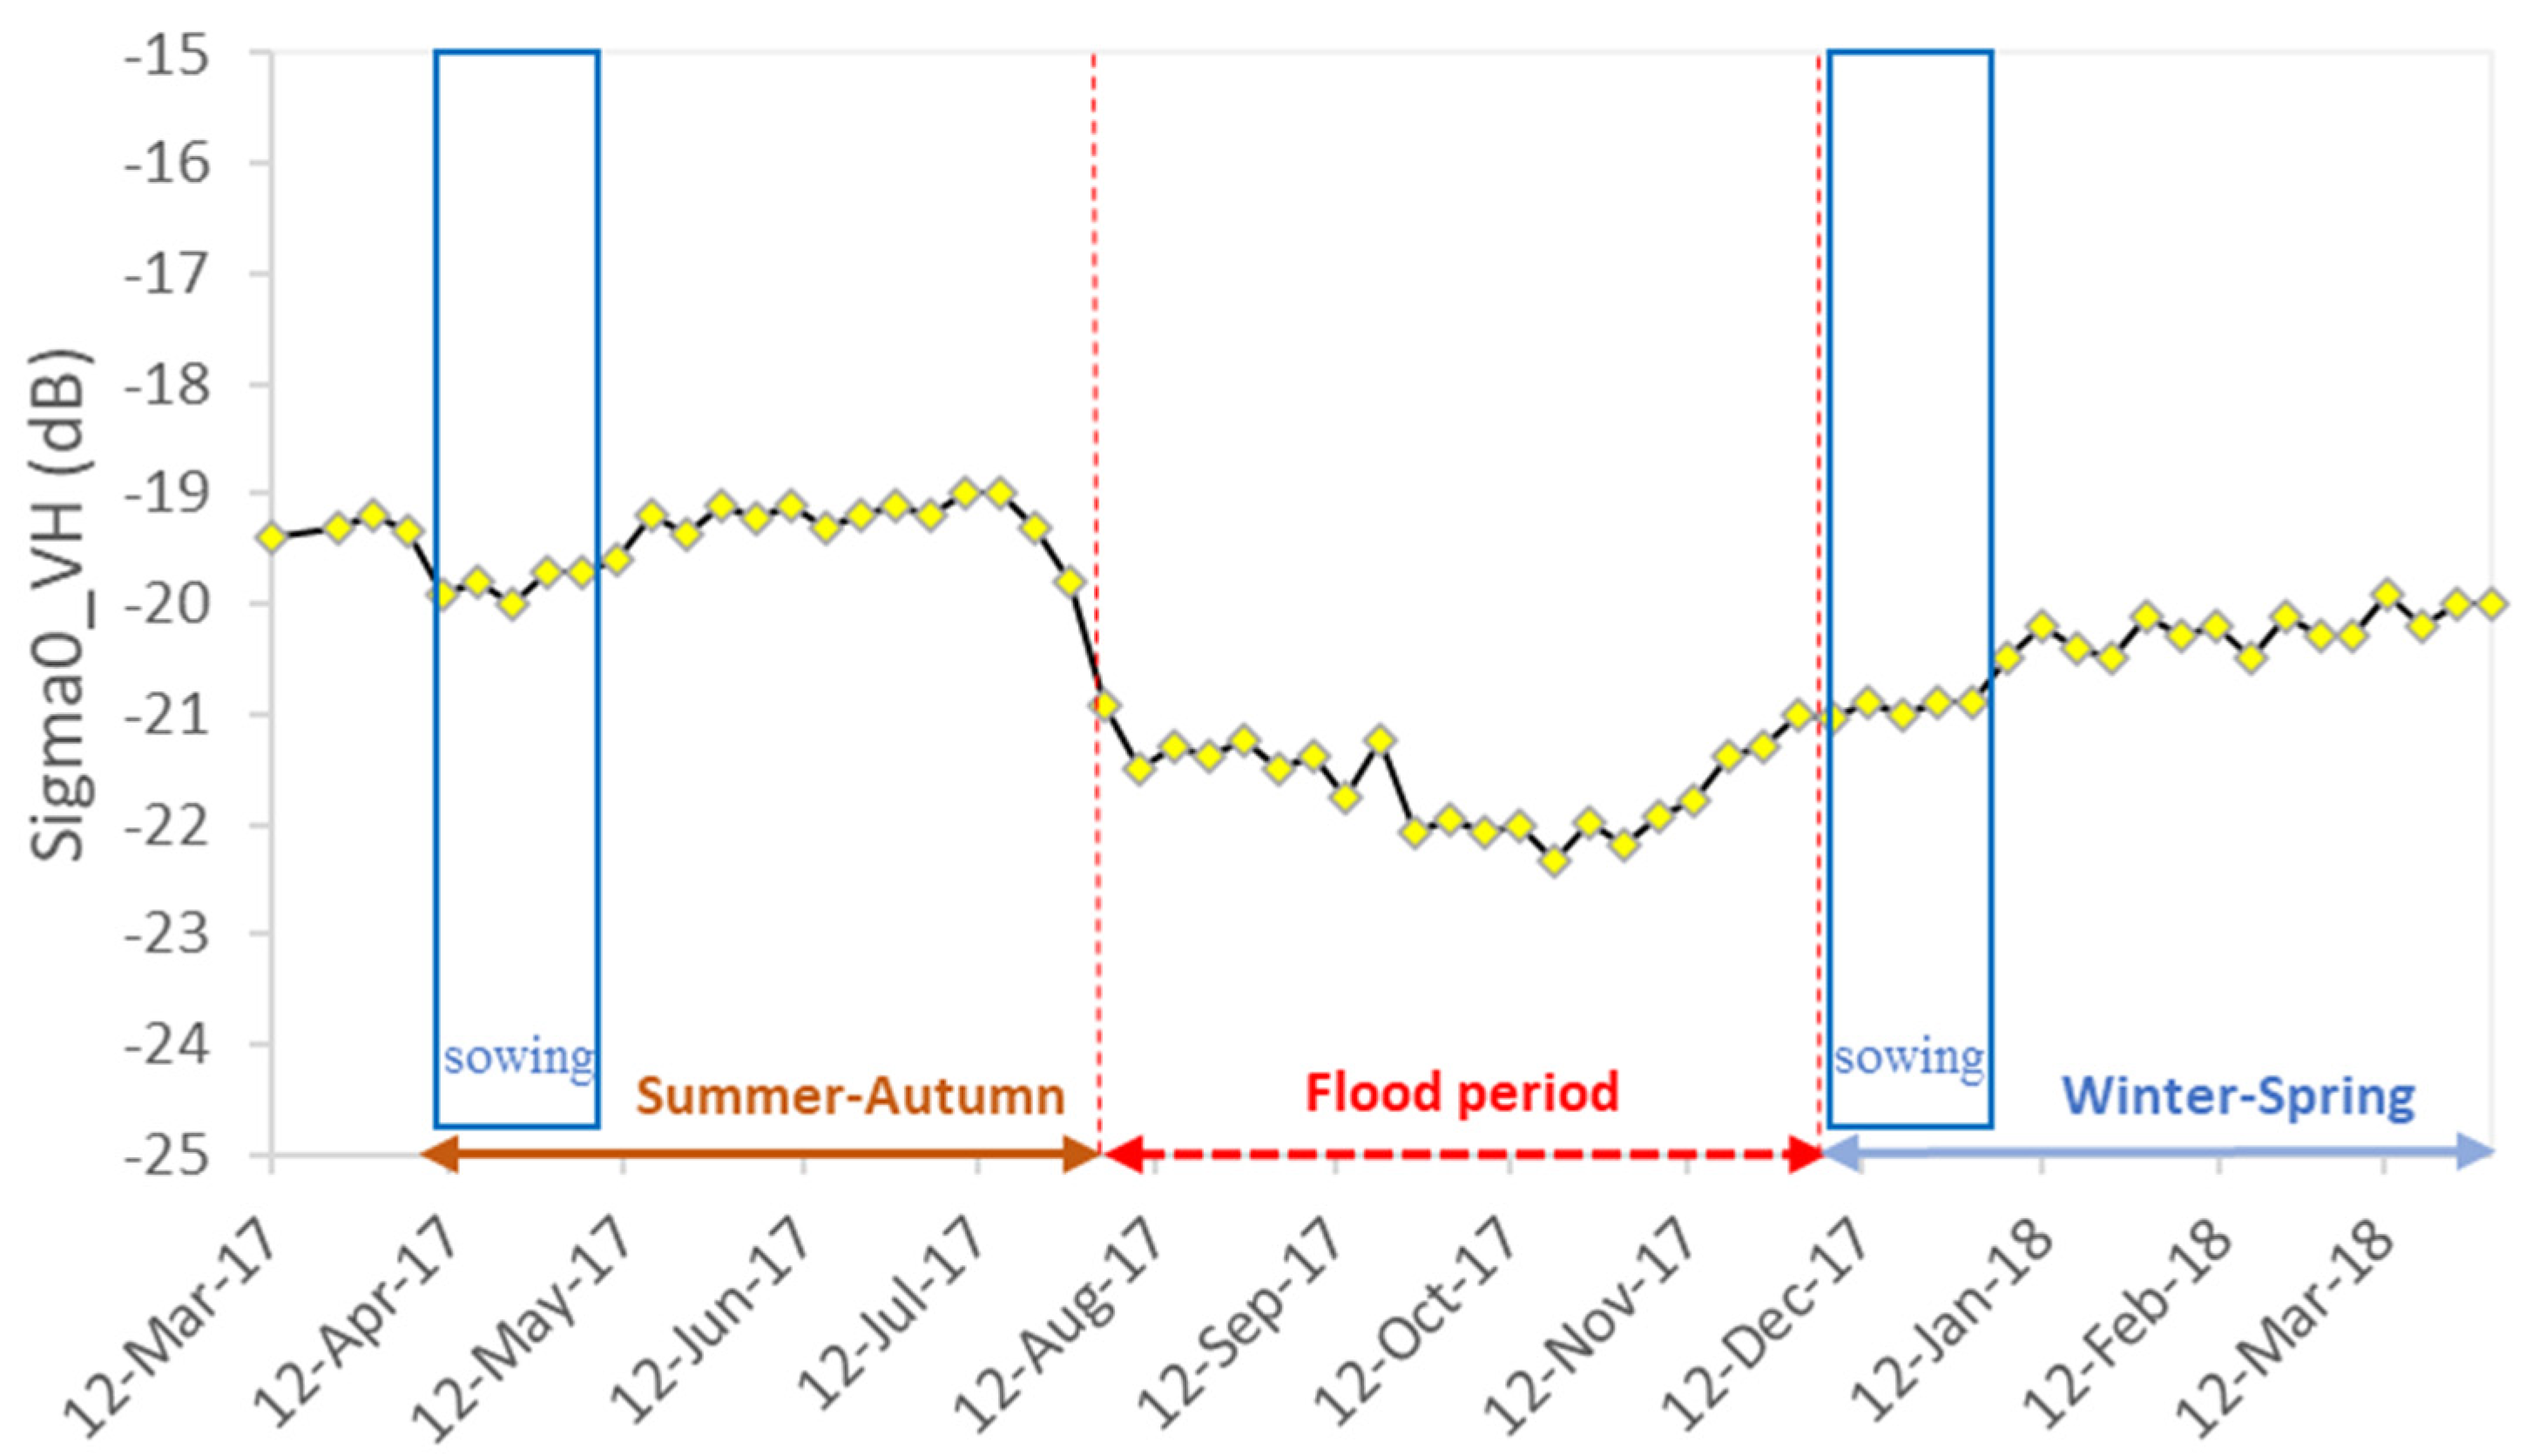
3.1.1. Polarization Analysis

Sentinel-1 satellites with the operational mode of IW swath meet most of the service conditions, simplify mission planning, reduce operational expenses, and create a coherent long-term archive with both dual VH and VV polarizations [78,80]. In previous studies, the double-bounce phenomena caused by the interaction of vegetation and water and mixed pixels of water and soil could create a large variation in backscatter [50,90]. According to Bangira et al. [49], there is a significant increase in the backscatter intensity of VV polarization due to the double-bounce phenomena of water-vegetation relation, while VH polarization has an insignificant impact. In particular, An Giang province is a complex area with 80% being cultivated-paddy fields, in which the mixture of soil, water, and vegetation is a common condition. Figure 4 clearly shows the difference between VH and VV backscatters. In the nursery period (~5 cm of water level), VV backscatter significantly increases, while VH backscatter has a lesser impact. Similarly, in the vegetative stage, when farmers drain and keep 1–3 cm water level for fertilizing their paddy fields, there is a significant drop in VV backscatter, while VH backscatter keeps increasing to reach the maximum value at the beginning of the reproductive stage. Thus, only VH polarization was selected for waterbodies delineation in this study to mitigate the impact of controlling water levels in the rice fields.

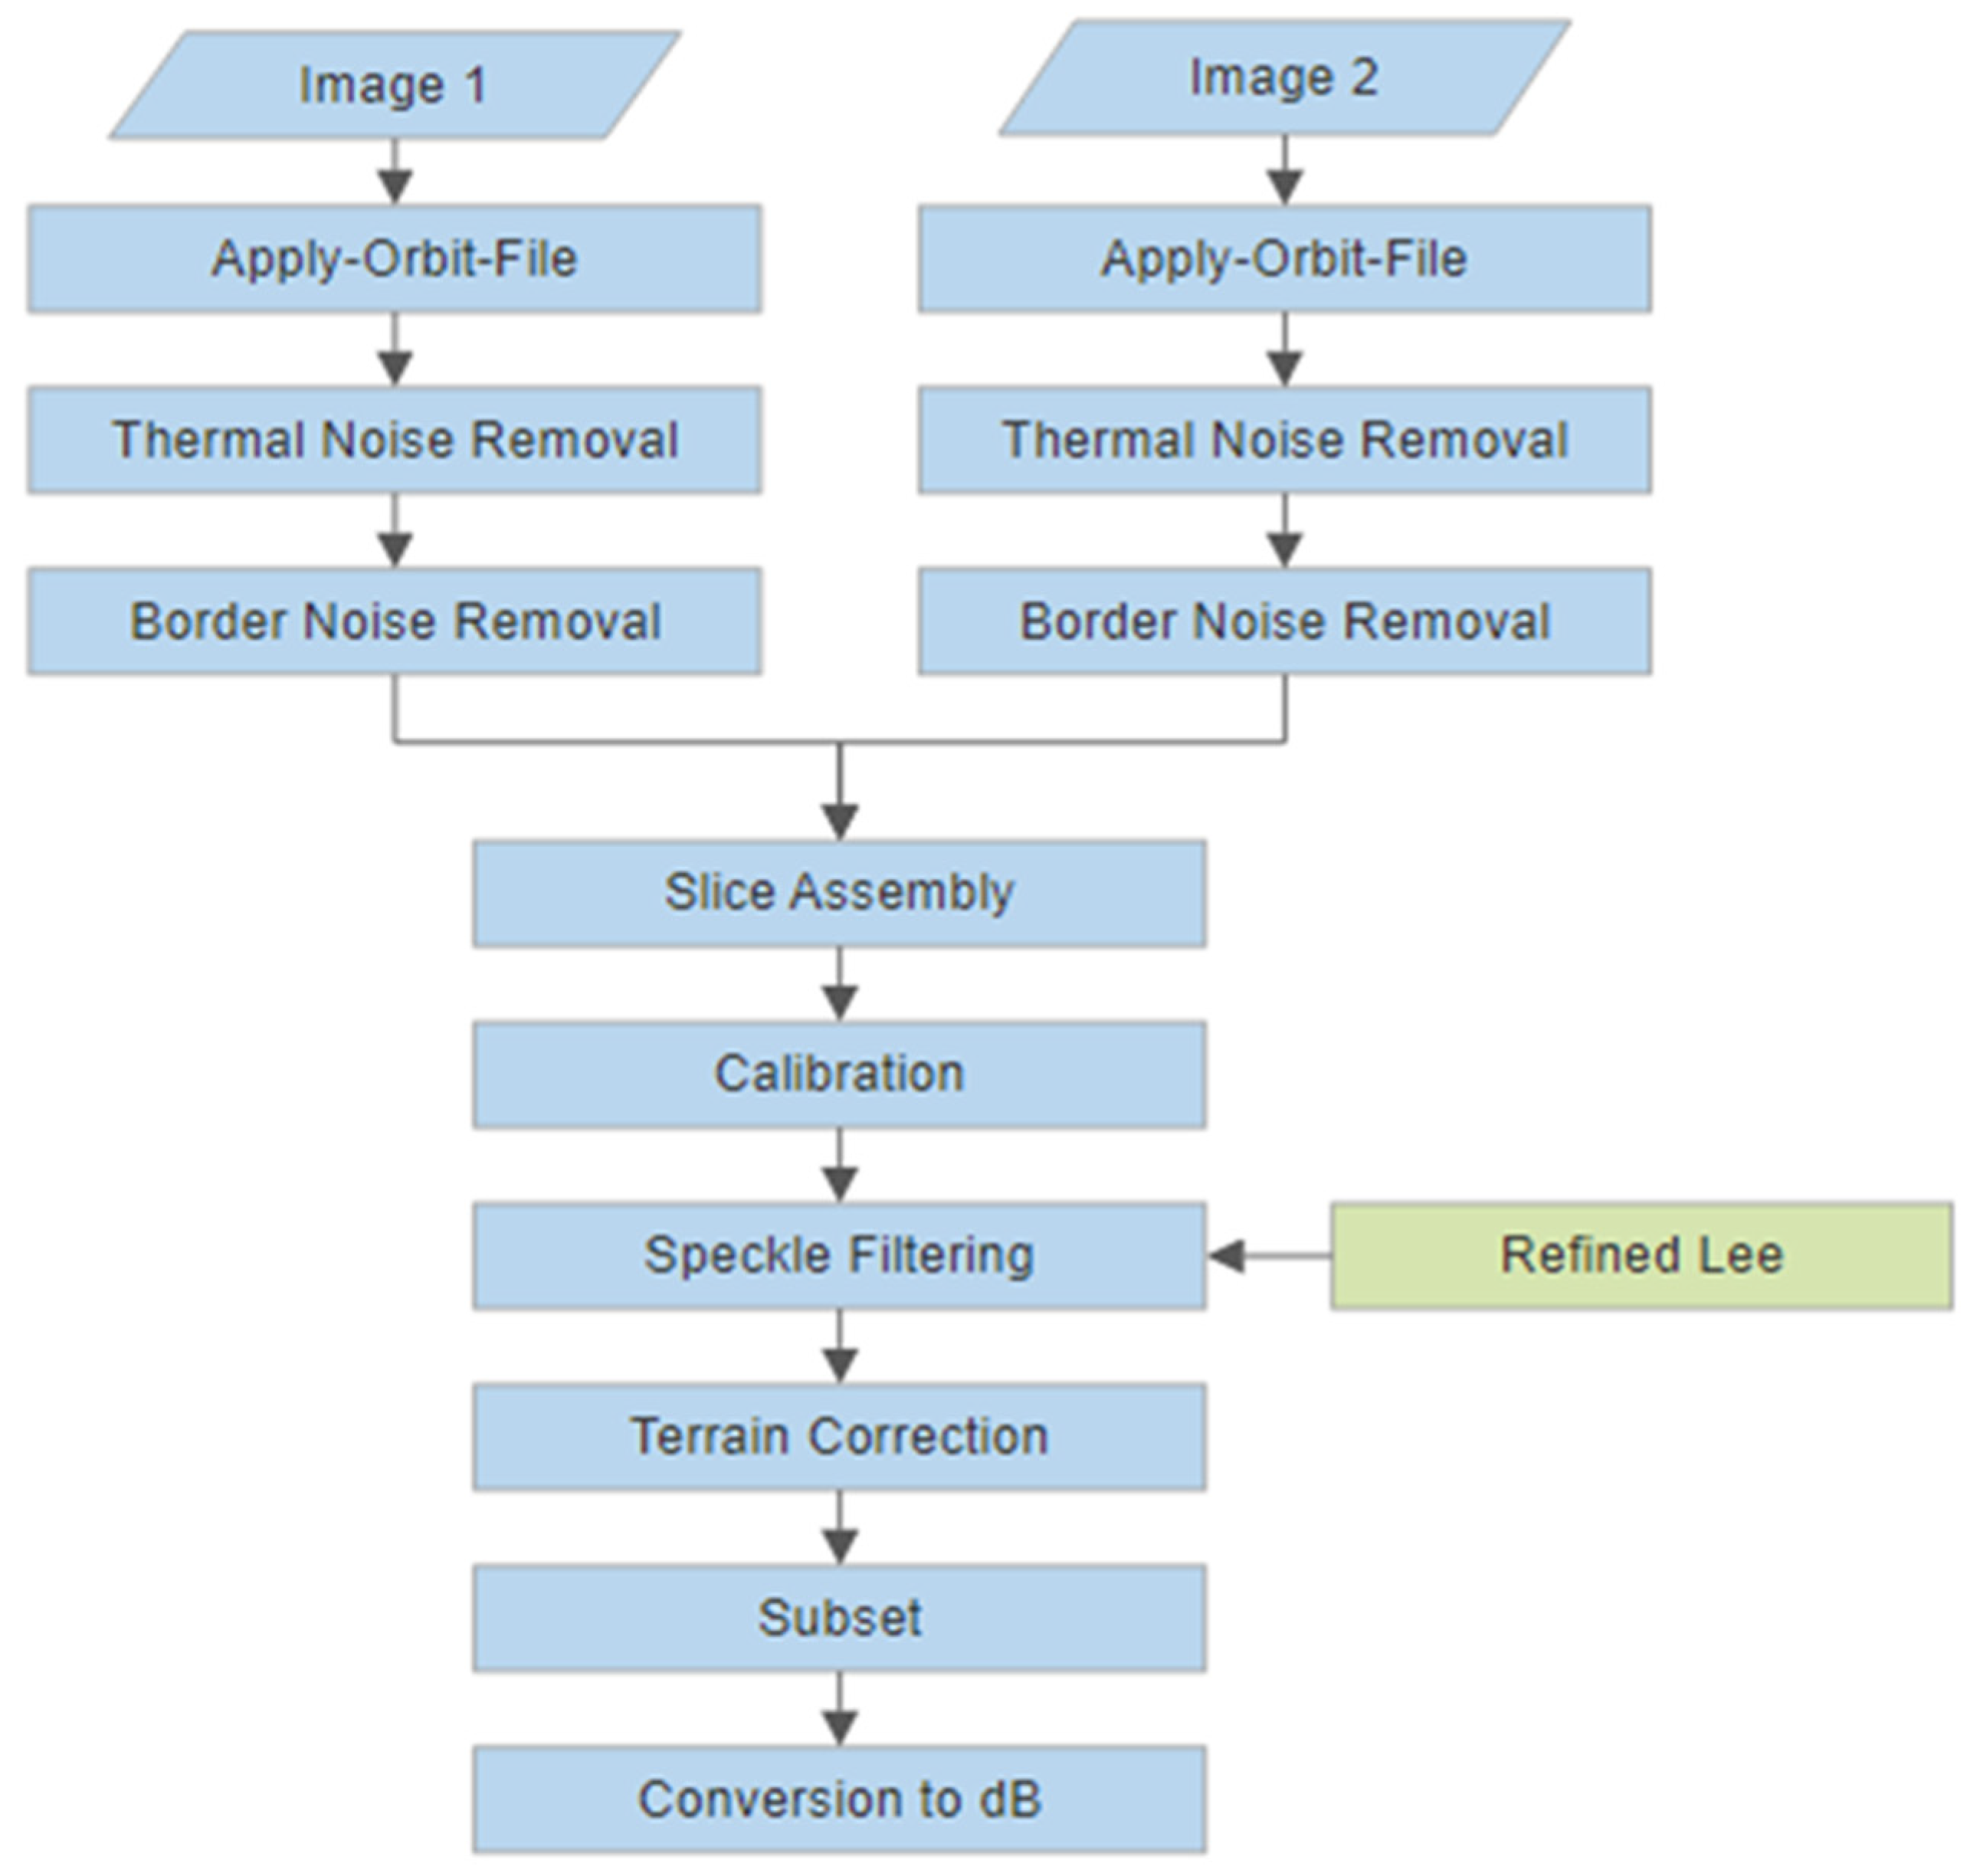
3.1.2. Sentinel-1 Pre-Processing

A series of Sentinel-1 VH polarization images were pre-processed using the SNAP. The procedure of pre-processing Sentinel-1 image was presented in previous studies [85,92], so it is briefly introduced here and illustrated in Figure 5. First, two images for each scene in an acquisition date are applied and updated orbit files to adjust satellite position, velocity information, and orbits. Second is the removal of thermal noise, especially the additive thermal noise in cross-polarization, which is caused by the discontinuities between sub-swaths for different scenes in multi-swath acquisition modes. The border noise removal also removes the low intensity and invalid backscatter on the edges of each scene. Third, slice assembly is used to reduce the non-seamless quality of slice products and create a mosaic of two images covering An Giang province fully. Fourth, the calibration reverses the scaling factor in the level-1 product development and applies a constant offset and a range-dependent gain (e.g., absolute calibration constant, sigma naught values, etc.) to obtain the radiometrically calibrated backscatter for all pixels in the mosaic image. Fifth, speckle-filtering is employed to reduce the granular noises or speckles in the images caused by the interference of signals from different scatterers. The Refined Lee filter is outstanding algorithm compared to other speckle filters for visual interpretation because it is able to preserve linear features, scene edges, texture information, and point target [93]. Sixth, a terrain correction is applied to acquire accurate geolocation using a digital elevation model to adjust the geometric distortions due to the differences in viewing angles and topography (e.g., foreshortening and shadow). Finally, the mosaic image is clipped to the case study of An Giang province and converted to the backscatter coefficient in dB using a logarithmic transformation.

3.1.3. Dynamic Otsu Thresholding Algorithm for Mapping Surface Water

Image thresholding is an efficient technique for SAR data analysis, which is fast, cost-effective, and accurate for surface water mapping, flood monitoring, and LULC classification [62,64,65]. For instance, Twele et al. [94] developed a NRT processing chain for flood detection by using a thresholding method to separate water and non-water area. Thresholding was also applied in an experiment for mapping vegetation in flooded areas using Sentinel-1 SAR data [95]. Similarly, a threshold was utilized on Sentinel-1A and TanDEM-X imagery for mapping wetland areas [96]. Finding a robust threshold that works for different sites and different images is a challenging task because the threshold depends on a number of factors, such as atmospheric conditions, mixed pixels, spatial resolution, and viewing angle of the satellite image [62]. Meanwhile, a fixed and empirical threshold was regularly employed on the Sentinel-1 SAR data for LULC classification in the VMD, e.g., land cover classification of An Giang province [81] and rice extent mapping in the Mekong Delta [91]. However, different rice seasons in the VMD have different features, growing environments, and weather conditions, which could lead to changes in backscatter intensity, especially the complexities of mixed pixels of vegetation, soil, and water in the paddy fields. Figure 6 shows a significant difference between the two rice seasons (summer-autumn and winter-spring). Rice in the summer-autumn season has lower backscatter in the sowing and vegetative stages. The minimum VH polarization backscatter intensity in the summer-autumn season is around −20 dB, while it is around −24 dB in the winter-spring season. For this reason, instead of an empirical threshold for the entire year, each image should have applied an adaptive or a specific threshold to separate water from non-water areas.
On the other hand, the Otsu thresholding algorithm is a well-known technique that enables the automatic determination of an optimal threshold t (Equation (1)), which is able to maximize the inter-class variance of two classes from a gray-level histogram [69]. Additionally, the Otsu threshold has been demonstrated as the most simple and efficient threshold method for surface water mapping [64,69,70]. Recently, Bangira et al. [62] compared the Otsu thresholding technique with machine learning classification methods for mapping waterbodies, showing the potential use of automatic Otsu threshold for mapping complex waterbodies (e.g., submerged vegetation, sedimented, and turbid water). Therefore, in this study, water pixels in each Sentinel-1 image were detected using the automatic Otsu thresholding algorithm using Equation (1). Based on the histogram of pre-processed Sentinel-1 VH backscatter intensity image, the algorithm exhaustively searches for the value that minimizes the intra-class variance, defined as a weighted sum of variances of water and non-water classes. The weights of water and non-water are the probabilities of these two classes separated by each threshold. By doing that for each Sentinel-1 image, the algorithm enables us to find different optimal thresholds for a time series of Sentinel-1 VH images (or dynamic Otsu thresholding). The pixels with a backscatter value less than the estimated Otsu threshold t were classified as water and greater than or equal to the estimated Otsu threshold t were classified as non-water. The Otsu threshold is estimated as:
σ 2 ( t ) = P w ( t ) × σ w 2 ( t ) + P n w ( t ) × σ n w 2 ( t )
where σ is the weighted sum of variances of water and non-water classes. P w ,   σ w , P n w ,   and   σ n w   are the probabilities and variances of the water ( w ) and non-water ( n w ) classes separated by a threshold t , respectively.

3.2. Surface Water Delineation Using Sentinel-2 MSI Data

3.2.1. Derivation of Normalized Difference Water Index (NDWI) and Modified Normalized Difference Water Index (MNDWI)

NDWI is the most popular water radiometric index proposed by McFeeters in 1996 based on the sharp absorption of NIR and high reflectance of the green band in the presence of water [97]. The NDWI formula (Equation (2)) is proposed as:
N D W I = ( ρ 3 ρ 8 ) / ( ρ 3 + ρ 8 )  
where ρ 3 and ρ 8 are the surface reflectance values of the green band (central wavelength of 0.56 μm) and NIR band (central wavelength of 0.842 μm) from Sentinel-2 data, respectively.
NDWI is excellent for water detection; however, there is a relatively low accuracy in areas with a mixture of water, built-up, soil, and vegetation [98]. A modification of NDWI was performed by Xu et al. [99] that uses the replacement of a SWIR band instead of a NIR band due to the absorption by water in the SWIR band being stronger than the NIR band. The MNDWI formula (Equation (3)) is proposed as:
M N D W I = ( ρ 3 ρ 11 ) / ( ρ 3 + ρ 11 )  
where ρ 3 and ρ 11 are the surface reflectance values of the green band (central wavelength of 0.56 μm) and SWIR band (central wavelength of 1.61 μm), respectively. It should be noted that the green and NIR bands are at 10 m spatial resolution, and the SWIR band is provided at 20 m spatial resolution. Thus, the SWIR band is nearest-neighbor resampled to 10 m before calculating MNDWI.

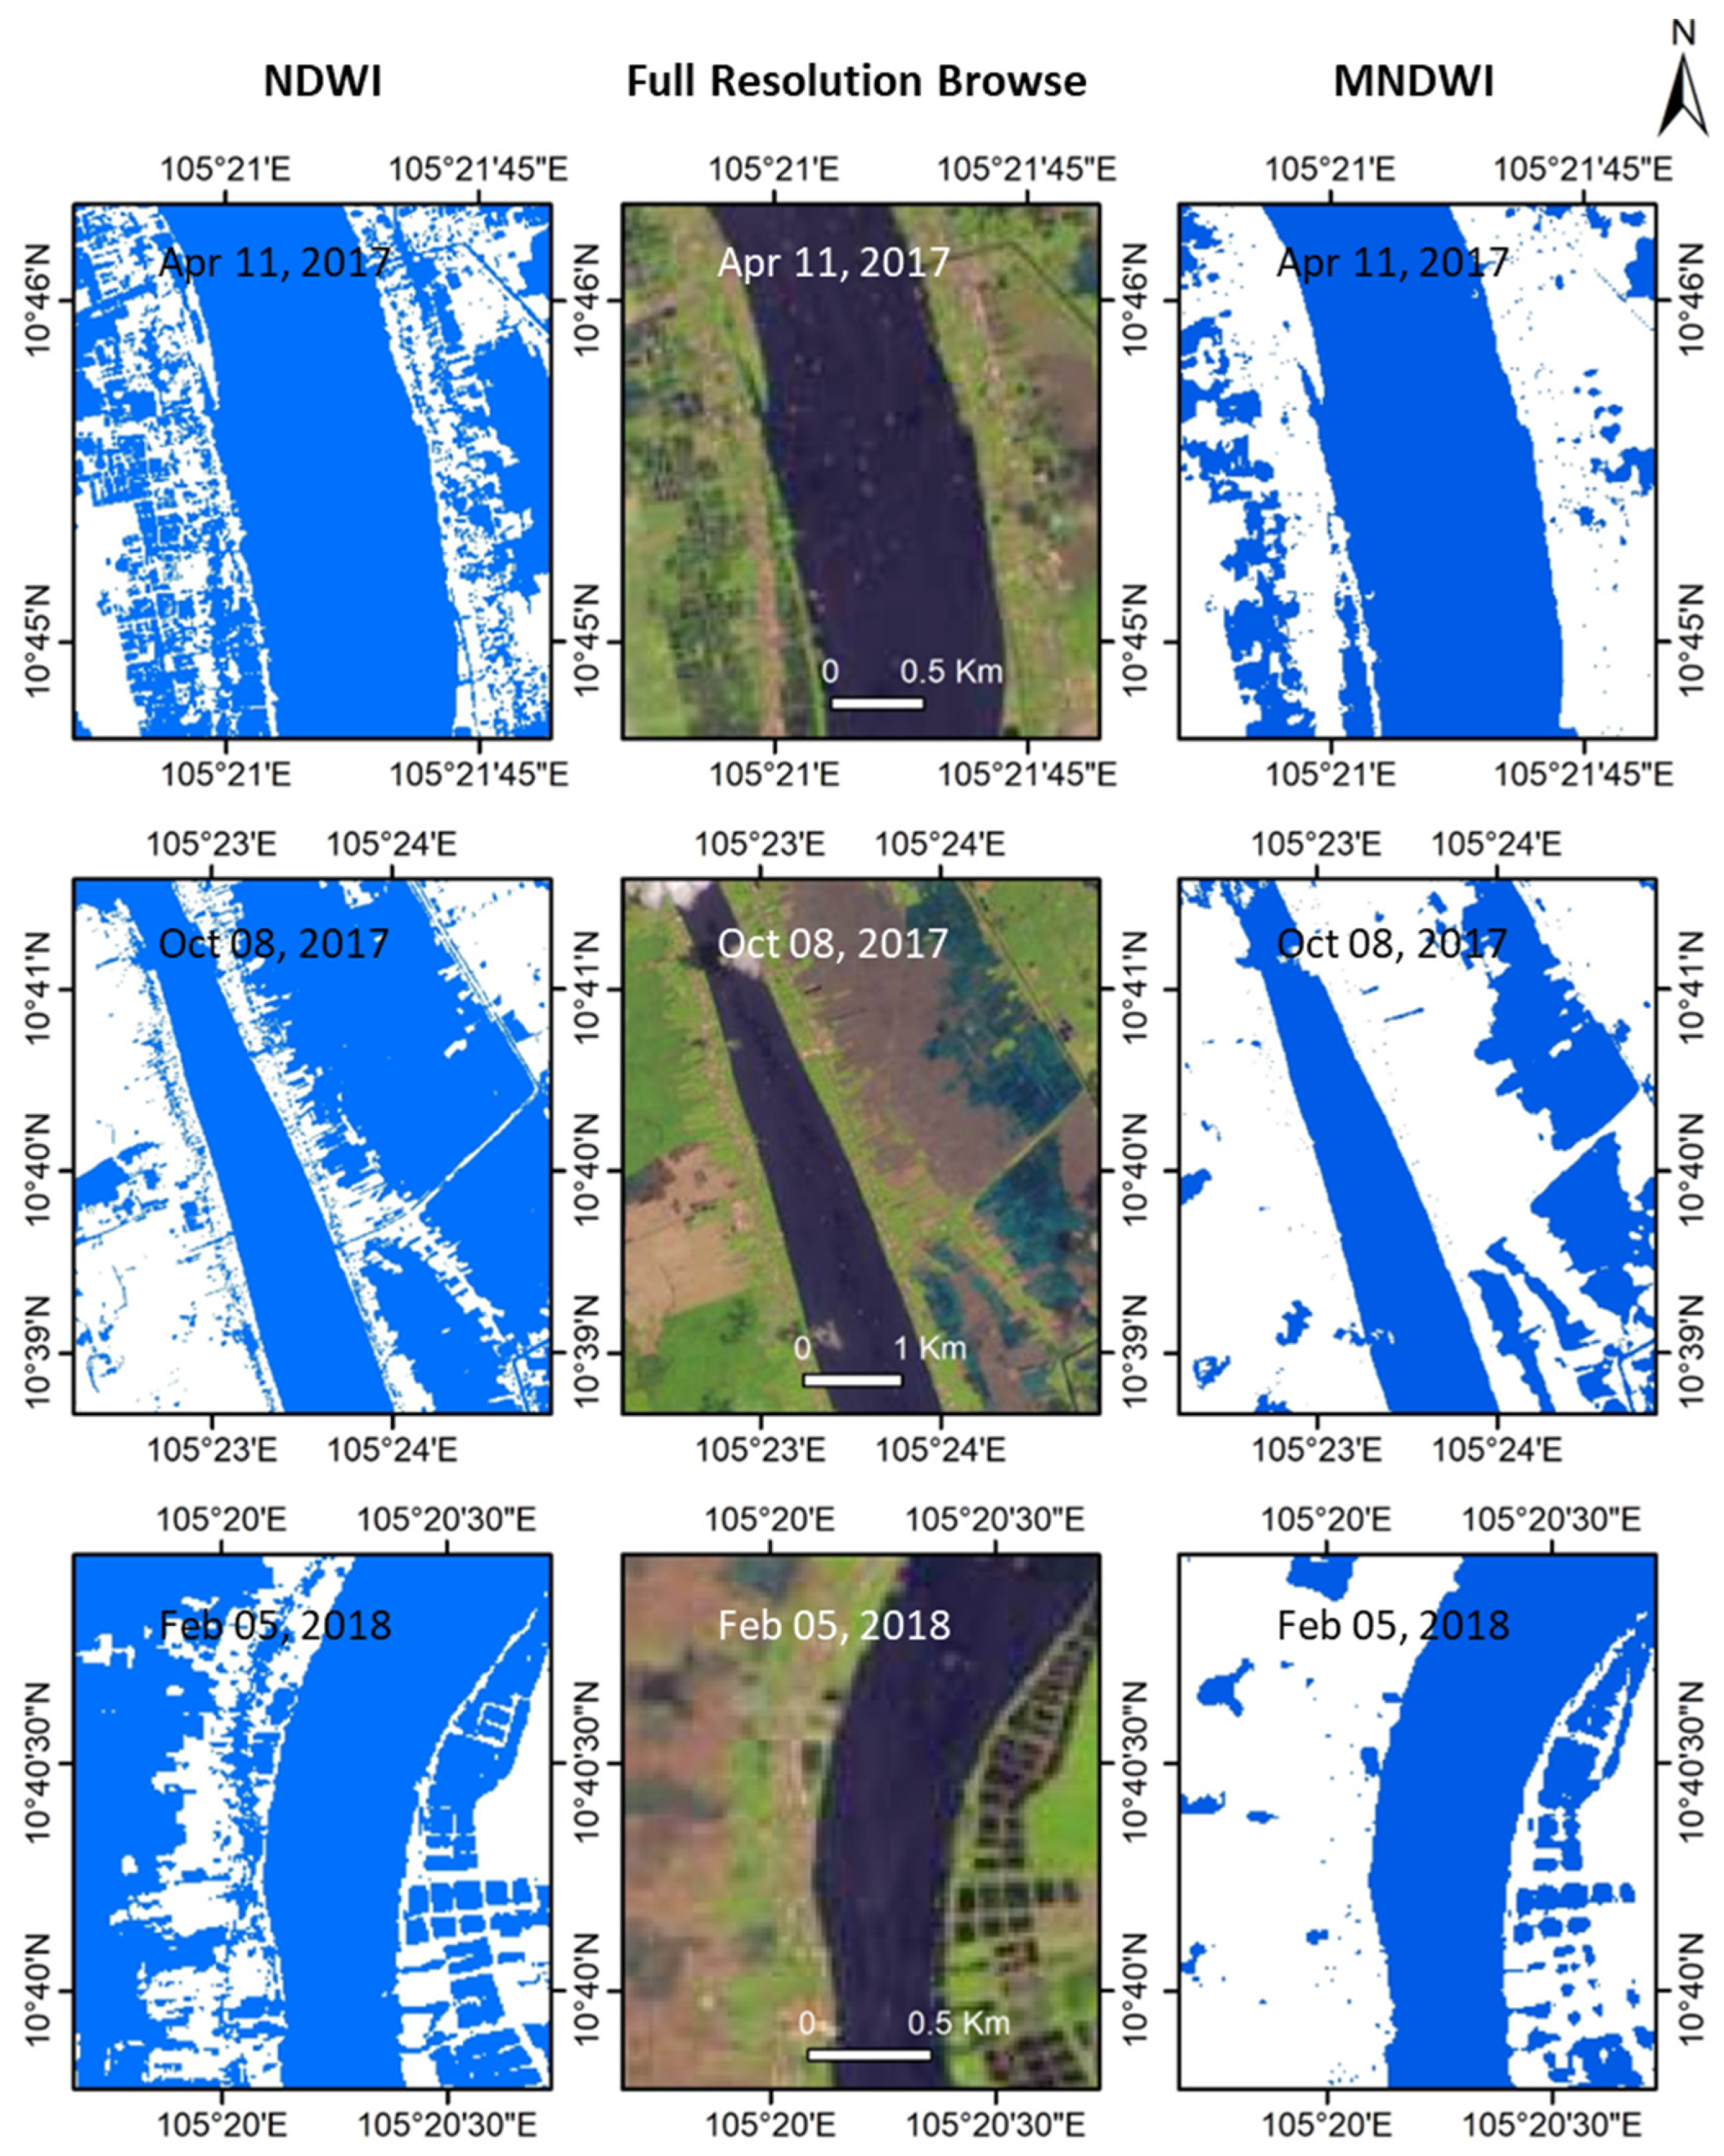
3.2.2. Surface Water Delineations Using the Automatic Otsu Threshold on the Sentinel-2 NDWI and MNDWI

According to McFeeters, the NDWI value of water is usually greater than zero, while soil and vegetation are indicated by zero or negative NDWI values [97]. Moreover, the use of Otsu thresholding was investigated for different water indices (NDWI, MNDWI, weighted NDWI (WNDVI), and water extraction index (AWEI)), which revealed a high overall accuracy of >92% of water detection in Xiangshan Harbour in Zhejiang, China and >83% in Tampa Bay in Florida, USA [100]. Therefore, we used the automatic Otsu method to determine an optimal threshold for detecting water and non-water pixels in the Sentinel-2 NDWI and MNDWI products instead of the threshold zero to (i) obtain a similar condition and consistency with the use of Otsu threshold for the Sentinel-1 SAR imagery, (ii) examine if the Otsu threshold is able to detect water effectively from the histogram of Sentinel-2 NDWI and MNDWI images, and (iii) investigate if the dynamic thresholds occur in the results of using the Otsu threshold for the optical satellite-based indices, such as NDWI and MNDWI. The Sentinel-2 NDWI and MNDWI pixels with a value greater than the estimated Otsu threshold t were classified as water and less than or equal to the estimated Otsu threshold t were classified as non-water.

3.3. Comparison of Surface Water Detections Derived from Sentinel-1 Data and Sentinel-2 Data

One of the most critical challenges in developing the algorithm for mapping the surface water in the VMD is the lack of ground truth data. It is very difficult or unable to collect the ground truth data in the region during the flood period because of the widespread, severe, and persistent inundation during the flooding season. Surface water monitoring using satellite observations in the VMD is in progress. Hence, flood monitoring and prediction highly depend on the data from limited gauge stations in the area and forecast results of hydrological modeling from local institutions and the Mekong River Commission. However, flood forecasts have gradually deviated due to many factors, such as forest degradation, upstream hydroelectric dams, local dike systems, land subsidence, urbanization, sea-level rises, and climate changes [82]. For example, because the 2018 flood event came earlier than expected, more than 2000 hectares of rice areas in the harvest season were damaged, among which over 1200 hectares were in An Giang province (https://reliefweb.int/report/viet-nam/floods-damage-2000ha-rice-mekong-delta, accessed on 1 January 2020). As a result, we used the visual comparison with the Sentinel-2 FRB images and the quantitative comparison with the Sentinel-2 surface water maps to quantify the derived Sentinel-1 surface water maps. The Sentinel-2 FBR is a composite of 3 bands (SWIR, NIR, and Red), which is compressed and stretched (gamma = 2.0) to create an optimized high-resolution image for visual interpretation, especially emphasizing the vegetation and water without clipping the extreme values (https://www.usgs.gov/landsat-missions/landsat-full-resolution-browse-images, accessed on 1 January 2020). Thus, the Sentinel-2 FRB data was selected to visually compare with surface water maps derived from the Sentinel-1 data and Sentinel-2 data.
Two water indices (NDWI and MNDWI) are mature and tested in many previous studies for waterbodies mapping [98,101,102,103]. However, the impacts of the mixture of built-up, soil, and vegetation areas cause relatively low performance in the classification results using the NDWI, which is improved significantly from the use of the MNDWI [65,98,104]. Particularly, An Giang province is crossed by two main Mekong River branches (Tien and Hau rivers) and a dense system of rivers and canals, so the waterway is the most popular transportation and the locals habitually build houses along the rivers. The mixture of soil, vegetation, and water is also prevalent in An Giang because it is the major province for cultivated rice production in Vietnam [105]. The government developed a full-dike system in An Giang province for water management and to increase the productivity of agricultural activities in this region [106]. Therefore, a necessary comparison of surface water maps derived from Sentinel-2 NDWI and MNDWI products is needed to understand the impact of built-up and mixed pixels, especially for riverbank areas and paddy fields. This test used Sentinel-2 FRB images with highlights of vegetation (e.g., rice) and water to evaluate two surface water maps (NDWI and MNDWI) by visually comparing water boundaries on several cloud-free subsets, and then finalizing which water index is better for surface water detection in An Giang province. The Sentinel-2 FRB images were further used to visually compare with surface water maps derived from the SAR Sentinel-1 VH images.
On the other hand, a statistical comparison was conducted to examine the correlation of surface water maps derived from the SAR Sentinel-1 VH data and optical Sentinel-2 MSI data. Because of the high dynamics of the river water level during the time in this study area, the comparison requires several pairs of Sentinel-1 and Sentinel-2 images acquired under similar conditions over the period. In other words, we selected the Sentinel-2 images with less than 1-day difference in acquisition date compared to Sentinel-1 images and less than 50% of cloud cover to mitigate the impacts of surface water changes. As a result, 10 pairs of Sentinel-1 and Sentinel-2 images (Sentinel-2 images in Table 2 and their corresponding Sentinel-1 images in Table 1) were selected for this comparison. We used the 10 m resampled SCL band and Sentinel-2 FRB images to select a set of cloud-free subsets in river and paddy field areas from each pair of Sentinel-1 and Sentinel-2 images for calculating the water percentage correlation coefficient R2 and root mean square error (RMSE).

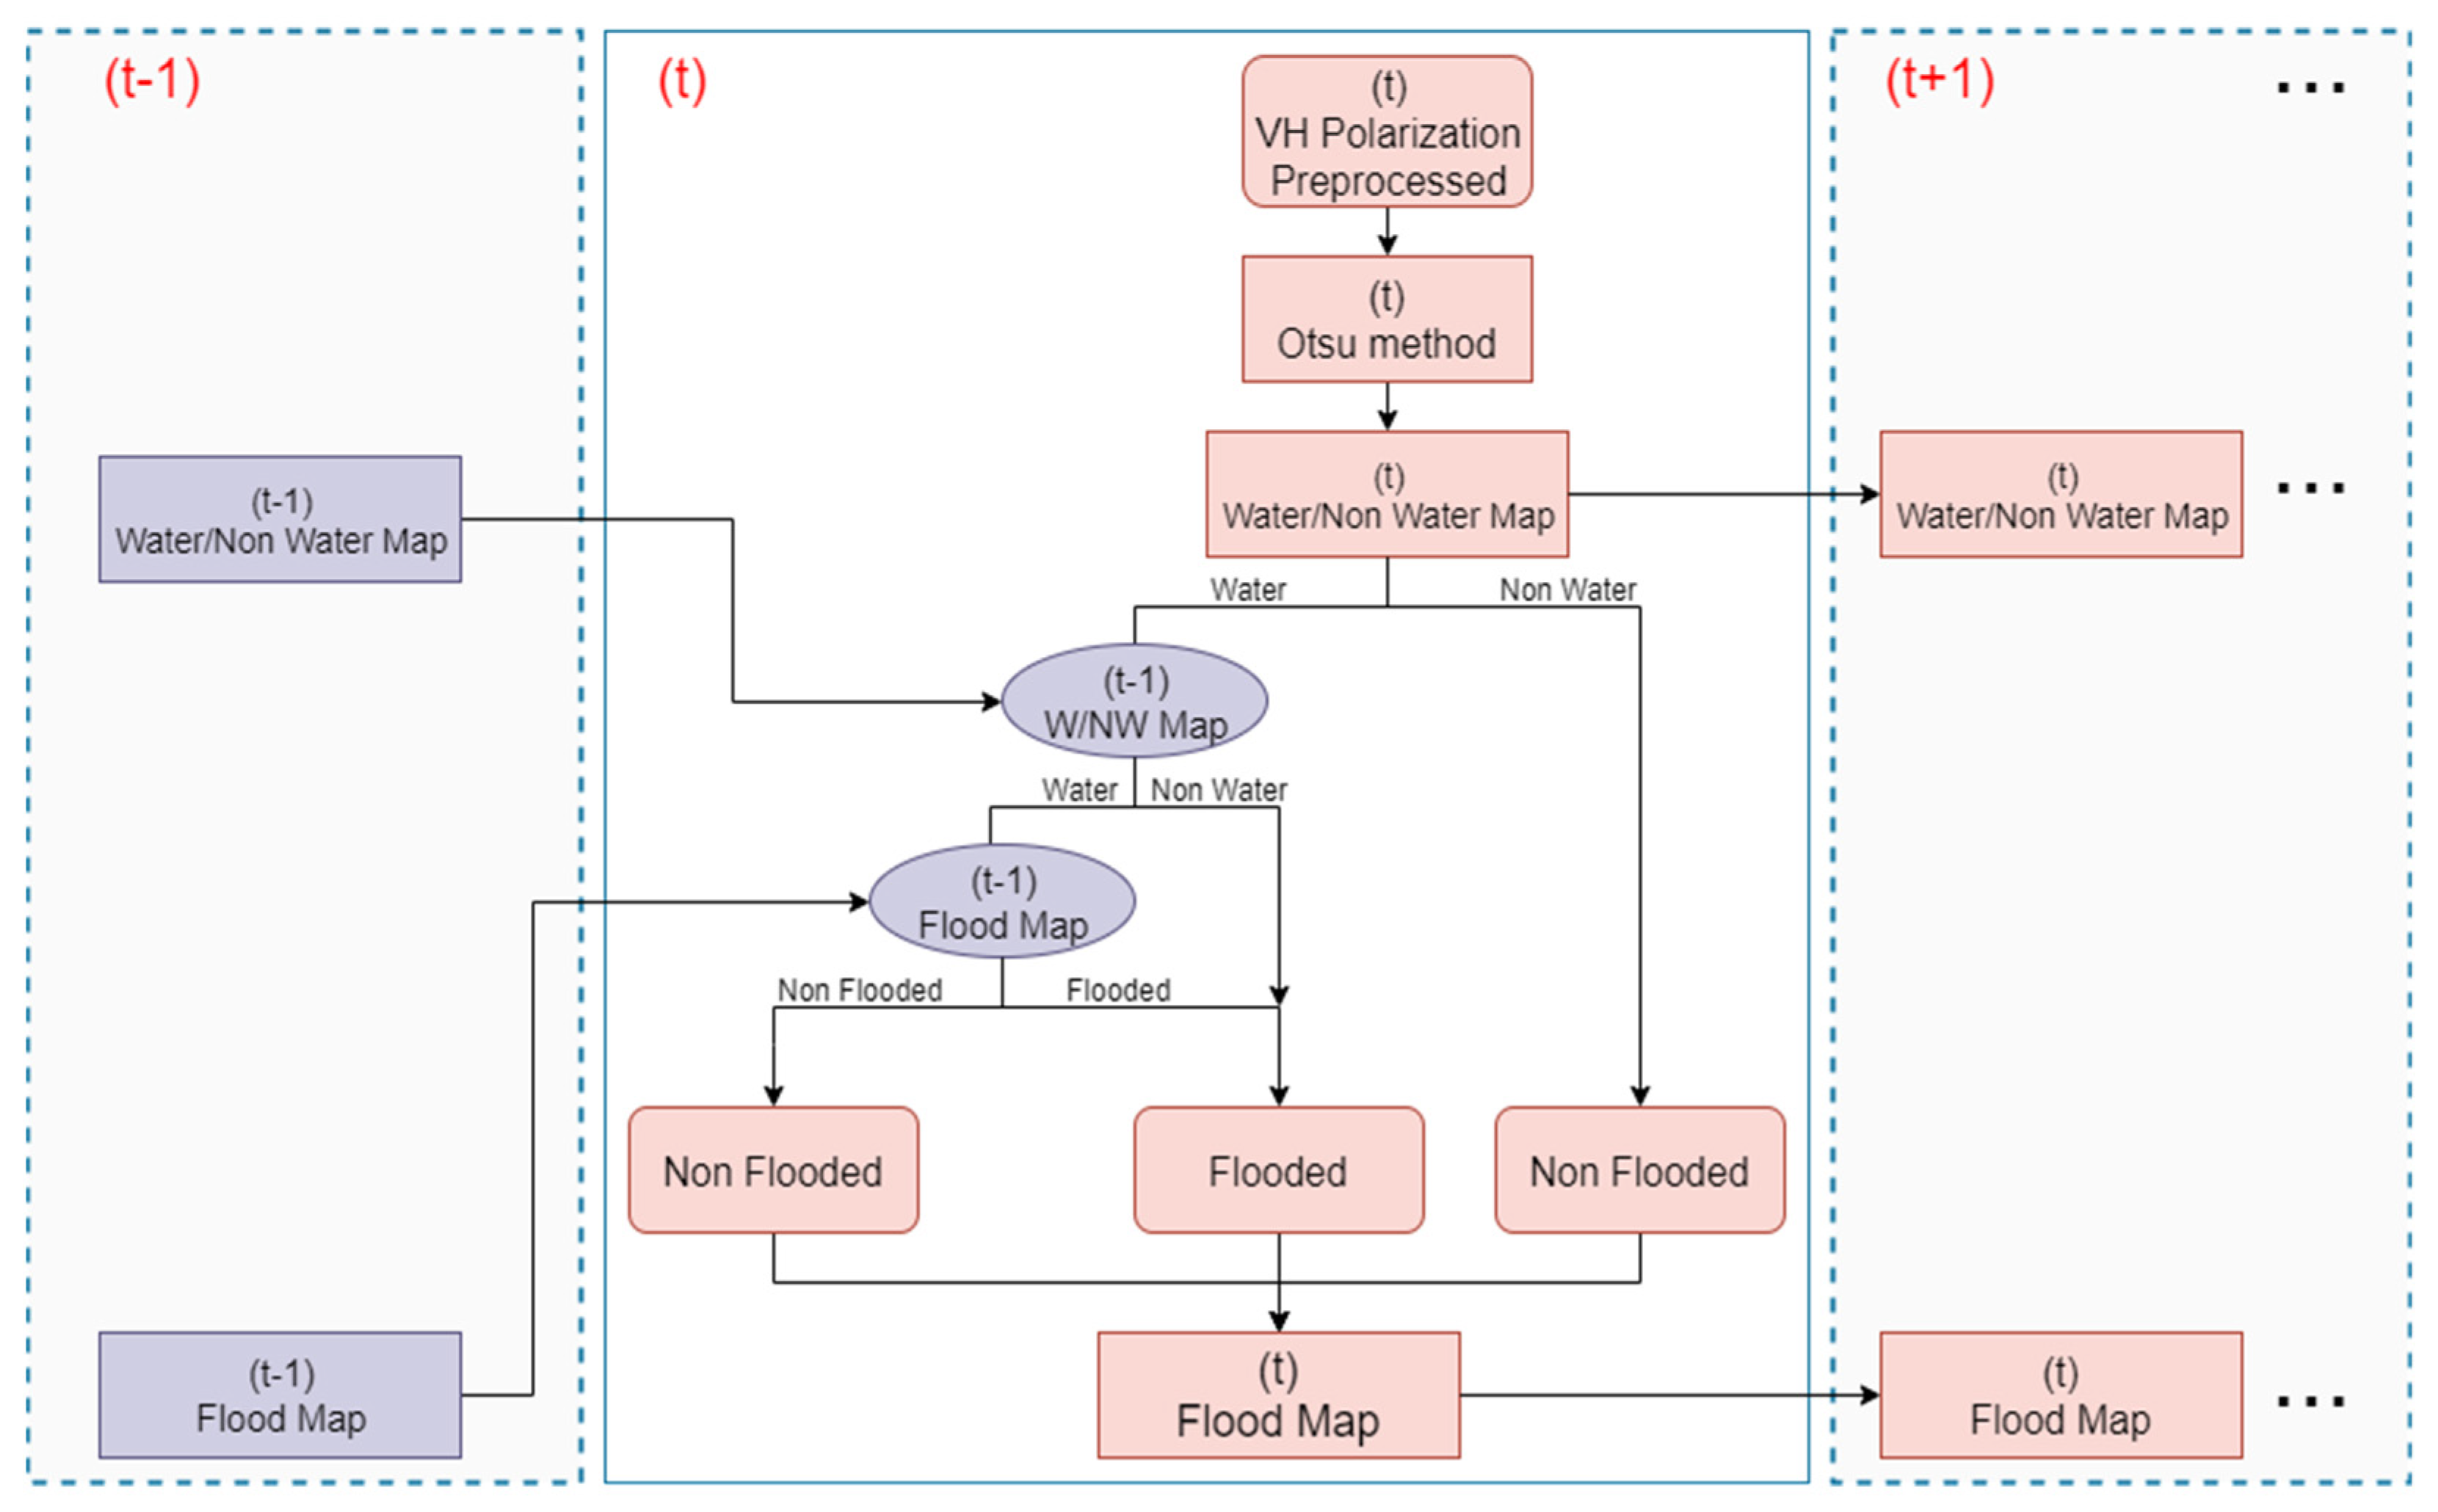
3.4. Flood Mapping Algorithm Using SAR Sentinel-1 Time Series Data

Figure 7 illustrates a processing chain of the flood mapping algorithm using the change-detection-based time series analyses on the Sentinel-1 SAR images.
At the considering time t , the dynamic Otsu threshold was applied to the pre-processed Sentinel-1 VH image to generate a water/non-water map, in which water is defined with a backscatter value less than the automatic Otsu threshold. After that, two conditions are examined to create a flood map at the time t :
Firstly, all non-water pixels in the derived water/non-water map at the time t   are classified into non-flooded pixels in the flood map at the time t .
Secondly, every single water pixel in the derived water/non-water map at the time t is respectively referred to a water/non-water map at the previous time t 1 , which is generated similarly using the Otsu threshold. Specifically,
(i)
if the state of that respective pixel in the water/non-water map at time t 1   is non-water, it is classified as a flooded pixel in the flood map at the time t .
(ii)
in contrast, if the state of that respective pixel in the water/non-water at time t 1 is water, that pixel is respectively referred to a flood map at the time t 1 with two conditions:
(a)
if the state of that respective pixel in the flood map at time t 1 is flooded, it is classified as a flooded pixel in the flood map at the time t .
(b)
otherwise, it will be classified as non-flooded in the flood map at the time t .
Finally, all pixels are classified into flooded and non-flooded, and the flood map at the time t is generated. The current maps at time t , including water/non-water and flooded/non-flooded maps, are continuously used as the references for the succeeding process at time t + 1 .
It should be noted that the algorithm needs an initial flood map for generating the next images; thus, we assumed that the initial flood map on March 12, 2017 (the driest month in the VMD [77]) is all non-flooded to activate the flood monitoring algorithm. However, An Giang province is a very complex area in terms of water dynamics and vegetation existence, such as rice cultivation [106], hydrological variations [18], a full-dike system for water management [86], and differences in agricultural calendar practices. The assumption that all pixels in the initial flood map on 12 March 2017 are non-flooded could make the model work, but the water pixels in the initial surface water map could potentially be flooded. Therefore, we adjusted the model by identifying the time that all the dynamic water pixels in the initial water/non-water map on 12 March 2017 changed to non-water. The dynamic water pixel is identified as a water pixel that changes over a period and is not a static water pixel in the lakes or rivers. This adjustment enables the accurate starting time ( t s t a r t ) for the flood monitoring algorithm.

4. Results

4.1. Water Delineation Using Sentinel-1 Time Series Data

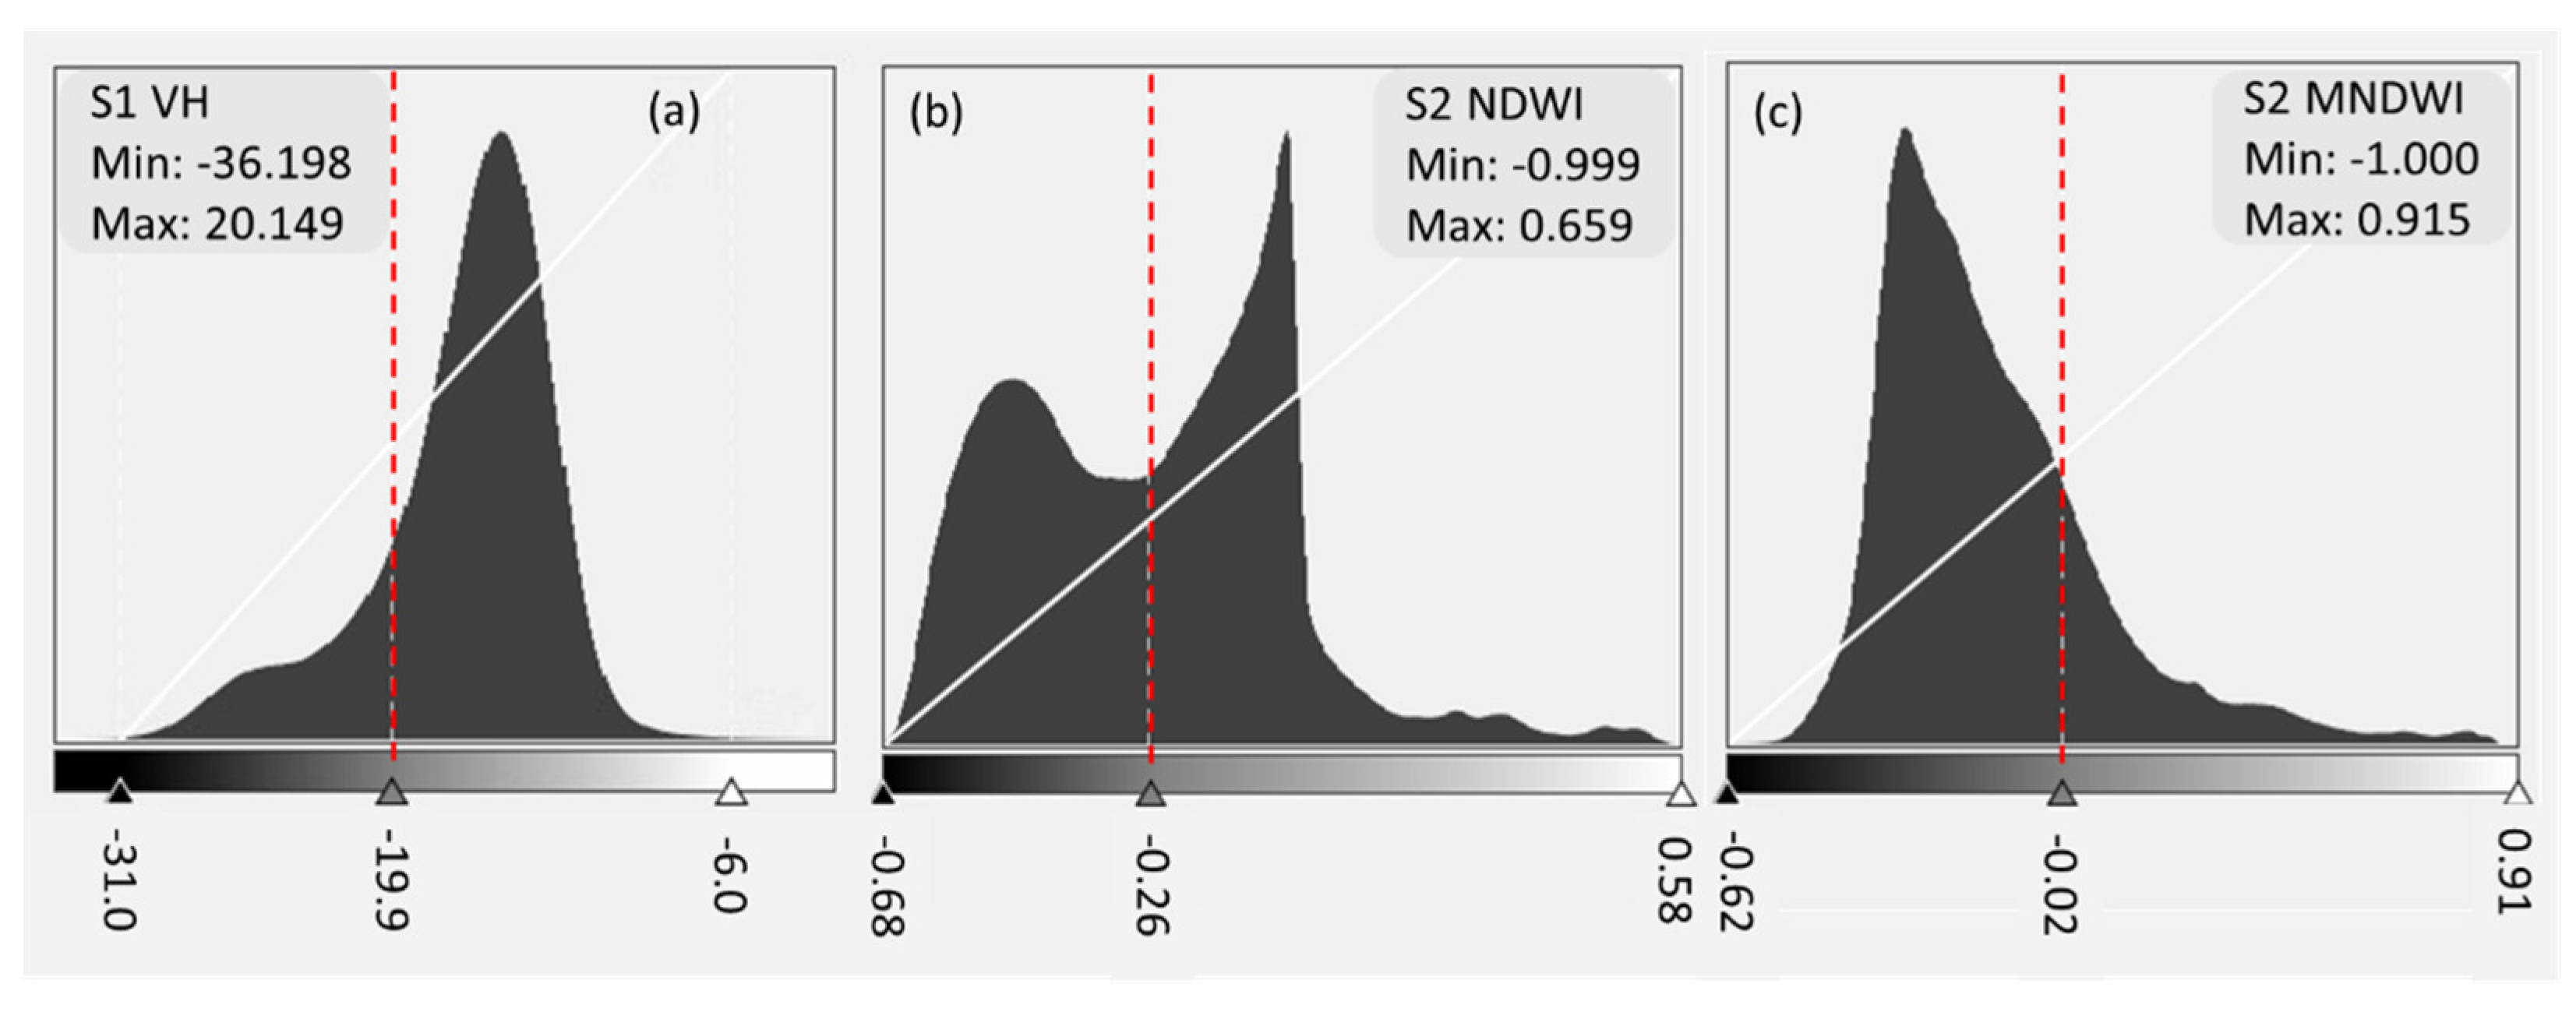
4.1.1. Dynamic Otsu Thresholds for Mapping Surface Water

Figure 8 shows dynamic thresholds that were determined using the automatic Otsu thresholding algorithm on the time series of Sentinel-1 SAR images from March 2017 to March 2018 in An Giang province. There were constantly different thresholds for each scene, which was lower in the flood event (August to November) and higher in other seasons. The difference was predictable mainly because flood water during flood events is usually deeper and more obvious than in other seasons. Therefore, it creates lower backscatter intensity obtained by Sentinel-1 satellites. For example, the average threshold in the flood period was −22 dB and higher in the rice seasons. The higher thresholds during the rice seasons could detect water at <5 cm on the paddy fields during the sowing period when the mixture of soil and water is a common condition for preparing planting beds for a new rice season (Section 3.1.1). The thresholds during the summer-autumn rice season were slightly higher than during the winter-spring rice season. The largest difference was 4 dB between the rice harvest and flood periods. Accordingly, the resultant dynamic Otsu thresholds could indicate a potential issue of using a fixed or empirical threshold for the entire period.

4.1.2. Surface Water Maps Derived from the Sentinel-1 Data and Dynamic Otsu Threshold

A total of 64 surface water maps were generated using the dynamic Otsu thresholding algorithm on the Sentinel-1 images from March 2017 to March 2018. Figure 9 indicates the flood event in 2017 came at the beginning of August, starting from the northern, central, and southern regions, where most of the areas are paddy fields with low elevation. The flood rapidly spread throughout An Giang province in September and then gradually decreased and started to disappear from paddy fields in the southern areas at the beginning of October. Moreover, the flood did not affect the northwestern region because of the terrain features of hills and mountains.

4.2. Comparison of Surface Water Detections Derived from Sentinel-1 Data and Sentinel-2 Data

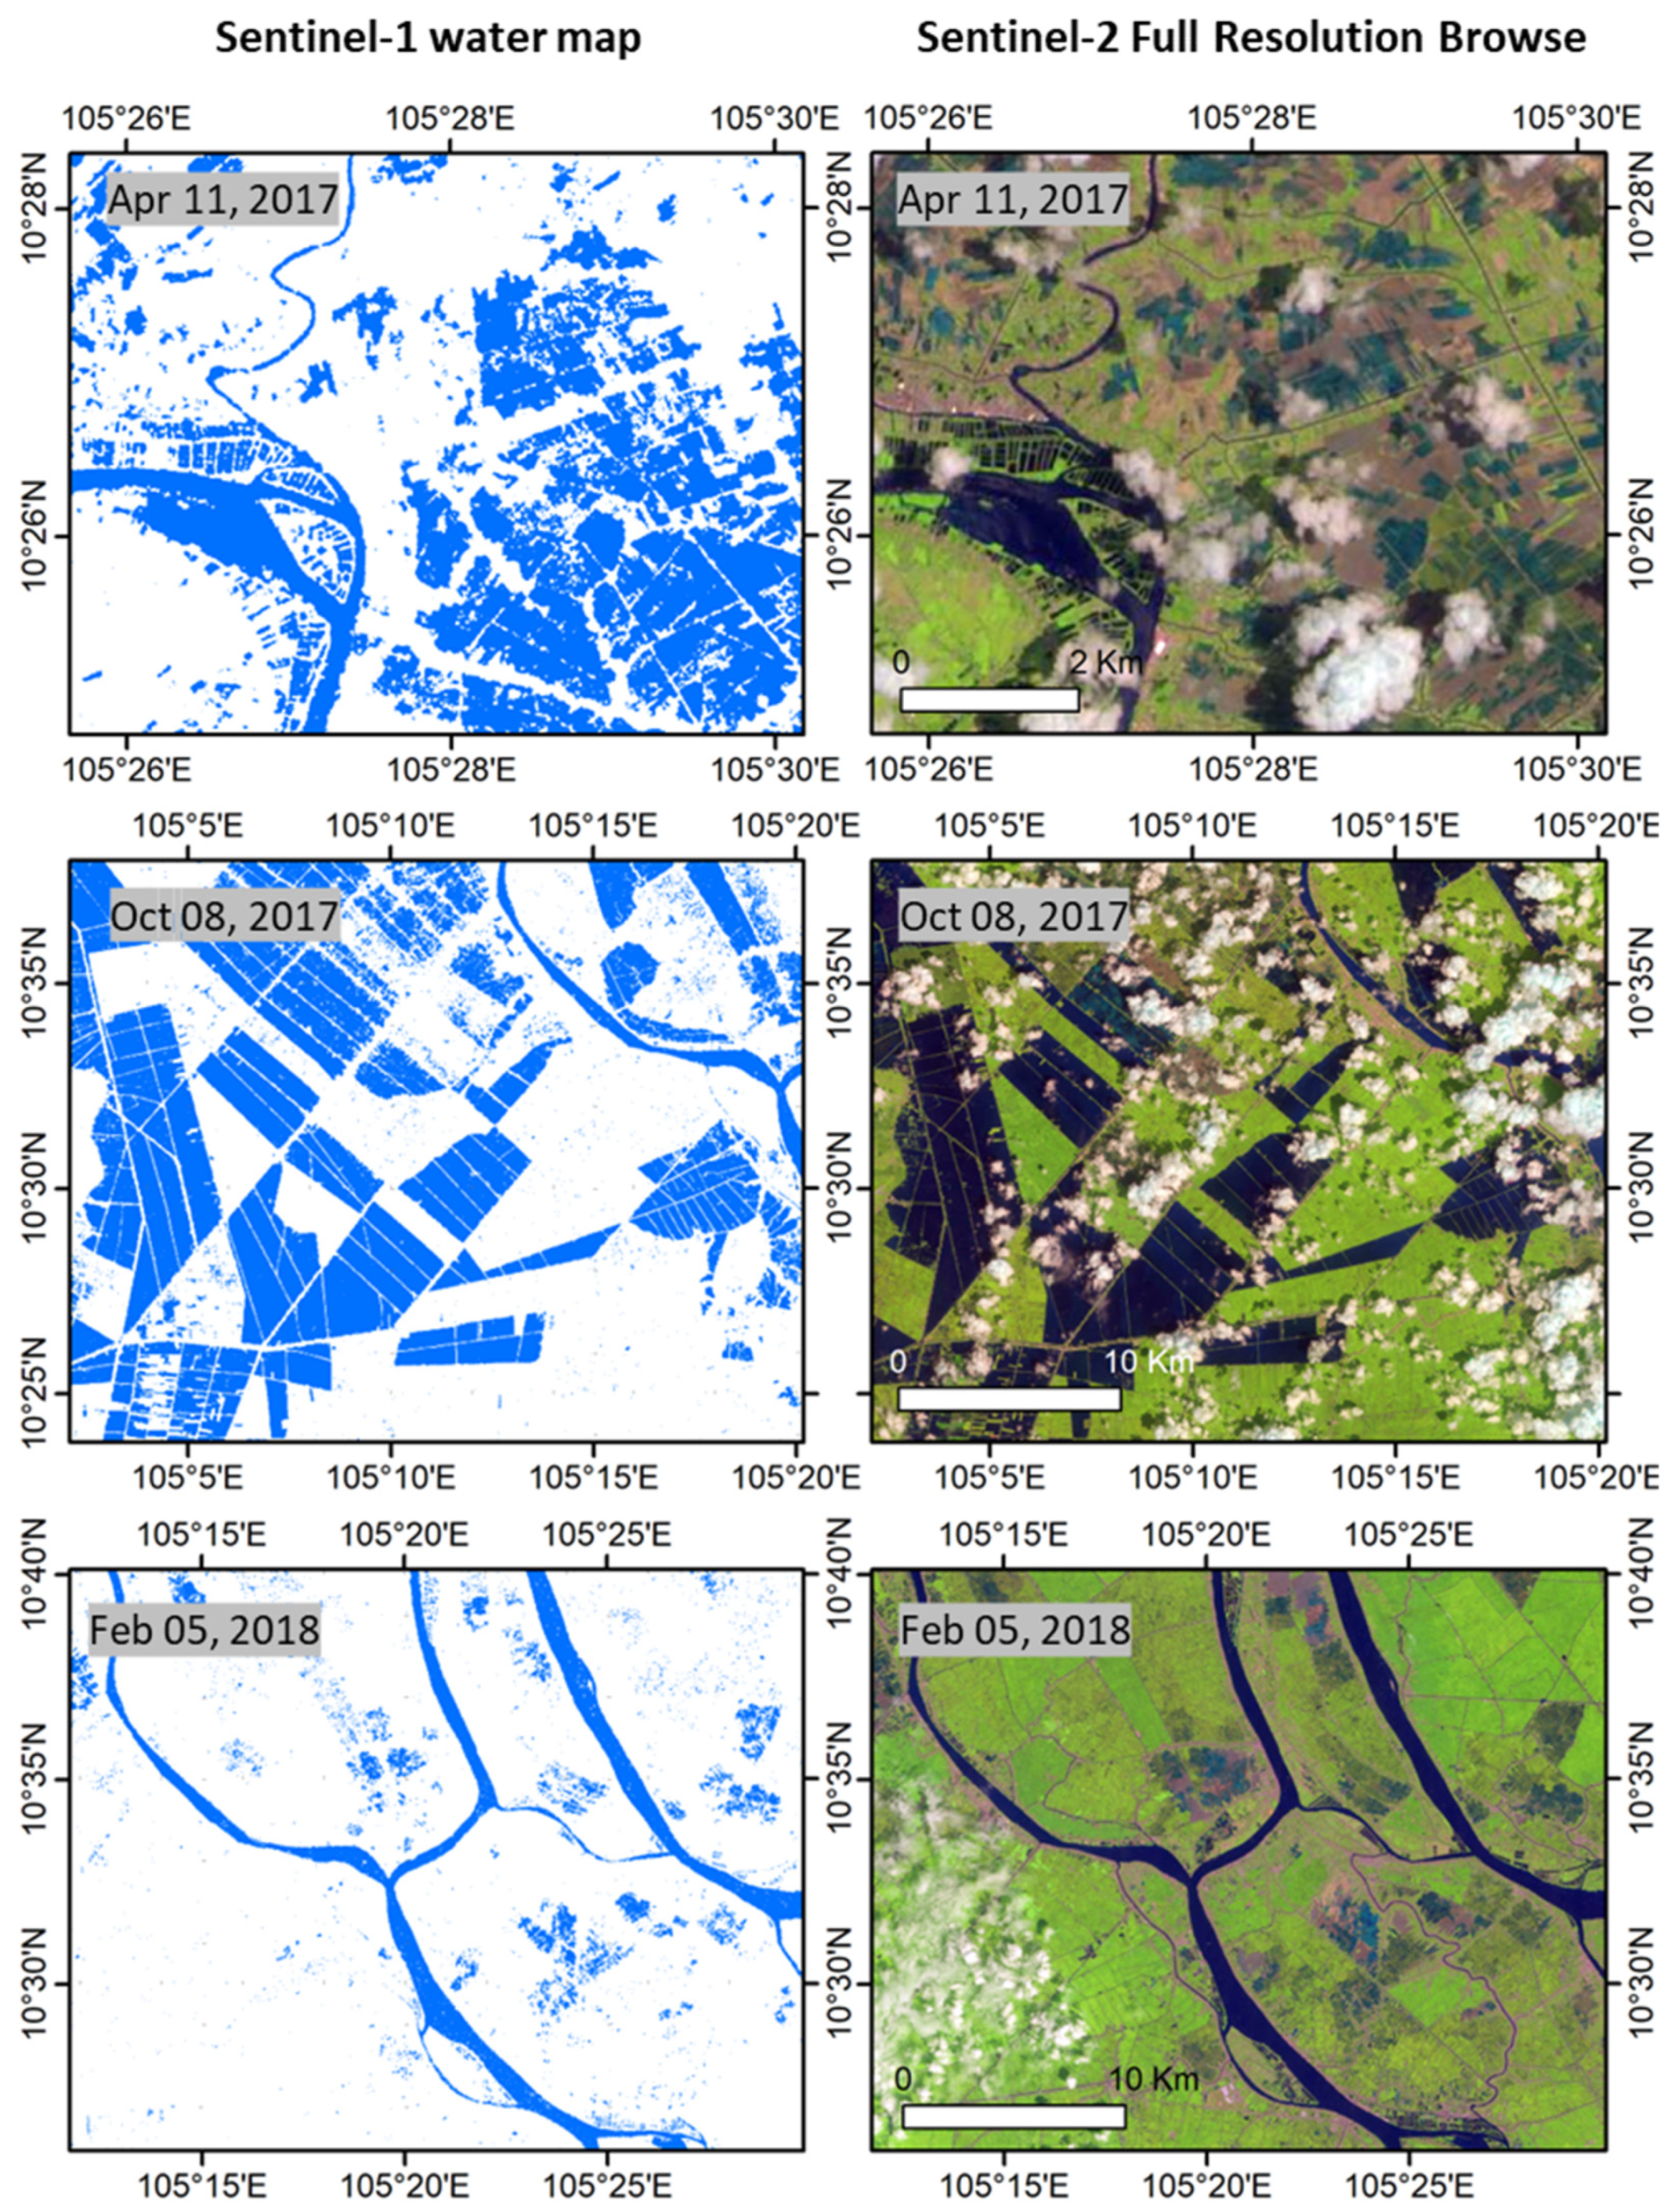
4.2.1. Visual Comparison of Surface Water Delineations Derived from Sentinel-1 VH Image and Sentinel-2 Full Resolution Browse Image

Figure 10 shows a strong visual correspondence between the surface water maps derived from using the dynamic Otsu thresholding algorithm on the Sentinel-1 SAR image time series and the Sentinel-2 FRB images during three main periods, including the rice sowing period (11 April 2017), the flood event (8 October 2017), and the rice maturation stage (5 February 2018).
The water surface map obtained from the Sentinel-1 image on 11 April 2017 effectively detected deep water in the river areas and rice fields areas, which can be seen obviously by the dark blue and light blue colors on the Sentinel-2 FRB image. The result could be sensitive to the rice field areas with brown color on the Sentinel-2 FRB image. It is because the Sentinel-1 image was acquired in April (the sowing period for the summer-autumn rice season [107]), when the mixture of soil and water is a common condition for preparing a planting bed for the new rice season and the water level is controlled ~5 cm (Section 3.1.1). That is why the brown color appears in the optical Sentinel-2 image instead of the blue color. The second surface water map derived from the Sentinel-1 image on 8 October 2017 (during the annual flood event), captured surface water very well in both river and paddy field areas because a higher water level is expected in this period (dark blue color in both paddy fields and river areas on the corresponding Sentinel-2 FRB image). The third surface water map derived from the Sentinel-1 image acquired on 5 February 2018 (maturation stage of rice growth), efficiently delineated surface water in the river and rice field areas, which is quite similar to the surface water map obtained on 11 April 2017. However, more noises could be found in some of the paddy field areas (green or light yellow colors on the corresponding Sentinel-2 FRB image), possibly because of the drop in backscatter intensity during the maturation stage of rice growth (Figure 4).

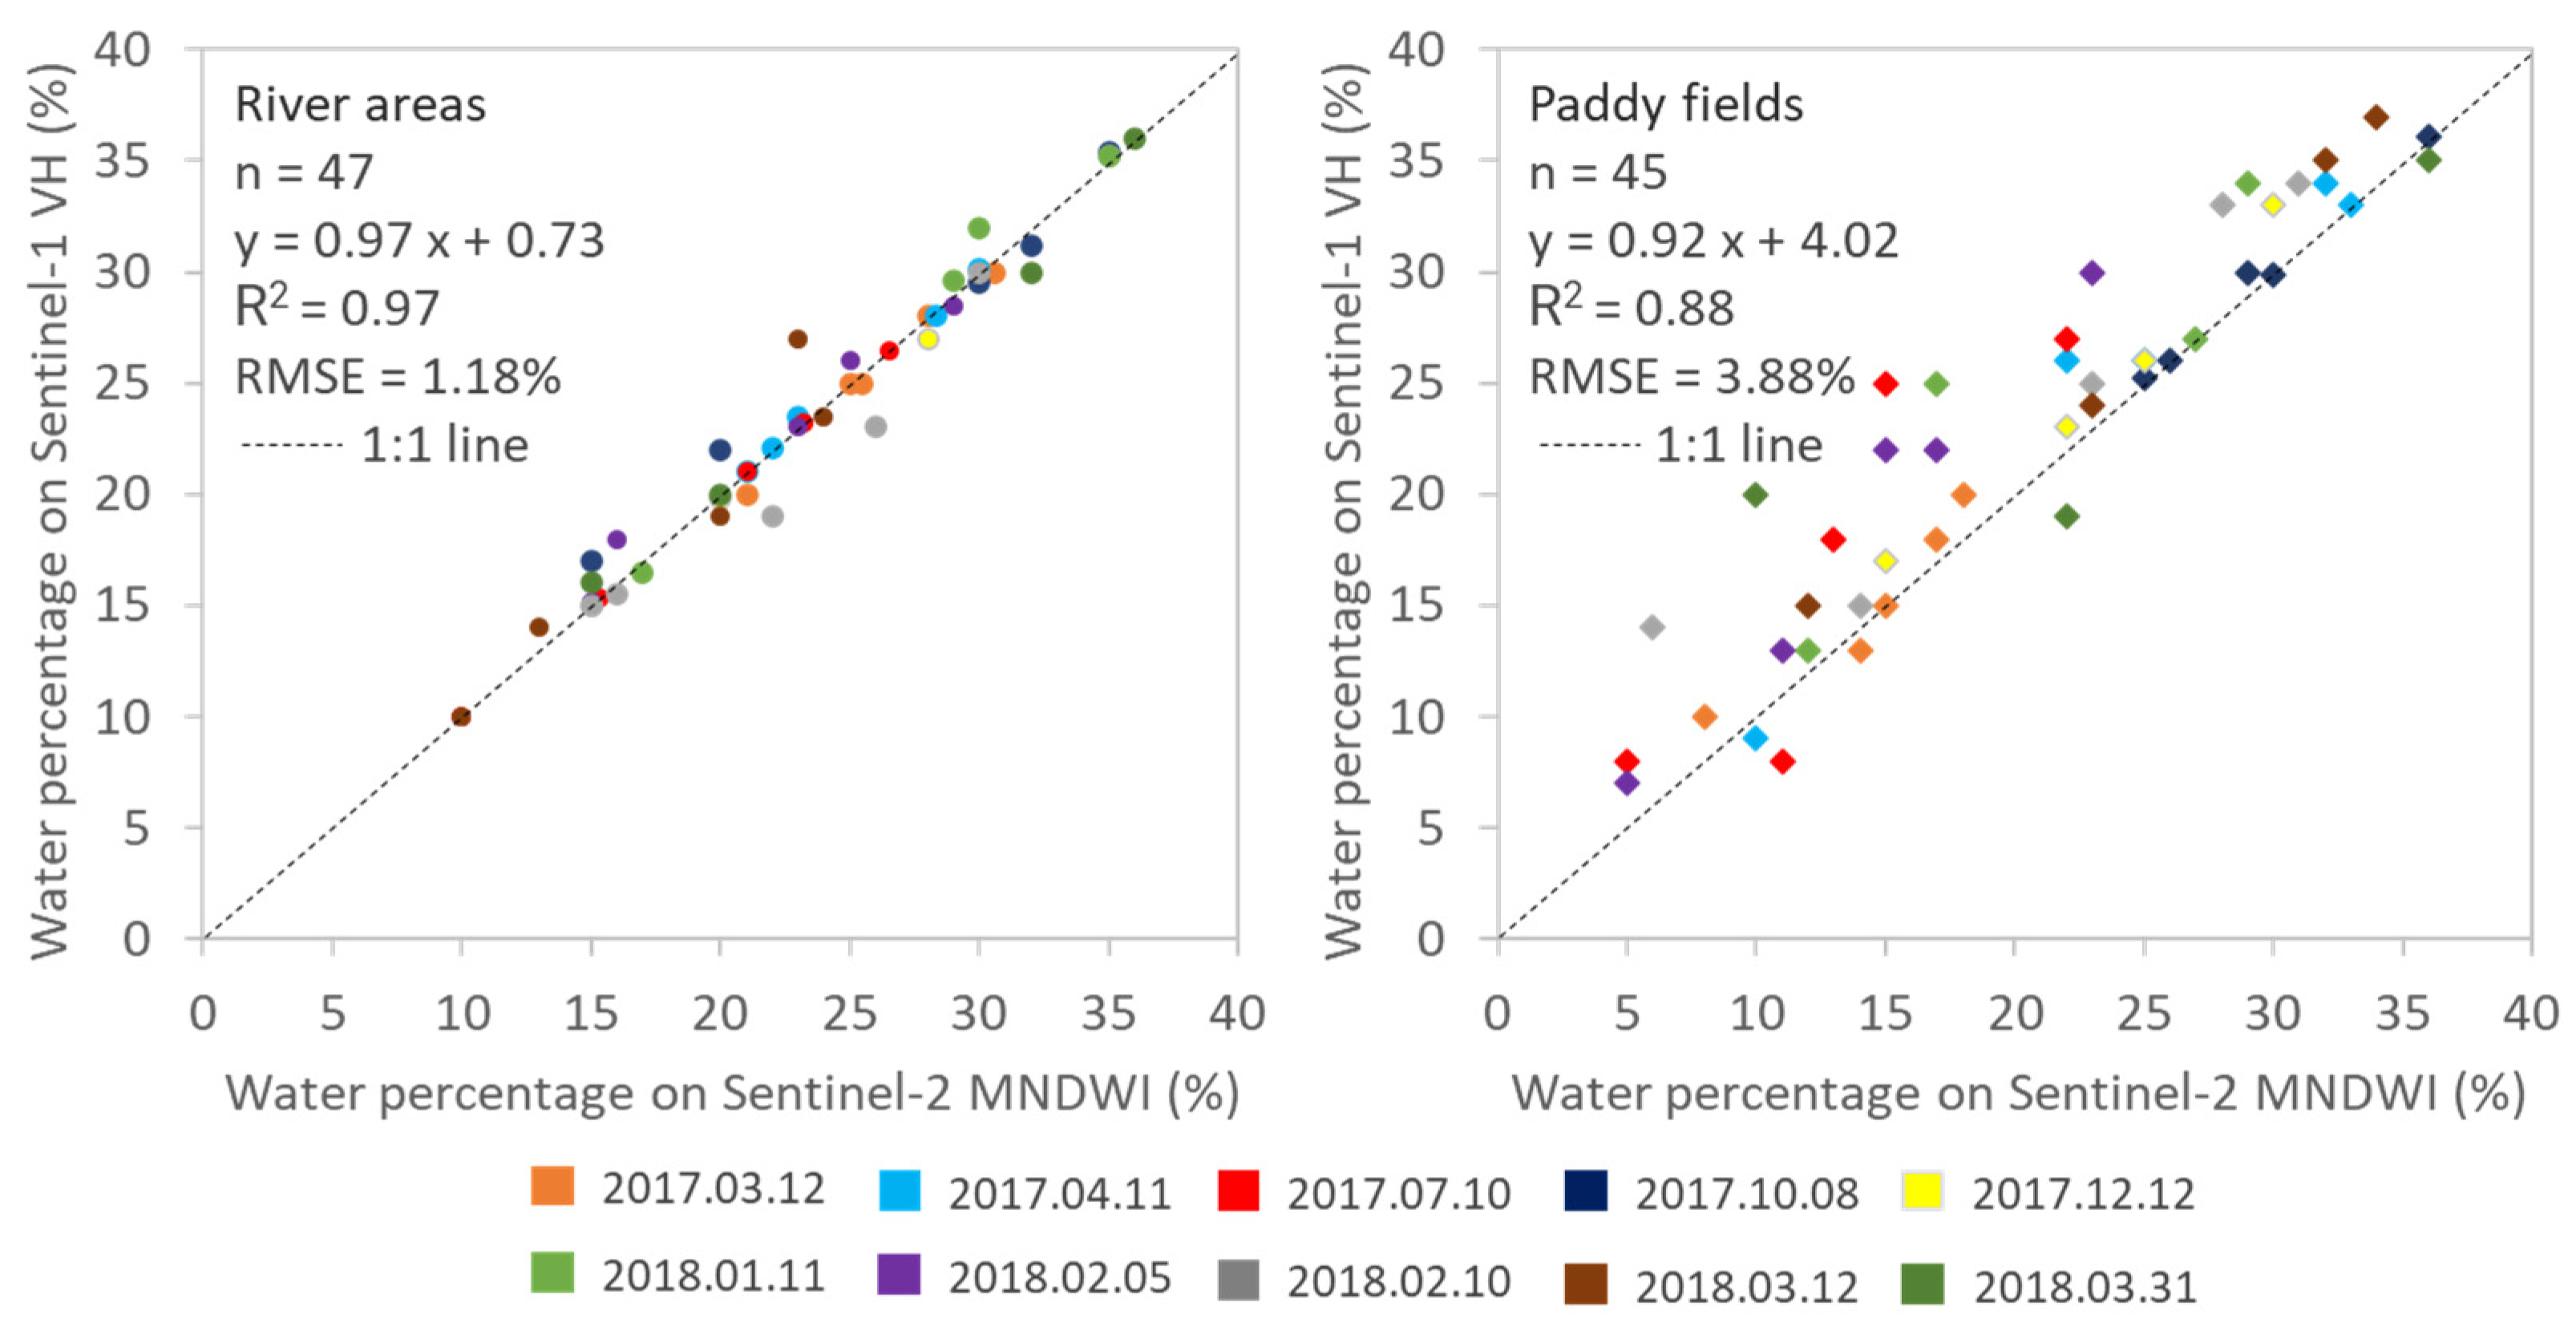
4.2.2. Statistical Comparison of Surface Water Delineations Derived from Sentinel-1 VH Image and Sentinel-2 Water Index Image

Figure 11 displays an example of histograms with the optimal Otsu thresholds determined for the Sentinel-1 VH image and Sentinel-2 NDWI and MNDWI images acquired on 11 April 2017. Figure 11a shows the backscatter intensity of the Sentinel-1 VH image was in a range of −36 to 20 dB, with the identified Otsu threshold was −19.9 dB. Moreover, the dynamic behavior did not occur in the use of automatic Otsu thresholding for separating water and non-water pixels in the optical Sentinel-2 NDWI and MNDWI images. All optimal Otsu thresholds derived for the Sentinel-2 MNDWI images were stably very close to zero. Figure 11b,c illustrate histograms of the NDWI and MNDWI derived from the Sentinel-2 image acquired on 11 April 2017. The NDWI value ranged between −1 and 0.66 with an Otsu threshold of −0.26, while the range of MNDWI value was between −1 and 0.92 with an Otsu threshold of −0.02. Note that the threshold zero has been commonly used in previous studies for indicating surface water [97,100].
Figure 12 shows a comparison of water delineation using the automatic Otsu threshold on the Sentinel-2 NDWI and MNDWI images during three similar periods in Figure 10, but in smaller subsets to carefully examine the effectiveness of the two indices for delineating surface water in An Giang province. Generally, the use of the Otsu threshold on the NDWI image was unstable for water delineation since it overestimates surface water in the paddy field areas in all three periods. In contrast, applying the Otsu threshold on the MNDWI image effectively captured surface water in both river and paddy field areas. Accordingly, the surface water map derived from the MNDWI and Otsu threshold was selected as the reference for the surface water maps derived from the Sentinel-1 SAR data.
Figure 13 shows the statistical comparison of water detections using the automatic Otsu thresholding algorithm on the SAR Sentinel-1 VH images and Sentinel-2 MNDWI images. A total of 47 and 45 cloud-free subsets in river areas and paddy fields ranging from 0.5 to 12 km2 were selected from the 10 pairs of Sentinel-1 and Sentinel-2 images, respectively. In the river areas, the water percentage in all subsets derived from Sentinel-1 VH images was strongly correlated to the water percentage derived from the Sentinel-2 MNDWI images. All samples distributed along the 1:1 line, slope ~1.0, R2 = 0.97, and RMSE = 1.18%. In paddy fields, although a strong correlation was found (R2 = 0.88 and RMSE = 3.88%), the water proportion derived from the Sentinel-1 VH images was generally larger than deriving from the Sentinel-2 MNDWI images. The higher water proportion is perhaps due to the capability of Sentinel-1 to detect water in the sowing period with a level <5 cm (Section 4.1.1). The statistical comparison with the Sentinel-2 MNDWI images indicated that using the dynamic Otsu thresholding algorithm on the Sentinel-1 SAR image time series effectively captures surface water in An Giang province.

4.3. Flood Mapping Algorithm

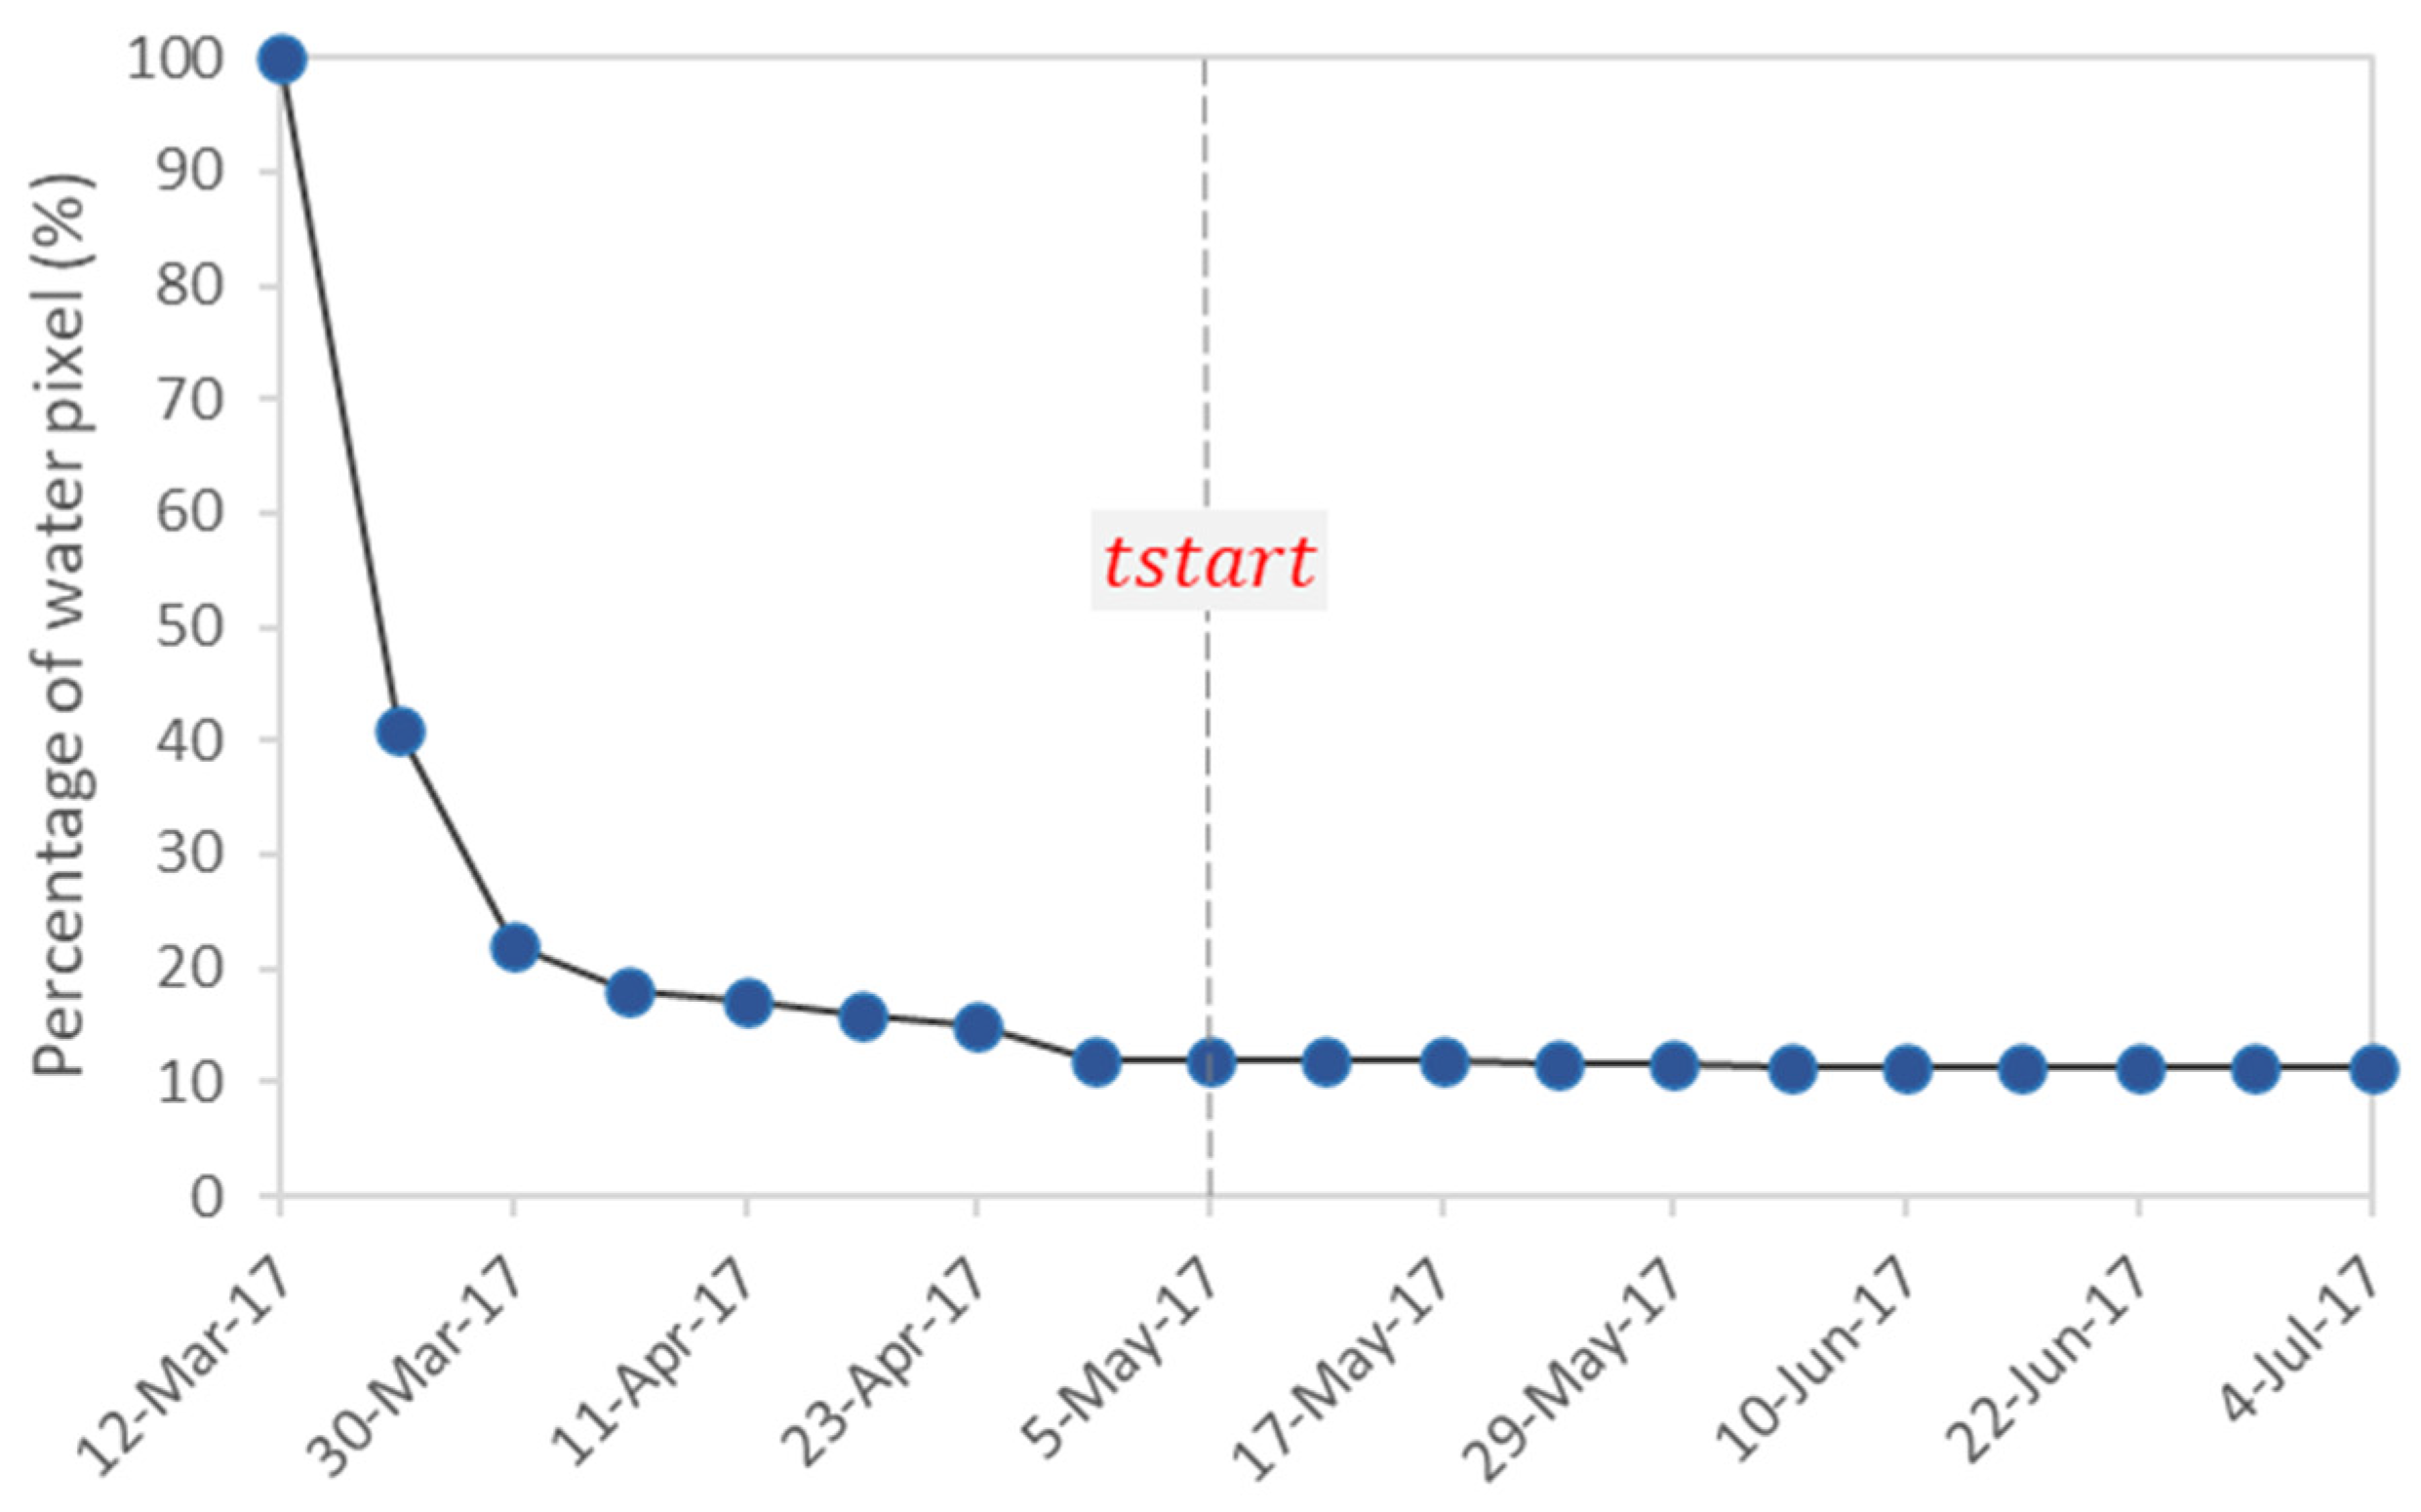
4.3.1. Adjustment for Finalizing Actual Starting Time for Flood Monitoring Algorithm

Figure 14 shows the proportion of the water pixels in the initial surface water map (12 March 2017), which exponentially decreased over time. Specifically, 59% of water pixels in the initial image have changed to non-water after two weeks (or 41% of water pixels remaining on 24 March 2017). The proportion of water pixels continued decreasing to ~12% on 5 May 2017 and became relatively stable afterward. The remaining ~12% in the water pixel proportion are considered as permanent water (e.g., water in the lakes and rivers). Consequently, the actual starting time ( t s t a r t ) for the flood monitoring algorithm was set on 5 May 2017.

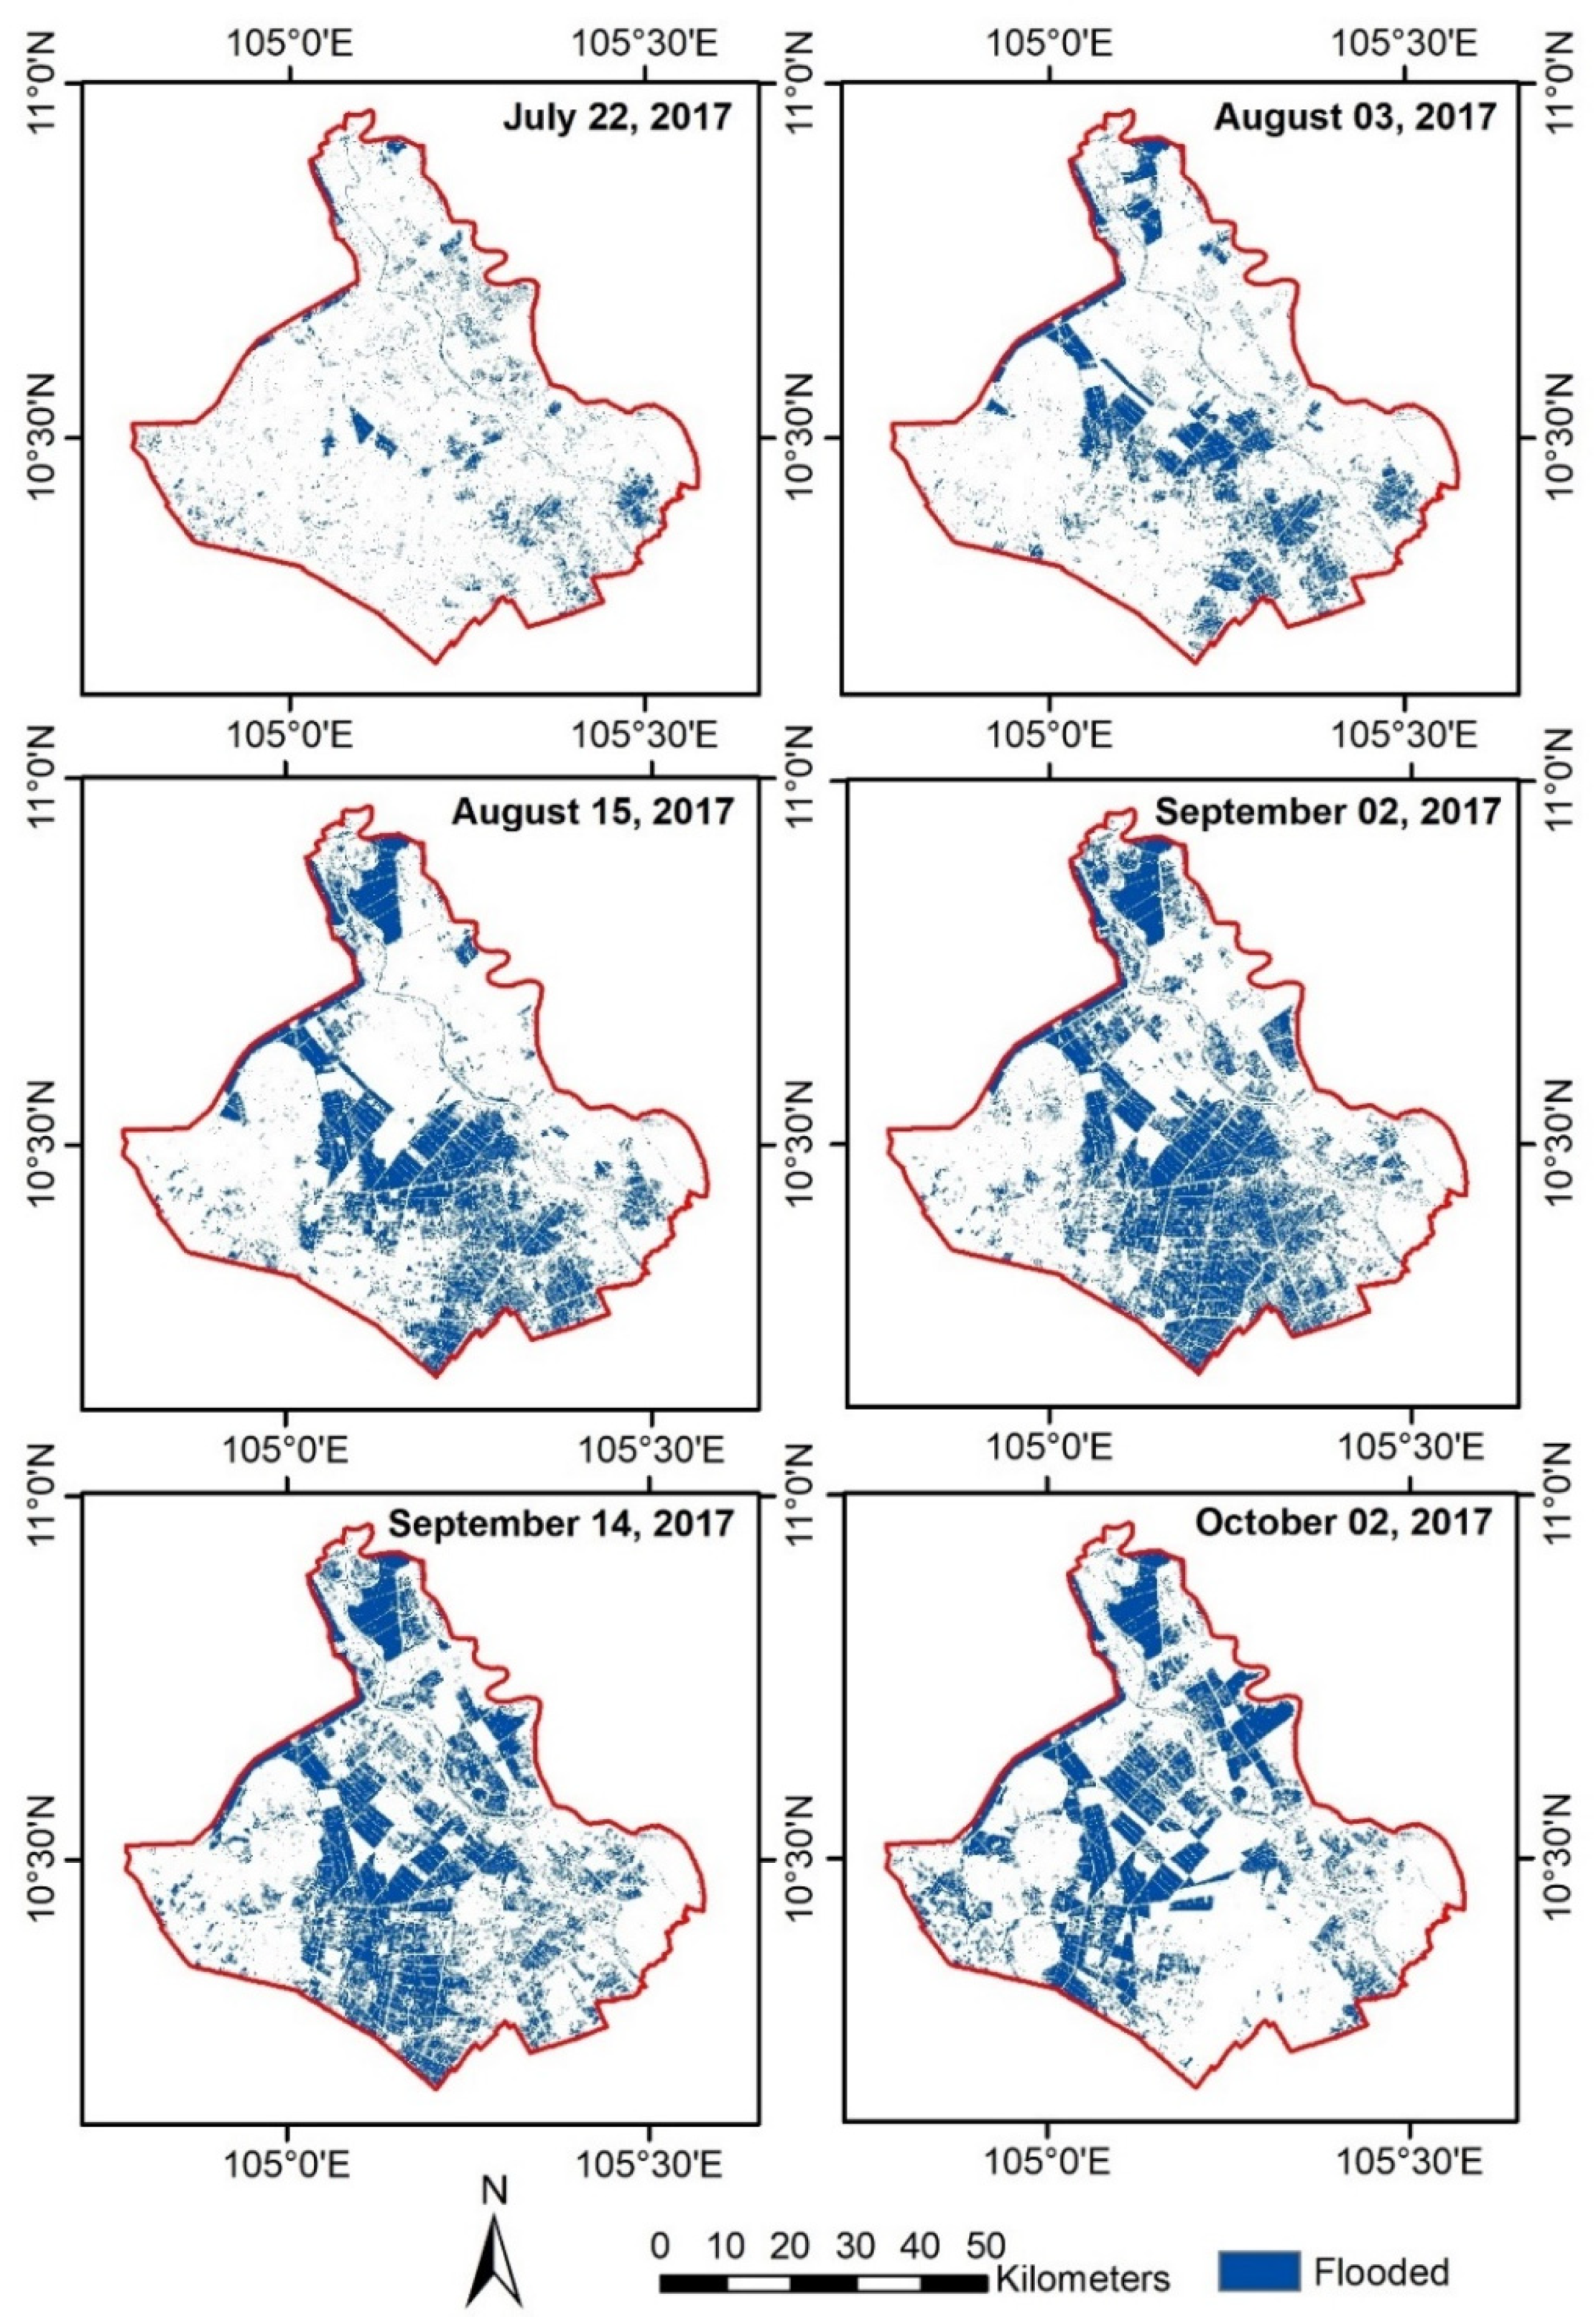
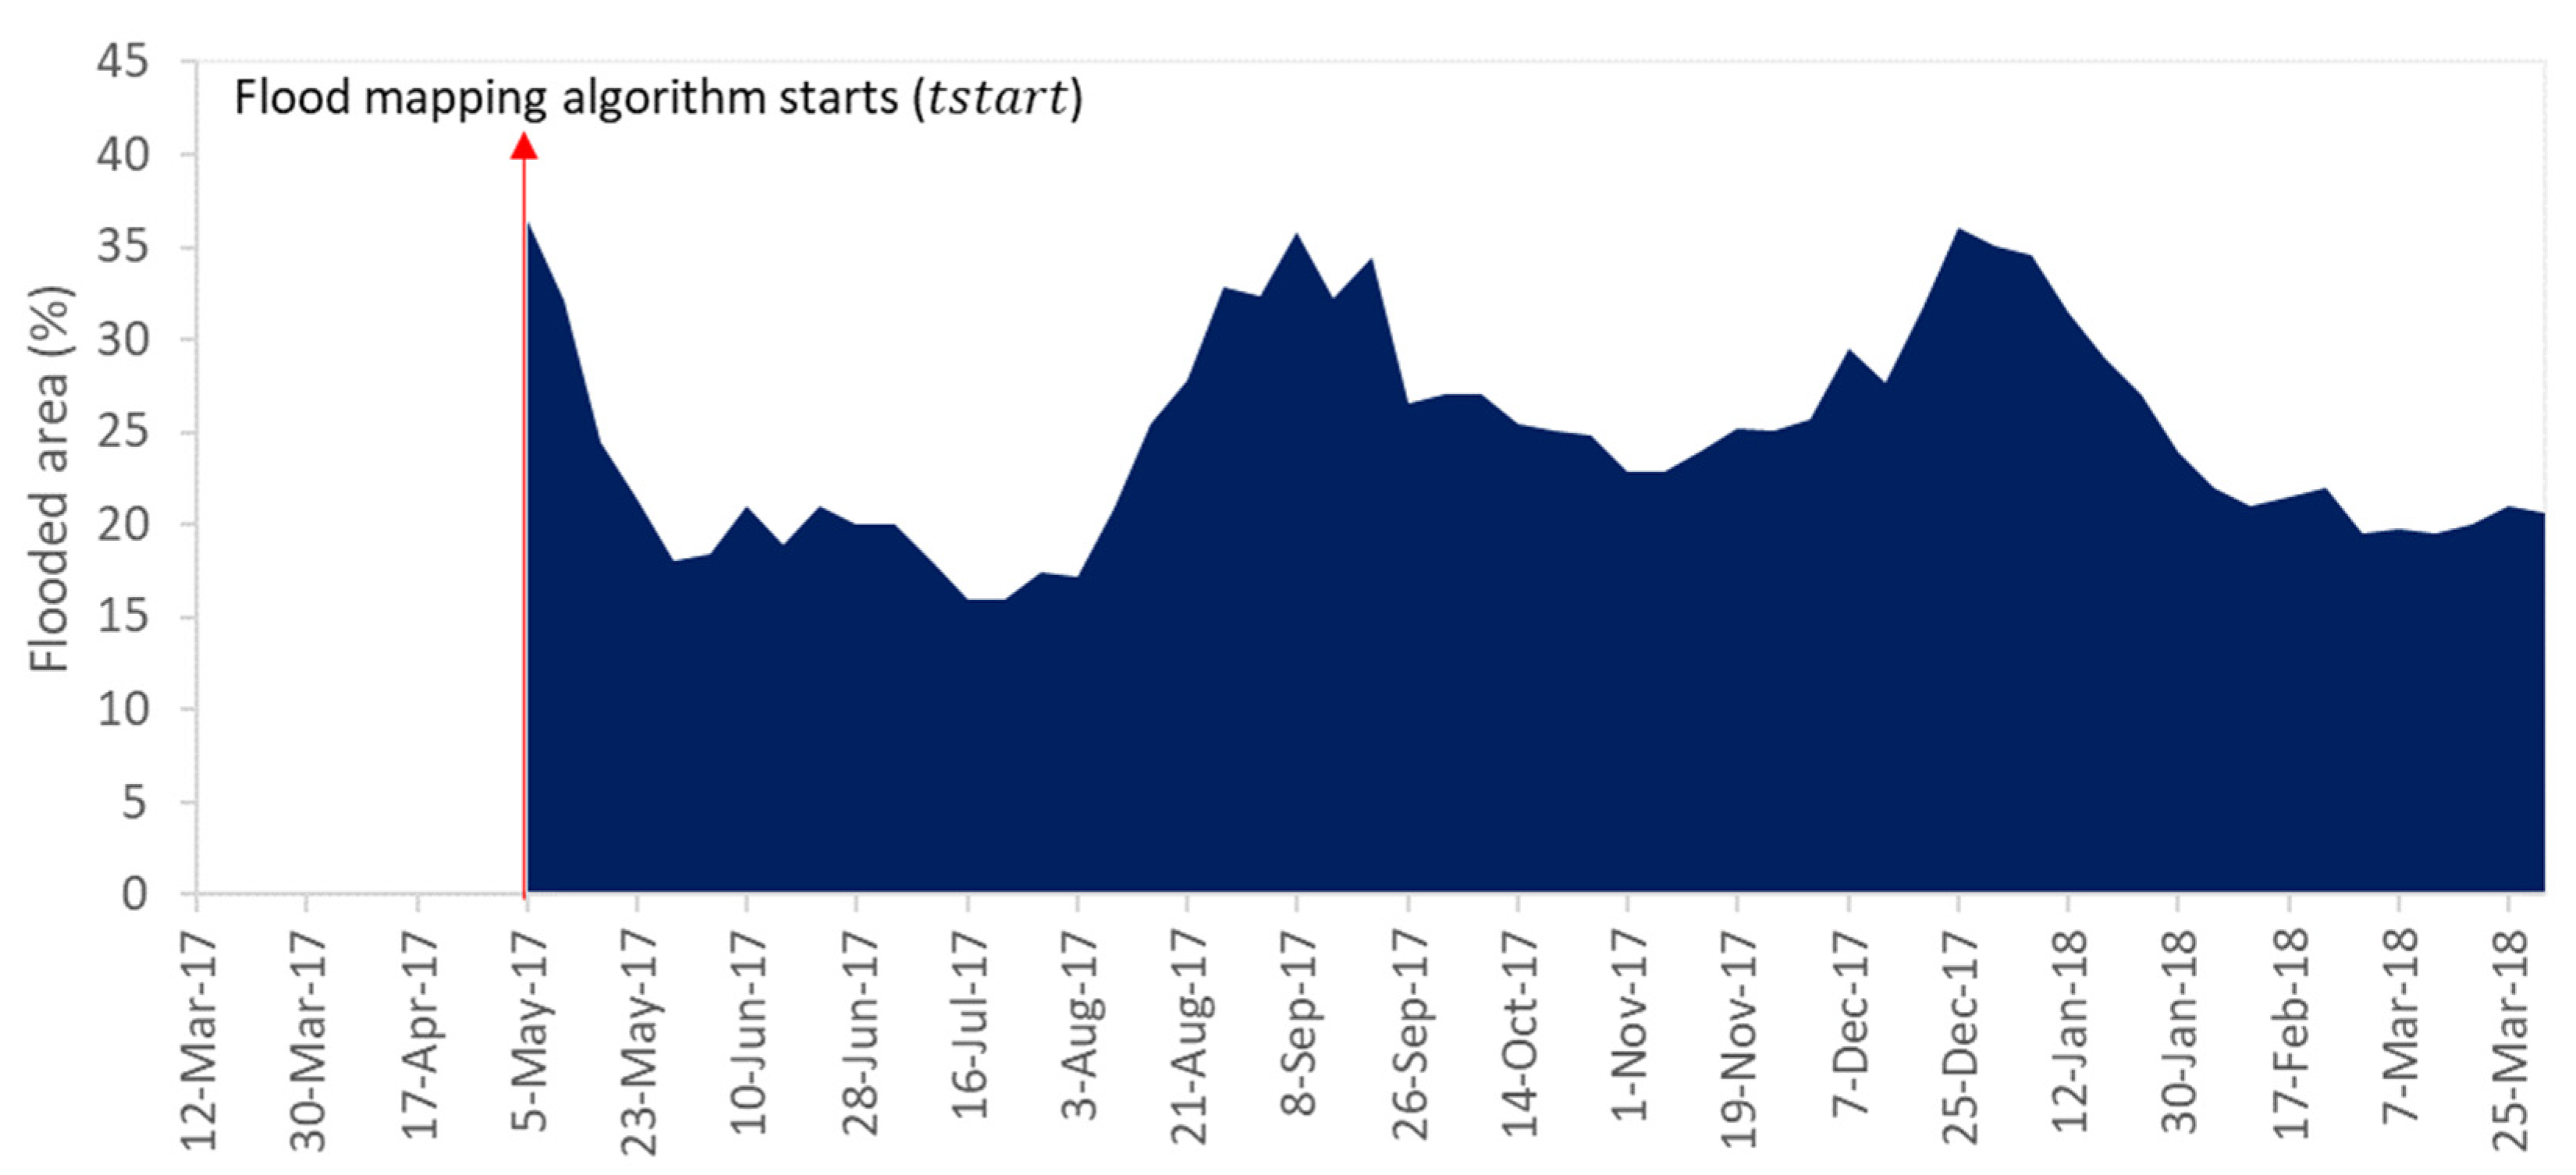
4.3.2. Flood Water Extent Maps Derived from the Flood Monitoring Algorithm

A total of 56 flood maps were generated with permanent water excluded using the flood mapping algorithm. The six corresponding flood maps of surface water maps in Figure 9 are displayed in Figure 15, showing a significant change in the extent of the flood water in An Giang province during the flood event in 2017. The flood started at the beginning of August, rapidly enlarged in the two months of August and September, and then gradually decreased at the beginning of October until November. Large areas of paddy fields in southern and central An Giang province were inundated during the flood event.
Figure 16 shows the percentage of the flooded area in An Giang province in 2017–2018. Before the flood event started, 22 July 2017 was the date with the minimum flood water (16% of An Giang province). It started increasing afterward and rapidly rising in August and September. The highest peak was on 8 September 2017 (36% of An Giang province). The flood began decreasing at the beginning of October until November. There were two other peaks in May 2017 (36%) and December 2017 (36%), which could be explained by the irrigation activities (Figure 4). May and December are the primary months for the sowing period of summer-autumn and winter-spring rice seasons in An Giang province [107]. Although the flood in the VMD is annual from August to November, it is worth characterizing flooded areas caused by agricultural activities or natural flood events (Section 5).

5. Discussion

This study provides an algorithm for mapping surface water and detecting flood water extent in An Giang province in the VMD using the Sentinel-1 SAR image time series. The contribution is mainly demonstrated in four aspects. First, the Sentinel-1 SAR data is a widely-used data resource for water resources management, especially for the humid and tropical regions with dense cloud cover during the year, because of its high spatial resolution at 10 m and 6-day revisit from a constellation of Sentinel-1A and Sentinel-1B satellites, free of cost, and all-weather and day-night operations [78,79,80]. However, very few studies have used the Sentinel-1 SAR data for surface water mapping and flood monitoring in the VMD, although this region is particularly vulnerable to the hydrological system and global climate changes [7,8,9]. Moreover, these studies generally apply an empirical threshold for all the scenes in a period (e.g., a year) to separate waterbodies from non-water areas [55,56]. Nevertheless, the VMD is a multifaceted area because of high crop growth dynamics and annual flood events. In fact, 80% of the area are cultivated paddy fields with up to three seasons a year, which cause large temporal variations in backscatter intensity derived from the Sentinel-1 SAR data [81]. The polarization analysis (Figure 4) reveals that the VH polarization has less influence on the double bounce phenomena caused by the mixture of soil and water in the rice’s sowing and nursery periods than the VV polarization. Furthermore, Figure 6 shows that different rice seasons could have distinguishing biophysical characteristics. For example, the minimum VH polarized backscatter intensity in the summer-autumn rice season is −20 dB, while it is −24 dB in the winter-spring season. For these reasons, the use of an empirical or static threshold for the entire year could cause large uncertainties in the classification results. The proposed dynamic Otsu threshold algorithm provides an opportunity to obtain optimal and specific thresholds for each acquisition date of the Sentinel-1 image time series for detecting surface water. It needs to be noted that collecting ground truth data in the VMD is very hard to be conducted because of the unpredictable, severe, widespread, and prolonged flood events in this area. Thus, the use of supervised methods could be less effective due to the demands of quick action and NRT mapping and monitoring.
Second, the NDWI and MNDWI are mature and well-demonstrated indices for surface water extraction [98,101,102,103]. Thus, an assessment is conducted to verify the water delineations between using the automatic Otsu threshold on the Sentinel-2 NDWI and MNDWI products. We similarly applied the automatic Otsu threshold to the optical Sentinel-2 NDWI and MNDWI images to obtain a consistent condition with the use of the Otsu threshold for the SAR Sentinel-1 VH images based on the intensity histogram. The obtained optimal Otsu thresholds for the Sentinel-2 NDWI and MNDWI were relatively stable during the year and not showing a significant dynamic as for the Sentinel-1 data. However, the overestimation of water delineation is found in the combination of the automatic Otsu threshold and Sentinel-2 NDWI image, while applying the Otsu method to the Sentinel-2 MNDWI image delineates waterbodies effectively in complicated areas (cultivated vegetation (e.g., rice), sediments, and hydrological dynamics). Moreover, the optimal Otsu threshold for the Sentinel-2 MNDWI image is close to threshold zero, which is typically used for identifying water on the NDWI and MNDWI [97,100]. The findings are consistent with previous studies regarding the ability of MNDWI to capture waterbodies in complex areas better than the NDWI [65,98,99,102]. As a result, the water maps derived from the combination of the MNDWI and Otsu threshold could be used as references to compare with the surface water maps derived from the Sentinel-1 SAR imagery.
Third, because of the difficulties in collecting the ground truth data for validation purposes, we conducted the visual comparison with the Sentinel-2 FRB images and statistical analysis with the Sentinel-2 MNDWI surface water maps to quantify the surface water maps derived from the Sentinel-1 data. A strong correspondence is observed through the visual comparison of surface water maps derived from the Sentinel-1 VH and Sentinel-2 FRB images. During the flood period (August to November), the surface water is captured very well in both river areas and paddy fields because of the low backscatter intensity of deep flood water. However, the accuracy is somewhat lower during the rice seasons because the Sentinel-1 SAR is more sensitive to the soil and water mixture conditions during the sowing and nursery periods when farmers prepare the planting beds for new rice seasons. Moreover, the statistical analysis shows that surface water maps derived from Sentinel-1 VH images and Sentinel-2 MNDWI images in paddy field areas and river areas are strongly correlated. Indeed, the combination of the automatic Otsu threshold and Sentinel-1 images detects surface water in the river areas efficiently (R2 = 0.97 and RMSE = 1.18%). However, lower effectiveness is observed in the paddy field areas, which is predictable because most pixels on the paddy fields are mixed of soil, water, and vegetation [52,55,108]. Consequently, applying the dynamic Otsu threshold algorithm to the Sentinel-1 SAR image time series is satisfactory for mapping surface water. Moreover, several studies of mapping surface water in the VMD have been conducted and faced similar conditions of lacking ground truth data for the validation. For example, to assess the derivation of surface water maps, Pham-Duc et al. [55] have compared the water maps derived from different remotely sensed data, such as Sentinel-1, Landsat 8, and MODIS/Terra. Our study initially obtained a strong correspondence between the derived Sentinel-1 surface water maps with the Sentinel-2 FRB images and Sentinel-2 MNDWI surface water maps, but the current validation results are purely qualitative between different products without referencing the in-situ data. Thus, the incorporation of multiple assessment and evaluation strategies would be greatly beneficial to validate the current satellite-based surface water maps. Particularly, support from local authorities and residents for observing the flooded areas, such as smartphone geotagged photos, could be considered to be added to the adaption and resilience program for creating the ground truth dataset for satellite-based applications.
Fourth, flood events have been increasingly severe, destructive, and unpredictable causing huge losses in many places around the world. For example, several floods in 2021 devastated different areas in China, such as Heilongjiang, Chongqing, Guizhou, Sichuan, Shanzi and Hebei, Inner Mongolia, Henan, Shaanxi, and Hubei, mostly caused by record-breaking rainfalls and typhoons. In July and August 2022, the flash flooding events struck several states of the United States (US), including parts of Missouri and Illinois, especially Greater St. Louis, Eastern Kentucky, Southwest Virginia, parts of West Virginia, and the Las Vegas Valley. The most unprecedented flash flooding event in Pakistan started in June 2022 triggered by heavy monsoon rains and melting glaciers, killing 1486 people. The flash floods also destructively hit central Italy in September 2022. Thus, the development of a flood mapping algorithm in NRT is one of the crucial tasks to have a quick response to flood events and changes in hydrological regime and global climate because of its close interaction with many activities such as agriculture, aquaculture, warning, prediction, damage estimation, and flood-adaption [11,26,27,30,31,32,33,34]. This study presents a promising algorithm that can meet the requirement for monitoring such flash flooding events. To be specific, the proposed flood monitoring algorithm uses the dynamic Otsu threshold approach, one of the fastest and most efficient thresholding techniques, to automatically map the surface water from the publicly and well-operated Sentinel-1 image time series. Then, a sequence of time series analyses mainly based on the change detection approach is applied to efficiently generate the temporal flood maps. These analyses are similar to rule-based classification, which is simple, direct, and capable of handling a high volume of data for the NRT applications. In addition, the high accuracy of mapping surface water during the flood period in such a complex area such as the VMD offers a prospective approach for applying the algorithm in other regions. As a result, this flood monitoring algorithm in NRT provides a fast and automatic tool, which could be potentially adopted in other areas for mapping surface water and monitoring flash flooding events. Unfortunately, it needs to be noted that the decommission of Sentinel-1B since December 2021 is a significant loss for the remote sensing community, especially for the NRT applications using the Sentinel-1 image time series. The proposed algorithm is still able to be operated with a 12-day revisit for surface water mapping and flood mapping using only the Sentinel-1A. We are also close to the Sentinel-1C launch date in April 2023 and looking forward to incorporating the upcoming Sentinel-1C data in our algorithm.
For future work, first, although the current research successfully detects flooded and non-flooded pixels in An Giang province, an upgraded model is needed to separate flooded pixels into real flooded and irrigated pixels. The improvement would provide essential information for water management and agricultural productivity in the VMD. Two potential approaches could be considered. The first method is based on the distinguishing characteristics of the annual flood events and irrigation activities in the VMD. Specifically, the length of the irrigation period is usually less than one month, while the annual flood in Mekong Delta only occurs in a specific period from August to November and usually lasts longer than two months [81,91]. The second method is based on supervised classification. Obviously, Figure 6 and Figure 10 show that there are significantly different characteristics of the water in the sowing period and the flood period, which are easily recognized on the Sentinel-2 FRB images as well. The water is shallow (5–15 cm) and contaminated with soil in the sowing period (brown color in the Sentinel-2 FBR images), while it is deeper and clarified in the flood period (dark blue color in the Sentinel-2 FBR images). Moreover, machine-learning-based (support vector machine, decision tree, and random forest) or deep-learning-based (deep neural networks, convolutional neural networks, and recurrent neural network) supervised classification methods are widely used for LULC classification and water detection [62,63,109,110,111,112]. One of the most important advantages of these methods is the ability to deal with uncertainties in the input data and cope with multiple input data sources in order to improve the accuracy of the classification or regression results [76,113]. Therefore, we plan to extend the study by generating a collection of training samples derived from the Sentinel-1 VH, VV, and ratio VH/VV images with labels acquired from the Sentinel-2 FRB images. The training data will be used to train machine learning and deep learning models for the classification of irrigation and natural flood. The trained models will be applied to eventually produce temporal flood maps with three classes consisting of irrigation, flooded, and non-flooded. Second, the global Otsu threshold is currently applied to An Giang province for mapping surface water. In recent research on flood water delineation, Liang et al. [114] revealed that the local thresholding approach could improve the accuracy by a 4–13% increase in the harmonic mean of user’s and producer’s accuracy of water compared to the conventional global-thresholding methods. Thus, an investigation of using the local and global Otsu threshold is highly recommended for future expansion to the entire VMD because of the complexities of the hydrological regime and the differences in agricultural and aquacultural activities. Third, although one-year data from March 2017 to March 2018 were obtained and analyzed for the algorithm development, it would be interesting to extend the period for understanding the intra and inter-annual variations simultaneously.

6. Conclusions

The annual flood and unusual alteration in the hydrological regimes are the most important concerns in the VMD because of its close connection with agricultural activities, aquacultural production, and livelihood of millions of inhabitants. Although the Sentinel-1 SAR data has been utilized in a number of research activities, very few studies have used the Sentinel-1 imagery for surface water mapping and flood monitoring in the VMD. Thus, this research developed an algorithm that (1) applies the dynamic Otsu threshold algorithm to the Sentinel-1 SAR image time series for mapping surface water and (2) implements time series analyses based on the change detection approach to detect flood water extent in NRT. The results evidently showed a visual correspondence between the water surface maps derived from the Sentinel-1 images and the Sentinel-2 FRB images in three selected periods (sowing period of rice season, flood period, and rice’s maturation stage). Moreover, applying the Otsu method to the Sentinel-2 MNDWI images obtains more accurate water delineation than to the Sentinel-2 NDWI images. The statistical analysis showed that the surface water maps derived from the Sentinel-1 VH images and Sentinel-2 MNDWI images were strongly correlated. Particularly, the surface water in the river was detected very well (R2 = 0.97 and RMSE = 1.18%), while it was somewhat lower in the paddy fields (R2 = 0.88 and RMSE = 3.88%). Particularly, the VMD is a complex area with high dynamics in hydrological systems and crop growth (e.g., rice cultivation), which could create large variations in the backscatter intensity in the Sentinel-1 SAR data. Thus, the use dynamic Otsu threshold algorithm is able to overcome the limitations of using an empirical threshold in previous studies for successfully mapping surface water. Furthermore, the flood monitoring algorithm was basically developed using a sequence of time series analyses based on the change detection approach that provides a rapid and effective tool for monitoring flood water extent in the VMD in NRT. The future improvements for separating irrigation, flood, and non-flood water are discussed.

Author Contributions

Conceptualization, K.H.T., M.M., and L.J.; Data curation, K.H.T.; Formal analysis, K.H.T.; Funding acquisition, M.M. and L.J.; Investigation, M.M. and L.J.; Methodology, K.H.T., M.M., and L.J.; Project administration, K.H.T., M.M., and L.J.; Software, K.H.T.; Supervision, M.M. and L.J.; Validation, K.H.T.; Visualization, K.H.T., M.M., and L.J.; Writing—original draft, K.H.T., M.M., and L.J.; Writing—review and editing, K.H.T., M.M., and L.J. All authors have read and agreed to the published version of the manuscript.

Funding

This work was supported by the Strategic Priority Research Program of the Chinese Academy of Sciences under Grants Nr. XDA19070102 and Nr. XDA19030203; M.M. acknowledges the support of the MOST High Level Foreign Expert program (Grant No. G2022055010L) and the Chinese Academy of Sciences President’s International Fellowship Initiative (Grant No. 2020VTA0001).

Data Availability Statement

The data used in this study were mainly obtained from publicly available sources. The details about the datasets are available in Section 2.2.

Acknowledgments

Thanks Capital Normal University, Delft University of Technology (TU Delft), and Chinese Academy of Sciences for supporting the authors; European Space Agency, Alaska Satellite Facility, and United States Geological Survey for providing Sentinel-1 and Sentinel-2 data; Keely Moriarty, Farman Ali, and Goran Djurdjevich for proofreading; and the reviewers for constructive comments during the review process of the manuscript.

Conflicts of Interest

The authors declare no conflict of interest.

References

  1. van Kien, N.; Hoang Han, N.; Cramb, R. Trends in Rice-Based Farming Systems in the Mekong Delta. In White Gold: The Commercialisation of Rice Farming in the Lower Mekong Basin; Cramb, R., Ed.; Springer: Singapore, 2020; pp. 347–373. ISBN 978-981-15-0998-8. [Google Scholar]
  2. Ho, T.D.N.; Kuwornu, J.K.M.; Tsusaka, T.W.; Nguyen, L.T.; Datta, A. Factors Influencing the Choice of Marketing Channel by Rice Producers: Evidence from the Mekong Delta Region, Vietnam. Int. J. Value Chain. Manag. 2021, 12, 336. [Google Scholar] [CrossRef]
  3. Eckstein, D.; Hutfils, M.-L.; Winges, M. Global Climate Risk Index 2019; Germanwatch: Bonn, Germany, 2018. [Google Scholar]
  4. Nguyen, N.A. Historic Drought and Salinity Intrusion in the Mekong Delta in 2016: Lessons Learned and Response Solutions. Vietnam. J. Sci. Technol. Eng. 2017, 59, 93–96. [Google Scholar] [CrossRef]
  5. Loc, H.H.; Low Lixian, M.; Park, E.; Dung, T.D.; Shrestha, S.; Yoon, Y.J. How the Saline Water Intrusion Has Reshaped the Agricultural Landscape of the Vietnamese Mekong Delta, a Review. Sci. Total Environ. 2021, 794, 148651. [Google Scholar] [CrossRef] [PubMed]
  6. Tran, D.D.; van Halsema, G.; Hellegers, P.J.G.J.; Ludwig, F.; Wyatt, A. Questioning Triple Rice Intensification on the Vietnamese Mekong Delta Floodplains: An Environmental and Economic Analysis of Current Land-Use Trends and Alternatives. J. Environ. Manag. 2018, 217, 429–441. [Google Scholar] [CrossRef] [PubMed]
  7. Tessler, Z.D.; Vörösmarty, C.J.; Grossberg, M.; Gladkova, I.; Aizenman, H.; Syvitski, J.P.M.; Foufoula-Georgiou, E. Profiling Risk and Sustainability in Coastal Deltas of the World. Science 2015, 349, 638–643. [Google Scholar] [CrossRef] [PubMed] [Green Version]
  8. Triet, N.V.K.; Dung, N.V.; Hoang, L.P.; Le Duy, N.; Tran, D.D.; Anh, T.T.; Kummu, M.; Merz, B.; Apel, H. Future Projections of Flood Dynamics in the Vietnamese Mekong Delta. Sci. Total Environ. 2020, 742, 140596. [Google Scholar] [CrossRef]
  9. Veettil, B.K.; Quang, N.X.; Thu Trang, N.T. Changes in Mangrove Vegetation, Aquaculture and Paddy Cultivation in the Mekong Delta: A Study from Ben Tre Province, Southern Vietnam. Estuar. Coast. Shelf Sci. 2019, 226, 106273. [Google Scholar] [CrossRef]
  10. Dun, O. Migration and Displacement Triggered by Floods in the Mekong Delta. Int. Migr. 2011, 49, e200–e223. [Google Scholar] [CrossRef]
  11. Nguyen, K.V.; James, H. Measuring Household Resilience to Floods: A Case Study in the Vietnamese Mekong River Delta. Ecol. Soc. 2013, 18, 13. [Google Scholar] [CrossRef] [Green Version]
  12. Van, P.D.T.; Popescu, I.; van Griensven, A.; Solomatine, D.P.; Trung, N.H.; Green, A. A Study of the Climate Change Impacts on Fluvial Flood Propagation in the Vietnamese Mekong Delta. Hydrol. Earth Syst. Sci. 2012, 16, 4637–4649. [Google Scholar] [CrossRef]
  13. Hoa, L.T.V.; Haruyama, S.; Nhan, N.H.; Cong, T.T.; Long, B.D. The Historical Flood in 2000 in Mekong River Delta, Vietnam: A Quantitative Analysis and Simulation. Geogr. Rev. Jpn. 2007, 80, 663–680. [Google Scholar] [CrossRef]
  14. Tran, D.; Likitdecharote, K.; Srisatit, T.; Trung, N. Modeling the Influence of River Discharge and Sea Level Rise on Salinity Intrusion in the Mekong Delta. In Proceedings of the Thai Society of Higher Education Institutes on Environment, Bangkok, Thailand, 22–25 March 2011; pp. 685–701. [Google Scholar]
  15. Pokhrel, Y.; Burbano, M.; Roush, J.; Kang, H.; Sridhar, V.; Hyndman, D.W. A Review of the Integrated Effects of Changing Climate, Land Use, and Dams on Mekong River Hydrology. Water 2018, 10, 266. [Google Scholar] [CrossRef] [Green Version]
  16. Kantoush, S.; Van Binh, D.; Sumi, T.; Trung, L.V. Impact of Upstream Hydropower Dams and Climate Change on Hydrodynamics of Vietnamese Mekong Delta. J. Jpn. Soc. Civ. Eng. Ser. B1 (Hydraul. Eng.) 2017, 73, I_109–I_114. [Google Scholar] [CrossRef] [Green Version]
  17. Manh, N.V.; Merz, B.; Apel, H. Sedimentation Monitoring Including Uncertainty Analysis in Complex Floodplains: A Case Study in the Mekong Delta. Hydrol. Earth Syst. Sci. Discuss. 2013, 10, 325–373. [Google Scholar] [CrossRef] [Green Version]
  18. Arias, M.E. Impacts of Hydrological Alterations in the Mekong Basin to the Tonle Sap Ecosystem. Ph.D. Thesis, University of Canterbury, Christchurch, New Zealand, 2013. [Google Scholar]
  19. Räsänen, T.; Joffre, O.; Someth, P.; Kummu, M. Trade-Offs between Hydropower and Irrigation Development and Their Cumulative Hydrological Impacts; ICEM—International Centre for Environmental Management: Hanoi, Vietnam, 2013. [Google Scholar]
  20. Ha, T.P.; Dieperink, C.; Dang Tri, V.P.; Otter, H.S.; Hoekstra, P. Governance Conditions for Adaptive Freshwater Management in the Vietnamese Mekong Delta. J. Hydrol. 2018, 557, 116–127. [Google Scholar] [CrossRef]
  21. Hoanh, C.T.; Suhardiman, D.; Anh, L.T. Irrigation Development in the Vietnamese Mekong Delta: Towards Polycentric Water Governance? Int. J. Water Gov. 2014, 2, 61–82. [Google Scholar] [CrossRef] [Green Version]
  22. Waibel, G.; Benedikter, S.; Reis, N.; Genschick, S.; Nguyen, L.; Huu, P.C.; Be, T.T. Water Governance Under Renovation? In Concepts and Practices of IWRM in the Mekong Delta, Vietnam; Renaud, F.G., Kuenzer, C., Eds.; Springer Netherlands: Dordrecht, The Netherlands, 2012; pp. 167–198. ISBN 978-94-007-3962-8. [Google Scholar]
  23. Johnson, K.A.; Wing, O.E.J.; Bates, P.D.; Fargione, J.; Kroeger, T.; Larson, W.D.; Sampson, C.C.; Smith, A.M. A Benefit–Cost Analysis of Floodplain Land Acquisition for US Flood Damage Reduction. Nat. Sustain. 2020, 3, 56–62. [Google Scholar] [CrossRef]
  24. de Moel, H.; van Alphen, J.; Aerts, J.C.J.H. Flood Maps in Europe—Methods, Availability and Use. Nat. Hazards Earth Syst. Sci. 2009, 9, 289–301. [Google Scholar] [CrossRef] [Green Version]
  25. Zakaria, S.F.; Zin, R.M.; Mohamad, I.; Balubaid, S.; Mydin, S.H.; MDR, E.M.R. The Development of Flood Map in Malaysia. AIP Conf. Proc. 2017, 1903, 110006. [Google Scholar] [CrossRef] [Green Version]
  26. Huynh, H.X.; Loi, T.T.T.; Huynh, T.P.; van Tran, S.; Nguyen, T.N.T.; Niculescu, S. Predicting of Flooding in the Mekong Delta Using Satellite Images. In Context-Aware Systems and Applications, and Nature of Computation and Communication; Vinh, P.C., Rakib, A., Eds.; Springer International Publishing: Cham, Switzerland, 2019; pp. 143–156. ISBN 978-3-030-34365-1. [Google Scholar]
  27. Nedkov, S.; Burkhard, B. Flood Regulating Ecosystem Services—Mapping Supply and Demand, in the Etropole Mu-nicipality, Bulgaria. Ecol. Indic. 2012, 21, 67–79. [Google Scholar] [CrossRef]
  28. Schelfaut, K.; Pannemans, B.; van der Craats, I.; Krywkow, J.; Mysiak, J.; Cools, J. Bringing Flood Resilience into Practice: The FREEMAN Project. Environ. Sci. Policy 2011, 14, 825–833. [Google Scholar] [CrossRef]
  29. Klijn, F.; Kreibich, H.; de Moel, H.; Penning-Rowsell, E. Adaptive Flood Risk Management Planning Based on a Comprehensive Flood Risk Conceptualisation. Mitig. Adapt. Strat. Glob. Chang. 2015, 20, 845–864. [Google Scholar] [CrossRef] [PubMed] [Green Version]
  30. Chau, V.N.; Holland, J.; Cassells, S.; Tuohy, M. Using GIS to Map Impacts upon Agriculture from Extreme Floods in Vietnam. Appl. Geogr. 2013, 41, 65–74. [Google Scholar] [CrossRef]
  31. Boori, M.S.; Choudhary, K.; Evers, M.; Paringer, R. A Review of Food Security and Flood Risk Dynamics in Central Dry Zone Area of Myanmar. Procedia Eng. 2017, 201, 231–238. [Google Scholar] [CrossRef]
  32. Parvin, G.A.; Shimi, A.C.; Shaw, R.; Biswas, C. Flood in a Changing Climate: The Impact on Livelihood and How the Rural Poor Cope in Bangladesh. Climate 2016, 4, 60. [Google Scholar] [CrossRef] [Green Version]
  33. Das, M.; Das, A.; Momin, S.; Pandey, R. Mapping the Effect of Climate Change on Community Livelihood Vulnerability in the Riparian Region of Gangatic Plain, India. Ecol. Indic. 2020, 119, 106815. [Google Scholar] [CrossRef]
  34. Armah, F.A.; Yawson, D.O.; Yengoh, G.T.; Odoi, J.O.; Afrifa, E.K.A. Impact of Floods on Livelihoods and Vulnerability of Natural Resource Dependent Communities in Northern Ghana. Water 2010, 2, 120–139. [Google Scholar] [CrossRef] [Green Version]
  35. Brivio, P.A.; Colombo, R.; Maggi, M.; Tomasoni, R. Integration of Remote Sensing Data and GIS for Accurate Mapping of Flooded Areas. Int. J. Remote Sens. 2002, 23, 429–441. [Google Scholar] [CrossRef]
  36. Sanyal, J.; Lu, X.X. Application of Remote Sensing in Flood Management with Special Reference to Monsoon Asia: A Review. Nat. Hazards 2004, 33, 283–301. [Google Scholar] [CrossRef]
  37. Wang, Y.; Colby, J.D.; Mulcahy, K.A. An Efficient Method for Mapping Flood Extent in a Coastal Floodplain Using Landsat TM and DEM Data. Int. J. Remote Sens. 2002, 23, 3681–3696. [Google Scholar] [CrossRef]
  38. Kansakar, P.; Hossain, F. A Review of Applications of Satellite Earth Observation Data for Global Societal Benefit and Stewardship of Planet Earth. Space Policy 2016, 36, 46–54. [Google Scholar] [CrossRef]
  39. Lin, L.; Di, L.; Yu, E.G.; Kang, L.; Shrestha, R.; Rahman, S.; Tang, J.; Deng, M.; Sun, Z.; Zhang, C.; et al. A Review of Remote Sensing in Flood Assessment. In Proceedings of the 2016 Fifth International Conference on Agro-Geoinformatics (Agro-Geoinformatics), Tianjin, China, 18–20 July 2016; pp. 1–4. [Google Scholar]
  40. Schumann, G.; Bates, P.D.; Horritt, M.S.; Matgen, P.; Pappenberger, F. Progress in Integration of Remote Sensing–Derived Flood Extent and Stage Data and Hydraulic Models. Rev. Geophys. 2009, 47, RG4001. [Google Scholar] [CrossRef]
  41. Huang, C.; Chen, Y.; Zhang, S.; Wu, J. Detecting, Extracting, and Monitoring Surface Water From Space Using Optical Sensors: A Review. Rev. Geophys. 2018, 56, 333–360. [Google Scholar] [CrossRef]
  42. Amarnath, G. An Algorithm for Rapid Flood Inundation Mapping from Optical Data Using a Reflectance Differencing Technique. J. Flood Risk Manag. 2014, 7, 239–250. [Google Scholar] [CrossRef]
  43. Anusha, N.; Bharathi, B. Flood Detection and Flood Mapping Using Multi-Temporal Synthetic Aperture Radar and Optical Data. Egypt. J. Remote Sens. Space Sci. 2020, 23, 207–219. [Google Scholar] [CrossRef]
  44. Sakamoto, T.; Van Nguyen, N.; Kotera, A.; Ohno, H.; Ishitsuka, N.; Yokozawa, M. Detecting Temporal Changes in the Extent of Annual Flooding within the Cambodia and the Vietnamese Mekong Delta from MODIS Time-Series Imagery. Remote Sens. Environ. 2007, 109, 295–313. [Google Scholar] [CrossRef]
  45. Fayne, J.V.; Bolten, J.D.; Doyle, C.S.; Fuhrmann, S.; Rice, M.T.; Houser, P.R.; Lakshmi, V. Flood Mapping in the Lower Mekong River Basin Using Daily MODIS Observations. Int. J. Remote Sens. 2017, 38, 1737–1757. [Google Scholar] [CrossRef]
  46. Tran, K.H.; Zhang, X.; Ketchpaw, A.R.; Wang, J.; Ye, Y.; Shen, Y. A Novel Algorithm for the Generation of Gap-Free Time Series by Fusing Harmonized Landsat 8 and Sentinel-2 Observations with PhenoCam Time Series for Detecting Land Surface Phenology. Remote Sens. Environ. 2022, 282, 113275. [Google Scholar] [CrossRef]
  47. Liu, S.; Li, X.; Chen, D.; Duan, Y.; Ji, H.; Zhang, L.; Chai, Q.; Hu, X. Understanding Land Use/Land Cover Dynamics and Impacts of Human Activities in the Mekong Delta over the Last 40 Years. Glob. Ecol. Conserv. 2020, 22, e00991. [Google Scholar] [CrossRef]
  48. Aires, F.; Venot, J.-P.; Massuel, S.; Gratiot, N.; Pham-Duc, B.; Prigent, C. Surface Water Evolution (2001–2017) at the Cambodia/Vietnam Border in the Upper Mekong Delta Using Satellite MODIS Observations. Remote Sens. 2020, 12, 800. [Google Scholar] [CrossRef]
  49. Bangira, T. Mapping Surface Water in Complex and Heterogeneous Environments Using Remote Sensing. Ph.D. Thesis, Stellenbosch University, Western Cape, South Africa, 2018. [Google Scholar]
  50. Tsyganskaya, V.; Martinis, S.; Marzahn, P.; Ludwig, R. Detection of Temporary Flooded Vegetation Using Sentinel-1 Time Series Data. Remote Sens. 2018, 10, 1286. [Google Scholar] [CrossRef] [Green Version]
  51. Bayik, C.; Abdikan, S.; Ozbulak, G.; Alasag, T.; Aydemir, S.; Sanli, F.B. Exploiting Multi-Temporal Sentinel-1 SAR Data for Flood Extend Mapping. Int. Arch. Photogramm. Remote Sens. Spat. Inf. Sci.—ISPRS Arch. 2018, 42, 109–113. [Google Scholar] [CrossRef] [Green Version]
  52. Chini, M.; Pelich, R.; Pulvirenti, L.; Pierdicca, N.; Hostache, R.; Matgen, P. Sentinel-1 InSAR Coherence to Detect Floodwater in Urban Areas: Houston and Hurricane Harvey as A Test Case. Remote Sens. 2019, 11, 107. [Google Scholar] [CrossRef] [Green Version]
  53. Nguyen, L.; Bui, T. Flood Monitoring of Mekong River Delta, Vietnam Using ERS SAR Data. In Proceedings of the 22nd Asian Conference on Remote Sensing, Singapore, 5–9 November 2001; p. 1544. [Google Scholar]
  54. Kuenzer, C.; Guo, H.; Huth, J.; Leinenkugel, P.; Li, X.; Dech, S. Flood Mapping and Flood Dynamics of the Mekong Delta: ENVISAT-ASAR-WSM Based Time Series Analyses. Remote Sens. 2013, 5, 687–715. [Google Scholar] [CrossRef] [Green Version]
  55. Pham-Duc, B.; Prigent, C.; Aires, F. Surface Water Monitoring within Cambodia and the Vietnamese Mekong Delta over a Year, with Sentinel-1 SAR Observations. Water 2017, 9, 366. [Google Scholar] [CrossRef] [Green Version]
  56. Dinh, D.A.; Elmahrad, B.; Leinenkugel, P.; Newton, A. Time Series of Flood Mapping in the Mekong Delta Using High Resolution Satellite Images. IOP Conf. Series: Earth Environ. Sci. 2019, 266, 012011. [Google Scholar] [CrossRef]
  57. Xie, H.; Luo, X.; Xu, X.; Pan, H.; Tong, X. Evaluation of Landsat 8 OLI Imagery for Unsupervised Inland Water Ex-traction. Int. J. Remote Sens. 2016, 37, 1826–1844. [Google Scholar] [CrossRef]
  58. Martinis, S.; Twele, A.; Voigt, S. Unsupervised Extraction of Flood-Induced Backscatter Changes in SAR Data Using Markov Image Modeling on Irregular Graphs. IEEE Trans. Geosci. Remote Sens. 2011, 49, 251–263. [Google Scholar] [CrossRef]
  59. Verpoorter, C.; Kutser, T.; Tranvik, L. Automated Mapping of Water Bodies Using Landsat Multispectral Data. Limnol. Oceanogr. Methods 2012, 10, 1037–1050. [Google Scholar] [CrossRef]
  60. Gilbertson, J.K.; van Niekerk, A. Value of Dimensionality Reduction for Crop Differentiation with Multi-Temporal Imagery and Machine Learning. Comput. Electron. Agric. 2017, 142, 50–58. [Google Scholar] [CrossRef]
  61. Pradhan, B.; Tehrany, M.S.; Jebur, M.N. A New Semiautomated Detection Mapping of Flood Extent From TerraSAR-X Satellite Image Using Rule-Based Classification and Taguchi Optimization Techniques. IEEE Trans. Geosci. Remote Sens. 2016, 54, 4331–4342. [Google Scholar] [CrossRef]
  62. Bangira, T.; Alfieri, S.M.; Menenti, M.; van Niekerk, A. Comparing Thresholding with Machine Learning Classifiers for Mapping Complex Water. Remote Sens. 2019, 11, 1351. [Google Scholar] [CrossRef] [Green Version]
  63. Tran, K.H.; Zhang, H.K.; McMaine, J.T.; Zhang, X.; Luo, D. 10 m Crop Type Mapping Using Sentinel-2 Reflectance and 30 m Cropland Data Layer Product. Int. J. Appl. Earth Obs. Geoinf. 2022, 107, 102692. [Google Scholar] [CrossRef]
  64. Zhang, X.-K.; Zhang, X.; Lan, Q.-Q.; Ali Baig, M.H. Automated Detection of Coastline Using Landsat TM Based on Water Index and Edge Detection Methods. In Proceedings of the 2012 Second International Workshop on Earth Observation and Remote Sensing Applications, Shanghai, China, 8–11 June 2012; pp. 153–156. [Google Scholar]
  65. Du, Y.; Zhang, Y.; Ling, F.; Wang, Q.; Li, W.; Li, X. Water Bodies’ Mapping from Sentinel-2 Imagery with Modified Normalized Difference Water Index at 10-m Spatial Resolution Produced by Sharpening the Swir Band. Remote Sens. 2016, 8, 345. [Google Scholar] [CrossRef] [Green Version]
  66. Foody, G.M.; Muslim, A.M.; Atkinson, P.M. Super-resolution Mapping of the Waterline from Remotely Sensed Data. Int. J. Remote Sens. 2005, 26, 5381–5392. [Google Scholar] [CrossRef]
  67. Niroumand-Jadidi, M.; Vitti, A. Reconstruction of River Boundaries at Sub-Pixel Resolution: Estimation and Spatial Allocation of Water Fractions. ISPRS Int. J. Geo-Inf. 2017, 6, 383. [Google Scholar] [CrossRef] [Green Version]
  68. Li, L.; Chen, Y.; Xu, T.; Liu, R.; Shi, K.; Huang, C. Super-Resolution Mapping of Wetland Inundation from Remote Sensing Imagery Based on Integration of Back-Propagation Neural Network and Genetic Algorithm. Remote Sens. Environ. 2015, 164, 142–154. [Google Scholar] [CrossRef]
  69. Otsu, N. A Threshold Selection Method from Gray-Level Histograms. IEEE Trans. Syst. Man Cybern. 1979, 9, 62–66. [Google Scholar] [CrossRef] [Green Version]
  70. Chini, M.; Hostache, R.; Giustarini, L.; Matgen, P. A Hierarchical Split-Based Approach for Parametric Thresholding of SAR Images: Flood Inundation as a Test Case. IEEE Trans. Geosci. Remote Sens. 2017, 55, 6975–6988. [Google Scholar] [CrossRef]
  71. Bangira, T.; Alfieri, S.; Menenti, M.; van Niekerk, A.; Vekerdy, Z. A Spectral Unmixing Method with Ensemble Esti-mation of Endmembers: Application to Flood Mapping in the Caprivi Floodplain. Remote Sens. 2017, 9, 1013. [Google Scholar] [CrossRef]
  72. Khan, S.N.; Li, D.; Maimaitijiang, M. A Geographically Weighted Random Forest Approach to Predict Corn Yield in the US Corn Belt. Remote Sens. 2022, 14, 2843. [Google Scholar] [CrossRef]
  73. Liu, T.; Abd-Elrahman, A.; Morton, J.; Wilhelm, V.L. Comparing Fully Convolutional Networks, Random Forest, Support Vector Machine, and Patch-Based Deep Convolutional Neural Networks for Object-Based Wetland Mapping Using Images from Small Unmanned Aircraft System. GISci. Remote Sens. 2018, 55, 243–264. [Google Scholar] [CrossRef]
  74. Yang, N.; Liu, D.; Feng, Q.; Xiong, Q.; Zhang, L.; Ren, T.; Zhao, Y.; Zhu, D.; Huang, J. Large-Scale Crop Mapping Based on Machine Learning and Parallel Computation with Grids. Remote Sens. 2019, 11, 1500. [Google Scholar] [CrossRef] [Green Version]
  75. Isikdogan, F.; Bovik, A.C.; Passalacqua, P. Surface Water Mapping by Deep Learning. IEEE J. Sel. Top. Appl. Earth Obs. Remote Sens. 2017, 10, 4909–4918. [Google Scholar] [CrossRef]
  76. Song, H.; Liu, Q.; Wang, G.; Hang, R.; Huang, B. Spatiotemporal Satellite Image Fusion Using Deep Convolutional Neural Networks. IEEE J. Sel. Top. Appl. Earth Obs. Remote Sens. 2018, 11, 821–829. [Google Scholar] [CrossRef]
  77. Li, M.; Zhang, T.; Tu, Y.; Ren, Z.; Xu, B. Monitoring Post-Flood Recovery of Croplands Using the Integrated Sentinel-1/2 Imagery in the Yangtze-Huai River Basin. Remote Sens. 2022, 14, 690. [Google Scholar] [CrossRef]
  78. Geudtner, D.; Torres, R.; Snoeij, P.; Davidson, M.; Rommen, B. Sentinel-1 System Capabilities and Applications. In Proceedings of the 2014 IEEE Geoscience and Remote Sensing Symposium, Quebec City, QC, Canada, 13–18 July 2014; pp. 1457–1460. [Google Scholar]
  79. Rucci, A.; Ferretti, A.; Monti Guarnieri, A.; Rocca, F. Sentinel 1 SAR Interferometry Applications: The Outlook for Sub Millimeter Measurements. Remote Sens. Environ. 2012, 120, 156–163. [Google Scholar] [CrossRef]
  80. Plank, S. Rapid Damage Assessment by Means of Multi-Temporal SAR—A Comprehensive Review and Outlook to Sentinel-1. Remote Sens. 2014, 6, 4870–4906. [Google Scholar] [CrossRef] [Green Version]
  81. Minh, H.V.T.; Avtar, R.; Mohan, G.; Misra, P.; Kurasaki, M. Monitoring and Mapping of Rice Cropping Pattern in Flooding Area in the Vietnamese Mekong Delta Using Sentinel-1A Data: A Case of an Giang Province. ISPRS Int. J. Geo-Inf. 2019, 8, 211. [Google Scholar] [CrossRef] [Green Version]
  82. Duc Tran, D.; van Halsema, G.; Hellegers, P.J.G.J.; Phi Hoang, L.; Quang Tran, T.; Kummu, M.; Ludwig, F. Assessing Impacts of Dike Construction on the Flood Dynamics of the Mekong Delta. Hydrol. Earth Syst. Sci. 2018, 22, 1875–1896. [Google Scholar] [CrossRef]
  83. General Statistics Office of Vietnam (GSO). Statistical Yearbook of Viet Nam 2017; General Statistics Office of Vietnam (GSO): Hanoi, Vietnam, 2017; ISBN 9786047507269.
  84. Minh, H.V.T.; Kurasaki, M.; Van Ty, T.; Tran, D.Q.; Le, K.N.; Avtar, R.; Rahman, M.; Osaki, M. Effects of Mul-ti-Dike Protection Systems on Surface Water Quality in the Vietnamese Mekong Delta. Water 2019, 11, 1010. [Google Scholar] [CrossRef] [Green Version]
  85. Phan, H.; le Toan, T.; Bouvet, A. Understanding Dense Time Series of Sentinel-1 Backscatter from Rice Fields: Case Study in a Province of the Mekong Delta, Vietnam. Remote Sens. 2021, 13, 921. [Google Scholar] [CrossRef]
  86. Motaze, N.V.; Nwachukwu, C.E.; Humphreys, E.H. Treatment Interventions for Diarrhoea in HIV-Infected and HIV-Exposed Children. In Cochrane Database of Systematic Reviews; John Wiley & Sons, Ltd.: Chichester, UK, 2013; p. 322. [Google Scholar] [CrossRef]
  87. van Tho, N. Coastal Erosion, River Bank Erosion and Landslides in the Mekong Delta: Causes, Effects and Solutions; Springer: Singapore, 2020; pp. 957–962. ISBN 9789811521843. [Google Scholar]
  88. Mekong River Commission. Annual Mekong Hydrology, Flood and Drought Report 2018; MRC: Vientiane, Laos, 2020. [Google Scholar]
  89. Li, J.; Roy, D. A Global Analysis of Sentinel-2A, Sentinel-2B and Landsat-8 Data Revisit Intervals and Implications for Terrestrial Monitoring. Remote Sens. 2017, 9, 902. [Google Scholar] [CrossRef] [Green Version]
  90. Hwang, P.A.; Zhang, B.; Toporkov, J.V.; Perrie, W. Correction to “Comparison of Composite Bragg Theory and Quad-Polarization Radar Backscatter from RADARSAT-2: With Applications to Wave Breaking and High Wind Re-trieval. J. Geophys. Res. Earth Surf. 2010, 115, C11099. [Google Scholar] [CrossRef]
  91. Nguyen, D.B.; Gruber, A.; Wagner, W. Mapping Rice Extent and Cropping Scheme in the Mekong Delta Using Sen-tinel-1A Data. Remote Sens. Lett. 2016, 7, 1209–1218. [Google Scholar] [CrossRef]
  92. Filipponi, F. Sentinel-1 GRD Preprocessing Workflow. Proceedings 2019, 18, 11. [Google Scholar] [CrossRef] [Green Version]
  93. Lee, J.S.; Jurkevich, L.; Dewaele, P.; Wambacq, P.; Oosterlinck, A. Speckle Filtering of Synthetic Aperture Radar Images: A Review. Remote Sens. Rev. 1994, 8, 313–340. [Google Scholar] [CrossRef]
  94. Twele, A.; Cao, W.; Plank, S.; Martinis, S. Sentinel-1-Based Flood Mapping: A Fully Automated Processing Chain. Int. J. Remote Sens. 2016, 37, 2990–3004. [Google Scholar] [CrossRef]
  95. Muro, J.; Canty, M.; Conradsen, K.; Hüttich, C.; Nielsen, A.A.; Skriver, H.; Remy, F.; Strauch, A.; Thonfeld, F.; Menz, G. Short-Term Change Detection in Wetlands Using Sentinel-1 Time Series. Remote Sens. 2016, 8, 795. [Google Scholar] [CrossRef]
  96. Mleczko, M.; Mróz, M. Wetland Mapping Using SAR Data from the Sentinel-1A and TanDEM-X Missions: A Com-parative Study in the Biebrza Floodplain (Poland). Remote Sens. 2018, 10, 78. [Google Scholar] [CrossRef] [Green Version]
  97. McFeeters, S.K. The Use of the Normalized Difference Water Index (NDWI) in the Delineation of Open Water Features. Int. J. Remote Sens. 1996, 17, 1425–1432. [Google Scholar] [CrossRef]
  98. Xu, H. Modification of Normalised Difference Water Index (NDWI) to Enhance Open Water Features in Remotely Sensed Imagery. Int. J. Remote Sens. 2006, 27, 3025–3033. [Google Scholar] [CrossRef]
  99. Sun, F.; Sun, W.; Chen, J.; Gong, P. Comparison and Improvement of Methods for Identifying Waterbodies in Remotely Sensed Imagery. Int. J. Remote Sens. 2012, 33, 6854–6875. [Google Scholar] [CrossRef]
  100. Guo, Q.; Pu, R.; Li, J.; Cheng, J. A Weighted Normalized Difference Water Index for Water Extraction Using Landsat Imagery. Int. J. Remote Sens. 2017, 38, 5430–5445. [Google Scholar] [CrossRef]
  101. Ganaie, H.A.; Hashia, H.; Kalota, D. Delineation of Flood Prone Area Using Normalized Difference Water Index (NDWI) and Transect Method: A Case Study of Kashmir Valley. Int. J. Remote Sens. Appl. 2013, 3, 53–58. [Google Scholar]
  102. Singh, K.V.; Setia, R.; Sahoo, S.; Prasad, A.; Pateriya, B. Evaluation of NDWI and MNDWI for Assessment of Water-logging by Integrating Digital Elevation Model and Groundwater Level. Geocarto Int. 2015, 30, 650–661. [Google Scholar] [CrossRef]
  103. Ji, L.; Zhang, L.; Wylie, B. Analysis of Dynamic Thresholds for the Normalized Difference Water Index. Photogramm. Eng. Remote Sens. 2009, 75, 1307–1317. [Google Scholar] [CrossRef]
  104. Lawal, A.; Kerner, H.; Becker-Reshef, I.; Meyer, S. Mapping the Location and Extent of 2019 Prevent Planting Acres in South Dakota Using Remote Sensing Techniques. Remote Sens. 2021, 13, 2430. [Google Scholar] [CrossRef]
  105. Nguyen, V.K.; Pittock, J.; Connell, D. Dikes, Rice, and Fish: How Rapid Changes in Land Use and Hydrology Have Transformed Agriculture and Subsistence Living in the Mekong Delta. Reg. Environ. Chang. 2019, 19, 2069–2077. [Google Scholar] [CrossRef]
  106. Yokoyama, S. Economic Feasibility of Diversified Farming System in the Flood-Prone Mekong Delta: Simulation for Dike Area in An Giang Province, Vietnam. Asian J. Agric. Dev. 2018, 15, 21–40. [Google Scholar] [CrossRef]
  107. Phan, H.; le Toan, T.; Bouvet, A.; Nguyen, L.; Pham Duy, T.; Zribi, M. Mapping of Rice Varieties and Sowing Date Using X-Band SAR Data. Sensors 2018, 18, 316. [Google Scholar] [CrossRef] [PubMed] [Green Version]
  108. Zhang, B.; Wdowinski, S.; Gann, D.; Hong, S.-H.; Sah, J. Spatiotemporal Variations of Wetland Backscatter: The Role of Water Depth and Vegetation Characteristics in Sentinel-1 Dual-Polarization SAR Observations. Remote Sens. Environ. 2022, 270, 112864. [Google Scholar] [CrossRef]
  109. Alifu, H.; Vuillaume, J.-F.; Johnson, B.A.; Hirabayashi, Y. Machine-Learning Classification of Debris-Covered Glaciers Using a Combination of Sentinel-1/-2 (SAR/Optical), Landsat 8 (Thermal) and Digital Elevation Data. Geomorphology 2020, 369, 107365. [Google Scholar] [CrossRef]
  110. Zhang, C.; Yang, Z.; Di, L.; Lin, L.; Hao, P. Refinement of Cropland Data Layer Using Machine Learning. Int. Arch. Photogramm. Remote Sens. Spatial Inf. Sci. 2020, XLII-3/W11, 161–164. [Google Scholar] [CrossRef] [Green Version]
  111. Gislason, P.O.; Benediktsson, J.A.; Sveinsson, J.R. Random Forests for Land Cover Classification. Pattern Recognit. Lett. 2006, 27, 294–300. [Google Scholar] [CrossRef]
  112. Pal, M. Random Forest Classifier for Remote Sensing Classification. Int. J. Remote Sens. 2005, 26, 217–222. [Google Scholar] [CrossRef]
  113. Belgiu, M.; Drăgu, L. Random Forest in Remote Sensing: A Review of Applications and Future Directions. ISPRS J. Photogramm. Remote Sens. 2016, 114, 24–31. [Google Scholar] [CrossRef]
  114. Liang, J.; Liu, D. A Local Thresholding Approach to Flood Water Delineation Using Sentinel-1 SAR Imagery. ISPRS J. Photogramm. Remote Sens. 2020, 159, 53–62. [Google Scholar] [CrossRef]
Figure 1. An Giang province with Tan Chau gauge station (10.79°N–105.24°E) in the Vietnamese Mekong Delta.
Remotesensing 14 05721 g001
Figure 2. Water level at Tan Chau gauge station in An Giang province from 1960 to 2009 (http://portal.mrcmekong.org/charts/chart, accessed on 1 January 2020).
Remotesensing 14 05721 g002
Figure 3. Flowchart for surface water mapping and flood monitoring using Sentinel-1 SAR image time series and Otsu threshold.
Remotesensing 14 05721 g003
Figure 4. Temporal VH and VV backscatter intensities on rice growth development, including preparing planting bed, nursery, vegetative stage, reproductive stage, and maturation stage, adopted from Nguyen et al. [91].
Remotesensing 14 05721 g004
Figure 5. The workflow of pre-processing Sentinel-1 data using SNAP.
Remotesensing 14 05721 g005
Figure 6. Sentinel-1 backscatter of crop phenology at two random samples, DR1 (10.47°N and 105.17°E) and DR2 (10.63°N and 105.51°E), cultivating two rice seasons a year (summer-autumn and autumn-winter seasons). The summer-autumn rice season is from April to July (right before the flood). The winter-spring rice season begins from December (right after the flood) to March. Another rice season could be possible in the flooding period from August to November for the areas that are protected by the dike system (autumn-winter season).
Remotesensing 14 05721 g006
Figure 7. Flood monitoring algorithm using change-detection-based time series analyses on the Sentinel-1 SAR images.
Remotesensing 14 05721 g007
Figure 8. Dynamic Otsu thresholds on the Sentinel-1 SAR image time series.
Remotesensing 14 05721 g008
Figure 9. Surface water maps during the flood event in 2017 were derived from using the dynamic Otsu thresholding algorithm on the Sentinel-1 SAR time series.
Remotesensing 14 05721 g009
Figure 10. Visual comparison of surface water delineation derived from Sentinel-1 VH images (left column) and Sentinel-2 Full Resolution Browse images (right column), during three main periods (rice sowing period—first row, flood event—second row, and rice’s maturation stage—third row).
Remotesensing 14 05721 g010
Figure 11. Histograms of Sentinel-1 VH (a), Sentinel-2 NDWI (b), and Sentinel-2 MNDWI (c) images acquired on 11 April 2017. The dashed lines in red color are the optimal Otsu thresholds.
Remotesensing 14 05721 g011
Figure 12. A comparison of surface water maps using the automatic Otsu threshold on the Sentinel-2 NDWI and MNDWI images for three main periods similar to Figure 10. The left column is water detection (blue color) using the automatic Otsu method on the NDWI images. The middle column is the Sentinel-2 Full Resolution Browse images. The right column is water detection (blue color) using the automatic Otsu method on the MNDWI images.
Remotesensing 14 05721 g012
Figure 13. Statistical comparison of water delineation derived from the SAR Sentinel-1 VH images and the Sentinel-2 MNDWI images in the river areas (left) and paddy fields (right).
Remotesensing 14 05721 g013
Figure 14. The percentage of water pixels in the initial surface water map on 12 March 2017 over time. The dashed line in gray color (5 May 2017) presents the actual starting time ( t s t a r t ) for the flood monitoring algorithm.
Remotesensing 14 05721 g014
Figure 15. Flood extent maps during the flood event in 2017 using the change detection-based time series analyses on the derived surface water maps derived from the Sentinel-1 SAR data.
Remotesensing 14 05721 g015
Figure 16. Percentage of the flooded area in An Giang province in 2017–2018.
Remotesensing 14 05721 g016
Table 1. Sentinel-1 data. The acquisition date is sorted by line corresponding to each month.
Sentinel1A/1B SAR C-Band (5.405 GHz)
Product levelGround Range Detected High Resolution (GRDH)
Acquisition modeInterferometric Wide swath (IW)
Incidence angles30.4° to 46.2°
Revisit time6 days
Spatial resolution10 × 10 m
Swath250 km
PolarizationVH and VV
Acquisition date
(YYYY.MM.DD)
2017.03.12; 2017.03.24; 2017.03.30
2017.04.05; 2017.04.11; 2017.04.17; 2017.04.23; 2017.04.29
2017.05.05; 2017.05.11; 2017.05.17; 2017.05.23; 2017.05.29
2017.06.04; 2017.06.10; 2017.06.16; 2017.06.22; 2017.06.28
2017.07.04; 2017.07.10; 2017.07.16; 2017.07.22; 2017.07.28
2017.08.03; 2017.08.09; 2017.08.15; 2017.08.21; 2017.08.27
2017.09.02; 2017.09.08; 2017.09.14; 2017.09.20; 2017.09.26
2017.10.02; 2017.10.08; 2017.10.14; 2017.10.20; 2017.10.26
2017.11.01; 2017.11.07; 2017.11.13; 2017.11.19; 2017.11.25
2017.12.01; 2017.12.07; 2017.12.13; 2017.12.19; 2017.12.25; 2017.12.31
2018.01.06; 2018.01.12; 2018.01.18; 2018.01.24; 2018.01.30
2018.02.05; 2018.02.11; 2018.02.17; 2018.02.23
2018.03.01; 2018.03.07; 2018.03.13; 2018.03.19; 2018.03.25; 2018.03.31
Table 2. Sentinel-2 data. The acquisition date is sorted by line corresponding to each month.
Sentinel2A/2B
Product level1C—Top of Atmosphere (TOA)
TileT48PWS
Revisit time5 days with different viewing angles
Spatial resolution10 m to 60 m
Cloud coverLess than 50%
ConditionAcquisition date < 1 day compared to Sentinel-1 image
Acquisition date
(YYYY.MM.DD)
2017.03.12
2017.04.11
2017.07.10
2017.10.08
2017.12.12
2018.01.11
2018.02.05; 2018.02.10
2018.03.12; 2018.03.31
Publisher’s Note: MDPI stays neutral with regard to jurisdictional claims in published maps and institutional affiliations.

