Article

Frequency Spectrum Intensity Attention Network for Building Detection from High-Resolution Imagery

School of Communications and Information Engineering, Xi’an University of Posts and Telecommunications, Xi’an 710121, China
*
Author to whom correspondence should be addressed.
Remote Sens. 2022, 14(21), 5457; https://doi.org/10.3390/rs14215457
Submission received: 9 September 2022 / Revised: 26 October 2022 / Accepted: 28 October 2022 / Published: 30 October 2022
(This article belongs to the Topic Computational Intelligence in Remote Sensing)

Abstract

:
Computational intelligence techniques have been widely used for automatic building detection from high-resolution remote sensing imagery and especially the methods based on neural networks. However, existing methods do not pay attention to the value of high-frequency and low-frequency information in the frequency domain for feature extraction of buildings in remote sensing images. To overcome these limitations, this paper proposes a frequency spectrum intensity attention network (FSIANet) with an encoder–decoder structure for automatic building detection. The proposed FSIANet mainly involves two innovations. One, a novel and plug-and-play frequency spectrum intensity attention (FSIA) mechanism is devised to enhance feature representation by evaluating the informative abundance of the feature maps. The FSIA is deployed after each convolutional block in the proposed FSIANet. Two, an atrous frequency spectrum attention pyramid (AFSAP) is constructed by introducing FSIA in widely used atrous spatial pyramid pooling. The AFSAP is able to select the features with high response to building semantic features at each scale and weaken the features with low response, thus enhancing the feature representation of buildings. The proposed FSIANet is evaluated on two large public datasets (East Asia and Inria Aerial Image Dataset), which demonstrates that the proposed method can achieve the state-of-the-art performance in terms of F1-score and intersection-over-union.

1. Introduction

With the development of satellite, aviation, and unmanned aerial vehicle (UAV) technology, huge amounts of high-resolution (HR) remote sensing images have been captured in a constant stream [1,2,3]. These HR remote sensing images have been applied to land cover classification [4,5,6], change detection [7,8,9], target recognition [10,11], and image restoration and registration [12,13], for example. This brings opportunities for us to observe fine objects such as buildings, roads, vehicles, etc. Among them, buildings are one of the most important targets in the surface coverage of remote sensing images. Therefore, building detection or extraction has become a hot topic of study, as it plays a crucial role in digital city construction and management [11,14,15] and sustainable urban development [16,17], among other applications.
Although building detection has made some progress in recent years, the widespread use of HR remote sensing images from different sensors has brought new challenges to this task [18,19]. These challenges include mainly the following:
(a)
A large number of fine ground targets can be depicted by very-high-resolution aerial imagery, e.g., trees, roads, vehicles, and swimming pools, etc. However, these targets often easily interfere with the identification of buildings due to their similar features (e.g., spectrum, shape, size, structure, etc.).
(b)
In urban areas, tall buildings often have severe geometric distortions caused by fixed sensor imaging angles. This may lead to accurate building detection becoming challenging.
(c)
With the rapid development of urbanization, many cities and rural areas are interspersed with tall buildings and short buildings. Tall buildings often exhibit large shadows when imaged by the sun. This phenomenon may not only make it difficult to accurately detect tall buildings themselves, but may also obscure other features (especially short buildings), thus limiting the effective detection of buildings.
Recently, deep-learning-based building detection techniques have been introduced to alleviate these challenges to some extent [20]. State-of-the-art (SOTA) methods are able to improve the performance of building detection through a variety of techniques, including the introduction of multi-scale modules [21,22], edge information [23,24], and attention mechanisms [25,
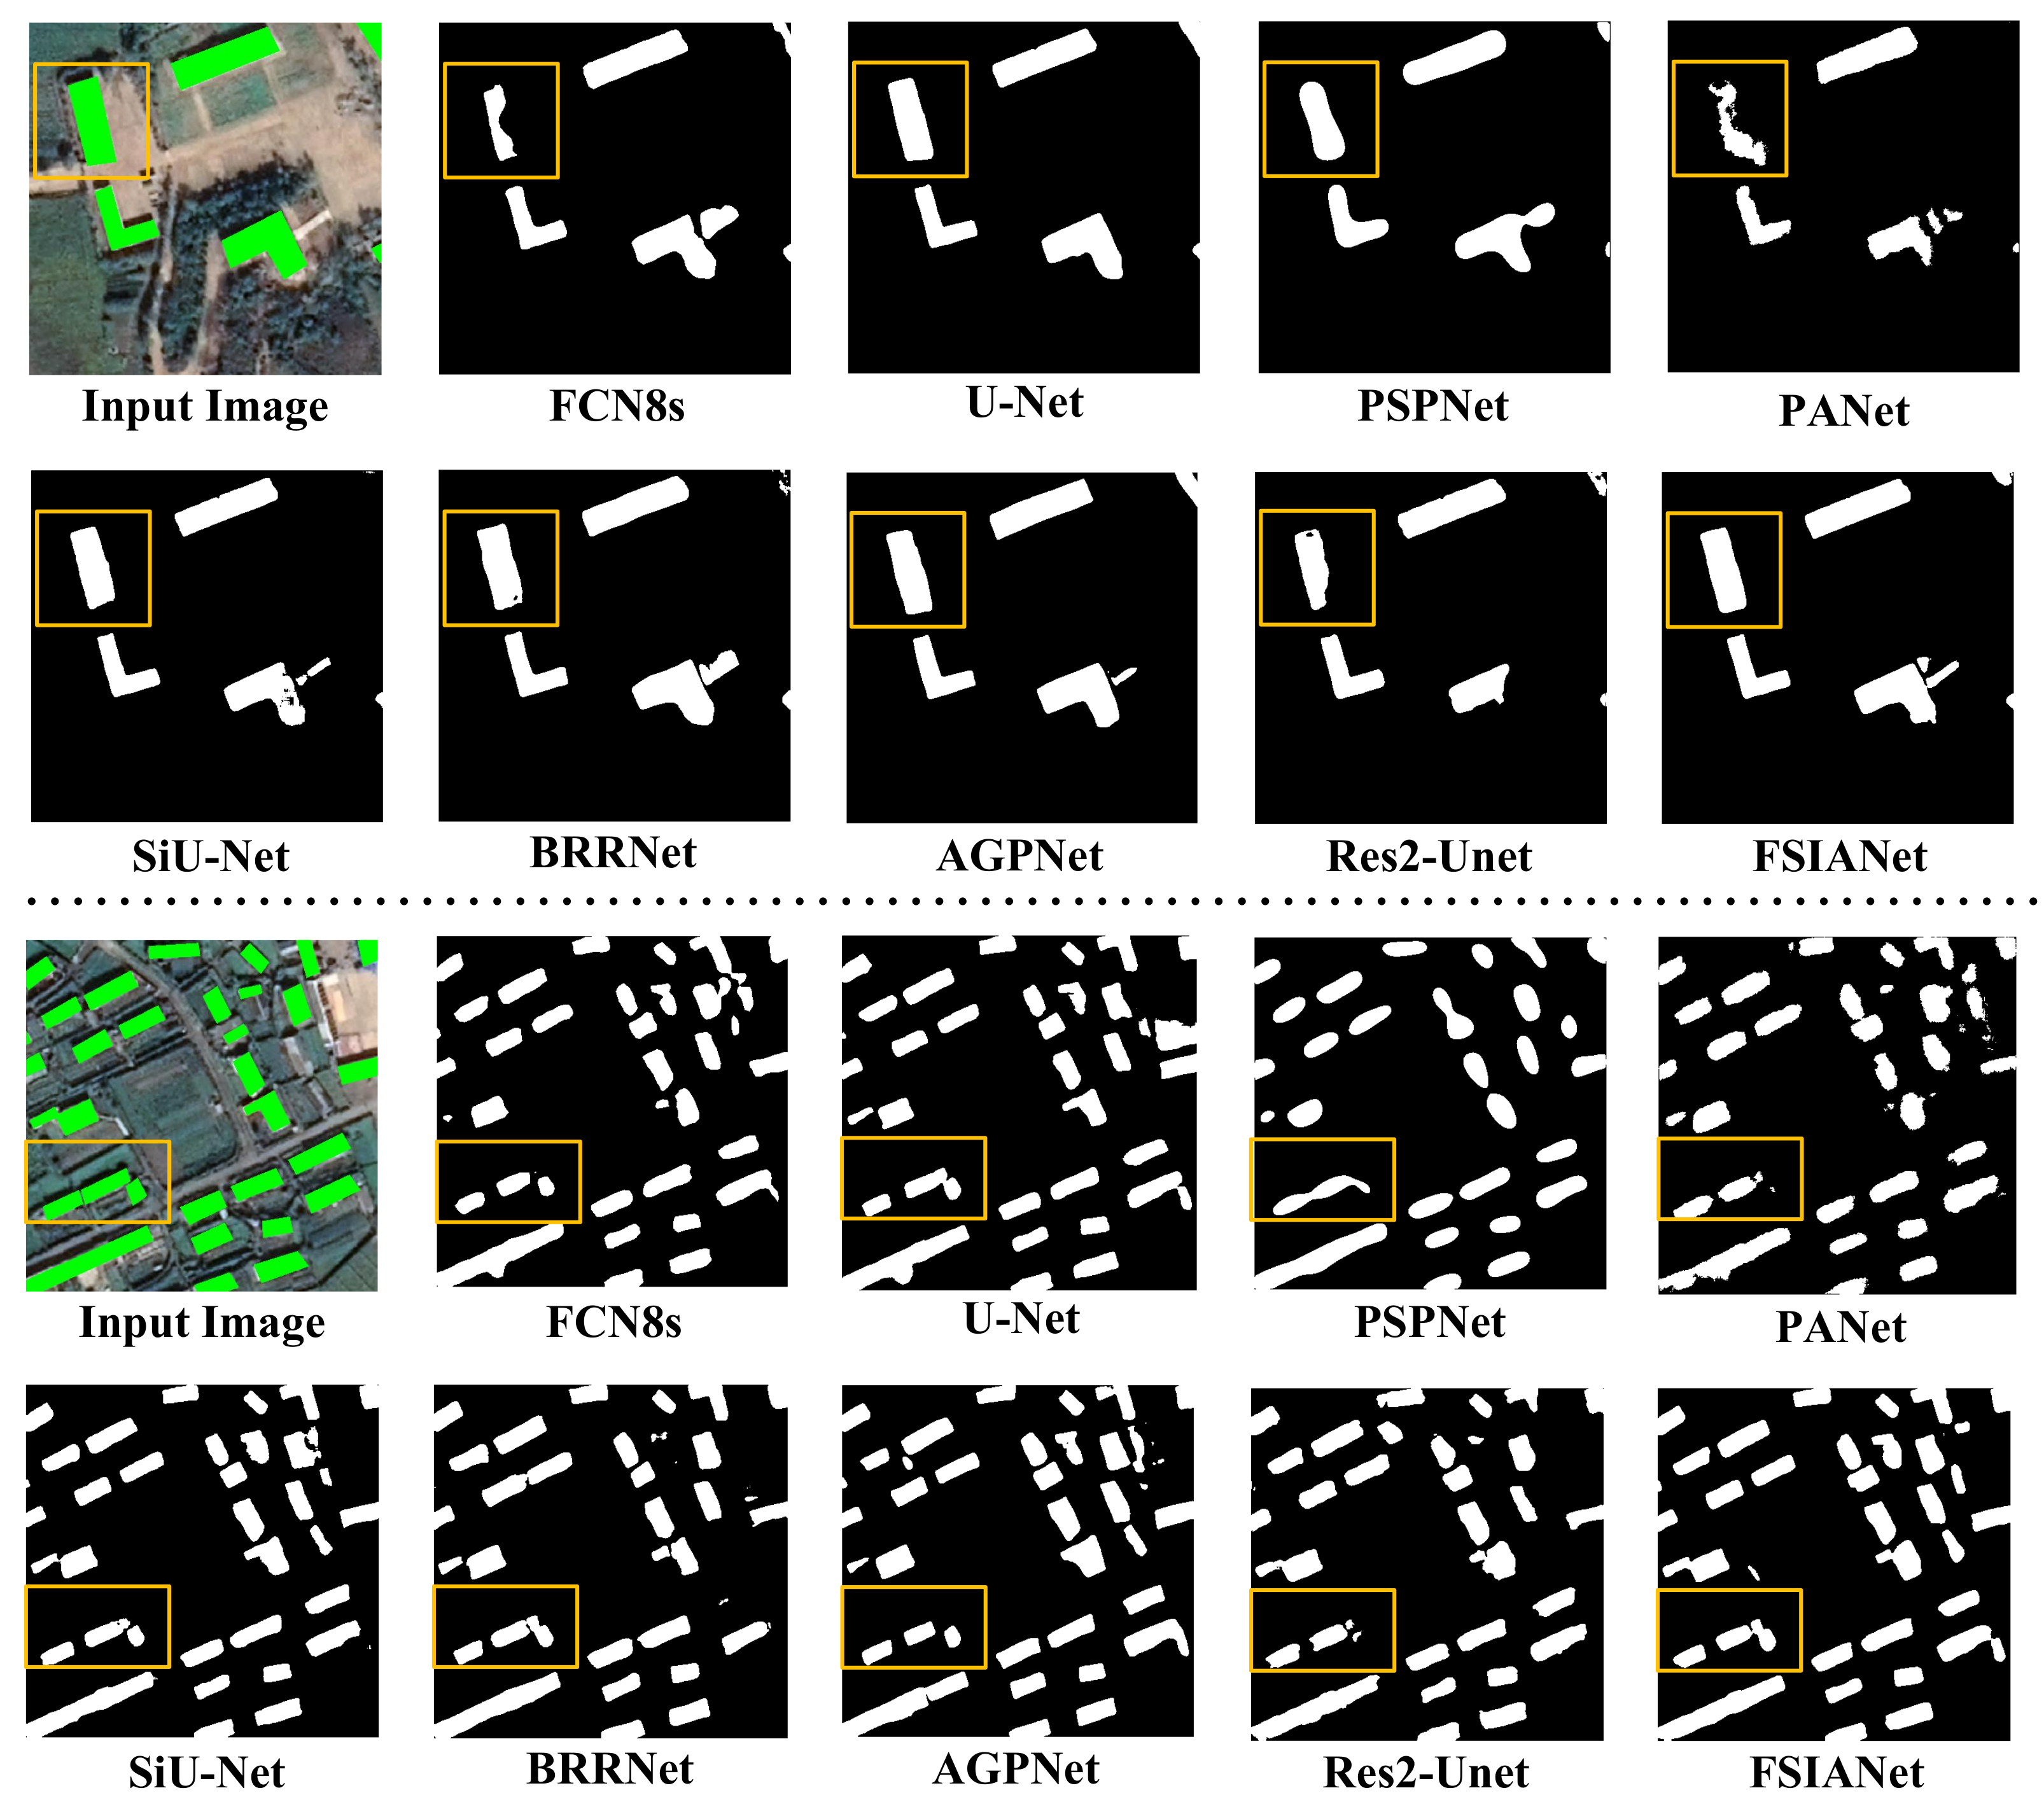
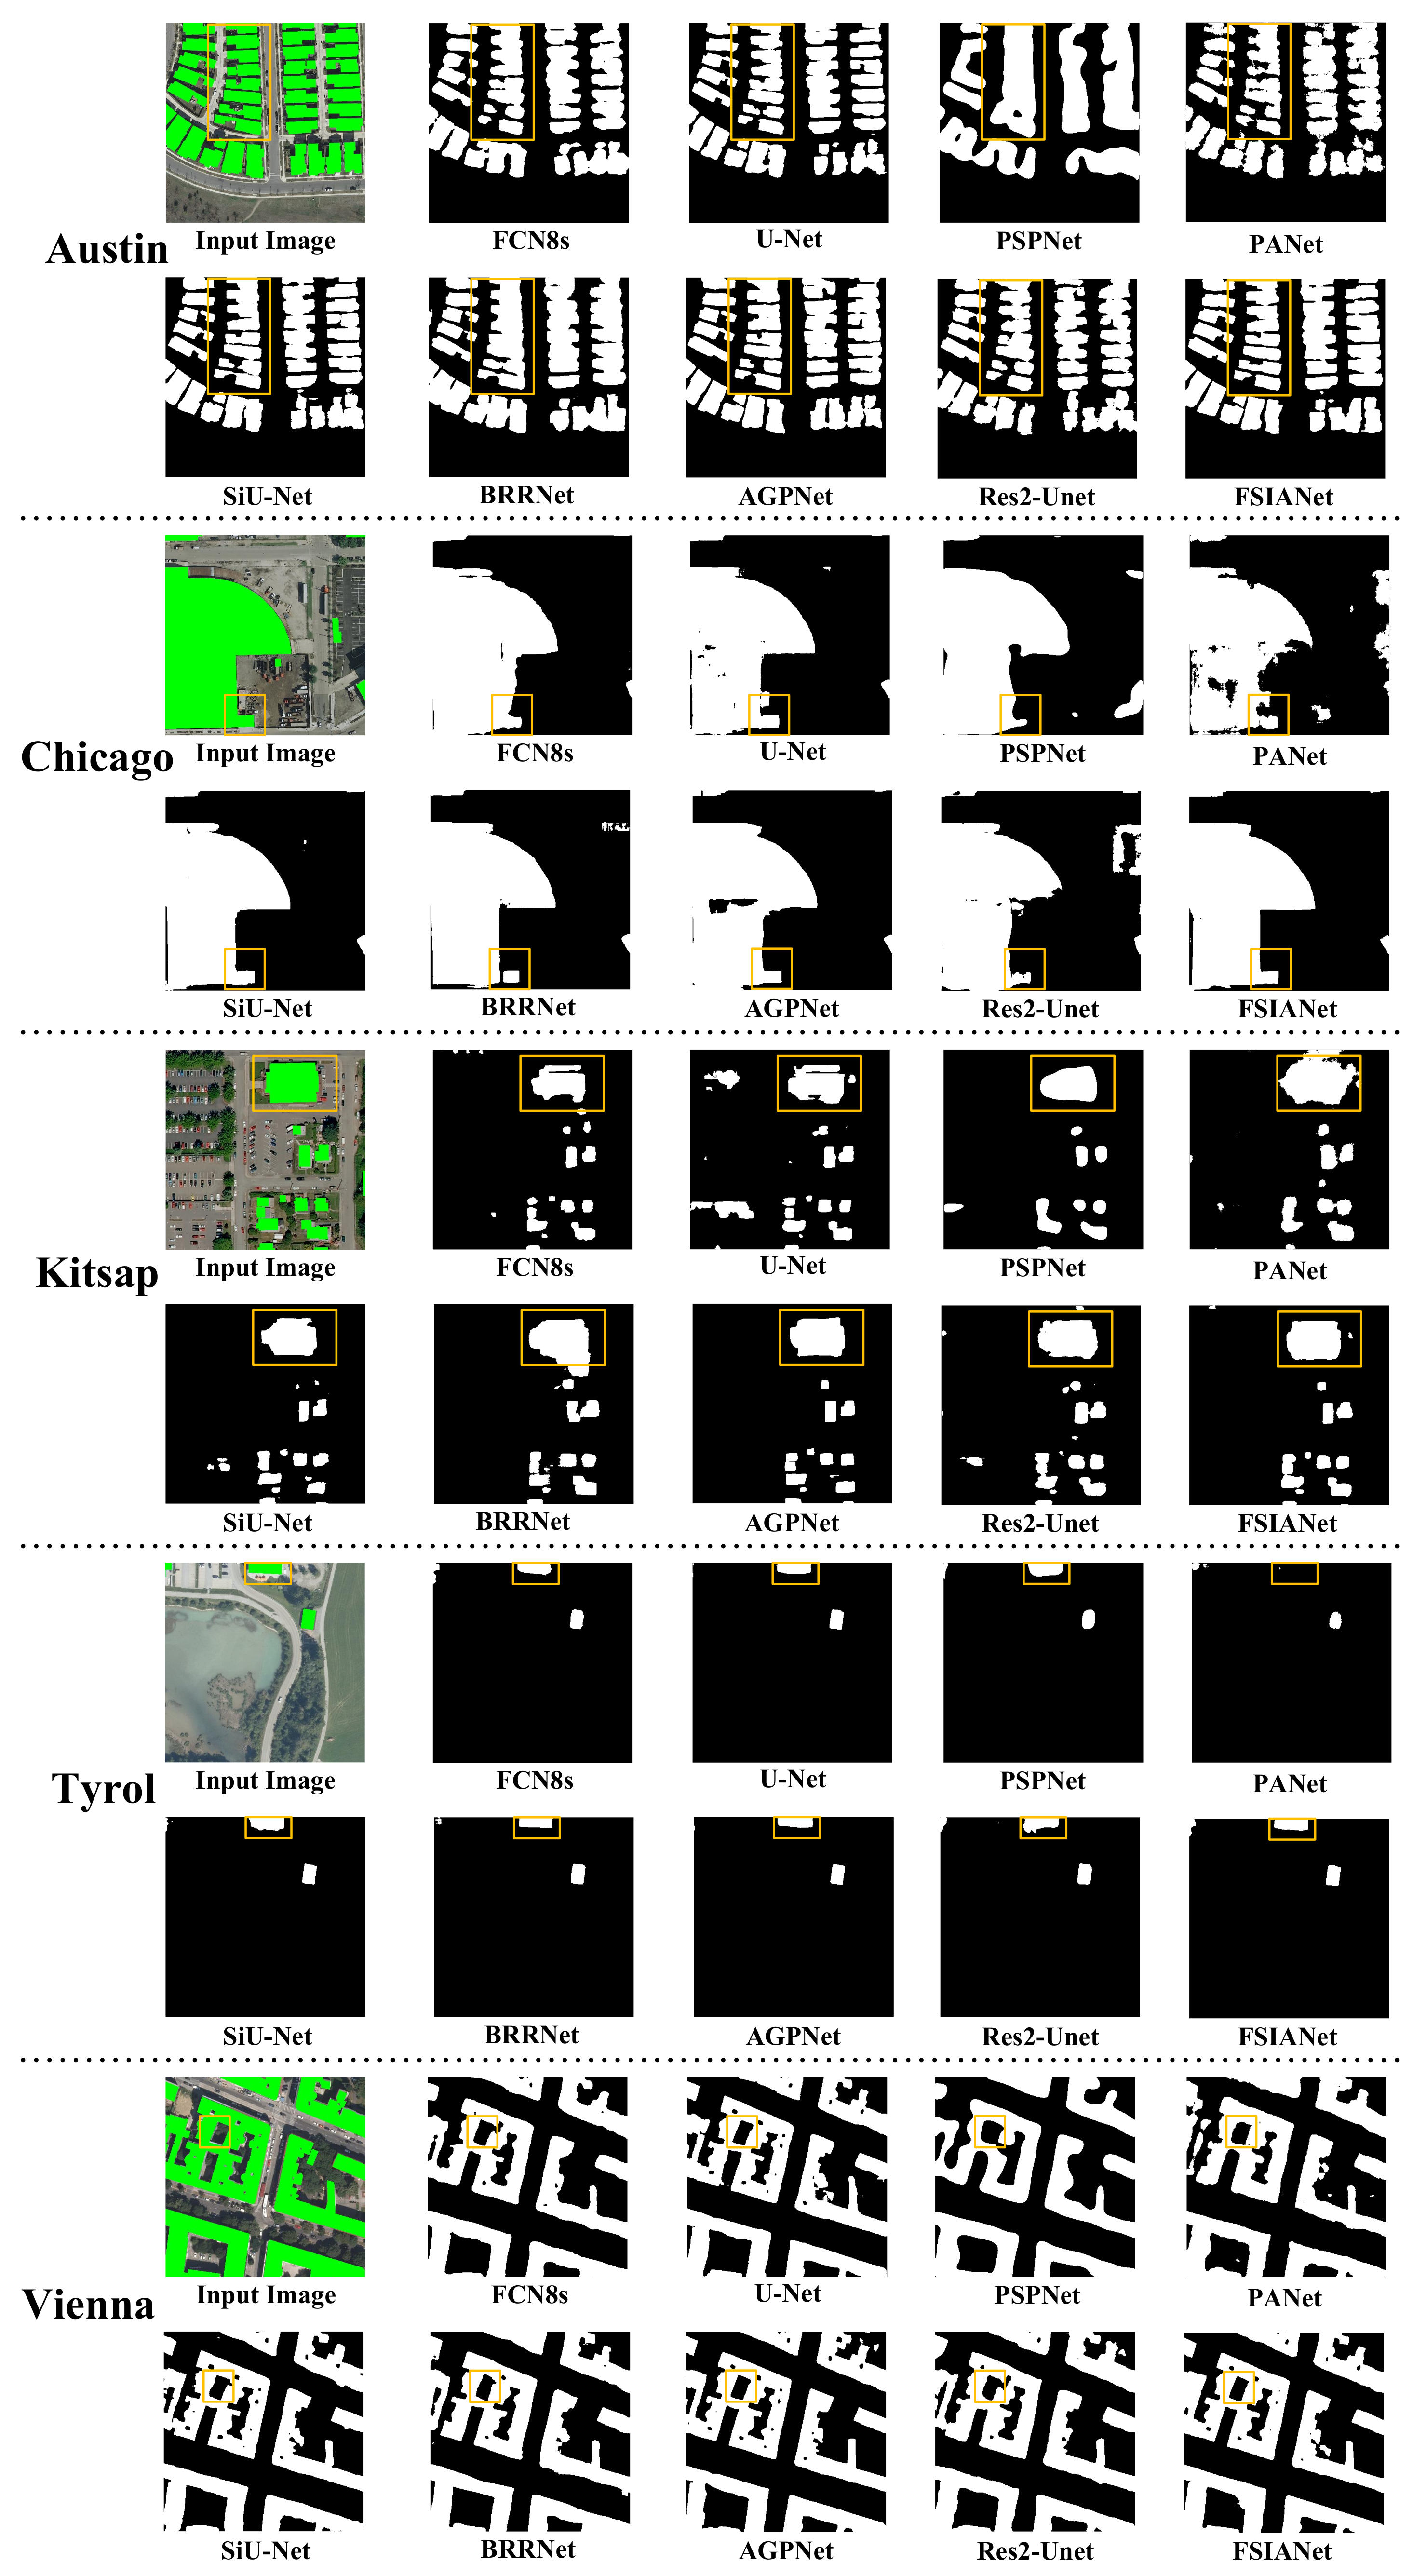
26]. For instance, Ji et al. proposed a Siamese U-Net (SiU-Net) for building extraction, which can enhance multi-scale feature extraction by adding a branch with a small resolution downsampled input image [19]. In [27], a named Building Residual Refine Network (BRRNet) was designed to achieve accurate and complete building extraction. This network is composed of a prediction module and a residual refinement module. In the prediction module, an atrous convolution is employed to capture multi-scale global features. The residual refinement module can refine the initial result of the prediction module, thereby obtaining a more accurate and complete building detection. Yang et al. promoted an edge-aware network, which consists of image segmentation networks and edge perception networks [28]. The network combines the network with edge-aware loss to achieve better performance.
These previous networks have achieved good detection results. Some methods effectively enhance the feature characterization ability of the network by some attention or multi-scale operations, thus improving the detection effect. Some recent approaches propose the introduction of edge information (edge module or edge loss supervision) to help building recognition. However, there are still some limitations to overcome. First, supervised learning strategies by introducing edge loss directly outside the network structure can lead to difficult convergence and less stable results. Second, the combination of roughly applied edge information and convolutional networks is both difficult to be well embedded in the neural network and prone to introduce some interference information from other ground target edges. Finally, edge information tends to represent only high-frequency information of buildings, whereas low-frequency information is equally important in pixel-level prediction tasks. Therefore, enhancing both high-frequency and low-frequency information can further improve the building feature characterization ability.
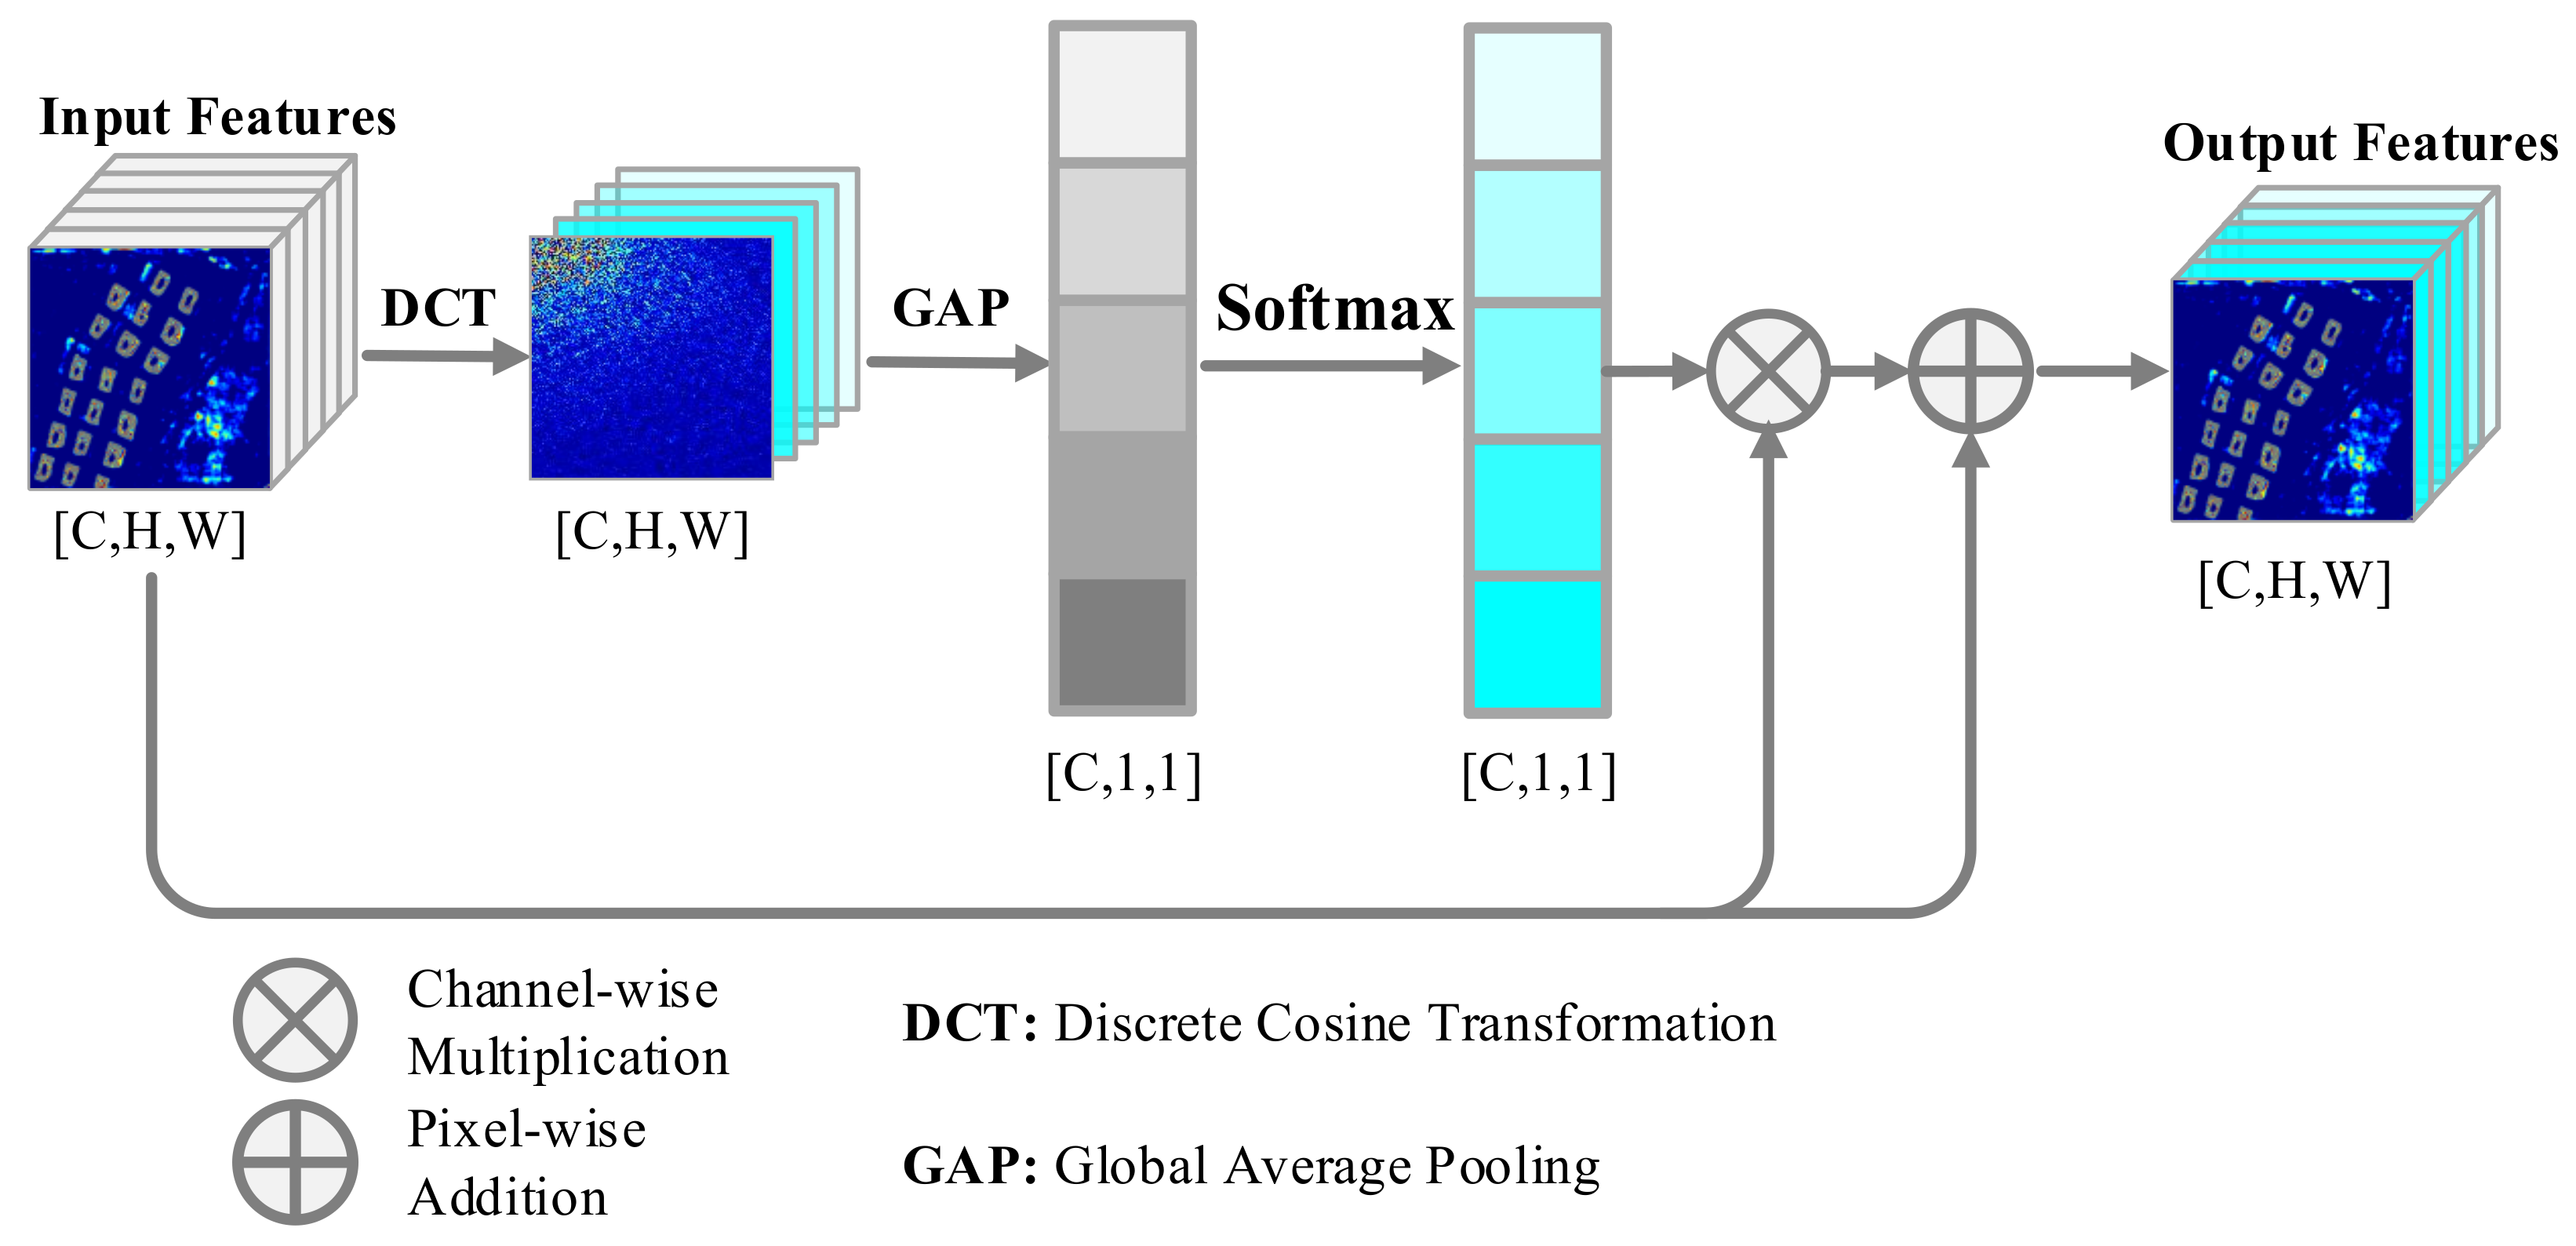
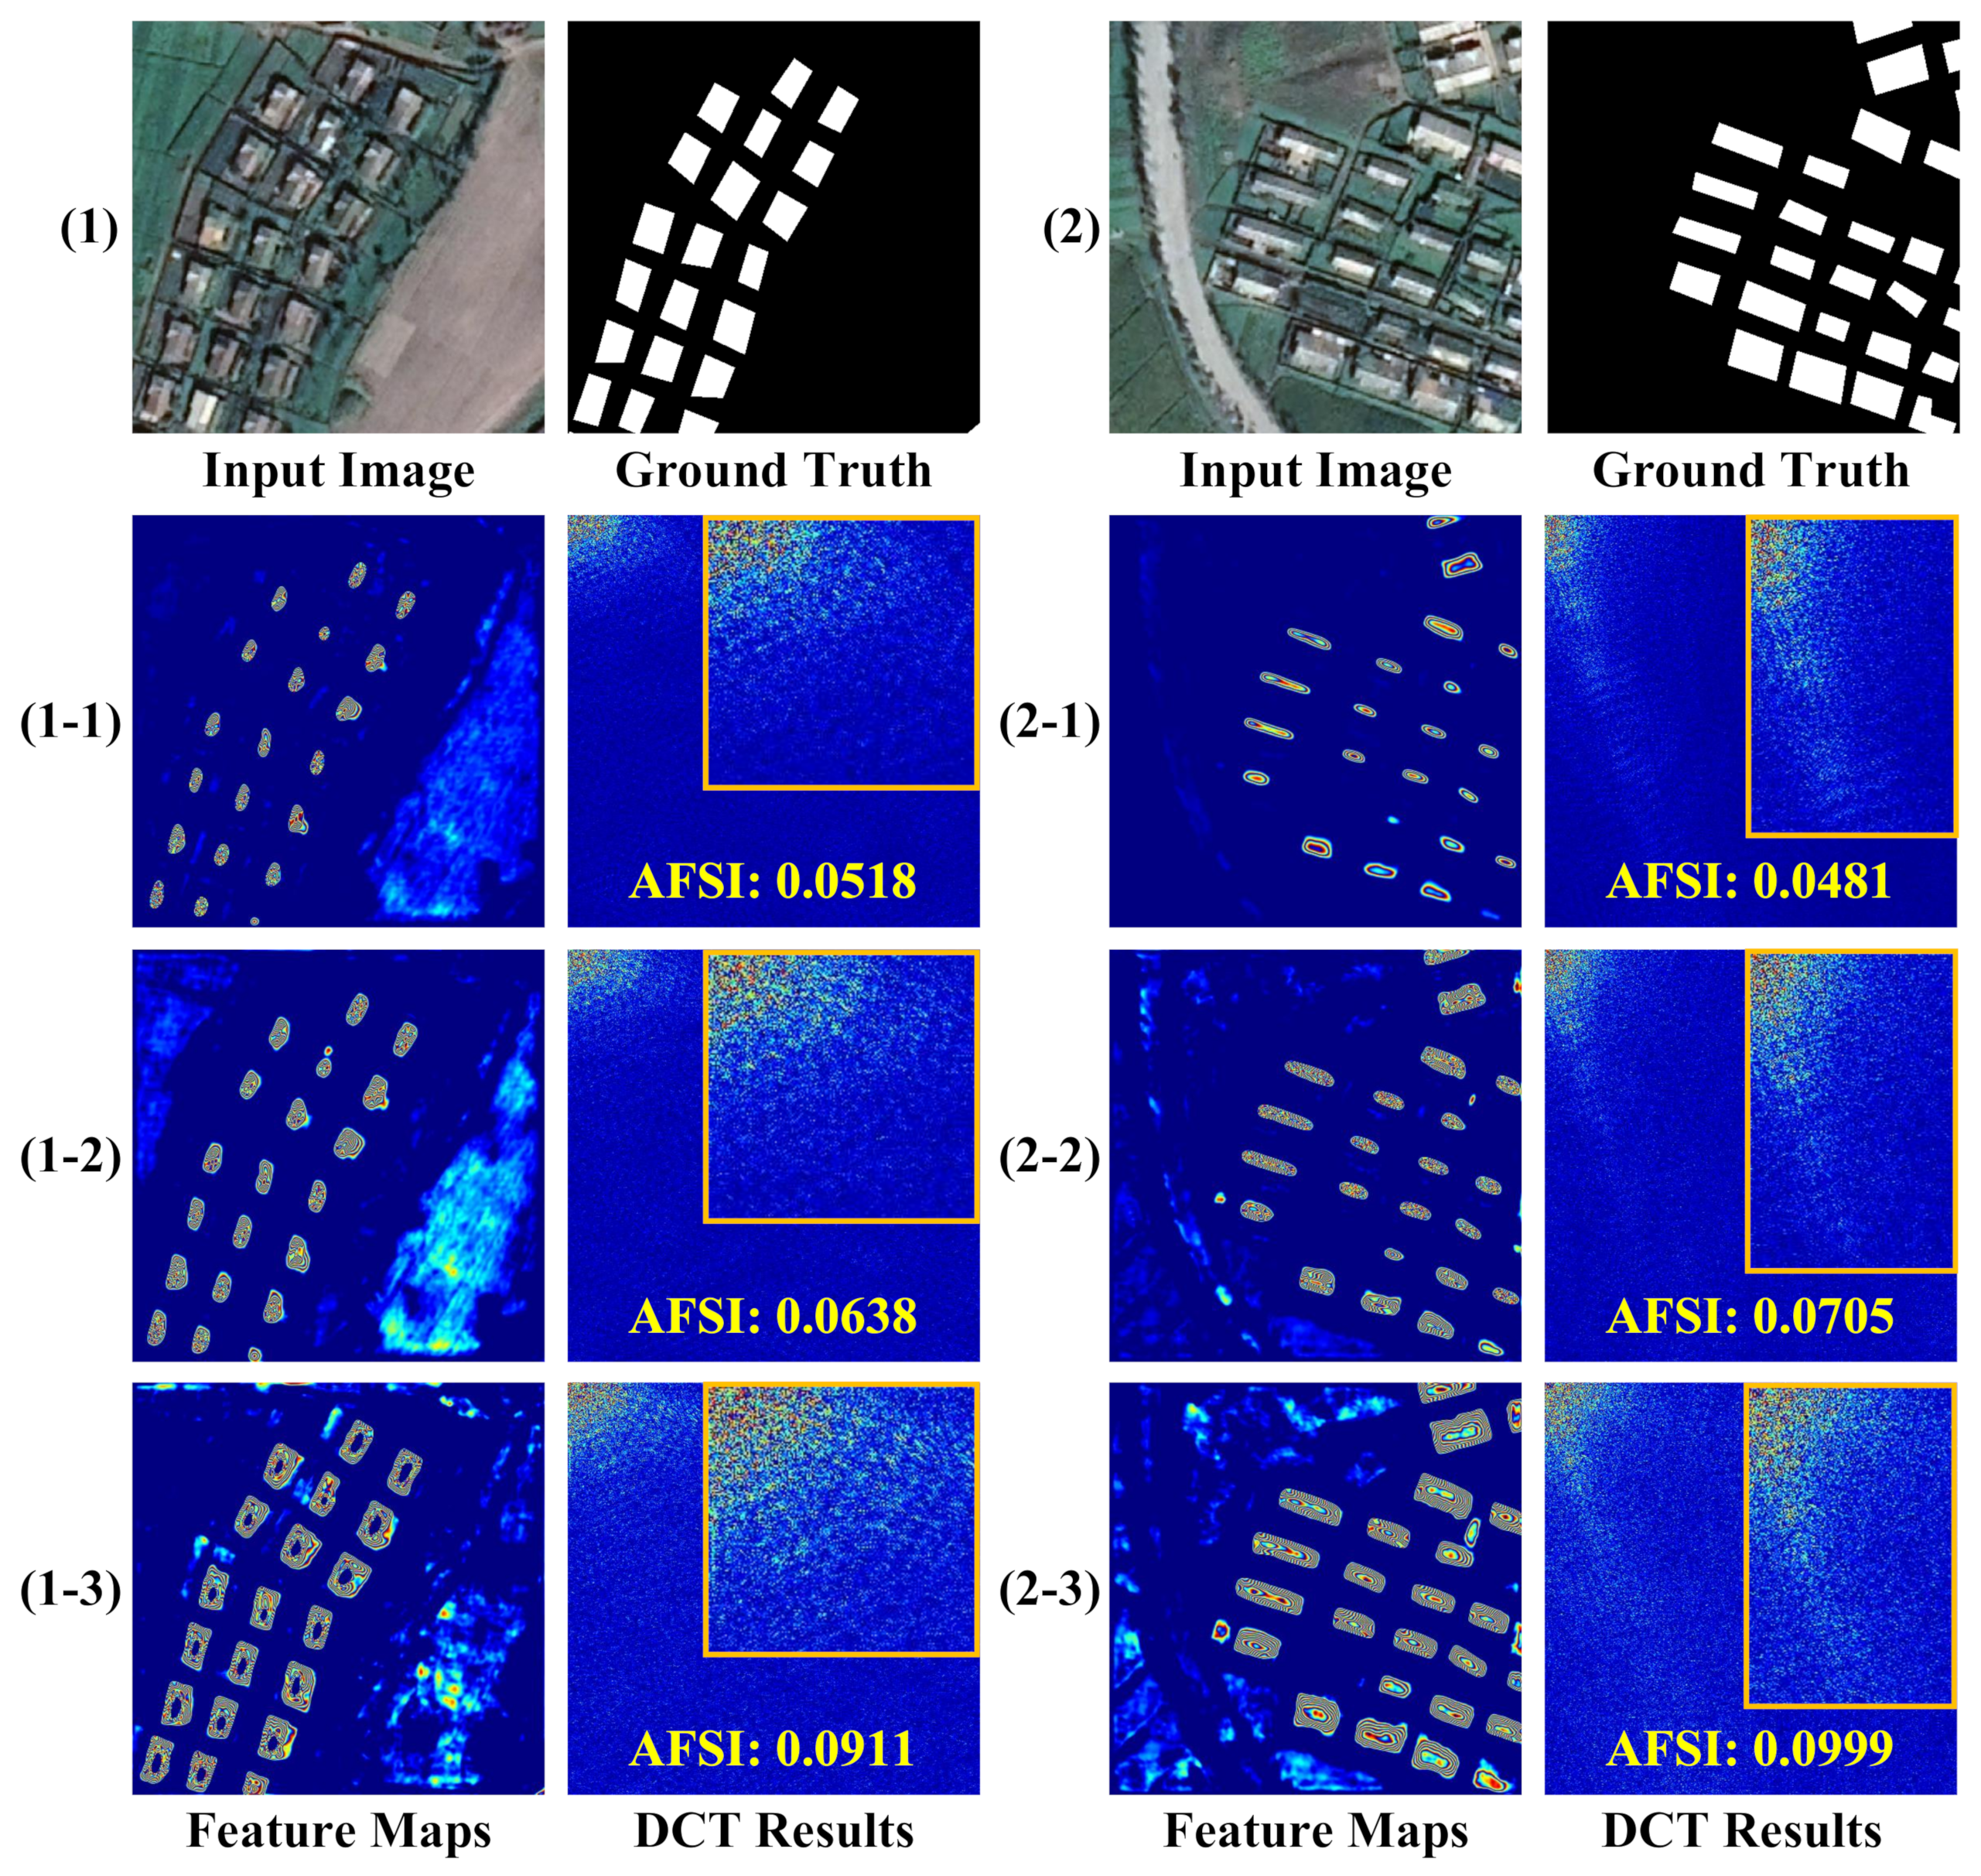
To address the aforementioned issues, our solutions are motivated by the following two aspects. On the one hand, Zheng et al. proposed a high frequency attention Siamese network for building change detection [29]. The study has verified that the introduction of high frequency information can enhance the network’s ability to sense buildings. However, introducing frequency domain information directly in the building detection task can easily introduce interference information from other features, thus limiting the building feature extraction. For this reason, inspired by this approach, we perform feature enhancement by introducing the attention module of the global feature map with frequency domain information. In particular, the average frequency spectral intensity of an image can express the amount of high frequency information contained in the image as a whole. This can effectively evaluate the features that are more conducive to building extraction. Therefore, the introduction of average frequency spectral intensity will be beneficial to building detection tasks. In this case, building detection performance may be further improved when both high-frequency and low-frequency information are considered in the network. On the other hand, atrous spatial pyramid pooling (ASPP) is often used to capture multi-scale features in remote sensing image understanding [30,
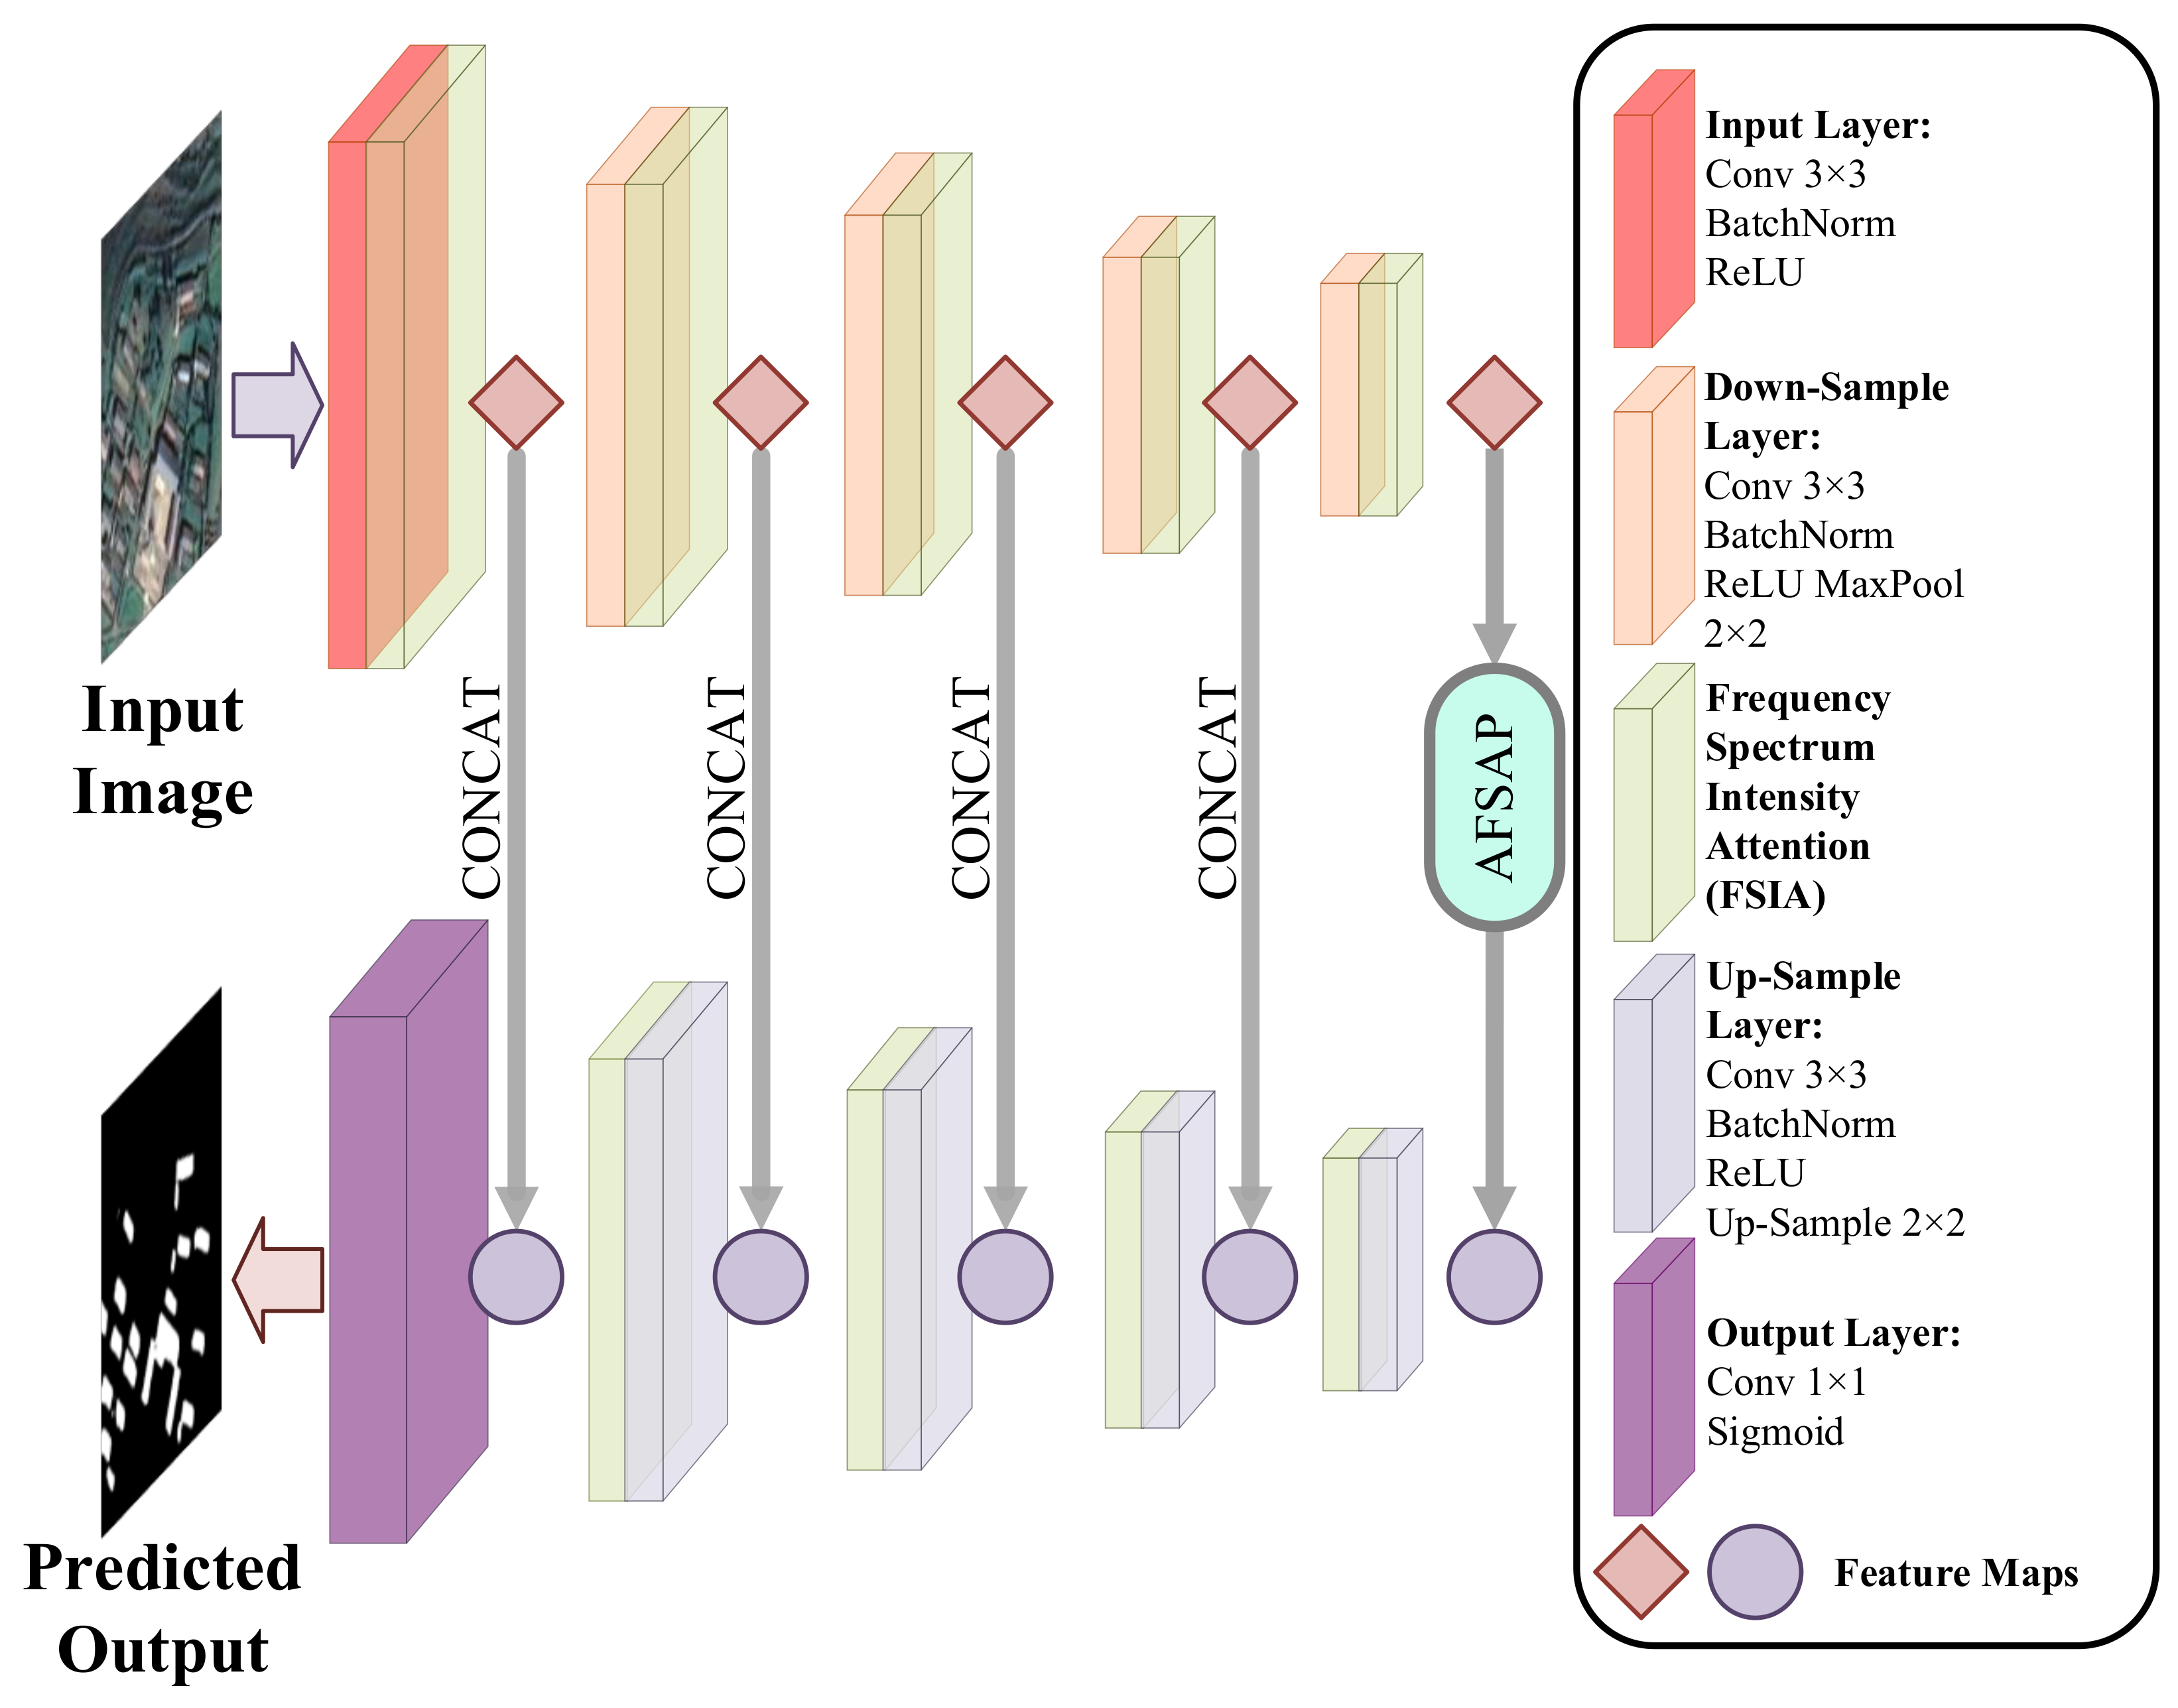
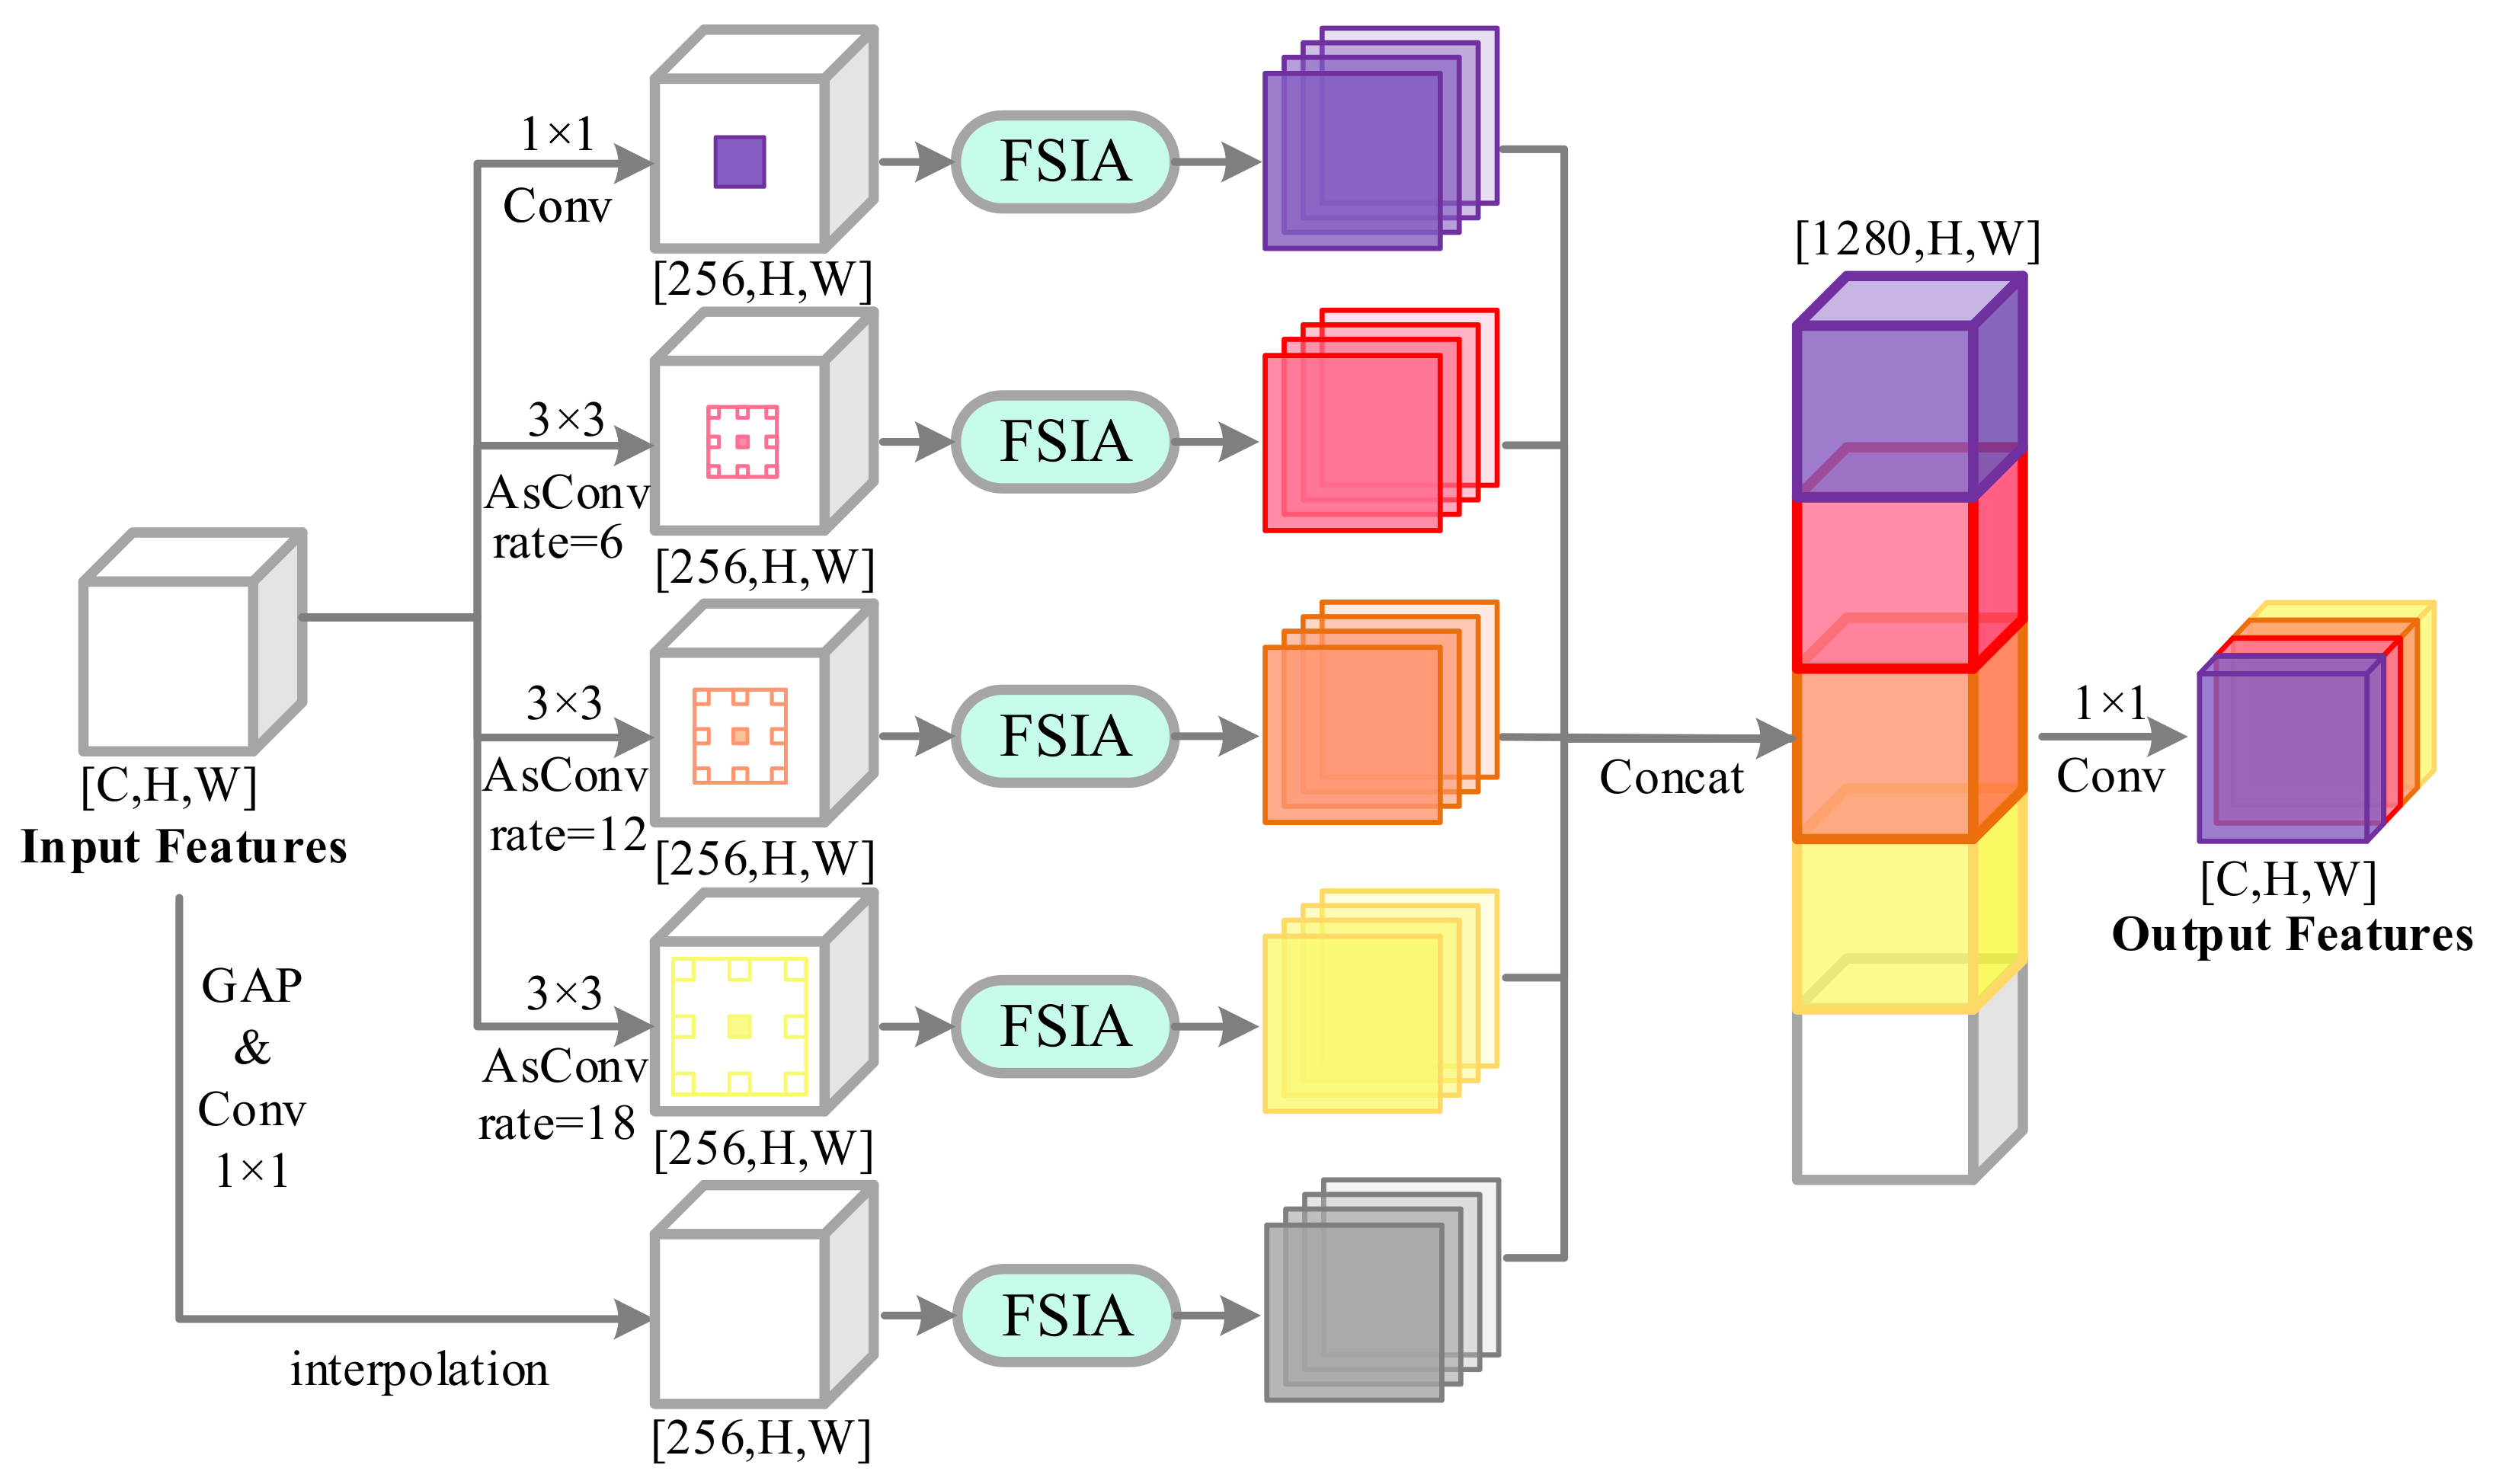
31]. However, different building features can be obtained by using atrous convolution with different atrous rates. In this context, it would enhance the building feature representation if the features with high response to the building semantic features at each scale are emphasized while the features with low response are weakened. According to these motivations, we propose a frequency spectrum intensity attention network (FSIANet) for building detection. The major contributions of this paper include the following three aspects:
(1)
This paper proposes a novel computational intelligence approach for automatic building detection, named FSIANet. In the proposed FSIANet, we devised a plug-and-play FSIA without the requirement of learnable parameters. The FSIA mechanism based on frequency–domain information can effectively evaluate the informative abundance of the feature maps and enhance feature representation by emphasizing more informative feature maps. To this end, The FSIANet can significantly improve the building detection performance.
(2)
An atrous frequency spectrum attention pyramid (AFSAP) is devised in the proposed FSIANet. It is able to mine multi-scale features. At the same time, by introducing FSIA in ASPP, it can emphasize the features with high response to building semantic features at each scale and weaken the features with low response, which will enhance the building feature representation.
(3)
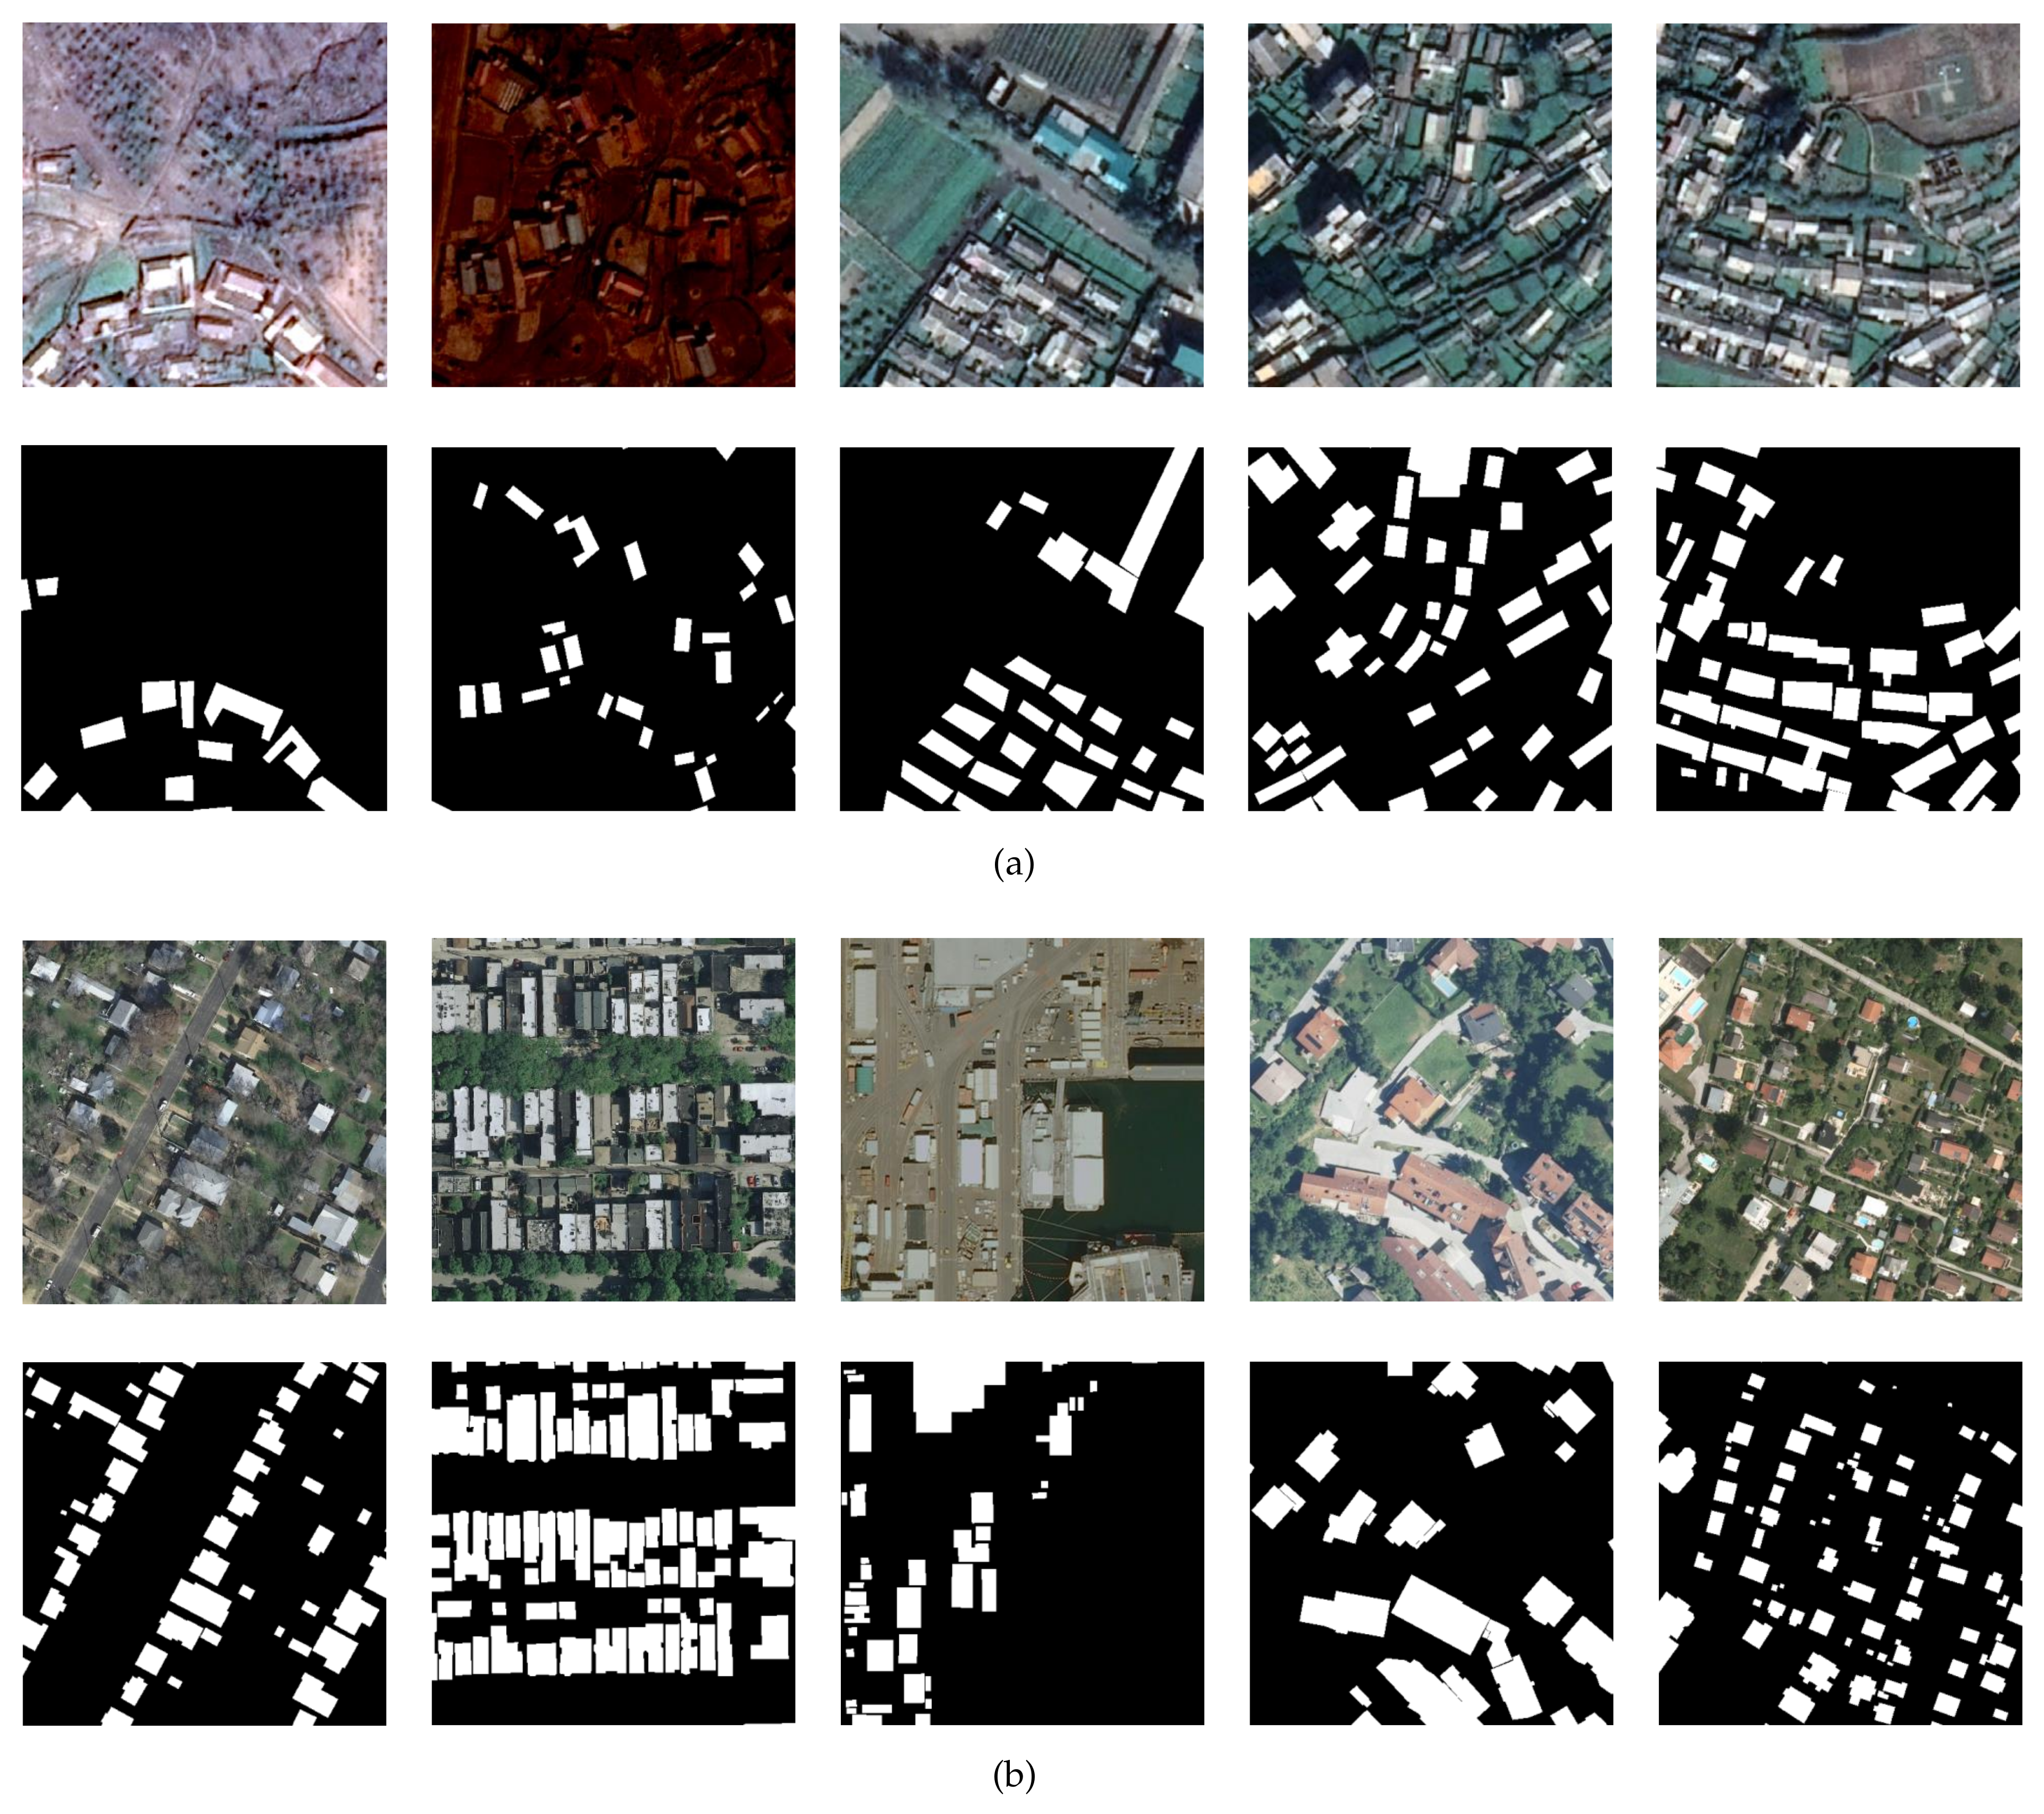
The experimental results on two large public datasets (Inria [18] and East Asia [19]) have demonstrated that the proposed FSIANet can achieve a more effective building detection compared to other classical and SOTA approaches.
The remainder of this article is arranged as follows. Section 2 reviews the relevant literature. Methodology and experiments are presented in Section 3 and Section 4. Finally, Section 6 concludes this article.

2. Related Work

In the past decade, building detection and roof extraction has been a hot research topic in the field of remote sensing. In the early stage, some handcrafted building features are used to implement building detection and extraction, such as pixel shape index [32], morphological profiles [33], etc. For example, Huang et al. combined the information of the morphological building index and the morphological shadow index for building extraction. Other morphological building index-based methods are available in [34,35,36]; Bi et al. proposed a multi-scale filtering building index to reduce the noise of building map in [21]. Although relying on these early hand-made building features can extract buildings from HR impacts, these methods are still poor in terms of accuracy and completeness of building detection and extraction.
With the rapid development of deep learning technology, deep learning has been extensively extended to the field of remote sensing. So far, deep-learning-based building detection approaches have become the most advanced technology. In the early stage, researchers treated the building detection task as an image segmentation task. Therefore, semantic segmentation networks widely used in computer vision can be directly applied to achieve building detection tasks, such as fully convolutional network (FCN) [37], U-Net [38], SegNet [39], etc. The introduction of these deep-learning-based methods leads to a significant improvement in the performance of building detection and extraction compared to hand-crafted feature methods. Nonetheless, with the unprecedented increase in the spatial resolution of images, researchers still found some new challenges, that is, buildings with large or small scales are difficult to accurately identify due to the local receptive fields of convolutional neural networks (CNN).
To overcome the above limitation, many multi-scale CNN have further promoted computer vision [40]. For instance, Zhao et al. designed a pyramid scene parsing network (PSPNet) for semantic segmentation [41]. In the PSPNet [41], a pyramid pooling module is used to capture global features, thereby improving the multi-scale feature extraction capability of the network. In [42], an atrous spatial pyramid pooling (ASPP) is devised to effectively enlarge the receptive field of the network, thereby improving the multi-scale feature representation ability of the network. These multi-scale CNN in computer vision have also been developed in the field of remote sensing [43,44]. Wang et al. promoted a novel FCN for dense semantic labeling [45]. This network can effectively mine multi-scale features by combining the advantages of both encoder-decoder and ASPP. Yu et al. applied an end-to-end segmentation network for pixel-level building detection, which combines the ASPP and skip connections generative adversarial segmentation network to aggregate multi-scale contextual information [31]. Similar research also includes [46,47,48].
In recent years, attention mechanisms have been widely used in deep learning [9,49,50,51], especially computer vision. Attention mechanisms commonly used in computer vision and remote sensing image processing can be divided into two major categories according to the function of the attention mechanism [52,53]: channel attention and spatial attention. Channel attention aims to enhance the feature representation ability of the network by selecting important feature channels [54,55,56]. Spatial attention is able to generate an attention mask in the spatial domain and employ it to emphasize the most task-relevant spatial regions [57,58]. In addition to multi-scale CNN, driven by the attention mechanism, it is another effective technique to improve the performance of building detection. For instance, spatial and channel attention mechanisms are simultaneously used to emphasize spatial regions and feature channels with high semantic responses to buildings, thereby improving the capability of the building feature extraction [59]. In [60], a pyramid attention network (PANet) is promoted to achieve pixel-level semantic segmentation; an encoder-decoder network based on attention-gate and ASPP (AGPNet) is proposed for building detection from UAV images [25]; Guo et al. [61] devised a scene-driven multitask parallel attention network to overcome the large intraclass variance of buildings in different scenes; other attention-based methods are available in [62,63]. Recently, many experts have designed some novel networks dedicated to automatic building detection and extraction. Transformer-based methods are the latest and most compelling new network structures. Wang et al. promoted a vision transformer network for building extraction [44]. A transformer-based multi-scale feature learning network was proposed in [64]. In addition, a new deep architecture, named Res2-Unet, was proposed for building detection [65]. This architecture is an end-to-end structure, which can exploit multi-scale learning at a granular level to extend the receptive field. These methods further advance the development of building detection.
In summary, although some progress has been made in previous work, there are still certain limitations that need to be further addressed. In particular, there is a lack of research on the role of frequency–domain information in building detection tasks. For one thing, the combination of roughly applied edge information and convolutional networks is both difficult to be well embedded in the neural network and prone to introduce some interference information from other ground target edges. For another thing, edge information tends to represent only high-frequency information of buildings, whereas low-frequency information is equally important in pixel-level prediction tasks.

3. Methodology

In this section, the detailed information of the proposed method will be given. First, a brief overview of the proposed FSIANet and the overall procedure will be illustrated in Section 3.1. Second, Section 3.2 will explain the proposed frequency spectrum intensity attention (FSIA) mechanism in detail. Finally, the atrous frequency spectrum attention pyramid (AFSAP) will be demonstrated in Section 3.3.

3.1. Overview of FSIANet

In Figure 1, the framework and overall inference process are illustrated. As shown in the figure, the raw HR remote sensing data are first input into the input layer of FSIANet. Subsequently, the initially extracted feature maps will be input into the down-sample layers followed by FSIA. With the network going deeper, the size of feature maps will be smaller, which contain the semantic and location information of land cover depicted on the input HR images. Then the deepest features will be improved by the proposed AFSAP. At the next stage, the previously extracted feature maps will be gradually gathered and processed by the up-sample layers with FSIA. Introducing previous features can significantly improve the performance of similar networks, which was demonstrated in [38]. During this stage, the spatial and semantic information of different levels will be integrated and fused to annotate building-like land cover at the output layer.

3.2. Frequency Spectrum Intensity Attention

Because attention mechanisms can bring potential performance improvement for deep-learning-based methods, they have been successfully utilized in many remote sensing tasks. However, most of the existing attention modules can reach a satisfying performance only after long-period training with networks. In addition, introducing frequency domain information, which can benefit the performance [29], is usually neglected in most network-based remote sensing methods. According to these facts, a new parameterless frequency-aware attention mechanism can be potential beneficial for deep-learning-based methods. To avoid these conventional problems, a novel attention mechanism, FSIA, is proposed for a better representation of building-like objects in our FSIANet. It aims for better feature representation without extra parameters waiting to be trained. As shown in Figure 2, the FSIA relies on frequency domain information to evaluate the importance of each extracted feature map and thereby enhance them accordingly. Based on the previous description, its mathematical representation can be demonstrated as follows:
First, let F I R C × H × W be the input features, in which C, H, and W represent the channel, height, and width sizes, respectively. The frequency spectrum of F I , F S R C × H × W   , can be denoted as:
F S = D C T F I
where D C T · is the channel-wise discrete cosine transformation, which acquires the frequency domain information. Then the global frequency information vector V S R C × 1 × 1 can be obtained by:
V S = G A P F S
where G A P · denotes the global average pooling. The global frequency spectrum intensity of each channel can be quantified through this way. To significantly enhance the informative feature maps, a channel-wise Softmax function is applied as follows:
V A = S o f t m a x V S
where S o f t m a x · indicates the Softmax function, whereas V A R C × 1 × 1 represents the channel-wise attention score. Given the attention weight V A , the final output of FSIA, F O R C × H × W , can be given as:
F O = F I V A F I
in which ⨂ and ⨁ demonstrate a channel-wise multiplication and a pixel-wise addition, respectively. In conclusion, FSIA tries to achieve a better feature representation in a unique parameterless pipeline, which is introduced in the frequency information. It is exploited numerous times in the proposed method, as it can be applied to features of any spatial size.

3.3. Atrous Frequency Spectrum Attention Pyramid

Except for the accurate semantic recognition of buildings, acquiring precise geographical locations and scales is also significant for fine building annotation in HR images. According to existing related work, multi-scale feature pyramids can help deep-learning-based methods better recognize land cover objects of various scales. In our work, we also propose an attention-based feature pyramid, AFSAP, to obtain better building annotation when dealing with multi-scale objects. Inspired by ASPP, atrous convolution with different dilation rates and global average pooling are utilized in AFSAP to obtain the features with different reception fields. Based on these features, proposed FSIA is employed to acquire finer feature representation, which is able to acquire higher performance improvement compared to bare ASPP. The detailed demonstration of AFSAP is shown in Figure 3. Its detailed process can be represented as the following equations:
Let F D R C × H × W be the deepest features of FSIANet. Then the features with different reception fields F i R F R 256 × H × W i = 1 , 2 , 3 , 4 , 5 can be obtained as follows:
F 1 R F = C o n v 1 × 1 1 F D
F 2 R F = A s C o n v 3 × 3 1 F D
F 3 R F = A s C o n v 3 × 3 2 F D
F 4 R F = A s C o n v 3 × 3 3 F D
F 5 R F =   i n t e r p o l a t i o n   C o n v 1 × 1 2 G A P F D
where C o n v 1 × 1 1 · and C o n v 1 × 1 2 · indicate the convolutional layers with the kernel size of 1 × 1 , which are followed by batch normalization (BN) and ReLU function. In addition, A s C o n v 3 × 3 1 · , A s C o n v 3 × 3 2 · , and A s C o n v 3 × 3 3 · represent 3 × 3 atrous convolution with dilation rates of 6, 12, and 18, respectively. These atrous convolutional layers are also followed by BN and ReLU. The expression i n t e r p o l a t i o n · is the bilinear interpolation that reverts feature size to H × W . At the next stage, these extracted features F i R F are distilled by FSIA and gathered in channel dimension as follows:
F ˙ i R F = F S I A F i R F
F ˜ R F = C o n c a t F ˙ 1 R F , F ˙ 2 R F , F ˙ 3 R F , F ˙ 4 R F , F ˙ 5 R F
With F ˜ R F acquired, the output of AFSAP can be represented as:
F ˜ D = C o n v 1 × 1 3 F ˜ R F
where C o n v 1 × 1 3 · is a convolutional layer with the kernel size of 1 × 1 , which is used to integrate and refine the collected features.
As a summary for AFSAP, the proposed feature pyramid can acquire better recognition for various buildings with the help of multi-scale reception fields provided by atrous convolutions. The proposed FSIA can facilitate and improve the feature extraction and representation of AFSAP, which gives AFSAP the ability to outperform ASPP.

4. Experimental Results and Analysis

In this section, we first briefly introduce three benchmark datasets and measurement indicators required for all experiments. The implementation details of the proposed FSIANet are also given. Subsequently, we will show the experimental results compared with other excellent peers. The ablation experiments of our proposed FSIANet are also analyzed in depth.

4.1. Dataset Descriptions and Evaluation Metrics

In this paper, two commonly used building detection datasets, East Asia Dataset [19] and Inria Aerial Image Dataset [18], are employed in the experiments to fairly validate the effectiveness of all methods. The detailed information of these datasets is presented in Table 1. Furthermore, some examples of these two datasets are shown in Figure 4. It is worth noting that we have processed both benchmark datasets accordingly on the basis of the original datasets.
East Asia Dataset [19] is a sub-dataset of the WHU Building Dataset, which consists of six neighboring satellite images in East Asia. The vector building map was completely hand-drawn in ArcGIS software and contained a total of 34,085 buildings. Specifically, 3153 and 903 aerial image tiles are selected as training and test sets, respectively. This East Asia Dataset is primarily used to evaluate and develop the generalization ability of deep learning models to different data sources but with similar architectural styles in the same geographic area. Therefore, this is recognized as one of the most challenging building extraction datasets.
We perform all the experiments with a total of 180 aerial image tiles covering an area of 405 km2 for the Inria Aerial Image Dataset [18]. It contains a total of five sub-datasets, namely Austin, Chicago, Kitsap, Tyrol, and Vienna, each of which consists of 36 aerial image tiles. We take the first 25 aerial image tiles and the remaining 11 aerial image tiles in each sub-dataset as a training set and a testing set, respectively. Consistent with [19,66], we crop all the aerial images to a size of 512 × 512 pixels. Therefore, the training and test sets in each sub-dataset consist of 2025 and 891 aerial images, respectively. The Inria Aerial Image Dataset was collected at different times and places. It is a very challenging task to accurately extract buildings with huge differences in architectural style, structure, and distribution in each place.
In terms of evaluation metrics, four commonly used building extraction indicators, namely P r e c i s i o n , R e c a l l , F 1 - S c o r e , and I n t e r s e c t i o n   o v e r   U n i o n   ( I o U ) , are employed for pixel-based evaluation to measure the performance of all methods. By convention, T P and T N represent the number of true positive and true negative pixels, respectively; F P and F N denote the number of false positive and false negative pixels, respectively. Based on this, P r e c i s i o n refers to the percentage of area that is predicted to be correct for buildings, which is defined as follows:
P r e c i s i o n ( P ) = T P T P + F P .
The value R e c a l l represents the proportion of positive examples in the building ground truths that is predicted to be correct, which can be calculated as follows:
R e c a l l ( R ) = T P T P + F N .
The F 1 - S c o r e , a comprehensive indicator, is the harmonic mean of precision and recall, so it can be obtained as follows:
F 1 - S c o r e ( F 1 ) = 2 × R × P R + P .
The I o U , also a comprehensive evaluation indicator, represents the ratio of the intersection area over the union area between the ground truths and the building predictions, which can be obtained as follows:
I o U = T P T P + F N + F P .

4.2. Implementation Details

In order to ensure the fairness of the comparison, we reproduce all peers and conduct all the experiments under the following execution conditions. It is worth noting that none of the deep learning models adopt strategies such as data augmentation or pre-training that can improve the performance of building extraction. This can ensure that the above interference is eliminated to the greatest extent, and the reason for the improvement is attributed to the proposed modules or strategies. Specifically, we implemented the experiments on a NVIDIA GTX 3090 based on the Pytorch framework in CUDA 11.6. In terms of parameter setting, we employed the Adam optimizer and the multistep learning rate delay, where the initial learning rate is set to 0.0001. In Adam, the coefficients used to calculate the moving average of the gradient and its square are set to 0.9 and 0.999, respectively. In addition, the batch size is set to 4.

4.3. Comparison with Other Methods

4.3.1. Comparative Algorithms

To demonstrate the effectiveness of our proposed method, seven outstanding peers are selected as comparative methods, and their detailed introductions are as follows:
(1)
FCN8s [37] (2015): This work includes three classic convolutional neural network characteristics, i.e., a fully convolutional network that discards the fully connected layer to adapt to the input of any size image; deconvolution layers that increase the size of the data enable it to output refined results; and a skip-level structure that combines results from different depth layers while ensuring robustness and accuracy.
(2)
U-Net [38] (2015): The proposed U-Net is an earlier model that applies convolutional neural networks to image semantic segmentation, which is built on the basis of FCN8s [37]. U-Net includes contracting paths to extract image features or context and expanding paths for accurate segmentation.
(3)
PSPNet [41] (2017): PSPNet mainly extracts multi-scale information through pyramid pooling, which can better extract global context information and utilize both local and global information to make scene recognition more reliable.
(4)
PANet [60] (2018): PANet proposed a pyramid attention network to exploit the influence of global contextual information in semantic segmentation, combining an attention mechanism and a spatial pyramid to extract precise pixel-annotated dense features instead of using complex diffuse convolution and hand-designed decoder networks.
(5)
SiU-Net [19] (2019): The East Asia Dataset was released in [19]. In addition, SiU-Net is designed with a Siamese fully convolutional network, in which two branches of the network share weights, and the original image and its downsampled counterpart are taken as inputs.
(6)
BRRNet [27] (2020): The prediction module and residual refinement module are the main innovations of BRRNet. The prediction module obtains a larger receptive field by introducing atrous convolutions with different dilation rates. The residual refinement module takes the output of the prediction module as input.
(7)
AGPNet [25] (2021): This is a SOTA ResNet50-based network, which combines grid-based attention gate and ASPP for building detection. This method is similar to ours and is valuable for comparing methods.
(8)
Res2-Unet [65] (2022): Res2-Unet employed granular-level multi-scale learning to expand the receptive field size of each bottleneck layer, focusing on pixels in the border region of complex backgrounds.

4.3.2. Results on the East Asia Dataset

Table 2 shows the quantitative experimental results of P r e c i s i o n , R e c a l l , F 1 - S c o r e , and I o U on the East Asia Dataset. Similar to the results on the Inria Aerial Image Dataset, FSIANet does not perform as well as other comparison algorithms on P r e c i s i o n , but achieves the best results on R e c a l l . In fact, the two are contradictory in some cases. For example, in the extreme case where there are only a very small number of buildings, we only predict one result and it is accurate, then the P r e c i s i o n is 100%, but the R e c a l l is very low, and vice versa. Therefore, two composite indicators, F 1 - S c o r e and I o U , should be given priority consideration. It can be concluded from Table 2 that FSIANet outperforms the SOTA algorithm (i.e., BRRNet) by 1.88% and 2.69% on F 1 - S c o r e and I o U , respectively. Similarly, compared with AGPNet [25], the proposed FSIANet achieves 1.2% and 1.72% improvement on F1 and IoU. The improvement of FSIANet on building detection is mainly attributed to the FSIA mechanism based on frequency domain information, which can effectively evaluate the information abundance of feature maps and enhance feature representation by emphasizing more informative feature maps.
We also provide some visualization results in the East Asia Dataset to further illustrate the effectiveness of our proposed FSIANet. The related visualization comparisons are shown in Figure 5. In the case shown in Figure 5, the buildings in the yellow boxes are not obvious, and there are trees, shadows, and other disturbances around. Algorithms such as FCN8s and PANet have difficulty extracting the approximate building outlines. This is largely because they focus too much on local information and are sensitive to parameters, and their attention mechanisms lack the connection between global information. Res2-Unet, PSPNet, and BRRNet also have certain missed detections. Compared with other methods, the buildings extracted by FSIANet are more accurate and clear on the whole.

4.3.3. Results on the Inria Aerial Image Dataset

The experimental results of the four indicators on the Inria Aerial Image Dataset are shown in Table 3. In terms of P r e c i s i o n , the proposed FSIANet has less obvious advantages compared with other algorithms. However, due to the extreme imbalance of positive and negative samples in many aerial images in the Inria Aerial Image Dataset, the proportion of buildings in some scenes is very low. Therefore, higher accuracy does not mean that the performance of the algorithm for extracting buildings is better. As such, the excellent performance of FSIANet on R e c a l l is also not convincing. Based on this, we have to focus on the performance of the methods on two comprehensive indicators, i.e., F 1 - S c o r e and I o U . On these two metrics, FSIANet achieves the best experimental results, with an overall improvement of 0.45% in F 1 - S c o r e and 0.71% in I o U compared to the existing SOTA methods. Specifically, the improvement of FSIANet is most obvious in the Kitsap and Tyrol regions. It is worth noting that there is a huge gap in the distribution of aerial image buildings in these two regions, with both dense and sparse building scenes. It can be explained that the proposed FSIANet has strong generalization performance to apply in various complex scenarios.
In addition to the experimental results of the quantitative analysis, we also present some representative visualizations of the Inria Aerial Image Dataset. Figure 6 shows the results of binary prediction visualizations of our FSIANet and seven other comparison methods in the Austin, Chicago, Kitsap, Tyrol, and Vienna regions. As in the aerial image example shown in Figure 6, the Inria dataset has some images with very low proportions of buildings. For illustration purposes, we mark the more visible regions with yellow rectangles. It can be concluded from Figure 6 that our proposed FSIANet method outperforms other methods overall, especially in recognizing edge, tiny, and shadow buildings. Furthermore, we can conclude from the examples of moderately dense buildings in Austin and Vienna that FSIANet performs well in the connection of multiple complex buildings. This is because the porous spectral attention pyramid is capable of mining multi-scale features, which can emphasize features with high response to building semantic features at each scale, and weakening features with low response will enhance the representation of building features.

4.4. Ablation Study

To further illustrate the effectiveness of our proposed innovations, ablation experiments on the East Asia Dataset are presented in Table 4. Specifically, the introduction of the FSIA shows much improvement in various indicators compared with only the backbone network. The FSIA module does not require learnable parameters, and the FSIA mechanism based on frequency domain information can effectively evaluate the informative abundance of feature maps and enhance feature representation by emphasizing more informative feature maps. After adding the ASPP, the performance of the network is not significantly improved or even slightly decreased. Therefore, our designed AFSAP in the network is able to mine multi-scale features, which can emphasize features with high response to building semantic features at each scale, while weakening features with low response can enhance the representation of building features.
In addition, we also implemented McNemar’s test to further obviously verify the superiority of our method. Here, McNemar’s test can be computed by Formula (17):
z = N i j N j i N i j + N j i
where N i j denotes the number of pixels that were correctly detected in method i but falsely detected in method j. For McNemar’s test, | z | > 1.96 indicates a significant performance gap between the two methods [67]. McNemar’s test of the ablation study on the East Asia Dataset is listed in Table 5. McNemar’s test results present that the proposed method has a significant performance advantage after introducing FSIA and AFSAP.
Furthermore, to illustrate the rationale for the FSIANet design, the feature maps and discrete cosine transformation (DCT) results on the East Asia Dataset are shown in Figure 7. Here, we define an average frequency spectrum intensity (AFSI), which is the average of the frequency spectral values (computed by DCT) of a feature map. For AFSI, a higher value of AFSI means that building semantic and spatial information is more closely connected. Figure 7 mainly illustrates the visualization of the DCT in three channels of the feature map obtained from FSIANet. For example, in Figure 7(1-1–1-3), the more information the feature map carries, the bigger the corresponding AFSI is. This intuitively illustrates that FSIA can emphasize features with high response to building semantic features at each scale, and weakening features with low response will enhance the representation of building features.

5. Discussion

From the extensive experiments conducted above, it can be concluded that the proposed FSIA mechanism and AFSAP module can efficiently improve the performance of building extraction. In this section, these contributions are further discussed.
In FSIA, we utilize DCT to evaluate how informative a feature is, and reweight the features accordingly. Since its benefit has been confirmed in building extraction, it may potentially improve the performance of CNN-based methods over similar tasks such as change detection and road extraction, even more computer vision tasks. Considering that FSIA has no supervised parameters, it can be used in any CNN-based method without training. However, there are still several disadvantages to this distinctive attention mechanism. The most notable of them is that DCT can be time-consuming when processing feature maps with large spatial sizes. This problem can be further overcome in future work with a lightweight transformation.

6. Conclusions

In this work, efforts have been made to better tackle automatic building detection tasks in HR remote sensing data by proposing some computational-intelligence-based techniques. Namely, a classic encoder-decoder-like end-to-end deep convolutional neural network, FSIANet, with two newly proposed modules, FSIA and AFSAP, is exploited. The FSIA is able to mine useful information from the frequency spectrum of extracted features, thus improving the global feature representation of FSIANet. Notably, it does not need to be trained to acquire reliable ability, which is different from most of the other attention mechanisms. In addition, the ASPP-inspired feature pyramid, AFSAP, is utilized to promote the detection of building-like objects. Compared to ASPP, the AFSAP can achieve more pronounced performance improvement with the help of FSIA. As a result, the proposed FSIANet has successfully outperformed several newly proposed cutting-edge deep-learning-based methods in two widely used large-scale HR remote sensing building detection datasets. For future work, more efforts can be made to expand the usage of frequency–domain-based analysis in the deep-learning-based methods, which have the potential to facilitate finer annotation of buildings in complicated scenes.

Author Contributions

Conceptualization, D.F.; methodology, D.F.; validation, H.C.; investigation, L.Z.; writing—original draft preparation, D.F.; writing—review and editing, H.C. and L.Z. All authors have read and agreed to the published version of the manuscript.

Funding

This work was supported in part by the National Natural Science Foundation of China under Grant 62102314, in part by the Natural Science Basic Research Plan in Shaanxi Province of China under Grants 2021JQ-721, 2021JQ-708, and 2022JQ-635, and in part by the Special Scientific Research Projects of Shaanxi Provincial Department of Education 20JK0918.

Data Availability Statement

Not applicable.

Conflicts of Interest

The authors declare no conflict of interest. The funders had no role in the design of the study; in the collection, analyses, or interpretation of data; in the writing of the manuscript; or in the decision to publish the results.

Abbreviations

AFSAP Atrous Frequency Spectrum Attention Pyramid
ASPP Atrous Spatial Pyramid Pooling
BRRNet Building Residual Refine Network
CNN Convolutional Neural Network
DCT Discrete Cosine Transformation
FCN Fully Convolutional Network
FSIANet Frequency Spectrum Intensity Attention Network
HR High-Resolution
SOTA State-of-the-Art
AFSI Average Frequency Spectrum Intensity

References

  1. Wu, Y.; Ma, W.; Gong, M.; Su, L.; Jiao, L. A novel point-matching algorithm based on fast sample consensus for image registration. IEEE Geosci. Remote Sens. Lett. 2014, 12, 43–47. [Google Scholar] [CrossRef]
  2. Wu, Y.; Li, J.; Yuan, Y.; Qin, A.; Miao, Q.G.; Gong, M.G. Commonality autoencoder: Learning common features for change detection from heterogeneous images. IEEE Trans. Neural Netw. Learn. Syst. 2021. [Google Scholar] [CrossRef] [PubMed]
  3. Li, J.; Li, H.; Liu, Y.; Gong, M. Multi-fidelity evolutionary multitasking optimization for hyperspectral endmember extraction. Appl. Soft Comput. 2021, 111, 107713. [Google Scholar] [CrossRef]
  4. Lv, Z.; Li, G.; Jin, Z.; Benediktsson, J.A.; Foody, G.M. Iterative training sample expansion to increase and balance the accuracy of land classification from VHR imagery. IEEE Trans. Geosci. Remote Sens. 2020, 59, 139–150. [Google Scholar] [CrossRef]
  5. Zhang, M.; Gong, M.; Mao, Y.; Li, J.; Wu, Y. Unsupervised feature extraction in hyperspectral images based on wasserstein generative adversarial network. IEEE Trans. Geosci. Remote Sens. 2018, 57, 2669–2688. [Google Scholar] [CrossRef]
  6. Zhang, M.; Gong, M.; He, H.; Zhu, S. Symmetric all convolutional neural-network-based unsupervised feature extraction for hyperspectral images classification. IEEE Trans. Cybern. 2020. [Google Scholar] [CrossRef]
  7. Lv, Z.; Wang, F.; Cui, G.; Benediktsson, J.A.; Lei, T.; Sun, W. Spatial–Spectral Attention Network Guided With Change Magnitude Image for Land Cover Change Detection Using Remote Sensing Images. IEEE Trans. Geosci. Remote Sens. 2022, 60, 1–12. [Google Scholar] [CrossRef]
  8. Gong, M.; Jiang, F.; Qin, A.K.; Liu, T.; Zhan, T.; Lu, D.; Zheng, H.; Zhang, M. A Spectral and Spatial Attention Network for Change Detection in Hyperspectral Images. IEEE Trans. Geosci. Remote Sens. 2021, 60, 1–14. [Google Scholar] [CrossRef]
  9. Wang, Z.; Jiang, F.; Liu, T.; Xie, F.; Li, P. Attention-Based Spatial and Spectral Network with PCA-Guided Self-Supervised Feature Extraction for Change Detection in Hyperspectral Images. Remote Sens. 2021, 13, 4927. [Google Scholar] [CrossRef]
  10. Shivappriya, S.; Priyadarsini, M.J.P.; Stateczny, A.; Puttamadappa, C.; Parameshachari, B. Cascade object detection and remote sensing object detection method based on trainable activation function. Remote Sens. 2021, 13, 200. [Google Scholar] [CrossRef]
  11. Ghanea, M.; Moallem, P.; Momeni, M. Building extraction from high-resolution satellite images in urban areas: Recent methods and strategies against significant challenges. Int. J. Remote Sens. 2016, 37, 5234–5248. [Google Scholar] [CrossRef]
  12. Singh, D.; Kaur, M.; Jabarulla, M.Y.; Kumar, V.; Lee, H.N. Evolving fusion-based visibility restoration model for hazy remote sensing images using dynamic differential evolution. IEEE Trans. Geosci. Remote Sens. 2022, 60, 1–14. [Google Scholar] [CrossRef]
  13. Wu, Y.; Zhang, Y.; Fan, X.; Gong, M.; Miao, Q.; Ma, W. INENet: Inliers Estimation Network with Similarity Learning for Partial Overlapping Registration. IEEE Trans. Circuits Syst. Video Technol. 2022. [Google Scholar] [CrossRef]
  14. Liu, T.; Gong, M.; Jiang, F.; Zhang, Y.; Li, H. Landslide Inventory Mapping Method Based on Adaptive Histogram-Mean Distance with Bitemporal VHR Aerial Images. IEEE Geosci. Remote Sens. Lett. 2021, 19, 1–5. [Google Scholar] [CrossRef]
  15. Wu, Y.; Liu, Y.; Gong, M.; Gong, P.; Li, H.; Tang, Z.; Miao, Q.; Ma, W. Multi-View Point Cloud Registration Based on Evolutionary Multitasking With Bi-Channel Knowledge Sharing Mechanism. IEEE Trans. Emerg. Top. Comput. Intell. 2022. [Google Scholar] [CrossRef]
  16. Awrangjeb, M.; Lu, G.; Fraser, C. Automatic building extraction from LiDAR data covering complex urban scenes. Int. Arch. Photogramm. Remote Sens. Spat. Inf. Sci. 2014, 40, 25. [Google Scholar] [CrossRef] [Green Version]
  17. Lv, Z.; Liu, T.; Benediktsson, J.A.; Falco, N. Land cover change detection techniques: Very-high-resolution optical images: A review. IEEE Geosci. Remote Sens. Mag. 2021, 10, 44–63. [Google Scholar] [CrossRef]
  18. Maggiori, E.; Tarabalka, Y.; Charpiat, G.; Alliez, P. Can semantic labeling methods generalize to any city? The inria aerial image labeling benchmark. In Proceedings of the 2017 IEEE International Geoscience and Remote Sensing Symposium (IGARSS), Fort Worth, TX, USA, 23–28 July 2017; pp. 3226–3229. [Google Scholar]
  19. Ji, S.; Wei, S.; Lu, M. Fully Convolutional Networks for Multisource Building Extraction From an Open Aerial and Satellite Imagery Data Set. IEEE Trans. Geosci. Remote Sens. 2019, 57, 574–586. [Google Scholar] [CrossRef]
  20. Liu, T.; Gong, M.; Lu, D.; Zhang, Q.; Zheng, H.; Jiang, F.; Zhang, M. Building Change Detection for VHR Remote Sensing Images via Local–Global Pyramid Network and Cross-Task Transfer Learning Strategy. IEEE Trans. Geosci. Remote Sens. 2021, 60, 1–17. [Google Scholar] [CrossRef]
  21. Bi, Q.; Qin, K.; Zhang, H.; Zhang, Y.; Li, Z.; Xu, K. A multi-scale filtering building index for building extraction in very high-resolution satellite imagery. Remote Sens. 2019, 11, 482. [Google Scholar] [CrossRef]
  22. Ma, J.; Wu, L.; Tang, X.; Liu, F.; Zhang, X.; Jiao, L. Building extraction of aerial images by a global and multi-scale encoder-decoder network. Remote Sens. 2020, 12, 2350. [Google Scholar] [CrossRef]
  23. Xia, L.; Zhang, X.; Zhang, J.; Yang, H.; Chen, T. Building extraction from very-high-resolution remote sensing images using semi-supervised semantic edge detection. Remote Sens. 2021, 13, 2187. [Google Scholar] [CrossRef]
  24. Liao, C.; Hu, H.; Li, H.; Ge, X.; Chen, M.; Li, C.; Zhu, Q. Joint learning of contour and structure for boundary-preserved building extraction. Remote Sens. 2021, 13, 1049. [Google Scholar] [CrossRef]
  25. Deng, W.; Shi, Q.; Li, J. Attention-gate-based encoder–decoder network for automatical building extraction. IEEE J. Sel. Top. Appl. Earth Obs. Remote Sens. 2021, 14, 2611–2620. [Google Scholar] [CrossRef]
  26. Zhao, H.; Zhang, H.; Zheng, X. A Multiscale Attention-Guided UNet++ with Edge Constraint for Building Extraction from High Spatial Resolution Imagery. Applied Sci. 2022, 12, 5960. [Google Scholar] [CrossRef]
  27. Shao, Z.; Tang, P.; Wang, Z.; Saleem, N.; Yam, S.; Sommai, C. BRRNet: A fully convolutional neural network for automatic building extraction from high-resolution remote sensing images. Remote Sens. 2020, 12, 1050. [Google Scholar] [CrossRef] [Green Version]
  28. Yang, G.; Zhang, Q.; Zhang, G. EANet: Edge-aware network for the extraction of buildings from aerial images. Remote Sens. 2020, 12, 2161. [Google Scholar] [CrossRef]
  29. Zheng, H.; Gong, M.; Liu, T.; Jiang, F.; Zhan, T.; Lu, D.; Zhang, M. HFA-Net: High frequency attention siamese network for building change detection in VHR remote sensing images. Pattern Recognit. 2022, 129, 108717. [Google Scholar] [CrossRef]
  30. He, H.; Yang, D.; Wang, S.; Wang, S.; Li, Y. Road extraction by using atrous spatial pyramid pooling integrated encoder-decoder network and structural similarity loss. Remote Sens. 2019, 11, 1015. [Google Scholar] [CrossRef] [Green Version]
  31. Yu, M.; Zhang, W.; Chen, X.; Liu, Y.; Niu, J. An End-to-End Atrous Spatial Pyramid Pooling and Skip-Connections Generative Adversarial Segmentation Network for Building Extraction from High-Resolution Aerial Images. Appl. Sci. 2022, 12, 5151. [Google Scholar] [CrossRef]
  32. Zhang, L.; Huang, X.; Huang, B.; Li, P. A pixel shape index coupled with spectral information for classification of high spatial resolution remotely sensed imagery. IEEE Trans. Geosci. Remote Sens. 2006, 44, 2950–2961. [Google Scholar] [CrossRef]
  33. Mongus, D.; Lukač, N.; Žalik, B. Ground and building extraction from LiDAR data based on differential morphological profiles and locally fitted surfaces. ISPRS J. Photogramm. Remote Sens. 2014, 93, 145–156. [Google Scholar] [CrossRef]
  34. Huang, X.; Zhang, L. A multidirectional and multiscale morphological index for automatic building extraction from multispectral GeoEye-1 imagery. Photogramm. Eng. Remote Sens. 2011, 77, 721–732. [Google Scholar] [CrossRef]
  35. Huang, X.; Zhang, L.; Zhu, T. Building change detection from multitemporal high-resolution remotely sensed images based on a morphological building index. IEEE J. Sel. Top. Appl. Earth Obs. Remote Sens. 2013, 7, 105–115. [Google Scholar] [CrossRef]
  36. You, Y.; Wang, S.; Ma, Y.; Chen, G.; Wang, B.; Shen, M.; Liu, W. Building detection from VHR remote sensing imagery based on the morphological building index. Remote Sens. 2018, 10, 1287. [Google Scholar] [CrossRef] [Green Version]
  37. Long, J.; Shelhamer, E.; Darrell, T. Fully convolutional networks for semantic segmentation. In Proceedings of the Proceedings of the IEEE Conference on Computer Vision and Pattern Recognition, Boston, MA, USA, 7–12 June 2015; pp. 3431–3440.
  38. Ronneberger, O.; Fischer, P.; Brox, T. U-net: Convolutional networks for biomedical image segmentation. In Proceedings of the International Conference on Medical Image Computing and Computer-Assisted Intervention, Munich, Germany, 5–9 October 2015; Springer: Berlin, Germany, 2015; pp. 234–241. [Google Scholar]
  39. Badrinarayanan, V.; Kendall, A.; Cipolla, R. Segnet: A deep convolutional encoder-decoder architecture for image segmentation. IEEE Trans. Pattern Anal. Mach. Intell. 2017, 39, 2481–2495. [Google Scholar] [CrossRef]
  40. Zhang, Y.; Gong, M.; Li, J.; Zhang, M.; Jiang, F.; Zhao, H. Self-Supervised Monocular Depth Estimation with Multiscale Perception. IEEE Trans. Image Process. 2022, 31, 3251–3266. [Google Scholar] [CrossRef]
  41. Zhao, H.; Shi, J.; Qi, X.; Wang, X.; Jia, J. Pyramid scene parsing network. In Proceedings of the IEEE Conference on Computer Vision and Pattern Recognition, Honolulu, HI, USA, 21–26 July 2017; pp. 2881–2890. [Google Scholar]
  42. Chen, L.C.; Papandreou, G.; Kokkinos, I.; Murphy, K.; Yuille, A.L. Deeplab: Semantic image segmentation with deep convolutional nets, atrous convolution, and fully connected crfs. IEEE Trans. Pattern Anal. Mach. Intell. 2017, 40, 834–848. [Google Scholar] [CrossRef] [Green Version]
  43. Luo, L.; Li, P.; Yan, X. Deep learning-based building extraction from remote sensing images: A comprehensive review. Energies 2021, 14, 7982. [Google Scholar] [CrossRef]
  44. Wang, L.; Fang, S.; Meng, X.; Li, R. Building extraction with vision transformer. IEEE Trans. Geosci. Remote Sens. 2022, 60, 1–11. [Google Scholar] [CrossRef]
  45. Wang, Y.; Liang, B.; Ding, M.; Li, J. Dense semantic labeling with atrous spatial pyramid pooling and decoder for high-resolution remote sensing imagery. Remote Sens. 2018, 11, 20. [Google Scholar] [CrossRef] [Green Version]
  46. Weihong, C.; Baoyu, X.; Liyao, Z. Multi-scale fully convolutional neural network for building extraction. Acta Geodaetica et Cartogr. Sinica 2019, 48, 597. [Google Scholar]
  47. Yuan, W.; Xu, W. MSST-Net: A Multi-Scale Adaptive Network for Building Extraction from Remote Sensing Images Based on Swin Transformer. Remote Sens. 2021, 13, 4743. [Google Scholar] [CrossRef]
  48. Qiu, Y.; Wu, F.; Yin, J.; Liu, C.; Gong, X.; Wang, A. MSL-Net: An Efficient Network for Building Extraction from Aerial Imagery. Remote Sens. 2022, 14, 3914. [Google Scholar] [CrossRef]
  49. Vaswani, A.; Shazeer, N.; Parmar, N.; Uszkoreit, J.; Jones, L.; Gomez, A.N.; Kaiser, Ł.; Polosukhin, I. Attention is all you need. In Proceedings of the Advances in Neural Information Processing Systems 30 (NIPS 2017), Long Beach, CA, USA, 4–9 December 2017; pp. 5998–6008. [Google Scholar]
  50. Niu, Z.; Zhong, G.; Yu, H. A review on the attention mechanism of deep learning. Neurocomputing 2021, 452, 48–62. [Google Scholar] [CrossRef]
  51. Gong, M.; Li, J.; Zhang, Y.; Wu, Y.; Zhang, M. Two-Path Aggregation Attention Network with Quad-Patch Data Augmentation for Few-shot Scene Classification. IEEE Trans. Geosci. Remote Sens. 2022. [Google Scholar] [CrossRef]
  52. Guo, M.H.; Xu, T.X.; Liu, J.J.; Liu, Z.N.; Jiang, P.T.; Mu, T.J.; Zhang, S.H.; Martin, R.R.; Cheng, M.M.; Hu, S.M. Attention mechanisms in computer vision: A survey. Comput. Vis. Media 2022, 1–38. [Google Scholar] [CrossRef]
  53. Ghaffarian, S.; Valente, J.; Van Der Voort, M.; Tekinerdogan, B. Effect of attention mechanism in deep learning-based remote sensing image processing: A systematic literature review. Remote Sens. 2021, 13, 2965. [Google Scholar] [CrossRef]
  54. Hu, J.; Shen, L.; Sun, G. Squeeze-and-excitation networks. In Proceedings of the IEEE Conference on Computer Vision and Pattern Recognition, Salt Lake City, UT, USA, 18–22 June 2018; pp. 7132–7141. [Google Scholar]
  55. Zhang, Y.; Li, K.; Li, K.; Wang, L.; Zhong, B.; Fu, Y. Image super-resolution using very deep residual channel attention networks. In Proceedings of the European Conference on Computer Vision (ECCV), Munich, Germany, 8–14 September 2018; pp. 286–301. [Google Scholar]
  56. Wang, Q.; Wu, B.; Zhu, P.; Li, P.; Zuo, W.; Hu, Q. ECA-Net: Efficient channel attention for deep convolutional neural networks. In Proceedings of the 2020 IEEE/CVF Conference on Computer Vision and Pattern Recognition, Seattle, WA, USA, 13–19 June 2020; pp. 13–19. [Google Scholar]
  57. Dai, J.; Qi, H.; Xiong, Y.; Li, Y.; Zhang, G.; Hu, H.; Wei, Y. Deformable convolutional networks. In Proceedings of the IEEE International Conference on Computer Vision, Venice, Italy, 22–29 October 2017; pp. 764–773. [Google Scholar]
  58. Wang, X.; Girshick, R.; Gupta, A.; He, K. Non-local neural networks. In Proceedings of the IEEE Conference on Computer Vision and Pattern Recognition, Salt Lake City, UT, USA, 18–22 June 2018; pp. 7794–7803. [Google Scholar]
  59. Pan, X.; Yang, F.; Gao, L.; Chen, Z.; Zhang, B.; Fan, H.; Ren, J. Building extraction from high-resolution aerial imagery using a generative adversarial network with spatial and channel attention mechanisms. Remote Sens. 2019, 11, 917. [Google Scholar] [CrossRef] [Green Version]
  60. Li, H.; Xiong, P.; An, J.; Wang, L. Pyramid attention network for semantic segmentation. arXiv 2018, arXiv:1805.10180. [Google Scholar]
  61. Guo, H.; Shi, Q.; Du, B.; Zhang, L.; Wang, D.; Ding, H. Scene-driven multitask parallel attention network for building extraction in high-resolution remote sensing images. IEEE Trans. Geosci. Remote Sens. 2020, 59, 4287–4306. [Google Scholar] [CrossRef]
  62. Ye, Z.; Fu, Y.; Gan, M.; Deng, J.; Comber, A.; Wang, K. Building extraction from very high resolution aerial imagery using joint attention deep neural network. Remote Sens. 2019, 11, 2970. [Google Scholar] [CrossRef]
  63. Guo, M.; Liu, H.; Xu, Y.; Huang, Y. Building extraction based on U-Net with an attention block and multiple losses. Remote Sens. 2020, 12, 1400. [Google Scholar] [CrossRef]
  64. Chen, X.; Qiu, C.; Guo, W.; Yu, A.; Tong, X.; Schmitt, M. Multiscale feature learning by transformer for building extraction from satellite images. IEEE Geosci. Remote Sens. Lett. 2022, 19, 1–5. [Google Scholar] [CrossRef]
  65. Chen, F.; Wang, N.; Yu, B.; Wang, L. Res2-Unet, a New Deep Architecture for Building Detection from High Spatial Resolution Images. IEEE J. Sel. Top. Appl. Earth Obs. Remote Sens. 2022, 15, 1494–1501. [Google Scholar] [CrossRef]
  66. Guo, H.; Du, B.; Zhang, L.; Su, X. A coarse-to-fine boundary refinement network for building footprint extraction from remote sensing imagery. ISPRS J. Photogramm. Remote Sens. 2022, 183, 240–252. [Google Scholar] [CrossRef]
  67. Foody, G.M. Thematic map comparison. Photogramm. Eng. Remote Sens. 2004, 70, 627–633. [Google Scholar] [CrossRef]
Figure 1. The brief procedure of the proposed FSIANet. The AFSAP indicates the proposed atrous frequency spectrum attention pyramid.
Remotesensing 14 05457 g001
Figure 2. The procedure of FSIA.
Remotesensing 14 05457 g002
Figure 3. The procedure of AFSAP.
Remotesensing 14 05457 g003
Figure 4. Some examples of two benchmark datasets. (a) East Asia Dataset. (b) Inria Aerial Image Dataset. The first row in each subplot is the aerial image tile, and the second row is the ground truth.
Remotesensing 14 05457 g004
Figure 5. The visualization results of the proposed FSIANet and other comparison methods on the East Asia Dataset.
Remotesensing 14 05457 g005
Figure 6. The visualization results of the proposed FSIANet and other comparison methods on the Inria Aerial Image Dataset.
Remotesensing 14 05457 g006
Figure 7. The feature maps and DCT results on the East Asia Dataset. Image (1): ((1-1)–(1-3)) represent different feature maps and their corresponding DCT results, respectively; image (2): ((2-1)–(2-3)) denote different feature maps and their corresponding DCT results, respectively.
Remotesensing 14 05457 g007
Table 1. The detailed information of the two building detection datasets.
DatasetEast Asia DatasetInria Aerial Image Dataset
Year20192017
Coverage550 km2810 km2
Size512 × 512 pixels5000 × 5000 pixels
Spatial Resolution2.7 m0.3 m
Table 2. Quantitative results on P r e c i s i o n , R e c a l l , F 1 - S c o r e , and I o U (in %) of different methods on the East Asia Dataset. The best results are shown in bold.
Methods Precision Recall F 1 - Score IoU
FCN8s [37]87.3070.3277.9063.79
U-Net [38]88.4171.2278.8965.14
PSPNet [41]83.6669.9776.2061.56
PANet [60]87.6964.0974.0558.80
SiU-Net [19]89.0969.7678.2564.27
BRRNet [27]83.0678.1180.5167.37
AGPNet [25]86.3776.5981.1968.34
Res2-Unet [65]84.0769.1475.8861.14
FSIANet (Ours)84.1180.7582.3970.06
Table 3. Quantitative results on P r e c i s i o n , R e c a l l , F 1 - S c o r e , and I o U (in %) of different methods on the Inria Aerial Image Dataset. The best results are shown in bold.
MetricsMethodsAustinChicagoKitsapTyrolViennaAverage
P r e c i s i o n FCN8s [37]88.2881.3785.2188.2589.8186.64
U-Net [38]89.9287.6184.0387.6289.6587.77
PSPNet [41]84.5880.5781.0185.5787.4783.84
PANet [60]87.7277.1380.6886.2684.8983.34
SiU-Net [19]90.9481.3984.4287.6789.0286.69
BRRNet [27]89.3087.2080.0983.1388.0485.55
AGPNet [25]91.7286.3785.9190.3091.4589.15
Res2-Unet [65]86.8679.2077.7485.6186.0683.09
FSIANet (Ours)90.0486.2583.2385.8089.5986.98
R e c a l l FCN8s [37]87.3279.2970.4180.8983.3980.26
U-Net [38]87.0373.4973.1683.3785.3380.48
PSPNet [41]74.3375.1969.7379.9981.9976.25
PANet [60]74.2666.1965.5075.2379.3972.11
SiU-Net [19]86.3978.2773.5582.2784.6081.02
BRRNet [27]89.0775.7877.5785.8585.4482.74
AGPNet [25]86.8178.6976.2482.7185.1181.91
Res2-Unet [65]84.7078.0672.4083.0984.9080.63
FSIANet (Ours)90.3078.7579.3988.3587.0184.76
F 1 - S c o r e FCN8s [37]87.8080.4777.1184.4086.4883.25
U-Net [38]88.4579.9478.2285.4487.4383.90
PSPNet [41]79.1277.7974.9582.6984.6479.84
PANet [60]80.4371.2472.3080.3782.0477.28
SiU-Net [19]88.6179.8178.6184.8986.7583.73
BRRNet [27]89.1981.0979.2084.4786.7284.13
AGPNet [25]89.2082.3580.7986.3488.1785.37
Res2-Unet [65]85.7778.6374.9784.3385.4881.84
FSIANet (Ours)90.1782.3381.2687.0688.2885.82
I o U FCN8s [37]78.2567.3262.7473.0276.1871.50
U-Net [38]79.3066.5864.2374.5877.6772.47
PSPNet [41]65.4663.6559.9470.4873.3766.58
PANet [60]67.2455.3356.6267.1869.5563.18
SiU-Net [19]79.5466.3964.7673.7476.6172.21
BRRNet [27]80.4868.1965.5773.1176.5872.79
AGPNet [25]80.5069.9967.7775.9678.8474.61
Res2-Unet [65]75.0964.7859.9672.9074.6469.47
FSIANet (Ours)82.1069.9768.4477.0879.0275.32
Table 4. Ablation results on P r e c i s i o n , R e c a l l , F 1 - S c o r e , and I o U (in %) of our proposed FSIANet on the East Asia Dataset. The best results are shown in bold.
Methods Precision Recall F 1 - Score IoU
backbone83.5279.0481.2268.38
backbone+FSIA84.2779.2981.7169.07
backbone+FSIA+ASPP85.3978.6281.8669.30
backbone+FSIA+AFSAP (Full)84.1180.7582.3970.06
Table 5. McNemar’s test of the ablation study over the proposed FSIANet on the East Asia Dataset.
FSIANetvs. Backbonevs. Backbone+FSIAvs. Backbone+FSIA+ASPP
z value154.2680.2728.58
Publisher’s Note: MDPI stays neutral with regard to jurisdictional claims in published maps and institutional affiliations.

