Article

A Fusion-Based Defogging Algorithm

1
School of Information Engineering, Chang’an University, Xi’an 710064, China
2
School of Electrical and Information Engineering, The University of Sydney, Sydney, NSW 2006, Australia
3
School of Electronics and Information, Northwestern Polytechnical University, Xi’an 710129, China
*
Author to whom correspondence should be addressed.
Remote Sens. 2022, 14(2), 425; https://doi.org/10.3390/rs14020425
Submission received: 7 December 2021 / Revised: 7 January 2022 / Accepted: 12 January 2022 / Published: 17 January 2022

Abstract

:
To solve the problem that traditional dark channel is not suitable for a large sky area and can easyily distort defogged images, we propose a novel fusion-based defogging algorithm. Firstly, an improved remote sensing image segmentation algorithm is introduced to mix the dark channel. Secondly, we establish a dark-light channel fusion model to calculate the atmospheric light map. Furthermore, in order to refine the transmittance image without reducing restoration quality, the grayscale image corresponding to the original image is selected as a guide image. Meanwhile, we optimize the set value of the defogging intensity parameter ω in the transmission estimation formula as the value of atmospheric light. Finally, a brightness/color compensation model based on visual perception is generated for image correction. Experimental results demonstrate that the proposed algorithm achieves superior performance on UAV foggy images in both subjective and objective evaluation, which verifies the effectiveness of the proposed algorithm.

Graphical Abstract

1. Introduction

Absorption, scattering, and reflection on suspended particles seriously reduce visibility and visible distance in fog weather. Images collected under fog weather usually present brightness, decreased contrast, blurred details, and color distortion. As a result, they are difficult to be utilized as the source of effective information. Therefore, defogging has attracted significant attention to its theoretical challenges and practical applications [1,2].
The current defogging algorithms are roughly categorized into three classes [3]: image enhancement, image restoration, and deep learning. The defogging methods based on image enhancement lack analysis of the image degradation principle and physical imaging model. These methods utilize existing image processing technologies to enhance contrast, highlight detailed information, and improve visibility. These methods mainly include retinex theory [4], histogram equalization [5], wavelet transform [6], and more. Retinex transform is a representative algorithm. It indicates that an image is composed of an incident component representing the image brightness information and a reflection component representing the internal information of the image [7]. Afterward, a series of modified Retinex methods are presented. Liu et al. proposed a novel image fidelity evaluation framework [8] based on a multi-scale retinal enhancement algorithm with color Restoration (MSRCR). Zhang et al. proposed a multi-channel convolution MSRCR fog removal algorithm [9]. However, none of the algorithms based on retinex theory completely solve the halo problem.
The principle of the histogram equalization method is to stretch the contrast of gray values concentrated in a specific gray range of foggy images so as to obtain more detailed information in visual perception [10]. Wong et al. [11] proposed a pipeline method that combines histogram equalization steps, amplitude compression, and saturation maximization stages with the color channel stretching process, aiming to effectively reduce artifacts while improving image contrast and color details. Afterward, Fei et al. [12] presented a histogram equalization defogging method based on image retrieval. Firstly, the constraint function of image enhancement is obtained by the image quality. Then, the distortion generated by mapping transformation is eliminated by a filter. Finally, adaptive brightness equalization is carried out, which effectively adjusts the contrast of the image and achieves better performance. However, when the fog concentration of an image is not uniform or the scene depth of an image is not continuous, the histogram equalization method shows some defects of detail loss, contour distortion, and overexposure. Unlike the histogram equalization method, the wavelet transform method enhances the image contrast by improving the high-frequency component and reducing the low-frequency component [13]. Jia et al. [14] proposed a foggy image visibility enhancement algorithm based on an imaging model and wavelet transform technology. Here, an optical imaging model under fog conditions is established, and the degradation factor and compensation strategy are determined. Finally, the light-scattering component is estimated by Gaussian blur and removed from the image, which significantly improves the image clarity. In recent years, He et al. [15] proposed a defogging method based on a wavelet transform in traffic scenes. The innovation of this method is that foggy images are defogged in both HSV and RGB color space and then merged. This retains more image information and is more suitable for human eyes to observe. However, the defogged image recovered by the wavelet transform method manifests great limitations for large or uneven fog concentrations. To sum up, the defogging methods based on image enhancement are unable to solve the problems of color distortion, detail loss, and noise interference in restored images.
The defogging methods based on image restoration mainly include depth information of the scene [16], polarization characteristics [17], prior information [18], and more. The methods based on the depth information of the scene utilize the transmittance information of the image obtained through the scene depth to carry out fog removal [19]. Gao et al. [20] proposed a method to solve the problem of color distortion in the boundary area of the sky. It combines the image transmittance obtained from the light field epipolar plane image with the transmittance obtained from the dark channel prior theory, improving the color fidelity and inhibiting the halo effect. Wang et al. [21] utilized complex optical equipment to obtain depth information of images and then estimated the transmittance of foggy images based on the depth information. This method fully preserves the color information of the image, but the process is complicated and limited by professional equipment. These factors ultimately lead to great limitations in practical application. The methods based on polarization characteristics extract atmospheric scattered light from the image to achieve fog removal [22]. In order to overcome the limitation of manually selecting reference points in the scene to obtain the polarization parameters, Namer et al. [23] propose an automatical polarization parameters extraction algorithm. Consequently, the polarization effects generated by the image become more robust and improve the overall quality of the restored image. Xia et al. [24] produced a quantitative analysis of the original image using mathematical tools to obtain the regularity of the threshold of air-light intensity and the range of polarization orientation angle. Thus improving the accuracy of image restoration. However, the methods based on polarization characteristics heavily rely on ambient light, and the effect is poor under the condition of high fog concentration. Furthermore, it is difficult to obtain the polarization image in some scenes. The methods based on prior information obtain the required parameters in the atmospheric scattering model by counting the rules or specific data of foggy images in advance. Then, using an inverse process through the atmospheric light model [25] the restored image is achieved. In recent years, this method has become popular with many researchers because it does not rely on multiple scene images. Moreover, it has the advantages of a simple and fast operation process and greatly improves the quality of image recovery. Among them, the most representative method is the dark channel prior defogging algorithm proposed by He et al., which has achieved a good defogging effect [26]. On this basis, He et al. put forward the guided filtering algorithm to solve heavy and complicated computation problems for soft matting [27]. However, the method based on image restoration still has the limitations of inaccurate estimation for transmittance and atmospheric light values in bright areas, as well as fixed parameters in the process of defogging. Afterward, Xu et al. proposed a method combining dark channel with light channel for image defogging [28]. Li et al. proposed a two-stage image dehazing algorithm based on homomorphic filtering and dark channel prior improved by the sphere model [29]. Furthermore, Wang et al. proposed a fog removal algorithm based on improved neighborhood combined with dark channel prior [30].
With the rapid development of deep learning, defogging methods based on deep learning have attracted more attention. Engin et al. proposed the cycle-dehaze algorithm, which has achieved a favourable smog removal effect, but the haze removal effect is lacking [31]. Moreover, Li et al. proposed a defogging algorithm based on residual image learning. It deforms the atmospheric scattering model and replaces parameters estimated by the convolutional neural network into the model to obtain defogged images [32]. Zhang et al. proposed a fusion end-to-end dense connection pyramid defogging network (DCPDN), which achieves a good image restoration effect [33]. Ren et al. introduced an end-to-end trainable neural network composed of an encoder and a decoder and trained the network with a multi-scale method to avoid the halo phenomenon of the defogged image [34]. In addition, Chen et al. utilized an end-to-end context aggregation network for image defogging. The recovered fog-free image greatly improves relevant objective evaluation indexes, and the method also has a certain universality [35]. However, defogging methods based on deep learning usually rely on foggy images and corresponding non-foggy images in the same scene, which is difficult to obtain in the real situation. Therefore, deep learning-based defogging methods usually obtain the network structure through learning a large amount of simulated foggy data. This has a poor effect in the real foggy scene.
At present, the mainstream defogging methods based on the dark channel prior have some limitations, mainly including its inapplicability to large white areas, higher estimation of atmospheric light, the simplification of parameters, and more. To overcome these drawbacks, a far and near scene fusion defogging algorithm based on the prior of the dark-light channel is proposed, presenting better contrast, brightness, and visual perception. The main contributions of this paper are summarized as follows:
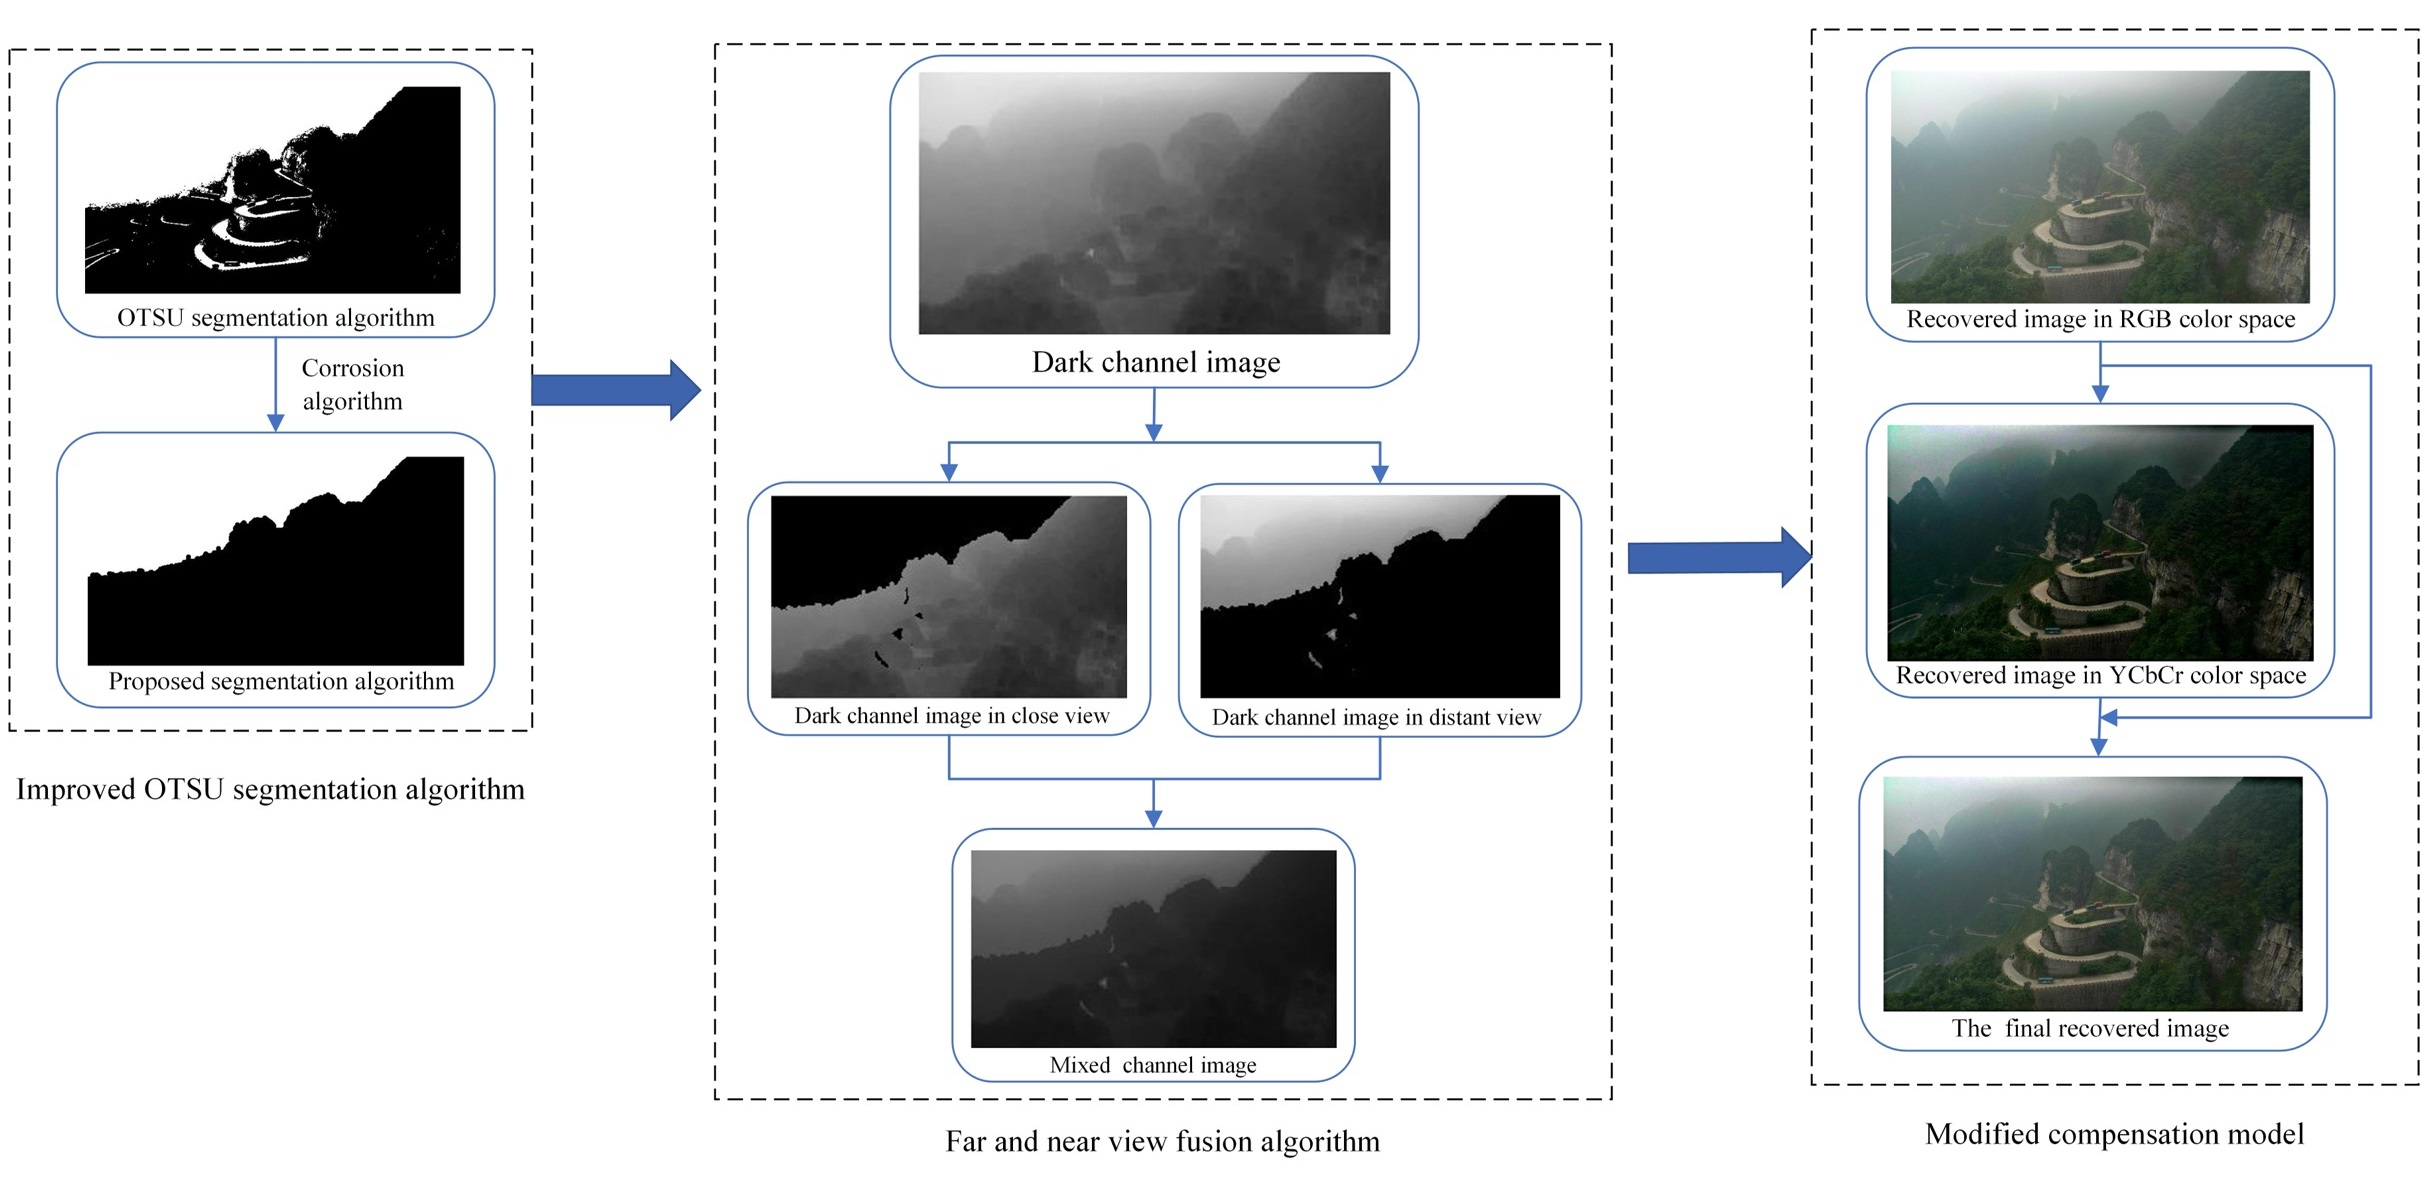
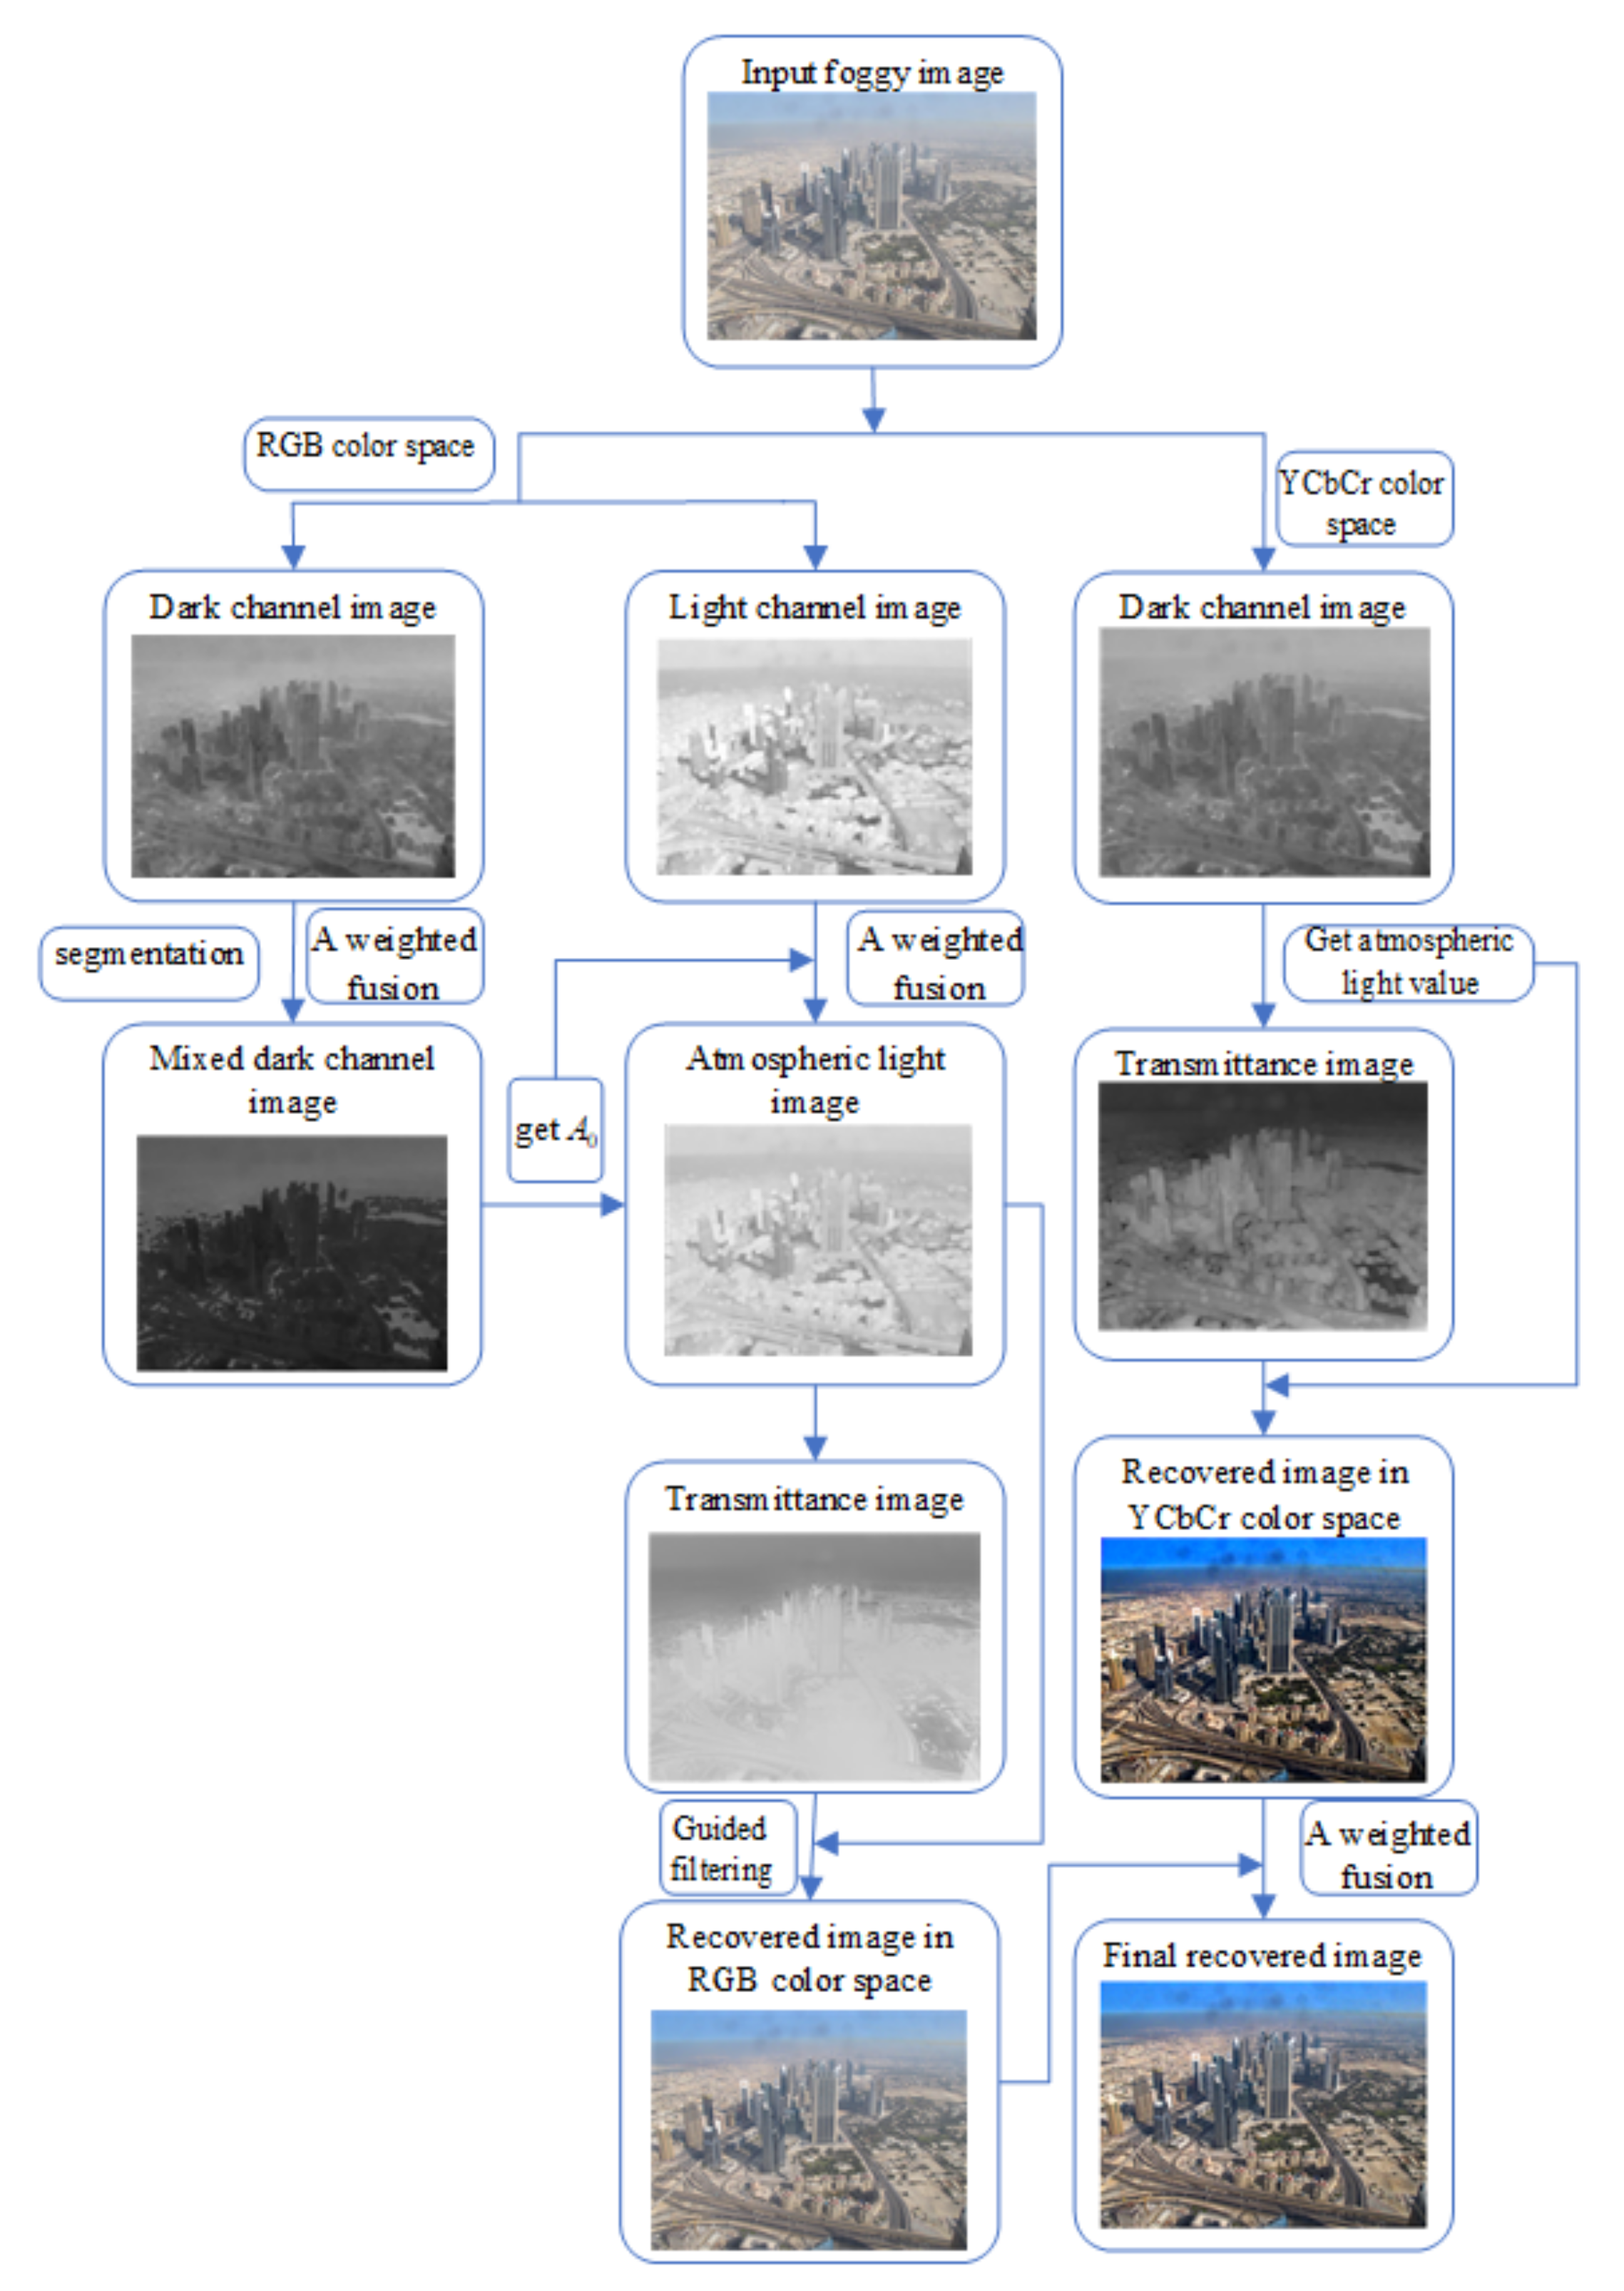
  • To solve the problem of the inaccurate estimation of atmospheric light value and transmittance, we propose a novel atmospheric light scattering model. The light channel prior is introduced to obtain a more accurate atmospheric light and transmittance value.
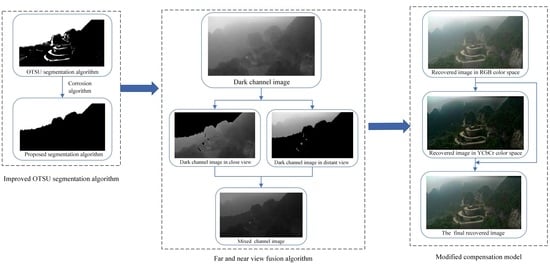
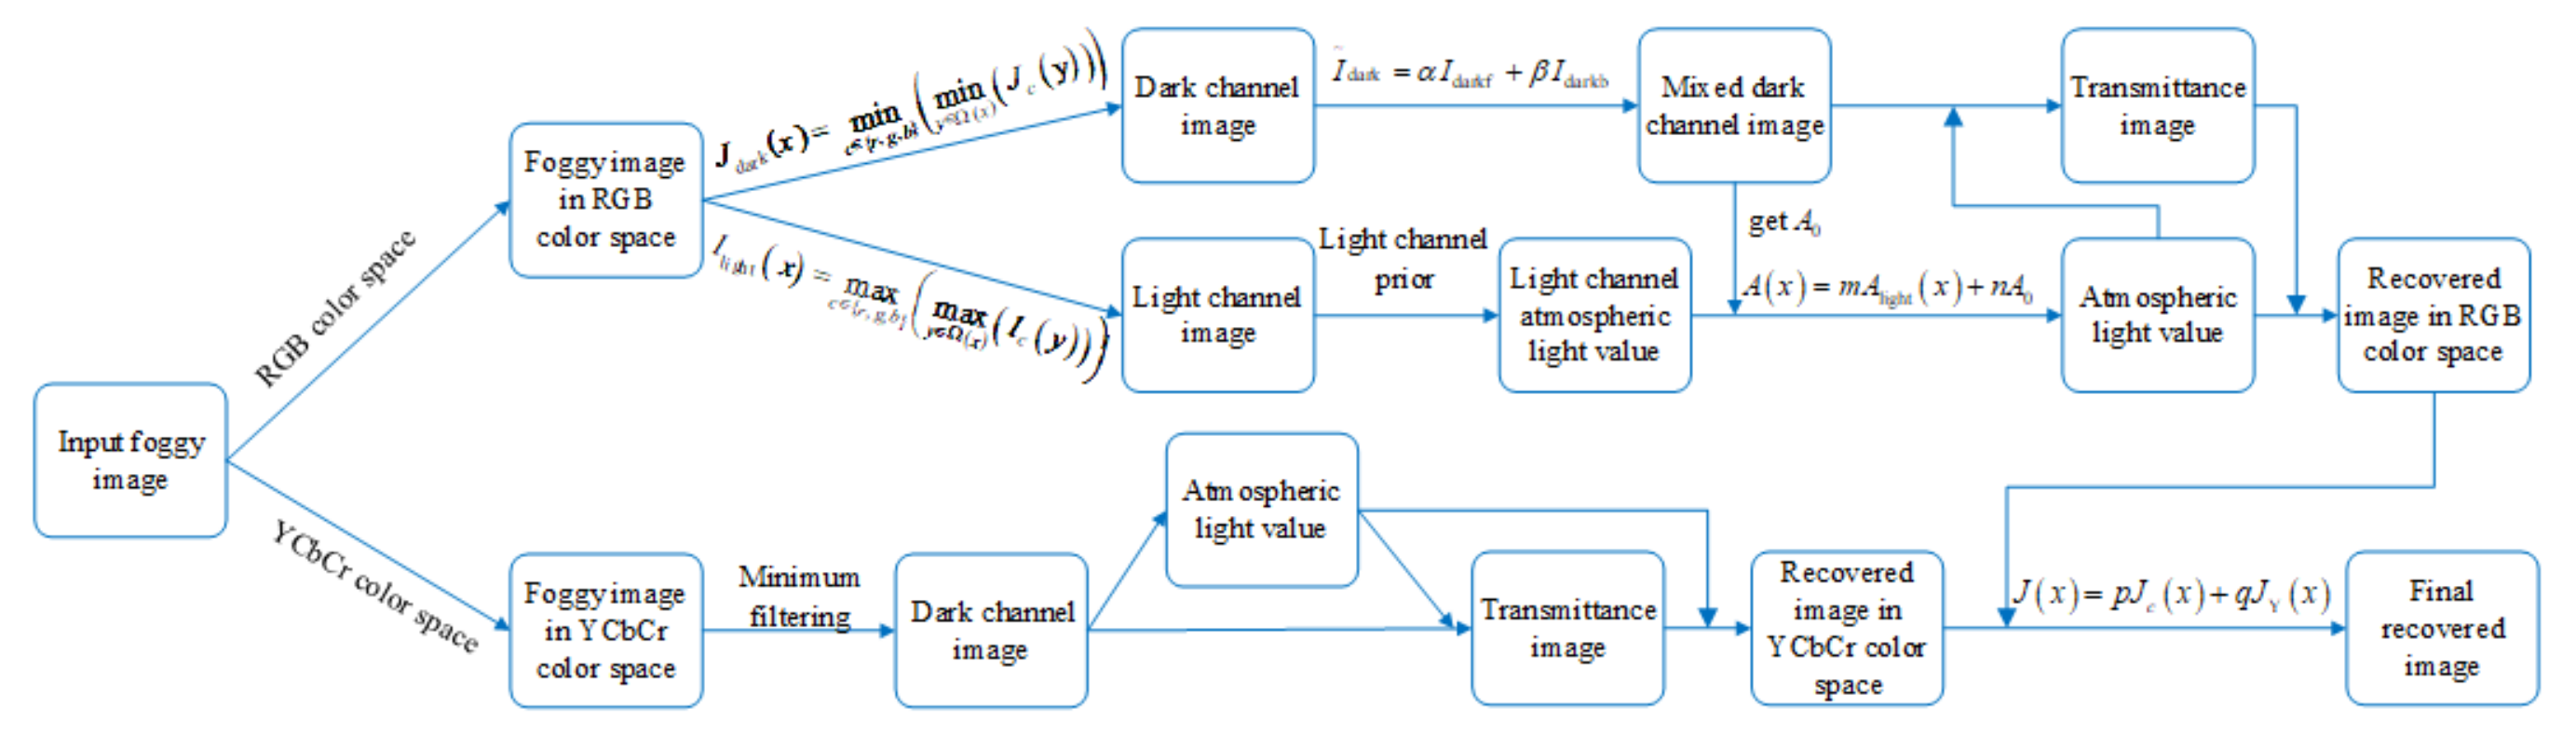
  • Aiming at the shortage that the dark channel prior theory is prone to distort in some regions of the image, an improved two-dimensional Otsu image segmentation algorithm is established. It mixes the dark channels in the near and distant areas and sets adaptive adjustment parameters of the mixed dark channel in the near and distant areas based on the optimal objective quality evaluation index.
  • In order to overcome the drawback that the defogging parameters are single and fixed in the process of defogging, an adaptive parameter model is generated to calculate the defogging degree according to the atmospheric light value.
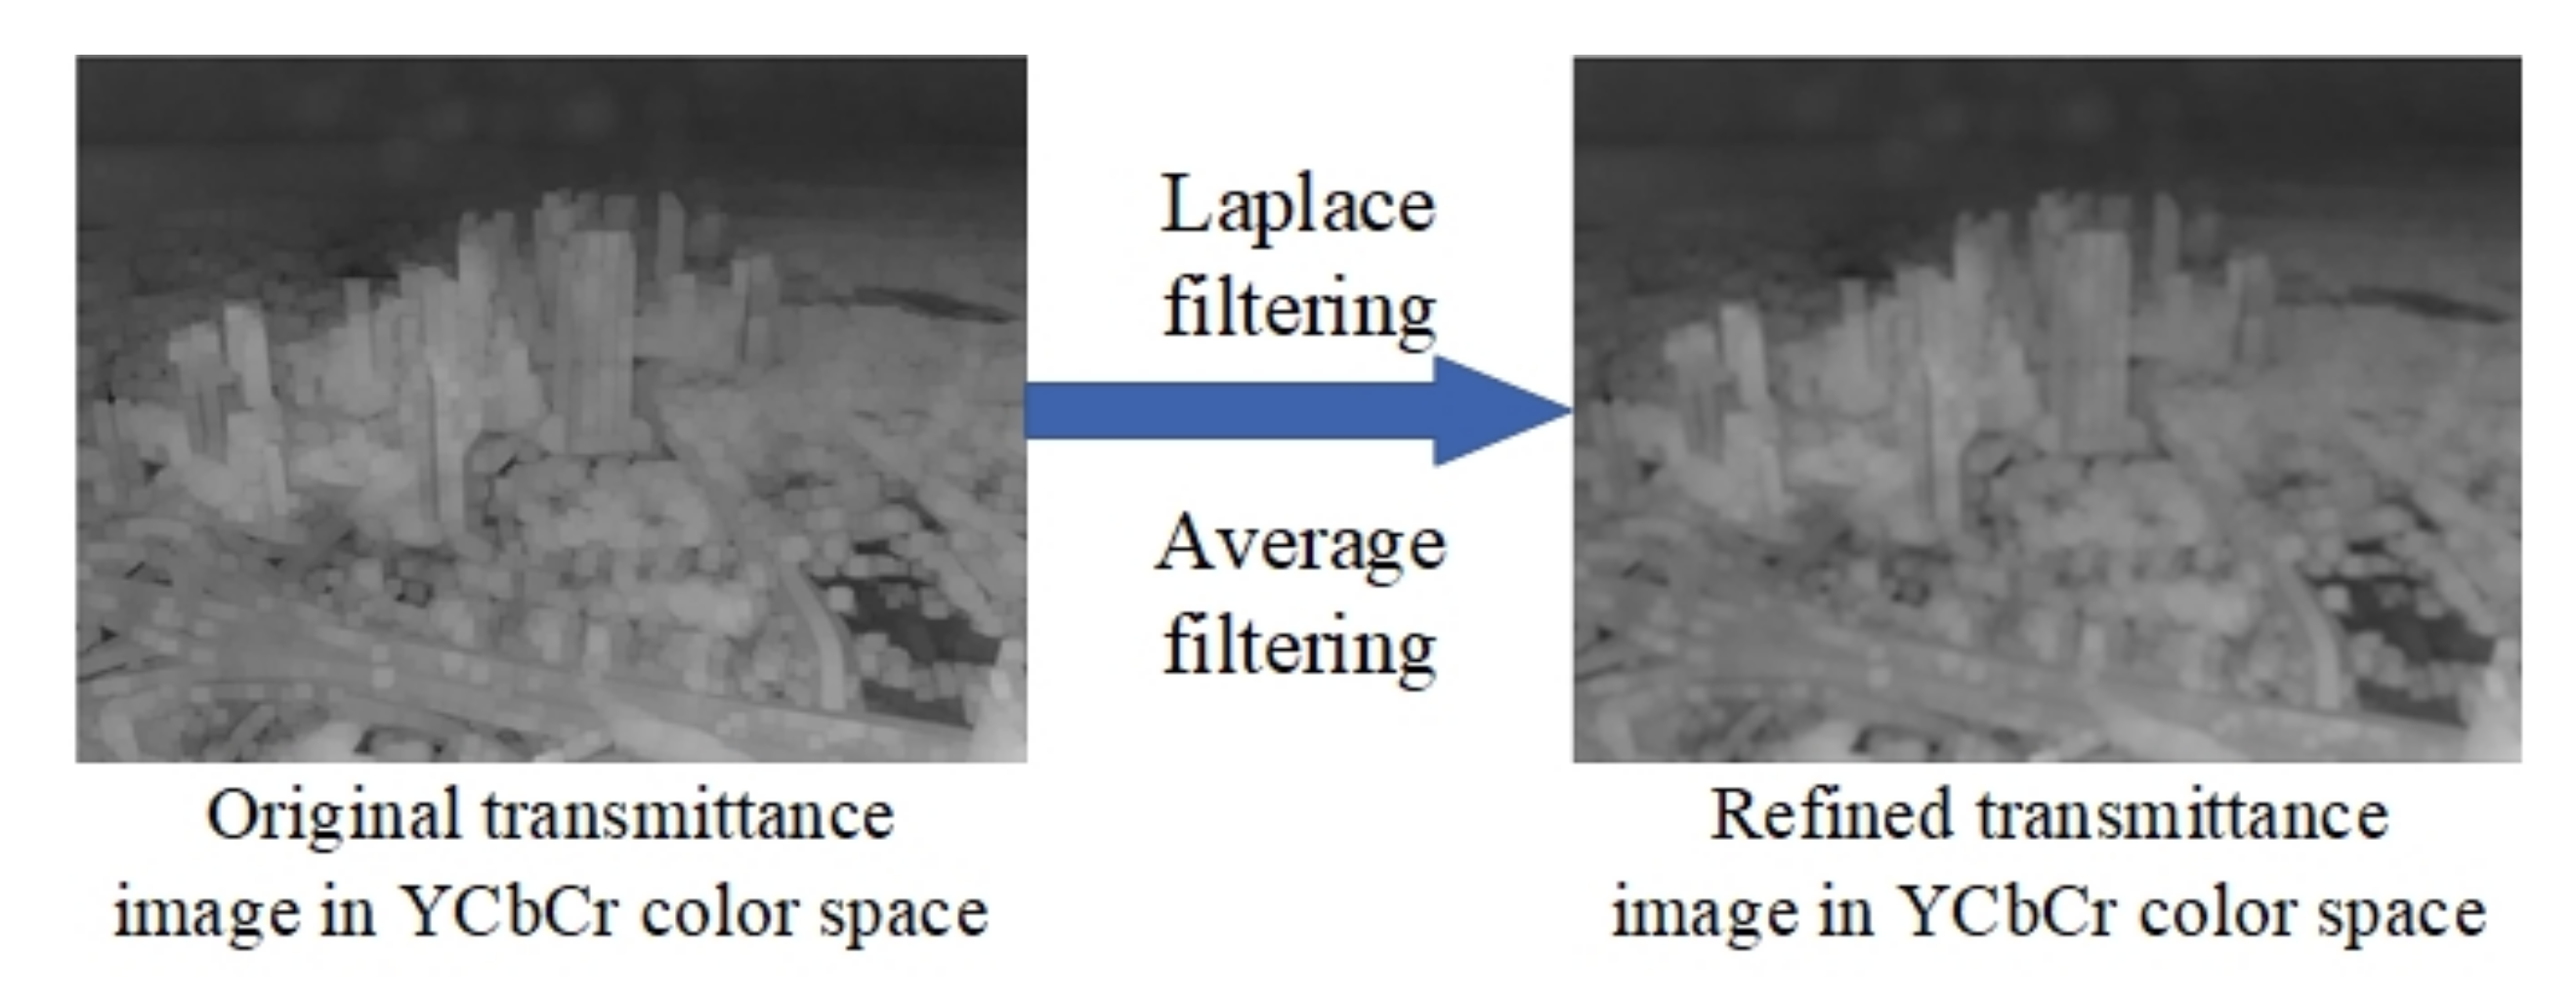
  • Focusing on reducing the computational complexity of refining transmittance, we utilize gray images corresponding to foggy images as guiding images for guiding filtering. Meanwhile, a brightness/color compensation model based on visual perception is proposed to correct the restored images, which improves the contrast and color saturation of the restored images.
This article is organized as follows. A background of image defogging and the contributions of this article are presented in Section 1. The traditional dark channel prior defogging algorithm is described in Section 2. Section 3 gives a detailed description of the proposed algorithm. Section 4 verifies the effectiveness of the proposed algorithm by abundant experiments. The conclusion is drawn in Section 5.

2. Related Work

2.1. Dark Channel Prior Theory

The atmospheric scattering model is described as follows:
I ( x ) = J ( x ) t ( x ) + A ( 1 t ( x ) )
where x is the corresponding position of each pixel in the foggy image, I ( x ) is the foggy image, J ( x ) represents the restored image, and A and t ( x ) represent the atmospheric light value and transmittance, respectively.
Assuming the atmosphere follows a uniform distribution, the transmission t ( x ) is expressed as follows:
t ( x ) = e β d ( x )
where β is the scattering coefficient of the atmosphere and d is the scene depth.
In 2009, He et al. proposed dark channel prior: in most non-sky areas of the fog-free images, at least one channel of RGB has some pixels which are very low or even close to zero, and these pixels are called dark primary color pixels. The dark channel J dark x is given by:
J dark ( x ) = min c { r , g , b } min y Ω ( x ) J c y
where c represents a channel in RGB color space and Ω ( x ) represents the filtering region centered on pixel x . We consider the transmittance t ( x ) to be a constant value t ˜ ( x ) in the range of each window Ω ( x ) . The following equation is obtained by dividing both sides of Equation (1) by the value of atmospheric light A c simultaneously:
I c x A c = t x J c x A c + 1 t x
where I c x and J c x , respectively, indicate the foggy image and the clear image in a certain channel. By simultaneously performing the local region minimum value operation and the color channel minimum value operation on both sides of the equation, Equations (4) and (5) are obtained:
min c r , g , b min y Ω ( x ) I c ( y ) A c = t ( x ) min c r , g , b min y Ω ( x ) J c ( y ) A c + 1 t ~ ( x )
According to the dark channel prior, a rough estimate of the transmittance t ( x ) is finally obtained as follows:
t x = 1 min c r , g , b min y Ω x I c y A c
Since preserving a certain amount of fog will make the image have a sense of scene depth, resulting in a more real and natural visual effect, literature [26] introduces empirical value ω = 0.95 for adjustment to retain a certain amount of fog. The equation of roughly estimated transmittance is improved as:
t x = 1 ω min c { r , g , b } min y Ω x I c y A c x
In Equation (1), too small transmittance t ( x ) will lead to the direct attenuation J ( x ) t ( x ) 0 term, and the restored image J x is prone to noise. In literature [26], the threshold t 0 = 0.1 is set as the lower limit of t ( x ) . At this time, the final defogging algorithm is reconstructed as:
J x = I ( x ) A x max t x , t 0 + A x

2.2. Guided Filtering Algorithm

Next, He et al. proposed guided filtering to refine the transmittance. This method dramatically reduces the processing time, and the edge details of the image refined by the guided filtering are much clearer. Moreover, the “blocking” effect is greatly reduced, and the dehazing effect is better. The formula of guided filtering [27] is defined as:
q i = 1 ω k , i , i ω i a k I i + b k
where ω represents the number of pixels in a window ω k ; a k , b k is the linear parameters of ω k , which are two fixed constants and expressed as:
a k = 1 ω i ω k I i p i μ k p k σ k 2 + ε
b k = p k a k μ k
where μ k and σ k 2 are the mean and variance of the guidance image I in ω k , respectively; p k is the mean of p in ω k .

3. The Proposed Algorithm

A remote sensing image usually has thin fog areas, namely near scene regions, and heavy fog areas, namely far scene regions. It is difficult for traditional defogging algorithms to quickly segment near and far scene regions of the remote sensing foggy image and process different areas in corresponding degrees. Therefore, a two-dimensional Otsu remote sensing image segmentation algorithm is firstly proposed to segment the image. Then, the improved atmospheric light model and the novel transmittance estimation method are generated to calculate the improved atmospheric light value and transmittance. Finally, they are substituted into the foggy image restoration model to restore the final fog-free image. The flow chart of the proposed algorithm is shown in Figure 1.

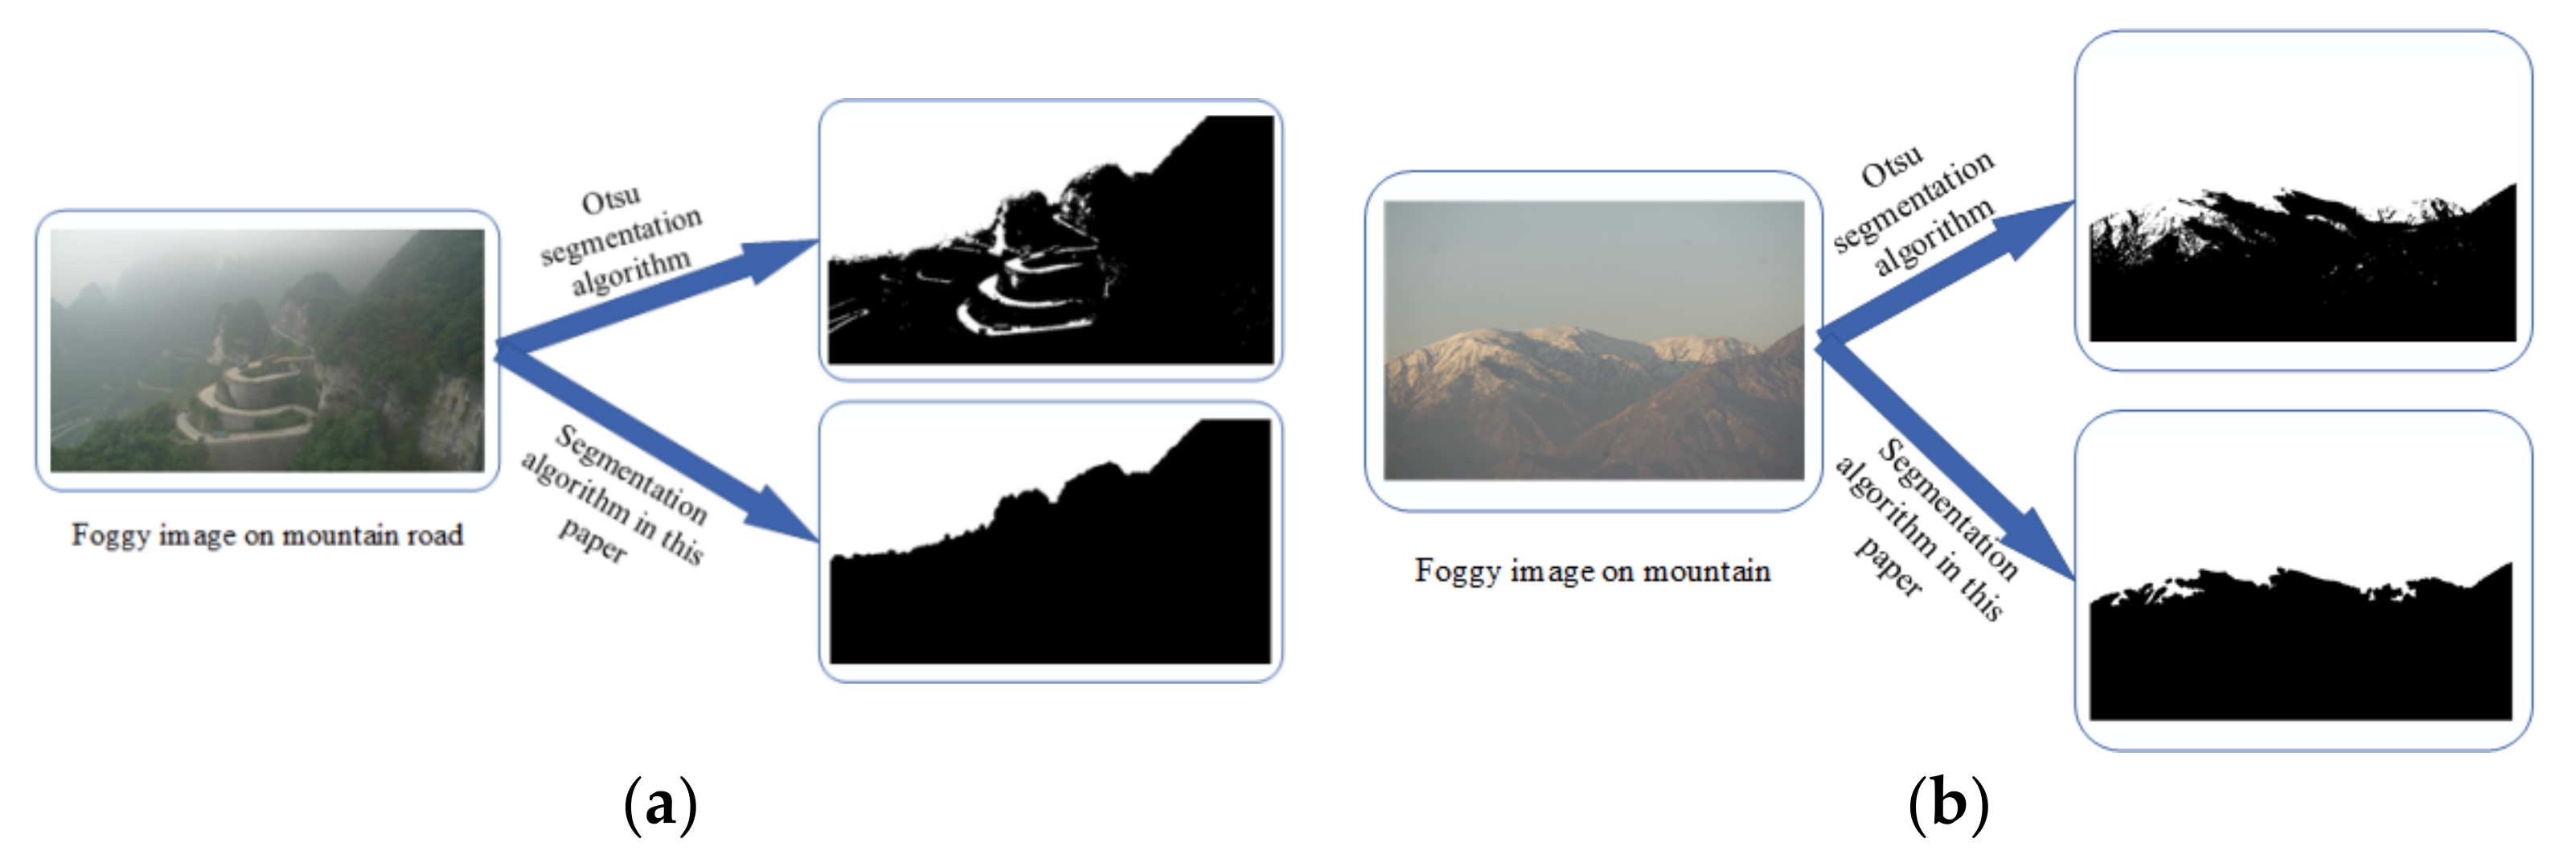
3.1. Two-Dimensional Otsu Remote Sensing Image Segmentation Algorithm

In 1978, the algorithm based on a unidimensional maximum between-cluster variance was proposed by Otsu, which is called the Otsu algorithm [36]. This algorithm has attracted widespread attention because of its prominent segmentation effect, extensive application, simplicity, and effectiveness. However, when the grayscale difference between the target and background in the image is not apparent, the image information segmented out will be lost. Thus, the literature [37] generalizes the unidimensional Otsu thresholding method as two-dimensional. The two-dimensional Otsu algorithm utilizes the original image and its neighborhood smooth image to construct a two-dimensional histogram, which is robust to noise. Under foggy weather, there is little difference in grayscale information for remote sensing images. Moreover, partial information in the close area is missing, and the close area omits some bright objects. These factors result in uneven segmentation for the two-dimensional Otsu algorithm. That is, it is difficult to segment the close and distant areas of the image accurately. Therefore, the corrosion algorithm of a binary image is utilized to carry out boundary corrosion of the segmented region. Finally, the maximum connected region is selected as the final close-range region. The flowchart of the proposed image segmentation algorithm is shown in Figure 2.
The comparison between the Otsu segmentation algorithm and the proposed image segmentation algorithm is shown in Figure 3. In Figure 3a, the mountain and sky belong to the near and far scene regions, respectively. Because the snow on the top of the mountain is a bright object, the Otsu algorithm fails to accurately segment the near scene region. By contrast, the proposed image segmentation algorithm divides the near scene region well. In Figure 3b, the near mountains and roads belong to near scene regions, while the distant mountains and sky areas belong to far scene regions. Since the color of the highway is light, the Otsu algorithm fails to accurately segment the near scene region. By contrast, the proposed image segmentation algorithm segments the near scene region well, and the edge information of the mountains is well reserved.

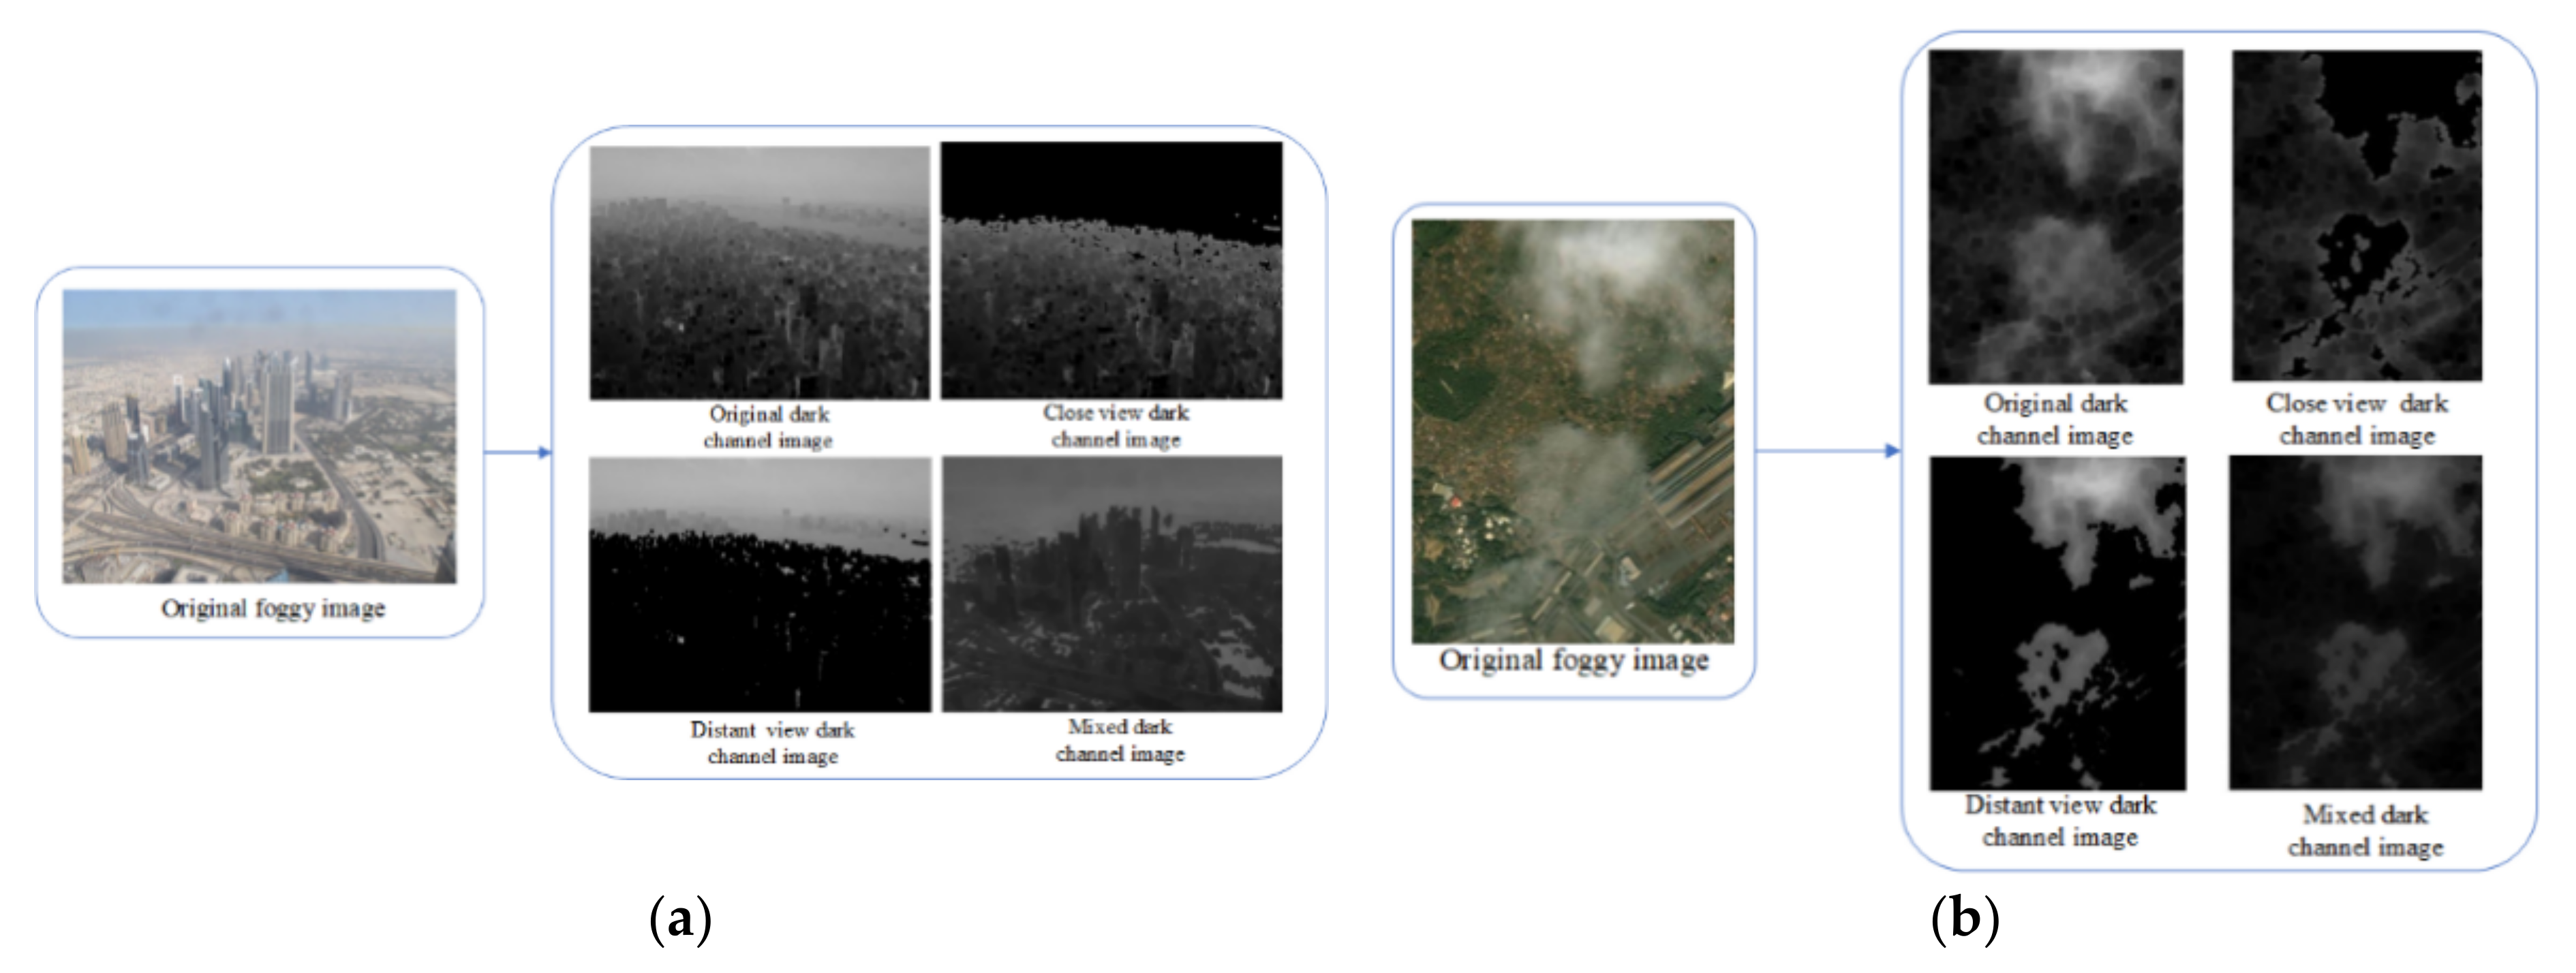
3.2. Mixed Dark Channel Algorithm

The foggy remote sensing image is segmented by the two-dimensional Otsu remote sensing image segmentation algorithm, in which the near area is relatively less disturbed by fog, and the dark channel value is smaller; the distant area is more disturbed by fog and the dark channel value is larger. The initial dark channel I dark is obtained by selecting the minimum of the three channels in RGB in a foggy image. Then the dark channel in the near area I darkf and the dark channel in the distant area I darkb are obtained according to the proposed image segmentation algorithm. The mixed dark channel I dark is the sum of I darkf and I darkb :
I dark = α I darkf + β I darkb
where α 0 , 1 , and β 0 , 1 are adjusting parameters, and α + β = 1 . When α < β , it mainly processes the distant area of the foggy remote sensing image. When α = β , the near and distant areas are processed at the same time. When α > β , it mainly processes the near area. The value of α is set in [0, 1] with a step size of 0.1 and 1 - β is also taken in [0, 1] with the step of 0.1. The values of objective quality evaluation index parameters corresponding to each group α , β are calculated, and the parameters corresponding to the optimal values are selected to obtain I dark . Based on a large number of experiments, the defogging effect is the best when α = 0.4 , β = 0.6 . Figure 4 show the close-range dark channel image, the distant-range dark channel image and the mixed dark channel image reconstructed by the mixed dark channel algorithm. It can be seen that the mixed dark channel image reduces the difference between the dark channel images in a close and distant area, laying a solid foundation for the subsequent restoration process to obtain a better restoration effect.

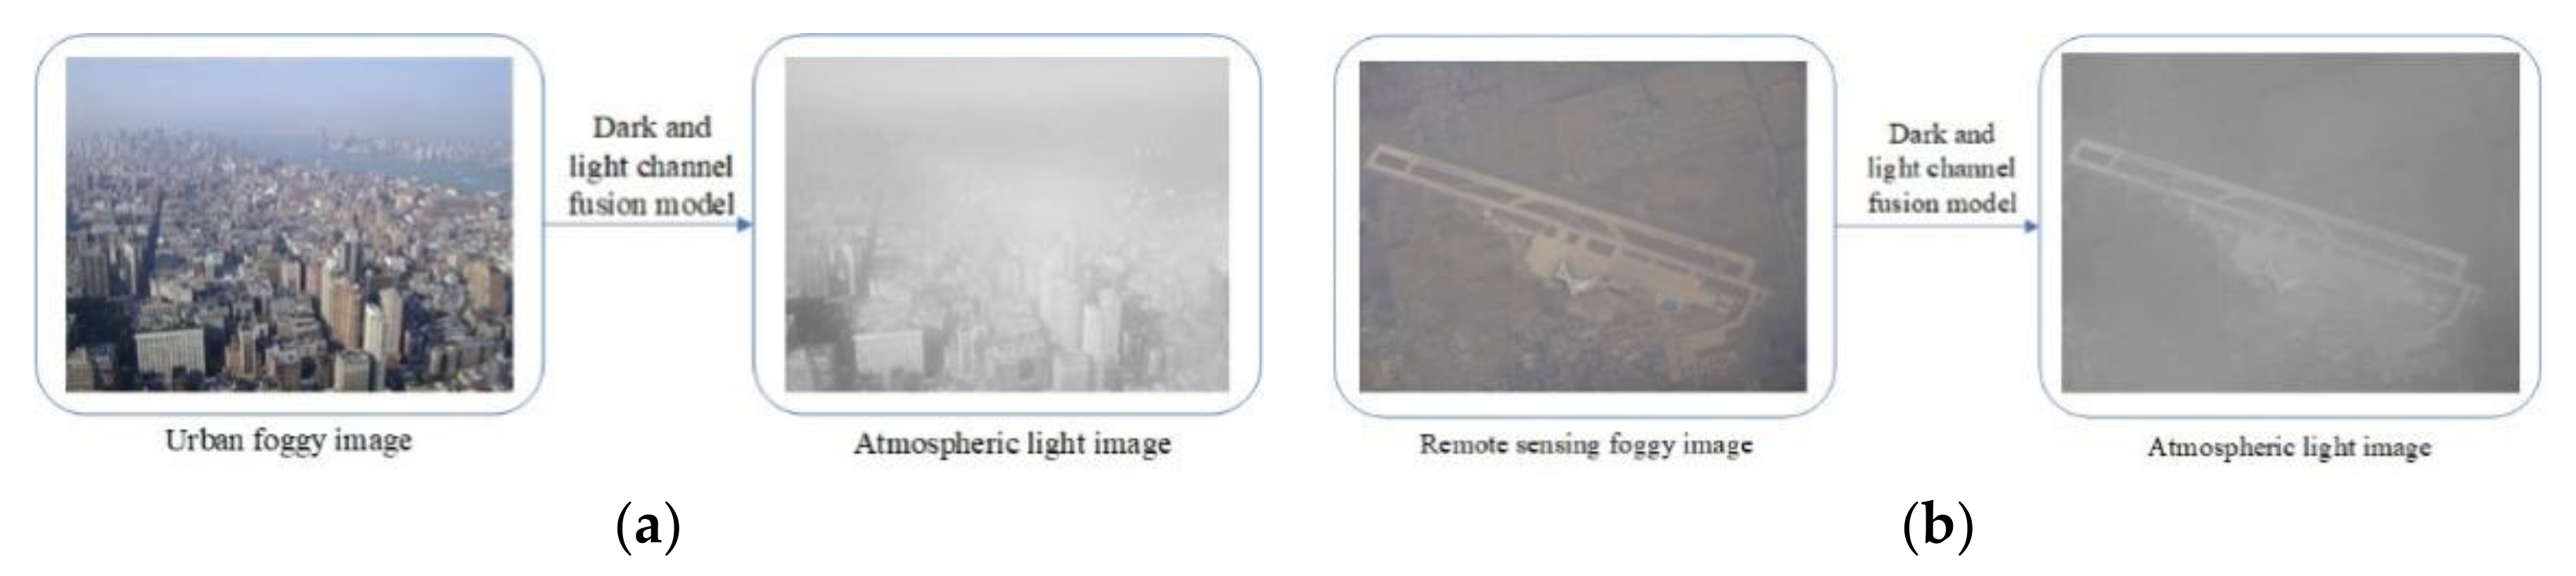
3.3. Dark-Light Channel Fusion Model

Most algorithms based on image restoration are based on the atmospheric light scattering model described in Equation (1). In Equation (1), the atmospheric light value A is supposed as a constant. It is found that the atmospheric light value is not invariable, and the fixed atmospheric light value is not suitable for the whole image. Thus, the atmospheric light scattering model is improved as follows:
I x = J x t x + A x 1 t x
The light channel prior is introduced to estimate the atmospheric light value more accurately. In contrast to the dark channel prior, light channel prior indicates that at least one color channel has a large pixel value in most areas of foggy images through a lot of observation and experiment. For each foggy image I , its light channel I light is expressed as:
I light x = max c { r , g , b } max y Ω x I c y
where I c represents a certain color channel of an image I . Ω x represents a local region centered on pixel x.
The light channel prior points out that the light channel value of a pixel in the foggy image is close to the atmospheric light value of its corresponding fogless image [28], and then the following formula is obtained:
I light x A light x
where A light x is the atmospheric light value estimated by the light channel. Equation (16) is obtained through Equations (14) and (15):
A light x = max c { r , g , b } max y Ω x I c y
It is concluded that the atmospheric light value of the foggy image is obtained by its corresponding light channel value. In order to enhance the robustness of the atmospheric light value, the light channel and the mixed dark channel are combined to adjust the calculation of the atmospheric light value, which avoids a higher estimation of atmospheric light value only by dark channel. A novel atmospheric light value estimation model is proposed and is expressed:
A x = m A light x + n A 0
where A 0 is calculated by the mean value of the original fog image pixels, which correspond to the brightest 0.1% pixels in the mixed dark channel image. m and n are adjusting parameters. The intensity of the atmospheric light value is greater than that of the fog-free image, i.e., J x A x . In addition, t x 0 , 1 is obtained from Equation (6), so J x I x A x . According to the previous steps, the calculation processes of A light x and A 0 involve the maximum value of I x , so m + n < 1 . Since the pixel value of the light channel is close to the atmospheric light value of the fog-free image, m > n is usually set to guarantee that the atmospheric light value has a larger weight. Through a lot of experimental calculation and analysis of image quality evaluation standards, it is concluded that when m = 0.7 , n = 0.15 , the evaluation indexes of the restored image obtain the optimal value. Figure 5 shows the foggy image and its corresponding improved atmospheric light map.

3.4. An Adaptive Defogging Intensity Parameter Model

In He’s algorithm, the defogging intensity parameter ω is uniformly set as 0.95 to make the final restored image more real and natural. However, it is found that not all foggy images are restored to the best effect when ω takes the same value. Therefore, an adaptive method for defogging intensity parameters ω is proposed. To exploit the optimal parameter, many relevant experiments are conducted.
As shown in Figure 6, when ω = 0.65 and ω = 0.75, the defogging intensity is obviously insufficient; when ω = 0.95, the forest part begins to appear distorted due to excessive saturation, and the image details also become blurred. Furthermore, when ω = 1, the distortion becomes more serious. When ω = 0.85, the defogging effect on the house and the forest is noticeable, and the color saturation is moderate, which has a good visual effect. In a comprehensive comparison, when ω = 0.85, the overall defogging effect is the best. At this time, the atmospheric light value A 0 of the original image in Figure 6 is estimated to be 0.8387 through the dark channel prior, which is exactly the closest to the best defogging intensity parameter ω .
To further verify the relationship between the defogging intensity parameter and atmospheric light value, many experiments are conducted. As shown in Figure 7, when ω = 0.65, the buildings of the coastal city are partially restored, the detailed information is prominent, and the water color is more natural and true. When ω = 0.75, the watercolor of the restored image starts to become darkened, and the color of the building is saturated. When ω = 1, the water color and part of the building are too saturated, and the distortion is aggravated, which is not suitable for human observation. In a comprehensive comparison, when ω = 0.65, the overall restoration effect is the best. At this time, the atmospheric light value A 0 of the original image in Figure 7 is estimated to be 0.6135 through the dark channel prior, which is the closest to the best defogging intensity parameter ω .
Figure 8 show that when ω = 0.65 and ω = 0.75, there is still a lot of fog remaining in the restored image. When ω = 0.85 and ω = 0.95, the dehazing effect is more obvious, but there is still a small amount of fog in the water. When ω = 1, the restoration effect of the water area, coastal vegetation, and buildings performs well. In a comprehensive comparison, when ω = 1, the overall restoration effect is the best. At this time, the atmospheric light value A 0 of the original image in Figure 6 is estimated to be 0.9712 through the dark channel prior, which is exactly the closest to the best defogging intensity parameter ω .
A large number of experimental results show that the value of ω is not fixed, and it has its best value in different images. According to the experimental results not limited to those listed above, ω is related to the atmospheric light value A 0 estimated by dark channel prior. The closer ω is to A 0 , the better the defogging effect is. Therefore, the value of ω is taken as the value of A 0 . Equation (7) is improved here as:
t x = 1 A 0 min c { r , g , b } min y Ω x I c y A c x

3.5. Brightness/Color Compensation Model Based on Visual Perception

In order to observe the defogging algorithm more intuitively, Equation (13) is transformed as follows:
J Y x = A Y x + I Y x A Y x t Y x
When calculating the atmospheric light value in YcbCr color space, the first 0.1% of the brightest pixels in the traditional dark channel image are directly used to find the corresponding pixels of the original foggy image in YcbCr color space, and their average value as the atmospheric light value is calculated, as shown in Equation (20):
A Y = m e a n max J Y dark x
According to Equation (18), Equation (21) is obtained in YcbCr color space as follows:
t Y x = 1 A 0 min d { y , c b , c r } min y Ω x I d y A Y
where I d y represents the foggy image of a specific channel in YcbCr color space, and t Y x represents the initial transmittance estimated in YcbCr color space. The flow chart of the refinement of the rough transmittance in YcbCr color space is shown in Figure 9.
The restored images in RGB and YcbCr color space are weighted and fused to enhance the sense of reality and color saturation:
J x = p J c x + q J Y x
where p , q are adjustment parameters. Both parameters are constants and satisfy p + q = 1 ; J c x represents the restored image in RGB color space; J Y x represents the restored image in YcbCr color space; J x represents the final restored image. The values of the adjustment parameters are determined through a lot of experiments, and the experimental results are listed as follows:
Figure 10 show that when p > 0.5 and q < 0.5, the intensity of defogging is lacking, and a small amount of fog remains in the image. When p < 0.5 and q > 0.5, the image is distorted. When p = q = 0.5, the defogging effect performs well, the color saturation is moderate, and the detailed information is kept intact, achieving the ideal defogging effect. Therefore, the parameters are set as p = q = 0.5.

3.6. Restoration of Fog-Free Images

In conclusion, a fog-free image has been obtained. In the improved atmospheric light scattering model, the atmospheric light image is obtained by the proposed dark-light channel fusion model, and the gray image of the original image is introduced as the guide image to refine the transmittance. Then the restored images are obtained in RGB and YcbCr color space, respectively. Finally, the brightness/color compensation model based on visual perception is carried out. The image of the defogging process is shown in Figure 11.

4. Integrated Performance and Discussion

In this paper, we first build a database that contains 50 images of fog with different concentrations and their corresponding defogged images created by five dehazing algorithms. Sections of the foggy remote sensing images are shown in Figure 12.

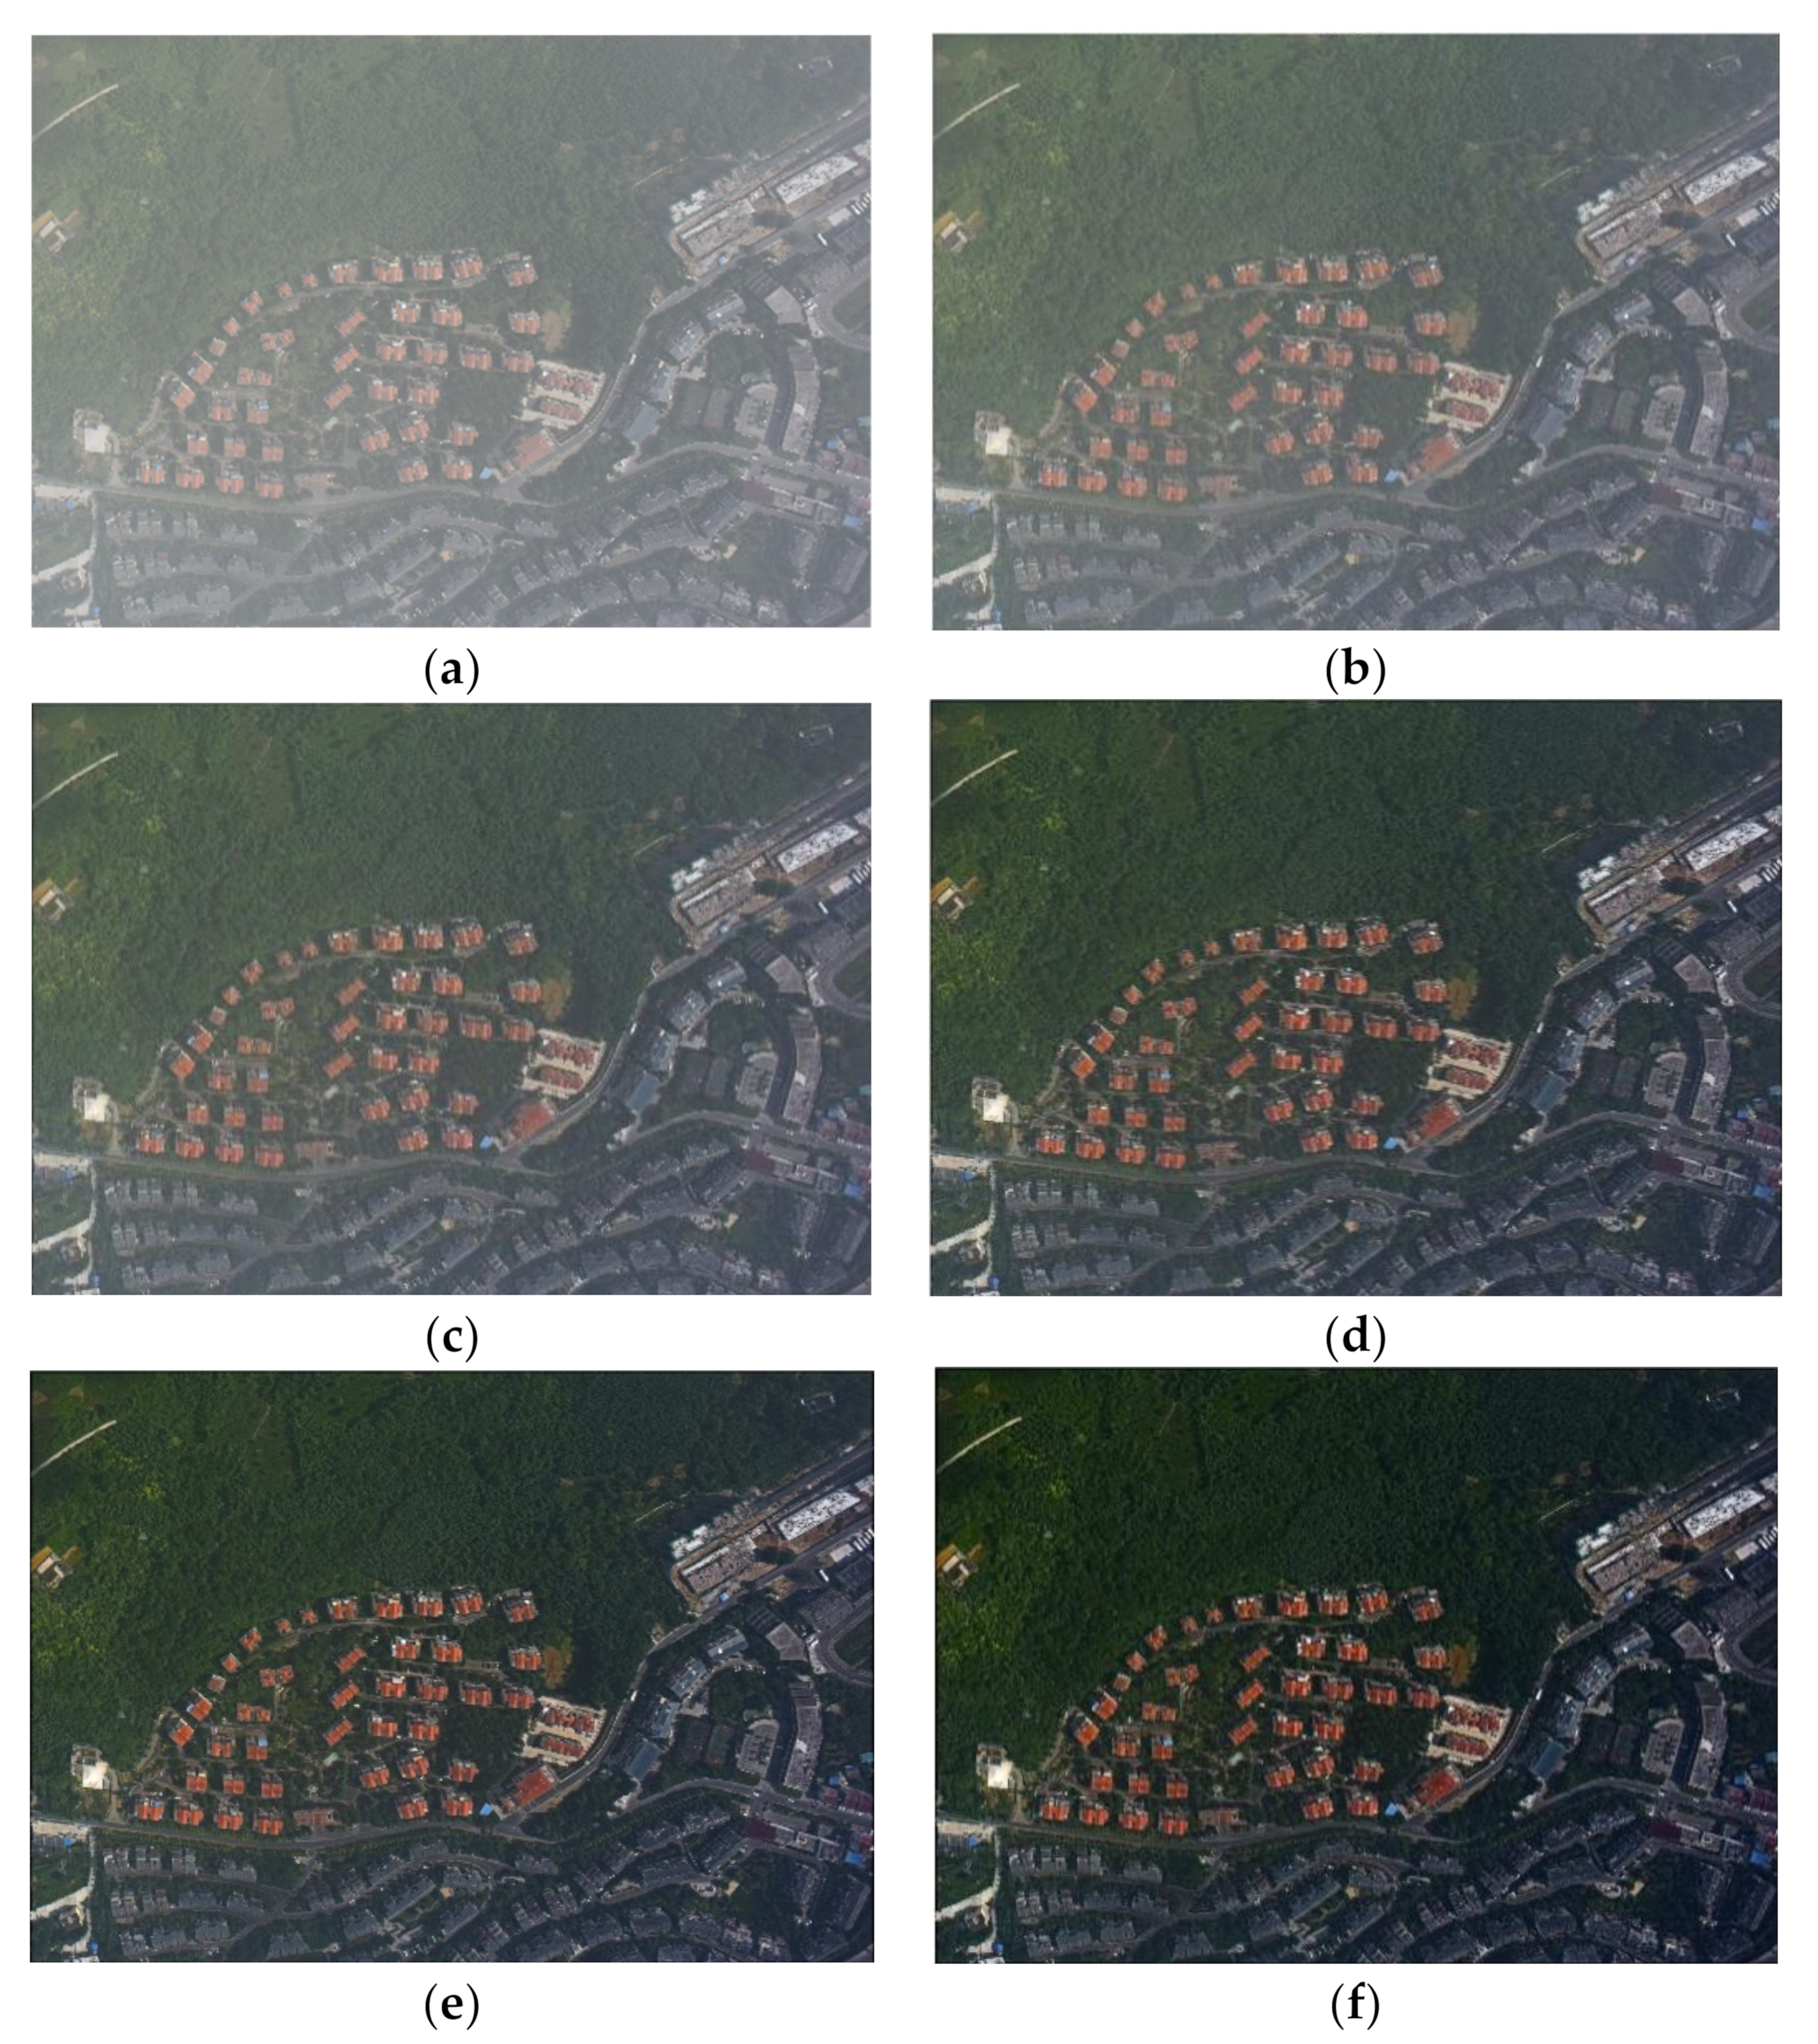
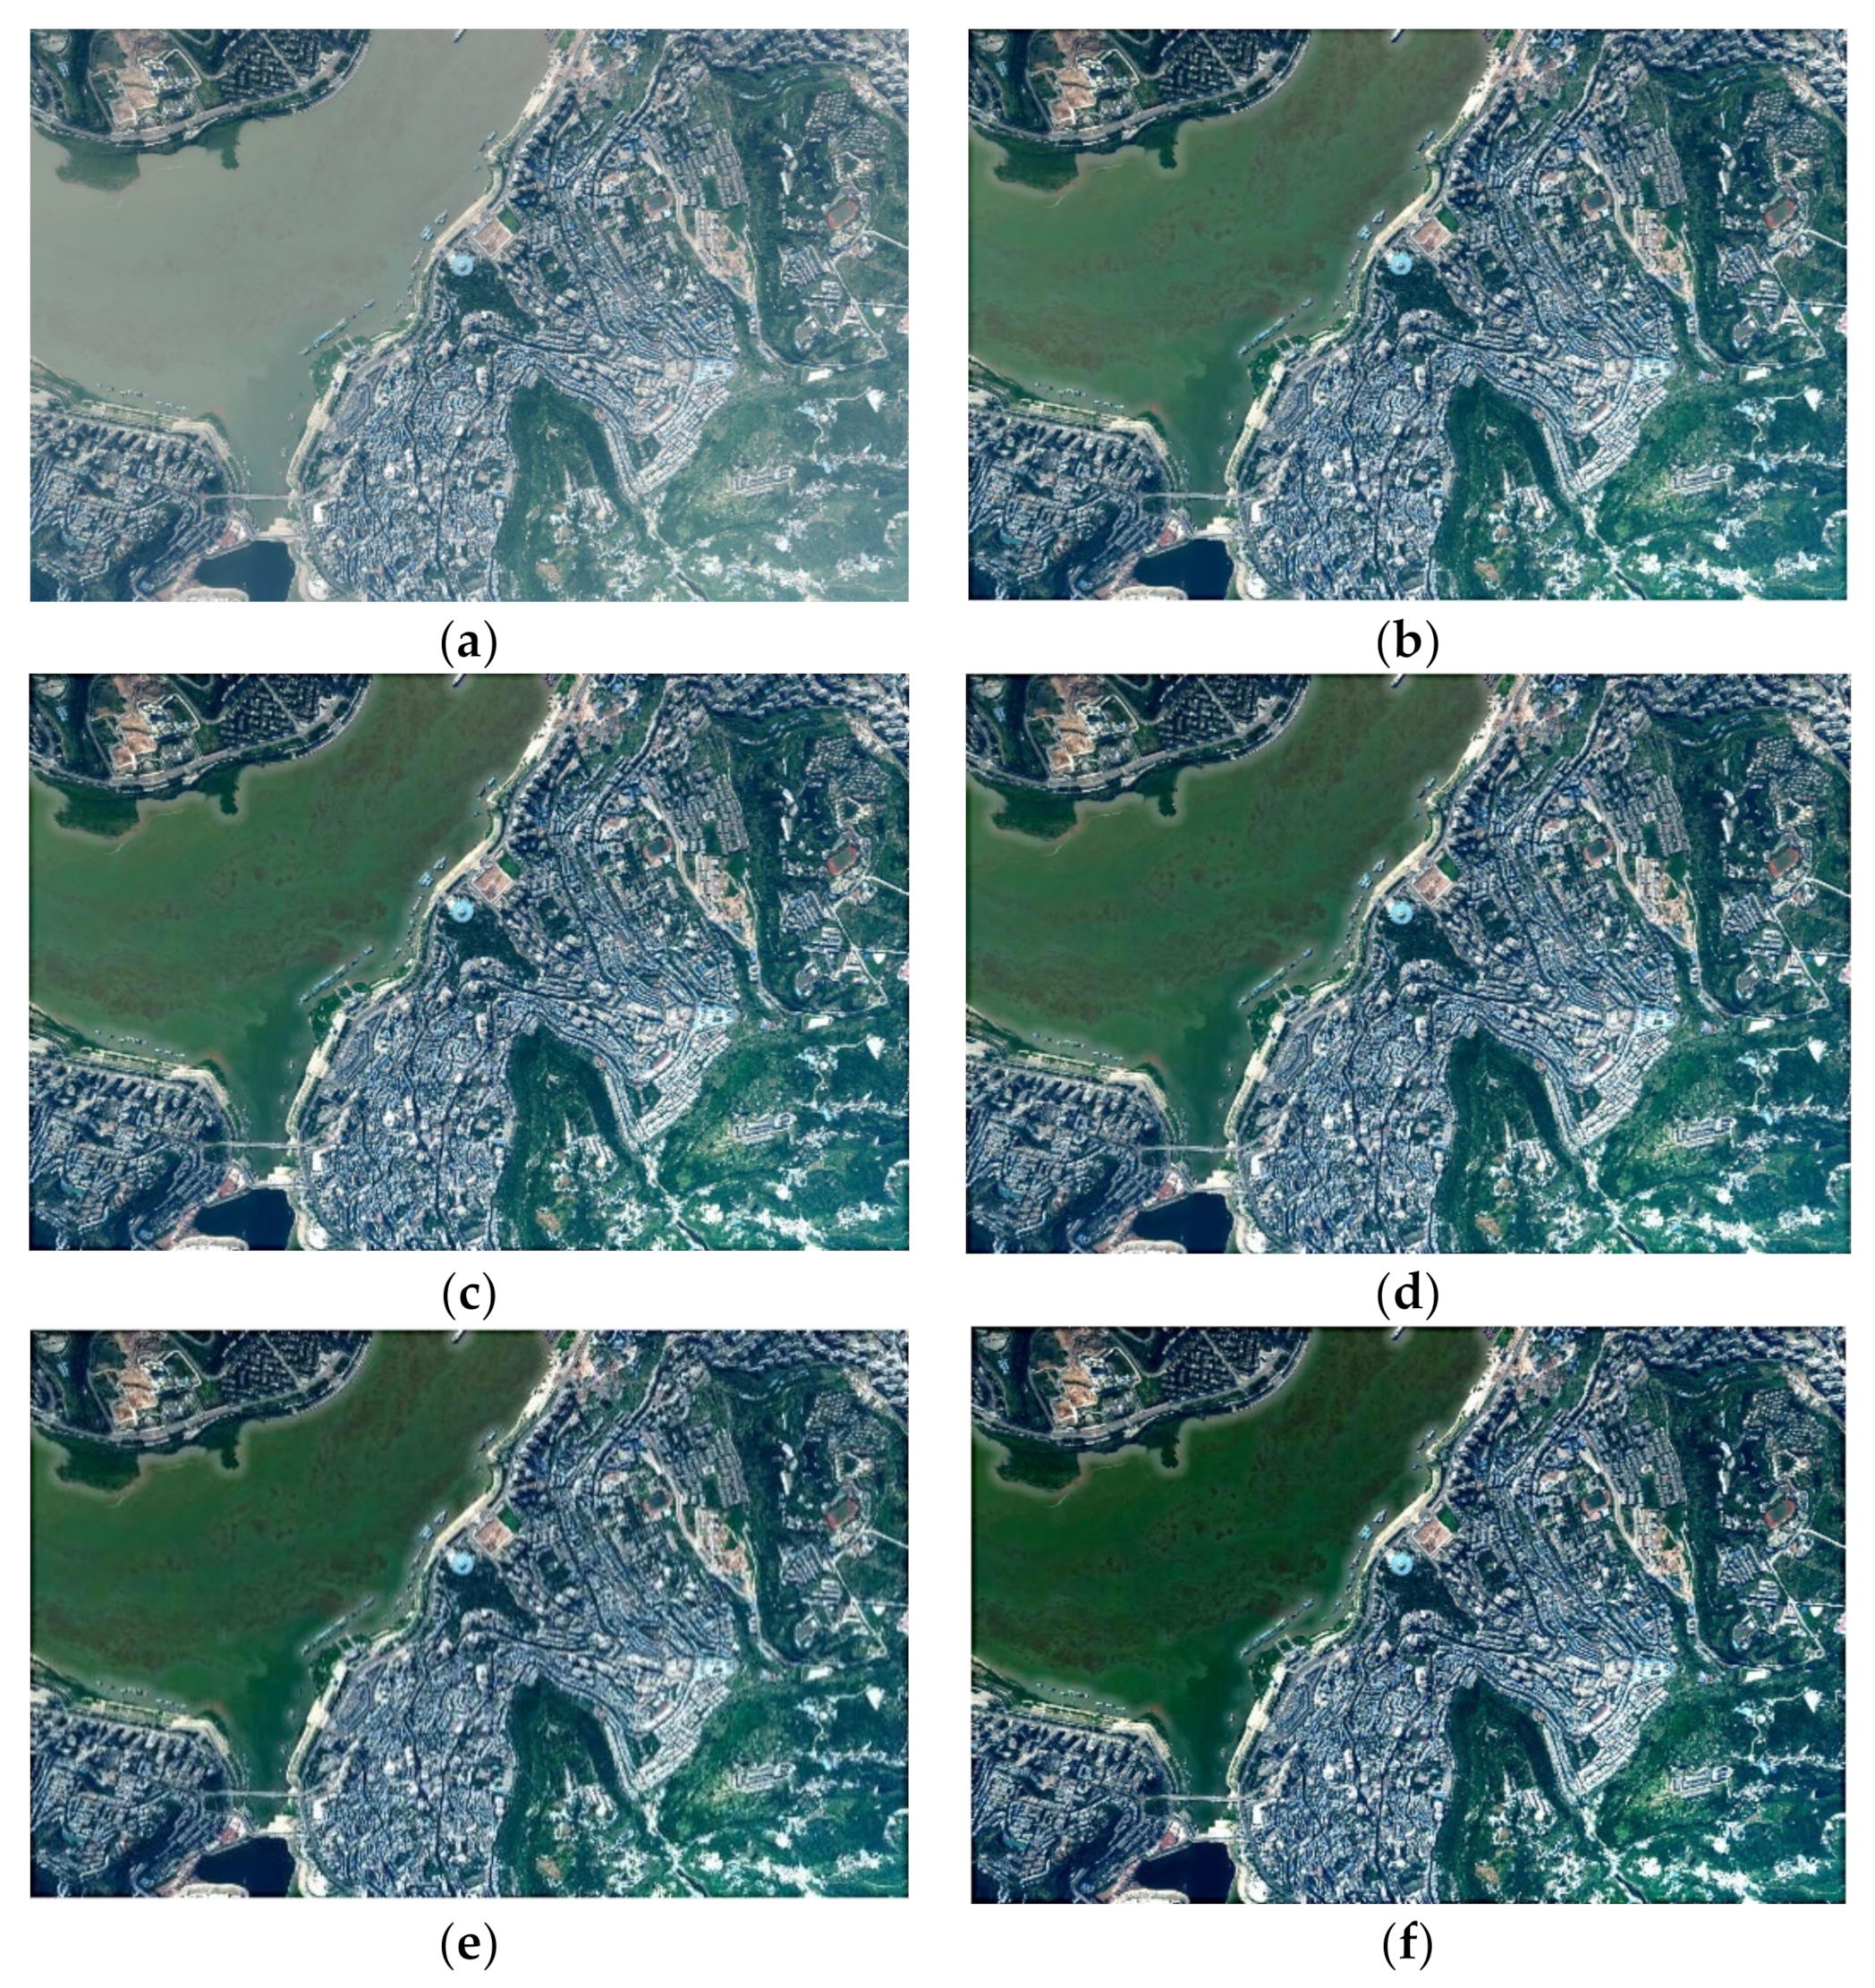
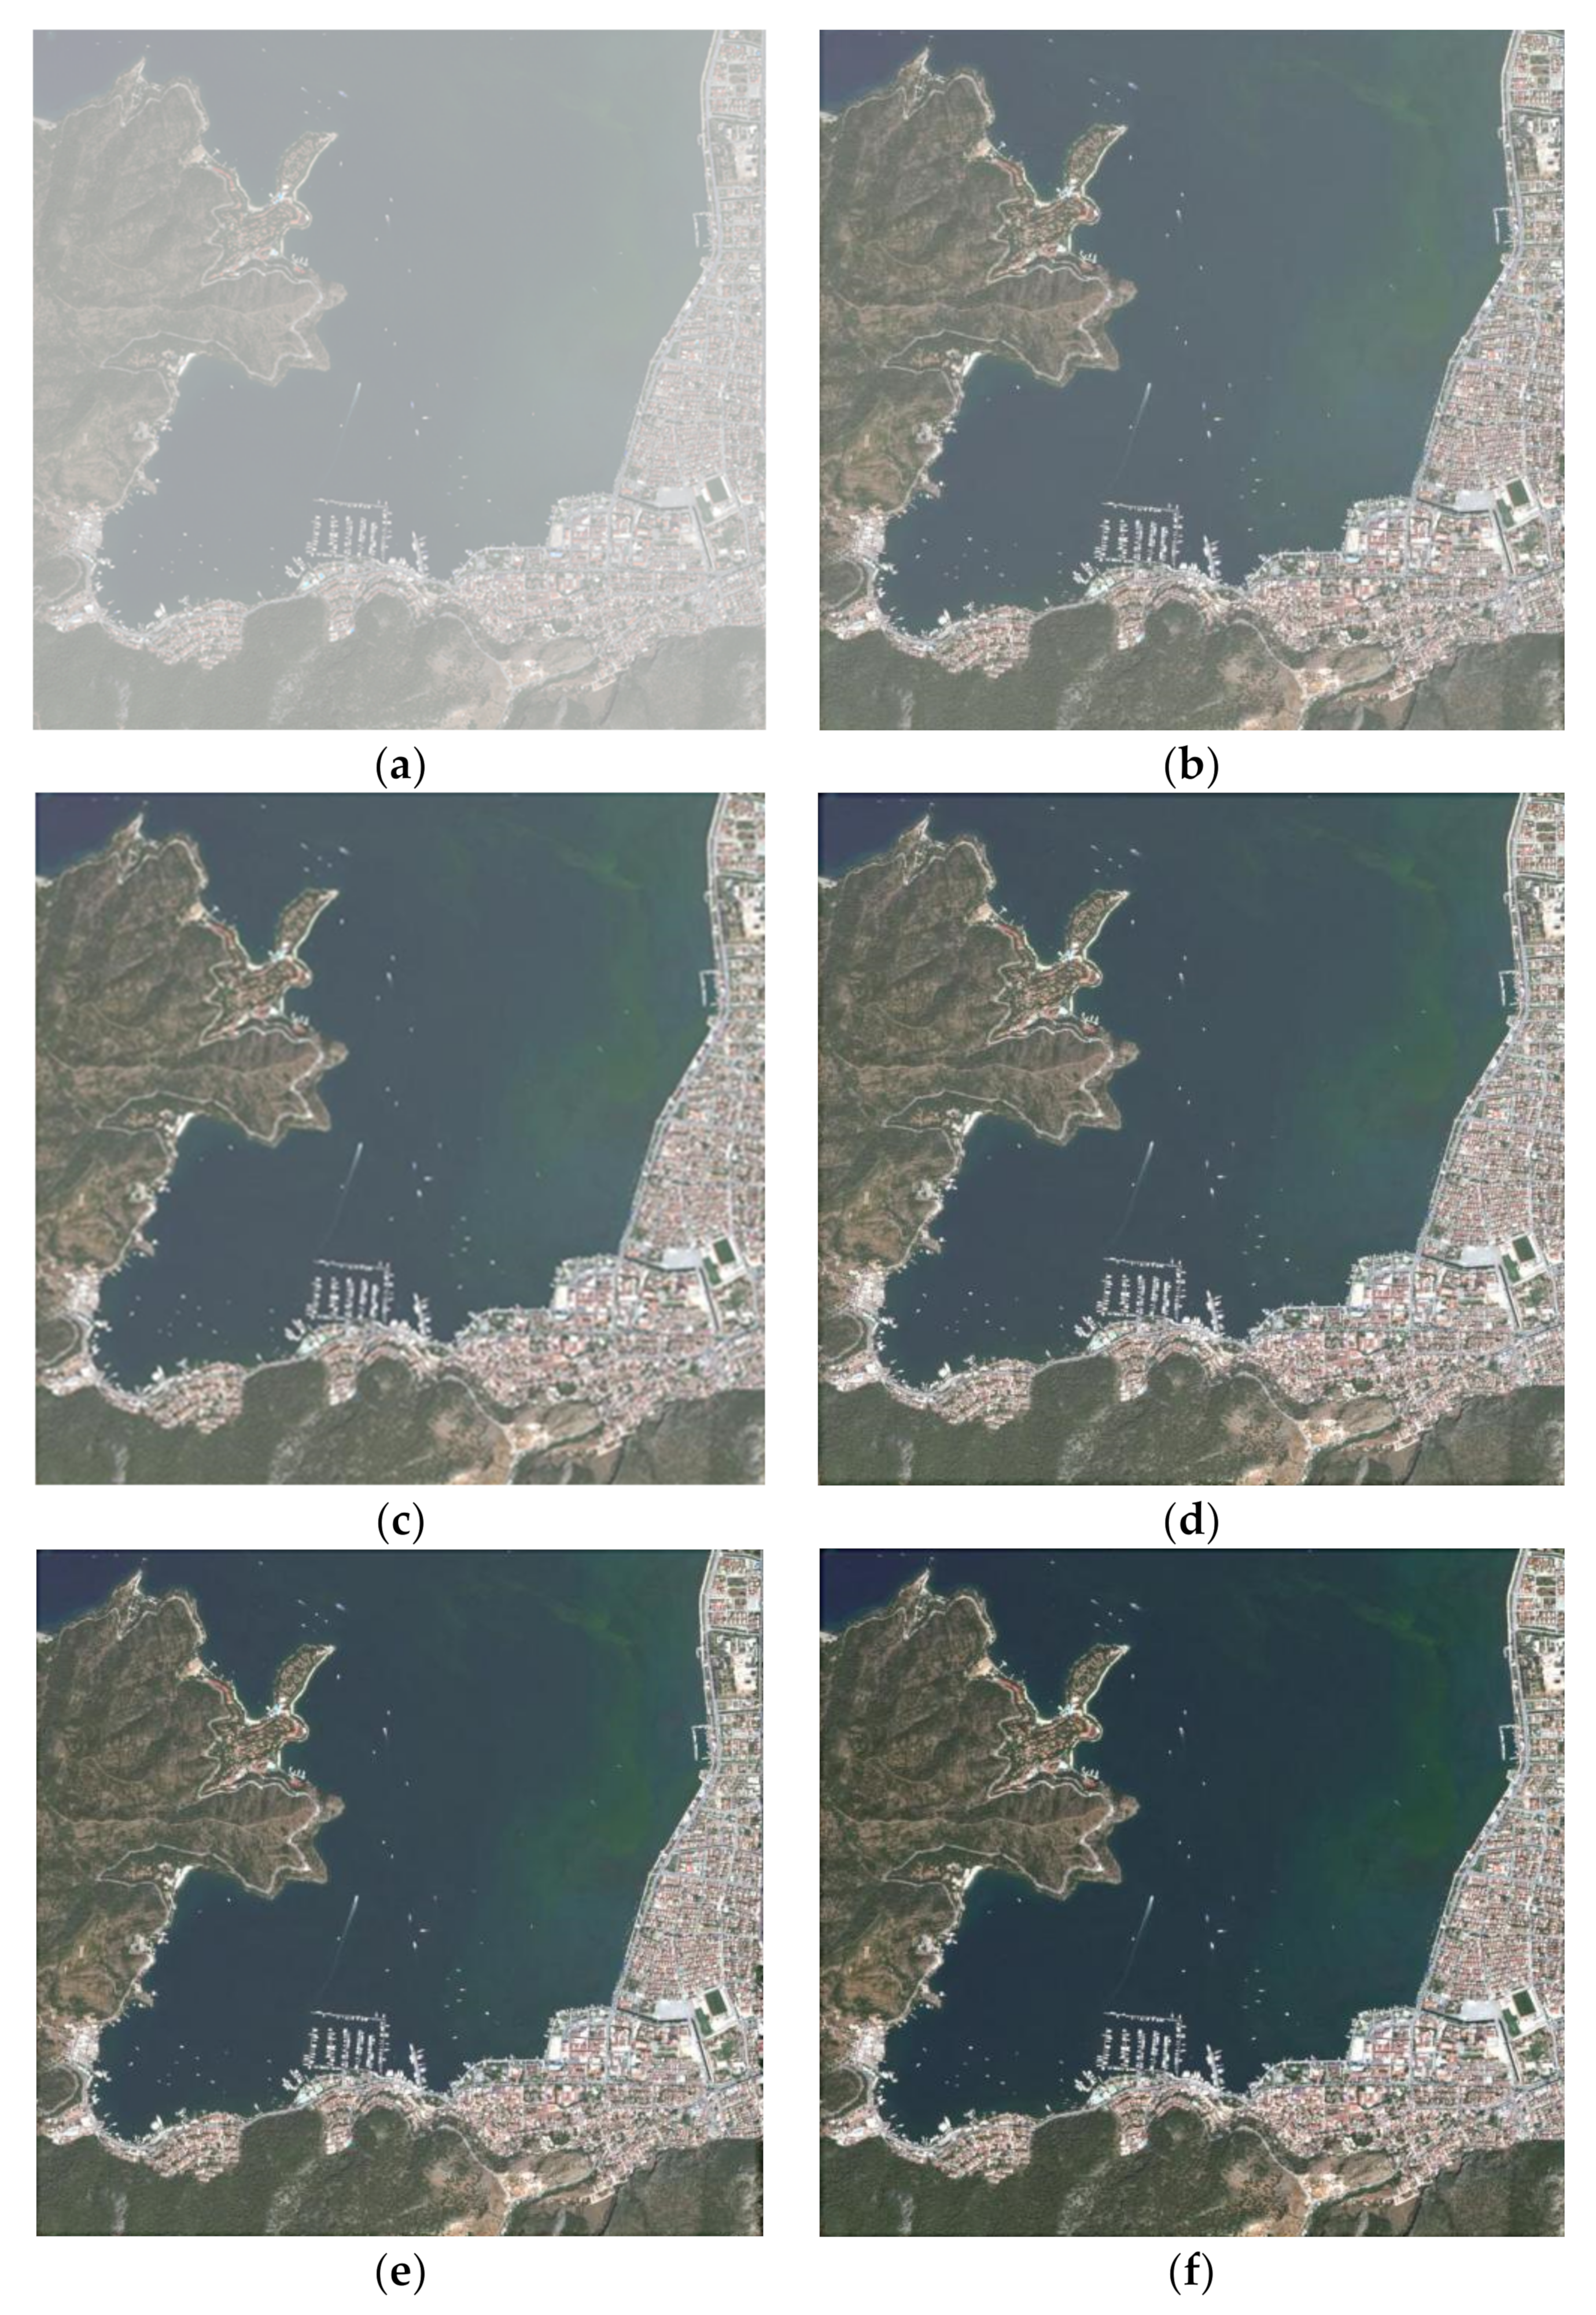
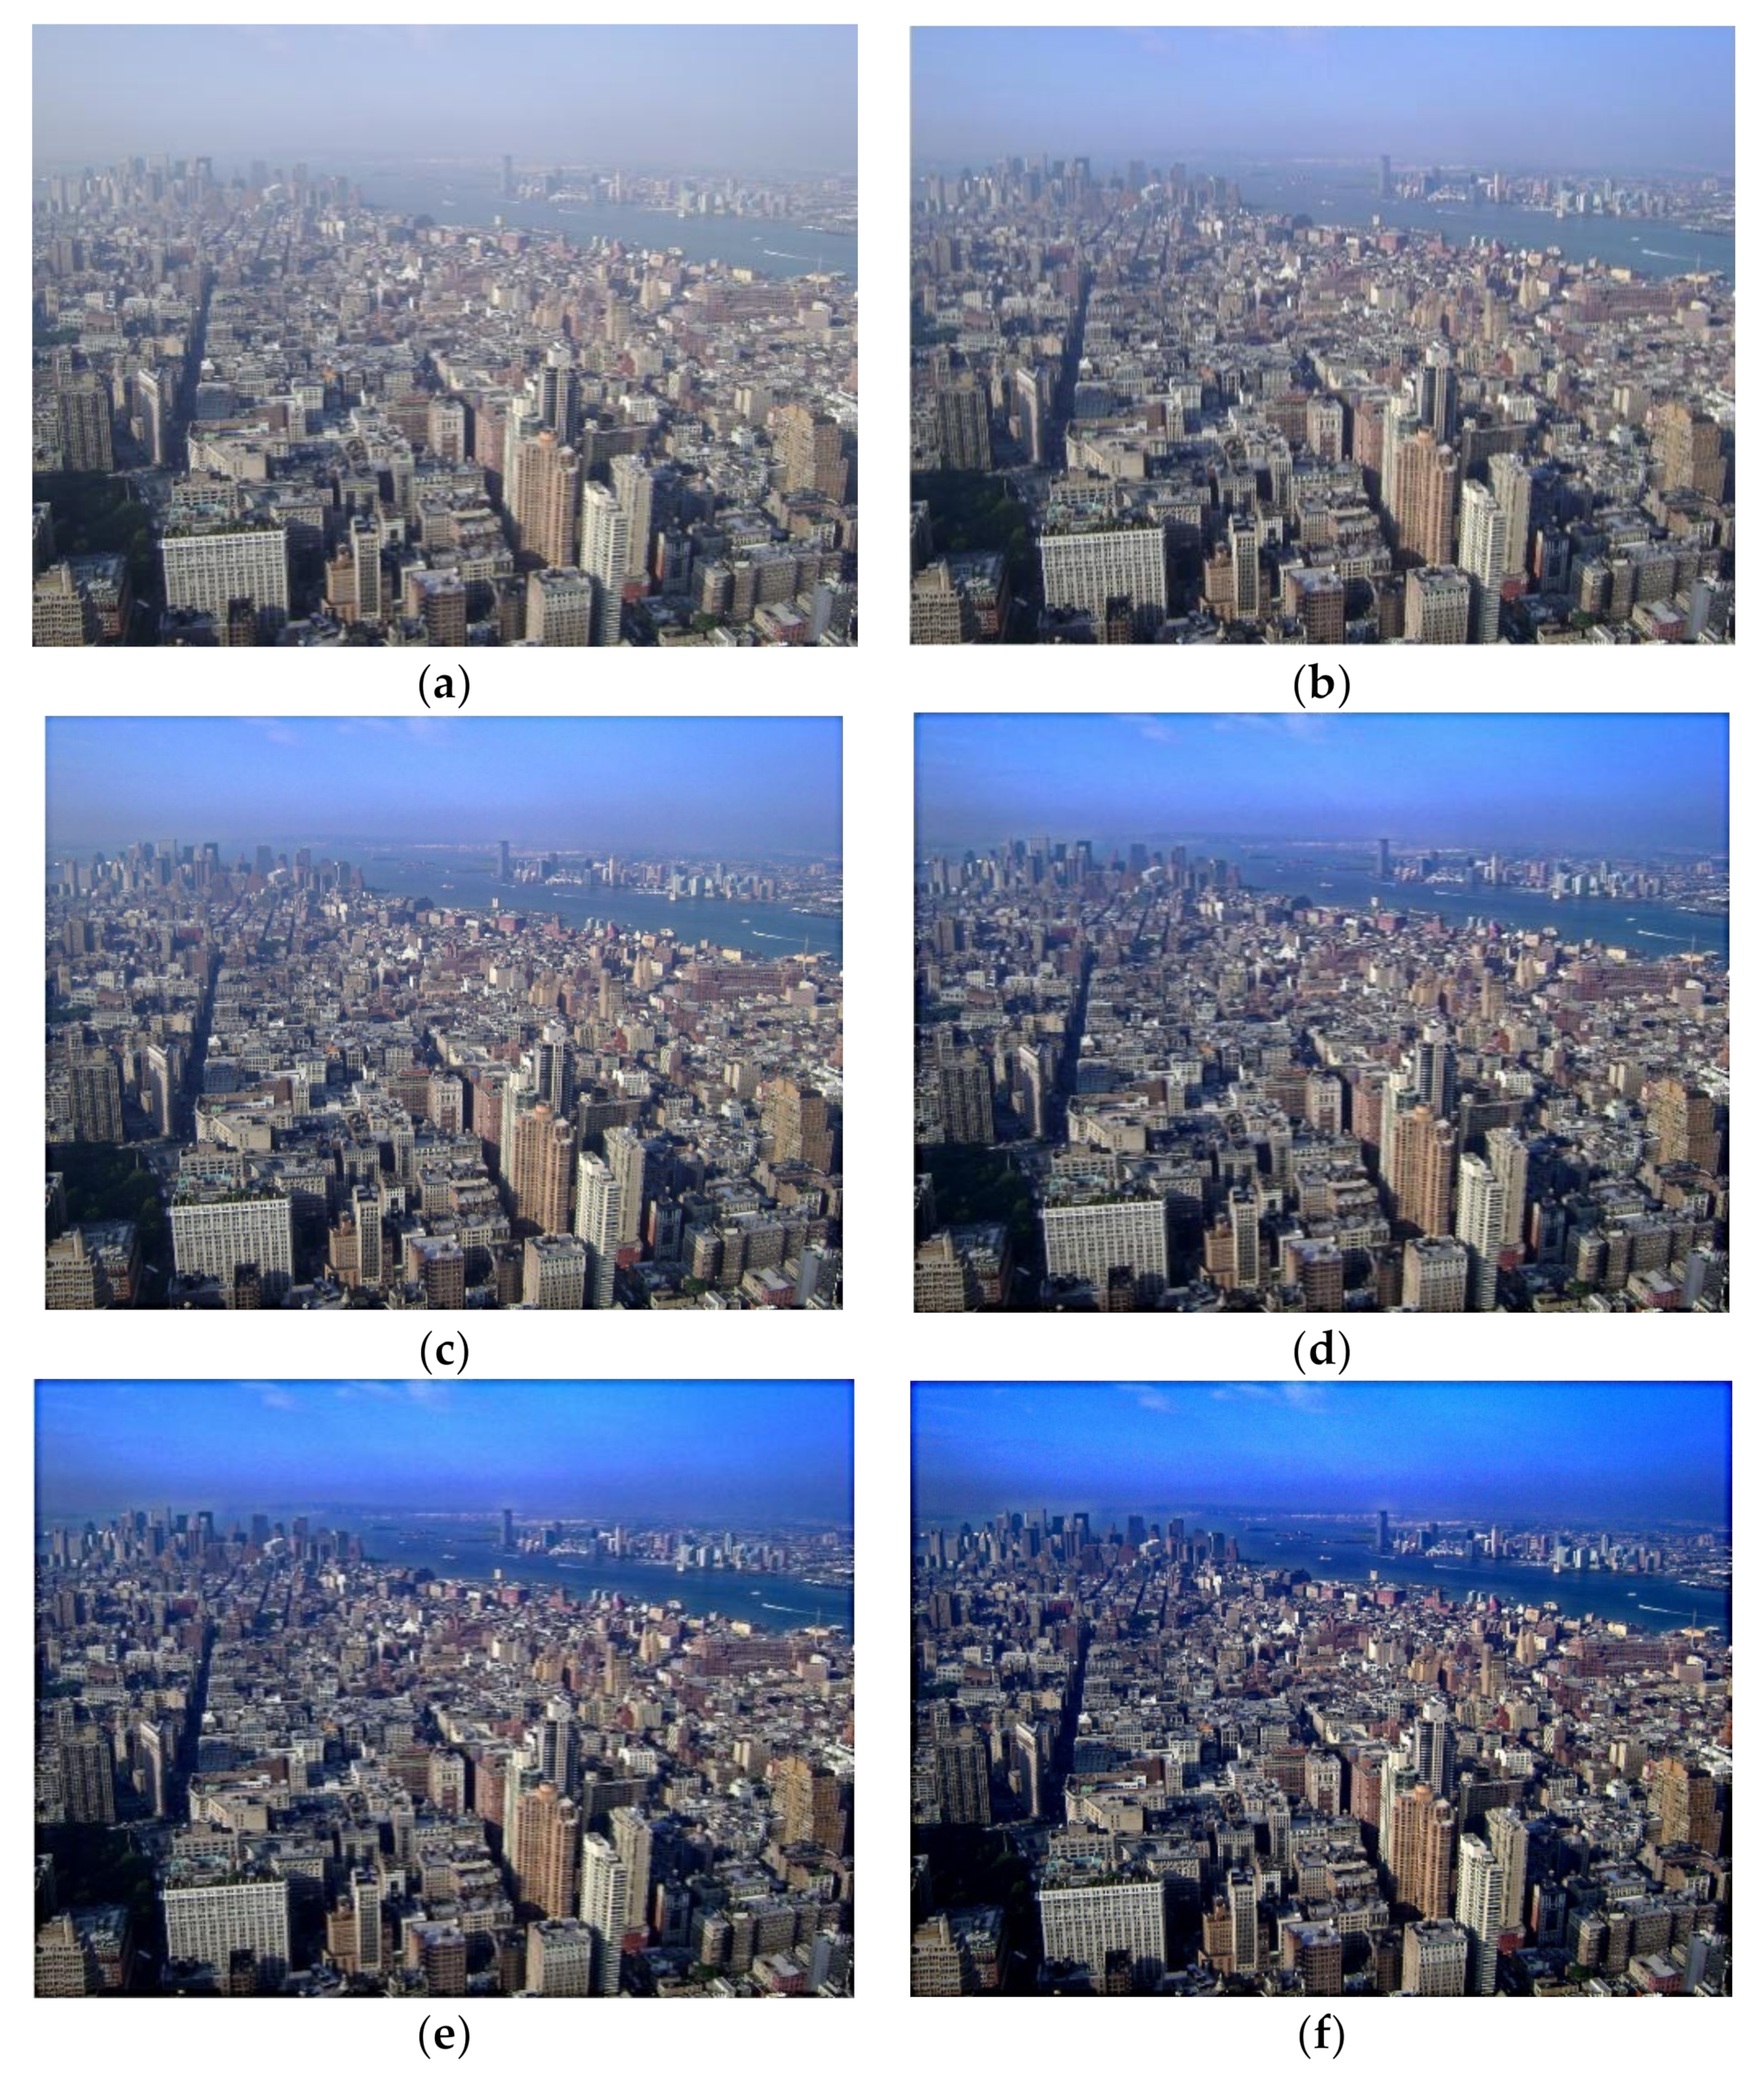
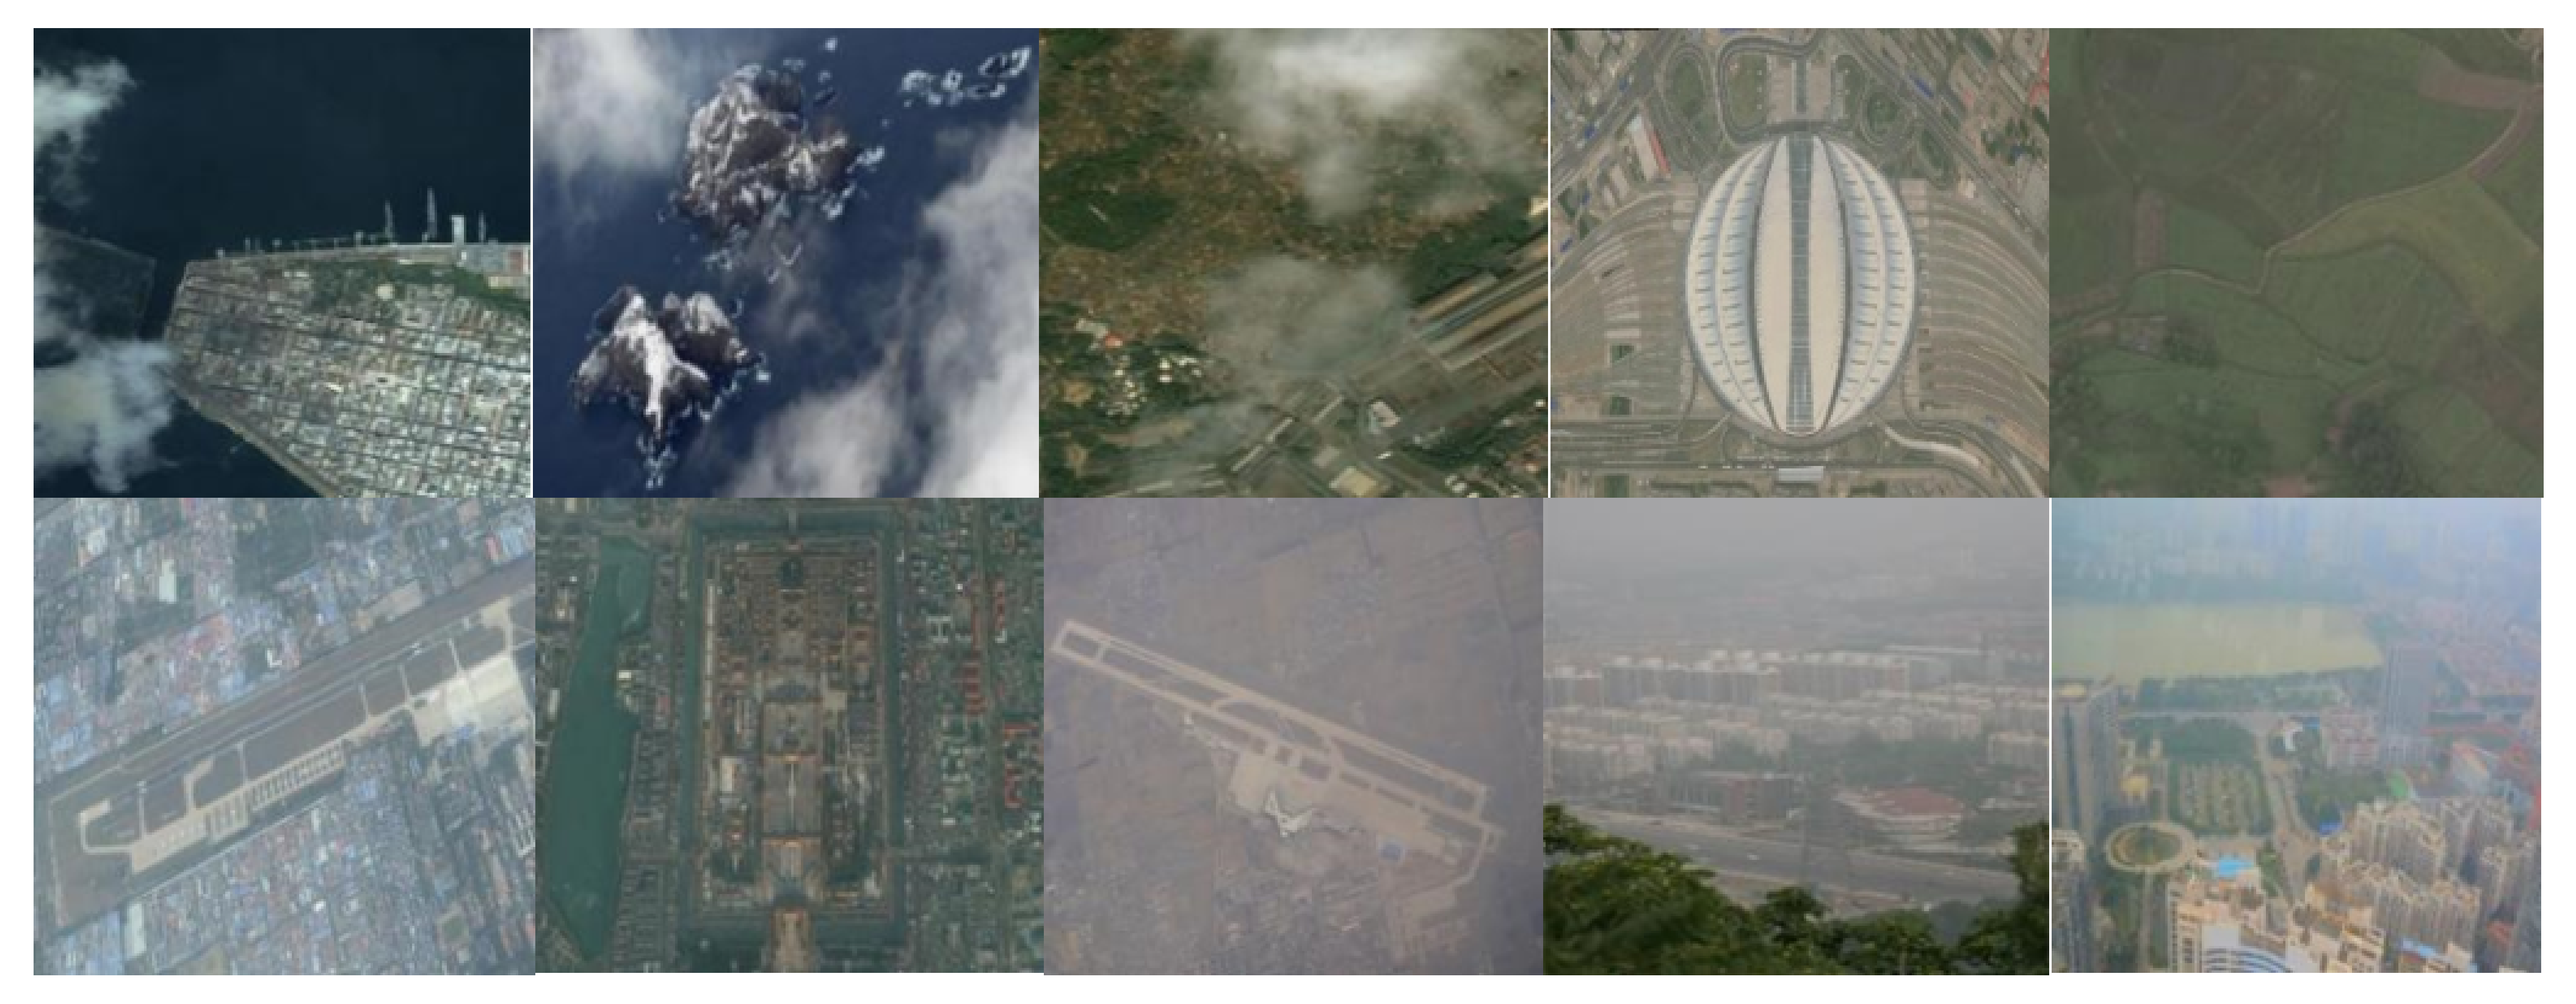
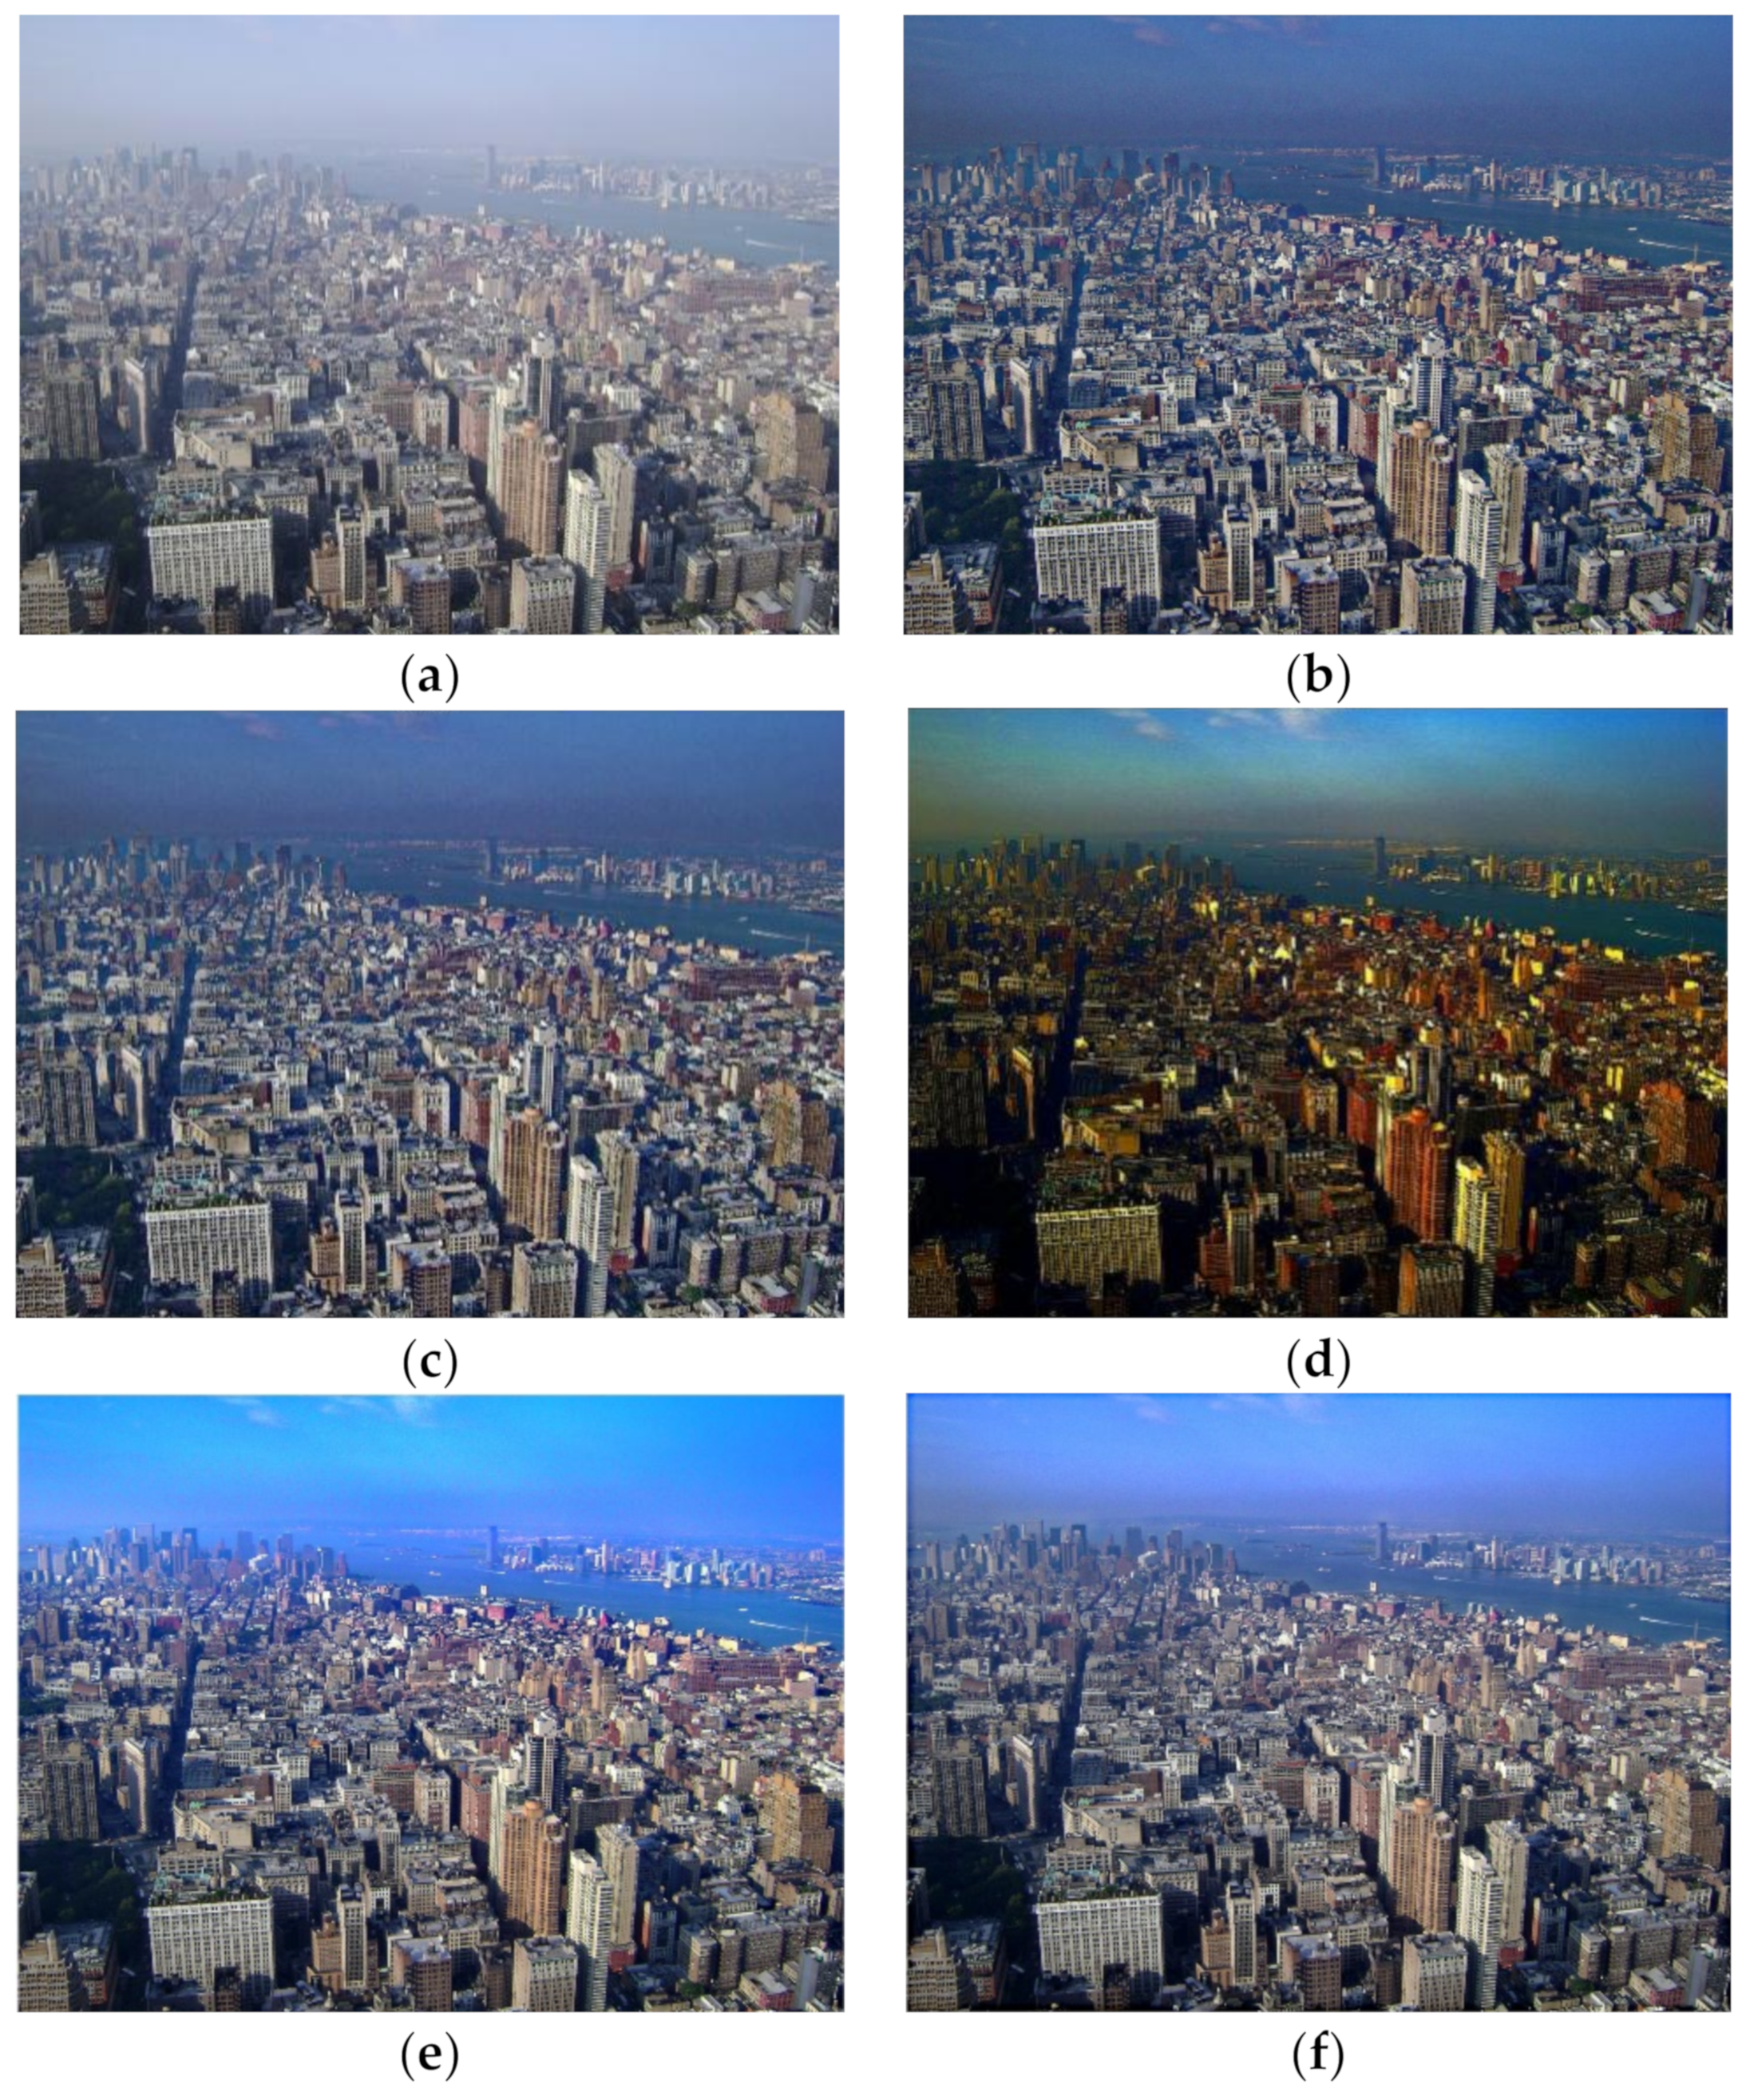
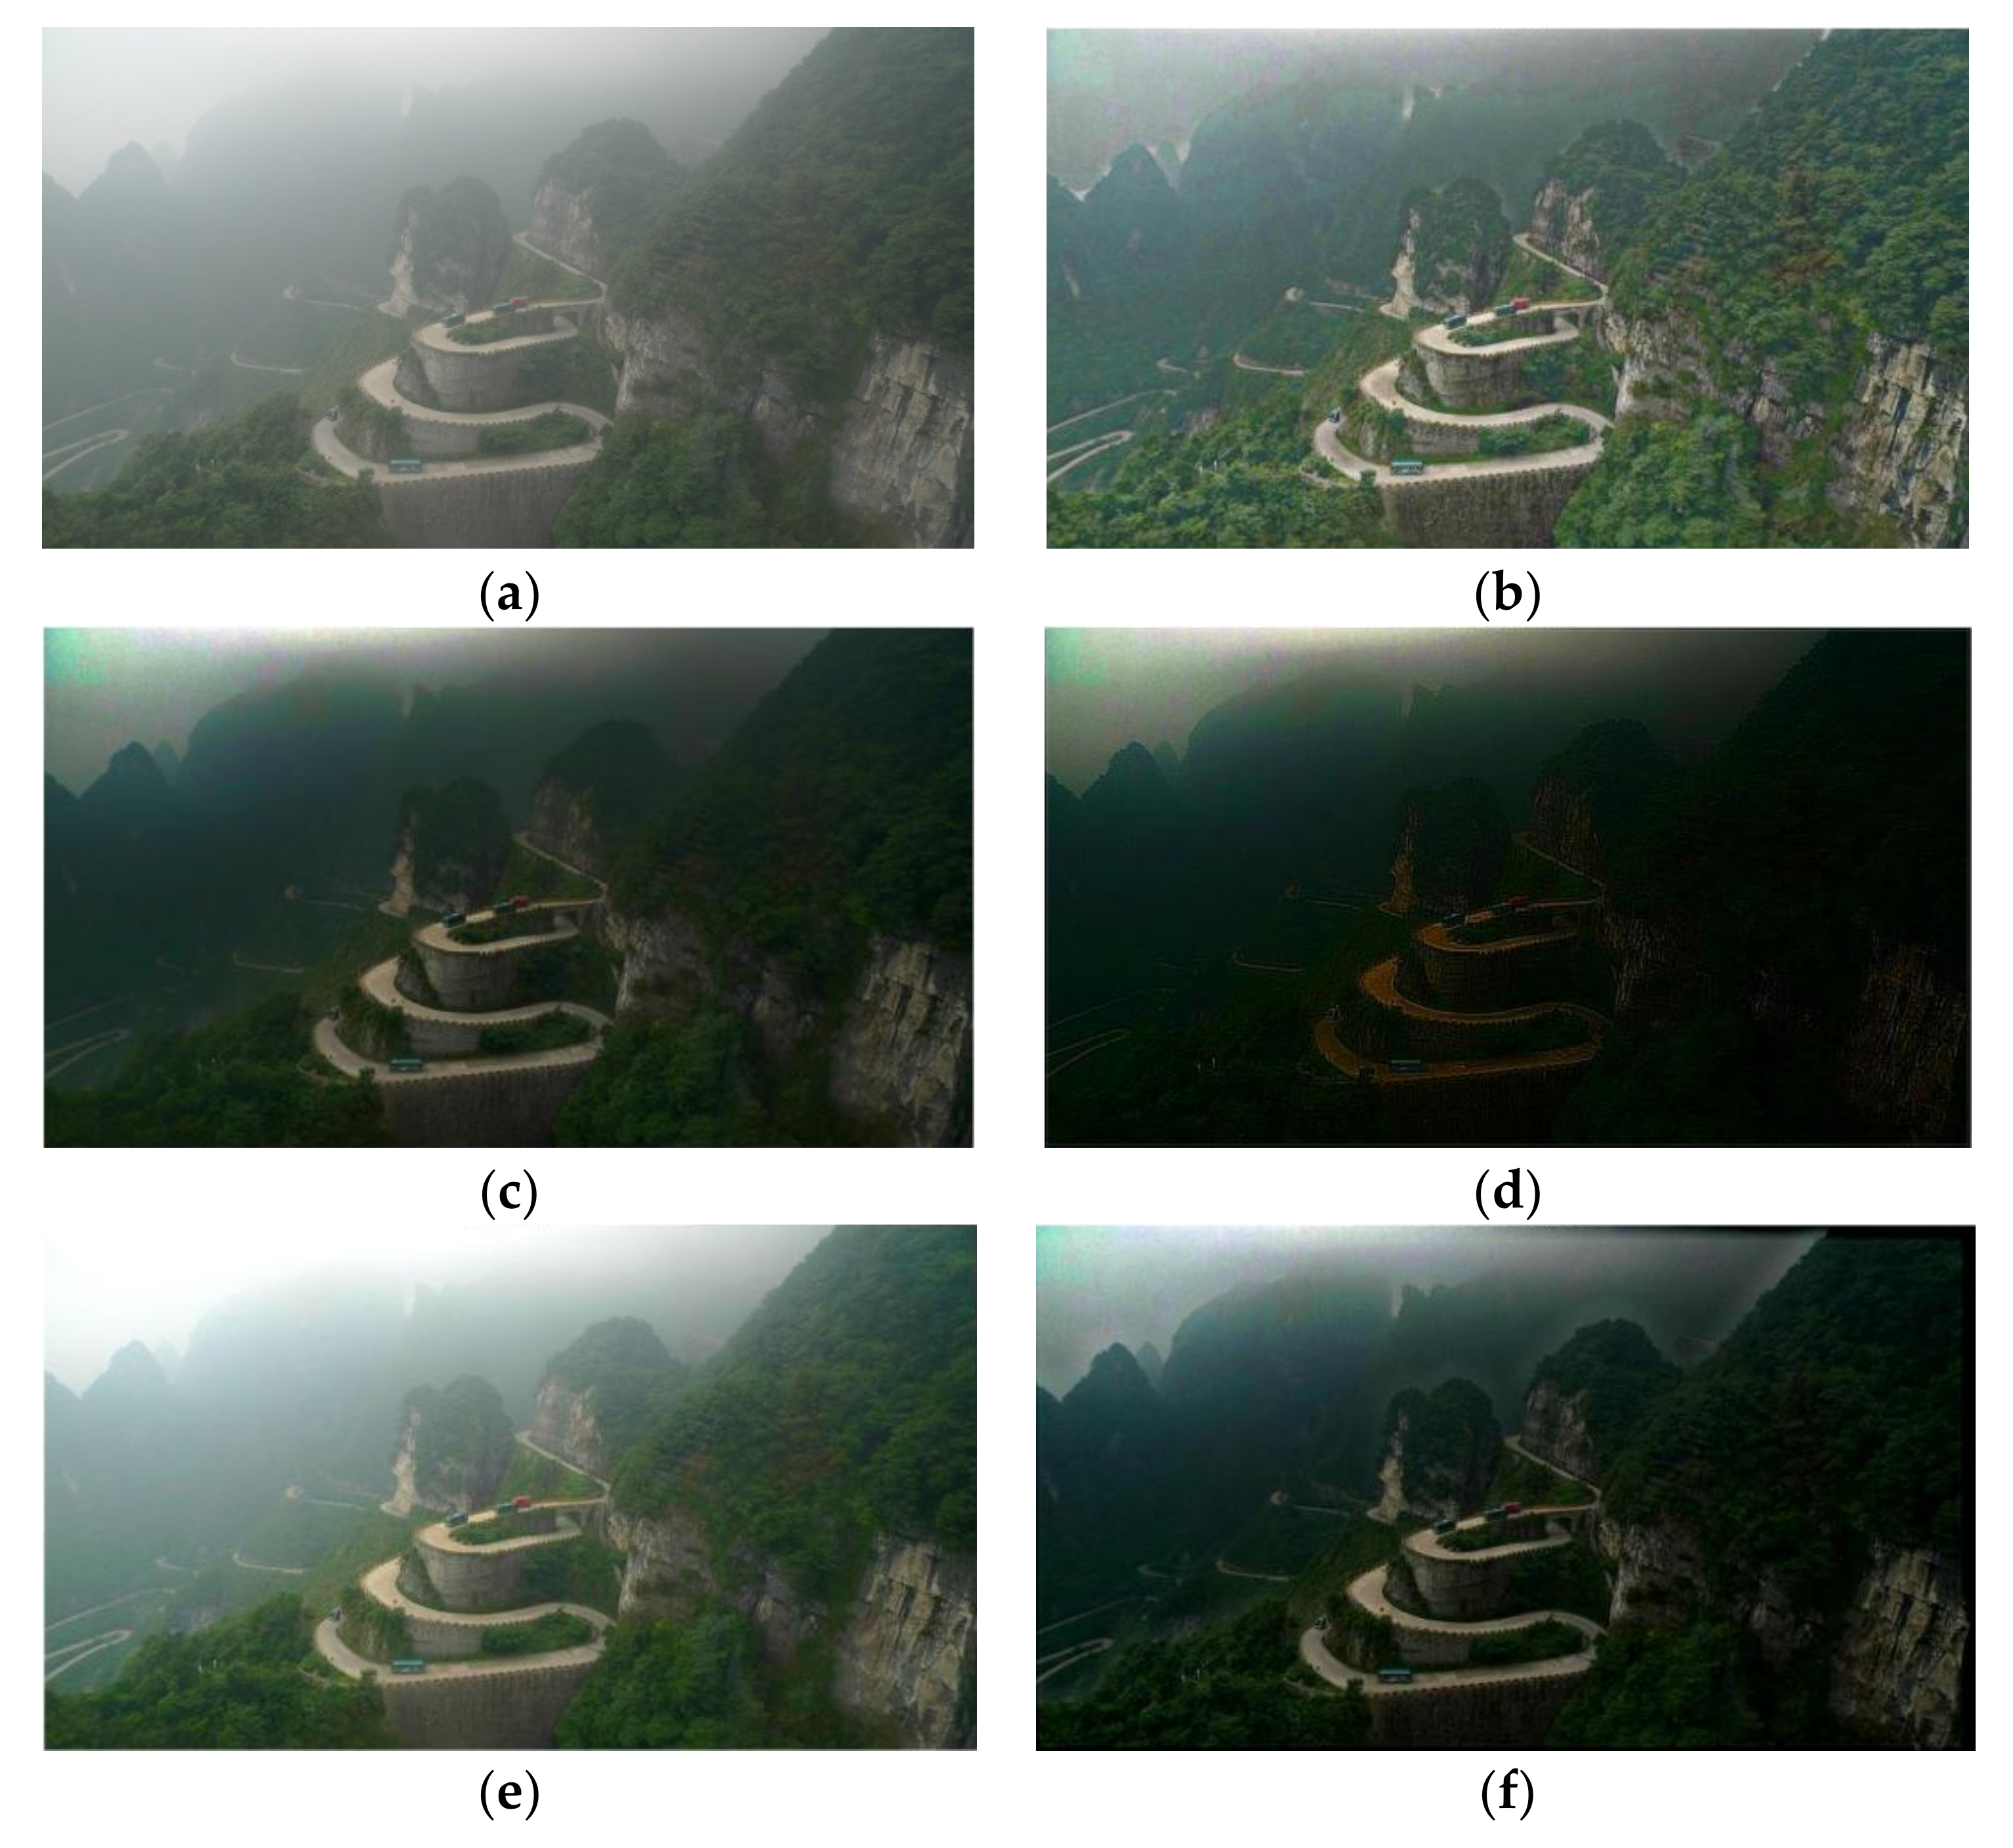
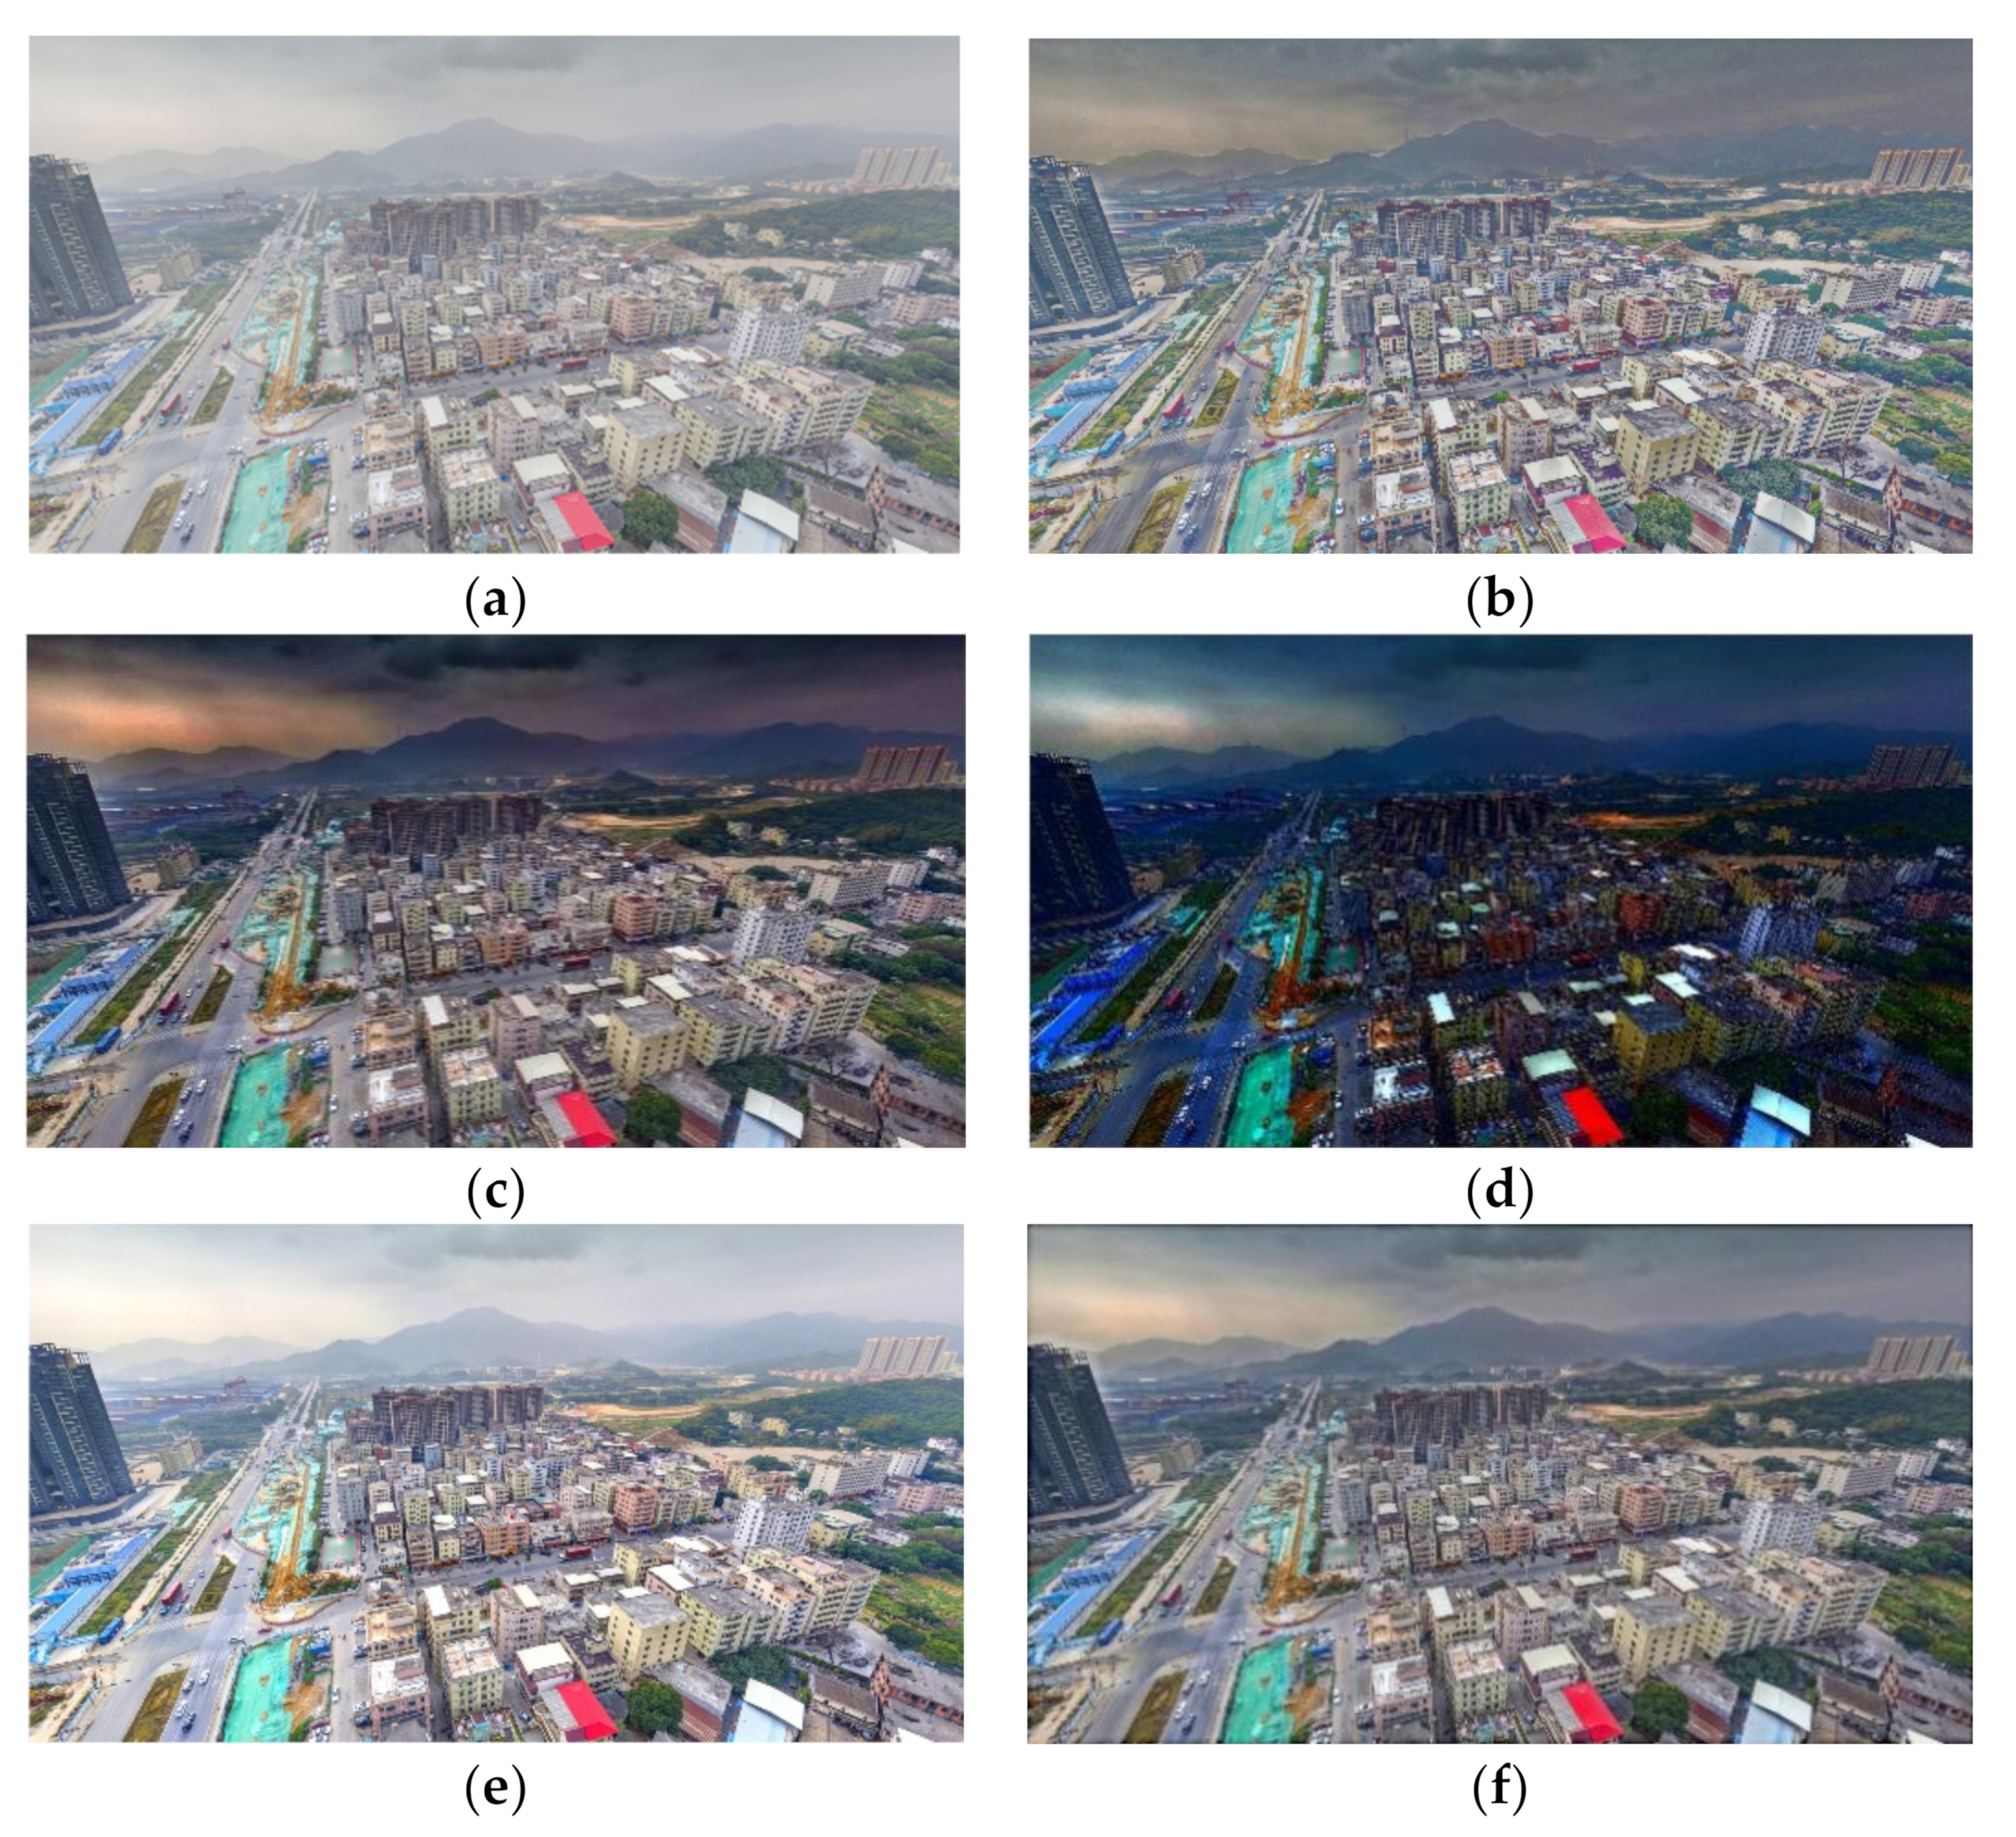
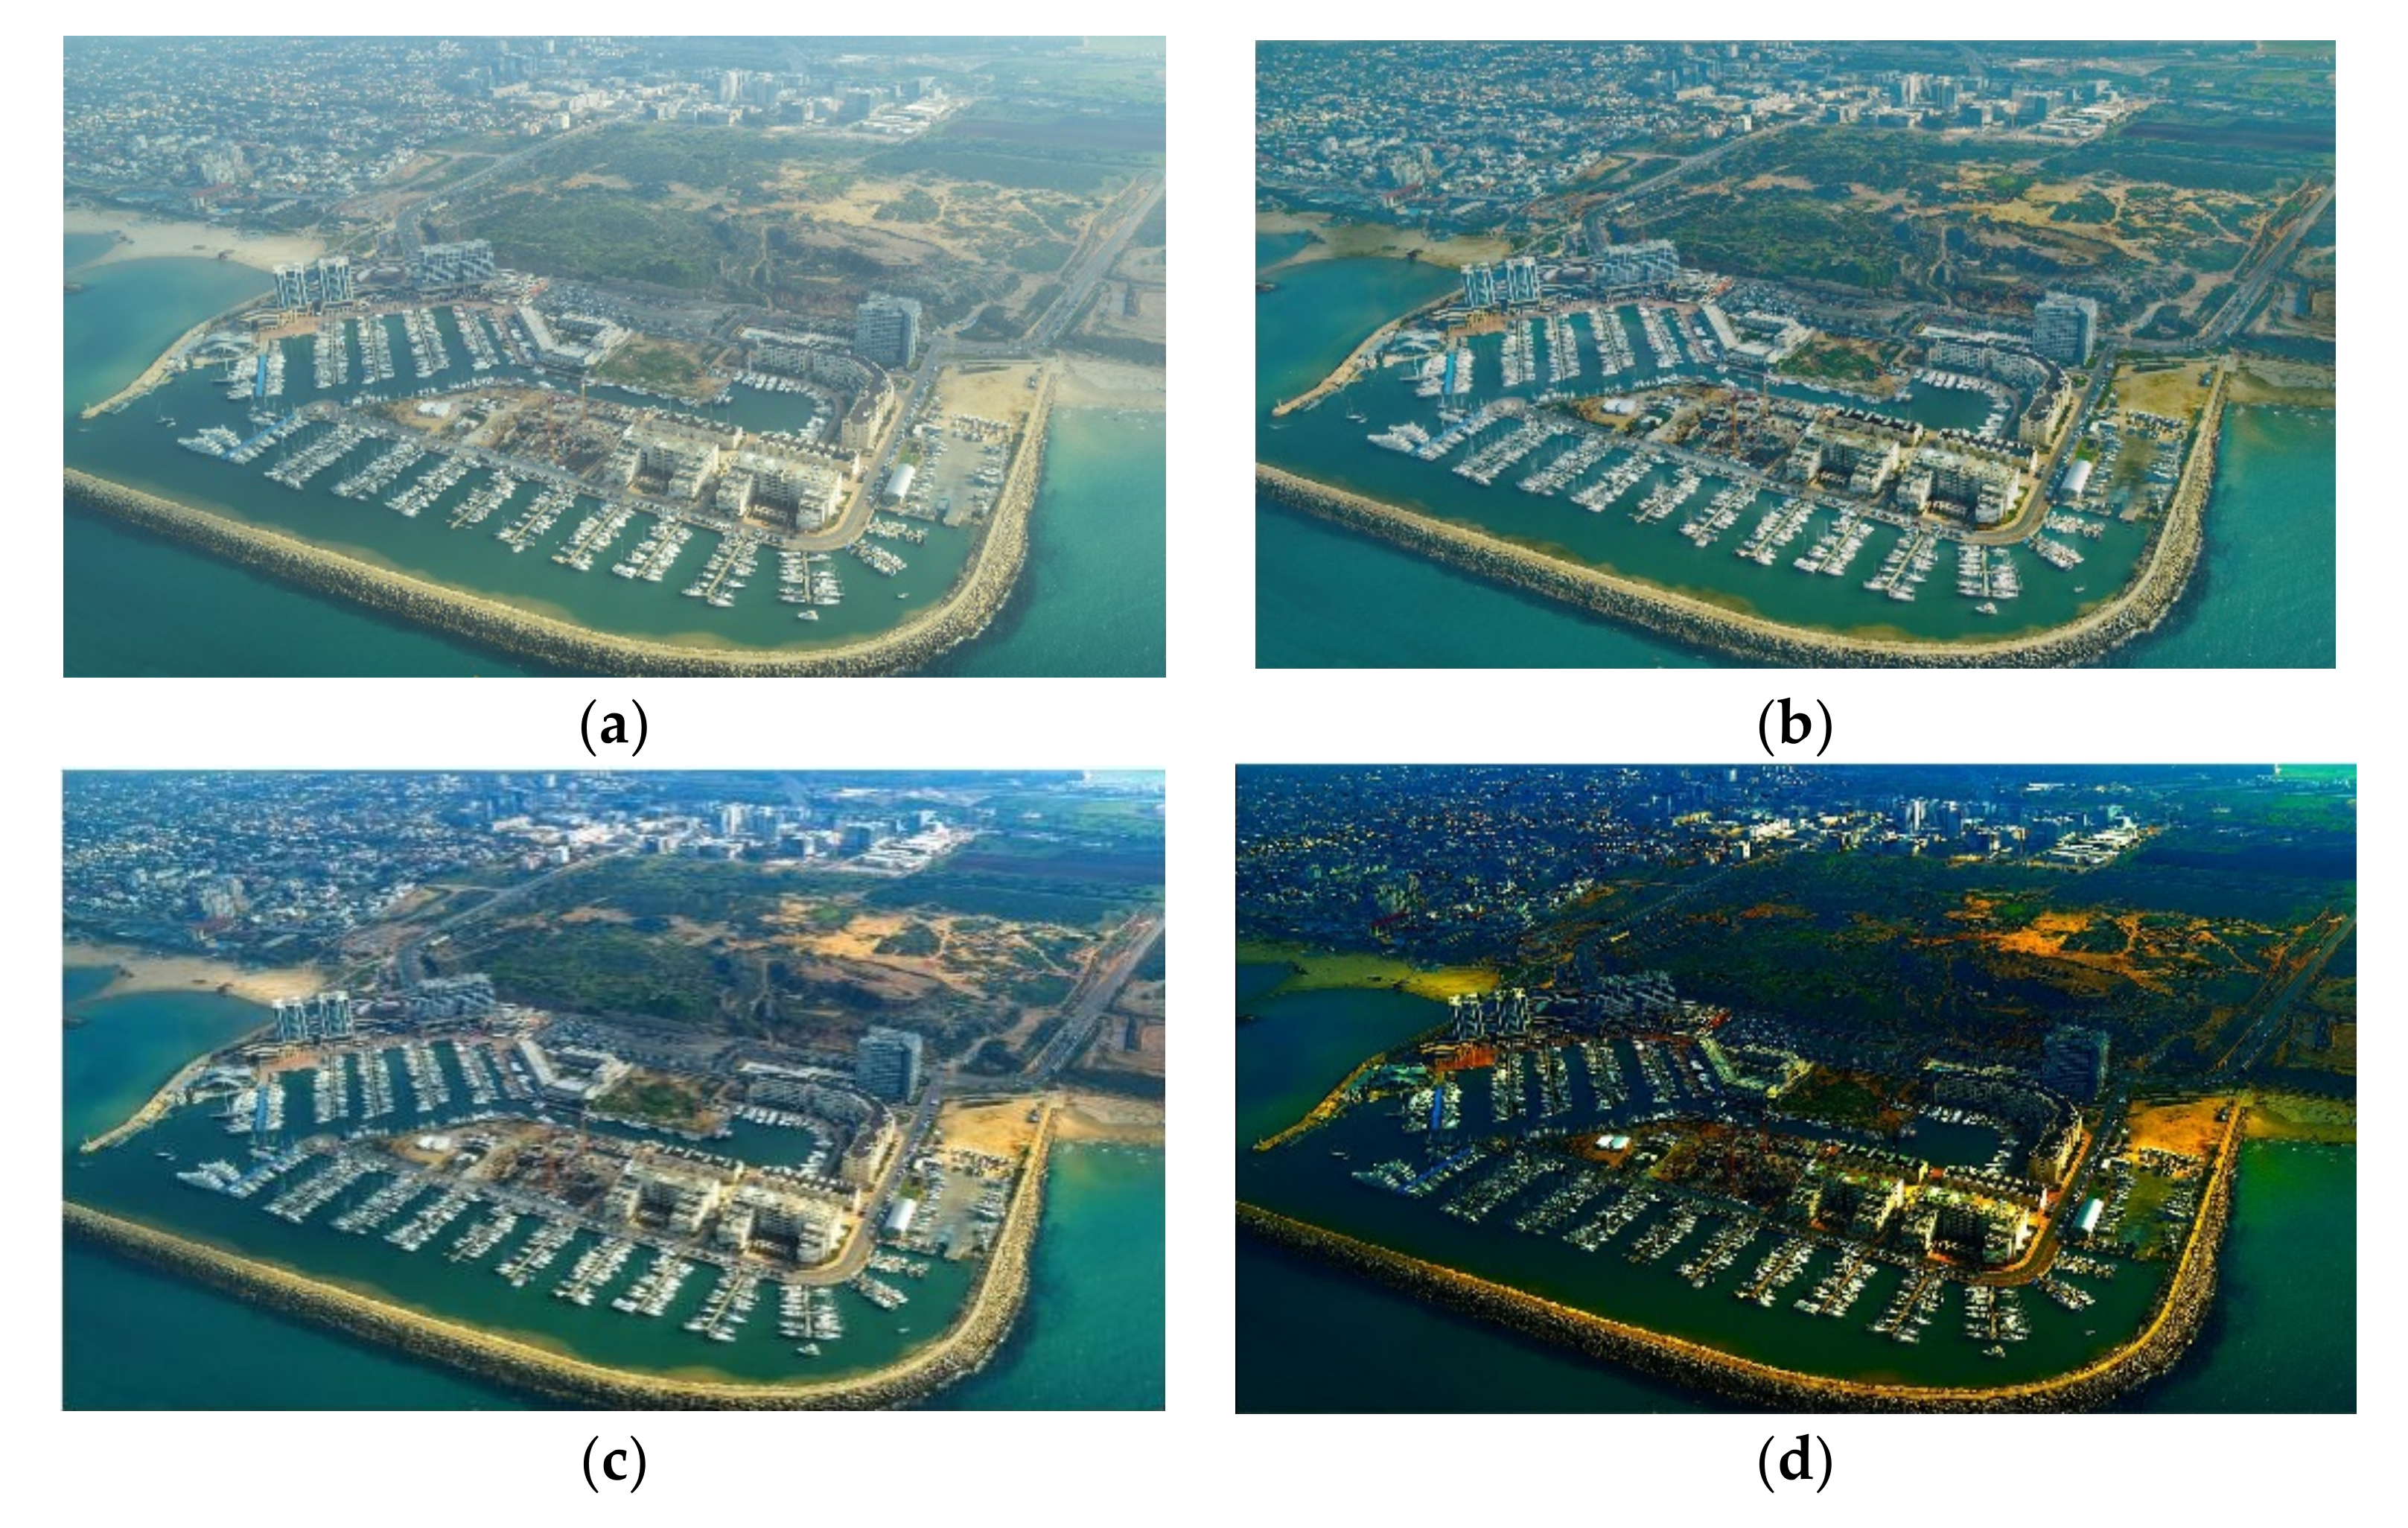
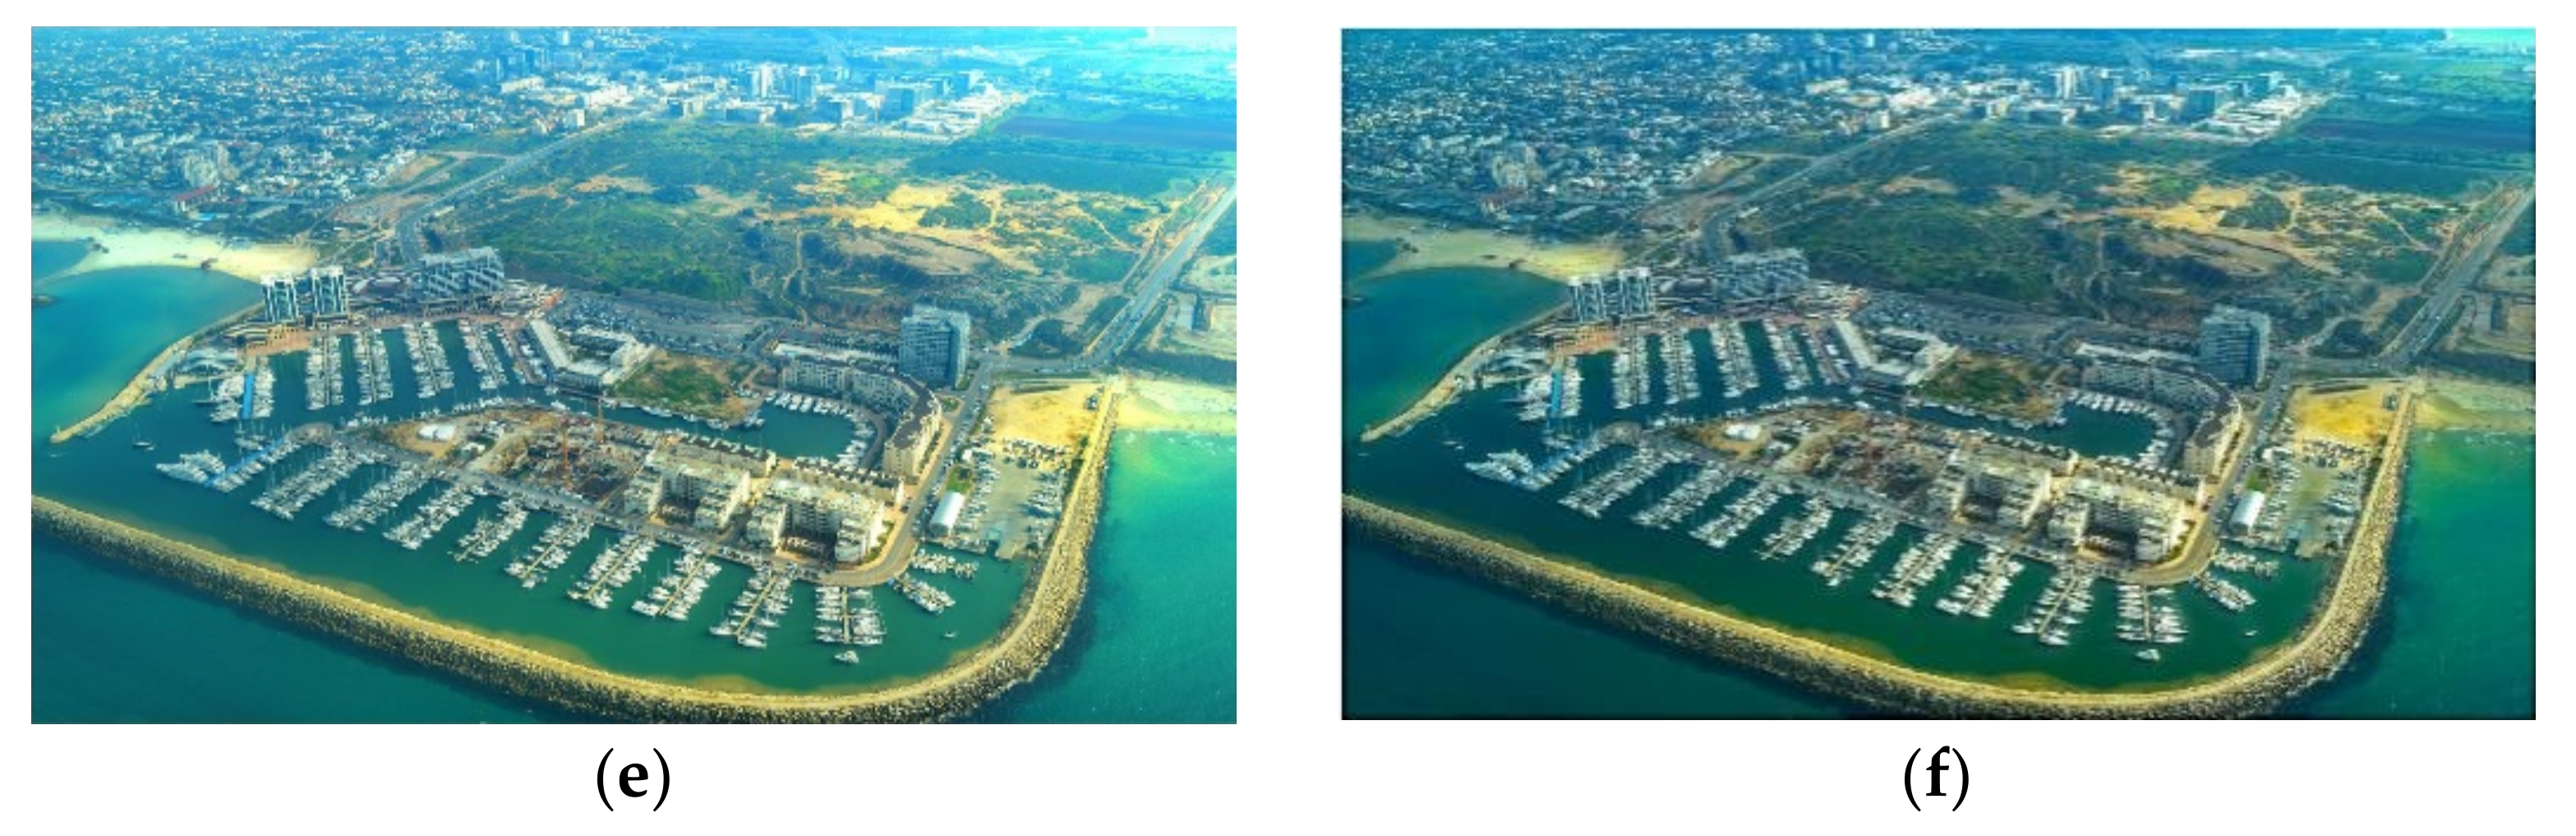
4.1. Visual Effect Analysis

In order to evaluate defogging performance, Tarel’s algorithm [38], He’s algorithm [39], Tufail’s algorithm [40], and Gao’s algorithm [41] are selected and compared with the proposed algorithm. The experimental results are as follows:
In Figure 13, Tarel’s algorithm appears gray in the whole image, and the sky section is seriously distorted. He’s algorithm presents haze and distortion in the link between the sky and city. Tufail’s algorithm cause the color saturation to appear too high on the whole image, which makes the restored image appear yellow and dark. Gao’s algorithm lacks fog removal in the sky while the rest is better. By contrast, the proposed algorithm restores the cloud well, the sky area becomes a natural blue color, and the city is also clear, which is more suitable for human eyes to observe.
In Figure 14, Tarel’s algorithm causes noise interference in the whole image, and its visual effect is poor. He’s algorithm has weak defogging intensity and the distant area of the restored image appears too dark in color. Tufail’s algorithm makes the image appear black in a large area and has severe distortion. Gao’s algorithm has a large area of distortion in the distant region. By contrast, the proposed algorithm has a good defogging effect in the distant foggy area, and the color saturation is more natural and realistic in visual perception.
In Figure 15, Tarel’s algorithm appears dark in color and low in saturation. He’s algorithm is dark and has distortion in the sky area. Tufail’s algorithm presents a large area of distortion in the distant area, and the color is too dark. Gao’s algorithm is insufficient to remove fog in the distant area, and a small amount of fog remains. In contrast, the proposed algorithm has a good defogging effect in distant mountains and dense fog areas; the restored color appears natural, and the detailed information is restored well.
In Figure 16, Tarel’s algorithm still leaves a small amount of fog in the distant area. He’s and Gao’s algorithms both have a distortion in the upper right of the distant area, but the rest of the images have a good restoration effect. Tufail’s algorithm shows a large area of black in the distant area, and the image is seriously distorted. In contrast, the proposed algorithm has a relatively good defogging effect, and the color saturation is moderate.

4.2. Image Defogging Evaluation Index

Universal quality index (UQI) [42], structural similarity index measurement (SSIM) [43], peak signal-to-noise ratio (PSNR) [44], and information entropy H [45] are adopted as objective quality evaluations to evaluate the proposed defogging algorithm. SSIM and UQI are evaluation indicators of the structural similarity between the foggy and restored images. The higher the value, the more reasonable the structure of the image after defogging. PSNR and information entropy H are evaluation indicators used to measure the level of image distortion and image information content, respectively. The larger the value is, the richer the image information and the clearer the image details are.
The evaluation results of the four groups of comparative experiments are shown in Table 1, Table 2, Table 3 and Table 4:
Due to Tarel’s median filtering method, a “halo” effect appears at the edge of the restored image where the scene depth changes abruptly. Therefore, Tarel’s method is second to the proposed algorithm in the fourth group and performs slightly worse in the other three groups. Due to the inaccurate estimation of atmospheric light value, He’s algorithm distorts the sky area. It performs relatively well in the second group but slightly worse in the other groups. Since the atmospheric light value and transmittance are calculated in YCbCr color space in Tufail’s algorithm, the color saturation of the restored image is too high. Thus, Tufail’s algorithm performs the least well in the four groups. Moreover, Gao’s algorithm utilizes an adaptive compensation function to improve the sky or the large white area with low transmittance. Because this algorithm cannot accurately segment far scene regions, it easily causes partial distortion. This algorithm is second to the proposed algorithm only in two groups. Based on improving the estimation of transmittance and atmospheric light value, a compensation model to further improve the color saturation of the image is also included in the proposed algorithm. Therefore, the evaluation results are optimal in four groups of comparative experiments, which verifies the effectiveness of the proposed algorithm.

5. Conclusions

Based on the principle of dark channel prior, a far and near scene fusion defogging algorithm was proposed. Firstly, a two-dimensional Otsu remote sensing image segmentation algorithm was proposed, and then the traditional dark channel algorithm and atmospheric light scattering model were improved. Secondly, the atmospheric light image was obtained by the dark-light channel fusion model, and the gray image of the original foggy image was used as the guide image to refine the transmittance. Furthermore, the transmittance was optimized by improving the defogging intensity parameter to the atmospheric light value. Finally, the brightness/color compensation model based on visual perception was introduced to improve the saturation and contrast of the image. Abundant experiments indicate the proposed algorithm has achieved superior performance in both subjective and objective aspects. The restored image is clearer with more prominent details, and the structure is more obvious, which is more suitable for human visual perception.

Author Contributions

Conceptualization, T.C. and M.L.; methodology, T.C. and M.L.; software, T.G.; validation, P.C., S.M. and Y.L.; formal analysis, T.C.; investigation, T.G.; resources, T.C. and M.L.; data curation, P.C.; writing—original draft preparation, T.C. and M.L.; writing—review and editing, T.C. and T.G.; visualization, S.M.; supervision, Y.L.; project administration, M.L.; funding acquisition, T.C. All authors have read and agreed to the published version of the manuscript.

Funding

This research was funded by the National Key R&D Program of China (2019YFE0108300) and the National Natural Science Foundation of China (52172379,62001058,U1864204).

Data Availability Statement

Data underlying the results presented in this paper are not publicly available at this time but may be obtained from the authors upon reasonable request.

Conflicts of Interest

The authors declare no conflict of interest.

References

  1. Yang, Y.; Chen, G.; Zhou, J. Iterative optimization defogging algorithm using Gaussian weight decay. Acta Autom. Sin. 2019, 45, 819–828. [Google Scholar]
  2. Huang, W.; Li, J.; Qi, C. Dense haze scene image defogging algorithm based on low rank and dictionary expression decisions. J. Xi’an Jiaotong Univ. 2020, 54, 118–125. [Google Scholar]
  3. Yang, Y.; Lu, X. Image dehazing combined with adaptive brightness transformation inequality to estimate transmission. J. Xi’an Jiaotong Univ. 2021, 6, 69–76. [Google Scholar]
  4. Fan, T.; Li, C.; Ma, X.; Chen, Z.; Zhang, X.; Chen, L. An improved single image defogging method based on Retinex. In Proceedings of the 2017 2nd International Conference on Image, Vision and Computing (ICIVC), Chengdu, China, 2–4 June 2017; IEEE: Piscataway, NJ, USA, 2017; pp. 410–413. [Google Scholar]
  5. Magudeeswaran, V.; Singh, J.F. Contrast limited fuzzy adaptive histogram equalization for enhancement of brain images. Int. J. Imaging Syst. Technol. 2017, 27, 98–103. [Google Scholar] [CrossRef] [Green Version]
  6. Fu, F.; Liu, F. Wavelet-Based Retinex Algorithm for Unmanned Aerial Vehicle Image Defogging. In Proceedings of the 2015 8th International Symposium on Computational Intelligence and Design (ISCID), Hangzhou, China, 12–13 December 2015; IEEE: Piscataway, NJ, USA, 2015; pp. 426–430. [Google Scholar]
  7. Ma, Z.; Wen, J. Single-scale Retinex sea fog removal algorithm based on fusion of edge information. J. Comput.-Aided Des. Graph. 2015, 27, 217–225. [Google Scholar]
  8. Liu, Y.; Yan, H.; Gao, S.; Yang, K. Criteria to evaluate the fidelity of image enhancement by MSRCR. IET Image Process. 2018, 12, 880–887. [Google Scholar] [CrossRef]
  9. Zhang, W.; Dong, L.; Pan, X.; Zhou, J.; Qin, L.; Xu, W. Single image defogging based on multi-channel convolutional MSRCR. IEEE Access 2019, 7, 72492–72504. [Google Scholar] [CrossRef]
  10. Liu, X. A defogging algorithm for ship video surveillance images under adaptive histogram equalization processing. Ship Sci. Technol. 2020, 42, 70–72. [Google Scholar]
  11. Wong, C.; Jiang, G.; Rahman, M.A.; Liu, S.; Lin, F.; Kwok, N.; Shi, H.; Yu, Y.; Wu, T. Histogram equalization and optimal profile compression based approach for colour image enhancement. J. Vis. Commun. Image Represent. 2016, 38, 802–813. [Google Scholar] [CrossRef]
  12. Fei, Y.; Shao, F. Contrast adjustment based on image retrieval. Prog. Laser Optoelectron. 2018, 55, 112–121. [Google Scholar]
  13. Huan, H.H.; Abduklimu, T.; He, X. Color image defogging method based on wavelet transform. Comput. Technol. Dev. 2020, 30, 60–64. [Google Scholar]
  14. Jia, J.; Yue, H. A wavelet-based approach to improve foggy image clarity. IFAC Proc. Vol. 2014, 47, 930–935. [Google Scholar] [CrossRef] [Green Version]
  15. Huan, H.H.; Abduklimu, T.; He, X. A method of traffic image defogging based on wavelet transform. Electron. Des. Eng. 2020, 28, 56–59. [Google Scholar]
  16. Wang, X. Research on Dehazing Algorithm of Light Field Image Based on Multi-Cues Fusion; Hefei University of Technology: Hefei, China, 2020. [Google Scholar]
  17. Zhang, Y. Research on Key Technologies of Haze Removal of Sea-Sky Background Image Based on Full Polarization Information Detection; University of Chinese Academy of Sciences: Beijing, China, 2020. [Google Scholar]
  18. Xu, Z.; Zhang, S.; Gu, L.; Huang, H.; Wang, H.; Liu, Q. A remote sensing image defogging method of UAV. Commun. Technol. 2020, 53, 2442–2446. [Google Scholar]
  19. Wang, W.; Chang, F.; Ji, T.; Wu, X. A Fast Single-Image Dehazing Method Based on a Physical Model and Gray Projection. IEEE Access 2018, 6, 5641–5653. [Google Scholar] [CrossRef]
  20. Jun, J.G.; Chu, Q.; Zhang, X.; Fan, Z. Image Dehazing Method Based on Light Field Depth Estimation and Atmospheric Scattering Model. Acta Photonica Sin. 2020, 49, 0710001. [Google Scholar] [CrossRef]
  21. Wang, X.; Zhang, X.; Zhang, J.; Sun, R. Image dehazing algorithm by combining light field multi-cues and atmospheric scattering model. Opto-Electron. Eng. 2020, 47, 190634. [Google Scholar]
  22. You, J.; Liu, P.; Rong, X.; Li, B.; Xu, T. Dehazing and enhancement research of polarized image based on dark channel priori principle. Laser Infrared 2020, 50, 493–500. [Google Scholar]
  23. Namer, E.; Schechner, Y.Y. Advanced visibility improvement based on polarization filtered images. In Polarization Science and Remote Sensing II.; SPIE: San Diego, CA, USA, 2005; Volume 5888, p. 588805. [Google Scholar]
  24. Xia, P.; Liu, X. Real-Time Static Polarimetric Image Dehazing Technique Based on Atmospheric Scattering Correction. J. Beijing Univ. Posts Telecommun. 2016, 39, 33–36. [Google Scholar]
  25. Ueki, Y.; Ikehara, M. Weighted Generalization of Dark Channel Prior with Adaptive Color Correction for Defogging. In Proceedings of the 2020 28th European Signal Processing Conference (EUSIPCO), Amsterdam, The Netherlands, 24–28 August 2020; IEEE: Piscataway, NJ, USA, 2021; pp. 685–689. [Google Scholar]
  26. He, K.; Sun, J.; Tang, X. Single image haze removal using dark channel prior. In Proceedings of the IEEE-Computer-Society Conference on Computer Vision and Pattern Recognition Workshops, Miami, FL, USA, 20–25 June 2009; IEEE: Piscataway, NJ, USA, 2009; pp. 1956–1963. [Google Scholar]
  27. He, K.; Sun, J.; Tang, X. Guided image filtering. In Proceedings of the European Conference on Computer Vision (ECCV), Heraklion, Greece, 5–11 September 2010; Springer: Berlin, Germany, 2010; pp. 1–14. [Google Scholar]
  28. Xu, Y.; Guo, X.; Wang, H.; Zhao, F.; Peng, L. Single image haze removal using light and dark channel prior. In Proceedings of the 2016 IEEE/CIC International Conference on Communications in China (ICCC), Chengdu, China, 27–29 July 2016; IEEE: Piscataway, NJ, USA, 2016; pp. 1–6. [Google Scholar]
  29. Li, J.; Hu, Q.; Ai, M. Haze and thin cloud removal via sphere model improved dark channel prior. IEEE Geosci. Remote Sens. Lett. 2018, 16, 472–476. [Google Scholar] [CrossRef]
  30. Wang, F.; Wang, W. Road extraction using modified dark channel prior and neighborhood FCM in foggy aerial images. Multimed. Tools Appl. 2019, 78, 947–964. [Google Scholar]
  31. Engin, D.; Gen, A.; Eenel, H.K. Cycle-Dehaze: Enhanced CycleGAN for single image dehazing. In Proceedings of the IEEE Conference on Computer Vision and Pattern Recognition Workshops, Salt Lake City, UT, USA, 18–22 June 2018; IEEE: Piscataway, NJ, USA, 2018; pp. 825–833. [Google Scholar]
  32. Li, J.; Li, G.; Fan, H. Image dehazing using residual-based deep CNN. IEEE Access 2018, 6, 26831–26842. [Google Scholar] [CrossRef]
  33. Zhang, H.; Patel, V.M. Densely connected pyramid dehazing network. In Proceedings of the 2018 IEEE/CVF Conference on Computer Vision and Pattern Recognition, Salt Lake City, UT, USA, 18–23 June 2018; IEEE: Piscataway, NJ, USA, 2018; pp. 3194–3203. [Google Scholar]
  34. Ren, W.; Ma, L.; Zhang, J.; Pan, J.; Cao, X.; Liu, W.; Yang, M. Gated fusion network for single image dehazing. In Proceedings of the 2018 IEEE/CVF Conference on Computer Vision and Pattern Recognition, Salt Lake City, UT, USA, 18–23 June 2018; IEEE: Piscataway, NJ, USA, 2018; pp. 3253–3261. [Google Scholar]
  35. Chen, D.; He, M.; Fan, Q.; Liao, J.; Zhang, L.; Hou, D.; Lu, Y.; Hua, G. Gated context aggregation network for image dehazing and deraining. In Proceedings of the 2019 IEEE Winter Conference on Applications of Computer Vision (WACV), Waikoloa Village, HI, USA, 7–11 January 2019; IEEE: Piscataway, NJ, USA, 2019; pp. 1375–1383. [Google Scholar]
  36. Otsu, N. A threshold selection method from gray-level histograms. IEEE Trans. Syst. Man Cybern. 1979, 9, 62–66. [Google Scholar] [CrossRef] [Green Version]
  37. Liu, J.; Li, W. Two-dimensional Otsu automatic threshold segmentation for grayscale image. Acta Autom. Sin. 1993, 19, 101–105. [Google Scholar]
  38. Tarel, J.; Hautiere, N. Fast visibility restoration from a single color or gray level image. In Proceedings of the 2009 IEEE 12th International Conference on Computer Vision, Kyoto, Japan, 27 September–4 October 2009; IEEE: Piscataway, NJ, USA, 2009; pp. 2201–2208. [Google Scholar]
  39. He, K.; Sun, J.; Tang, X. Single image haze removal using dark channel prior. IEEE Trans. Pattern Anal. Mach. Intell. 2010, 33, 2341–2353. [Google Scholar]
  40. Tufail, Z.; Khurshid, K.; Salmana, A.; Nizami, I.F.; Khurshid, K.; Jeon, B. Improved dark channel prior for image defogging using RGB and YCbCr color space. IEEE Access 2018, 6, 32576–32587. [Google Scholar] [CrossRef]
  41. Gao, T.; Li, K.; Chen, T.; Liu, M.; Mei, S.; Xing, K. A Novel UAV Sensing Image Defogging Method. IEEE J. Sel. Top. Appl. Earth Obs. Remote Sens. 2020, 13, 2610–2625. [Google Scholar] [CrossRef]
  42. Yu, C.; Lin, H.; Xu, X.; Ye, X. Parameter estimation of fog degradation model and CUDA design. J. Comput.-Aided Des. Graph. 2018, 30, 327–335. [Google Scholar] [CrossRef]
  43. Fan, X.; Ye, S.; Shi, P.; Zhang, X.; Ma, J. An image dehazing algorithm based on improved atmospheric scattering model. J. Comput.-Aided Des. Graph. 2019, 31, 1148–1155. [Google Scholar] [CrossRef]
  44. Xiao, J.; Shen, M.; Lei, J.; Xiong, W.; Jiao, C. Image conversion algorithm of haze scene based on generative adversarial networks. J. Comput. Sci. 2020, 43, 165–176. [Google Scholar]
  45. Yao, T.; Liang, Y.; Liu, X.; Hu, Q. Video dehazing algorithm via haze-line prior with spatiotemporal correlation constraint. J. Electron. Inf. Technol. 2020, 42, 2796–2804. [Google Scholar]
Figure 1. Flow chart of the proposed algorithm.
Remotesensing 14 00425 g001
Figure 2. Flow chart of two-dimensional Otsu remote sensing image segmentation algorithm.
Remotesensing 14 00425 g002
Figure 3. A comparison diagram of segmentation regions between Otsu algorithm and the proposed segmentation algorithm.(a) Foggy image on mountain road; (b) Foggy image on mountain.
Remotesensing 14 00425 g003
Figure 4. Comparison of traditional and mixed dark channel (a) Urban foggy image; (b) Satellite remote sensing image.
Remotesensing 14 00425 g004
Figure 5. Foggy image and its atmospheric light map (a) Image of a foggy coastal city; (b) Satellite remote sensing image.
Remotesensing 14 00425 g005
Figure 6. (a) Foggy remote sensing image; (b) ω = 0.65; (c) ω = 0.75; (d) ω = 0.85; (e) ω = 0.95; (f) ω = 1.
Remotesensing 14 00425 g006
Figure 7. (a) Image of foggy coastal countryside; (b) ω = 0.65; (c) ω = 0.75; (d) ω = 0.85; (e) ω = 0.95; (f) ω = 1.
Remotesensing 14 00425 g007
Figure 8. (a) Image of foggy coastal countryside; (b) ω = 0.65; (c) ω = 0.75; (d) ω = 0.85; (e) ω = 0.95; (f) ω = 1.
Remotesensing 14 00425 g008
Figure 9. Flow chart of refining rough transmittance in YcbCr color space.
Remotesensing 14 00425 g009
Figure 10. (a) original foggy image; (b) p = 1 , q = 0 ; (c) p = 0 . 75 , q = 0.25 ; (d) p = 0 . 5 , q = 0.5 ; (e) p = 0 . 25 , q = 0.75 ; (f) p = 0 , q = 1 .
Remotesensing 14 00425 g010
Figure 11. Image of the defogging process.
Remotesensing 14 00425 g011
Figure 12. Part of the foggy remote sensing images.
Remotesensing 14 00425 g012
Figure 13. A comparison of defogging effects of the image of a city with fog. (a) Image of foggy coastal city image; (b) Tarel’s method; (c) He’s method; (d) Tufail’s method; (e) Gao ’s method; (f) our method.
Remotesensing 14 00425 g013
Figure 14. A comparison of defogging effects of the image of winding mountain road with fog. (a) Image of foggy winding mountain road image; (b) Tarel’s method; (c) He’s method; (d) Tufail ’s method; (e) Gao ’s method; (f) our method.
Remotesensing 14 00425 g014
Figure 15. A comparison of defogging effects of foggy country images. (a) Image of foggy country image; (b) Tarel’s method; (c) He’s method; (d) Tufail ’s method; (e) Gao ’s method; (f) our method.
Remotesensing 14 00425 g015
Figure 16. A comparison of defogging effects of foggy country images A comparison of defogging effects of foggy port images. (a) Image of foggy port image; (b) Tarel’s method; (c) He’s method; (d) Tufail ’s method; (e) Gao ’s method; (f) our method.
Remotesensing 14 00425 g016aRemotesensing 14 00425 g016b
Table 1. Objective evaluation results on the first group of defogged images based on five defogging algorithms.
Tarel’s
Algorithm
He’s
Algorithm
Tufail’s
Algorithm
Gao’s
Algorithm
Proposed
Algorithm
UQI0.69960.74040.38480.78960.7954
SSIM0.82190.83680.47490.85140.8828
PSNR13.277515.11279.892514.200116.9181
H7.42407.41636.67007.49267.5637
Table 2. Objective evaluation results on the second group of defogged images based on five defogging algorithms.
Tarel’s
Algorithm
He’s
Algorithm
Tufail’s
Algorithm
Gao’s
Algorithm
Proposed
Algorithm
UQI0.55230.58110.19310.53840.6056
SSIM0.66000.64490.26230.53920.6791
PSNR11.929510.50638.26949.591612.1122
H7.03856.51176.10156.34267.0759
Table 3. Objective evaluation results on the third group of defogged images based on five defogging algorithms.
Tarel’s
Algorithm
He’s
Algorithm
Tufail’s
Algorithm
Gao’s
Algorithm
Proposed
Algorithm
UQI0.70550.69410.29120.76100.7780
SSIM0.84200.76520.36460.85760.8723
PSNR16.049610.44426.821416.104616.3206
H7.38937.24196.81167.44197.6805
Table 4. Objective evaluation results on the fourth group of defogged images based on five defogging algorithms.
Tarel’s
Algorithm
He’s
Algorithm
Tufail’s
Algorithm
Gao’s
Algorithm
Proposed
Algorithm
UQI0.77520.74390.28610.71730.7878
SSIM0.86200.86810.30040.82830.8753
PSNR16.570616.37687.810013.308716.9963
H7.41387.35146.44377.41387.4954
Publisher’s Note: MDPI stays neutral with regard to jurisdictional claims in published maps and institutional affiliations.

