
Underground Morphological Detection of Ground Fissures in Collapsible Loess Area Based on Three-Dimensional Laser Scanning Technology

 , ,
, ,  , ,
, ,
Abstract
:
1. Introduction
2. Materials and Methods
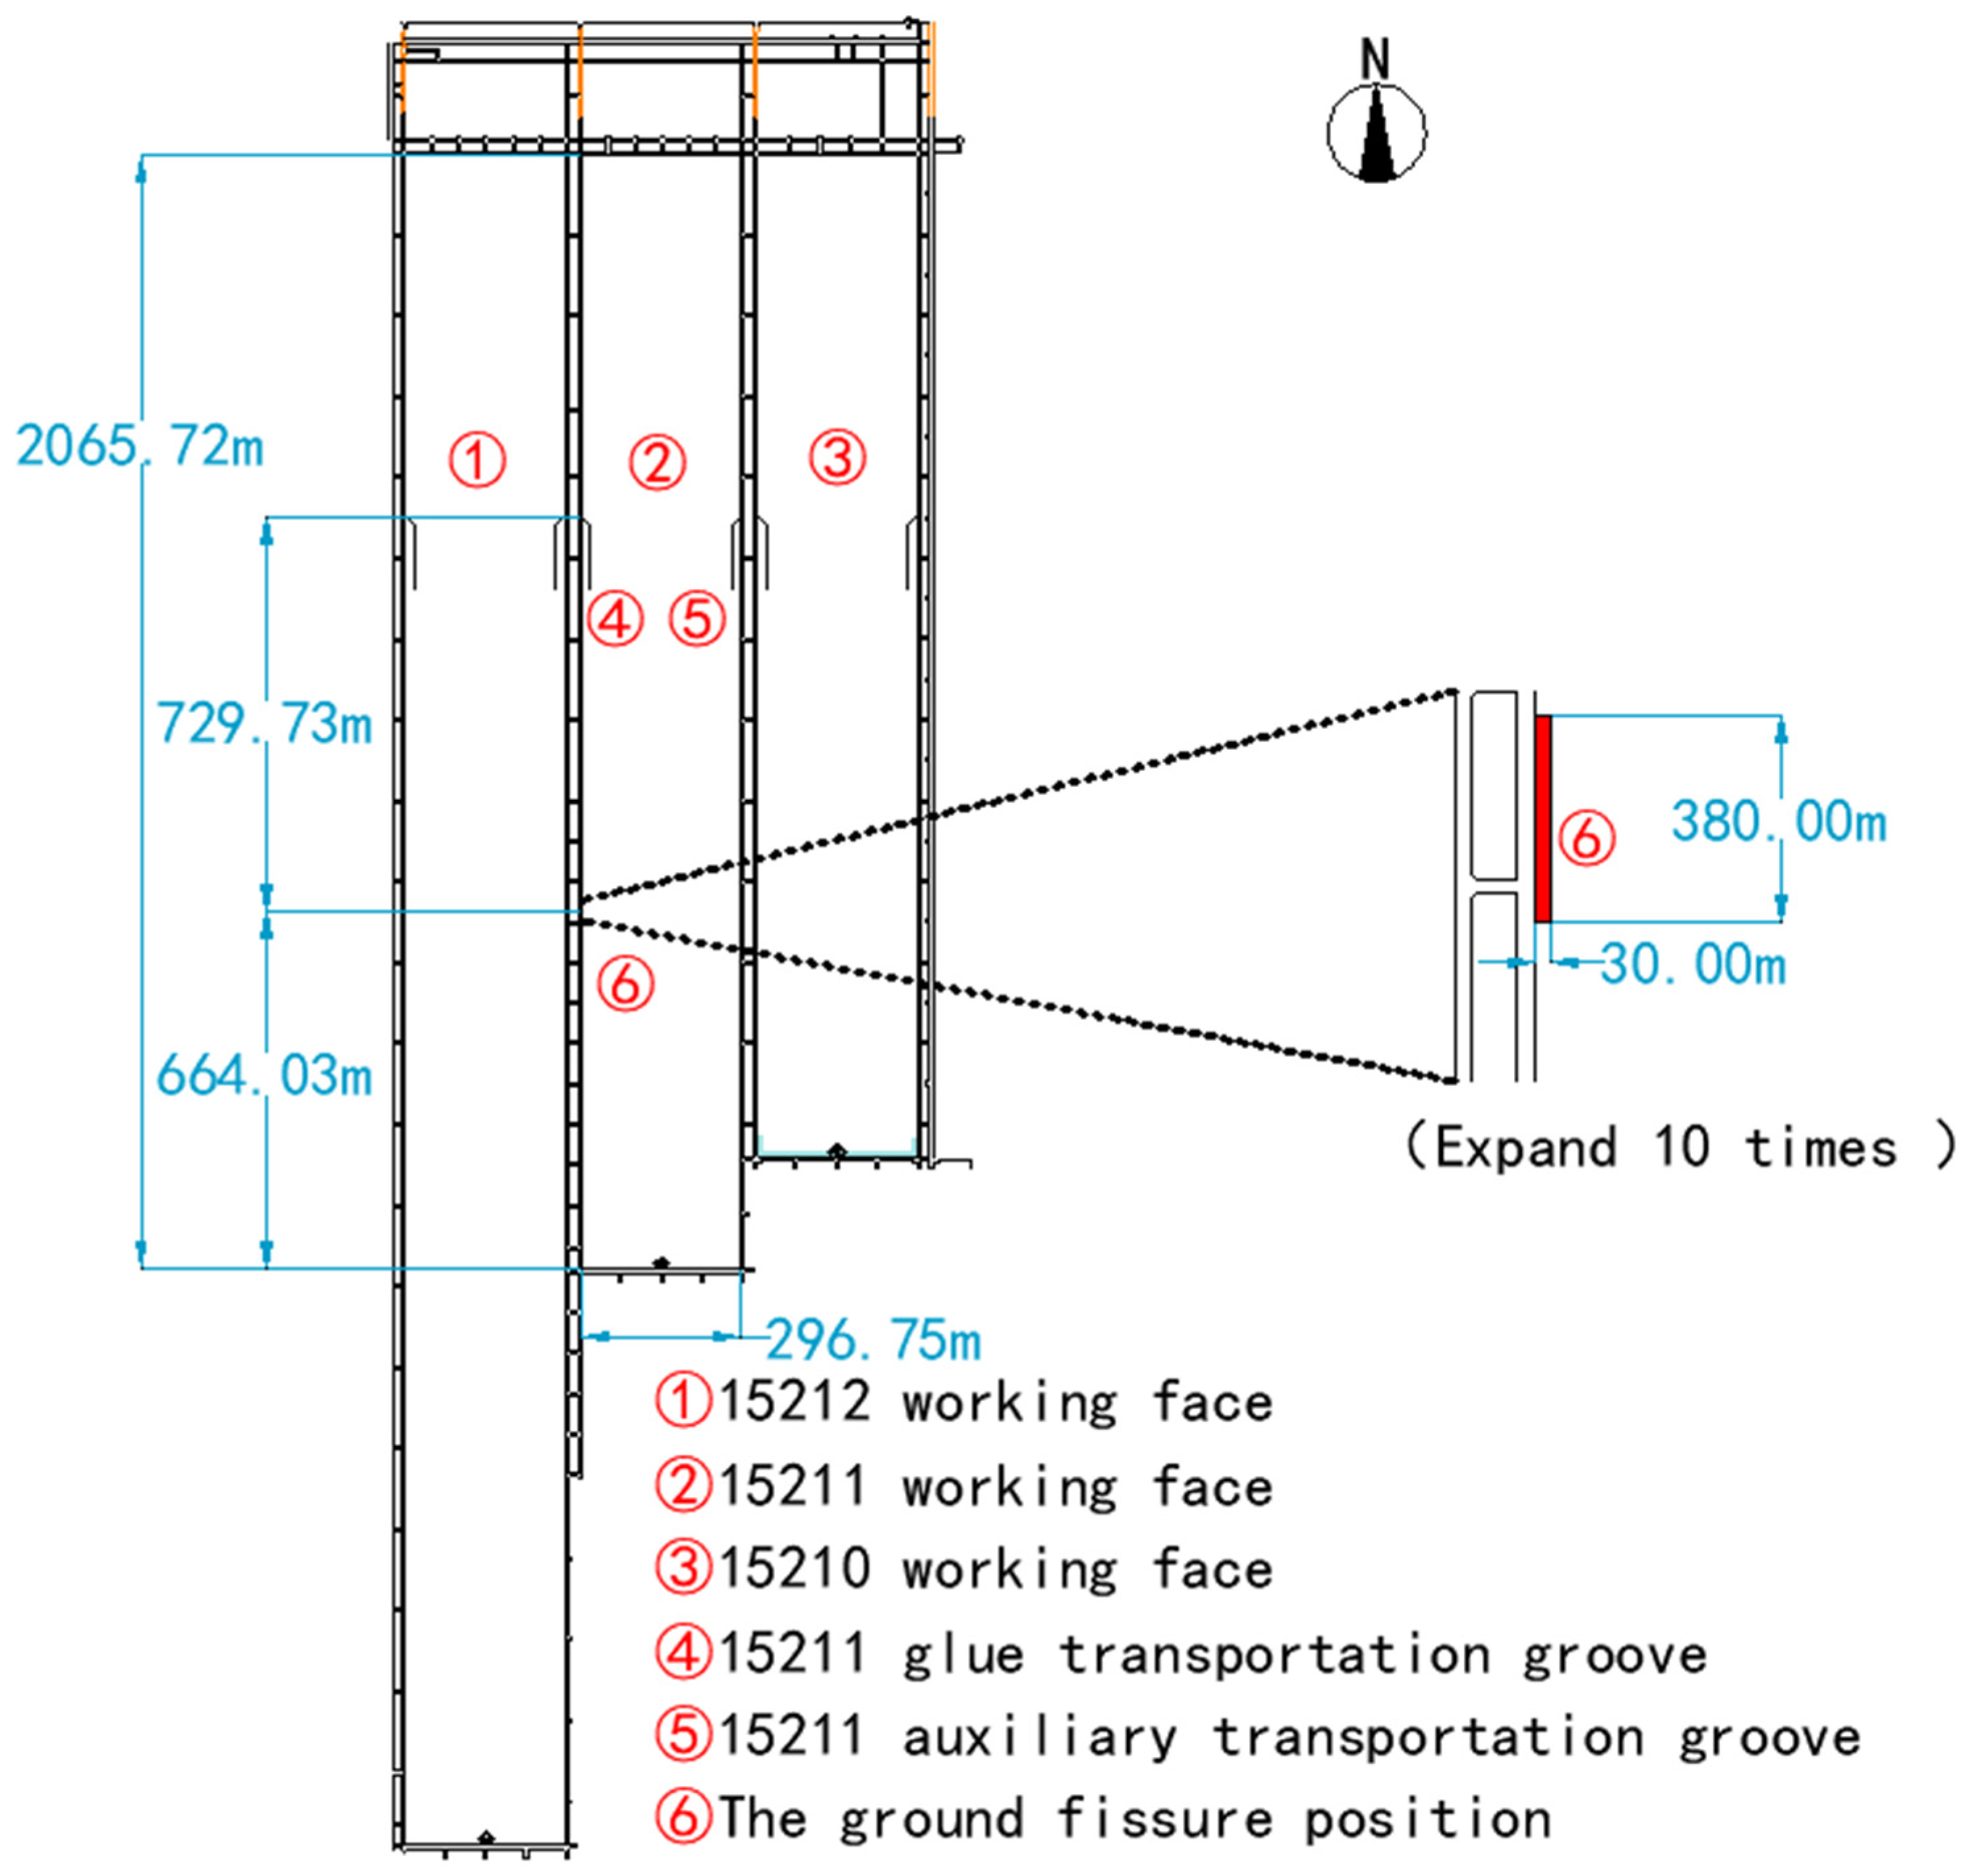
2.1. Location of Study Area
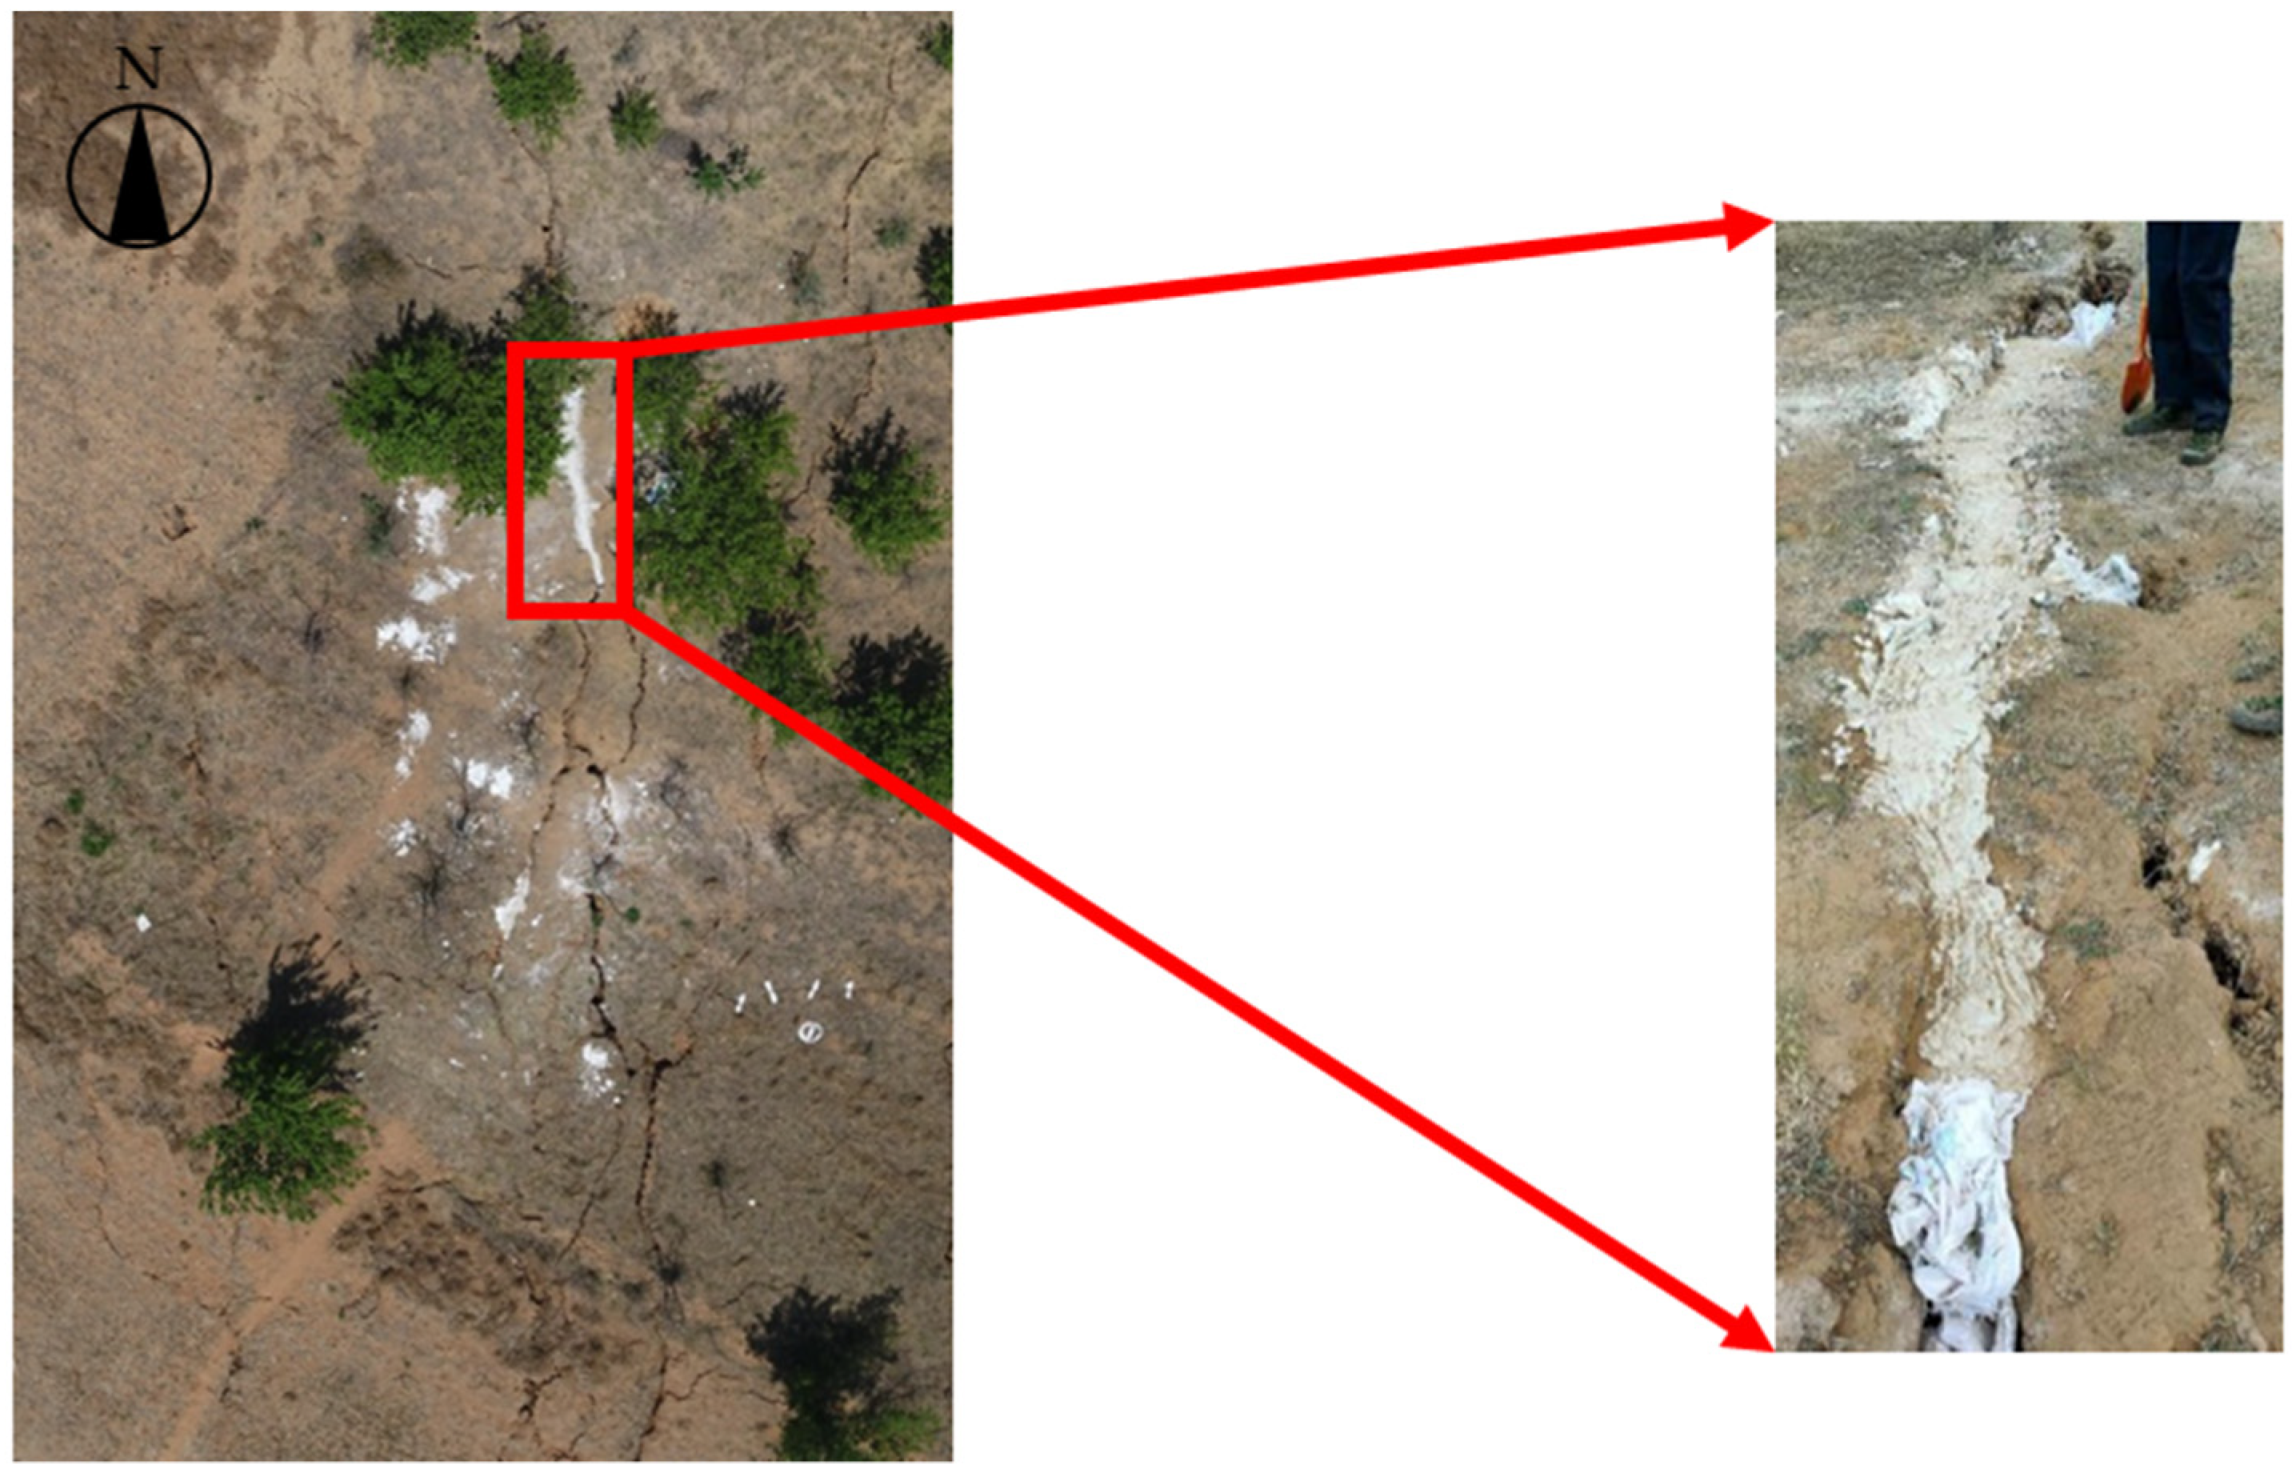
2.2. Ground Fissure Filling Method and Observation
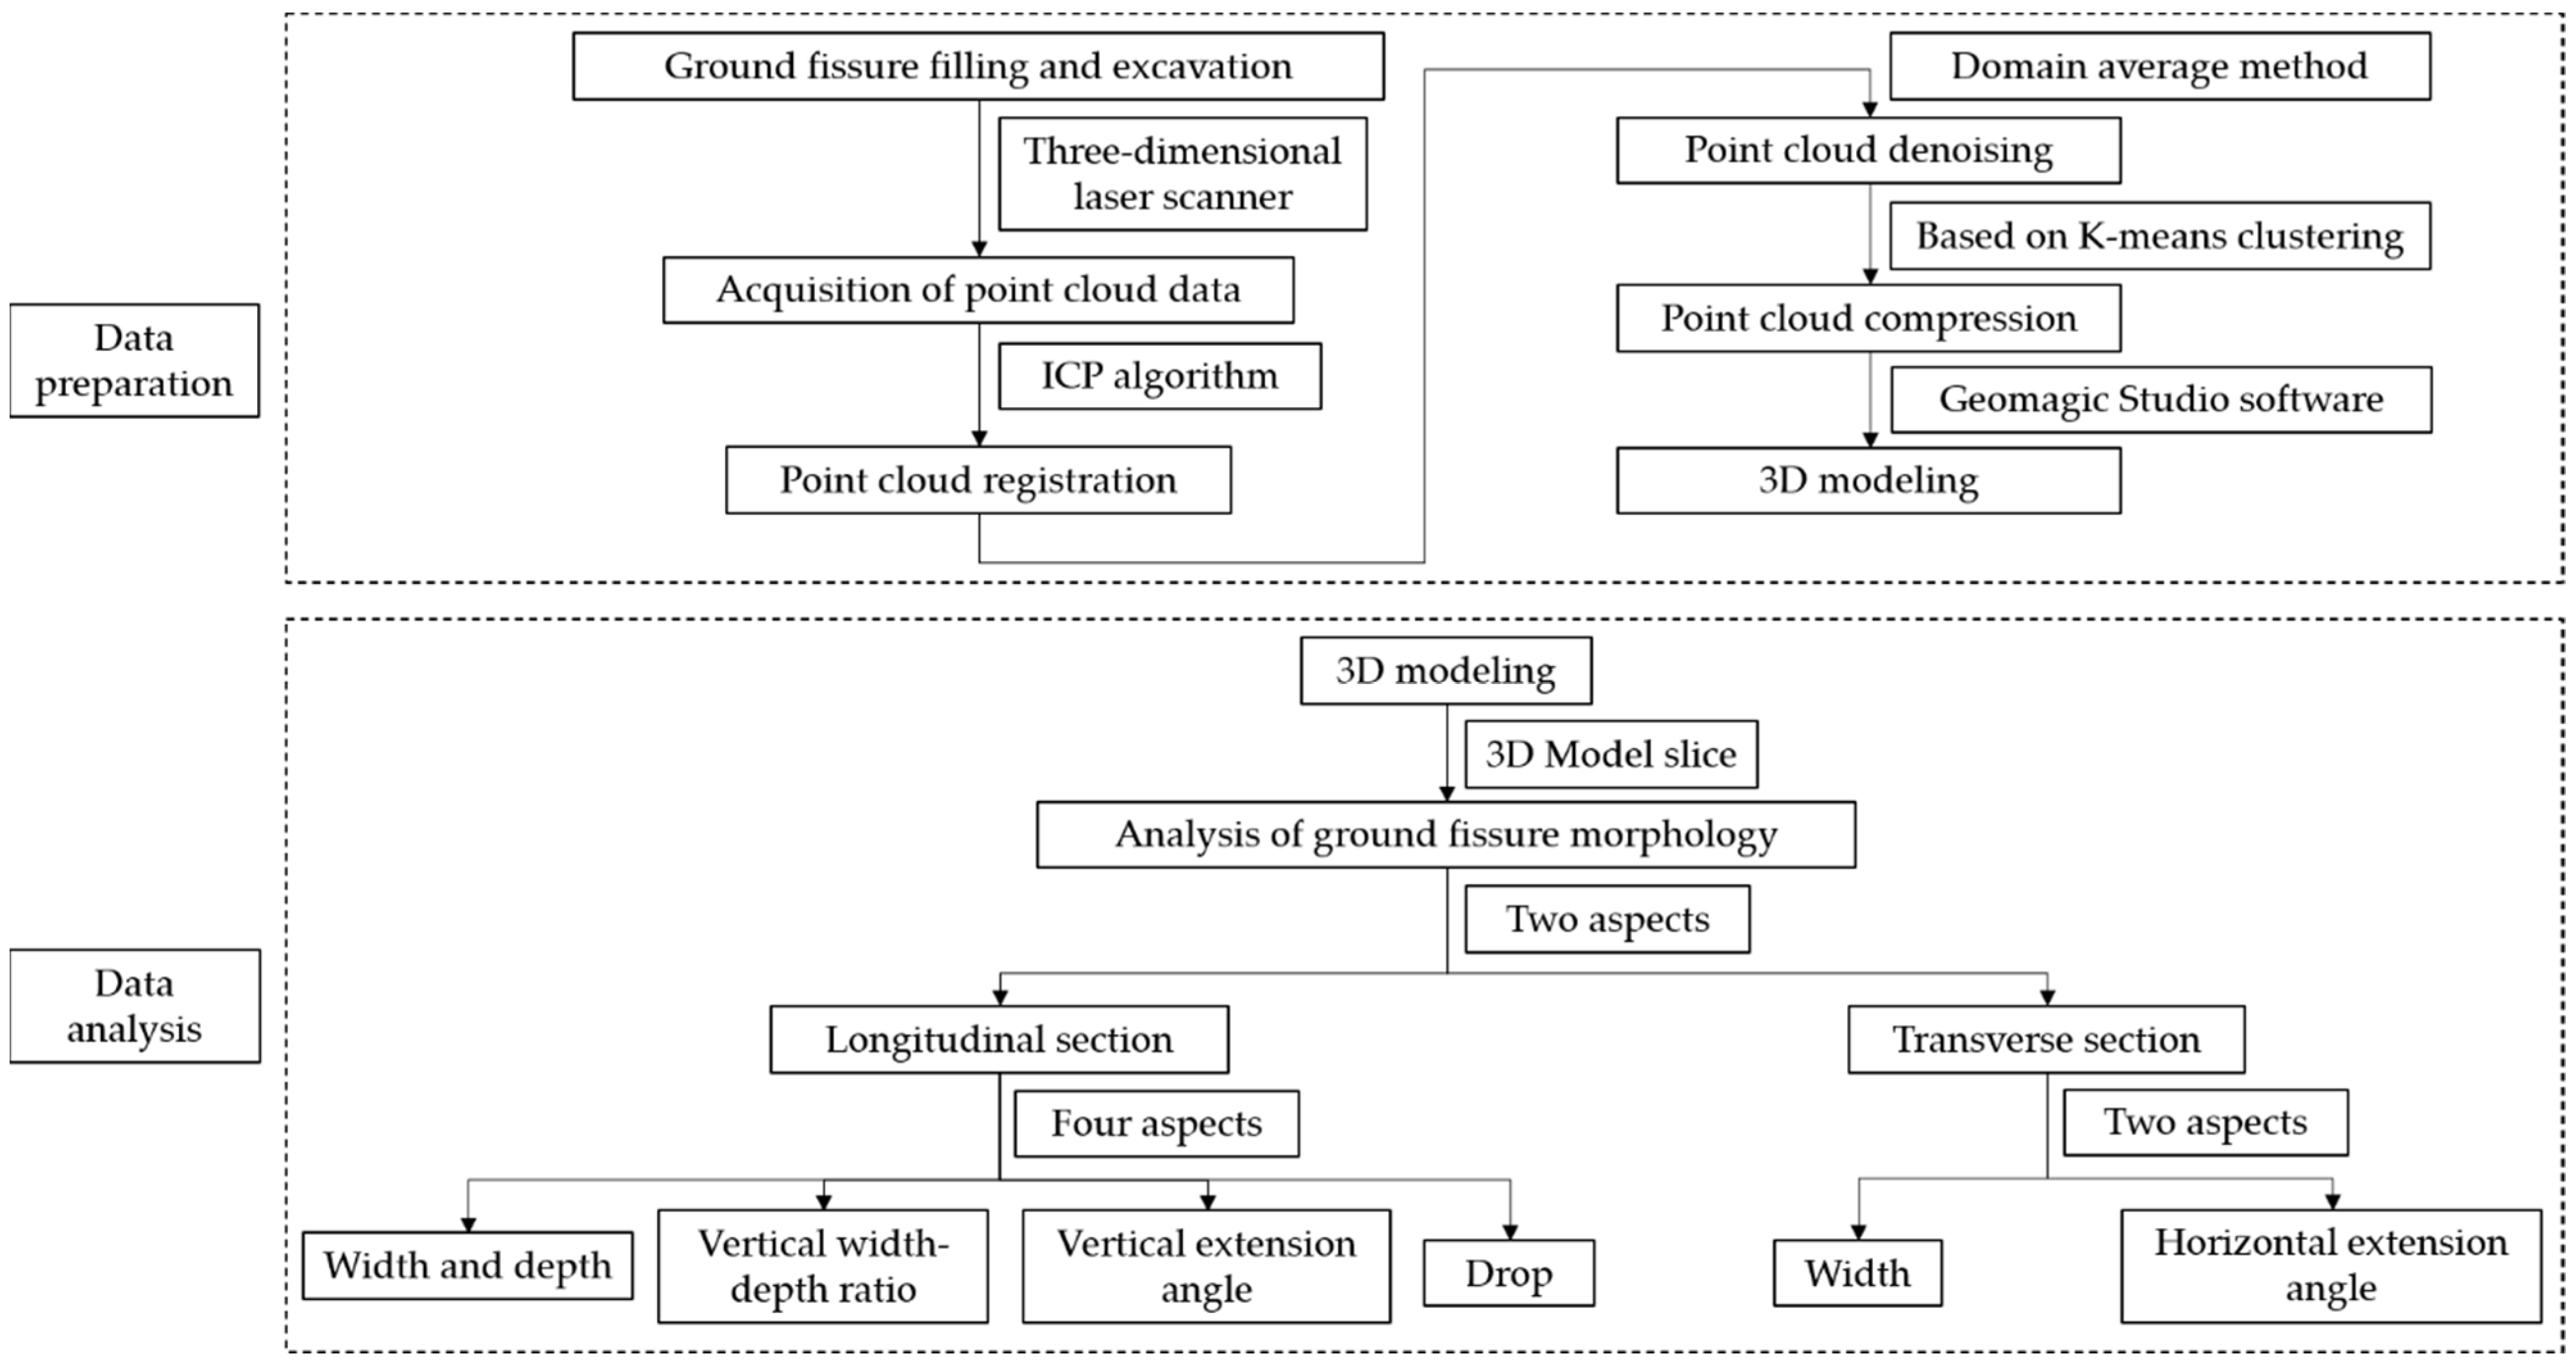
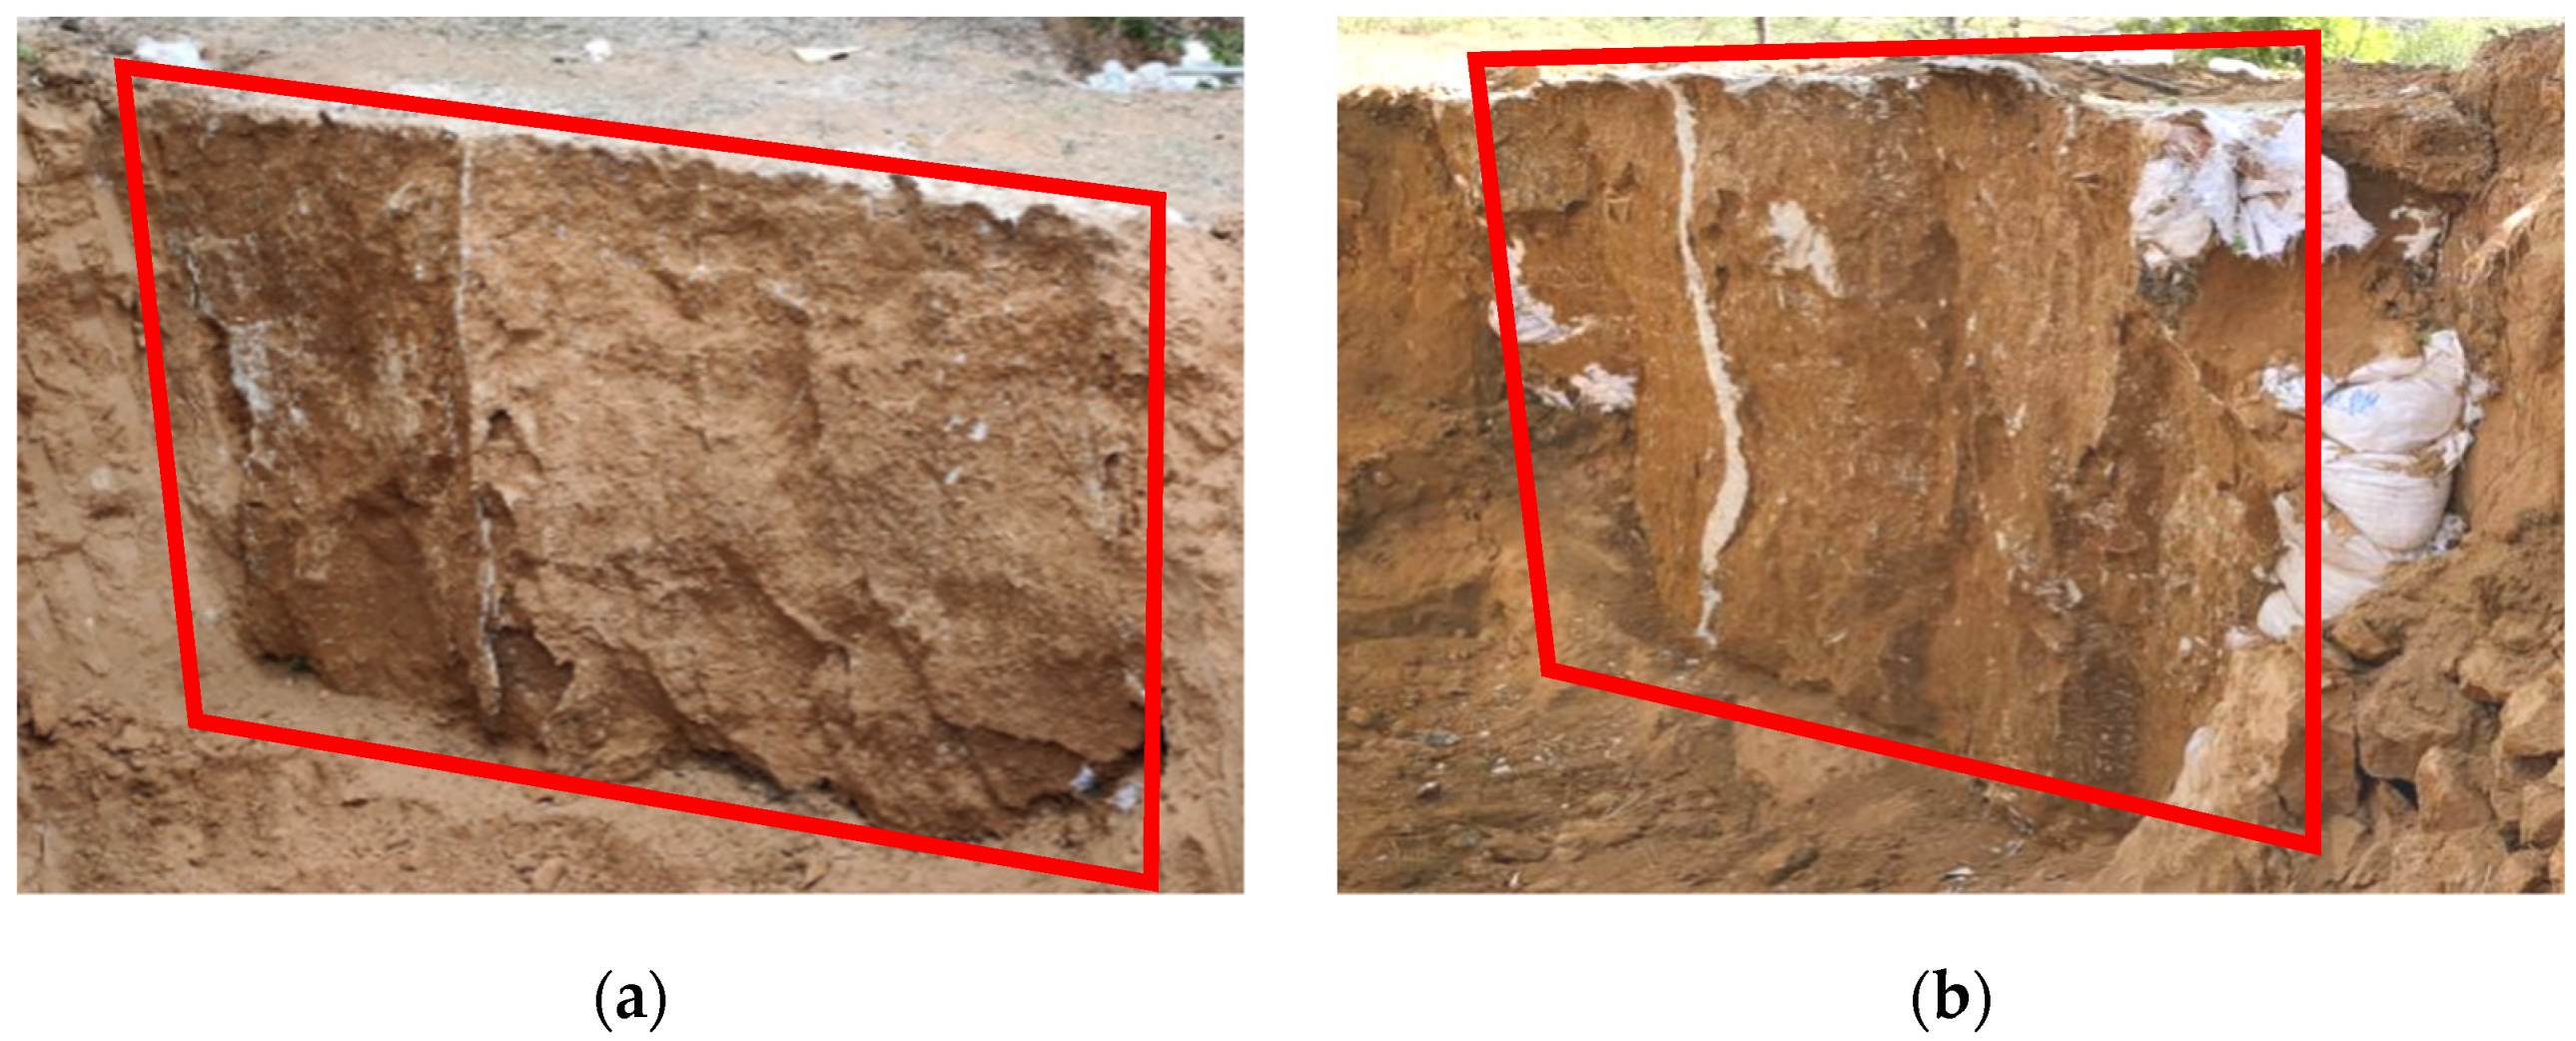
2.2.1. Ground Fissure Filling and Excavation
2.2.2. Data Acquisition Method
- 1.
- Instrument Selection
- 2.
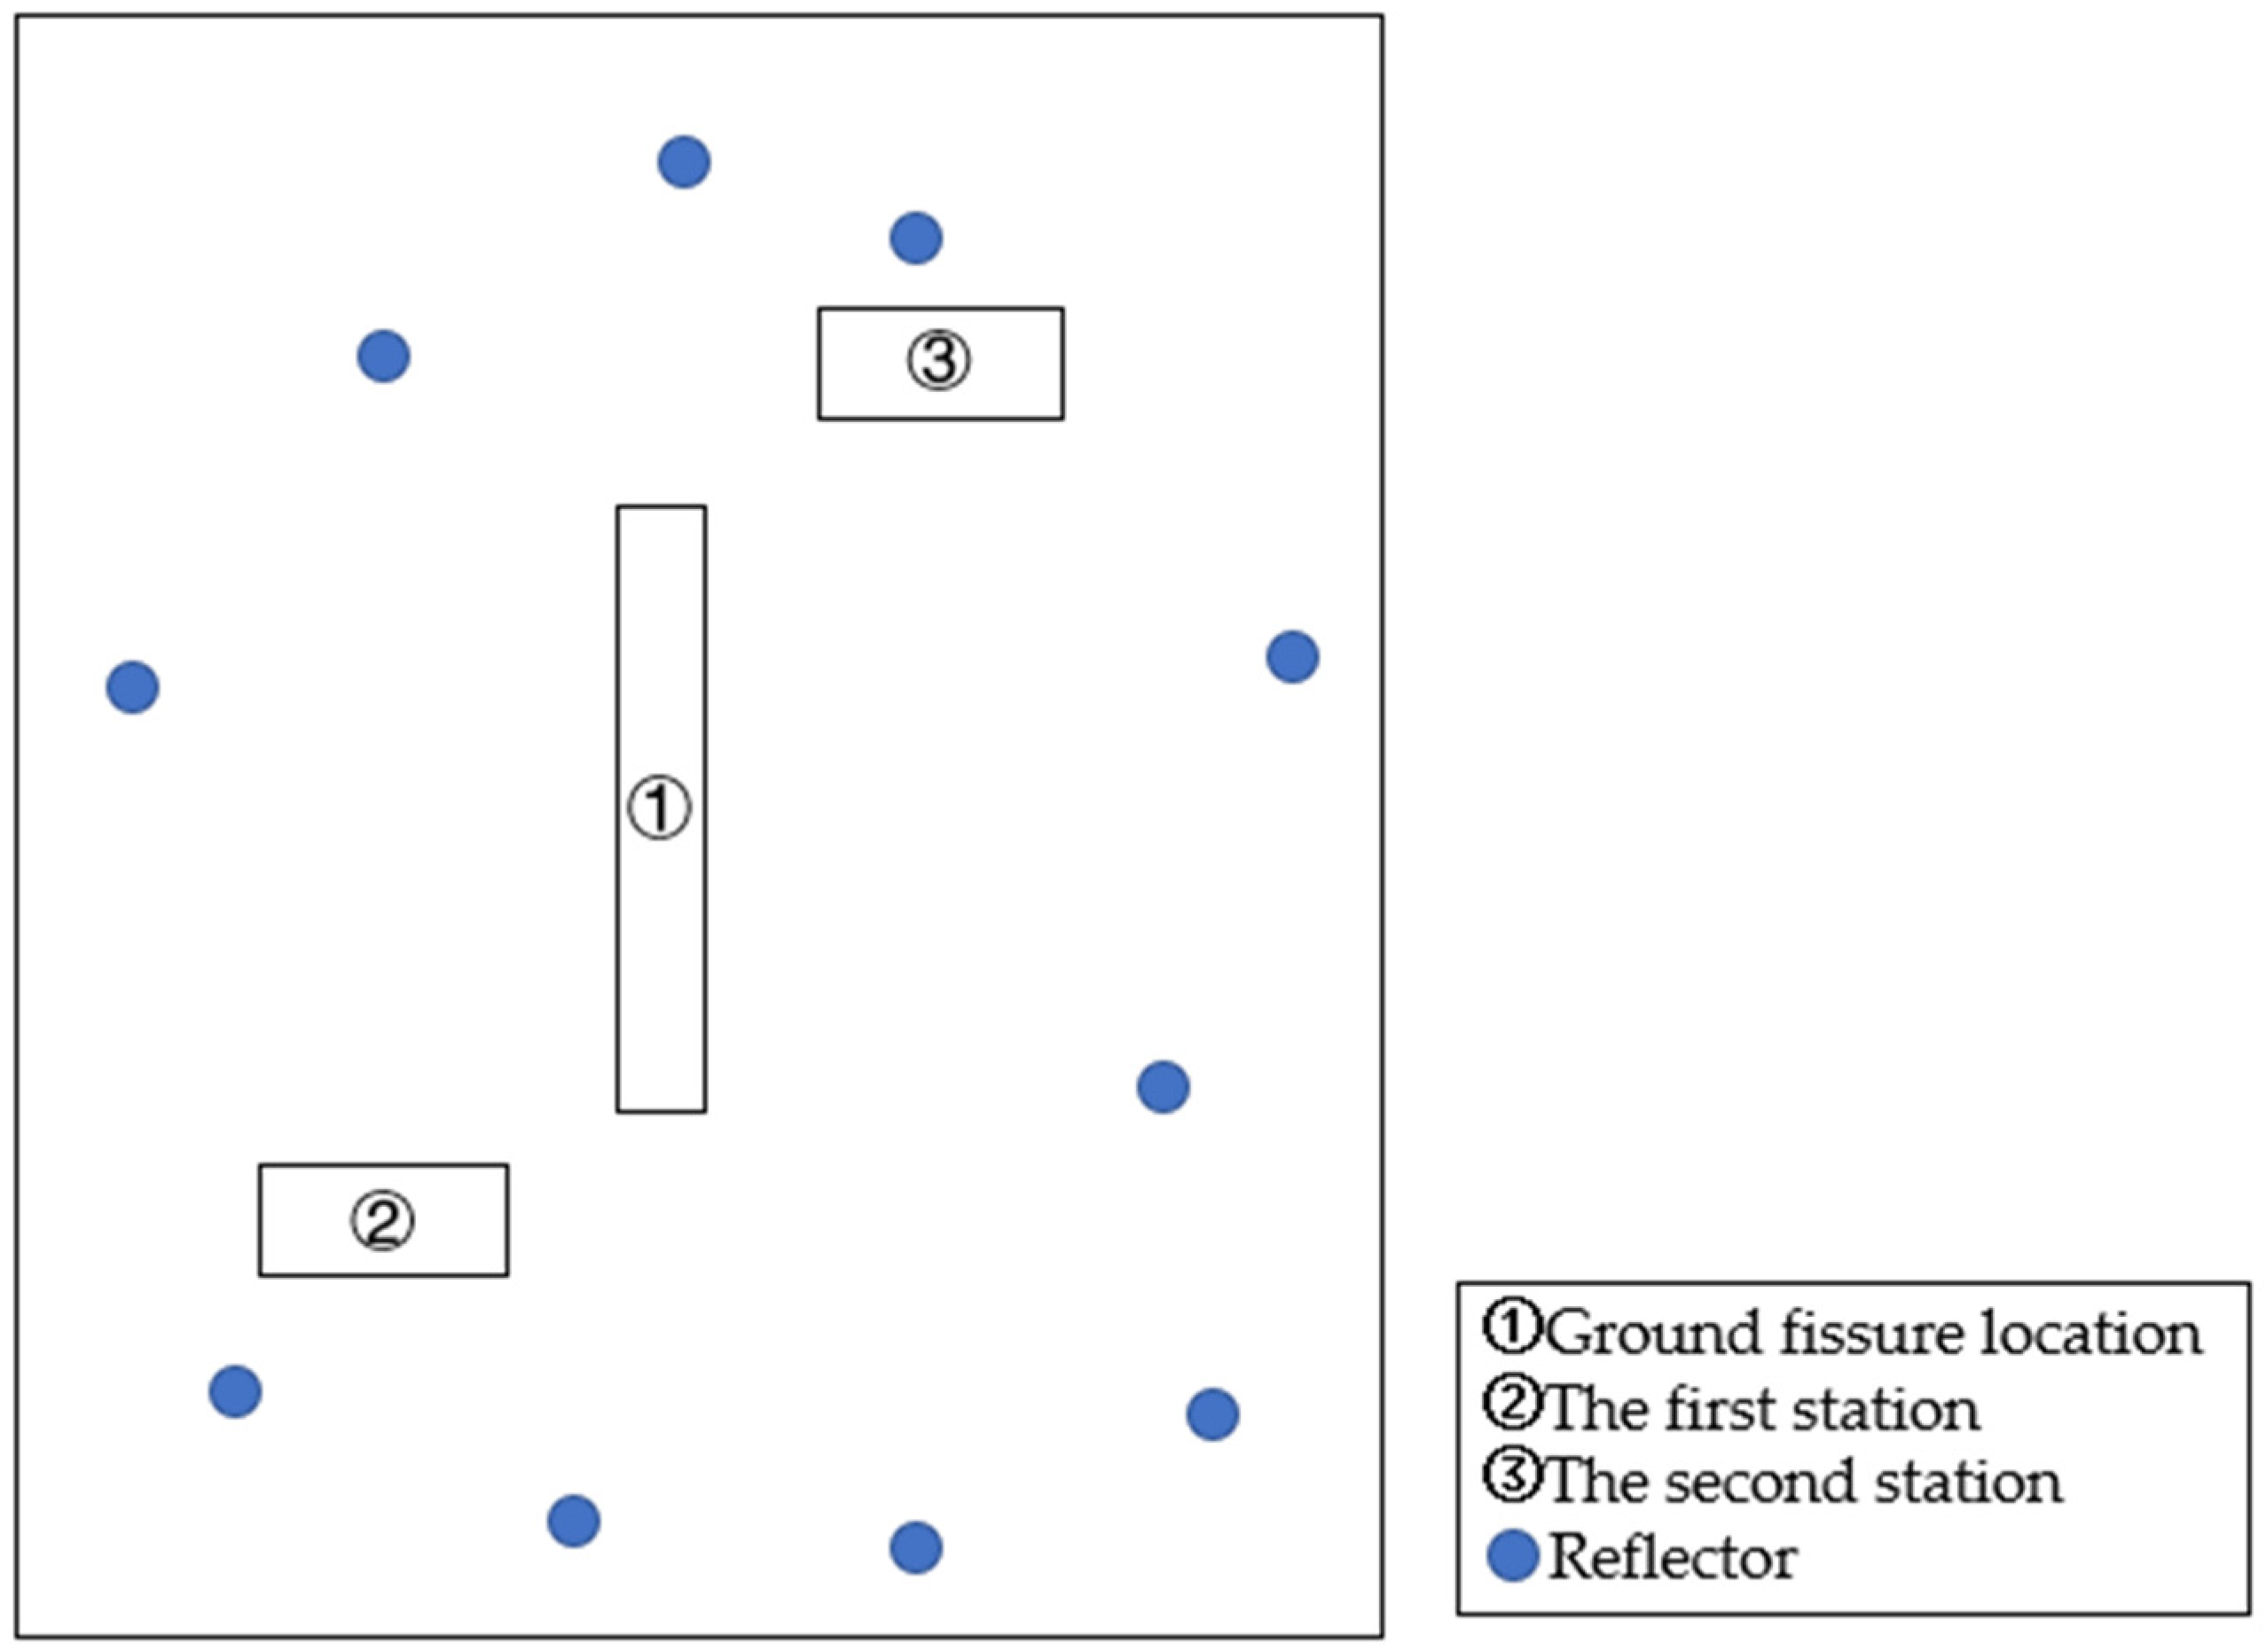
- Design of Data Acquisition Scheme
- 3.
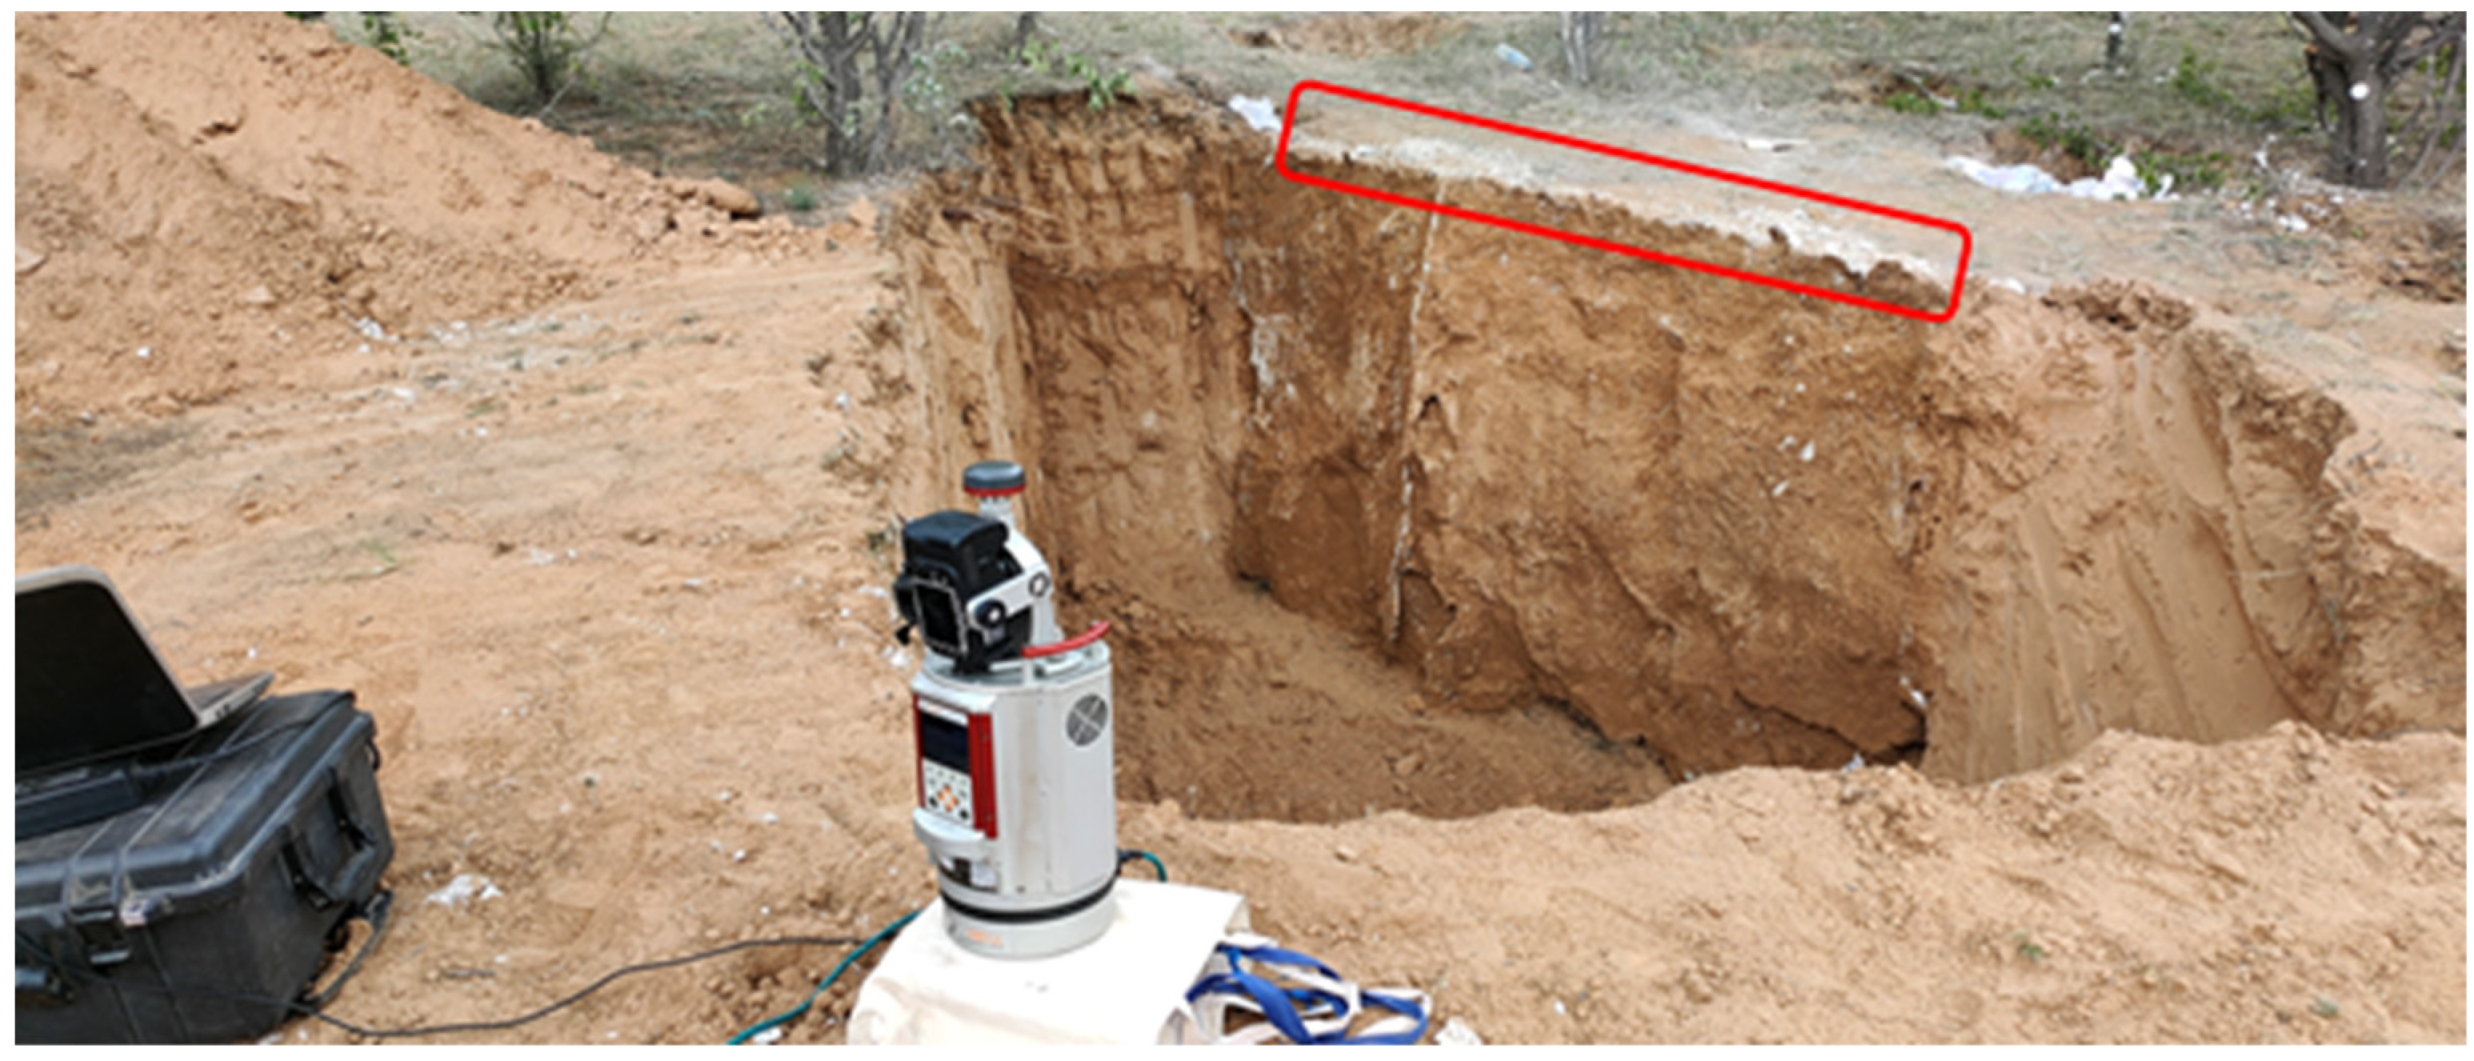
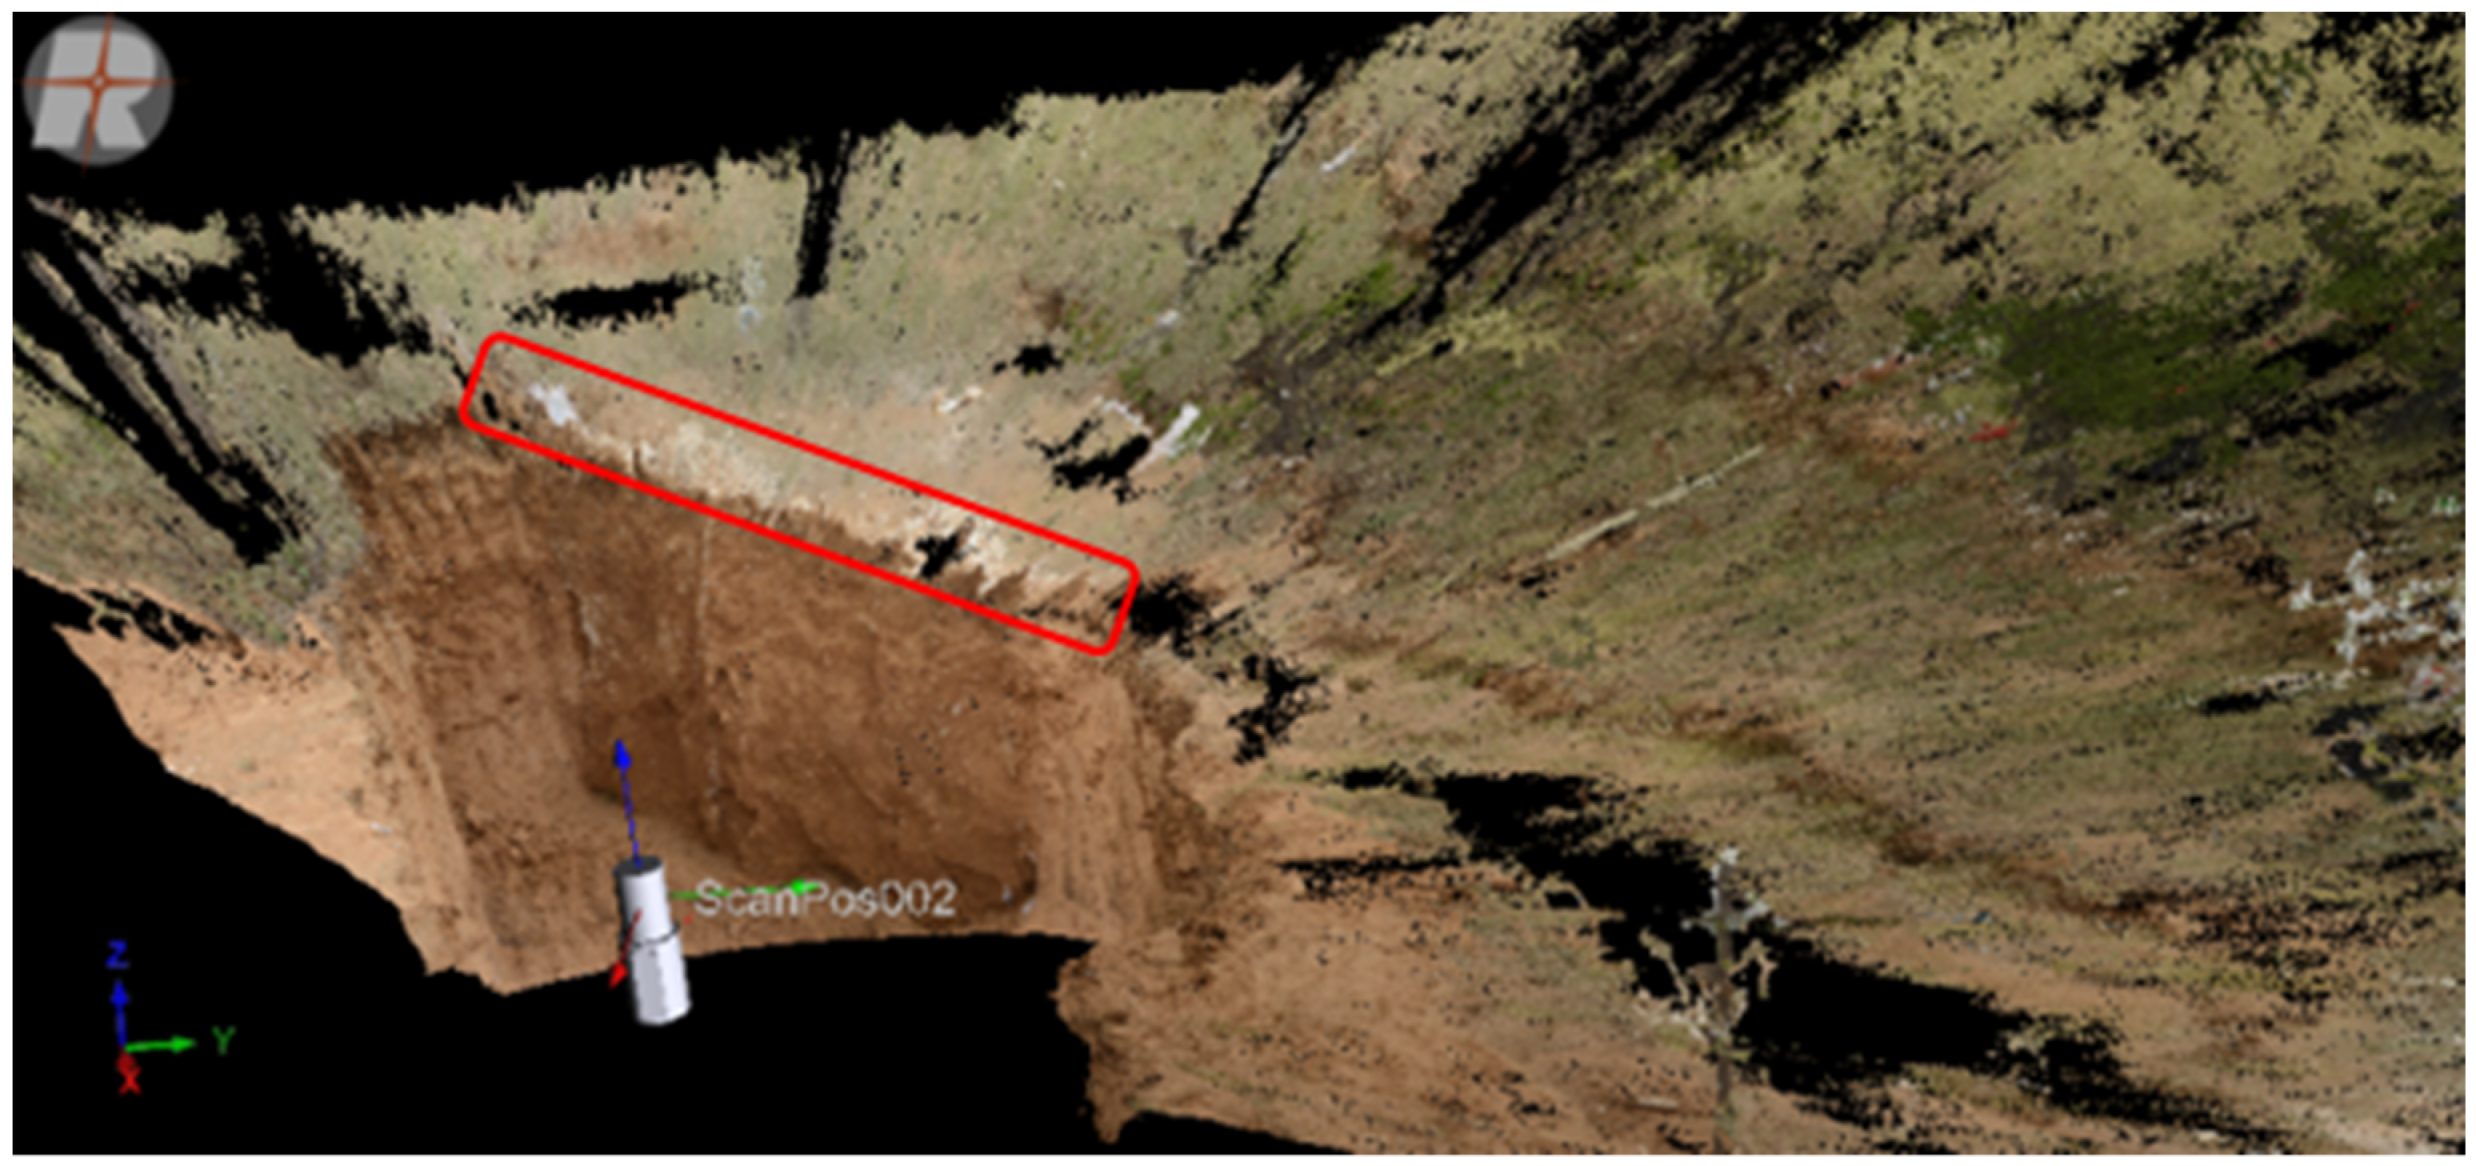
- Acquisition of Point Cloud Data
2.3. Data Processing Results
- 1.
- Point cloud registration
- 2.
- Point cloud denoising
- 3.
- Point cloud compression
- 4.
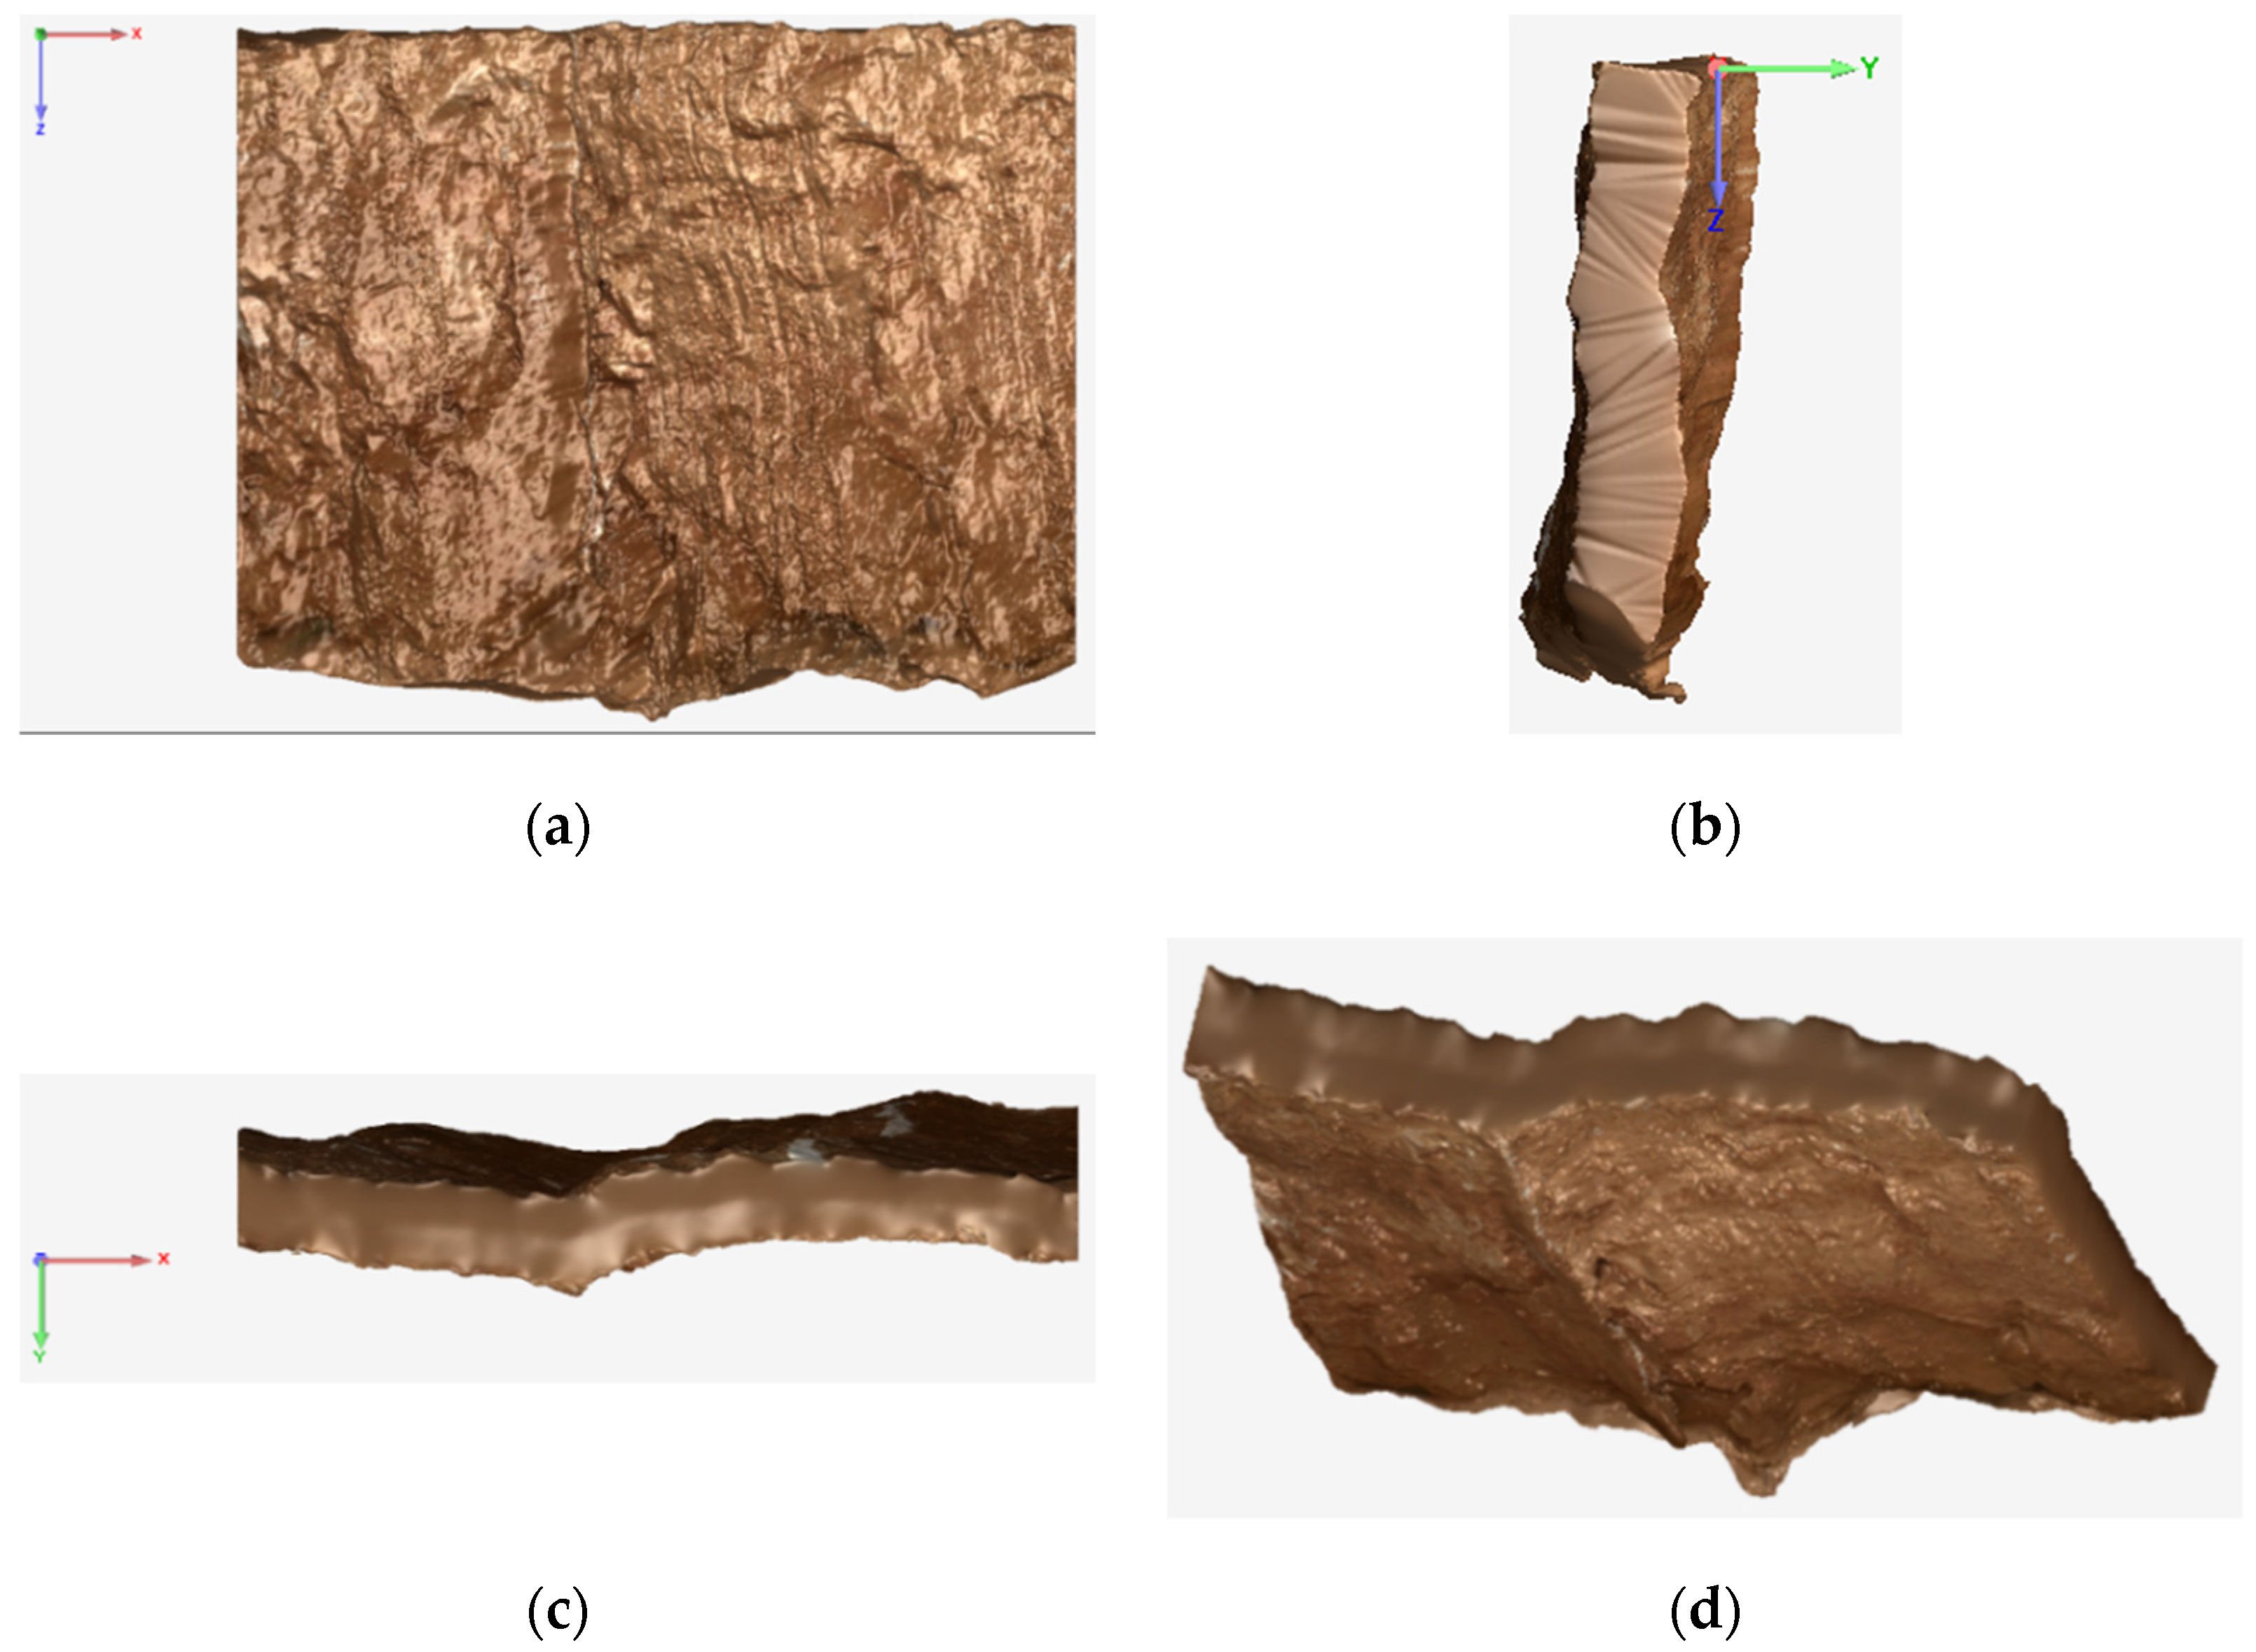
- 3D modeling
2.4. Description of the Ground Fissures
- Width: The surface width of the ground fissure represents the extent of the development of the ground fissure along the horizontal direction. The value reflects the damage degree of the ground fissure to surface continuity.
- Depth: The vertical depth of the ground fissure represents the extent of the development of the ground fissure along the vertical direction. The value reflects the influence of the ground fissure on surface water and mechanical properties.
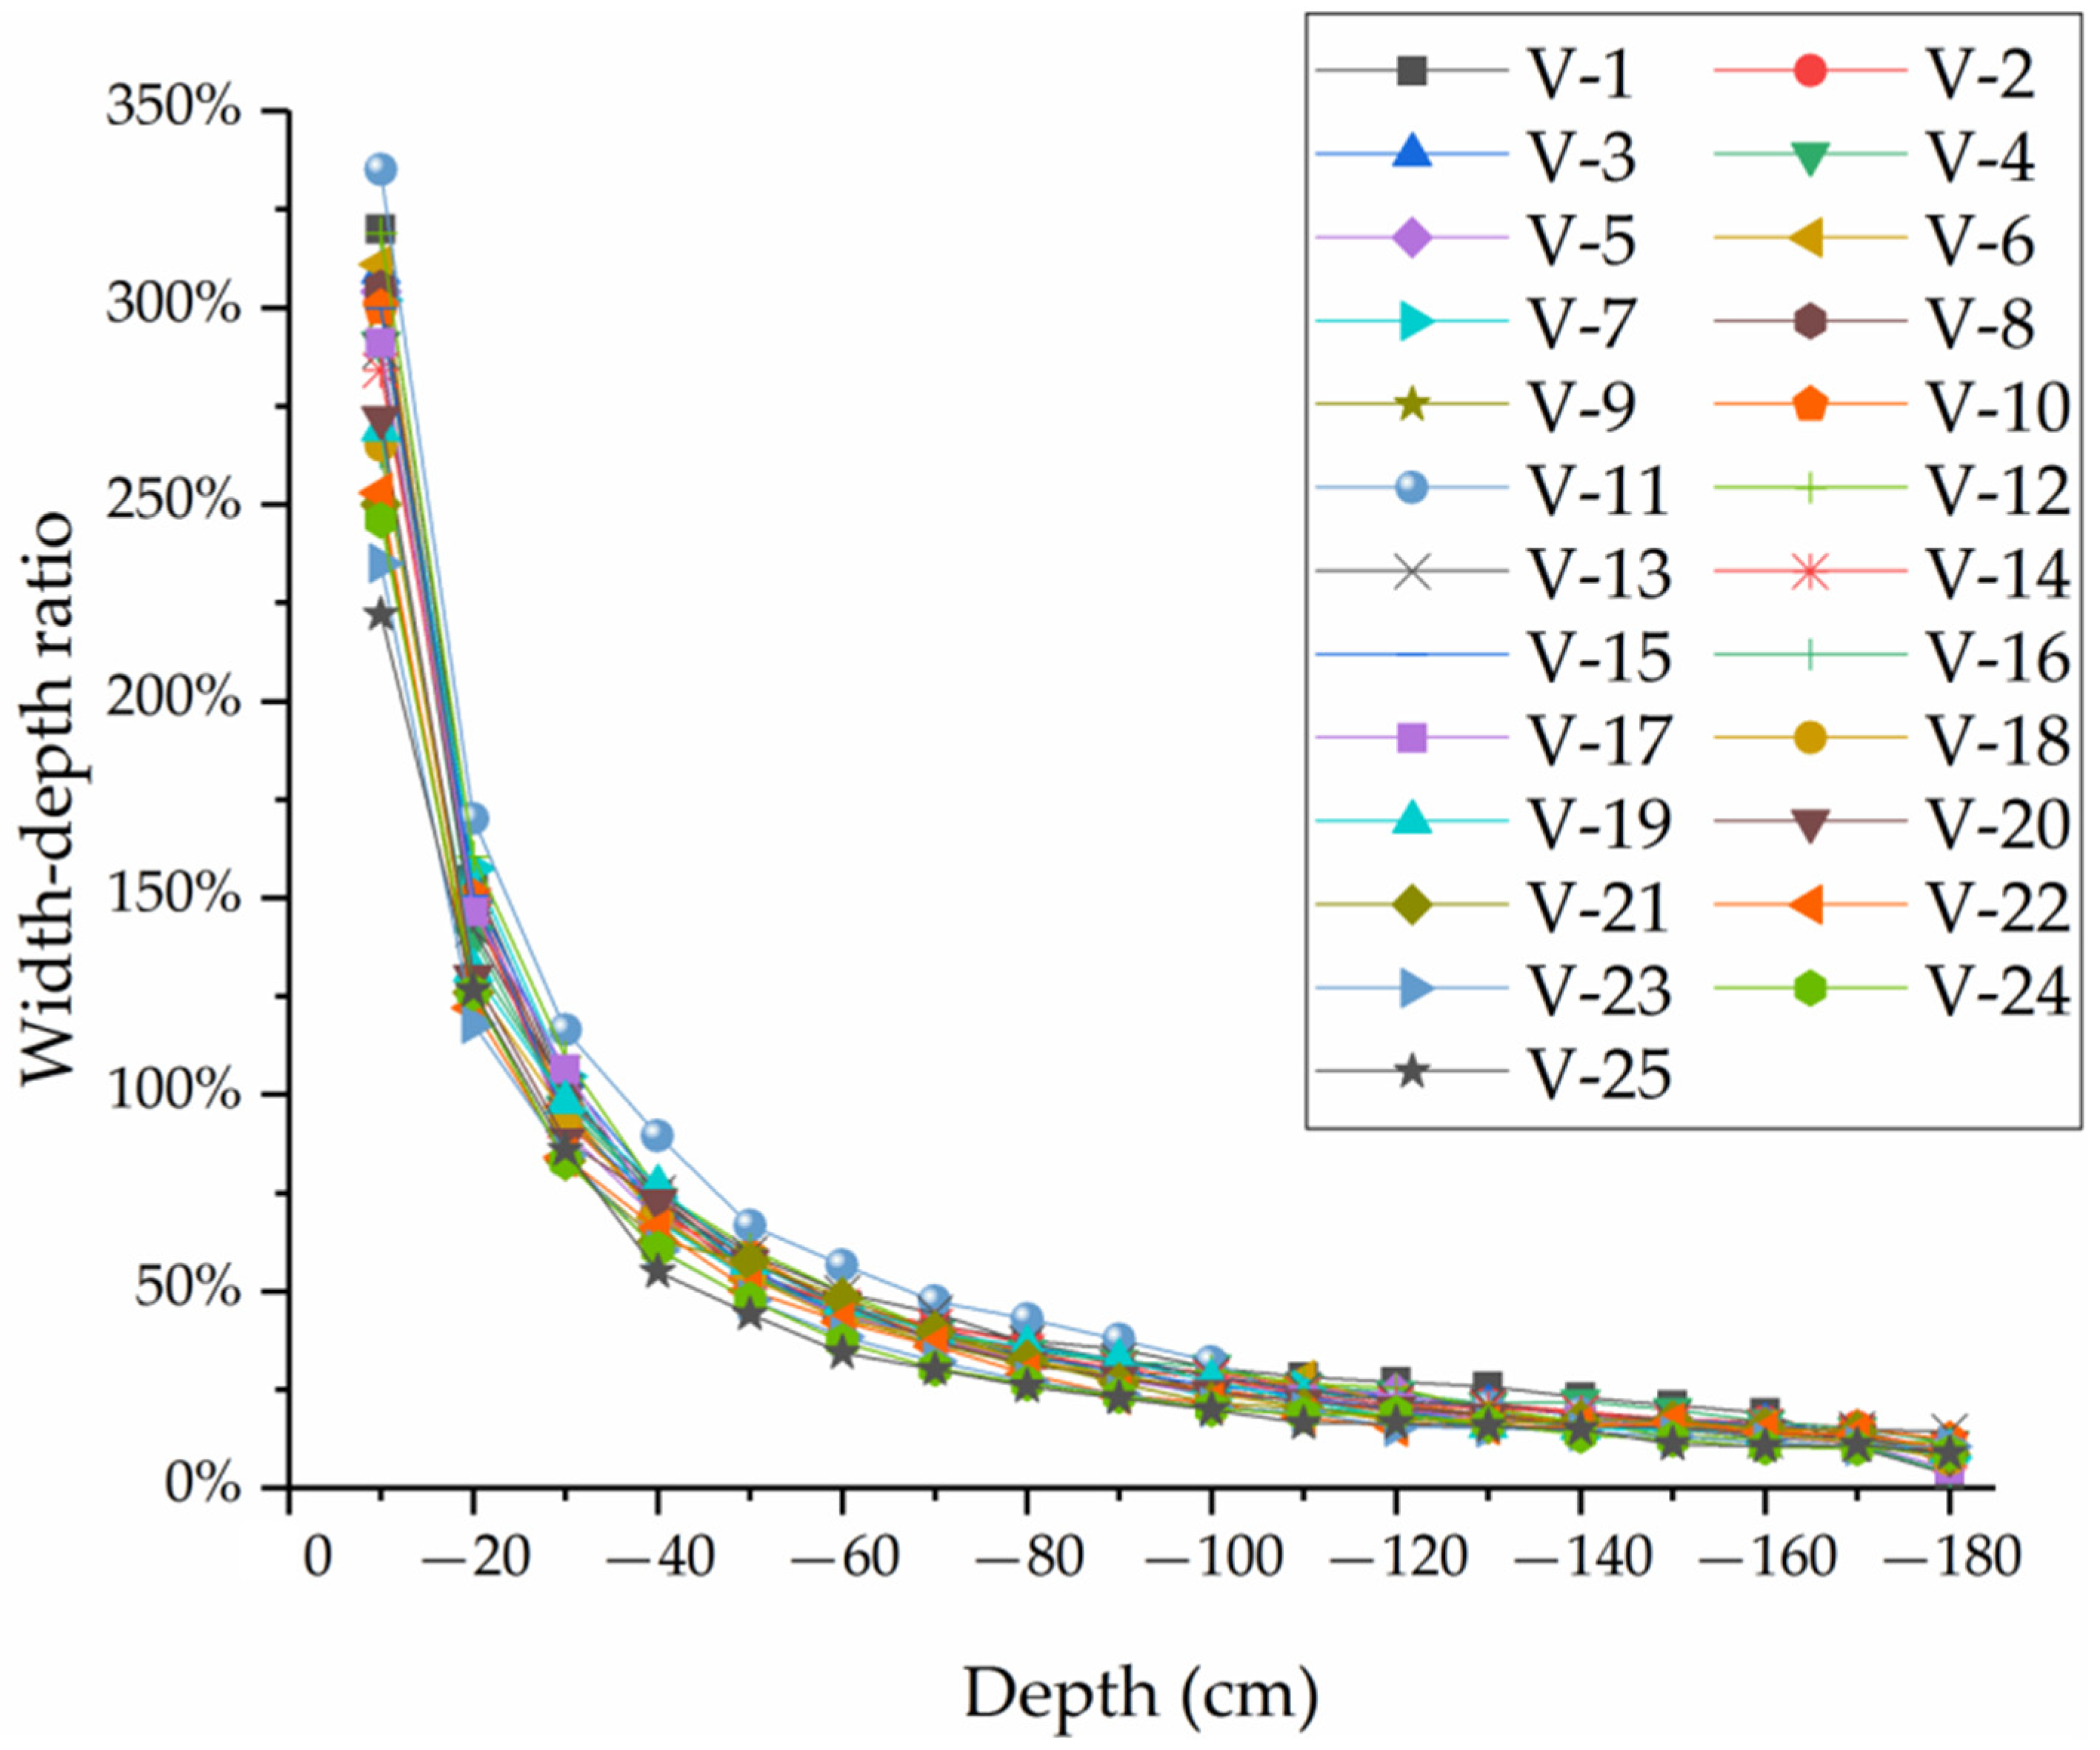
- Width–depth ratio: The ratio of the ground fissure width (in cm) to the depth (in cm) is related to the change of the ground fissure width with increasing depth.
- Extension angle: The angle between the ground fissure and the standard direction reflects the degree of the offset of the ground fissure.
- Drop: The height of the ground fissure step.
3. Results
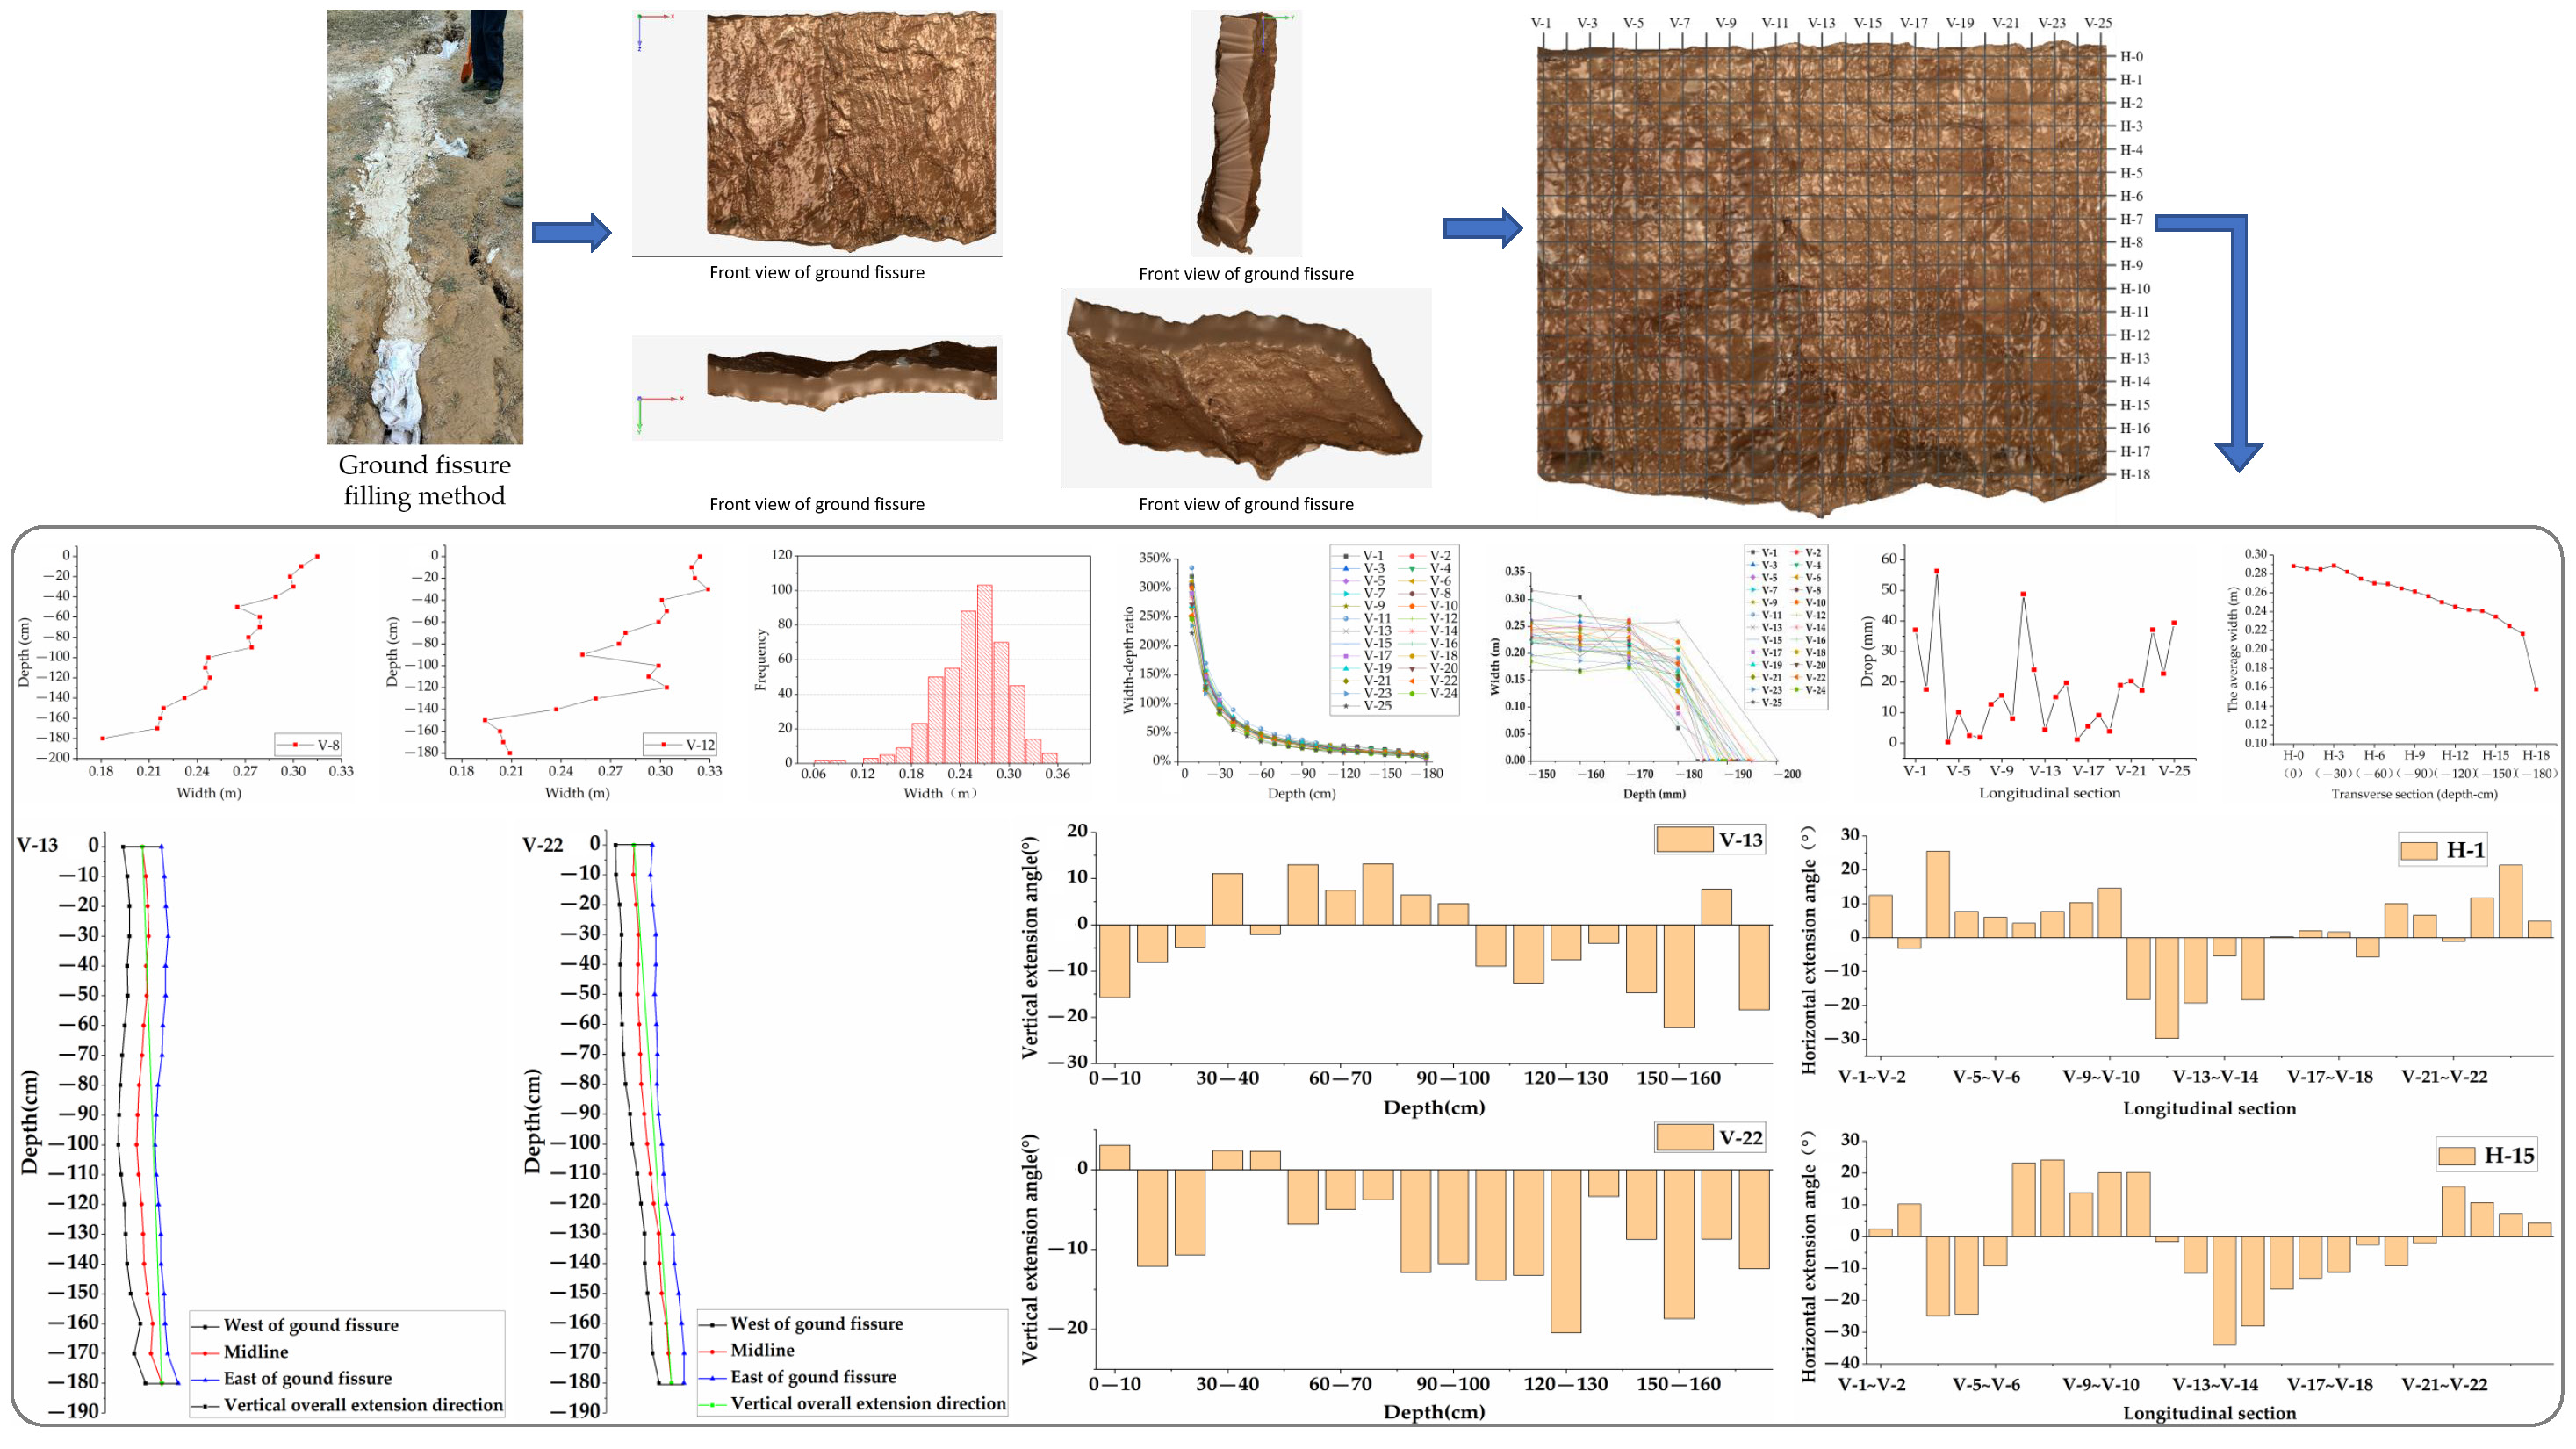
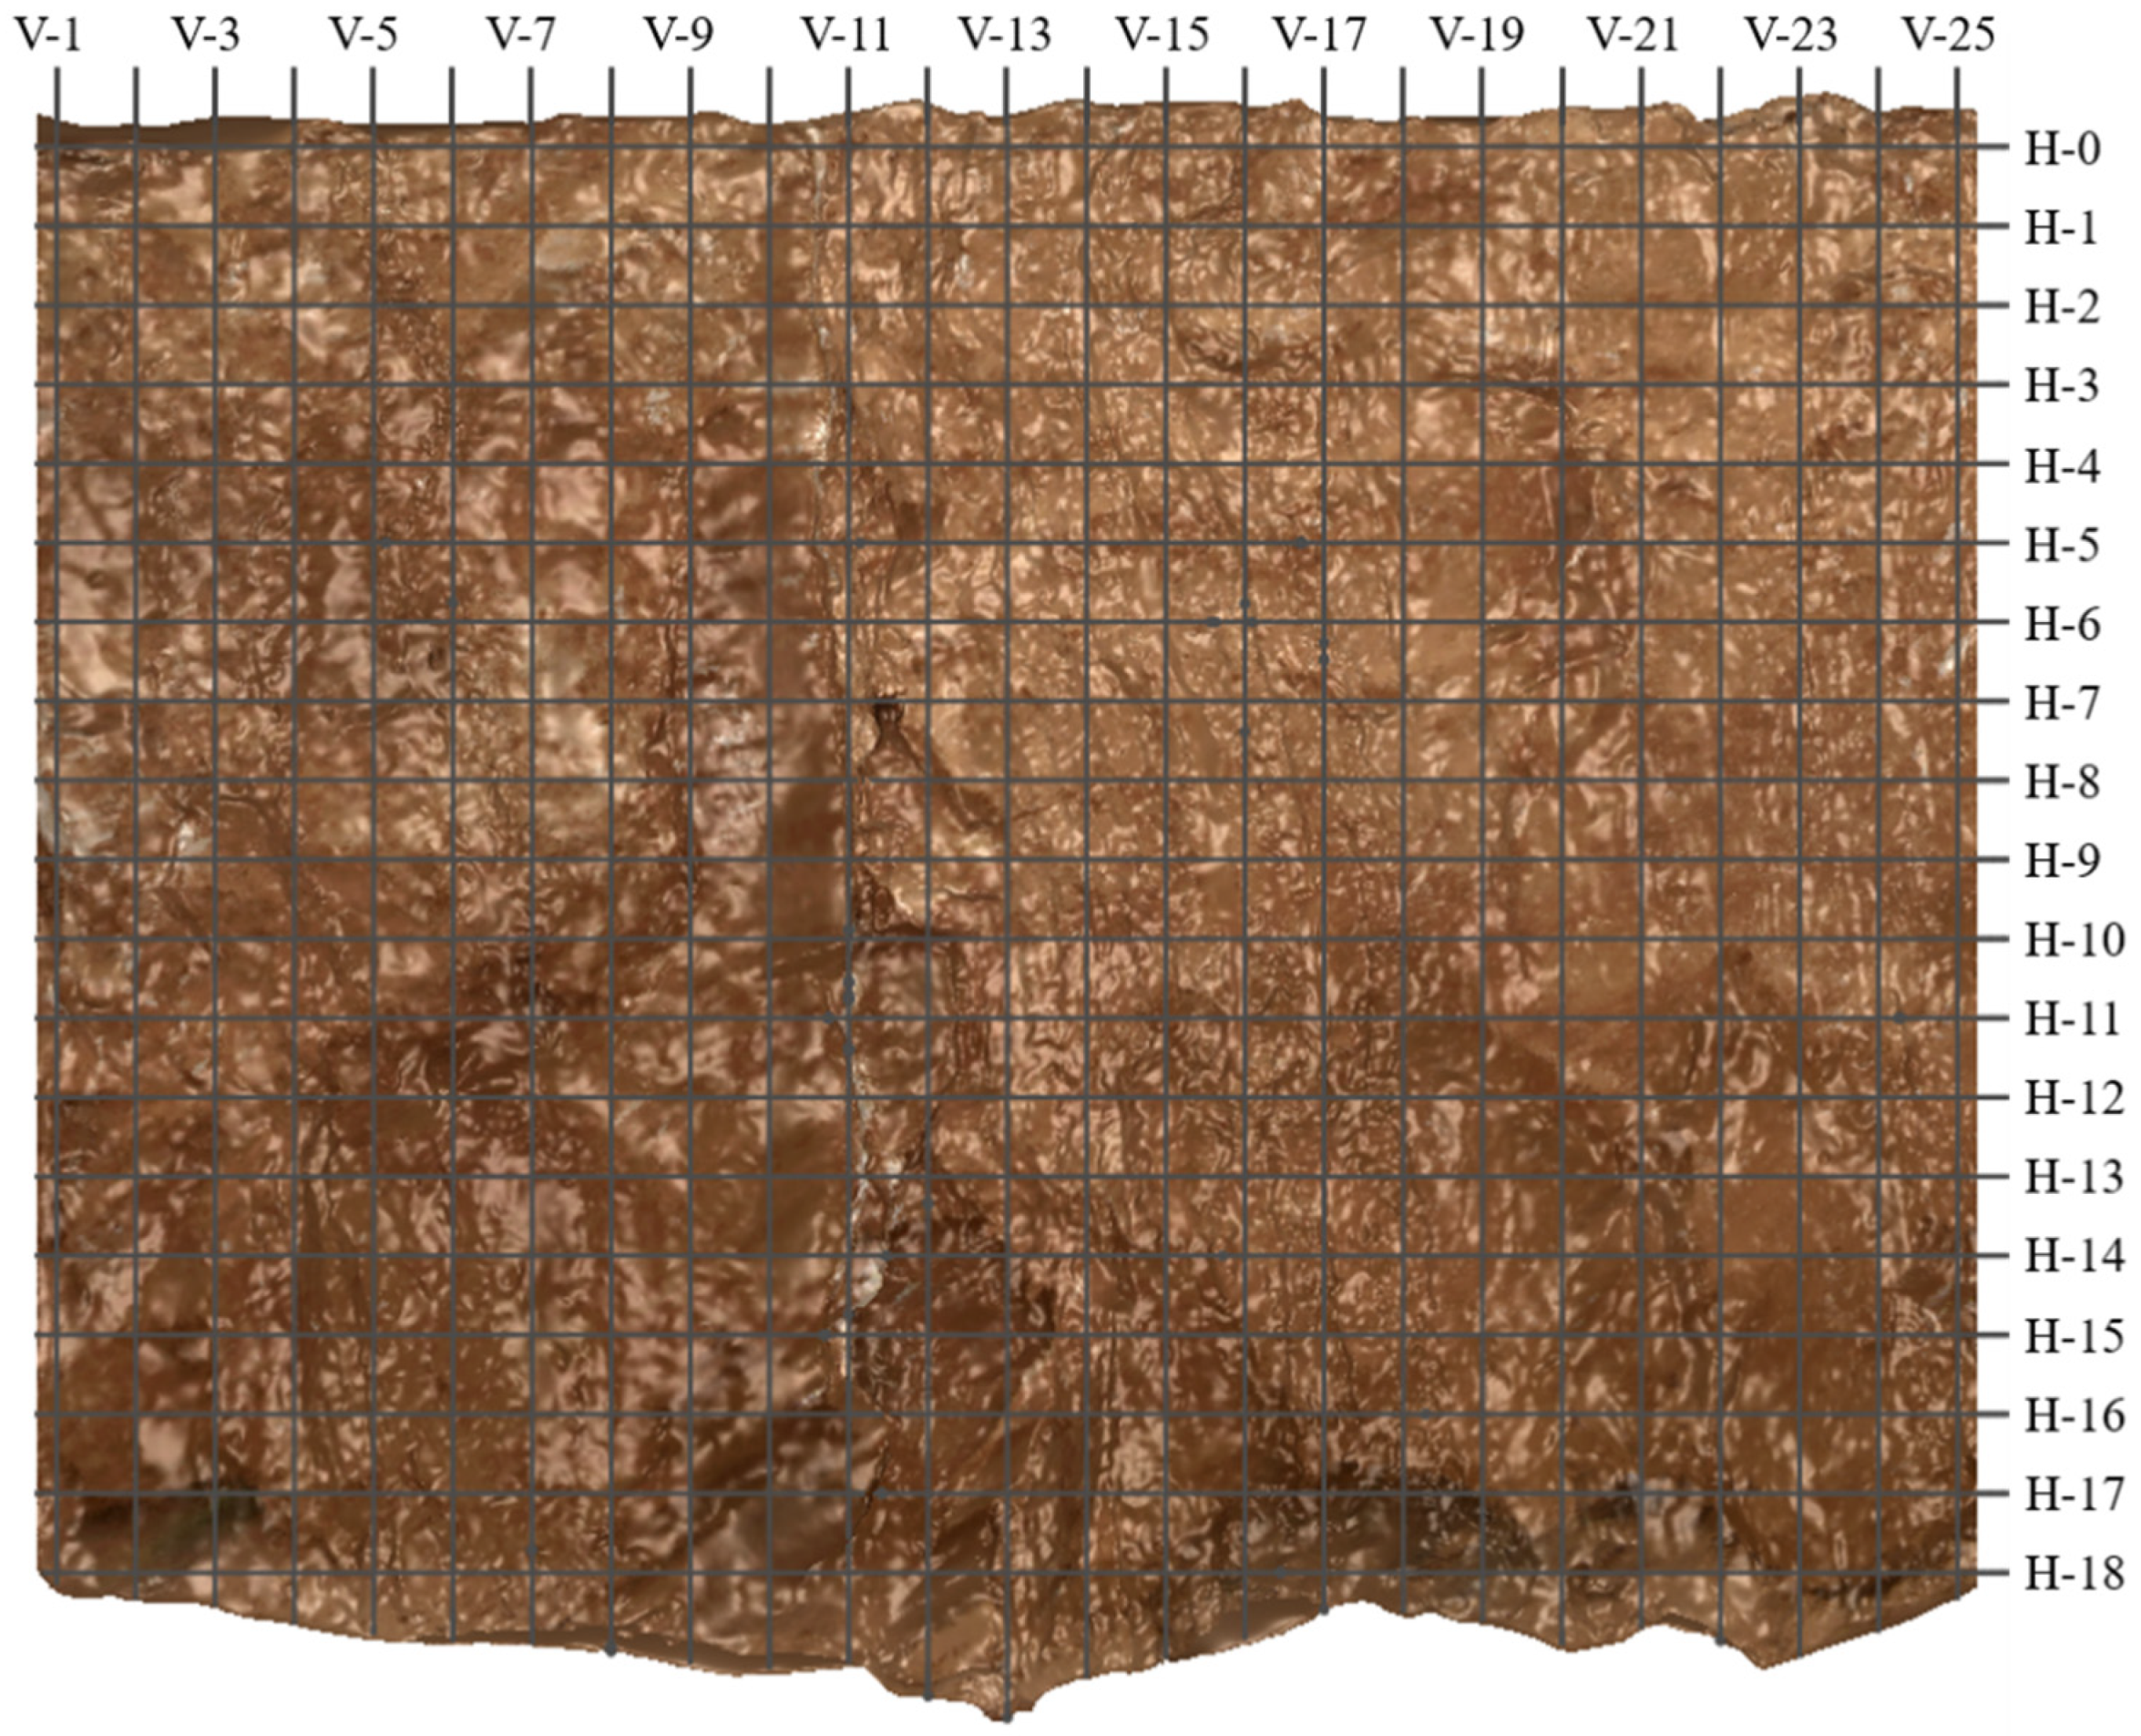
3.1. Model Slice
3.2. Analysis of Ground Fissure Morphology
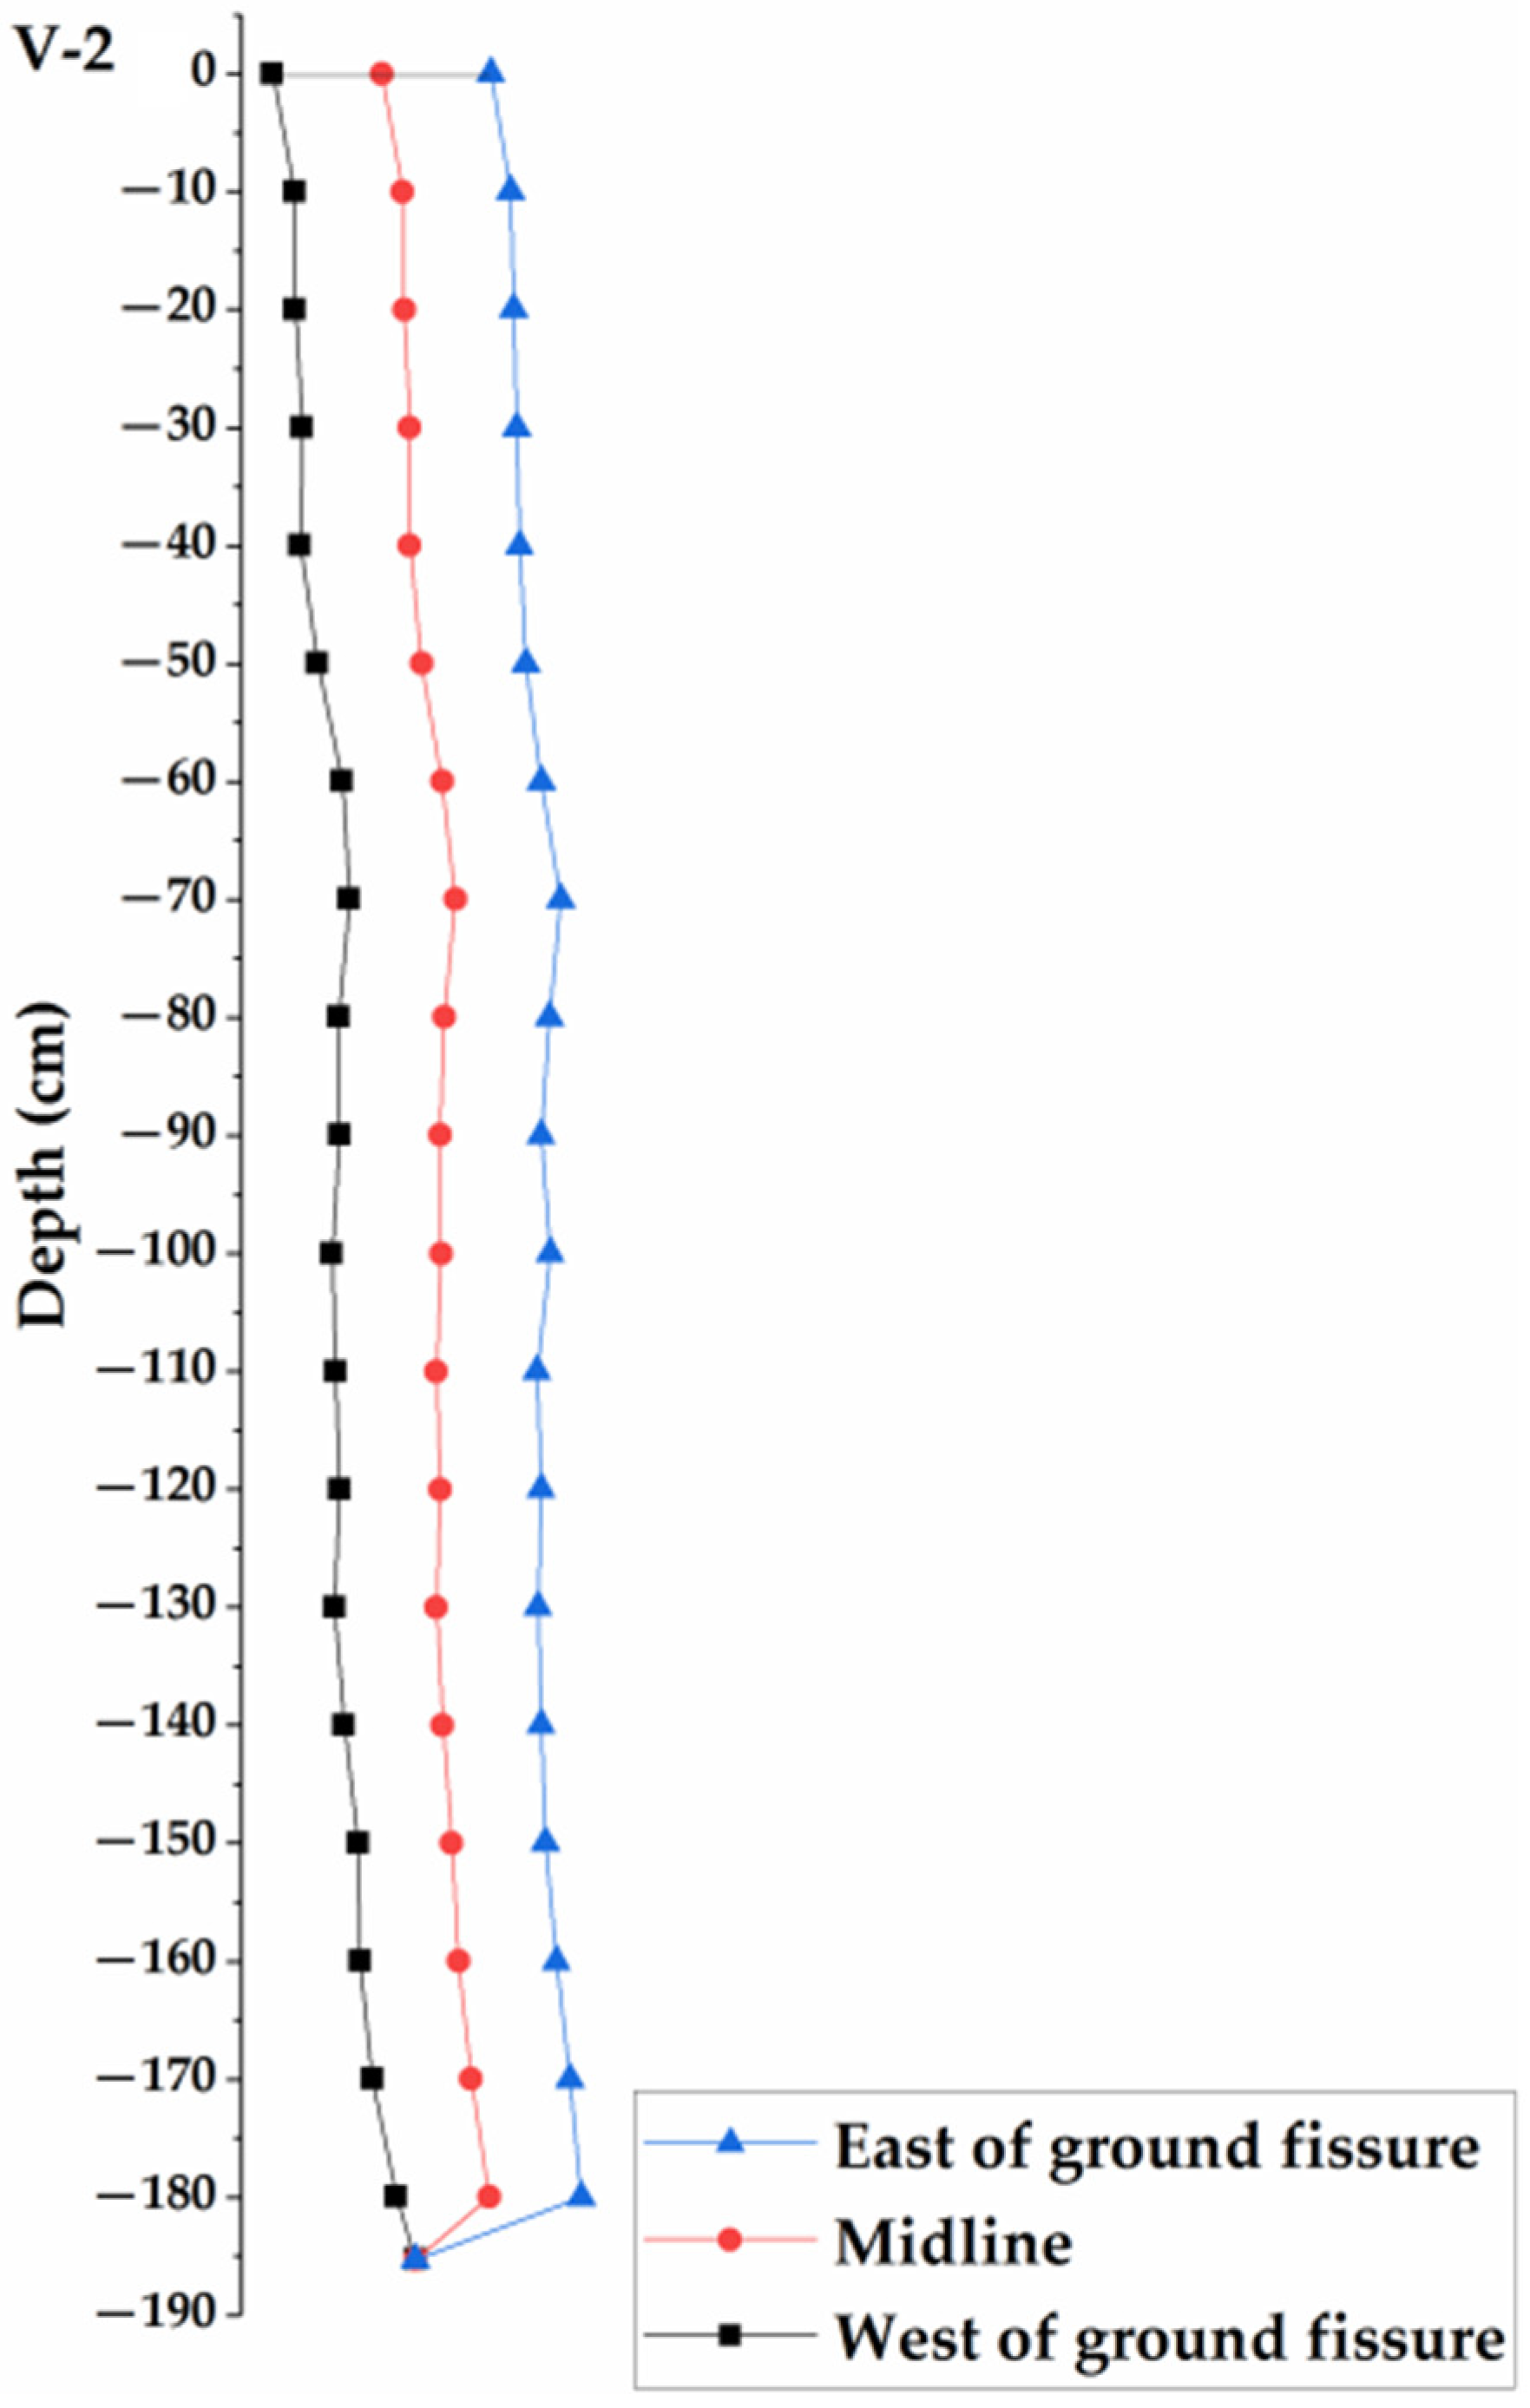
3.2.1. Longitudinal Section of the Ground Fissure Analysis
- 1.
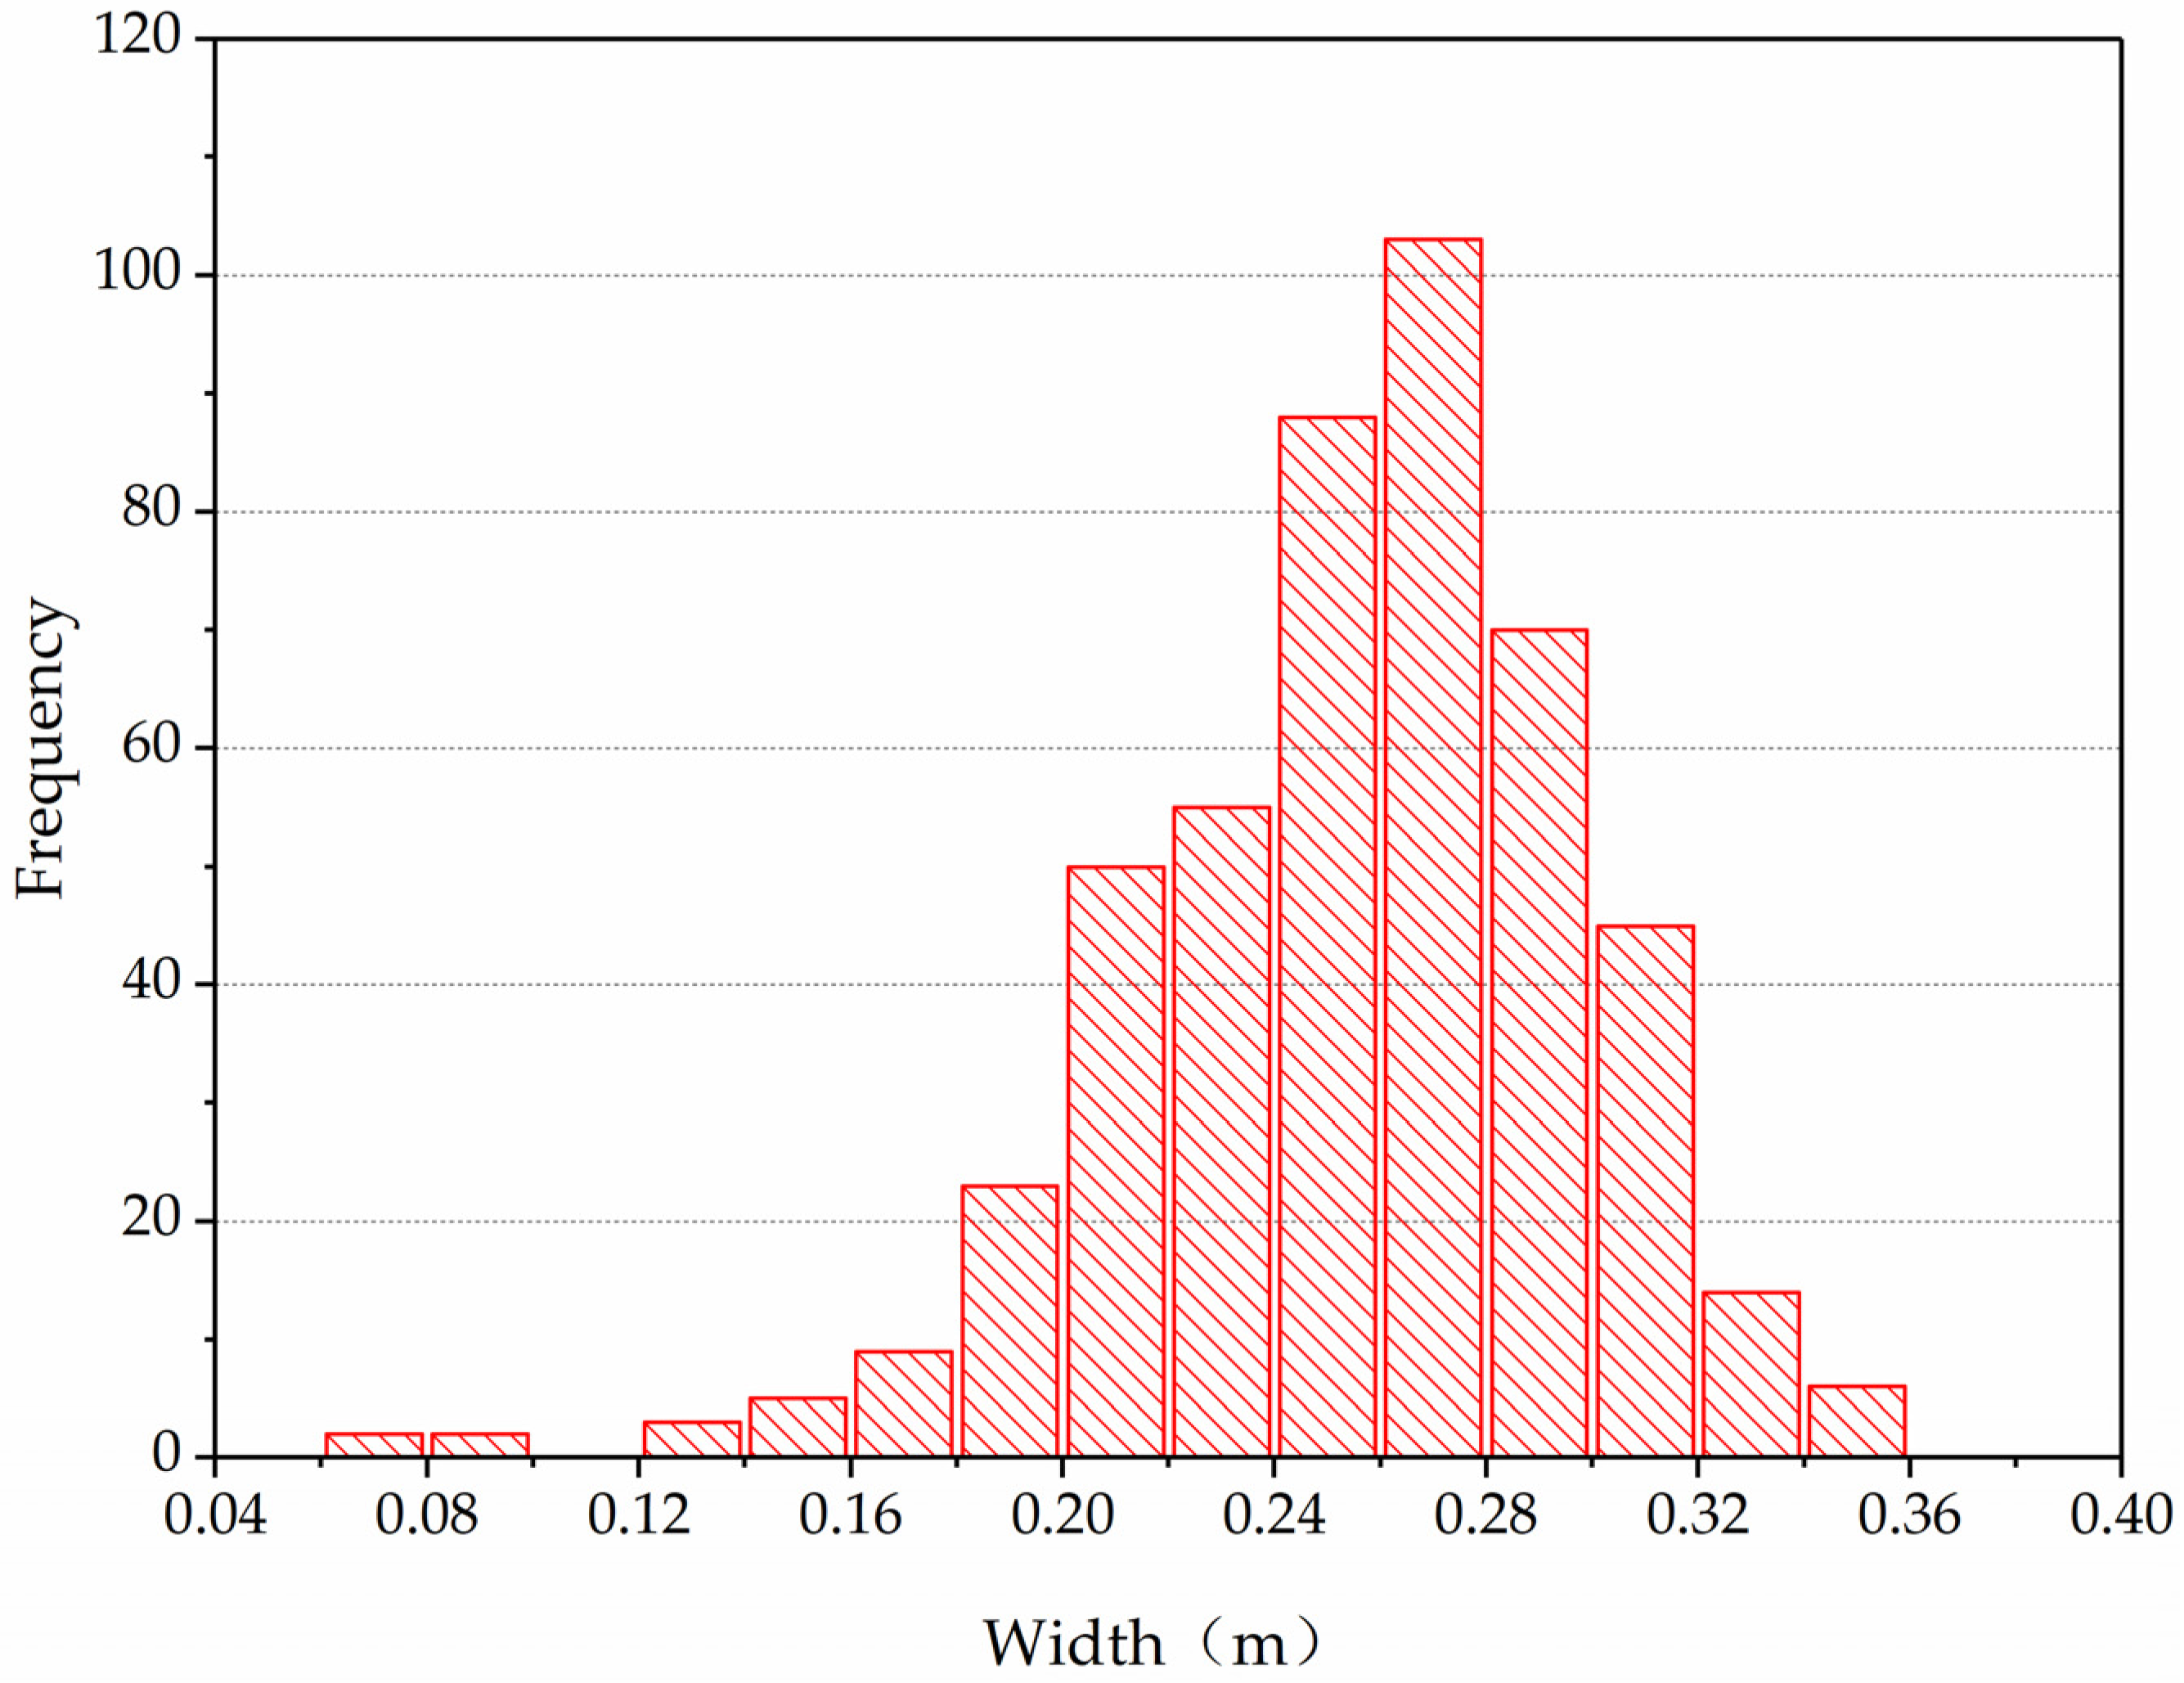
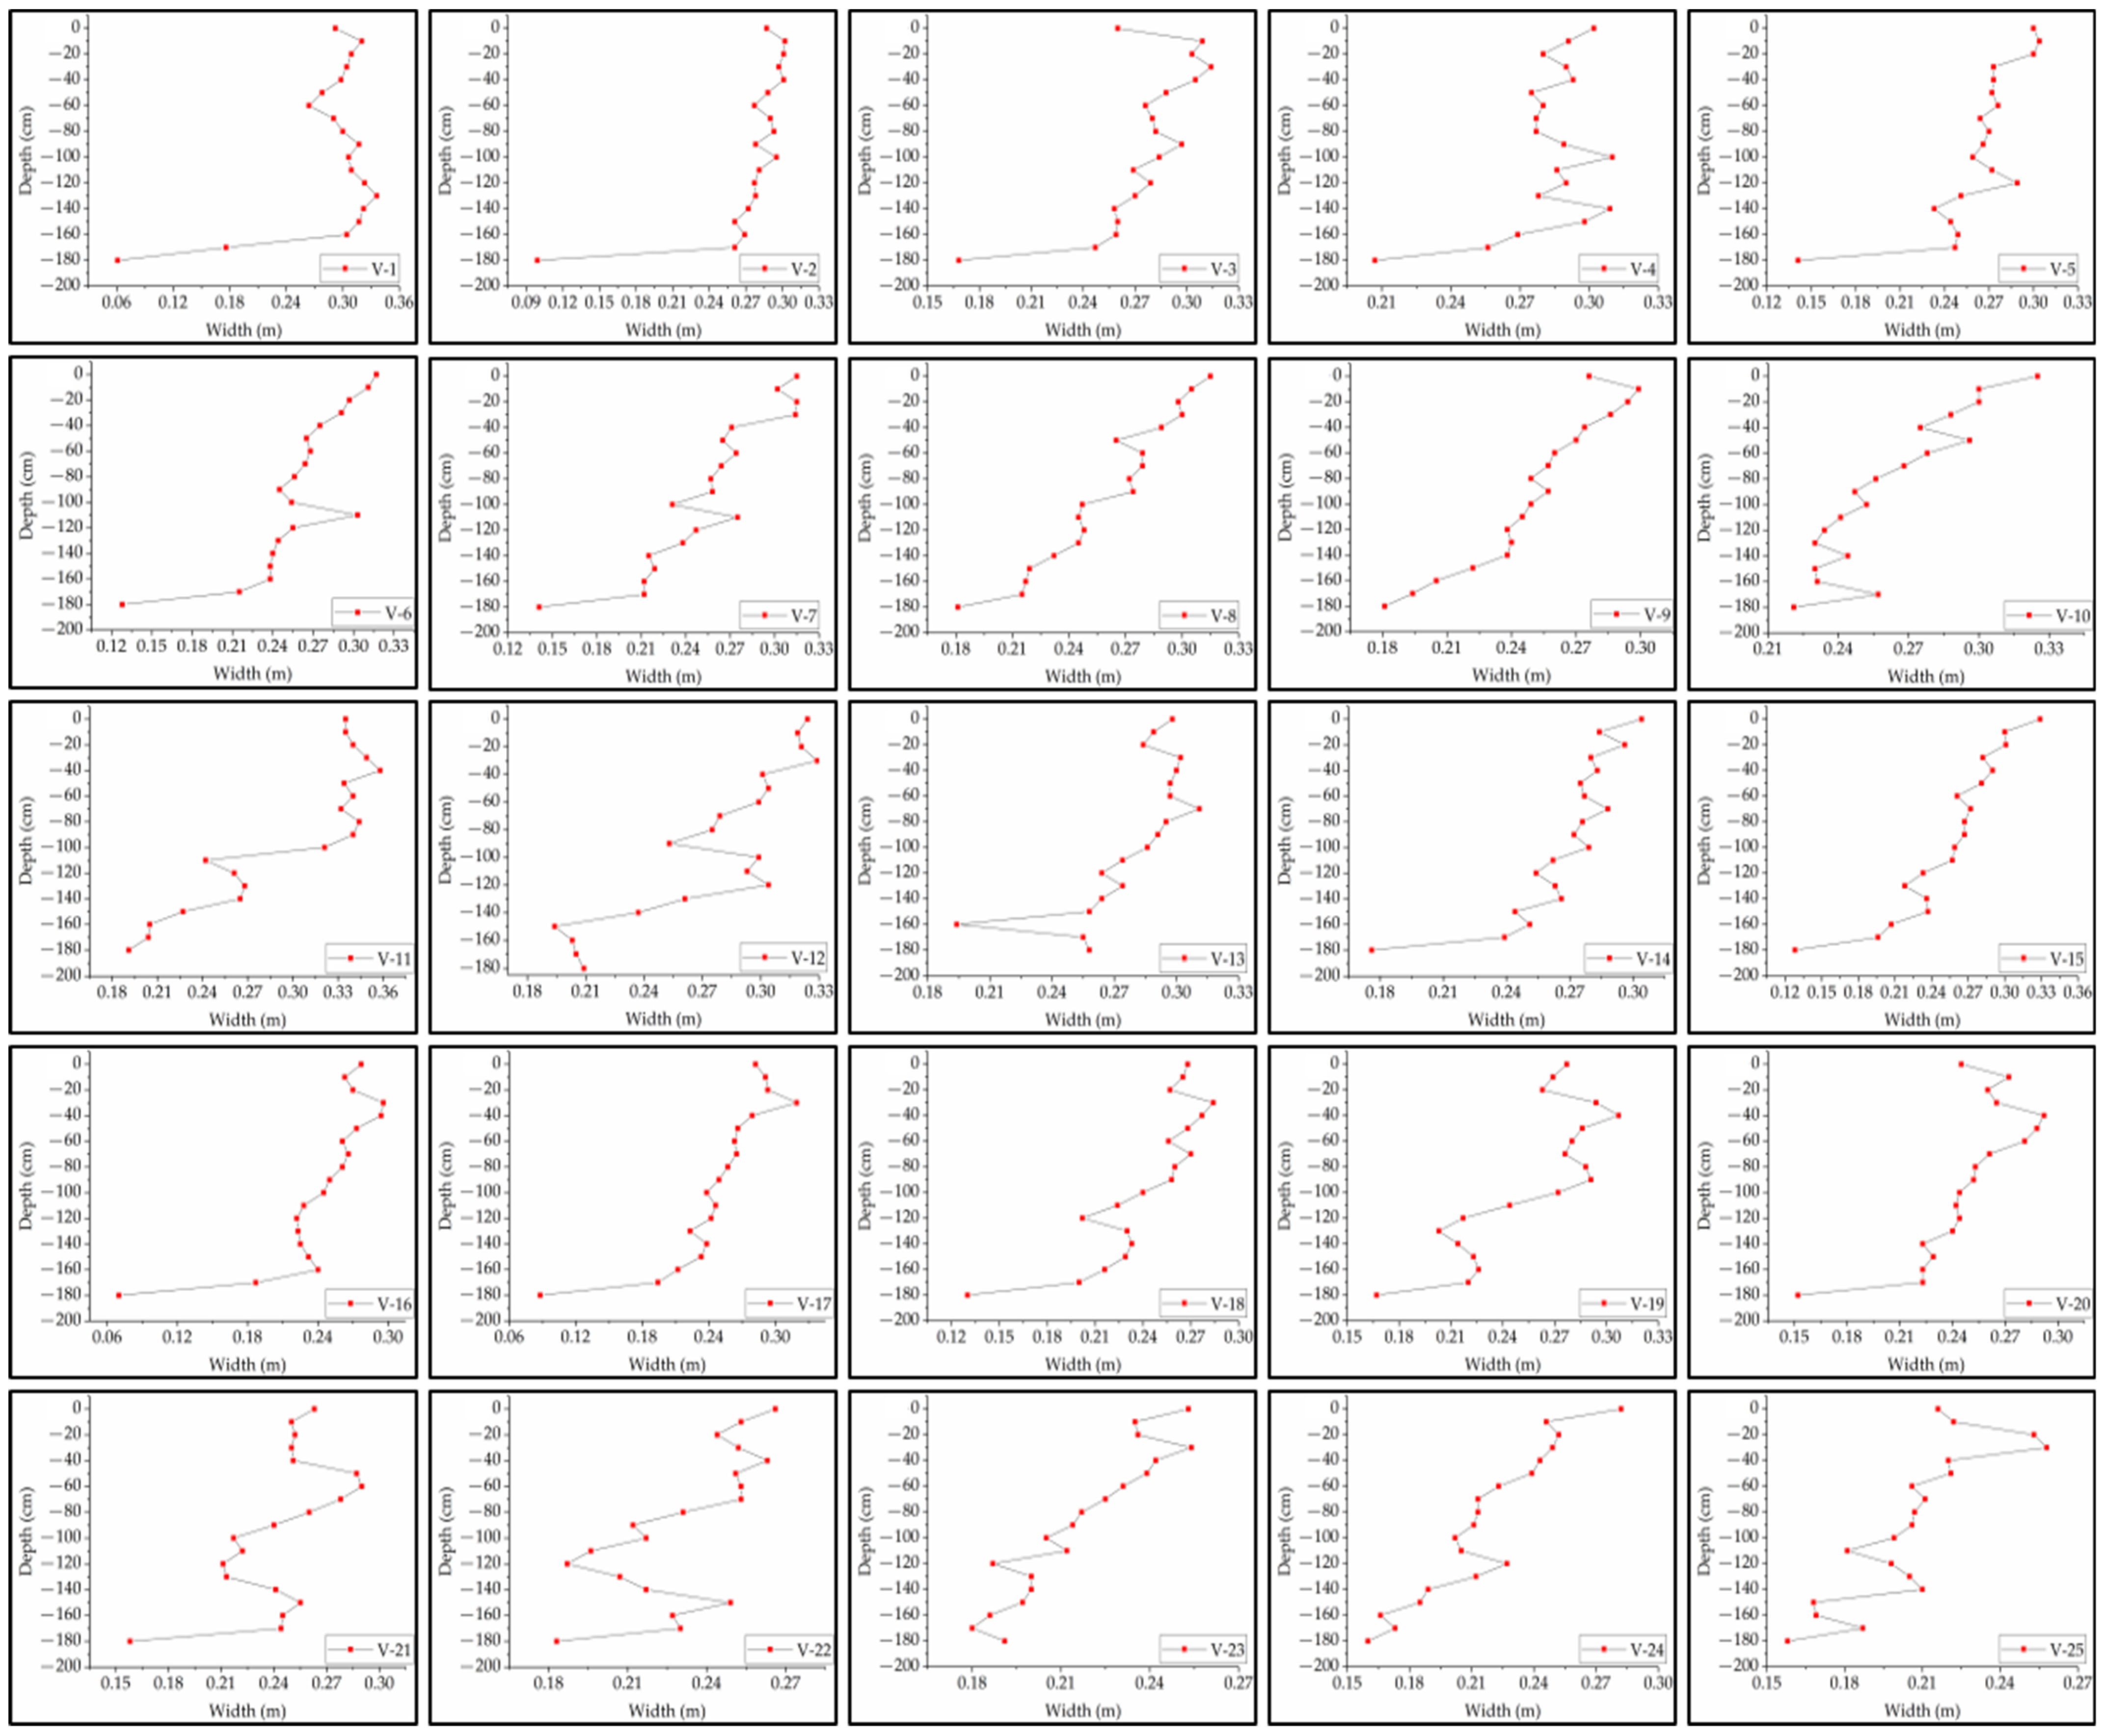
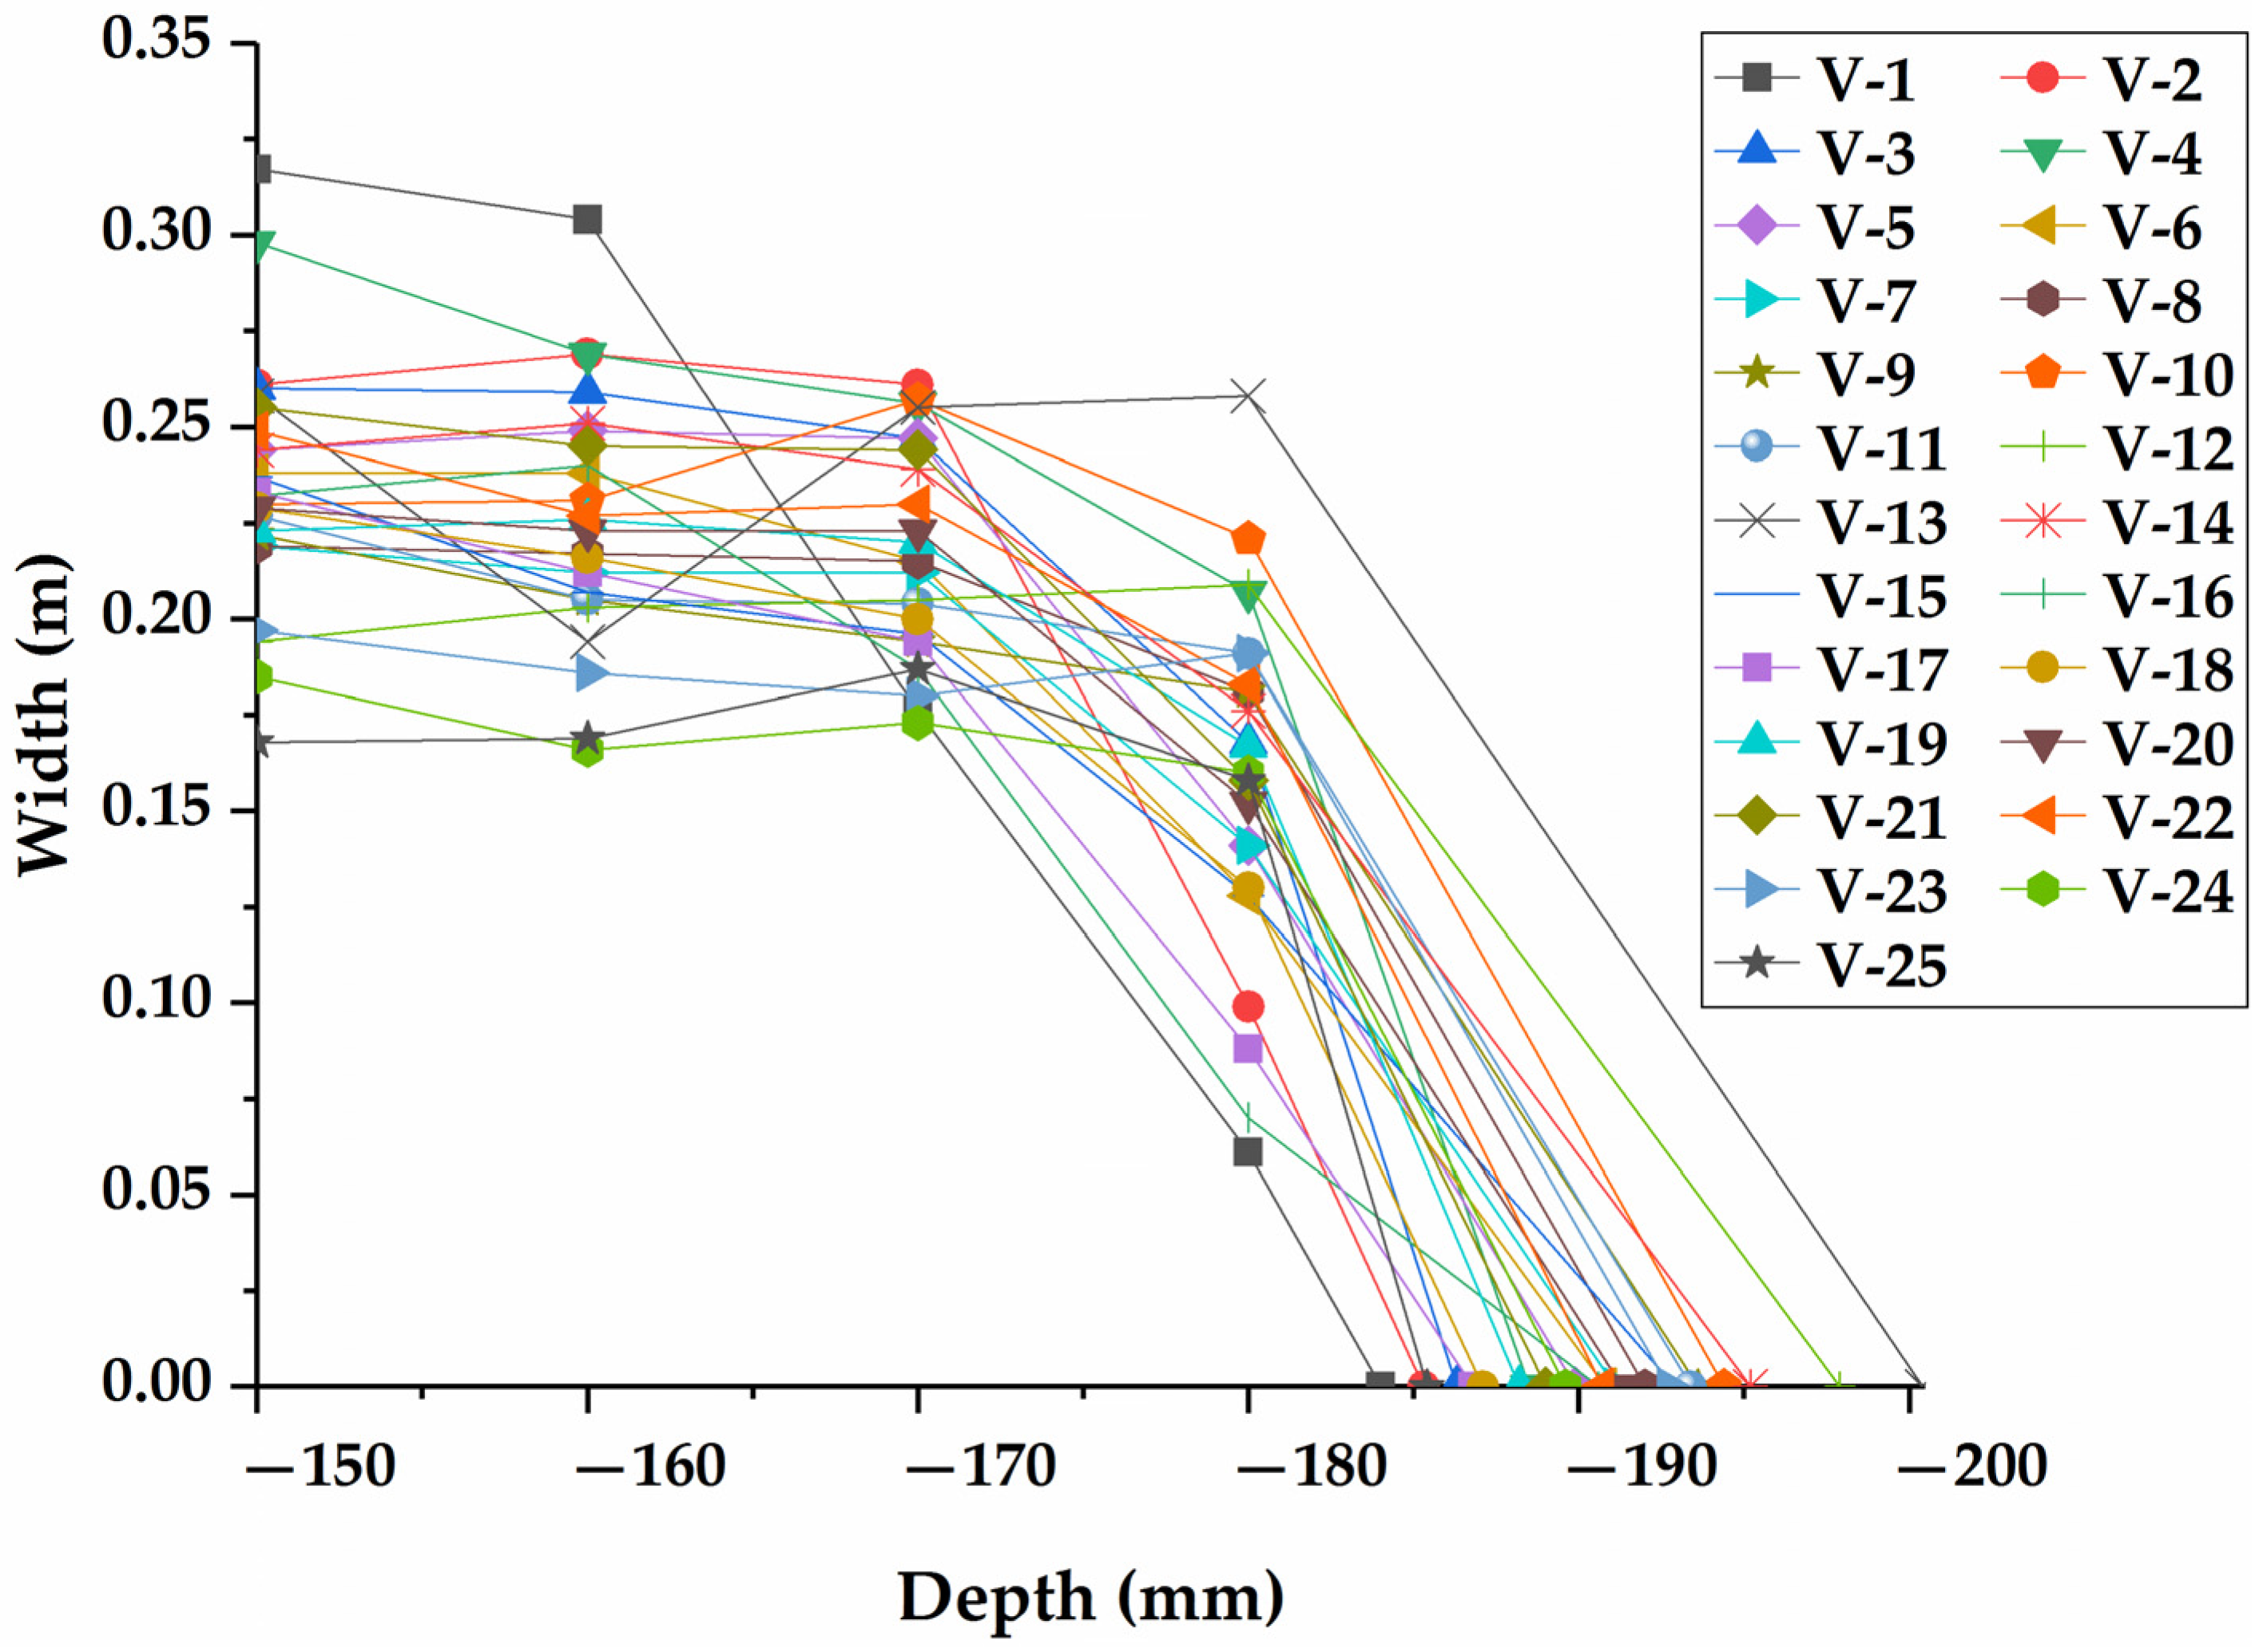
- Width and Depth of the Ground Fissure
- 2.
- Vertical Width–Depth Ratio of the Ground Fissure
- 3.
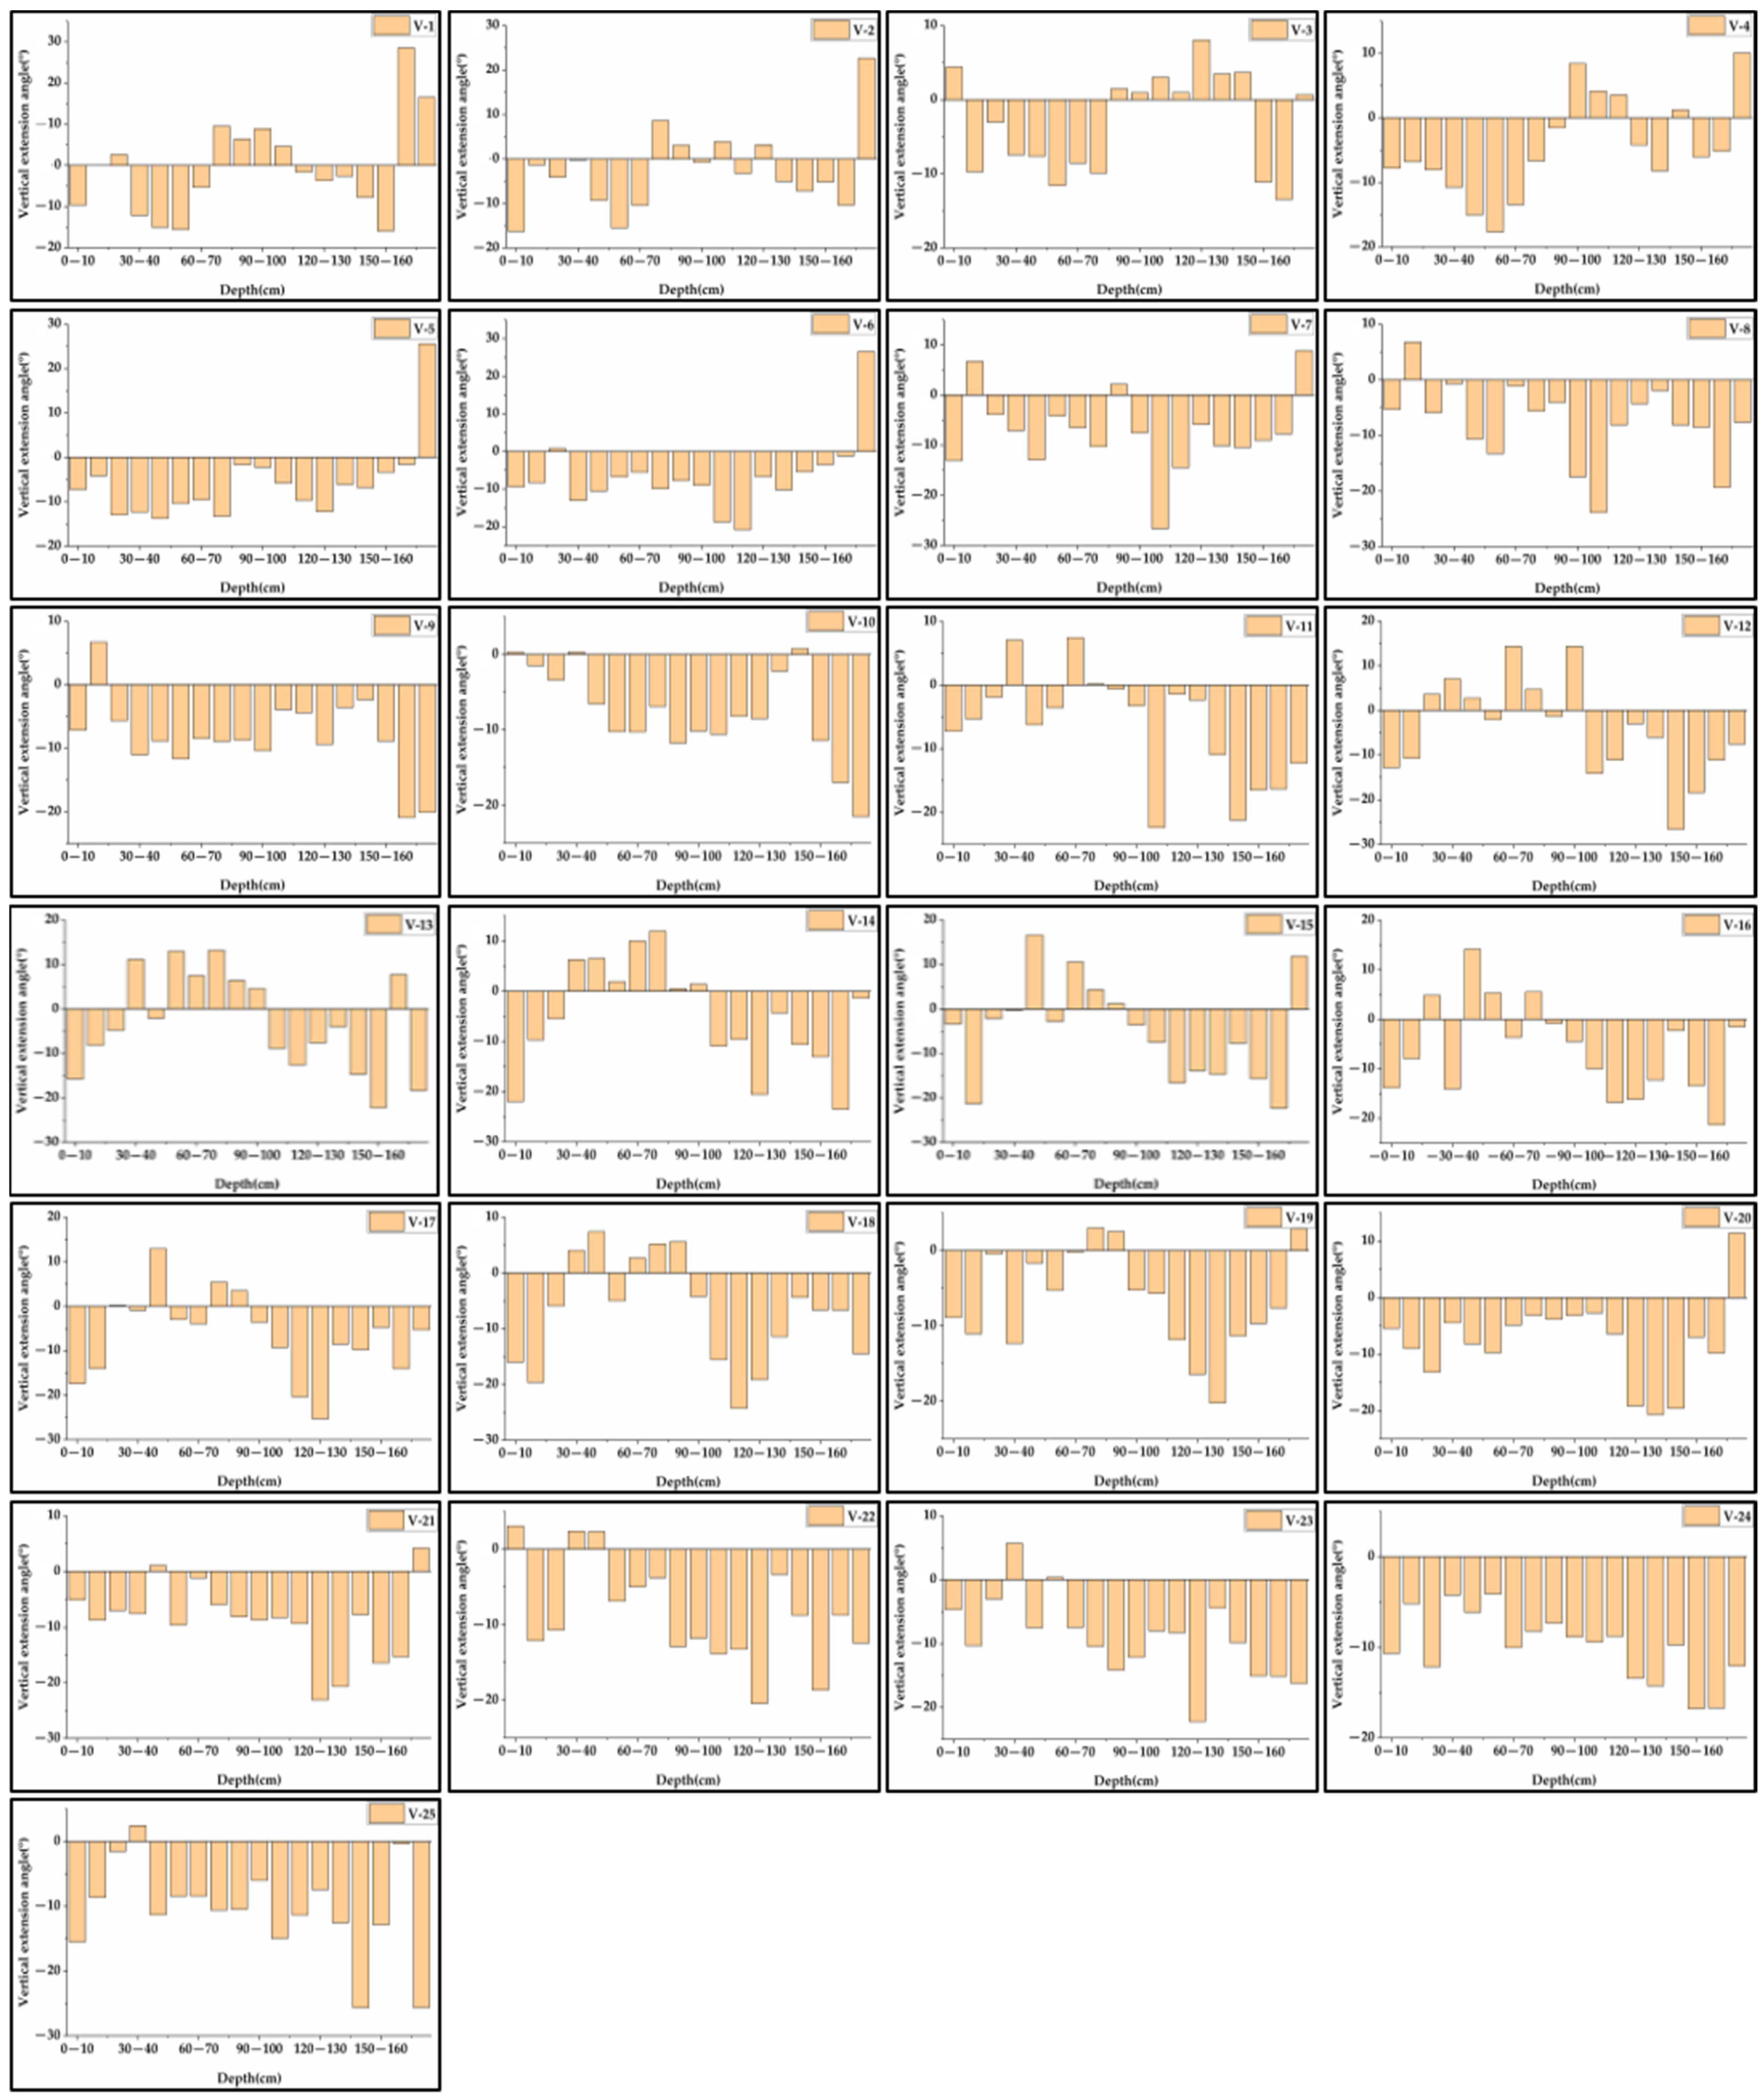
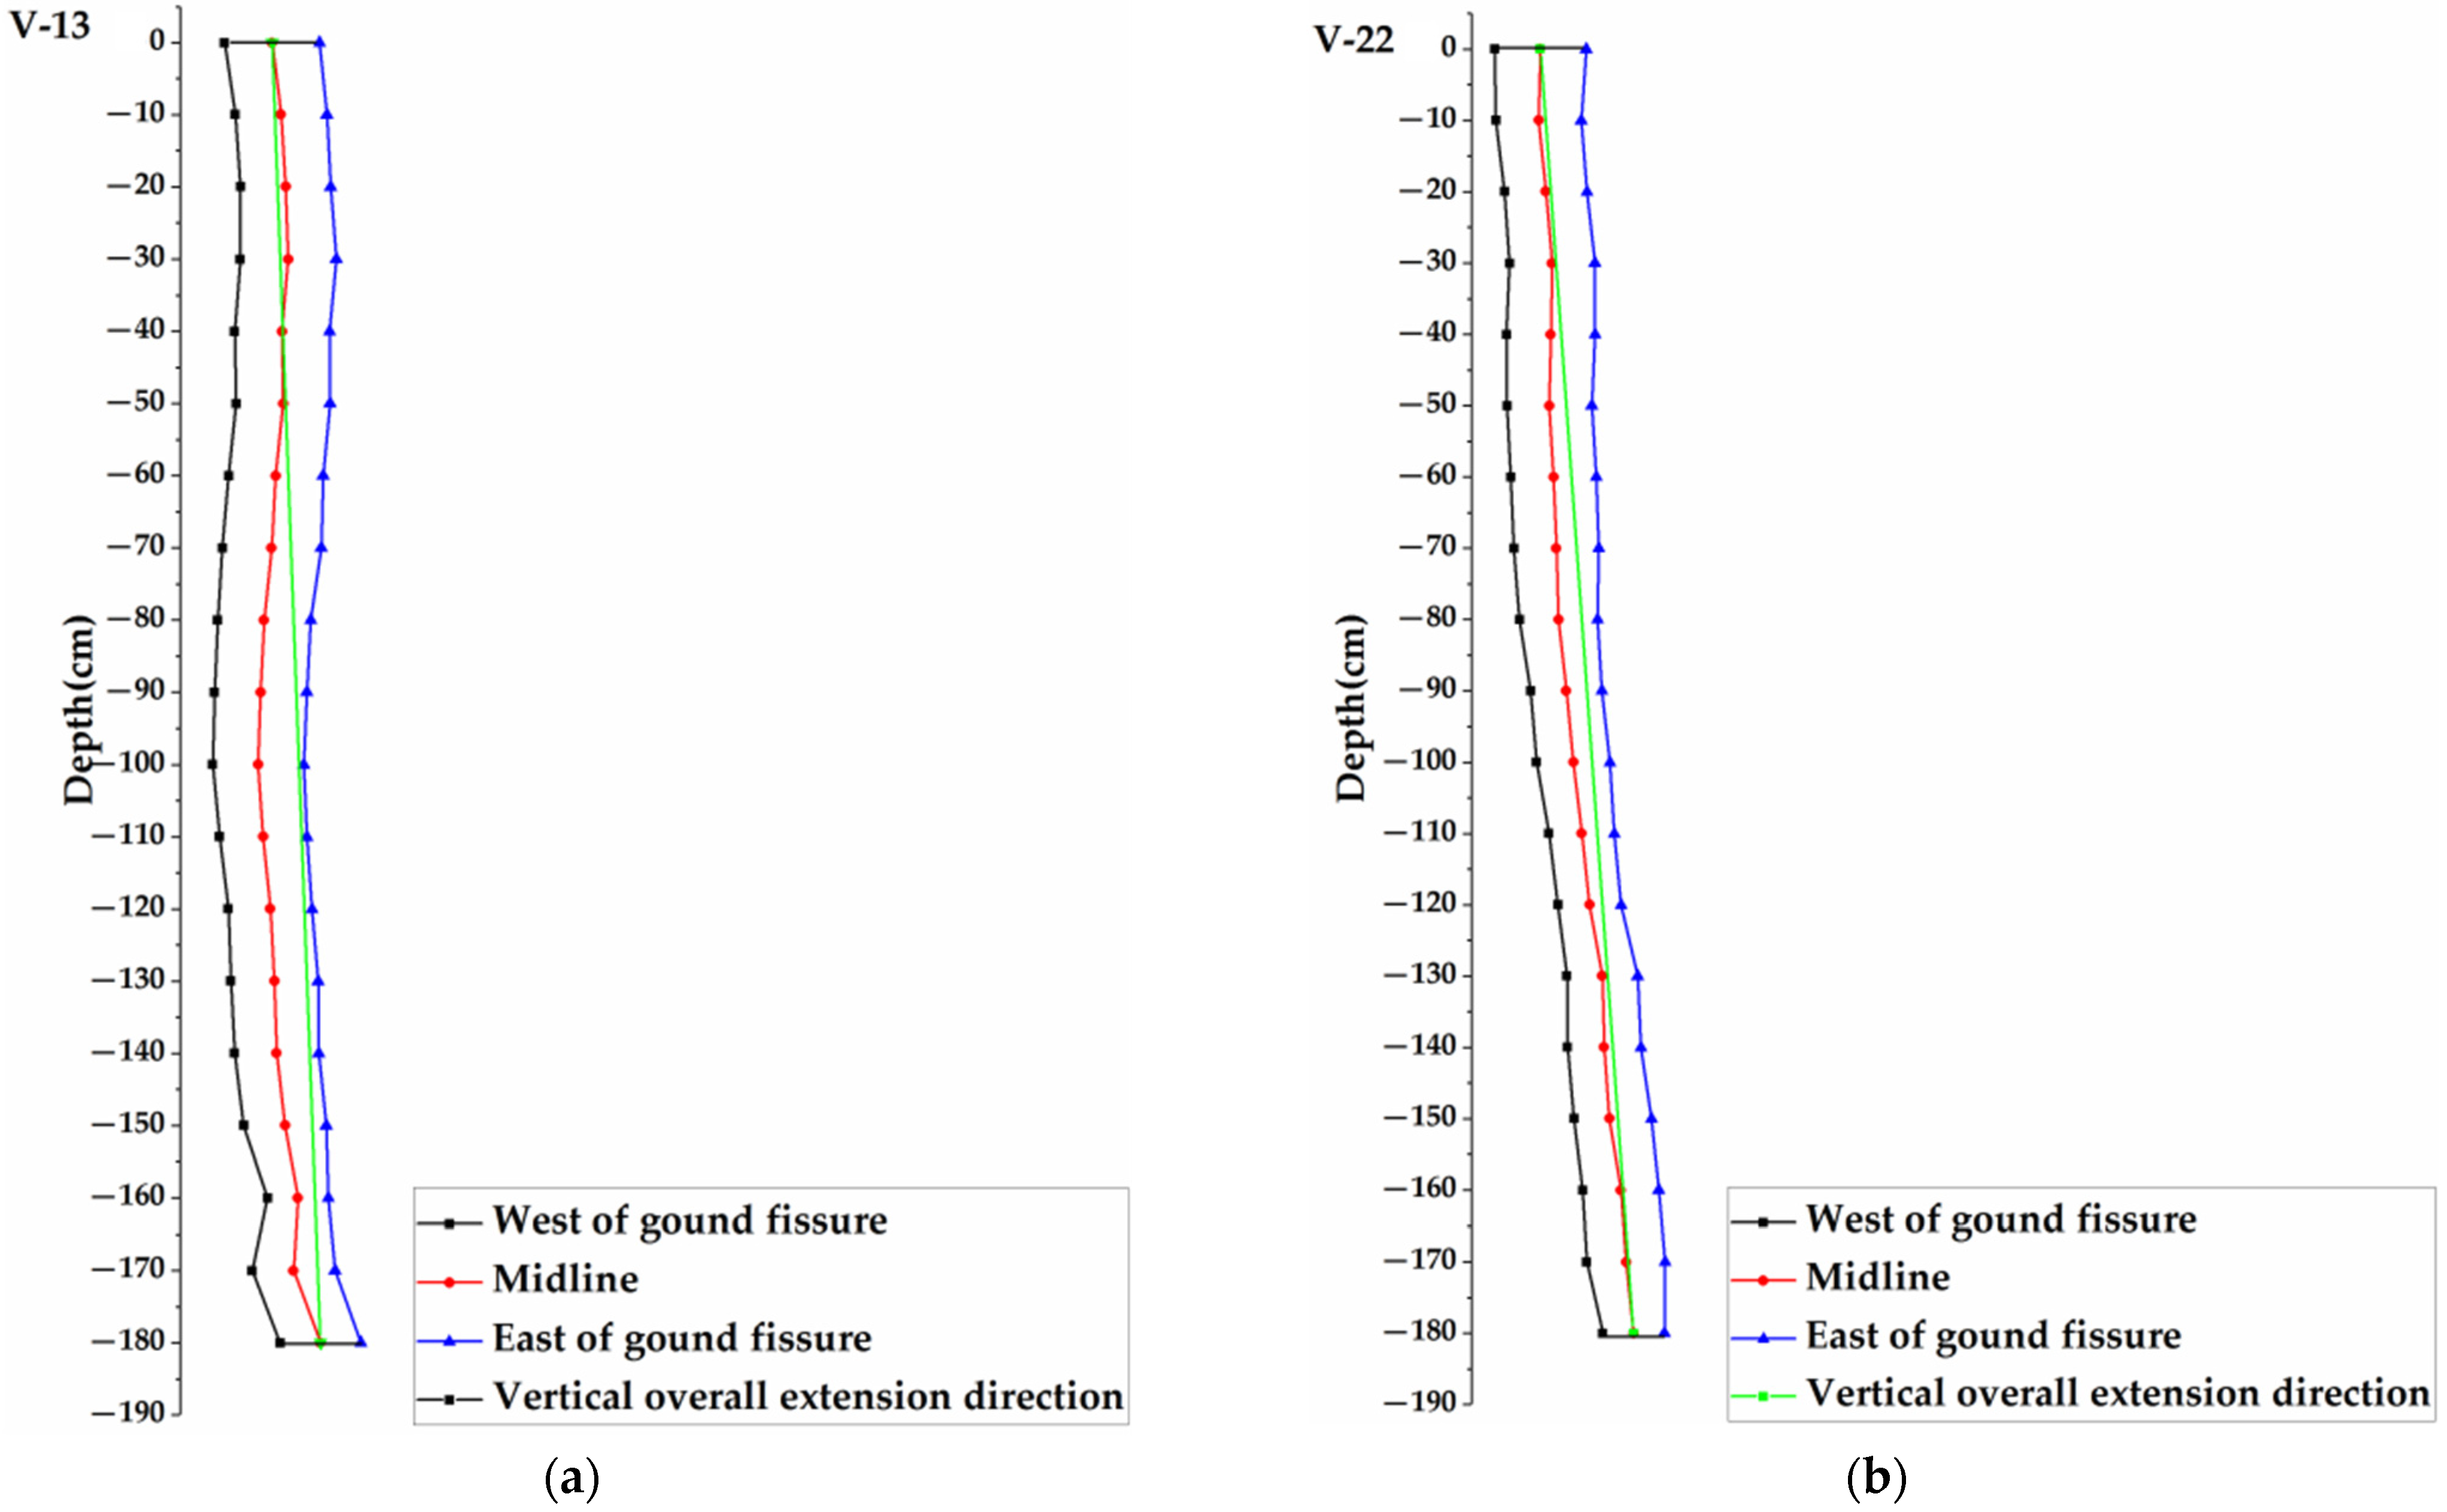
- Vertical Extension Angle of the Ground Fissure
- (1)
- Vertical extension angle of the ground fissure at each depth
- (2)
- Vertical overall extension angle of the ground fissure
- 4.
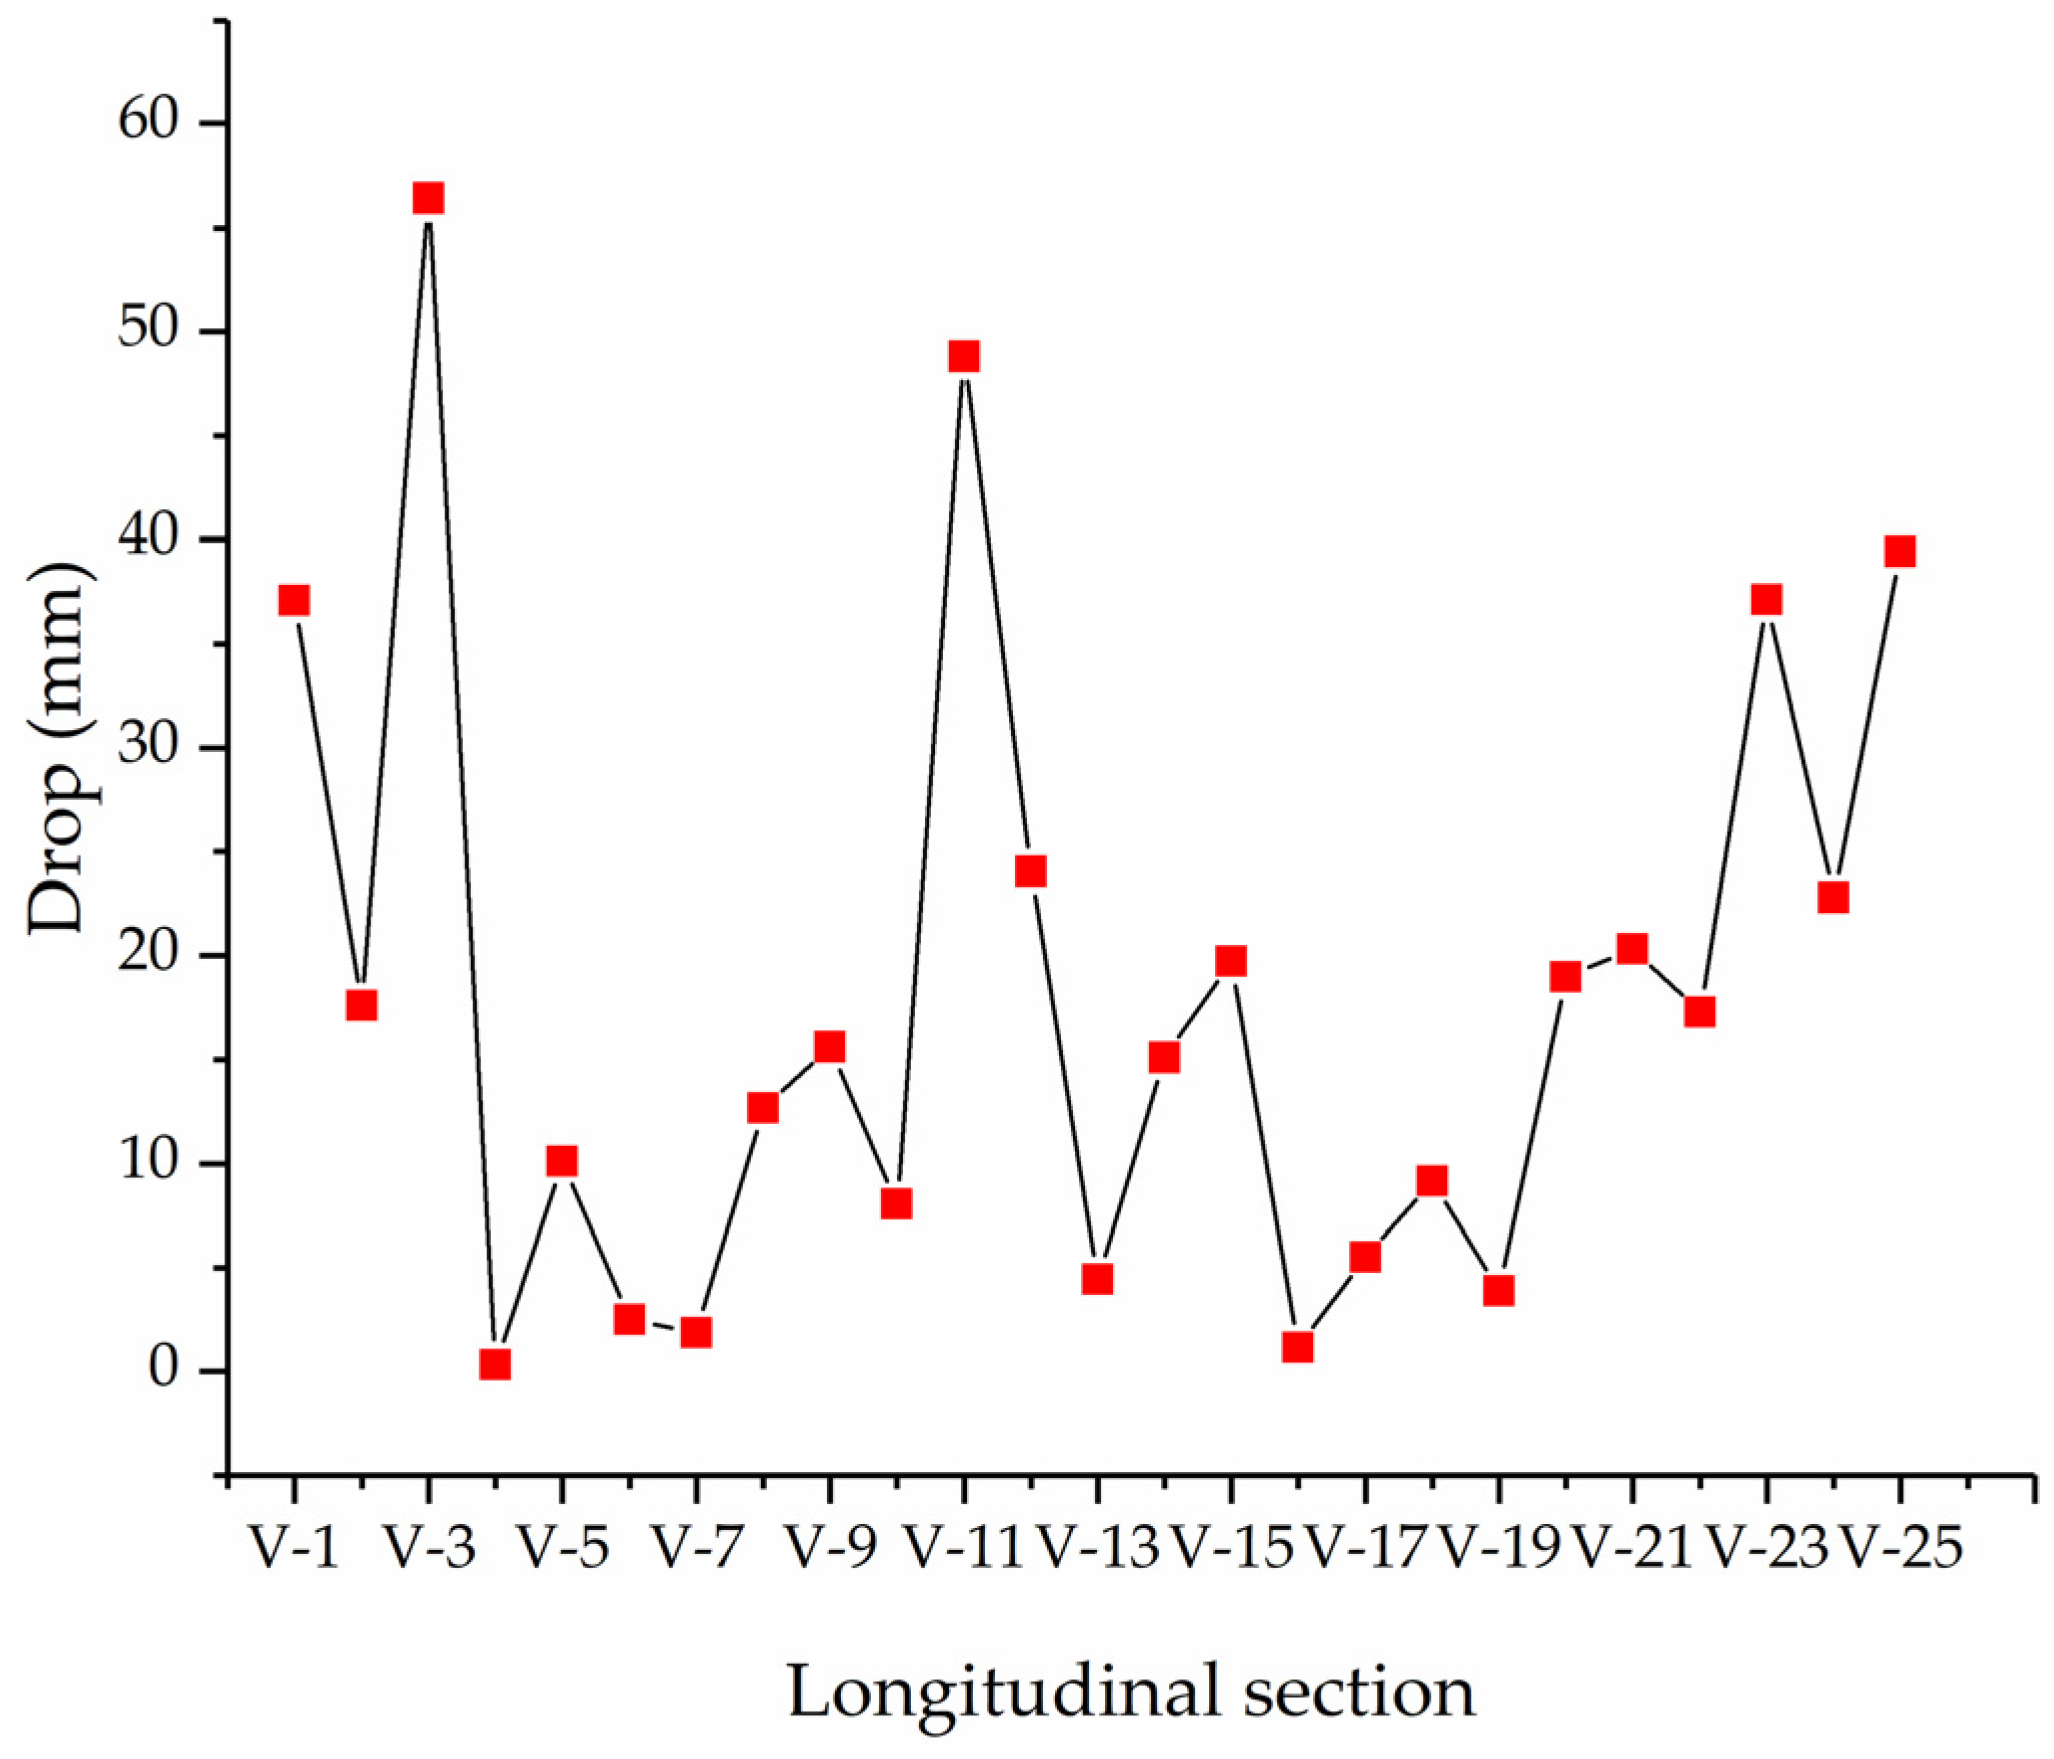
- Drop of the Ground Fissure
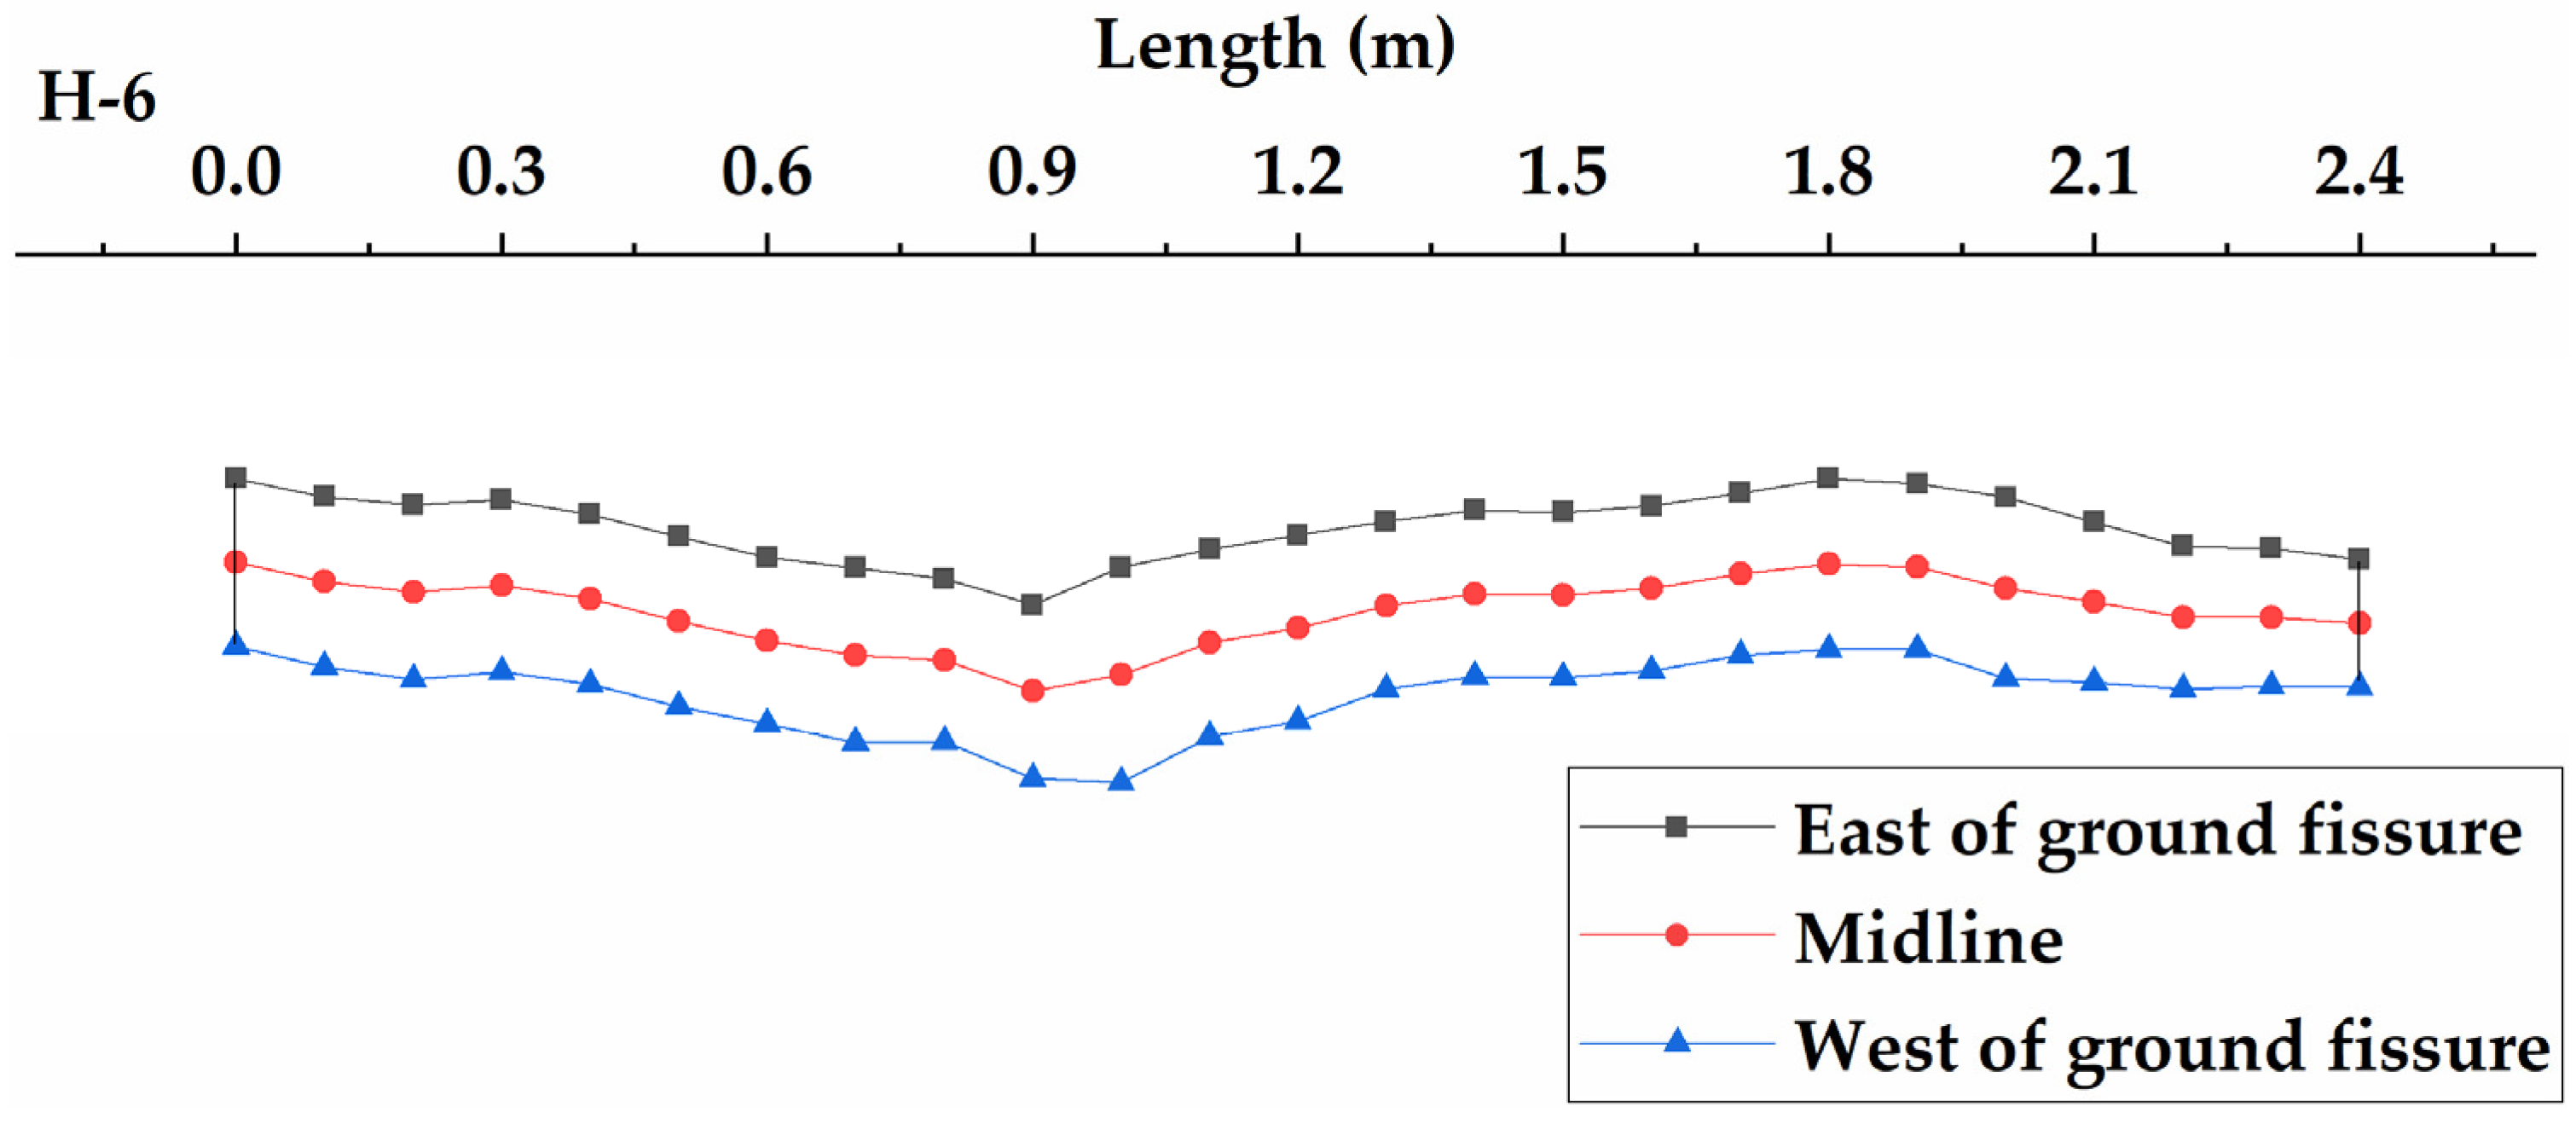
3.2.2. Transverse Section of the Ground Fissure Analysis
- 1.
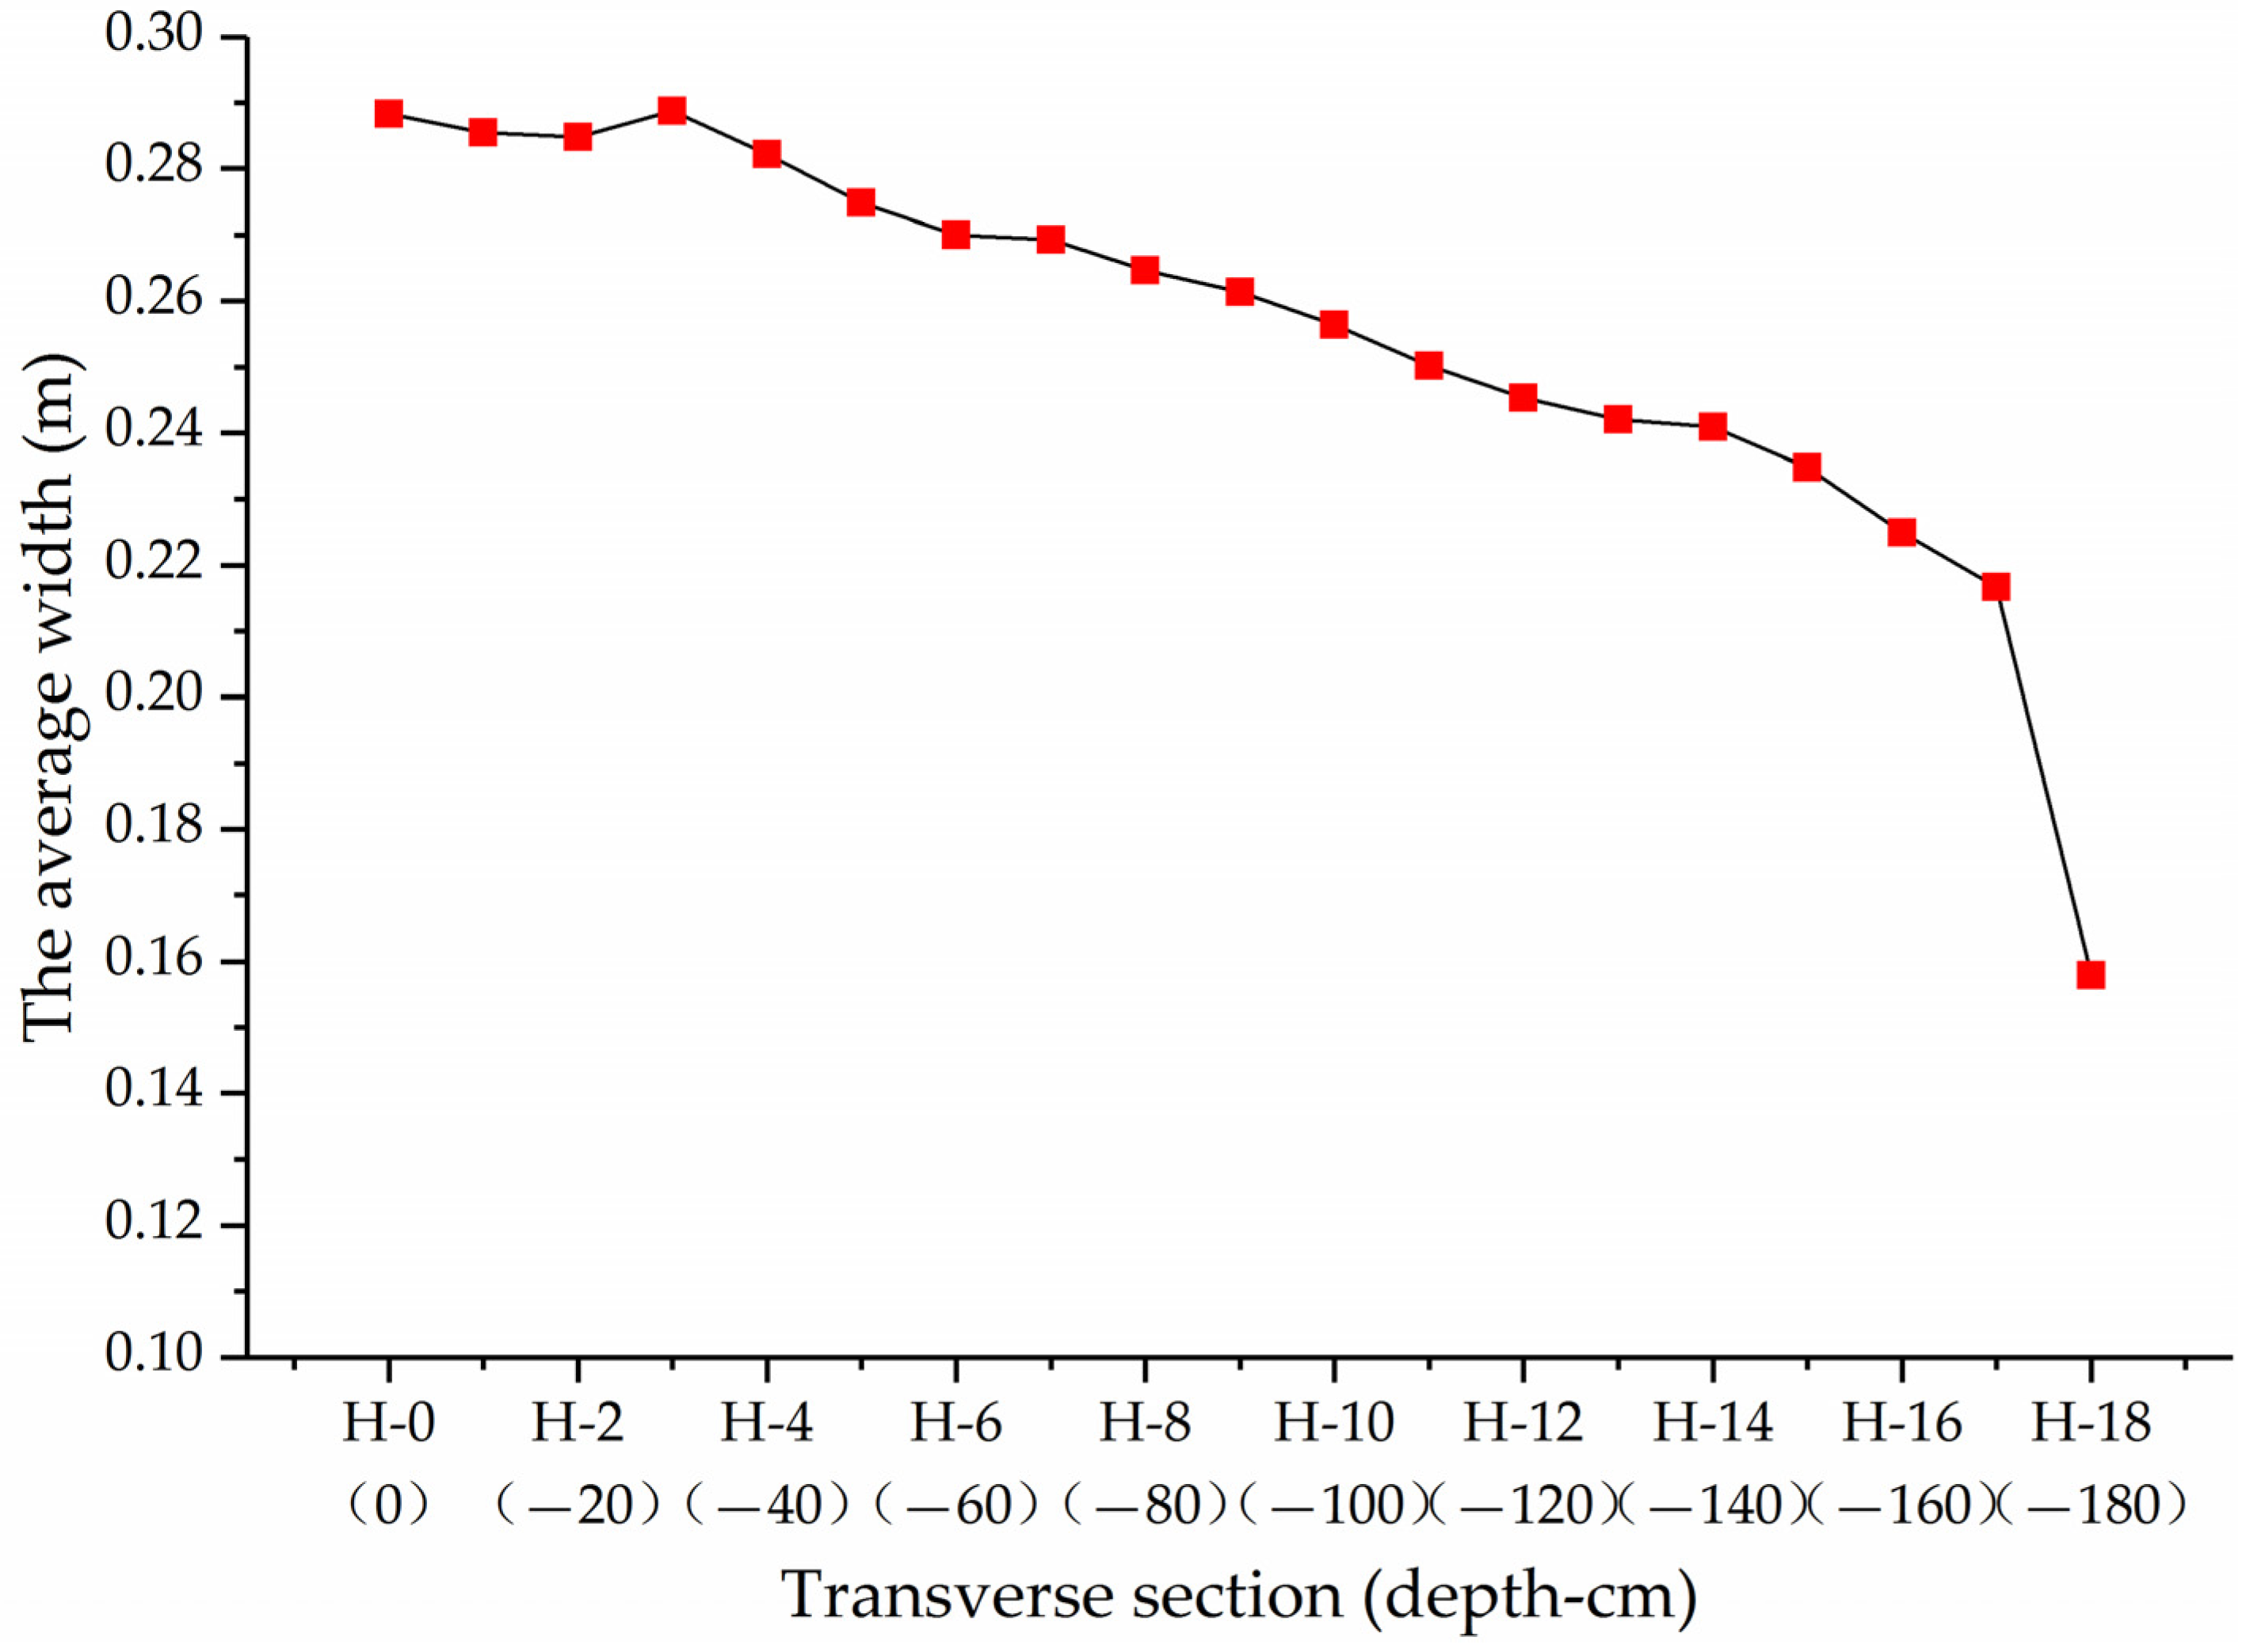
- Width of the Ground Fissure
- 2.
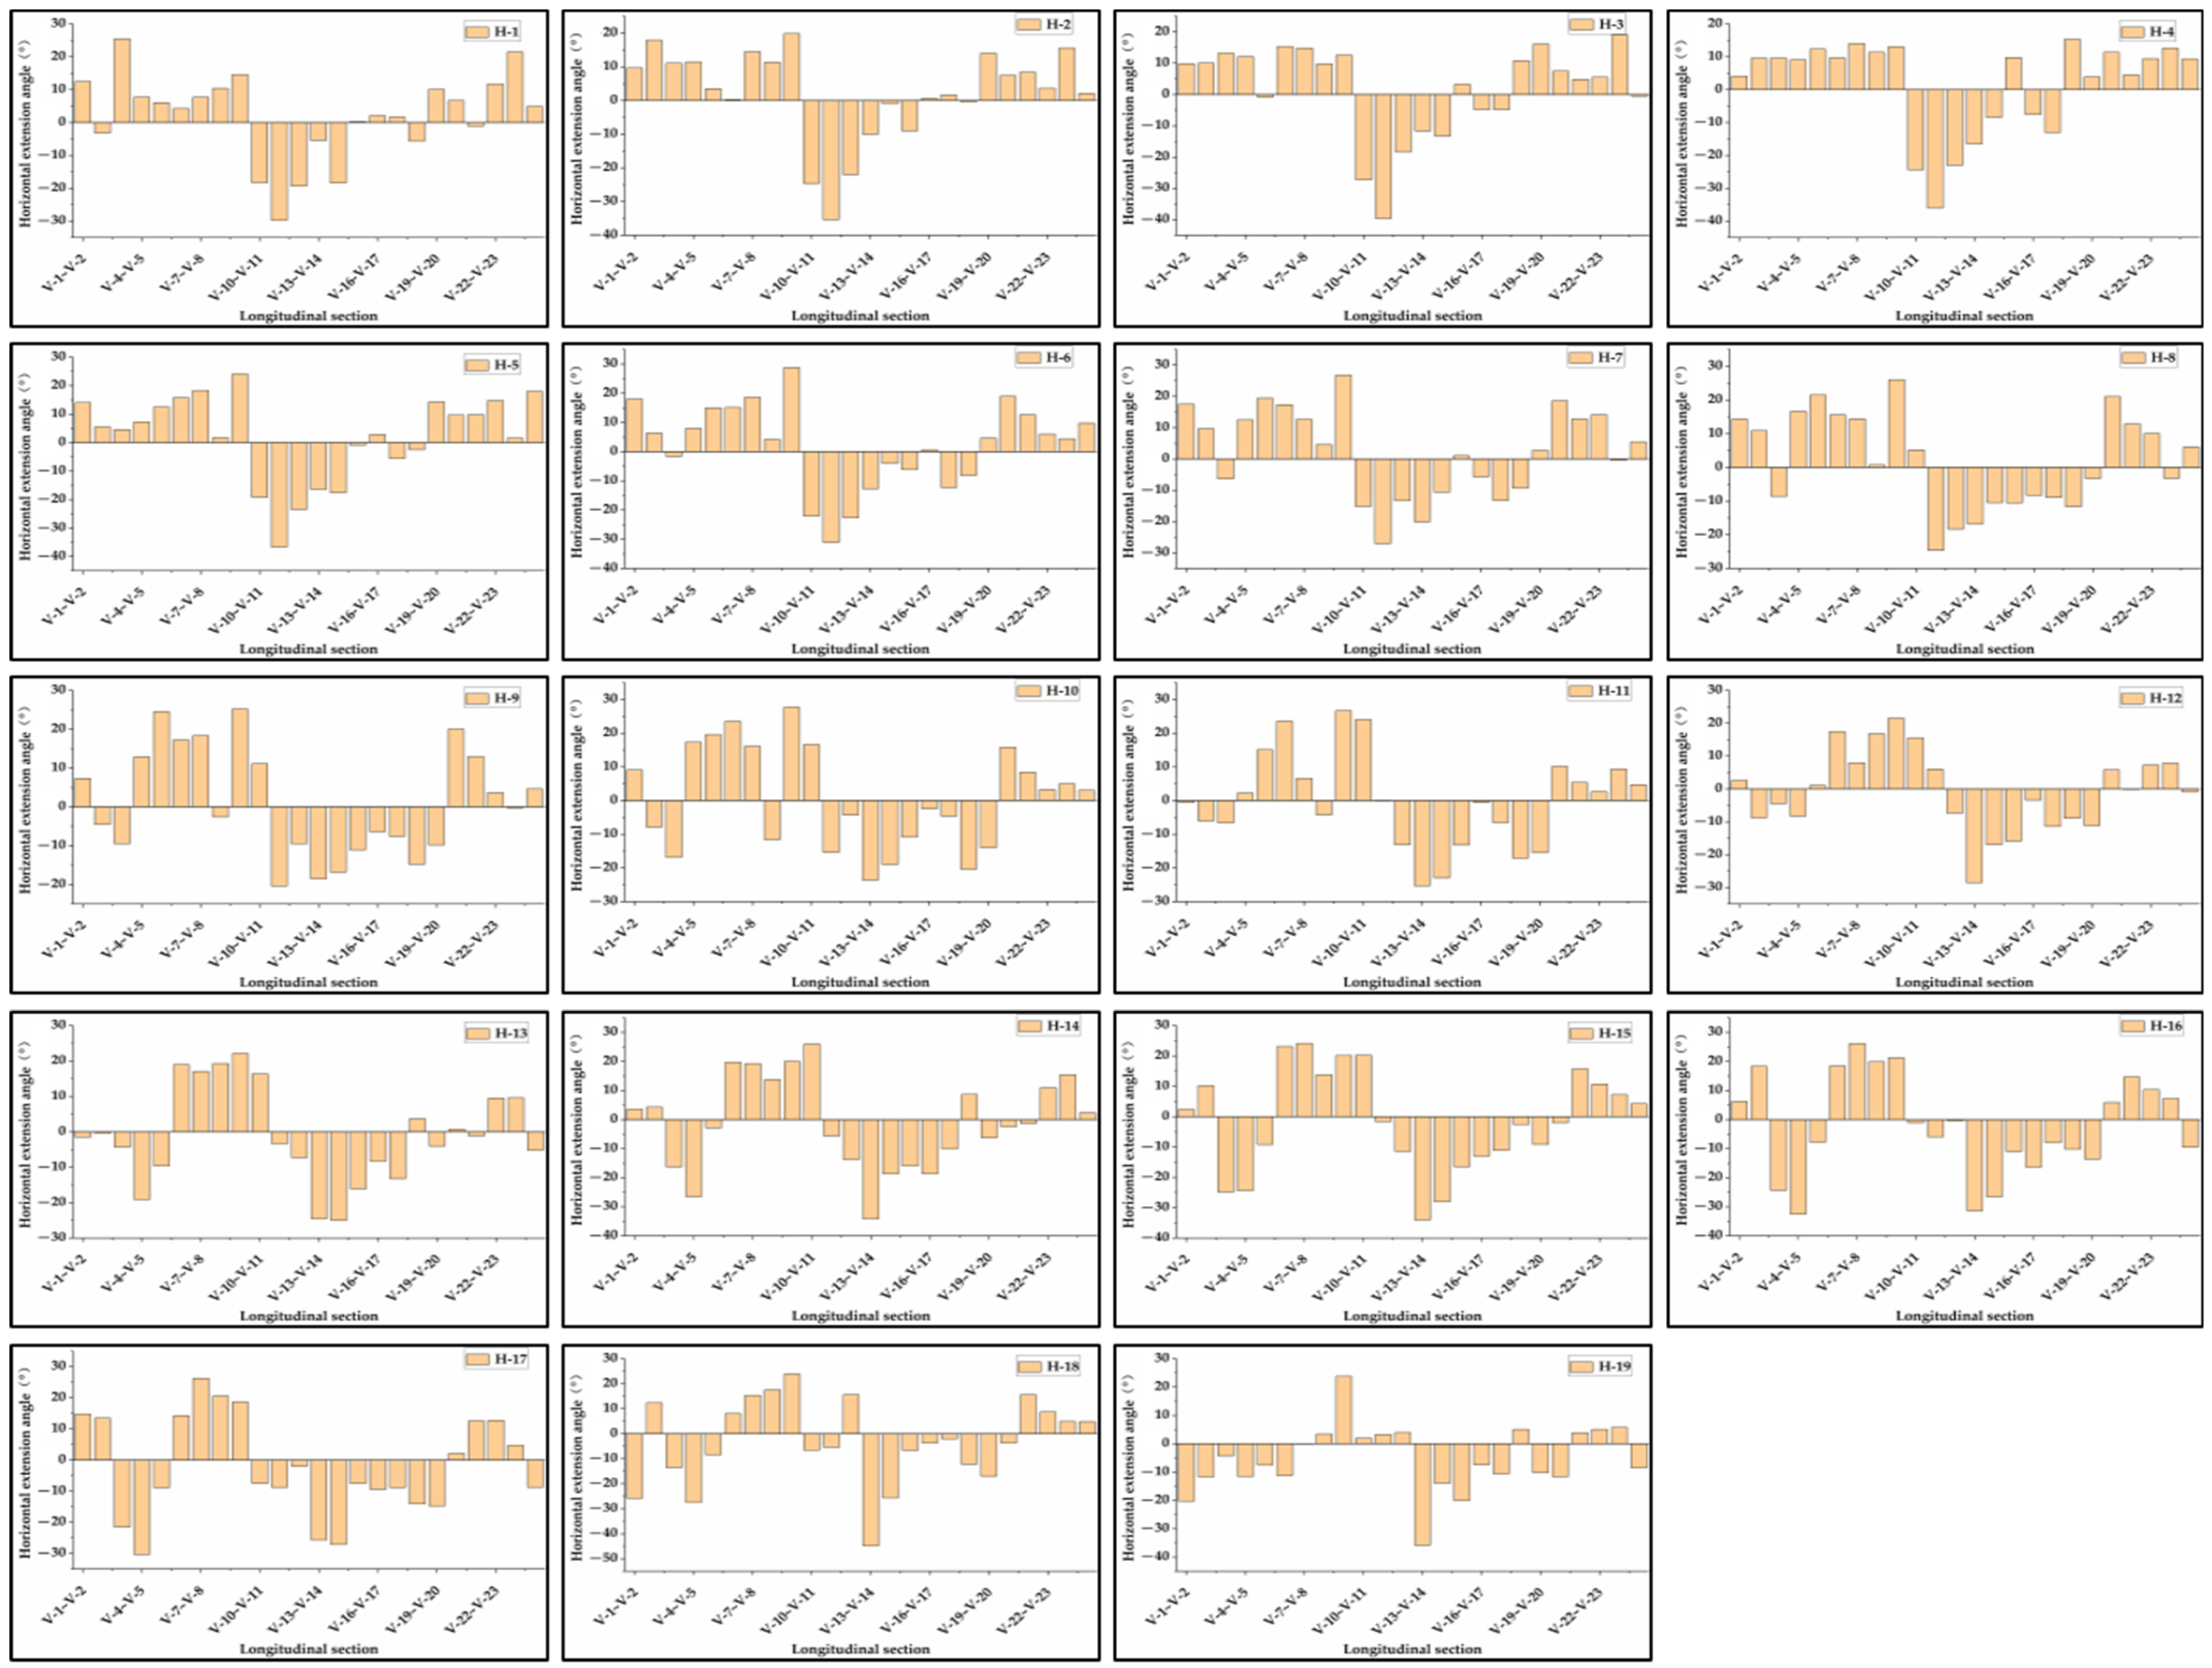
- Horizontal Extension Angle of the Ground Fissure
4. Discussion
4.1. Complexity of Underground Morphology of Ground Fissures
- Once the ground fissure was excavated, and after the cleaning of the soil surface, we recognized a mixture of the soil surface with some fine-grained pebbles. As the pebbles are harder than the soil, they hinder the development of the ground fissure, thereby destroying the overall trend of width changes and slightly reducing the width increase at specific depth positions.
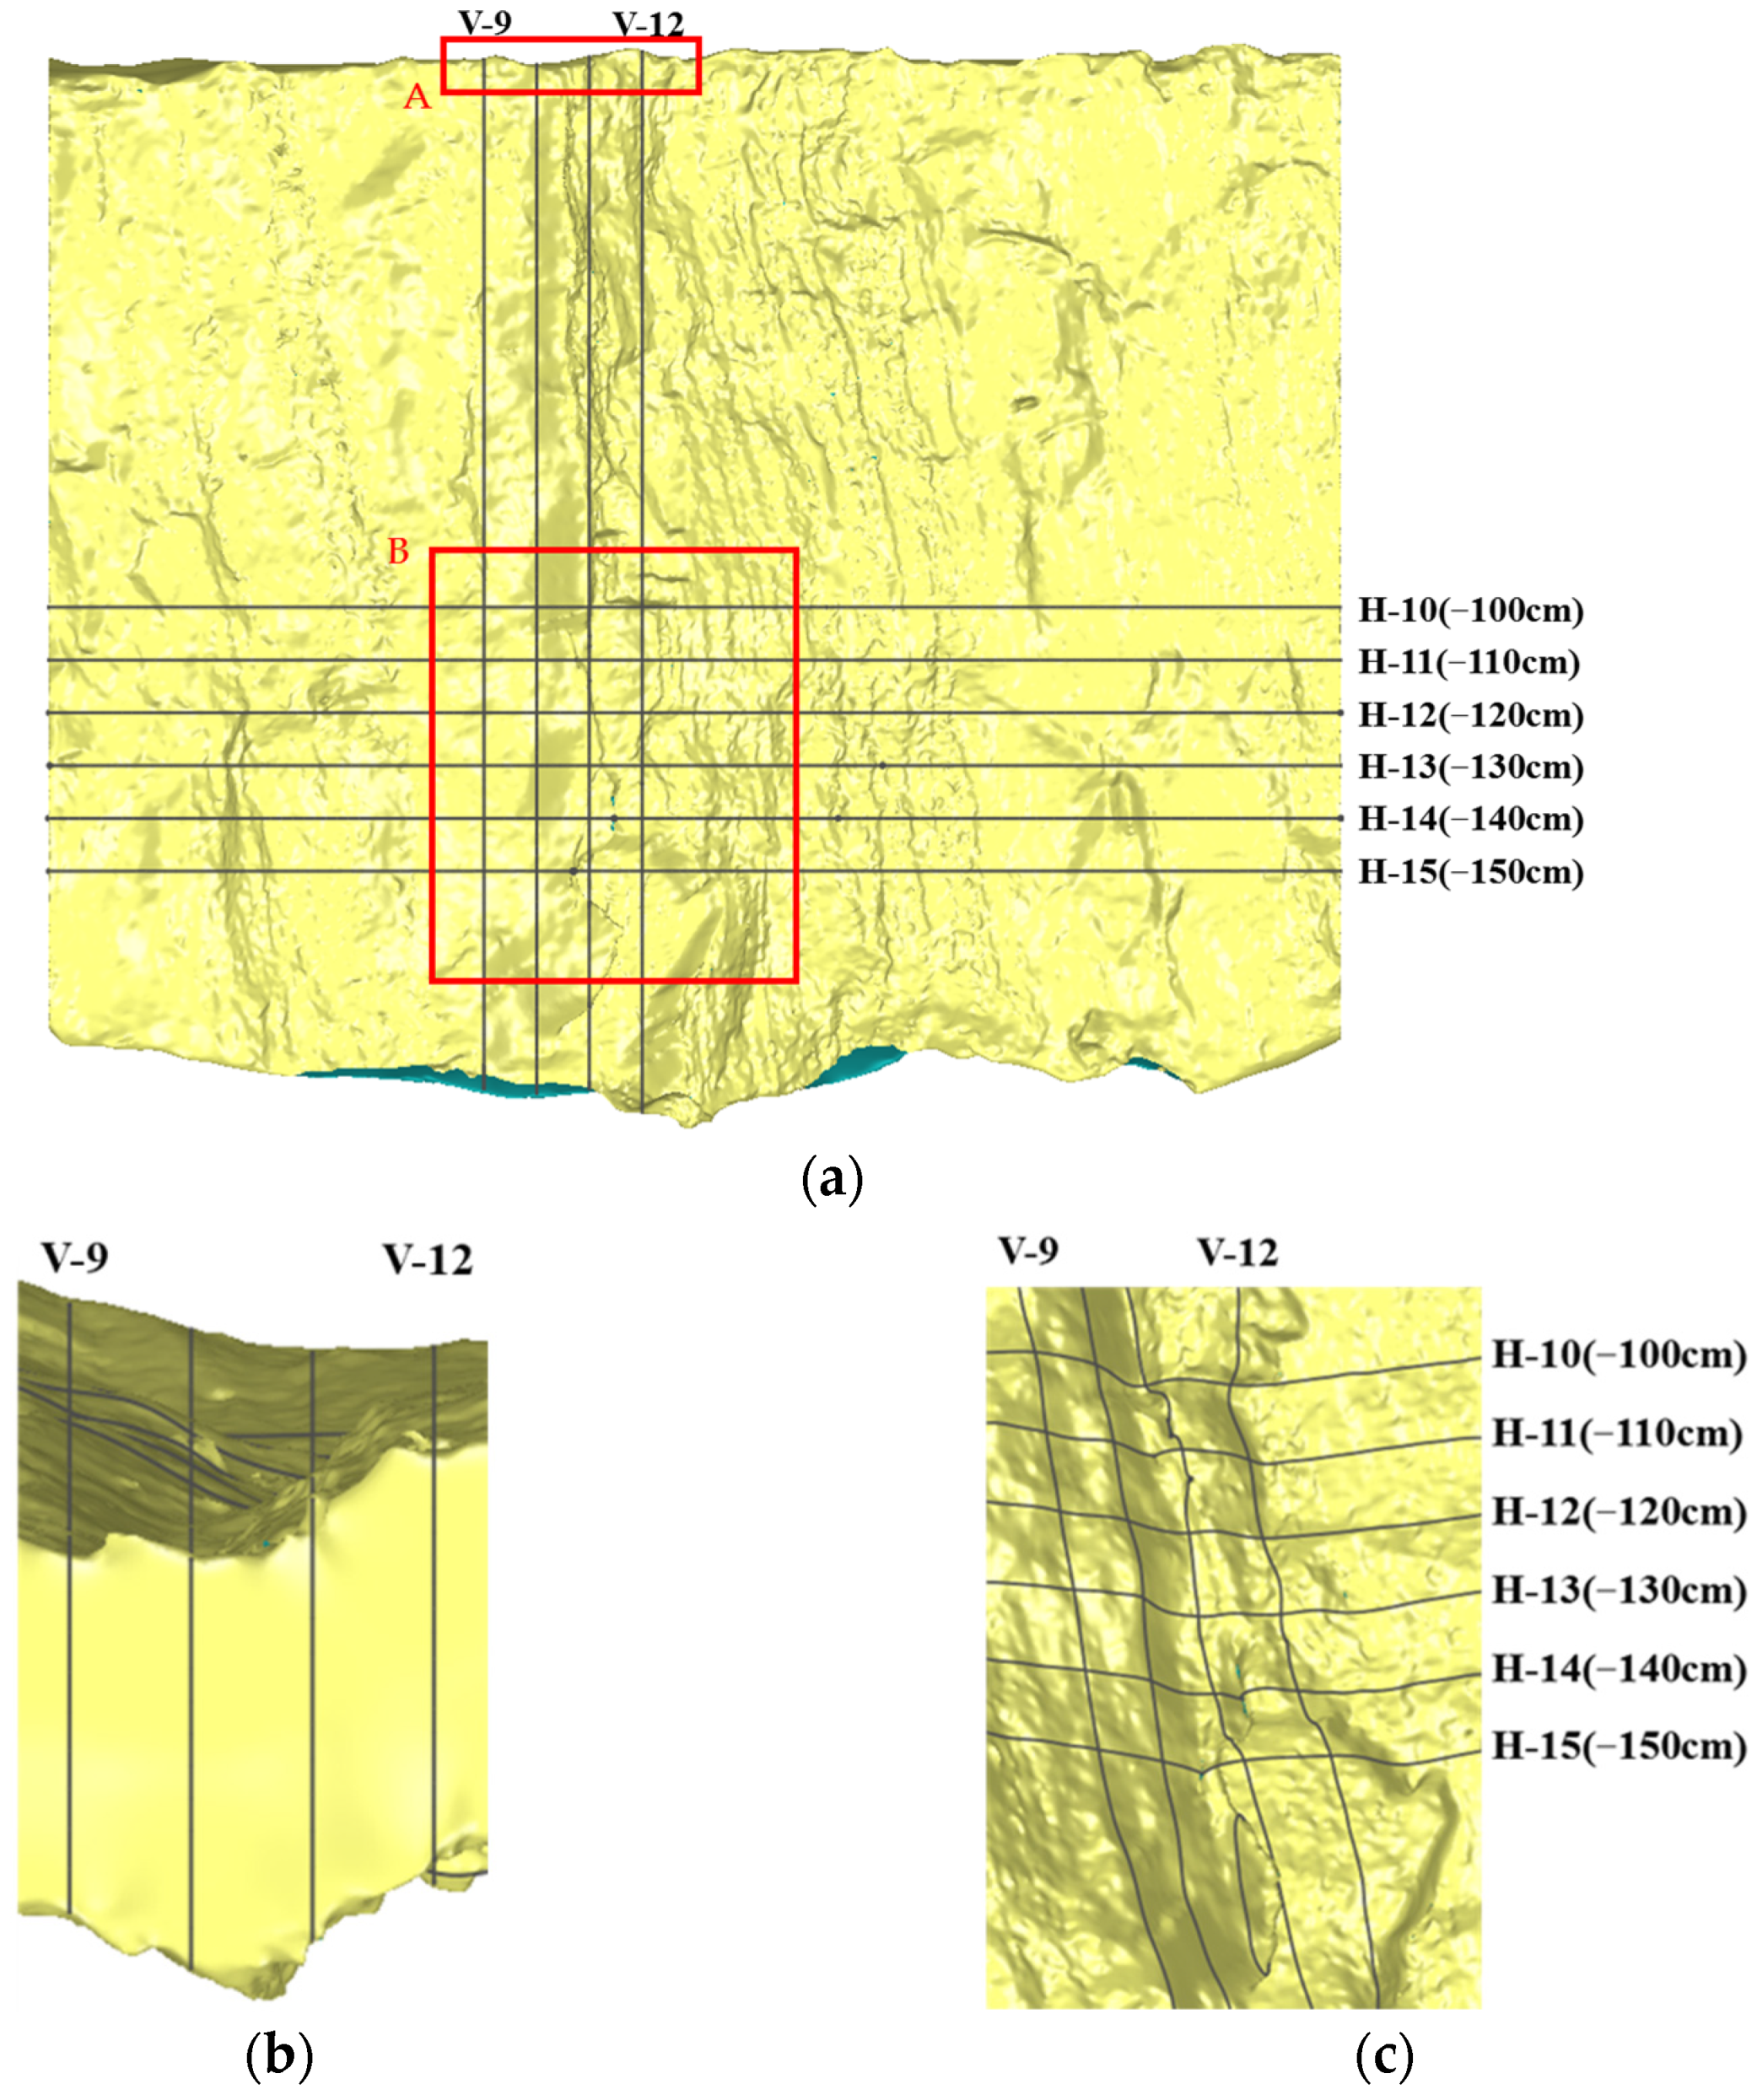
- At a depth of 100~120 cm, a new crack developed perpendicular to the direction of the previous ground fissure at V-9–V-12, documenting a crack bifurcation phenomenon. The location and details of the crack bifurcation are shown in Figure 20. The crack bifurcation explains the abnormal value of the ground fissure width at these positions.
4.2. The Relationship between Ground Fissures and Coal Mining Subsidence
4.3. The Particularity of Ground Fissures in Collapsible Loess Areas
4.4. Deficiency of Three-Dimensional Laser Scanning Technology in Detecting Ground Fissures
5. Conclusions
- The ground fissure is cut along the horizontal and vertical directions at a distance of 10 cm to obtain 25 longitudinal sections and 19 transverse sections. The width is distributed between 0.061~0.358 m, and about 80% are distributed between 0.20~0.30 m. The vertical extension angle ranges between −18.3°~15.5° at different depth levels. The vertical overall extension angle is in the range of −11.1°~−2.6°. The drop is distributed between 0.3~56.4 mm, and the range of variation is relatively large. The horizontal extension angle varies in the range of −44.88°~28.77°.
- The underground morphology of ground fissures is complex, and the width suddenly increases or decreases in specific depth layers due to the influence of the soil composition and crack bifurcation.
- The overlying collapsible loess has a uniform lithology and loose structure, and this special soil texture causes unique ground fissures: The vertical extension direction is not regular at all levels but is biased towards the inside of the working face. With increasing depth, the horizontal extension direction becomes more complex, and the extension direction is not strictly parallel to the working face boundary. The bottom will be filled with loosely flowing soil, causing the bottom width to drop to 0, which, in turn, affects the morphological characteristics.
Author Contributions
Funding
Institutional Review Board Statement
Informed Consent Statement
Data Availability Statement
Acknowledgments
Conflicts of Interest
References
- Wu, Q.; Tu, K.; Ceng, Y.; Liu, S. Discussion on the main problems and countermeasures for building an upgrade version of main energy. J. China Coal Soc. 2019, 44, 1625–1636. [Google Scholar]
- BP Statistical Review of World Energy 2021. Available online: https://www.bp.com/en/global/corporate/energy-economics/statistical-review-of-world-energy.html (accessed on 28 September 2021).
- Xu, Z. A review on combined open—Underground mining technology in pingshuo mining area. Coal Eng. 2015, 47, 11–14. [Google Scholar]
- Guo, J.; Liu, X.; Wang, X.; Hu, X. Mechanism of mining-induced surface destruction in metal mines and its control technology. Metal. Mine 2014, 43, 6–11. [Google Scholar]
- Wang, H. Distribution characteristics of surface cracks in gob collapse in Xiqu mine. Min. Technol. 2006, 6, 358–359. [Google Scholar]
- Li, Y.; Lu, G.; Wang, D.; Diao, L.; Li, C.; Dong, L.; Du, X. Morphological characteristics of ground fissures at surface coal mine dump in northern grassland of China. J. China Coal Soc. 2020, 45, 3781–3792. [Google Scholar]
- Cheng, W.; Bian, Z.; Dong, J.; Lei, S. Soil properties in reclaimed farmland by filling subsidence basin due to underground coal mining with mineral wastes in China. T. Nonferr. Metal. Soc. 2014, 24, 2627–2635. [Google Scholar] [CrossRef]
- Gilland, K.E.; McCarthy, B.C. Microtopography influences early successional plant communities on experimental coal surface mine land reclamation. Restor. Ecol. 2014, 22, 232–239. [Google Scholar] [CrossRef]
- Malinowska, A.A. The impact of deep underground coal mining on Earth fissure occurrence. Acta Geodyn. Geomater. 2016, 321–330. [Google Scholar] [CrossRef] [Green Version]
- Mohseni, N.; Sepehr, A.; Hosseinzadeh, S.R.; Golzarian, M.R.; Shabani, F. Variations in spatial patterns of soil–vegetation properties over subsidence-related ground fissures at an arid ecotone in northeastern Iran. Environ. Earth Sci. 2017, 76, 234. [Google Scholar] [CrossRef]
- Pan, C.; Fan, Y.; Wang, H.; Wang, J.; Cui, S. Study on formation mechanism of ground fissures and disaster prevention and reduction measures for buildings—A case study of Qingxu area in Shanxi Province. IOP Conf. Ser. Earth Environ. Sci. 2021, 804, 22015. [Google Scholar] [CrossRef]
- Wright, I.A.; McCarthy, B.; Belmer, N.; Price, P. Subsidence from an underground coal mine and mine wastewater discharge causing water pollution and degradation of aquatic ecosystems. Water Air Soil Pollut. 2015, 226, 3–14. [Google Scholar] [CrossRef]
- Li, L.; Wu, K.; Chen, R.; Zhang, S. Information extraction of surface crack position in mining subsidence area based on wavelet transform. Sci. Surv. Mapp. 2010, 35, 165–166. [Google Scholar]
- Ścigała, R.; Szafulera, K. Linear discontinuous deformations created on the surface as an effect of underground mining and local geological conditions-case study. Bull. Eng. Geol. Environ. 2020, 79, 2059–2068. [Google Scholar] [CrossRef]
- Kalogirou, E.E.; Tsapanos, T.M.; Karakostas, V.G.; Marinos, V.P.; Chatzipetros, A. Ground fissures in the area of Mavropigi Village (N. Greece): Seismotectonics or mining activity? Acta Geophys. 2014, 62, 1387–1412. [Google Scholar] [CrossRef]
- Bi, Y.; Zhang, J.; Song, Z.; Wang, Z.; Qiu, L.; Hu, J.; Gong, Y. Arbuscular mycorrhizal fungi alleviate root damage stress induced by simulated coal mining subsidence ground fissures. Sci. Total Environ. 2019, 652, 398–405. [Google Scholar] [CrossRef] [PubMed]
- Zhang, P. Study on the Impact of Coal Mining Subsidence on Soil Quality in the overlapped Areas of Cropland and Coal Resources. Ph.D. Thesis, China University of Mining and Technology-Beijing, Beijing, China, 2016. [Google Scholar]
- Zhang, Y.; Bi, Y.; Chen, S.; Wang, J.; Han, B.; Feng, Y. Effects of subsidence fracture caused by coal-mining on soil moisture content in semi-arid windy desert area. Environ. Sci. Technol. 2015, 38, 11–14. [Google Scholar]
- Huang, S.; Yu, X.; Zhao, X.; Fan, K. Study on mining damage law and control method of collapsible loess. Min. Saf. Environ. Prot. 2006, 33, 11–12. [Google Scholar]
- Peng, J.; Qiao, J.; Leng, Y.; Wang, F.; Xue, S. Distribution and mechanism of the ground fissures in Wei River Basin, the origin of the Silk Road. Environ. Earth Sci. 2016, 75, 718. [Google Scholar] [CrossRef]
- Glenn, N.F.; Streutker, D.R.; Chadwick, D.J.; Thackray, G.D.; Dorsch, S.J. Analysis of LiDAR-derived topographic information for characterizing and differentiating landslide morphology and activity. Geomorphology 2006, 73, 131–148. [Google Scholar] [CrossRef]
- Kasai, M.; Ikeda, M.; Asahina, T.; Fujisawa, K. LiDAR-derived DEM evaluation of deep-seated landslides in a steep and rocky region of Japan. Geomorphology 2009, 113, 57–69. [Google Scholar] [CrossRef]
- Zhang, F.; Hu, Z.; Fu, Y.; Yang, K.; Wu, Q.; Feng, Z. A new identification method for surface cracks from UAV images based on machine learning in coal mining areas. Remote Sens. 2020, 12, 1571. [Google Scholar] [CrossRef]
- Shruthi, R.B.V.; Kerle, N.; Jetten, V. Object-Based gully feature extraction using high spatial resolution imagery. Geomorphology 2011, 134, 260–268. [Google Scholar] [CrossRef]
- Zhao, Y.; Xu, D.; Sun, B.; Jiang, Y.; Zhang, C.; He, X. Investigation on ground fissure identification using UAV infrared remote sensing and edge detection technology. J. China Coal Soc. 2021, 46, 624–637. [Google Scholar]
- Ye, L. Aerial Image Visual Detection and Recognition Method of Ground Crack in Goaf of Coal Mine. Master’s Thesis, China University of Mining and Technology, Xuzhou, China, 2020. [Google Scholar]
- Jia, H.; Wei, B.; Liu, G.; Zhang, R.; Yu, B.; Wu, S. A semi-automatic method for extracting small ground fissures from loess areas using unmanned aerial vehicle images. Remote Sens. 2021, 13, 1784. [Google Scholar] [CrossRef]
- Nex, F.; Remondino, F. UAV for 3D mapping applications: A review. Appl. Geomat. 2014, 6, 1–15. [Google Scholar] [CrossRef]
- Li, Y.; Wang, D.; Lu, G.; Diao, L.; Dong, L.; Du, X. A review of soil mass cracks characteristics and their eco-environmental effects in coal mining area. Chin. J. Ecol. 2018, 37, 3769–3779. [Google Scholar]
- Zhang, J.; Bi, Y.; Peng, S. Study on detection methods for three—Dimensional morphology of mining—Induced ground fissures and accuracy evaluation. Coal Sci. Technol. 2020, 48, 236–242. [Google Scholar]
- Jia, X.; Yao, H. Detection and control of ground fissure in shallow coal mining based on GPR technology. Coal Sci. Technol. 2017, 45, 82–86. [Google Scholar]
- Liu, F. Experimental Study of the Crack-depth Detection Based on the Theory of Elastic Waves. Master’s Thesis, Shantou University, Shantou, China, 2009. [Google Scholar]
- Li, W.; Liu, G.; Yao, T. Research Progress on crack characteristics of expansive soil. Adv. Sci. Technol. Water Resour. 2012, 32, 78–82. [Google Scholar]
- Dai, H.; Luo, J.; Guo, J.; Yan, Y.; Zhang, W.; Zhu, Y. In Site surveying and study on development laws of surface cracks by high—Intensity mining in Shangwan Mine. Coal Sci. Technol. 2020, 48, 124–129. [Google Scholar]
- Hou, E.; Xie, X.; Wang, S.; Cong, T.; Feng, D.; Chen, Z. Development law of ground cracks induced by fully-mechanized mining of medium-buried coal seams. J. Min. Saf. Eng. 2021, 38, 1178–1188. [Google Scholar]
- Yesiller, N.; Miller, C.J.; Inci, G.; Yaldo, K. Desiccation and cracking behavior of three compacted landfill liner soils. Eng. Geol. 2000, 57, 105–121. [Google Scholar] [CrossRef] [Green Version]
- Gaur, V.P.; Kar, S.K.; Srivastava, M. Development of ground fissures: A case study from southern parts of Uttar Pradesh, India. J. Geol. Soc. India 2015, 86, 671–678. [Google Scholar] [CrossRef]
- Picornell, M.; Lytton, R.L. Field measurement of shrinkage crack depth in expansive soils. Transport. Res. Rec. 1989, 1219, 121–130. [Google Scholar]
- Shao, G.; Du, T. Detection of shallow underground fissures by time-frequency analysis of Rayleigh waves based on wavelet transform. Appl. Geophys. 2020, 17, 233–242. [Google Scholar] [CrossRef]
- Hu, Z.; Wang, X.; He, A. Distribution characteristic and development rules of ground fissures due to coal mining in windy and sandy region. J. China Coal Soc. 2014, 39, 11–18. [Google Scholar]
- He, Y.; Hu, Z.; Wu, K.; Wang, R. A novel method for density analysis of repaired point cloud with holes based on image data. Remote Sens. 2021, 13, 3417. [Google Scholar] [CrossRef]
- Gong, Z. Research on Point Cloud Processing Method of 3D Laser Scann Technology. Ph.D. Thesis, China University of Geosciences, Wuhan, China, 2017. [Google Scholar]
- He, Y. Technical Research on Mending Three-Dimensional Point Cloud Holes with Images. Master’s Thesis, China University of Mining and Technology, Xuzhou, China, 2018. [Google Scholar]
- He, Y.; Cai, J.; Wang, J.; Yu, Z.; Guan, Z.; Zhou, D. Modeling and repairing of ancient city wall by three-dimensional laser scanning technology. Laser J. 2018, 39, 85–89. [Google Scholar]
- Zhou, J. Forest Parameter Extraction from Terrestrial Laser Scanning Data. Ph.D. Thesis, University of Electronic Science and Technology of China, Chengdu, China, 2019. [Google Scholar]
- Duan, Y. Three-Dimensional Reconstruction of Outdoor Scenes Based on Laser Point Clouds. Master’s Thesis, Dalian University of Technology, Dalian, China, 2021. [Google Scholar]
- Chu, H.; Xing, G.; Li, K.; Wang, G.; Duan, Q. Monitoring of dangerous rock mass in the Three Gorges Reservoir area based on the terrestrial laser scanning method. Hydrogeol. Eng. Geol. 2021, 48, 124–132. [Google Scholar]
- Wang, X. Monitoring, Evolution and Self-Healing Characteristics of Land Damage Due to High Tension Coal Mining in Windy and Sandy Area. Ph.D. Thesis, China University of Mining and Technology-Beijing, Beijing, China, 2014. [Google Scholar]
- Peng, J. Research on Registration and Reconstruction of 3D Point Cloud Scene. Master’s Thesis, Southwest University of Science and Technology, Mianyang, China, 2020. [Google Scholar]
- He, Y.; Chen, R.; Wu, K.; Duan, Z. Point cloud simplification method based on k-means clustering. Laser Optoelectron. Prog. 2019, 56, 96–99. [Google Scholar]
- Cao, J.; Huang, Q. Rregularity and control of overburden and surface fractures in shallow-contiguous seams. Coal Geol. Explor. 2021, 49, 213–220. [Google Scholar]
- Hu, Q.; Cui, X.; Yuan, D.; Deng, X. Formation mechanism of surface cracks caused by thick seam mining and hazard analysis. J. Min. Saf. Eng. 2012, 29, 864–869. [Google Scholar]
- Wang, J.; Zhao, H.; Liu, J. Study on dynamic law of surface movement above working face of shallow—Buried coal seam with thin bedrock. Min. Saf. Environ. Prot. 2016, 43, 21–25. [Google Scholar]
- Wu, K.; Zhou, M.; Hu, Z. The prediction of ground fissure depth and width by mining. J. Fuxin Min. Inst. 1997, 16, 649–652. [Google Scholar]
- Ma, X.; Bai, Z.; Shao, Y.; Zhang, S.; Wu, J.; Zhao, M. Eco-Environmental impact assessment on subsidence with coal mining in loess hilly areas—Taking kaiyuan mine of yangquan coal limited company as example. J. Shanxi Agric. Univ. 2004, 24, 47–51. [Google Scholar]
- Wu, K.; Li, L.; Ao, J.; Hao, G. Discussion on limit development depth of cracks in surface soil mass caused by mining subsidence. Coal Sci. Technol. 2010, 38, 108–111. [Google Scholar]
- Pang, Z. Research on Bearing Behavior of Composite Foundation in Collapsible Loess Area. Master’s Thesis, China University of Geosciences, Beijing, China, 2020. [Google Scholar]


| Detection Method | Principle | Advantage | Disadvantage |
|---|---|---|---|
| Steel ruler measurement method | The steel ruler is vertically inserted into the bottom of the ground fissure. The depth is obtained by reading the steel ruler [30,36]. | Suitable for shallow ground fissures. Easy to operate. | The application is limited and largely affected by the morphology of the ground fissures and the density of the sampling points. In general, the measured value is slightly lower than the real value |
| Ground penetrating radar method | Transmission of high-frequency electromagnetic waves underground using the launch antenna. The electromagnetic wave will be reflected as it passes through the contact surface of different electrical properties. The receiving antenna obtains the reflected electromagnetic wave. In combination with the morphology, amplitude, and dynamic characteristics of the reflected electromagnetic wave, it is possible to model the composition, morphology, depth, and spatial orientation of the under-ground dielectric layer [14,31,37]. | The results are two-dimensional images. | The accuracy is closely related to the performance of the antenna. The 3D morphology of the ground fissures is not resolved. |
| Ultrasonic method | As the transmitted ultrasonic waves encounter cracks during their propagation, they produce physical phenomena, such as reflection, refraction, and diffraction, which will prolong the propagation time. The depth is modeled by the change of time. Single-plane detection is applicable only in the case of one measurable surface at the location of the ground fissures. The depth is inferred from the different propagation paths of the span and the non-span ultrasonic wave in the same range [32,33,38]. | Suitable for shallow ground fissures and easy to operate. | The echo signal of spherical defects is usually weak, or the propagation time change is equivocal. |
| Plastic rod measurement method | Very robust thin elastic plastic rod (about 1 mm in diameter) with a ruler. The rod is inserted into the ground fissure until it reaches the hard surface. The length of the plastic rod is regarded as the approximate value of the development depth of the ground fissures [39]. | Suitable for shallow ground fissures and easy to operate. | Only considers the development of ground fissures along the vertical direction. Does not consider the bending degree and the crack bifurcation phenomenon. Therefore, the precision is rather poor, and the measured value is generally lower than the actual depth. Moreover, the measurement is time-consuming and laborious. |
| On-site excavation method | Conventional method to determine the depth of ground fissures by excavating soil profiles. Ground fissures are artificially grouted with white lime. After the soil profile is formed, the depth of the ground fissure is measured with a steel ruler or meter ruler. A digital camera can be used to document a ground fissure image, and the depth is obtained after processing [40]. | As it can obtain a complete ground fissure model, it is more accurate than the steel ruler measurement method. | The experimental process is time-consuming and laborious. The precision is rather poor, and the soil will be disturbed. |
| Transverse Section | Maximum (m) | Minimum (m) | Average Value (m) | Range Value (m) |
|---|---|---|---|---|
| H-0 | 0.335 | 0.216 | 0.288 | 0.119 |
| H-1 | 0.335 | 0.222 | 0.285 | 0.113 |
| H-2 | 0.340 | 0.236 | 0.285 | 0.104 |
| H-3 | 0.349 | 0.249 | 0.289 | 0.100 |
| H-4 | 0.358 | 0.220 | 0.282 | 0.138 |
| H-5 | 0.334 | 0.221 | 0.275 | 0.113 |
| H-6 | 0.340 | 0.206 | 0.270 | 0.134 |
| H-7 | 0.332 | 0.211 | 0.269 | 0.121 |
| H-8 | 0.344 | 0.207 | 0.265 | 0.137 |
| H-9 | 0.340 | 0.206 | 0.261 | 0.134 |
| H-10 | 0.321 | 0.199 | 0.256 | 0.122 |
| H-11 | 0.309 | 0.181 | 0.250 | 0.128 |
| H-12 | 0.323 | 0.187 | 0.245 | 0.136 |
| H-13 | 0.336 | 0.200 | 0.242 | 0.136 |
| H-14 | 0.322 | 0.189 | 0.241 | 0.133 |
| H-15 | 0.317 | 0.168 | 0.235 | 0.149 |
| H-16 | 0.304 | 0.166 | 0.225 | 0.138 |
| H-17 | 0.261 | 0.173 | 0.217 | 0.088 |
| H-18 | 0.258 | 0.061 | 0.158 | 0.197 |
Publisher’s Note: MDPI stays neutral with regard to jurisdictional claims in published maps and institutional affiliations. |
© 2022 by the authors. Licensee MDPI, Basel, Switzerland. This article is an open access article distributed under the terms and conditions of the Creative Commons Attribution (CC BY) license (https://creativecommons.org/licenses/by/4.0/).
Share and Cite
He, Y.; Hu, Z.; Fu, Y.; Yang, K.; Wang, R.; Shi, G.; Feng, Z.; Yang, Q.; Yu, L. Underground Morphological Detection of Ground Fissures in Collapsible Loess Area Based on Three-Dimensional Laser Scanning Technology. Remote Sens. 2022, 14, 424. https://doi.org/10.3390/rs14020424
He Y, Hu Z, Fu Y, Yang K, Wang R, Shi G, Feng Z, Yang Q, Yu L. Underground Morphological Detection of Ground Fissures in Collapsible Loess Area Based on Three-Dimensional Laser Scanning Technology. Remote Sensing. 2022; 14(2):424. https://doi.org/10.3390/rs14020424
Chicago/Turabian StyleHe, Yibo, Zhenqi Hu, Yaokun Fu, Kun Yang, Rui Wang, Guomou Shi, Zhanjie Feng, Qirang Yang, and Liang Yu. 2022. "Underground Morphological Detection of Ground Fissures in Collapsible Loess Area Based on Three-Dimensional Laser Scanning Technology" Remote Sensing 14, no. 2: 424. https://doi.org/10.3390/rs14020424