Article

Shortwave Infrared Multi-Angle Polarization Imager (MAPI) Onboard Fengyun-3 Precipitation Satellite for Enhanced Cloud Characterization

1
Key Laboratory of Radiometric Calibration and Validation for Environmental Satellites, China Meteorological Administration, Beijing 100081, China
2
National Satellite Meteorological Center (National Center for Space Weather), Beijing 100081, China
3
Innovation Center for FengYun Meteorological Satellite (FYSIC), Beijing 100081, China
4
Key Laboratory of Infrared Detecting and Imaging Technology, Shanghai Institute of Technical Physics, Chinese Academy of Sciences, Shanghai 200083, China
5
State Environment Protection Key Laboratory of Satellite Remote Sensing, Aerospace Information Re-Search Institute, Chinese Academy of Sciences, Beijing 100101, China
6
State Key Laboratory of Remote Sensing Science, Institute of Remote Sensing and Digital Earth, Chinese Academy of Sciences, Beijing 100045, China
*
Author to whom correspondence should be addressed.
Remote Sens. 2022, 14(19), 4855; https://doi.org/10.3390/rs14194855
Submission received: 19 August 2022 / Revised: 24 September 2022 / Accepted: 26 September 2022 / Published: 29 September 2022

Abstract

:
Accurate measurement of the radiative properties of clouds and aerosols is of great significance to global climate change and numerical weather prediction. The multi-angle polarization imager (MAPI) onboard the Fengyun-3 precipitation satellite, planned to be launched in 2023, will provide the multi-angle, multi-shortwave infrared (SWIR) channels and multi-polarization satellite observation of clouds and aerosols. MAPI operates in a non-sun-synchronized inclined orbit and provides images with a spatial resolution of 3 km (sub-satellite) and a swath of 700 km. The observation channels of the MAPI include 1030 nm, 1370 nm, and 1640 nm polarization channels and corresponding non-polarization channels, which provide observation information from 14 angles. In-flight radiometric and polarimetric calibration strategies are introduced, aiming to achieve radiometric accuracy of 5% and polarimetric accuracy of 2%. Simulation experiments show that the MAPI has some unique advantages of characterizing clouds and aerosols. For cloud observation, the polarization phase functions of the 1030 nm and 1640 nm around the scattering angle of a cloudbow show strong sensitivity to cloud droplet radius and effective variance. In addition, the polarized observation of the 1030 nm and 1640 nm has a higher content of information for aerosol than VIS-NIR. Additionally, the unique observation geometry of non-sun-synchronous orbits can provide more radiometric and polarization information with expanded scattering angles. Thus, the multi-angle polarization measurement of the new SWIR channel onboard Fengyun-3 can optimize cloud phase state identification and cloud microphysical parameter inversion, as well as the retrieval of aerosols. The results obtained from the simulations will provide support for the design of the next generation of polarized imagers of China.

Graphical Abstract

1. Introduction

Rapid environmental and climate change caused by human activities is exposing the planet to huge potential risks [1]. The changes in cloud cover and the complexity of cloud–radiation–climate interactions bring large uncertainty in predicting global climate change. The cloud–radiation interaction is a difficult problem related to many macrophysical and microphysical parameters of clouds [2,3,4]. At the same time, aerosols can trigger cloud formation by acting as cloud condensation nuclei [5,6]. Therefore, global observations of cloud and aerosol properties as well as their radiation effects are crucial.
Multi-angle, multi-spectral polarimeters are the sensors that provide the most information needed for cloud and aerosol characterization on the global or regional scale [7,8,9,10]. The usual scanning radiometer, which observes a given Earth target only from a separate angle, makes it difficult to accurately describe the morphology of the clouds and aerosols [11,12]. The advantage of polarization observations is that the sensitivity of atmospheric particles is more than that of land surfaces. It could overcome the problem that surface signals mask atmospheric signals in intensity observations [13,14,15]. In addition, multi-angle polarization observations can determine the thermodynamic phase of clouds and further retrieve the size and shape of cloud particles, which are important cloud parameters in climate models [1].
Multi-angle Imaging SpectroRadiometer (MISR) was designed to observe the intensity of scattered sunlight in different directions, contributing to distinguishing the types of clouds and aerosols [16]. Then, the world’s first spaceborne multi-angle polarimeter POLarization and Directionality of the Earth’s Reflectances (POLDER) was developed by the French Space Centre (CNES) [17]. After that, China launched several POLDER-like instruments with similar channels, such as MAI (Multi-Angle polarization Imager), CAPI (Cloud and Aerosol Polarization Imager), and DPC (Directional Polarimetric Camera) [18,19,20]. Multi-view Multi-channel Multi-polarization Imaging (3MI) is the planned second-generation polar orbit satellite payload of the European Meteorological Satellite Applications Organization (EUMETSAT). It is designed to extend the observation channel to VIS-NIR and SWIR by using two optical heads and two detectors [21]. The overview of launched and completed polarization imagers are listed in Table 1.
SWIR has unique advantages in detecting and analyzing surface–atmospheric targets that cannot be identified using VIS-NIR alone. Due to its stronger penetration ability, SWIR can improve the detection of thick clouds and heavily polluted atmosphere, as well as the surface descriptions. There are many studies using SWIR for cloud detection [22]. Gao et al. (1993) found that due to the strong absorption of water vapor in the lower layers of the atmosphere at 1.38 um and nearby wavelengths, it instead shows strong sensitivity to high-level cirrus clouds [23]. Sun et al. (2017) developed an automatic cloud detection algorithm using the SWIR band of MODIS and the Landsat 8 OLI [24]. For evaluation of aerosols, Min et al. (2010) used the SWIR band and the visible band of MODIS to clarify the contribution of surface reflectance, thereby improving the retrieval accuracy of aerosols [25]. Hou et al. (2018) have shown that the inversion accuracy of aerosol microphysical parameters in vegetation regions can be improved by using polarized radiance data in the SWIR band [26]. Dlugach et al. (2021) found the possibility of a 1.378 µm band to obtain microphysical characteristics of stratospheric aerosols via a space-based multi-angle imager [27].
The channels of the existing POLDER-like instruments were set mainly in VIS-NIR, until both VIS-NIR and SWIR were proposed by the 3MI mission. A SWIR multi-angle polarization imager (MAPI) onboard the Fengyun-3 precipitation measurement satellite of the China Meteorological Administration is planned to launch in 2023. This study investigates the advantages of SWIR multi-angle polarization measurements for cloud and aerosol inversion through simulation experiments. Section 2 introduces the observational characteristics and data product of the MAPI. The results of simulation experiments and the application potential are shown in Section 3. The study is concluded and discussed in Section 4.

2. MAPI Onboard FY-3 Precipitation Measurement Satellite

2.1. FY-3 Precipitation Measurement Satellite Program

The Fengyun-3 (FY-3) precipitation measurement satellite is mainly used for heavy precipitation monitoring in disastrous weather systems, providing support for improving the accuracy of precipitation meteorological forecasts. The satellite is in a non-sun-synchronous inclined orbit with an inclination of 50° ± 1° and an orbital altitude of 407 km. Active radar and a passive optical imager enable the retrieval of cloud and precipitation parameters [28,29,30]. Precipitation measurement radars (PMR) provide three-dimensional measurement of clouds and precipitation. The simplified medium-resolution spectral imager (MERSI-RM) is a set of eight observation channels (0.650–12 μm), consisting of five solar reflection band channels and three thermal infrared channels, and the spatial resolution of all channels is 500 m. The High-Accuracy Onboard Calibrator (HAOC) measures the radiance spectrum of 400 nm to 1060 nm at 4 nm spectral sampling interval, designed to support high-precision space calibration for other reflected solar band instruments. Finally, the MAPI provides multi-angle and multi-polarization observation information (Figure 1). The advantage of observation by multiple sensors on the same platform is the spatial-temporal consistency with high synchronization, which can enhance the synergistic effect on the retrieval of geophysical parameters and serve the observation chain of aerosol–cloud–precipitation (Figure 2).

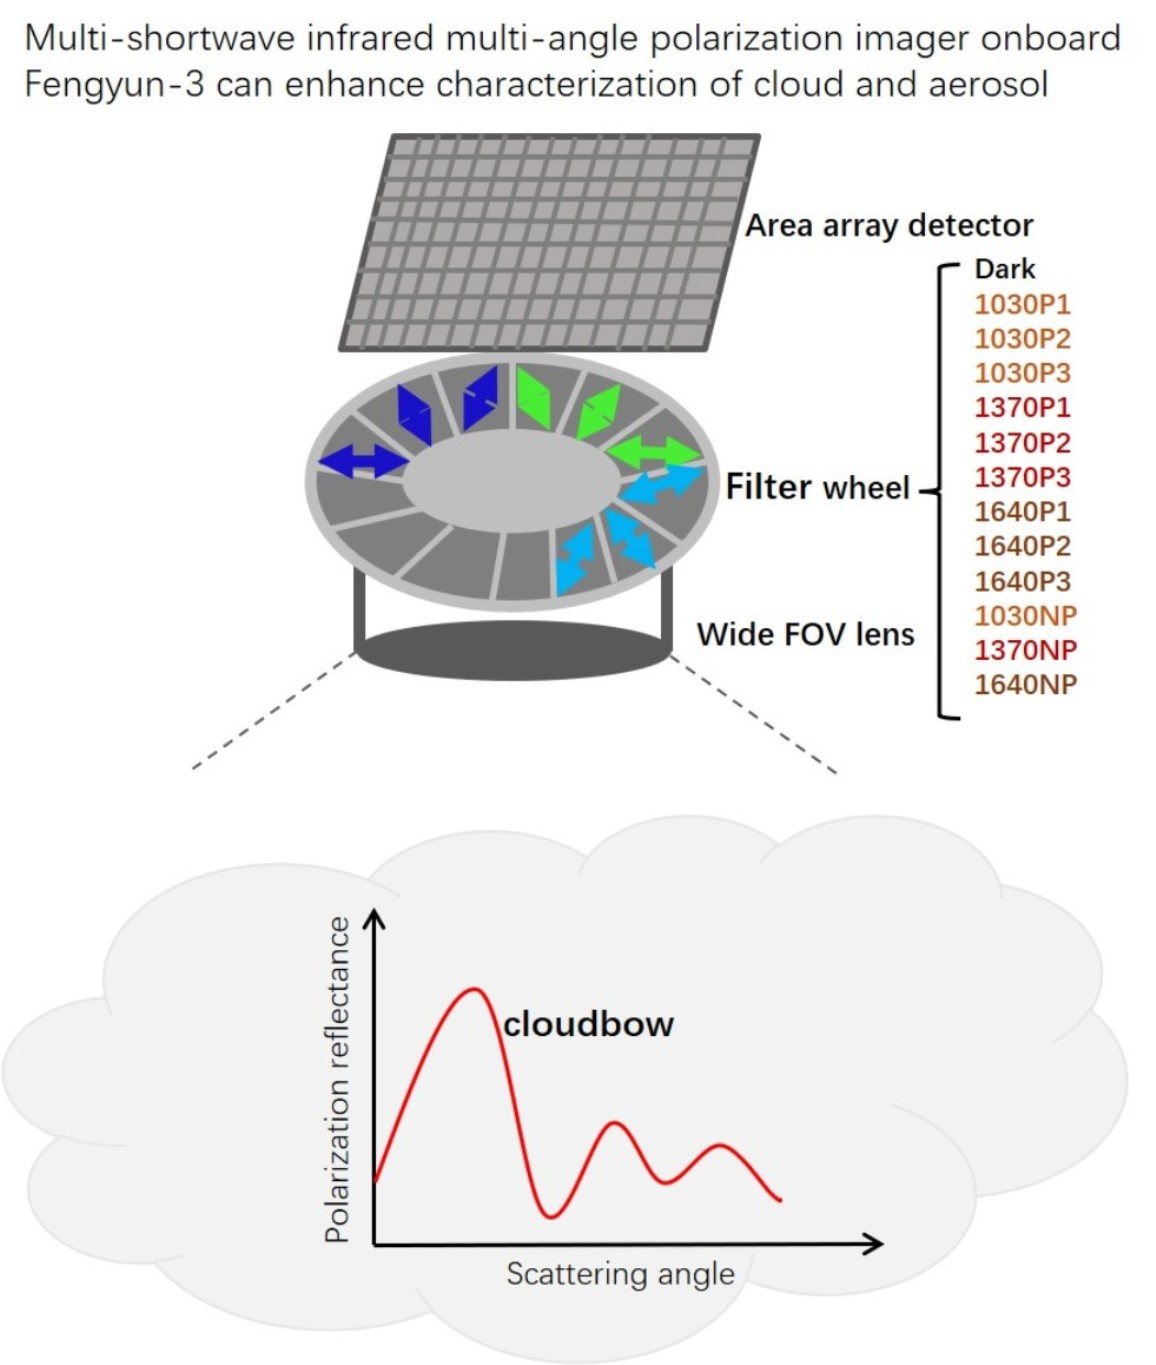
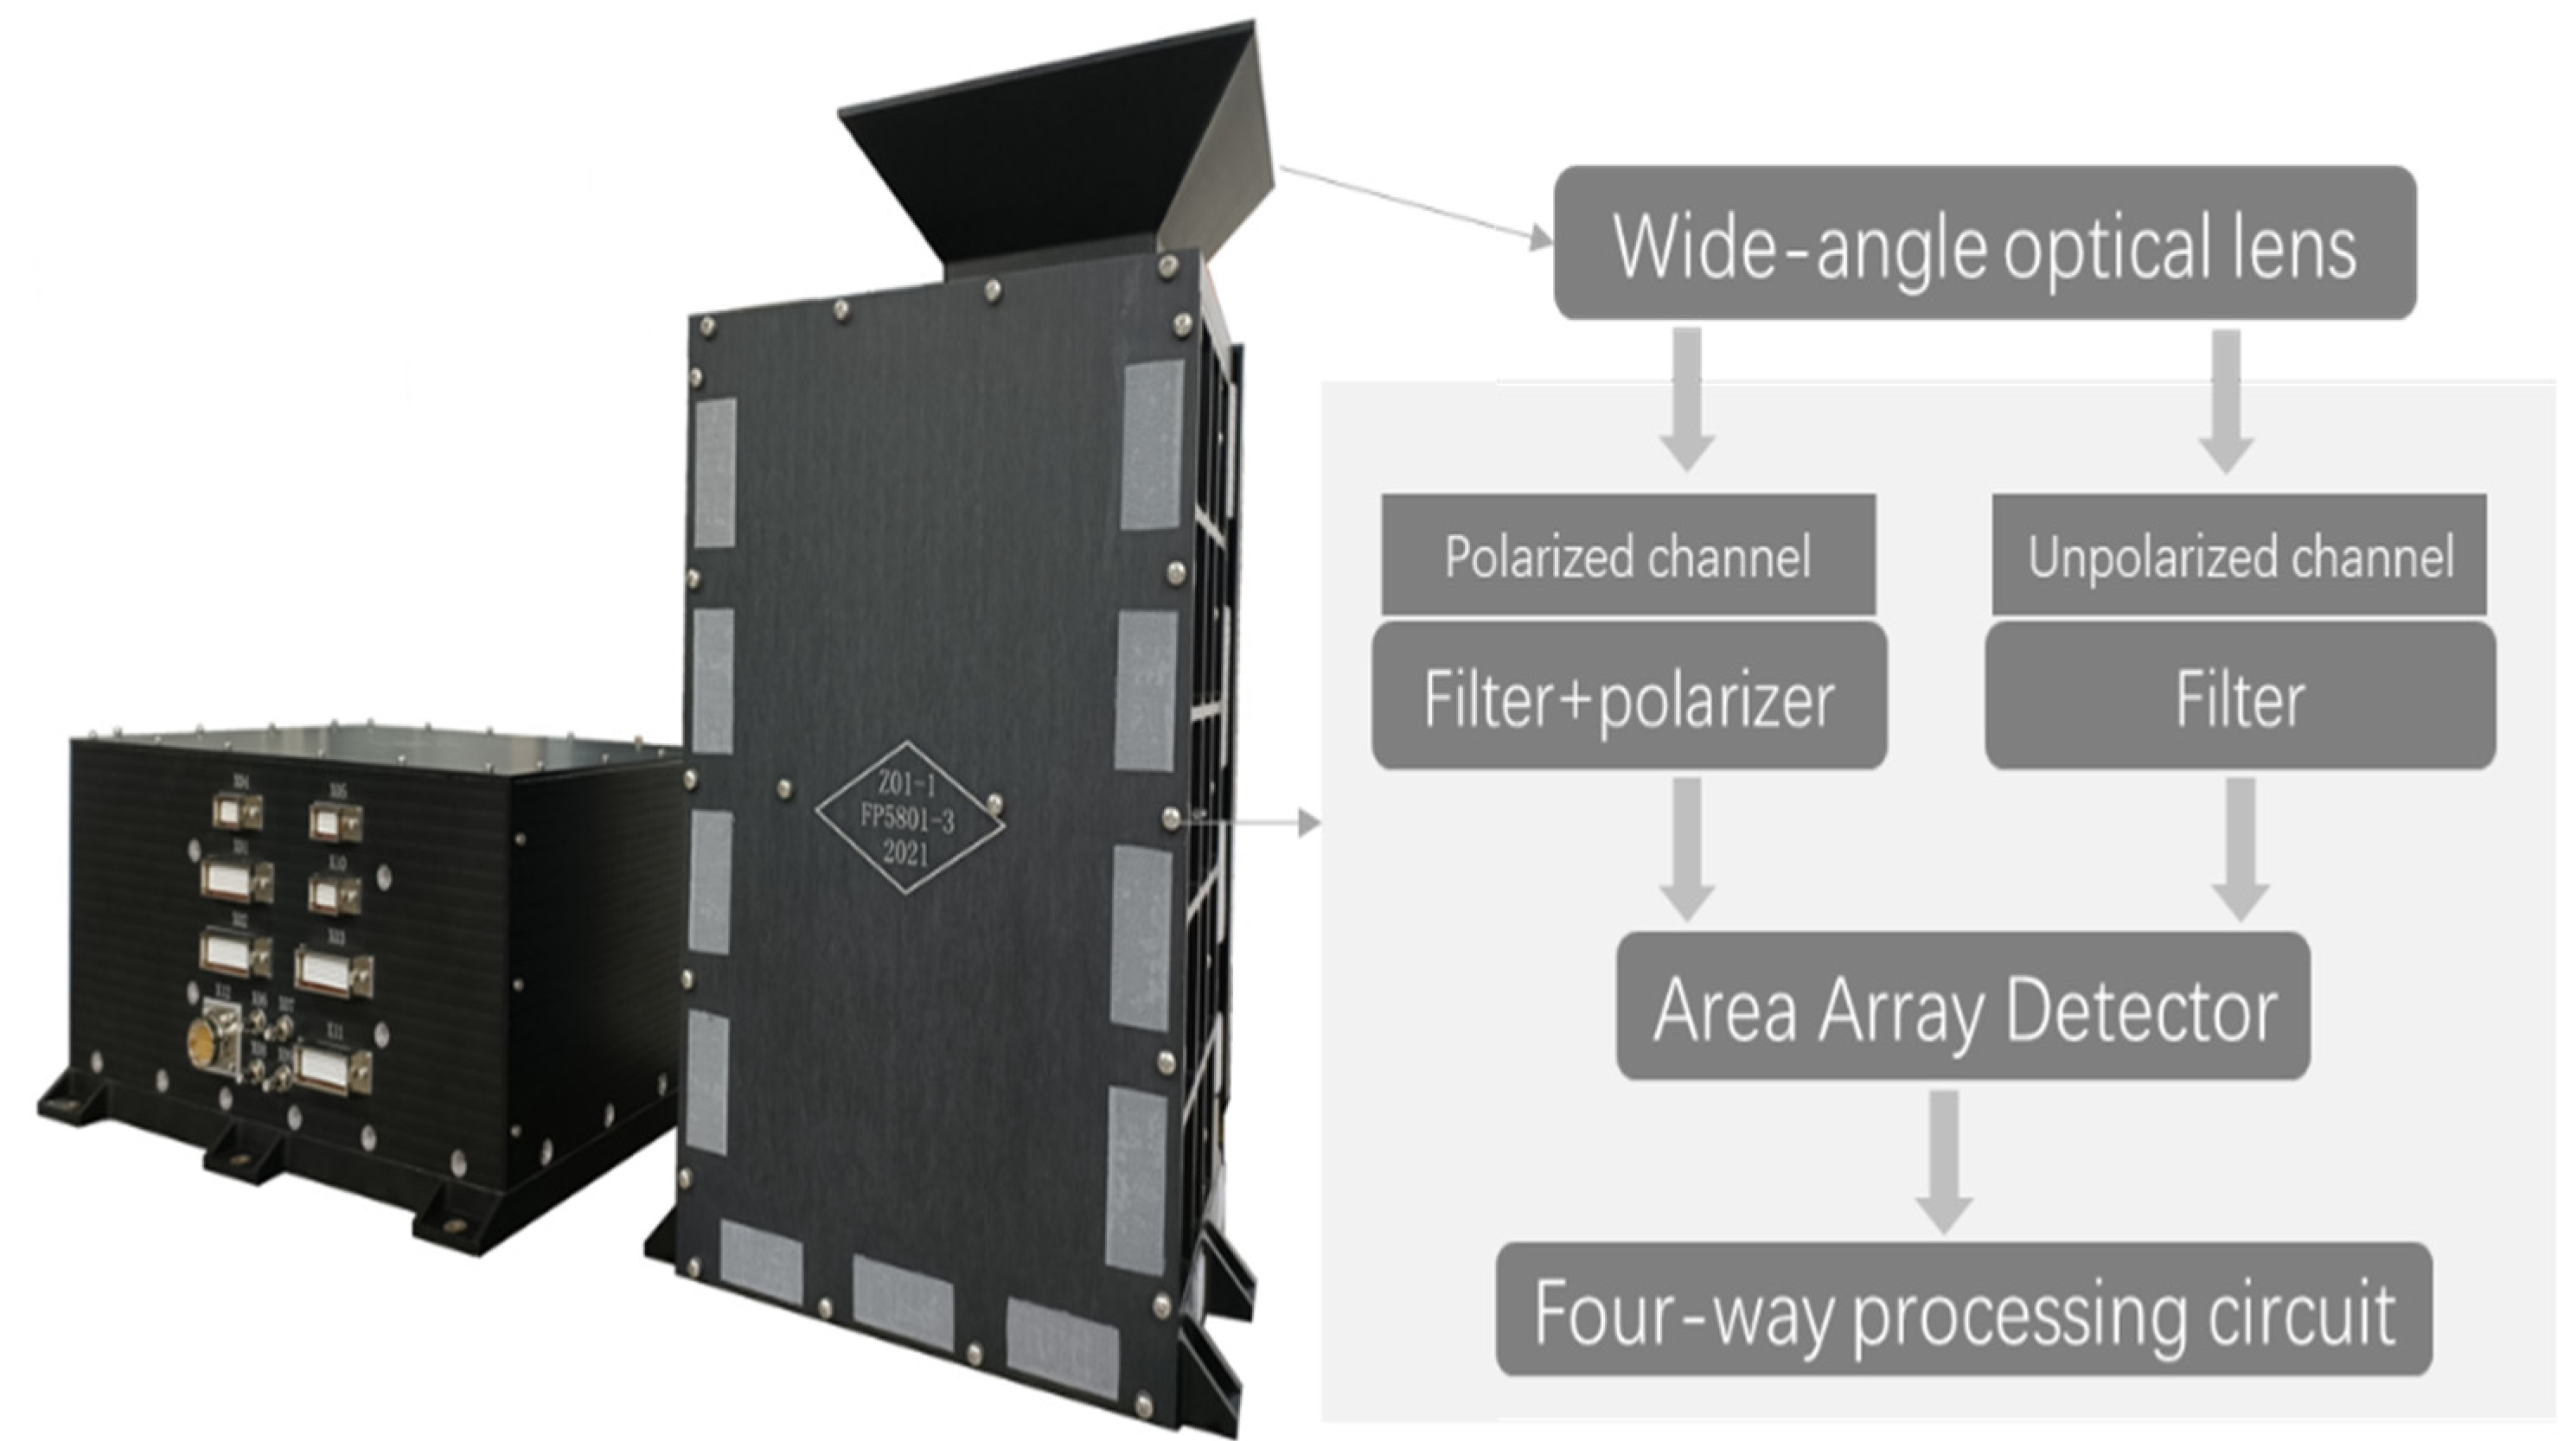
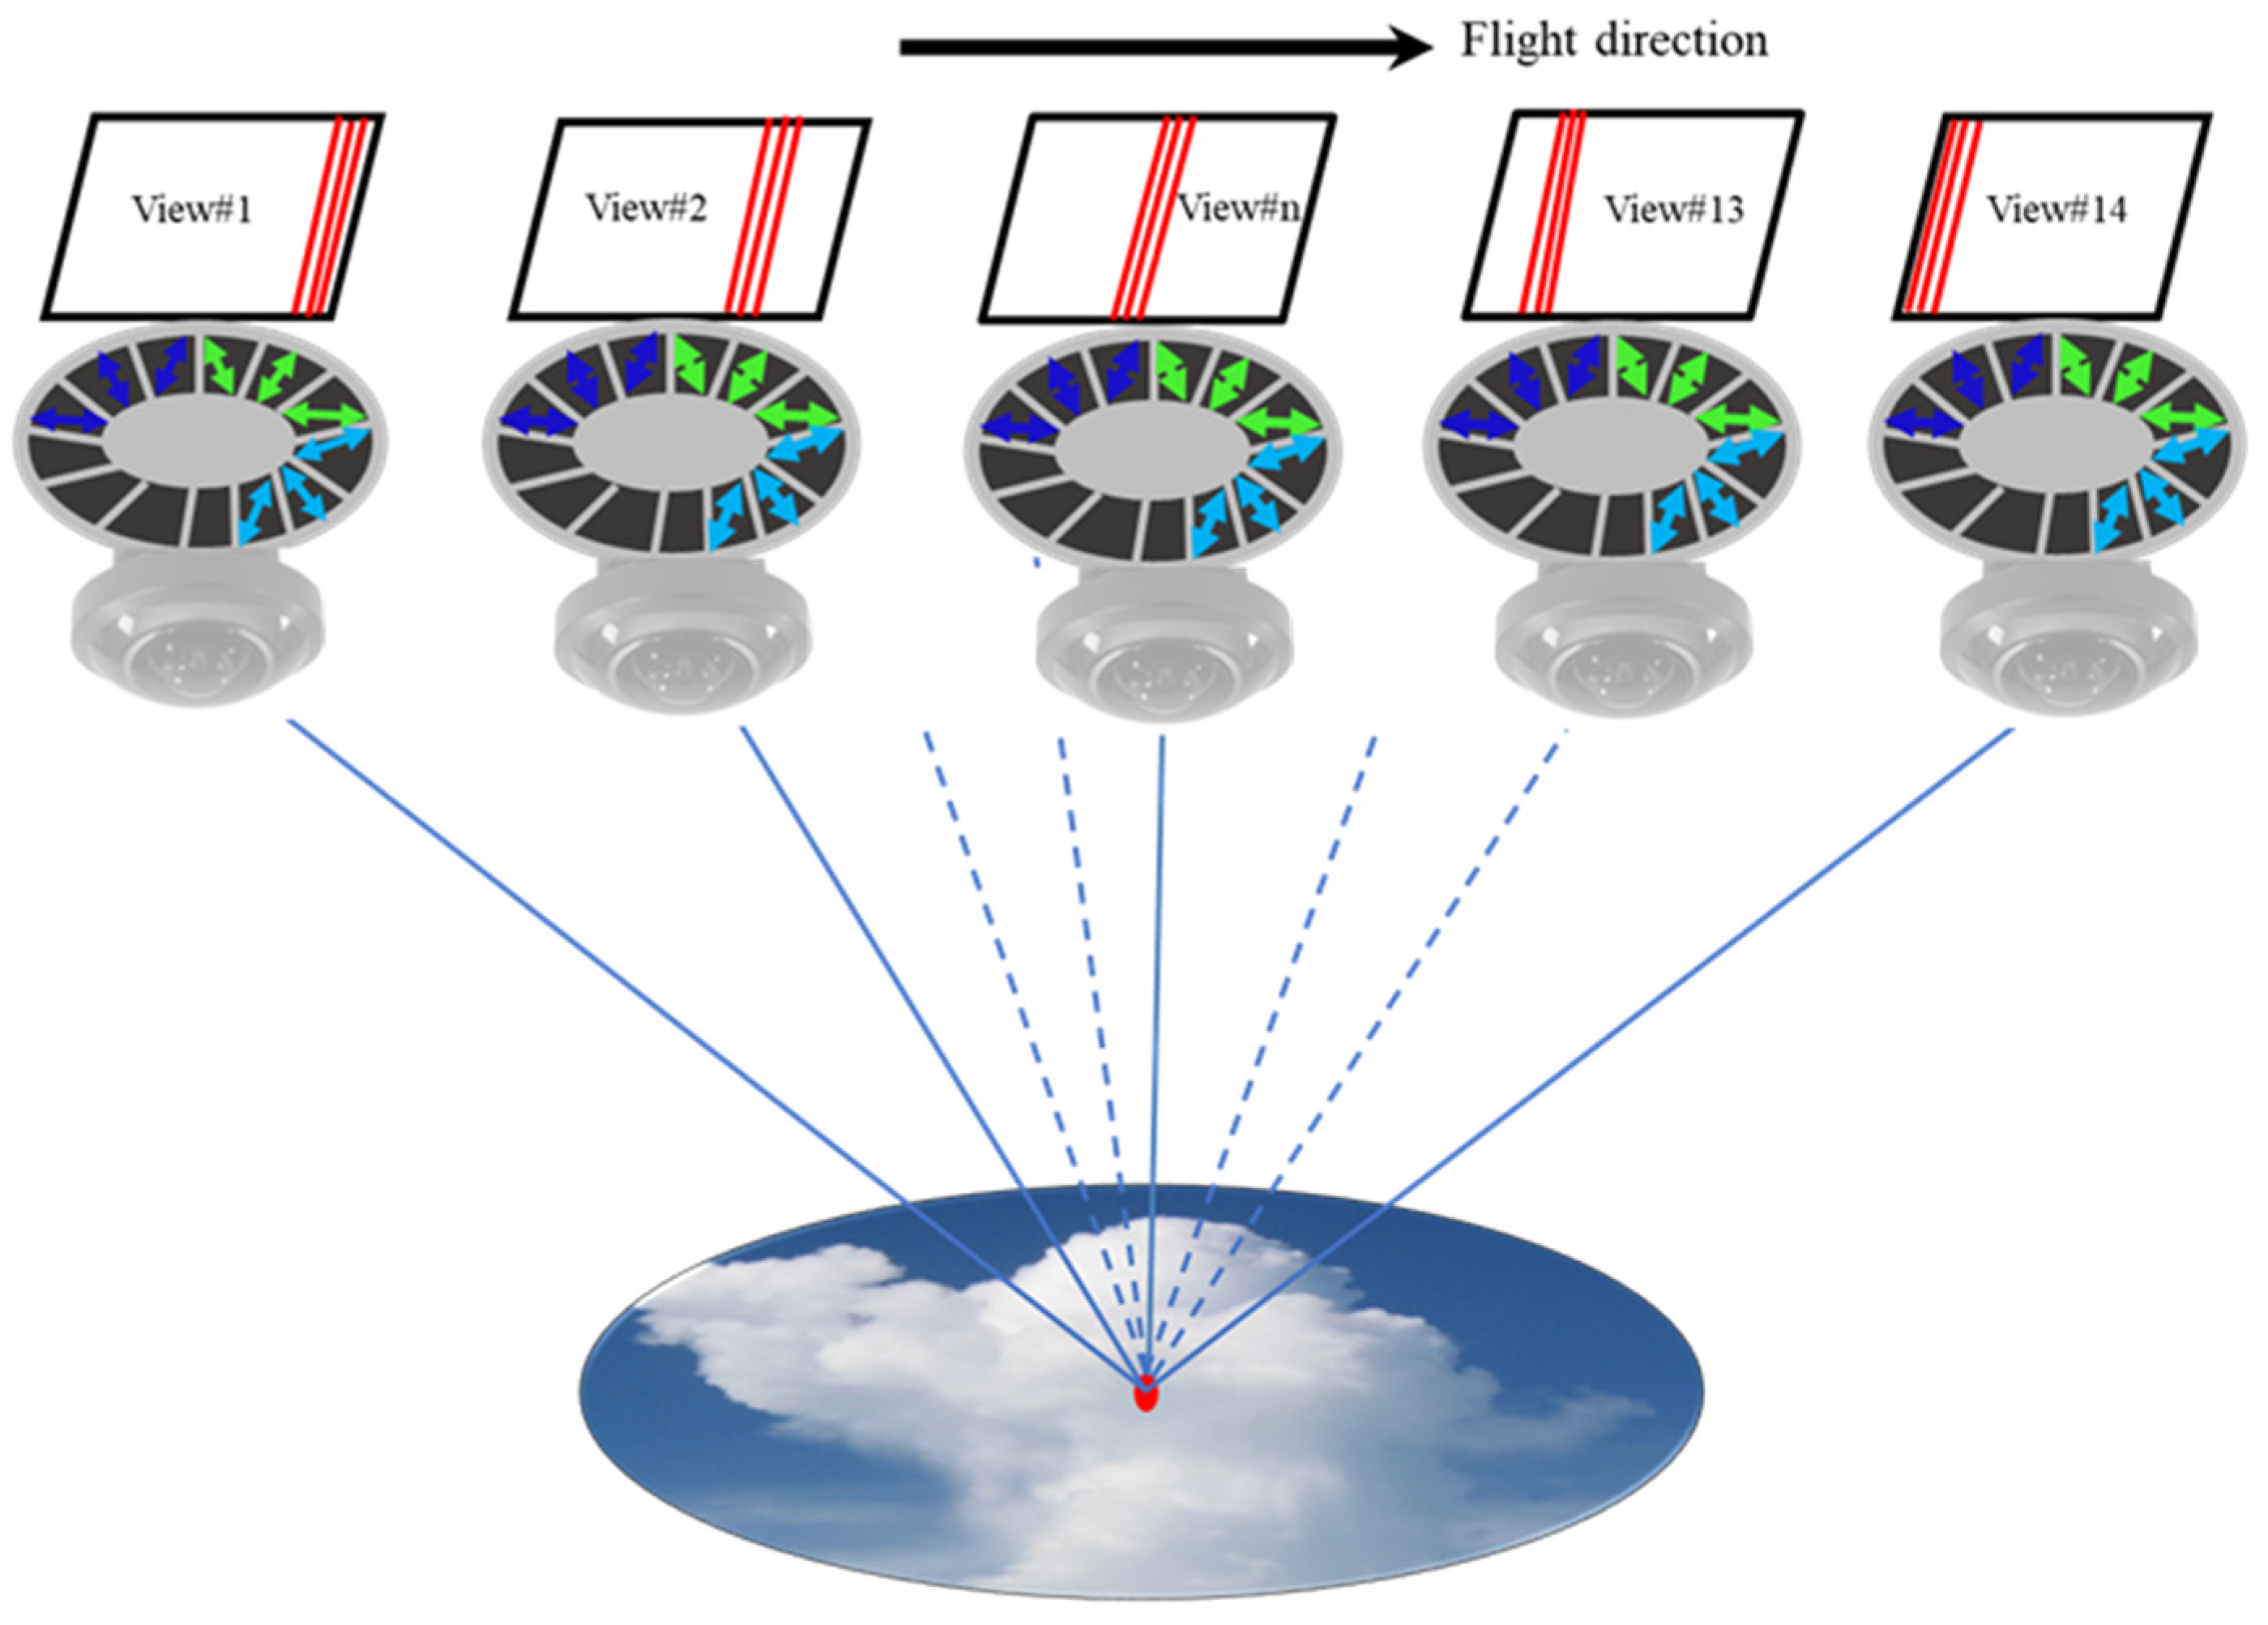
2.2. Overview of MAPI

The MAPI has an optical lens with a wide field of view (±40° × ±40°), combined with a two-dimensional indium gallium arsenic (InGaAs) focal plane detector. The observation channel is concentrated in SWIR, consisting of 1030 nm, 1370 nm, and 1640 nm polarized and non-polarized channels, aiming to improve the description of cloud and aerosol properties [21]. The earth–atmosphere system observed by the MAPI is continuously and instantaneously imaged on an area array detector with 256 × 256 pixels, achieving spatial resolution of 2.96 km under a swath of 700 km. For an observing object, the MAPI can measure it from up to 14 viewing angles (Figure 3). For each observation angle, all spectral and polarization information is contained. The radiometric and polarimetric measurements of the DPC are better than 5% and 2%, respectively. The instrumental parameters of the MAPI onboard the FY-3 satellite are listed in Table 2.
The rotating wheel module between the optics and focal plane provides 13 (1 + 3 × 3 + 3) measurement channels, including a background channel, 3 polarized bands (1030, 1370, and 1640 nm), and 3 non-polarized bands (1030, 1370, and 1640 nm). Each polarized band consists of three channels equipped with a polarizer whose polarization angles are close to 60°, 0°, and −60°, respectively. The three polarized channels of the same band are adjacent, which are geometrically registered by a wedge prism. The detailed information is shown in Table 3 and Figure 3.

2.3. Radiometric Model and In-Flight Calibration Strategy

The partially linearly polarized light, which is the main object observed by the MAPI, can be represented by three Stokes parameters (I, Q, U). For any linear polarization vector E, the Stokes parameter can be expressed as:
{ I = I n p + I p o l Q = I p o l · c o s 2 α = D o L P · I · c o s 2 · A o L P U = I p o l · s i n 2 α = D o L P · I · s i n 2 · A o L P
where I is the total incident radiance, while I n p is the unpolarized radiance and I p o l   is the polarized radiance, and D o L P is the ratio of I p o l   to I.
The radiometric model of the instrument is used to describe the physical properties of the instrument to obtain the response of each spectral channel and each detector element to any incident polarized light. For the incident light vector E ( I 0 ,   Q 0 , U 0 ) to be observed, a certain band (k) of one of the detector elements (row and column number l, p), and a polarizer (a), the response value of the instrument can be expressed as:
D N l , p k , s , a = A l , p k · ( P 1 i , j k , a · I 0 + P 2 i , j k , a · Q 0 + P 3 i , j k , a · U 0 ) + C l , p
among them, D N l , p k , s , a is the response value of the instrument within integration time s, and A l , p k is the mean absolute calibration coefficient. C l , p indicates the dark current of the channel. P1, P2, P3 are polarization calibrated coefficients, indicating the polarization phenomena of the optics and the filter units [31]. From the Stokes parameters measured by the MAPI, the degree of linear polarization (DoLP) and the angle of linear polarization (AoLP) can be obtained.
D o L P = Q 2 + U 2 I
A o L P = 1 2 t a n 1 ( U Q )
Similar to the previous POLDER and the upcoming 3MI, the MAPI does not have an onboard calibrator. On the basis of comprehensive and representative pre-launch calibration, the in-flight performance of radiometric and polarization observation could be verified and calibrated through cross-calibration with other instruments on the same platform (including HAOC and MERSI-RM) and vicarious calibration by natural targets.
Cross-calibration provided by other instruments on the same platform is an important calibration tool, as it provides the same observation time and almost coincident observation geometry for the same spectral interval. Hyperspectral observations of HAOC can provide the radiometric benchmark for the 1030 nm channel of the MAPI, because of its high precision (with radiometric accuracy better than 2%) and low uncertainty. MERSI-RM on the same platform has 1380 nm and 1640 nm channels, and performs in-flight calibration by an onboard calibrator. Therefore, HAOC and MERSI-RM can provide the MAPI with high-precision radiometric cross-calibration. Using the radiometric calibration coefficient before launch and the in-flight reflectance observed by the three instruments, a new radiometric calibrated coefficient of the MAPI can be estimated by cross-calibration:
A i n f l i g h t 1030 = A p r e f l i g h t 1030 · I H A O C 1030 I M A P I 1030
A i n f l i g h t 1370 / 1640 = A p r e f l i g h t 1370 / 1640 · I M E R S I R M 1370 / 1640 I M A P I 1370 / 1640
The successful vicarious calibration methods applied to POLDER will be extended to new SWIR channels of the MAPI, including radiometric calibration and polarization calibration [17,32,33]. Vicarious calibration relies on the natural scene as a radiometric benchmark, including sunglint, deep convective clouds, and deserts. The in-flight performance of polarization measurement is verified using two complementary polarization calibration methods. One is based on unpolarized targets, such as clouds, while the other uses strongly polarized targets, such as sunglint over the ocean. It is shown in Figure 4 that the DoLP of sunglint is extremely high, with the range of 0.8 to 1. Thus, sunglint can be the high and stable DoLP target for polarization calibration.

3. Advantage the Observation of MAPI

The multi-angle polarization imager onboard FY-3 has the advantage of the new SWIR channel, unique orbital characteristics, and collaborative observation of multiple instruments on the same platform. Some simulations were conducted to illustrate the advantages of improving the characterization of clouds, aerosols, and the surface by the MAPI.

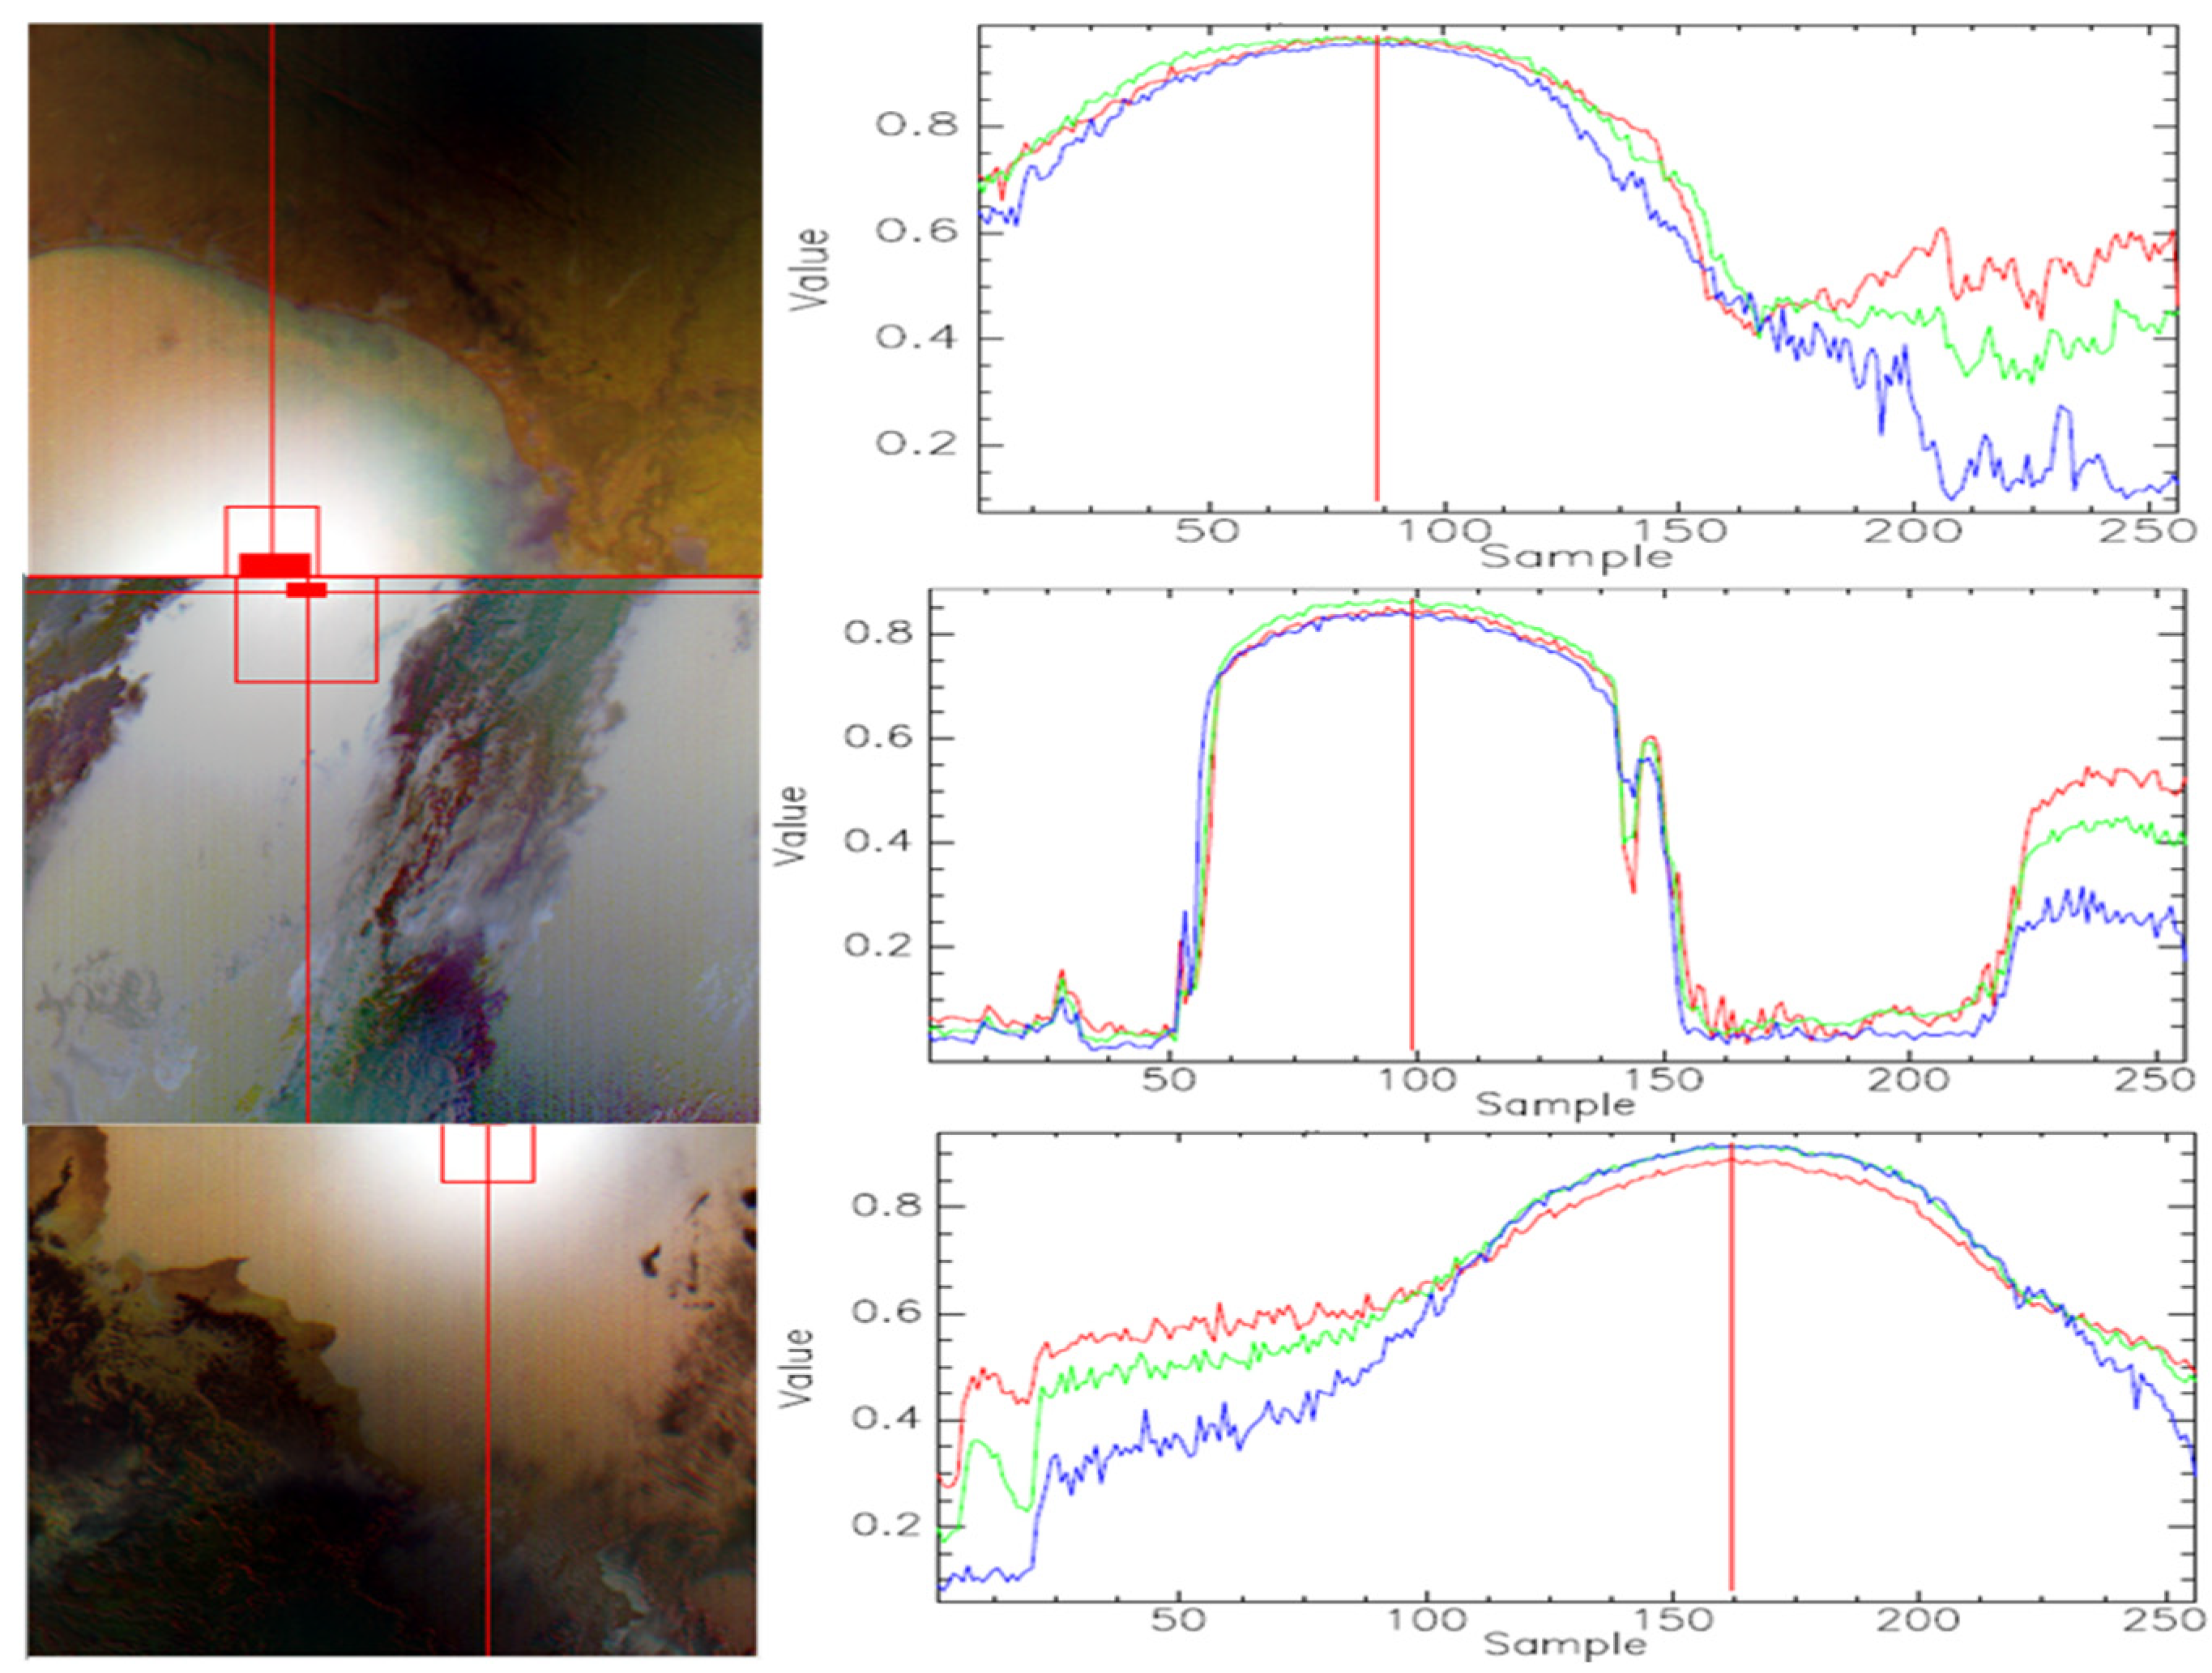
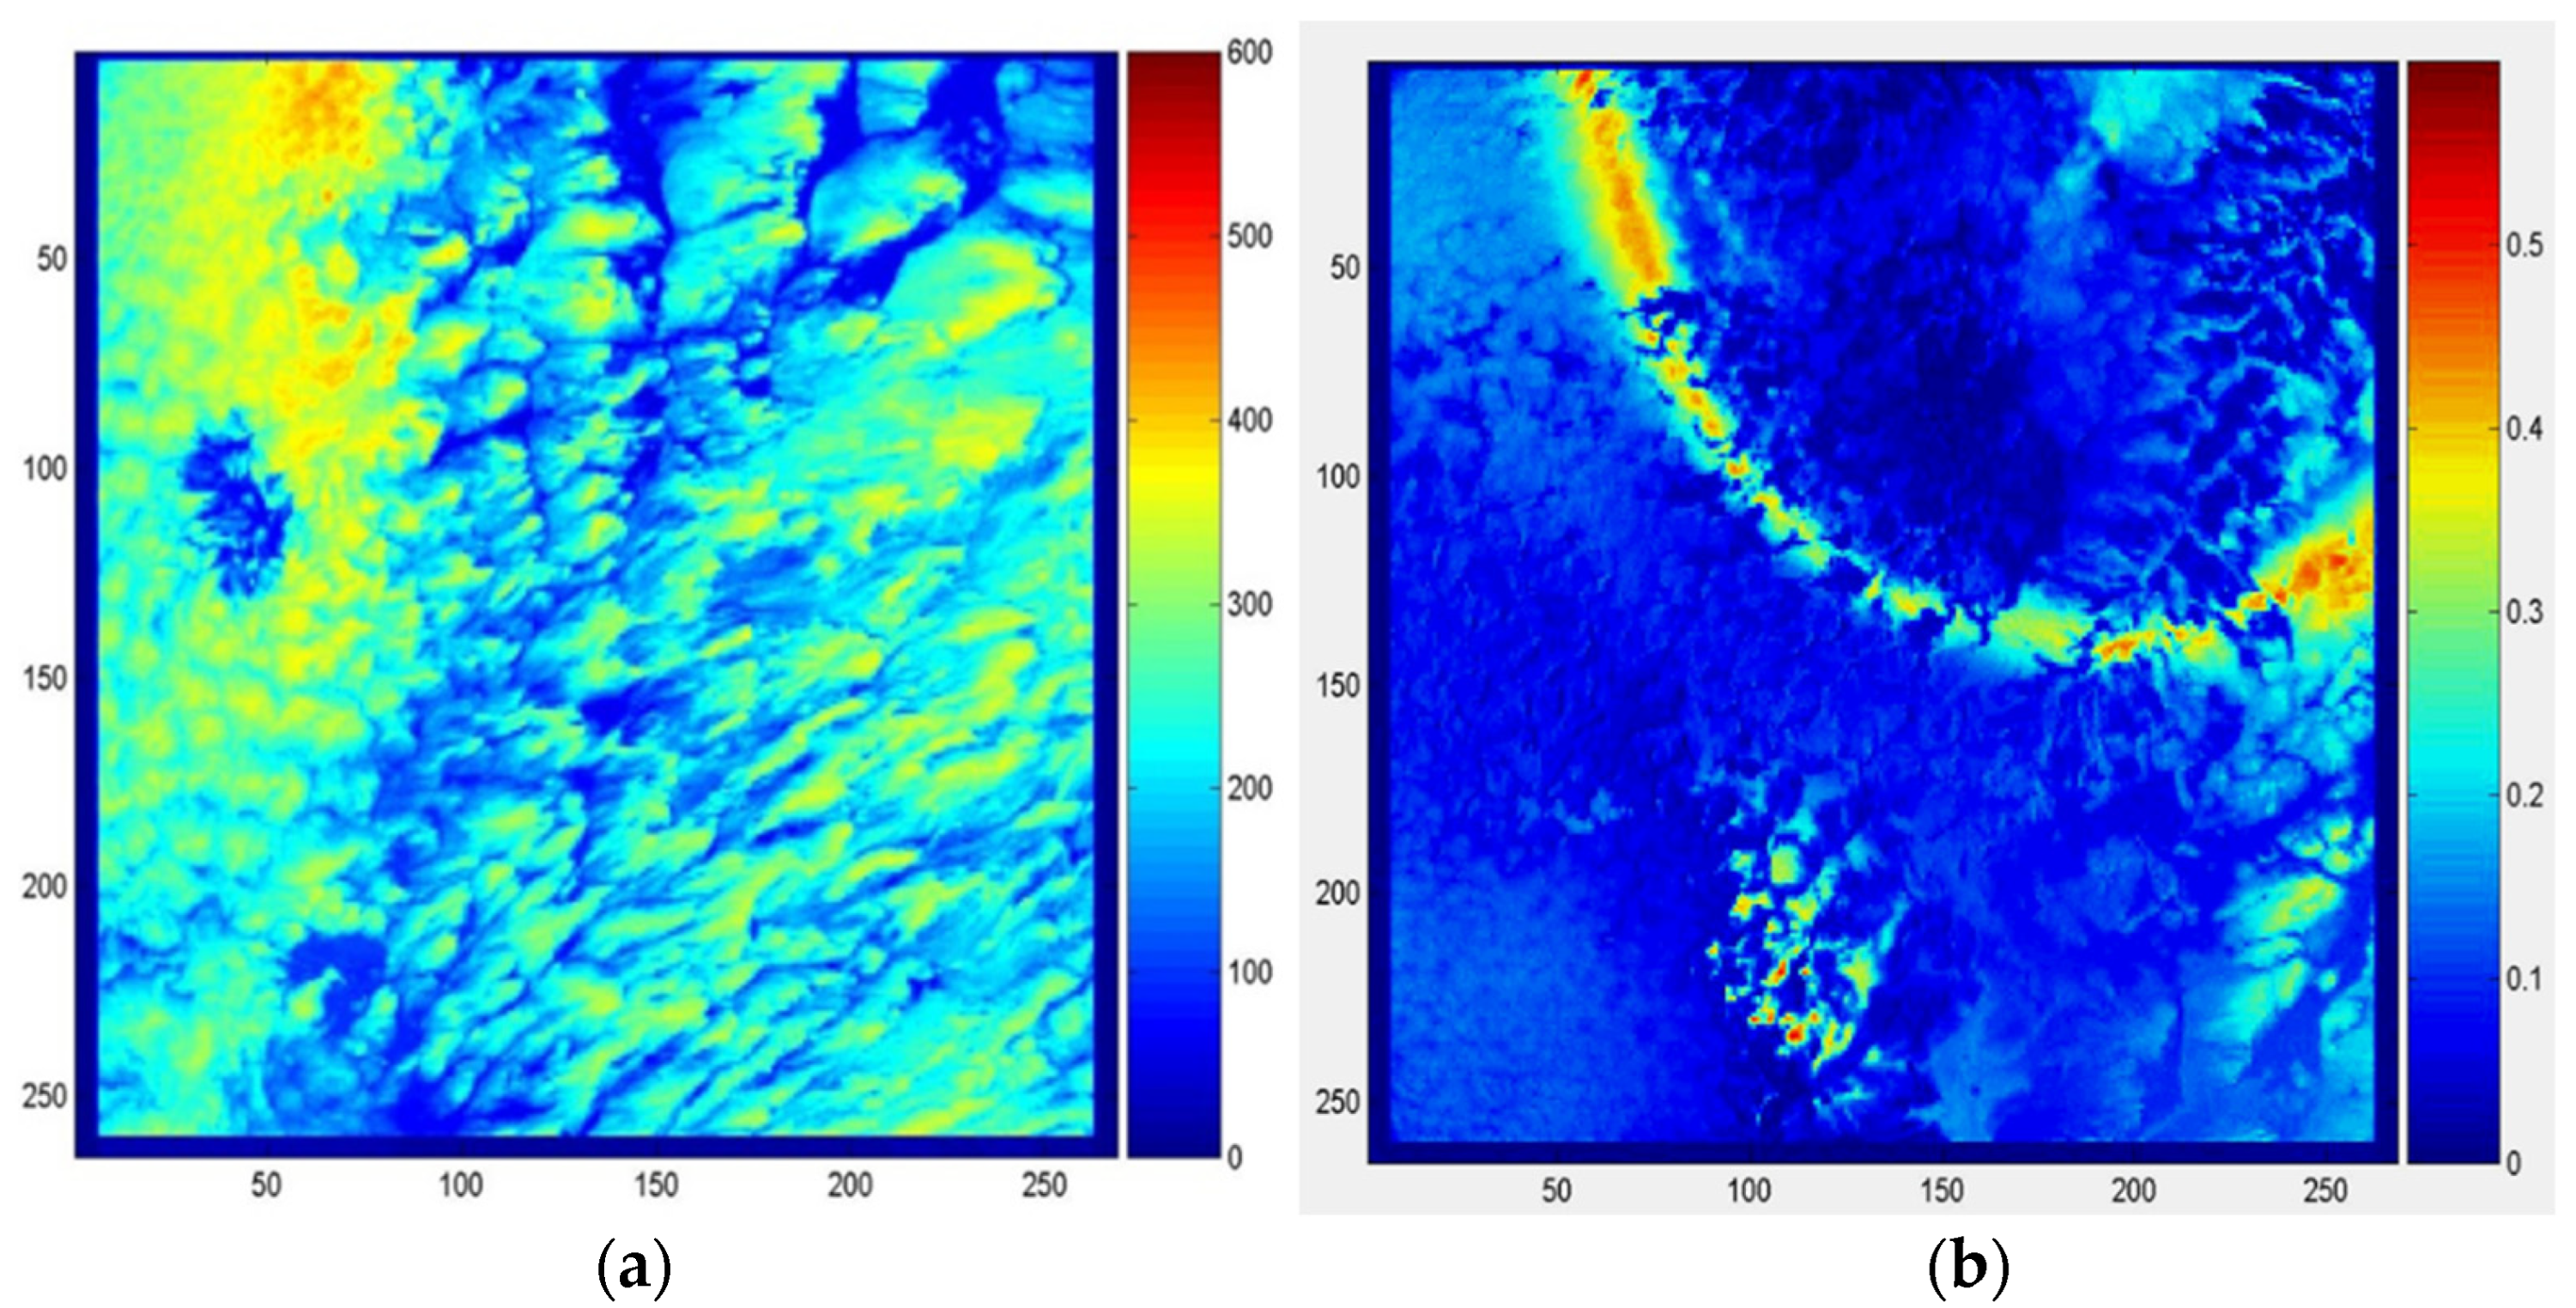
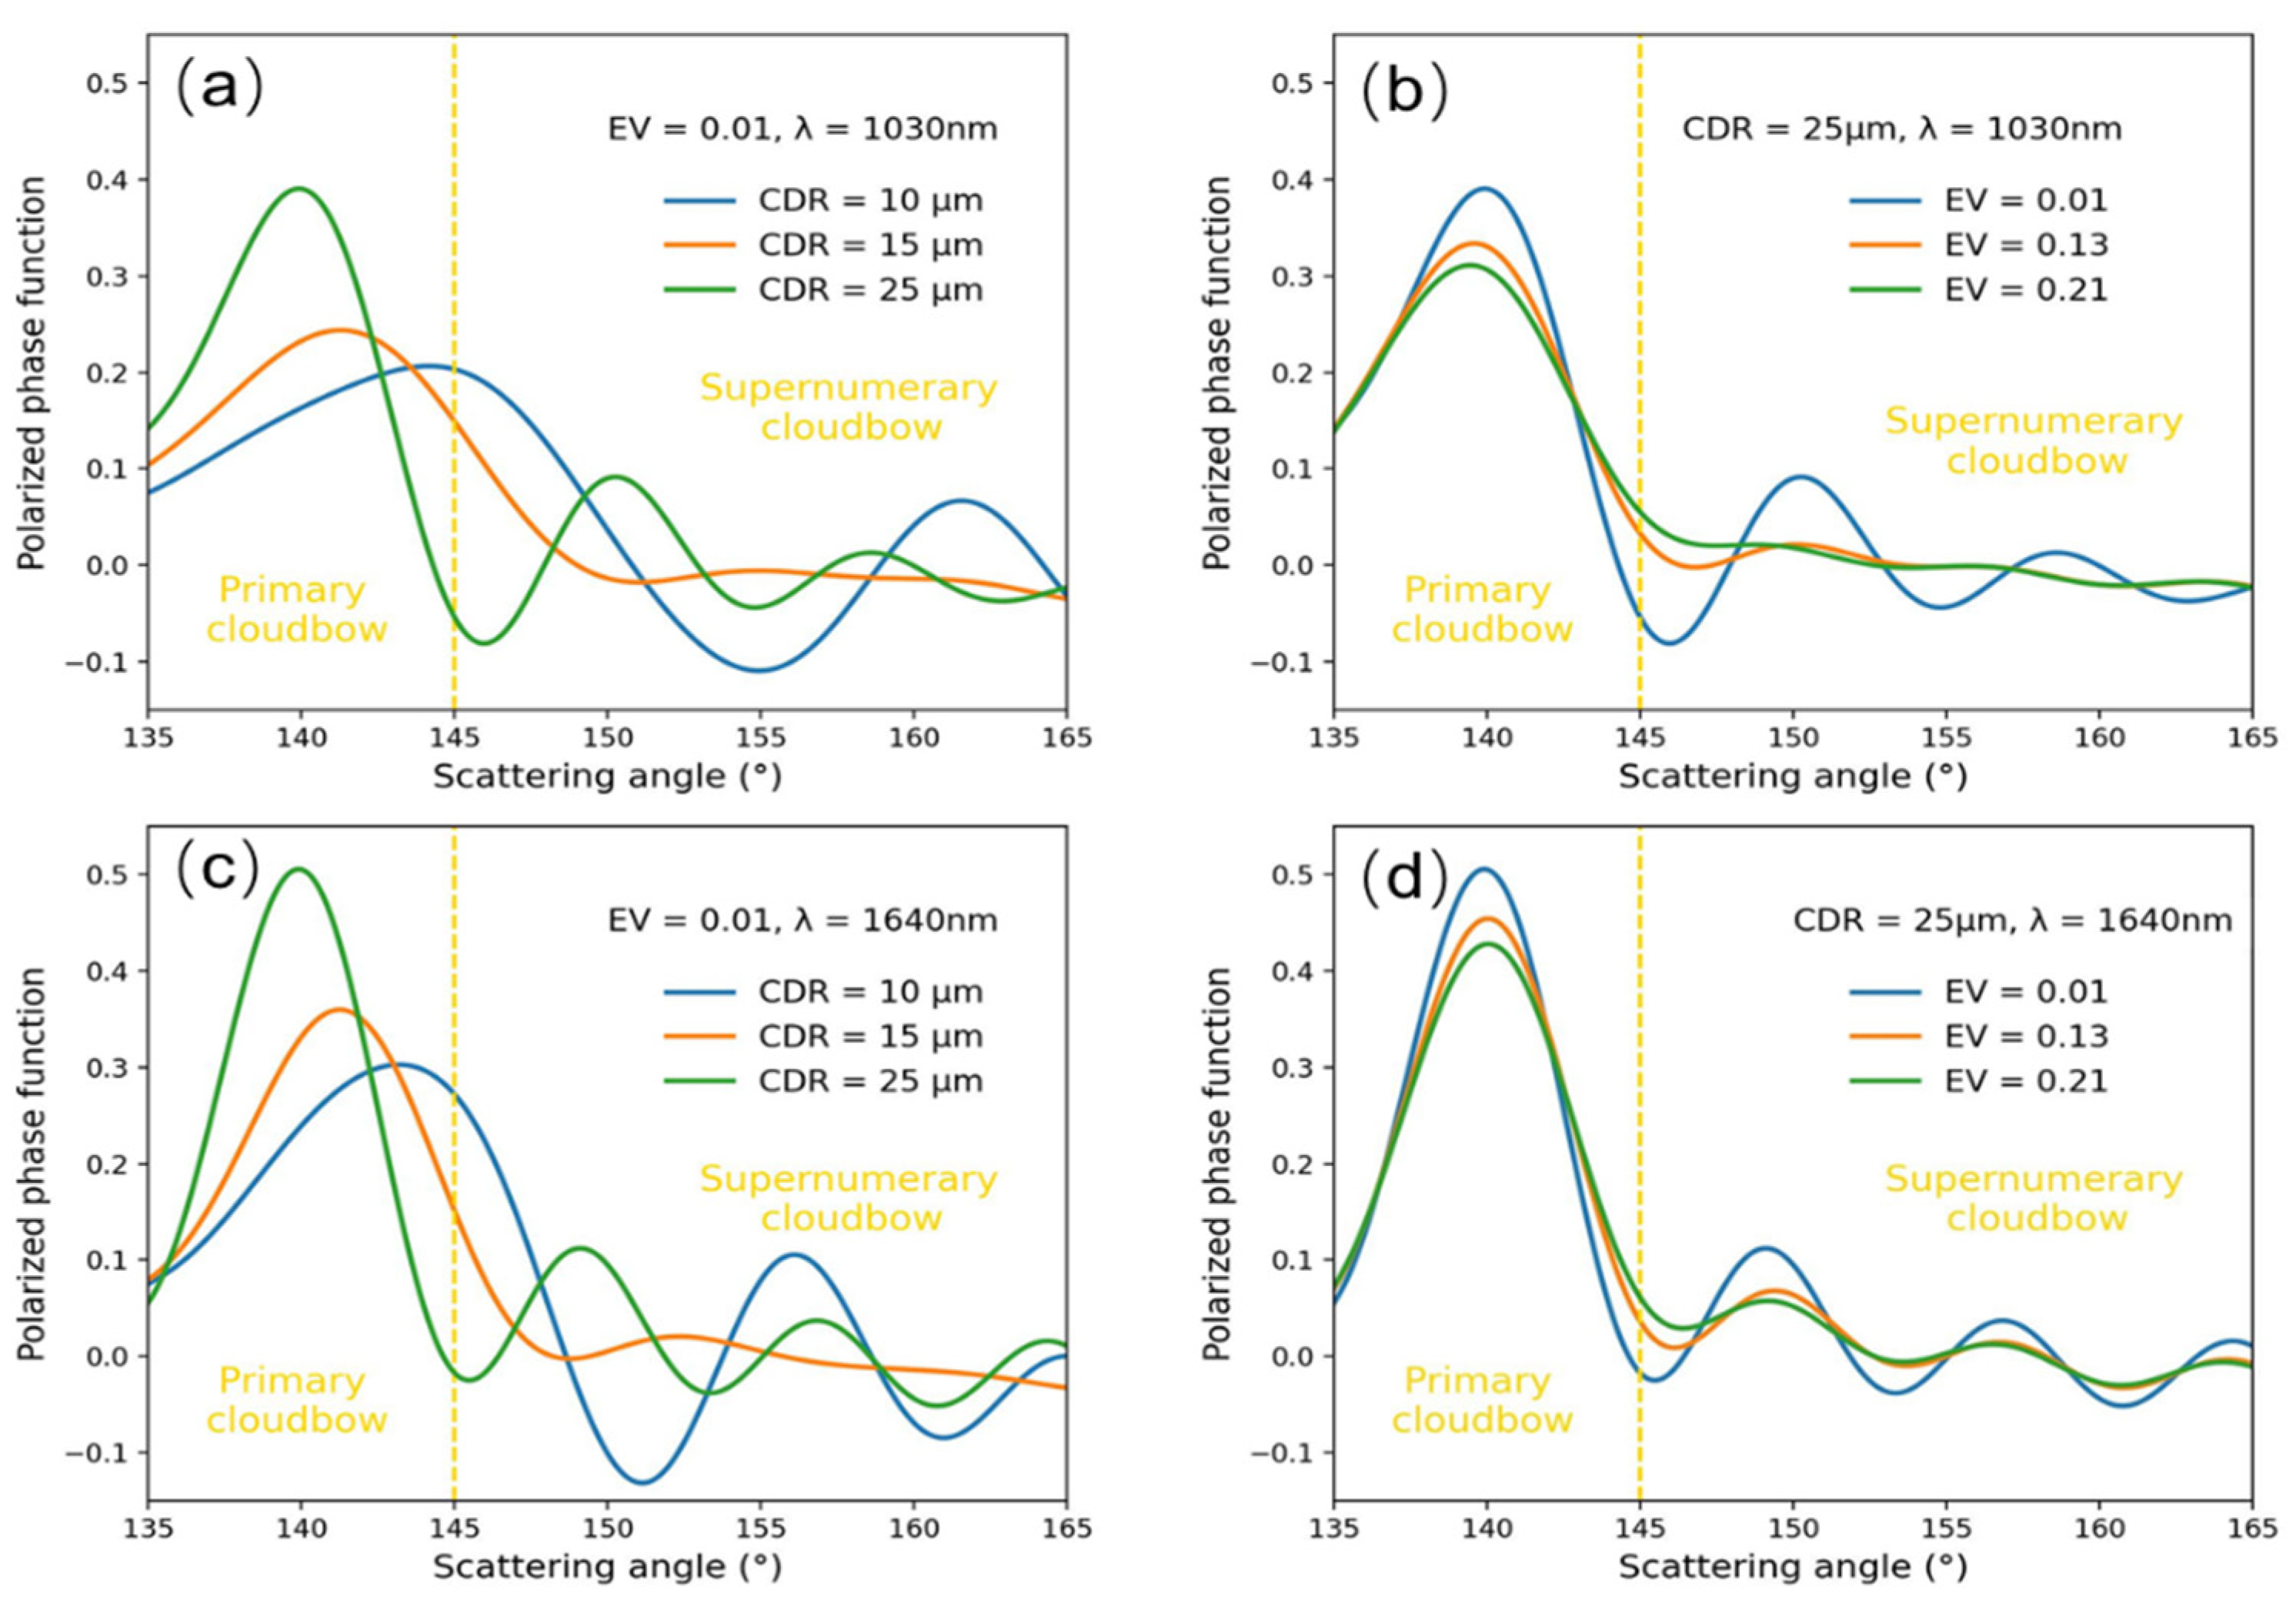
3.1. Improving the Description of Cloud Characteristics

The multi-angle polarization observation provides a unique cloud detection method, that is, “cloudbow” at the specific range of scattering angle around 140°, due to large, polarized reflectance scattered by a water cloud [34,35]. In addition, the water and ice clouds can be effectively distinguished based on whether there is a cloudbow. Figure 5 shows the water cloud observed by the polarimeter. It shows an obvious cloudbow in the polarization measurement of the water cloud in the top right of Figure 5b, while the phenomenon is not seen in total reflectance (Figure 5a). In addition, Figure 5b indicates that the cloudbow present by polarized reflectance is not shown in all of the water cloud region, but the aera of the scattering angle is around 140°.
The cloud droplet size distribution is the important parameter of cloud radiation study, which can be characterized by cloud droplet radius (CDR) and effective variance (EV). Figure 6 shows the sensitivity of the polarized phase function of CDR and EV in the angle range around cloudbow, including the “primary cloudbow” range (135°–145°) and the “supernumerary cloudbow” range (145°–165°). For the 1030 nm band shown in Figure 6a, when EV adopts 0.01, as the CDR increases from 10 μm to 25 μm, the polarized reflectances of the peak of the primary cloudbow are significantly improved, with the values of 0.20, 0.24, and 0.40, respectively. In addition, the corresponding scattering angle moves to the smaller regions from 144°, 142°, and 140°. For 1640 nm (Figure 6c), the peak values are 0.3, 0.35, and 0.51 under the scattering angles of 143°, 141°, and 140°. As for EV shown in Figure 6b,d, when CDR is 25 μm, as EV grows, the amplitude of the peak of both primary cloudbow and supernumerary cloudbow weaken obviously. The polarized phase function for smaller EV (0.01) presents much stronger fluctuation. It can be seen that the polarization phase functions of the 1030 nm and 1640 nm bands show strong sensitivity to CDR and EV, and stronger than that of the 865 nm band indicated by Shang et al. (2019). Compared with multi-angle polarization instruments such as POLDER and DPC, the unique SWIR channel of the MAPI can enhance the inversion of cloud microphysical parameters.

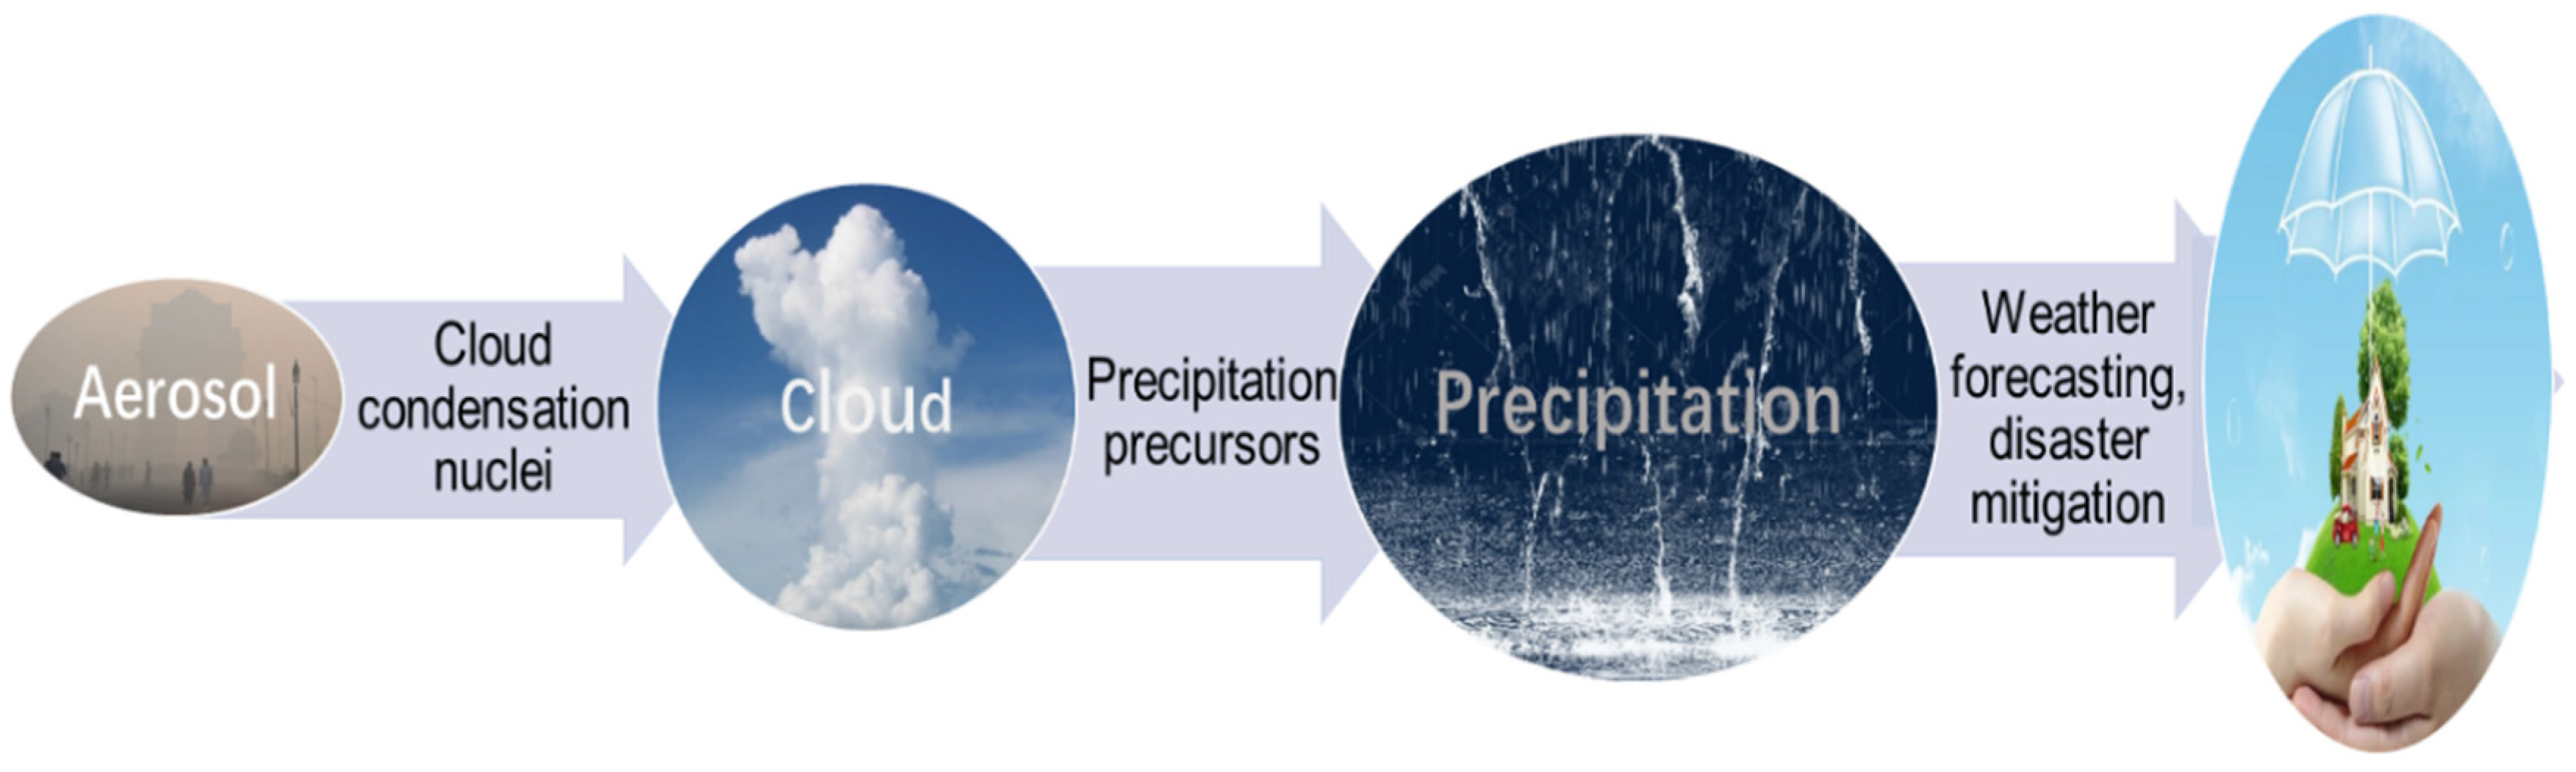
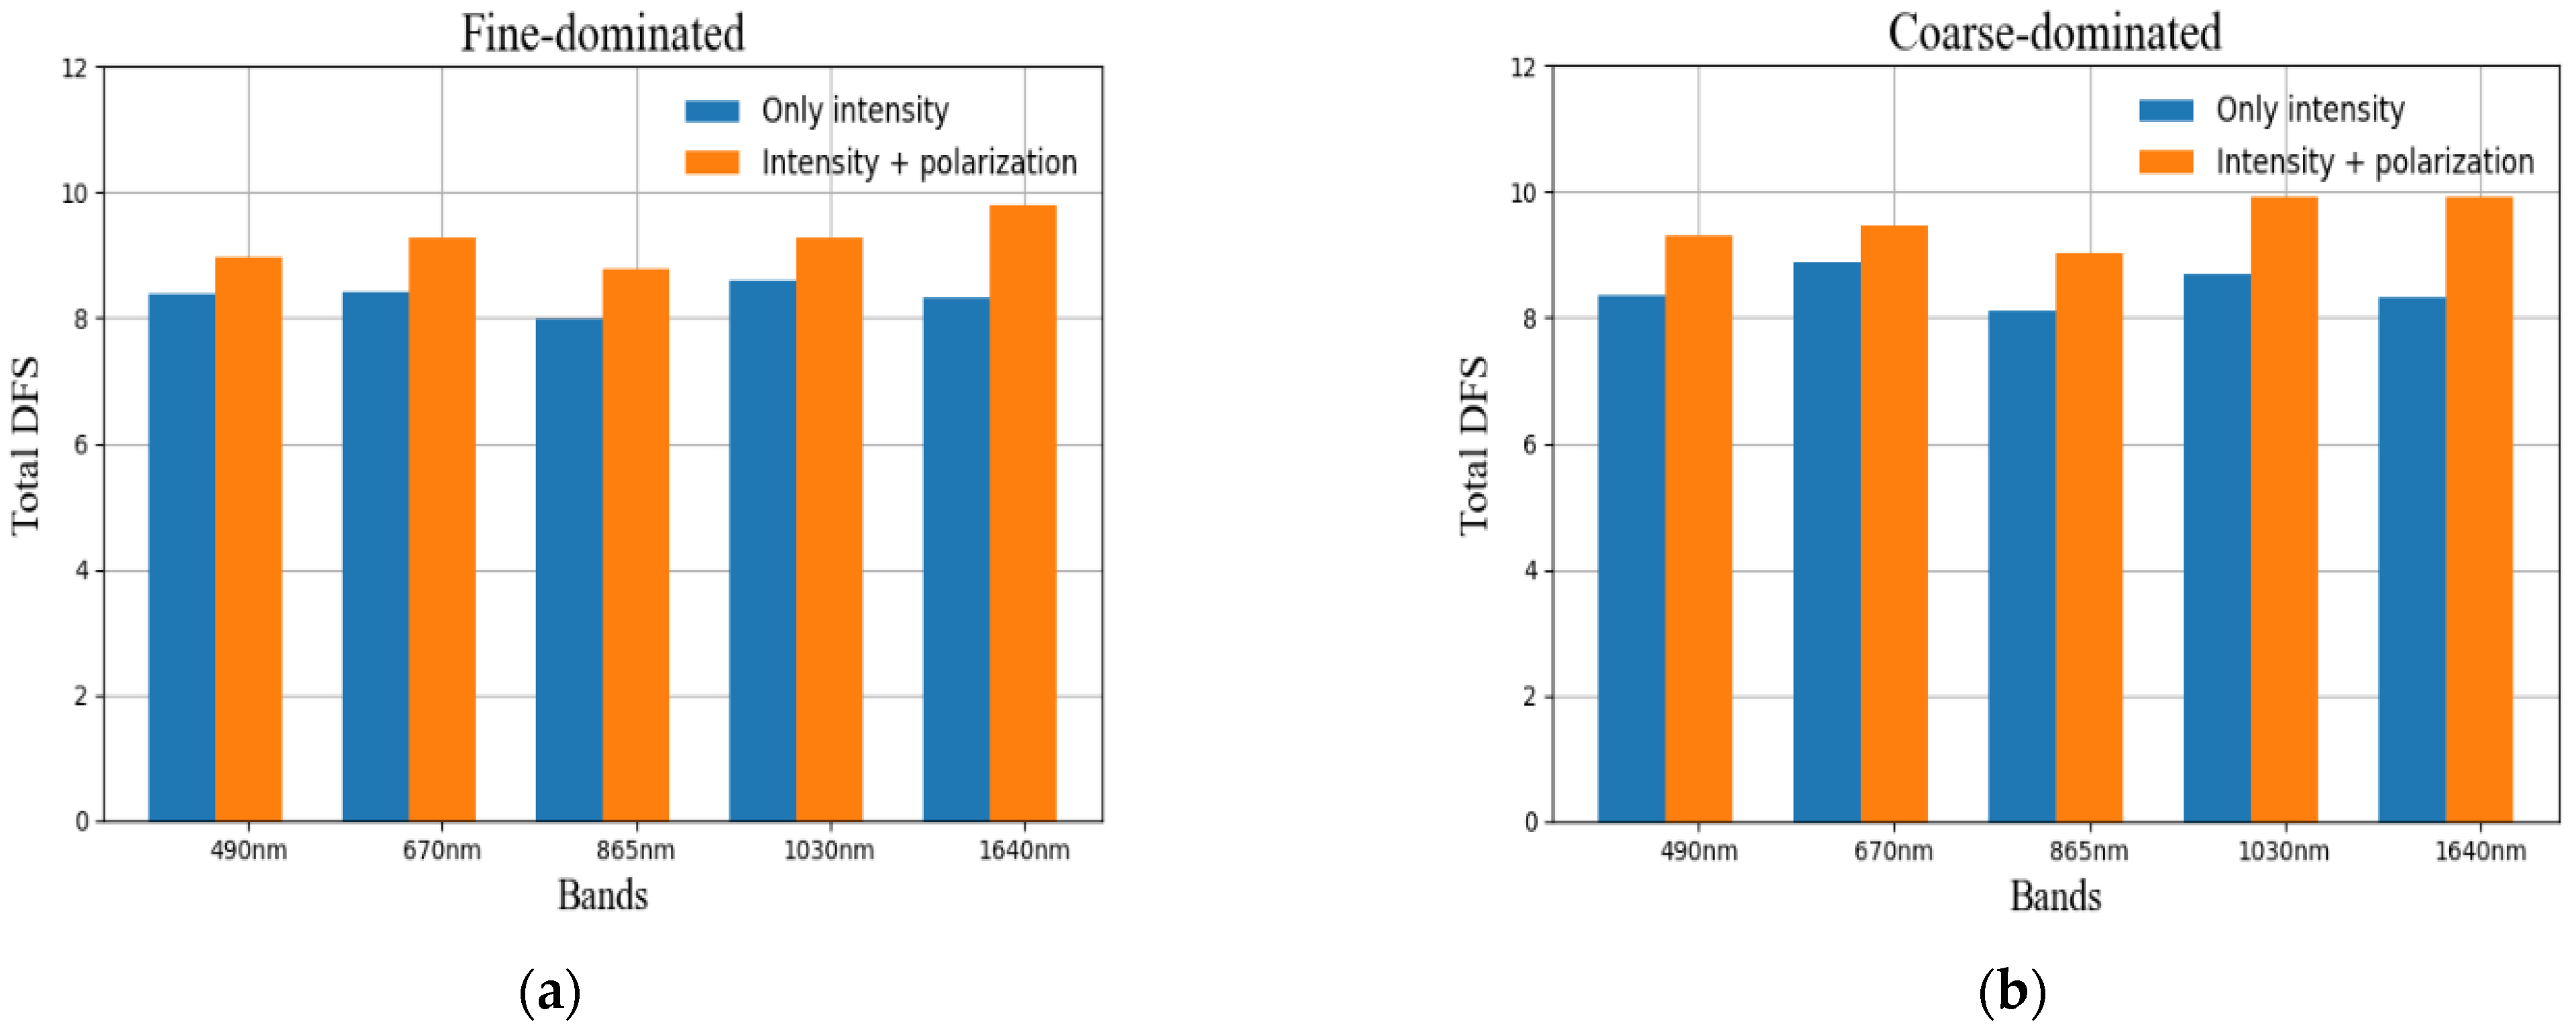
3.2. Optimizing Aerosol Characterization

For troposphere aerosol satellite remote sensing, the contribution of the surface and atmosphere to the apparent radiance is coupled, and for accurate aerosol inversion, the surface contribution must be accurately described [20,36]. We studied the sensitivity of the intensity information and polarization information of different channels to aerosols through sensitivity experiments, including common VIS-NIR bands of 490 nm, 670 nm, and 865 nm and the new channels of 1030 nm and 1640 nm. Degree of freedom for signal (DFS) can be used to characterize the content of information obtained from satellite observations for the inversion parameters [26]. The greater the content of information, the higher the expected inversion accuracy. Taking the parameters of the aerosol model and surface mode as the state vector, the content of information can be obtained. The aerosol model was selected as the coarse particle mode and the fine particle mode, respectively, the aerosol optical depth was 0.4, and the surface model adopted bare soil (for details refer to Appendix A). Figure 7 presents that the information content of intensity and polarization observations of 1030 nm band under the dominance of the fine mode are 8.60 and 9.27, while those of the 1640 nm band are 8.33 and 9.81. Similarly, under the dominance of the coarse mode, the total intensity and polarization observations in the 1030 nm band are 8.70 and 9.92, while those in the 1640 nm band are 8.33 and 9.93. Compared with the intensity information content, that of the polarization observation was greatly improved. The contents of information of polarized 1030 nm and 1640 nm bands are larger than the VIS-NIR bands. Additionally, from the comparison of the two modes, the two polarization bands of 1030 nm and 1640 nm of the MAPI have more advantages in detecting coarse aerosols.

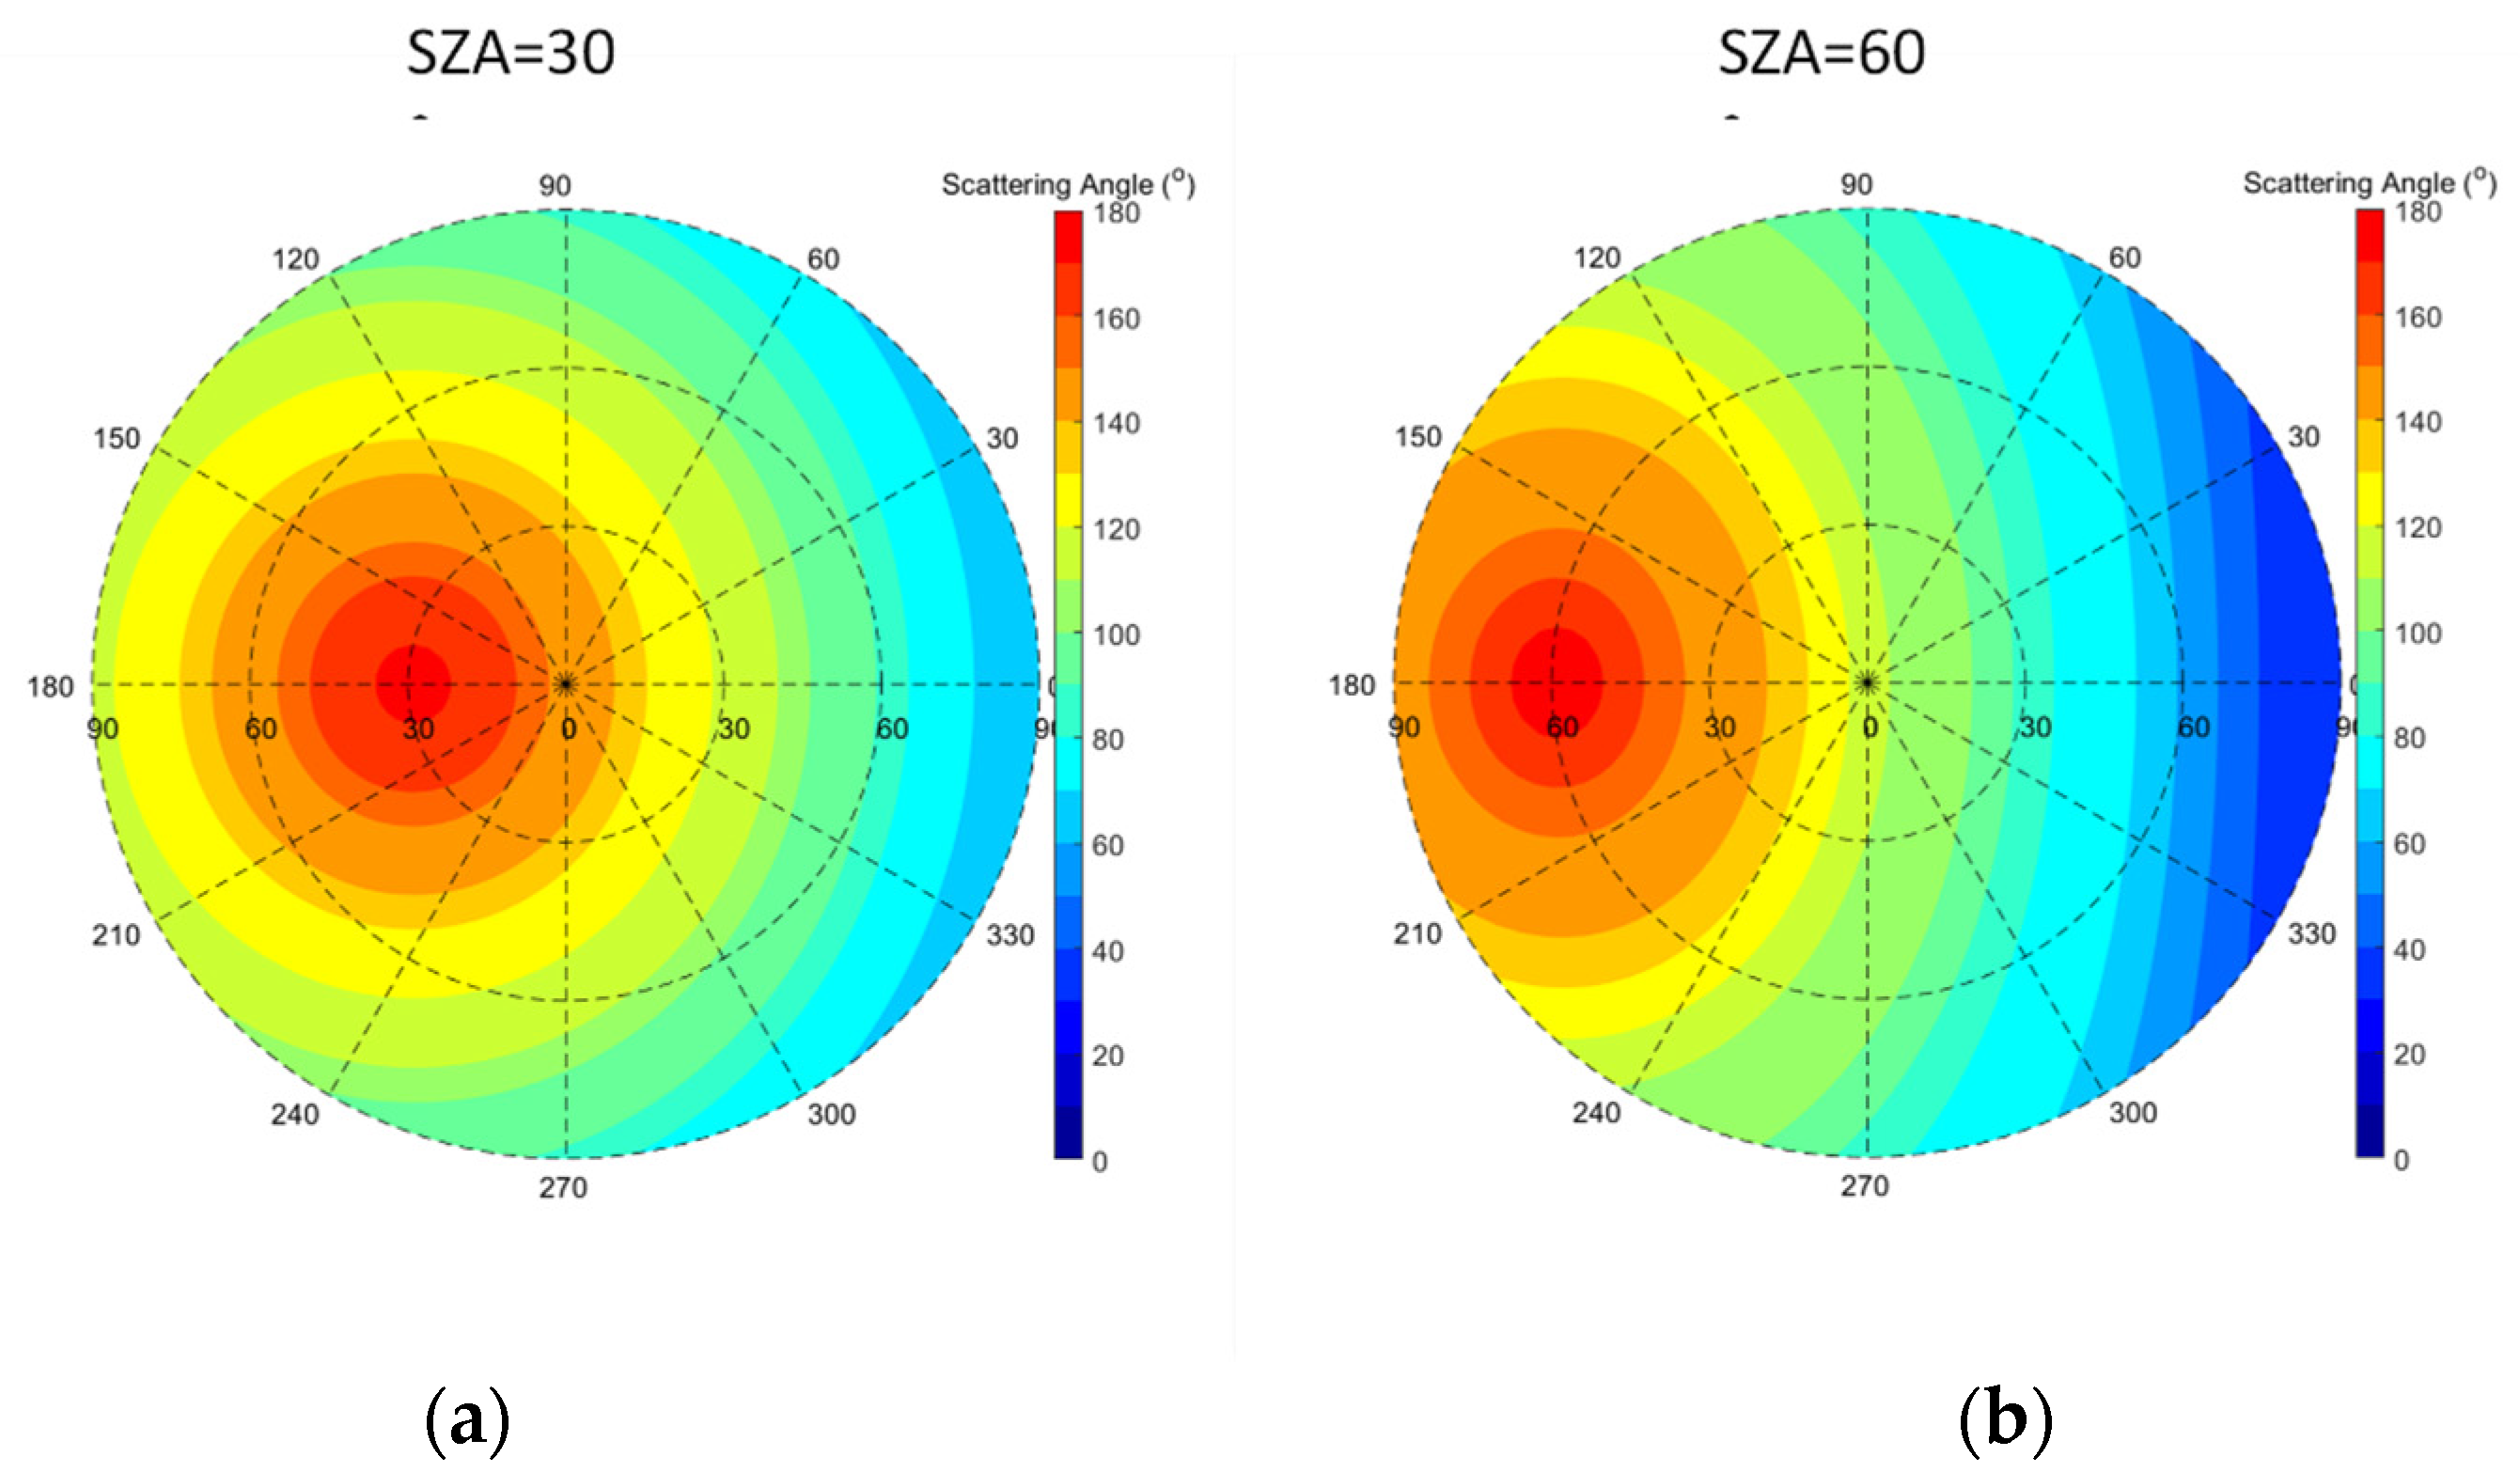
3.3. Unique Advantages of Non-Sun-Synchronous Orbits

The atmospheric particle microphysical parameters are highly correlated to radiometric characterization, as the function of the scattering angle of the particle, and some of the signature scattering phenomena, are only presented at the specific scattering angle, such as the cloudbow [1]. For example, the effective radius of most large cloud droplet particles is often overestimated due to the lack of observations in the primary cloudbow region [9], as shown in Figure 6. Polarization observations under different geometry conditions can be obtained in the non-sun-synchronous orbit, which is of unique significance for the observations of vector radiation [8]. As in the scattering angle simulation shown in Figure 8, when the sun zenith angle (SZA) is 30°, the scattering angles greater than 140° (related to cloudbow) are only distributed around the view zenith angle (VZA) of 5°–55° and relative azimuth angle (RAA) of 120°–240°, while when the SZA is 60°, the scattering angles greater than 140° are distributed around VZA of 35°–85° and RAA of 150°–210°. Therefore, as sun zenith angles vary in non-sun-synchronous inclined orbits, the distribution of scattering angles of atmospheric particles observed by the MAPI changes. Combined with the multi-angle observation characteristics of polarization imagers, the observation range of scattering angles of atmospheric particle is expanded, which contributes to the retrieval of atmospheric particle characteristics.

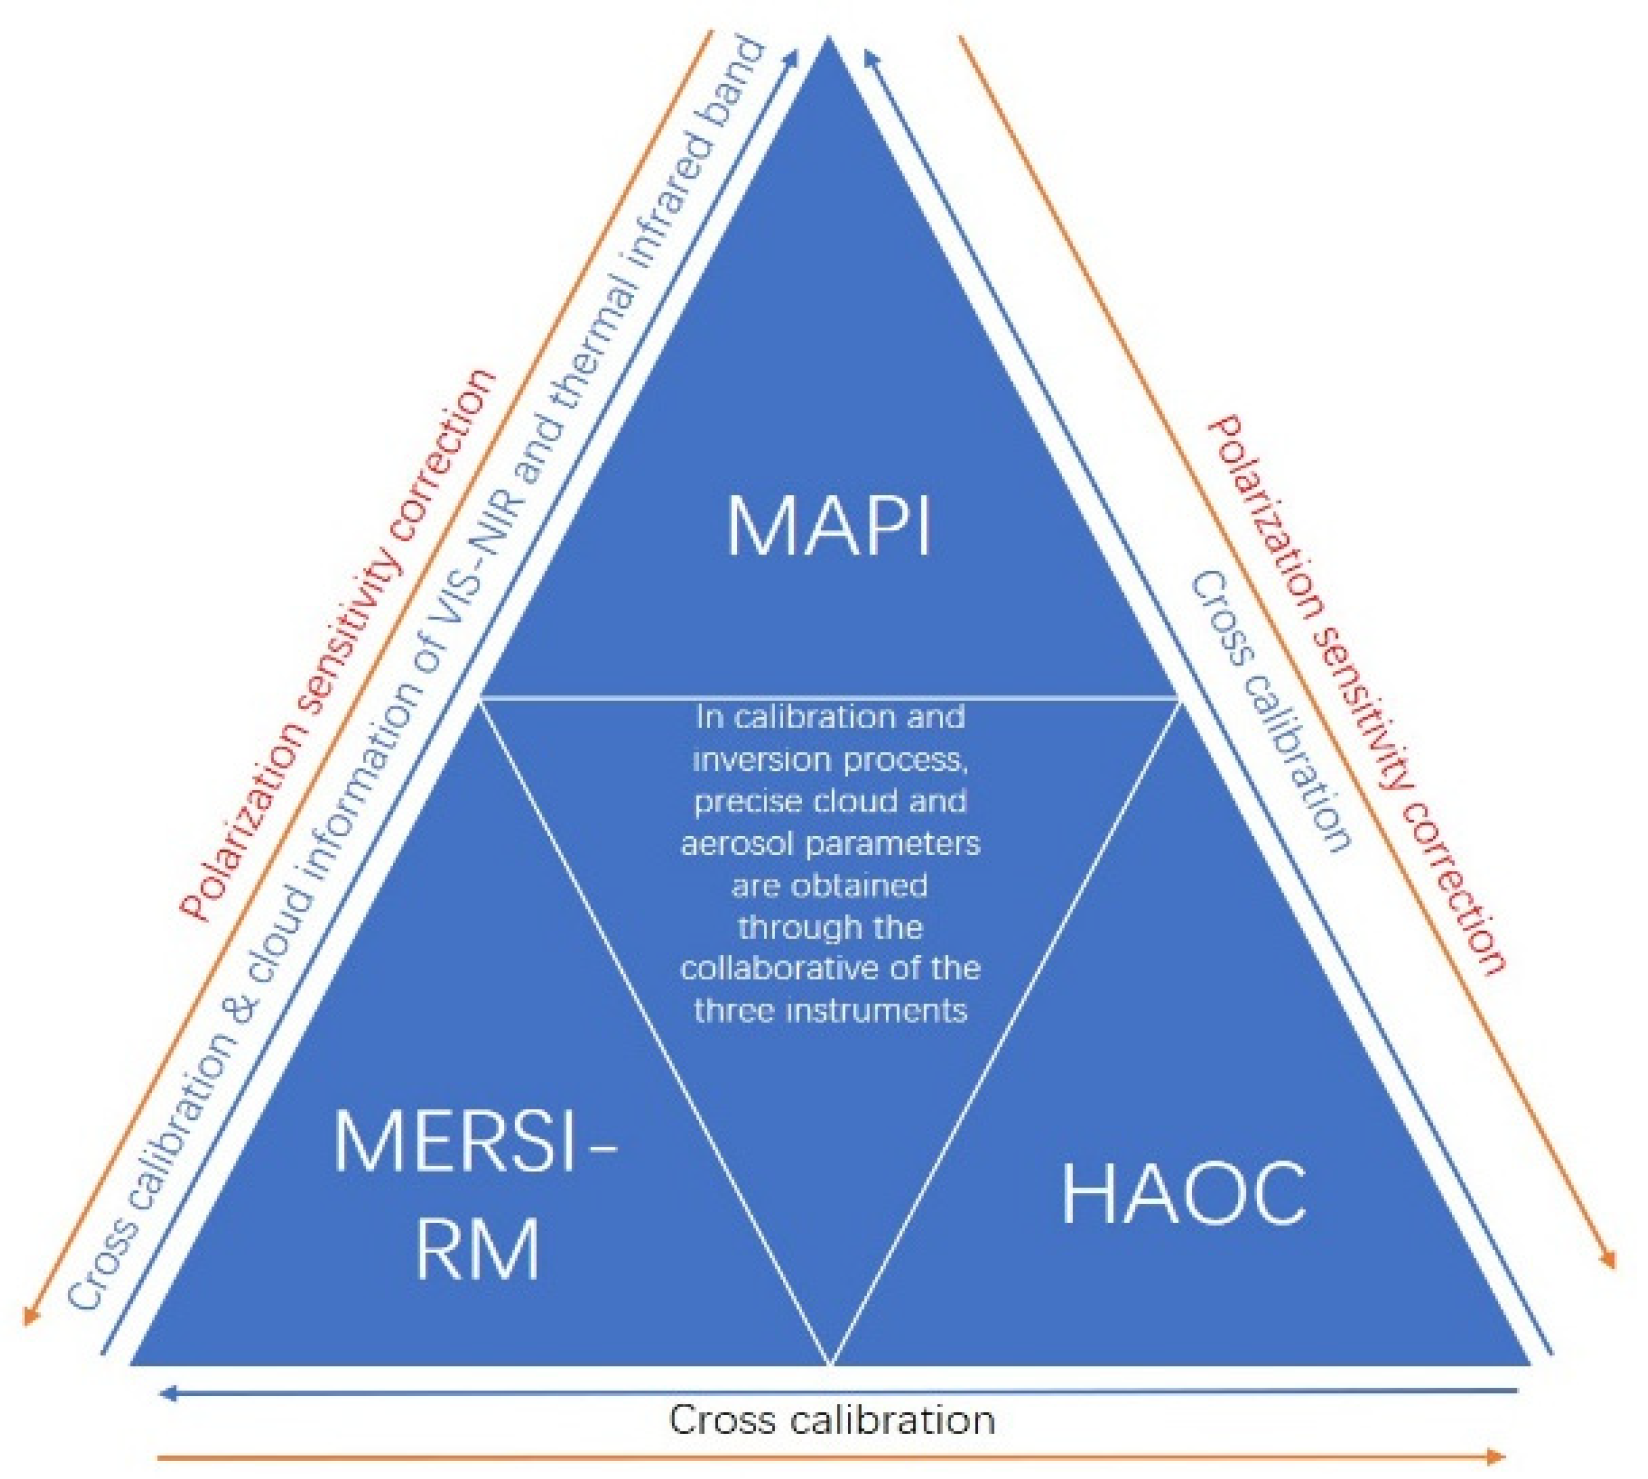
3.4. Collaborative Observation of the Optical Instruments

The collaborative observation of the MAPI, MERSI-RM, and HAOC is shown in Figure 9. MERSI-RM can provide the MAPI the observed cloud information of VIS-NIR and a thermal infrared band with higher spatial resolution. During orbital operation, cross calibration of radiometric measurements between three instruments is designed to transfer higher radiometric measurement accuracy to the MAPI. On the other hand, the polarimetric characterization of incident light observed by the MAPI can be used for the polarization sensitivity correction for MERSI-RM and HAOC. Therefore, the collaborative of the three optical instruments will improve the retrieval accuracy of clouds and aerosols.

4. Conclusions

The multi-angle polarization imager (MAPI) onboard the Fengyun-3 precipitation satellite will be launched in 2023. This study introduces the observational characteristics of the new instrument and demonstrates the unique advantage of characterizing clouds and aerosols among the existing polarization imagers.
The MAPI is a new airborne imaging polarimeter for clouds and aerosols, serving the observation chain of aerosol–cloud–precipitation. The MAPI operates in a non-sun-synchronized inclined orbit and provides images with a spatial resolution of 3 km (sub-satellite) and a swath of 700 km. This instrument is a POLDER-like polarimeter, but can measure the linear degree of polarization of 1030 nm, 1370 nm and 1640 nm with 14 view angles. In-flight radiometric and polarimetric calibration strategies are introduced, aiming to achieve radiometric accuracy of 5% and polarimetric accuracy of 2%.
Simulation experiments show that for cloud observation, the polarization phase functions of the 1030 nm and 1640 nm around the scattering angle of cloudbows show strong sensitivity to cloud droplet radius and effective variance, and stronger than that of 865 nm. For aerosol observation, the polarized channels of 1030 nm and 1640 nm have a higher content of information than VIS-NIR polarized channels. The unique observation geometry of non-sun-synchronous orbits and collaboration with other instruments on the same platform will enhance the accuracy of the calibration and retrieval of the MAPI. Therefore, the multi-angle polarization measurement of the new SWIR channel can optimize cloud phase identification and water cloud droplet effective inversion, as well as aerosol retrieval.
However, the observation channel of the MAPI onboard the Fengyun-3 satellite is limited, mainly focusing on the SWIR channel, and the combined use of the VIS-NIR channel needs collaborative observation with DPC or MERSI. On the planned Fengyun-5 satellite platform, the next-generation polarization imager will be an earth observation tool with sufficient detection channels and high measurement accuracy. The results obtained from the simulations in this study will provide support for the design of the next generation of polarized imagers of China.

Author Contributions

H.W.: Methodology, Writing–Original Draft Preparation. P.Z. and S.G.: Funding and Supervision. Z.L. and X.H.: Supervision and Conceptualization. D.Y., H.S. and H.X.: Observation and Methodology. J.S.: Writing—Reviewing and Editing. All authors have read and agreed to the published version of the manuscript.

Funding

This research was funded by The International Space Water Cycle Observation Constellation Program (Grant No.183311KYSB20200015), the third batch of Fengyun-3 meteorological satellite projects; the National Satellite Meteorological Center Youth Talent Fund.

Data Availability Statement

Not applicable.

Acknowledgments

The work of the aerosol information content analysis by Weizhen Hou and Haoren Gu is appreciated. We acknowledge the work of colleges of Shanghai Institute of Satellite Engineering and Shanghai Institute of Technical Physics who was involved with the new satellite. Some picture elements used in Figure 2 and Figure 3 are from the Internet, and I would like to express my thanks to these creators. In addition, thanks to the reviewers and editor for their helpful comments.

Conflicts of Interest

The authors declare no conflict of interest.

Appendix A. The Parameters of Aerosol Simulation Experiments

In this study, the settings of all bands are shown in Table A1. Table A2 presents the microphysical parameters of the aerosol model of the coarse and fine model aerosols following a bimodal lognormal distribution function, including the refractive indices of real parts ( m r ) and imaginary parts ( m i ), the effective radius ( r eff ) and variance ( V eff ), as well as fine mode fraction ( FMF V ). The surface model adopts an improved BRDF model of bare land surface. The specific parameters are shown in Table A3. The values in parentheses are the errors of the parameters.
Table A1. Basic characteristics of sensor.
Equipment Parameters
Central wavelength/nm490 nm, 670 nm, 865 nm, 1030 nm, 1640 nm
PolarizationI, Q, U
Pol. Cal. Error0.02
Rad. Cal. Error5% (VNIR), 5% (SWIR)
Multi-angle15
Table A2. The aerosol model parameters.
Scenarios m r  (550 nm) m i  (550 nm) r e f f /μm V e f f F M F V
Fine-dominated1.44 (0.15)0.011 (0.01)0.21 (80%)0.25 (80%)0.8
Coarse-dominated1.55 (0.15)0.003 (0.005)1.90 (80%)0.41 (80%)0.2
Table A3. The surface model parameters.
Surface Typefiso (λ)k1k2
Bare soil0.105 (0.0224), 0.276 (0.0207), 0.355 (0.2119), 0.415 (0.137), 0.446 (0.126)0.158 (80%)0.547 (80%)
The values of the surface model parameter f i s o ( λ ) correspond to 490 nm, 670 nm, 865 nm, 1030 nm, and 1640 nm, respectively.

References

  1. Parol, F.; Buriez, J.C.; Vanbauce, C.; Riédi, J.; Doutriaux-Boucher, M.; Vesperini, M.; Sèze, G.; Couvert, P.; Viollier, M.; Bréon, F.M. Review of capabilities of multi-angle and polarization cloud measurements from POLDER. Adv. Space Res. 2004, 33, 1080–1088. [Google Scholar] [CrossRef]
  2. Husi, L.; Hiroshi, I.; Jerome, R.; Takashi, Y.; Laurent, C.; Anthony, J.; Takashi, M.; Miho, S. Investigation of ice particle habits to be used for ice cloud remote sensing for the GCOM-C satellite mission. Atmos. Chem. Phys. 2016, 16, 12287–12303. [Google Scholar]
  3. Luo, S.; Lu, C.; Liu, Y.; Gao, W.; Zhu, L.; Xu, X.; Li, J.; Guo, X. Consideration of initial cloud droplet size distribution shapes in quantifying different entrainment-mixing mechanisms. J. Geophys. Res. Atmos. 2021, 126, e2020JD034455. [Google Scholar] [CrossRef]
  4. Zhang, M.; Teng, S.; Di, D.; Hu, X.; Letu, H.; Min, M.; Liu, C. Information Content of Ice Cloud Properties from Multi-Spectral, -Angle and -Polarization Observations. Remote Sens. 2020, 12, 2548. [Google Scholar] [CrossRef]
  5. Hasekamp, O.P.; Landgraf, J. Retrieval of aerosol properties over land surfaces: Capabilities of multiple-viewing-angle intensity and polarization measurements. Appl. Opt. 2007, 46, 3332–3344. [Google Scholar] [CrossRef]
  6. Zhao, C.; Yang, Y.; Fan, H.; Huang, J.; Fu, Y.; Zhang, X.; Kang, S.; Cong, Z.; Letu, H.; Menenti, M. Aerosol Characteristics and Impacts on Weather and Climate over Tibetan Plateau. Natl. Sci. Rev. 2020, 7, 492–495. [Google Scholar] [CrossRef]
  7. Mishchenko, M.; Travis, L. Satellite retrieval of aerosol properties over the ocean using polarization as well as intensity of reflected sunlight. J. Geophys. Res. 1997, 102, 16989–17013. [Google Scholar] [CrossRef]
  8. Dubovik, O.; Li, Z.; Mishchenko, M.I.; Tanré, D.; Karol, Y.; Bojkov, B.; Cairns, B.; Diner, D.J.; Espinosa, W.R.; Goloub, P.; et al. Polarimetric remote sensing of atmospheric aerosols: Instruments, methodologies, results, and perspectives. J. Quant. Spectrosc. Radiat. Transf. 2019, 224, 474–511. [Google Scholar] [CrossRef]
  9. Shang, H.; Letu, H.; Bréon, F.-M.; Riedi, J.; Ma, R.; Wang, Z.; Nakajima, T.; Wang, Z.; Chen, L. An improved algorithm of cloud droplet size distribution from POLDER polarized measurements. Remote Sens. Environ. 2019, 228, 61–74. [Google Scholar] [CrossRef]
  10. Li, Z.; Hou, W.; Hong, J.; Fan, C.; Wei, Y.; Liu, Z.; Lei, X.; Qiao, Y.; Hasekamp, O.P.; Fu, G.; et al. The polarization crossfire (PCF) sensor suite focusing on satellite remote sensing of fine particulate matter PM2. 5 from space J. Quant. Spectrosc. Radiat. Transf. 2022, 286, 108217. [Google Scholar] [CrossRef]
  11. Levis, A.; Davis, A.B.; Schechner, Y.Y.; Loveridge, J. 3D cloud tomography and droplet size retrieval from multi-angle polarimetric imaging of scattered sunlight from above. In Proceedings of the SPIE Polarization Science and Remote Sensing X, San Diego, CA, USA, 1 August 2021; p. 11833-05. [Google Scholar]
  12. Li, J.; Ma, J.; Li, C.; Wang, Y.; Li, Z.; Hong, J. Multi-information collaborative cloud identification algorithm in Gaofen-5 Directional Polarimetric Camera imagery. J. Quant. Spectrosc. Radiat. Transf. 2021, 261, 107439. [Google Scholar] [CrossRef]
  13. Leroy, M.; Deuzé, J.L.; Bréon, F.M.; Hautecoeur, O.; Herman, M.; Buriez, J.C.; Tanre, D.; Bouffiès, S.; Chazette, P.; Roujean, J.L. Retrieval of atmospheric properties and surface bidirectional reflectances over land from POLDER/ADEOS. J. Geophys. Res. 1997, 102, 17023–17037. [Google Scholar] [CrossRef]
  14. Fan, X.; Goloub, P.; Deuzé, J.-L.; Chen, H.; Zhang, W.; Tanré, D.; Li, Z. Evaluation of PARASOL aerosol retrieval over North East Asia. Remote Sens. Environ. 2008, 112, 697–707. [Google Scholar] [CrossRef]
  15. Tanré, D.; Bréon, F.M.; Deuzé, J.L.; Dubovik, O.; Ducos, F.; François, P.; Goloub, P.; Herman, M.; Lifermann, A.; Waquet, F. Remote sensing of aerosols by using polarized, directional and spectral measurements within the A-Train: The PARASOL mission. Atmos. Meas. Tech. 2011, 4, 1383–1395. [Google Scholar] [CrossRef]
  16. Kahn, R.A.; Gaitley, B.J.; Martonchik, J.V.; Diner, D.J.; Crean, K.A.; Holben, B. Multiangle Imaging Spectroradiometer (MISR) global aerosol optical depth validation based on 2 years of coincident Aerosol Robotic Network (AERONET) observations. J. Geophys. Res. 2005, 110, D10S04. [Google Scholar] [CrossRef]
  17. Fougnie, B. Improvement of the PARASOL radiometric in-flight calibration based on synergy between various methods using natural targets. IEEE Trans. Geosci. Remote Sens. 2016, 54, 2140–2152. [Google Scholar] [CrossRef]
  18. Zhang, Y.; Hu, X.; Yin, D.; Gu, M. Onboard Polarization Calibration Technique of Multi-Angle Polarization Imager Based on Sun Glint from Ocean. Acta Opt. Sin. 2020, 40, 1528002. (In Chinese) [Google Scholar] [CrossRef]
  19. Wang, X.; Guo, Z.; Huang, Y.; Fan, H.; Li, W. A cloud detection scheme for the Chinese Carbon Dioxide Observation Satellite (TANSAT). Adv. Atmos. Sci. 2017, 34, 16–25. [Google Scholar] [CrossRef]
  20. Li, Z.; Hou, W.; Hong, J.; Zheng, F.; Luo, D.; Wang, J.; Gu, X.; Qiao, Y. Directional Polarimetric Camera (DPC): Monitoring aerosol spectral optical properties over land from satellite observation. J. Quant. Spectrosc. Radiat. Transf. 2018, 218, 21–37. [Google Scholar] [CrossRef]
  21. Fougnie, B.; Marbach, T.; Lacan, A.; Lang, R.; Schlüssel, P.; Poli, G.; Munro, R.; Couto, A.B. The multi-viewing multi-channel multi-polarisation imager—Overview of the 3MI polarimetric mission for aerosol and cloud characterization. J. Quant. Spectrosc. Radiat. Transf. 2018, 219, 23–32. [Google Scholar] [CrossRef]
  22. Li, H.; Zhang, L.; Shen, H.; Li, P. A variational gradient-based fusion method for visible and SWIR imagery. Photogramm. Eng. Remote Sens. 2012, 78, 947–958. [Google Scholar] [CrossRef]
  23. Gao, B.; Goetz, A.; Wiscombe, W. Cirrus cloud detection from airborne imaging spectrometer data using the 1.38 μm water vapor band. Geophys. Res. Lett. 1993, 20, 301–304. [Google Scholar] [CrossRef]
  24. Sun, L.; Mi, X.; Wei, J.; Wang, J.; Tian, X.; Yu, H.; Gan, P. A cloud detection algorithm-generating method for remote sensing data at visible to short-wave infrared wavelengths. ISPRS J. Photogramm. Remote Sens. 2017, 124, 70–88. [Google Scholar] [CrossRef]
  25. Min, M.; Matthias, J.; Eduardo, H.; Ana, P.; Barry, M.; Fred, M.; Samir, A. Improved MODIS aerosol retrieval using modified VIS/SWIR surface albedo ratio over urban scenes. IEEE Trans. Geosci. Remote Sens. 2010, 48, 983–1000. [Google Scholar]
  26. Hou, W.; Li, Z.; Wang, J.; Xu, X.; Goloub, P.; Qie, L. Improving remote sensing of aerosol microphysical properties by near-infrared polarimetric measurements over vegetated land: Information content analysis. J. Geophys. Res. Atmos. 2018, 123, 2215–2243. [Google Scholar] [CrossRef]
  27. Dlugach, J.M.; Mishchenko, M.I.; Veles, O.A. Applying orbital multi-angle photopolarimetric observations to study properties of aerosols in the Earth’s atmosphere: Implications of measurements in the 1.378 µm spectral channel to retrieve microphysical characteristics and composition of stratospheric aerosols. J. Quant. Spectrosc. Radiat. Transf. 2021, 261, 107483. [Google Scholar] [CrossRef]
  28. Zhang, P.; Chen, L.; Xian, D.; Xu, Z. Recent progress of Fengyun meteorology satellites. Chin. J. Space Sci. 2020, 40, 788–796. [Google Scholar] [CrossRef]
  29. Zhang, P.; Lu, Q.; Hu, X.; Gu, S.; Yang, L.; Min, M.; Chen, L.; Xu, N.; Sun, L.; Bai, W.; et al. Latest progress of the Chinese meteorological satellite program and core data processing technologies. Adv. Atmos. Sci. 2019, 36, 1027–1045. [Google Scholar] [CrossRef]
  30. Gu, S.N.; Wu, Q.; Yin, H.; Shang, J.; Sun, F.; Chen, L.; Zhang, P. Analysis and prospect of precipitation detection capability of Fengyun-3 meteorological satellite. J. Mar. Meteorol. 2022, 42, 1–10. [Google Scholar]
  31. Bret-Dibat, T.; Andre, Y.; Laherrere, J.M. Preflight calibration of the POLDER instrument. In Proceedings of the SPIE—The International Society for Optical Engineering, San Diego, CA, USA, 29 September 1995; Volume 2553, pp. 218–231. [Google Scholar]
  32. Hagolle, O.; Goloub, P.; Deschamps, P.-Y.; Cosnefroy, H.; Briottet, X.; Bailleul, T.; Nicolas, J.-M.; Parol, F.; Lafrance, B.; Herman, M. Results of POLDER in-flight calibration. IEEE Trans. Geosci. Remote Sens. 1999, 37, 1550–1566. [Google Scholar] [CrossRef]
  33. Toubbe, B.; Bailleul, T.; Deuze, J.L.; Goloub, P.; Hagolle, O.; Herman, M. In-flight calibration of the POLDER polarized channels using the Sun’s glitter. IEEE Trans. Geosci. Remote Sens. 1999, 37, 513–524. [Google Scholar] [CrossRef]
  34. Buriez, J.C.; Vanbauce, C.; Parol, F.; Goloub, P.; Herman, M.; Bonnel, B.; Fouquart, Y.; Couvert, P.; Seze, G. Cloud detection and derivation of cloud properties from POLDER. Int. J. Remote Sens. 1997, 18, 2785–2813. [Google Scholar] [CrossRef]
  35. Shang, H.; Letu, H.; Chen, L.; Riedi, J.; Ma, R.; Wei, L.; Labonnote, L.C.; Hioki, S.; Liu, C.; Wang, Z.; et al. Cloud thermodynamic phase detection using a directional polarimetric camera DPC. J. Quant. Spectrosc. Radiat. Transf. 2020, 253, 107–179. [Google Scholar] [CrossRef]
  36. Dubovik, O.; Fuertes, D.; Litvinov, P.; Lopatin, A.; Lapyonok, T.; Doubovik, I.; Xu, F.; Ducos, F.; Chen, C.; Torres, B.; et al. A Comprehensive Description of Multi—Term LSM for Applying Multiple a Priori Constraints in Problems of Atmospheric Remote Sensing: GRASP Algorithm, Concept, and Applications. Front. Remote Sens. 2021, 2, 706851. [Google Scholar] [CrossRef]
Figure 1. Picture of MAPI prototype and main component description.
Remotesensing 14 04855 g001
Figure 2. The observation chain of FY-3 precipitation measurement satellite.
Remotesensing 14 04855 g002
Figure 3. Schematic diagram of shortwave infrared multi-angle polarization observation capability of MAPI. Along the flight direction, a total of 14 observations were made to the same target, and each observation corresponds to a different area on the detector (as shown by the red line in the square detector). The gray disc represents the filter wheel, consisting of the filters and polarizers of 13 channels, where the arrows indicate the transmitting axis direction of the polarizers. Below the filter wheel is an optical lens with a large field of view.
Remotesensing 14 04855 g003
Figure 4. Measured DoLP of the sunlight region. The left image is the color image composited of 565 nm, 670 nm, and 865 nm, and the right image is measured DoLP curve corresponding to the three bands. The Y axis indicates the value of measured DoLP, while the X axis presents the number of samples corresponding to the red line in the left figure. The data are from MAI/TG.
Remotesensing 14 04855 g004
Figure 5. The cloudbow observed by polarization imager, (a) shown by total reflectance (I), with the color indicating the DN, and (b) shown by polarized reflectance ( I p o l ). The abscissa and ordinate of the image represent the row and column numbers in the frame of instrument coordinates.
Remotesensing 14 04855 g005
Figure 6. Simulations of the polarized phase function for different (a) cloud droplet effective radii (CDR) and (b) variance values (EV) for 1030 nm, as well as different (c) CDR and (d) EV for 1640 nm. The scattering range consists of the primary cloudbow (135°–145°) and supernumerary cloudbows (145°–165°).
Remotesensing 14 04855 g006
Figure 7. The content of information analysis for different bands, corresponding to fine-dominated aerosol (a) and coarse-dominated aerosol (b). The ordinate represents the degrees of freedom for signal (DFS), indicating the content of information.
Remotesensing 14 04855 g007
Figure 8. Distribution of scattering angles of atmospheric particles observed by instruments at different sun zenith angles (SZA) for (a) 30° and (b) 60°. The radial direction represents the view zenith angle (VZA), while the circumferential direction indicates the relative azimuth angle (RAA).
Remotesensing 14 04855 g008
Figure 9. Schematic diagram of collaborative observation of MAPI, MERSI-RM and HAOC.
Remotesensing 14 04855 g009
Table 1. Overview of launched and completed polarization imagers.
ChannelPOLDERMAI/TGCAPI/TanSatDPC/GF53MI/ESPMAPI/FY3Main Applications
Observation mode Area array wide anglesArea array wide anglesLine array push broom
single angle
Area array wide anglesArea array wide anglesArea
array
wide angles
PolarizedVIS-NIR 410 aerosol
443 aerosol
490 490490 aerosol/cloud/surface
565 555 surface albedo
670670670670670 aerosol
865865 865865 aerosol/cloud
SWIR 1030cloud/aerosol/surface
13701370cirrus
1640 16501640cloud/aerosol/surface
2130 cloud/surface
Non-polarizedVIS-NIR443 380443 aerosol
565 870565 surface albedo
763763 763763 cloud/aerosol height
765765 765754 cloud/aerosol height
910910 910910 water vapor
SWIR1020 1030cloud/aerosol/surface
1375 1370cirrus
1640cloud/aerosol/surface
Table 2. Specifications of MAPI.
TypeSpecifications
DetectorTwo-dimensional InGaAs
Spectral wavelengthSWIR 1030 nm, 1370 nm, 1640 nm
Orientation of the polarizer−60°/0°/60°
Polarization vectorStokes vector I/Q/U
Field of view±40° × ±40°
Sub-satellite resolution2.96 km (@407 km)
Observation swath700 km (@407 km)
Dynamic range>1
Radiation measurement accuracy>5%
Polarization measurement accuracy>0.02 (@P = 1)
Number of angles14
SNR≥600@Solar constant
Observation targetCloud and Aerosol
Table 3. Characteristics of the 6 designed MAPI bands.
ChannelSpectral Band/nmBandwidth/nmWedge PrismPolarization
1dark background\nono
21030P130+yes (+60°)
31030P230noyes (0°)
41030P330-yes (−60°)
51370P150+yes (+60°)
61370P250noyes (0°)
71370P350-yes (−60°)
81640P150+yes (+60°)
91640P250noyes (0°)
101640P350-yes (−60°)
11103030+no
12137030nono
13164050-no
Publisher’s Note: MDPI stays neutral with regard to jurisdictional claims in published maps and institutional affiliations.

