Article

Analysis of GNSS-Derived Tropospheric Zenith Non-Hydrostatic Delay Anomaly during Sandstorms in Northern China on 15th March 2021

1
College of Geodesy and Geomatics, Shandong University of Science and Technology, Qingdao 266590, China
2
The Institute of Oceanographic Instrumentation, Qilu University of Technology (Shandong Academy of Sciences), Qingdao 266100, China
*
Author to whom correspondence should be addressed.
Remote Sens. 2022, 14(18), 4678; https://doi.org/10.3390/rs14184678
Submission received: 22 August 2022 / Revised: 15 September 2022 / Accepted: 15 September 2022 / Published: 19 September 2022
(This article belongs to the Special Issue Remote Sensing in Space Geodesy and Cartography Methods)

Abstract

:
On the 15th of March 2021, the strongest sandstorm in a decade occurred in northern China, and had a great adverse impact on the natural environment and human health in northern China. Real-time monitoring of dust storms is becoming increasingly important. In order to effectively analyze the non-hydrostatic delay (ZNHD) anomaly during a sandstorm, the method based on GNSS-derived tropospheric ZNHD residual to monitor the sandstorm is proposed at the same time. We studied the relationship between ZNHD/PWV and PM10/PM2.5 in Beijing, Changchun, Pingliang and Zhongwei before and after sandstorms. The ZNHD time series was then decomposed by singular spectrum analysis (SSA) and the residuals were obtained. The relationship between the GNSS-derived ZNHD residual and PM10 was analyzed. The results show that the impact of the sandstorm on PM10 is greater than that on PM2.5. Before the sandstorm, the correlation between PM10 and ZNHD was low, less than 0.25. When the sandstorm occurred, the correlation between PM10 and ZNHD increased significantly, and the maximum was greater than 0.7. When the sandstorm ended, the correlation between PM10 and ZNHD decreased significantly. Through the relationship between the ZNHD residual and PM10, it can be found that when the peak-to-peak values of the ZNHD residual are all above 80 mm, sandstorms may occur. But Rainfall, snowfall, haze and other abnormal weather can also lead to ZNHD anomalies.

1. Introduction

A sandstorm, a collective name for sandstorm and dust storm, arises when a gust front or other strong wind blows loose sand and dirt from a dry surface. During the period of a sandstorm, particles are transported by saltation and suspension, causing turbid air and low visibility of less than 1km. A sandstorm will bring a lot of floating dust, among which particulate matter 10 (PM10), (2.5 to 10 microns particulate matter) and particulate matter 2.5 (PM2.5) (2.5 microns or less particulate matter) are two important indicators of sandstorm pollution. PM2.5 and PM10 consist of a variety of toxic and hazardous substances that can be breathed directly into the lungs and cause respiratory diseases, such as asthma and cardiovascular diseases [1,2]. A sandstorm, as a common natural disaster in northern China, jeopardizes the natural environment, national economy and people’s health [2,3,4,5,6]. As can be seen from Figure 1, from 14th of March to the morning of the 15th of March 2021, affected by the cold air, one of the worst sand and dust storms from Mongolia in a decade hit the central and western parts of Gansu, Inner Mongolia, northern Shanxi, northern Hebei, Beijing, Tianjin and other places in China, with a large environmental and economic impact and harmed air quality for millions of people. In many places, levels of the coarse particulate matter, PM10, were hazardous [7,8,9,10,11]. In Inner Mongolia, Gansu, Ningxia, northern Hebei and Beijing, PM10 peak concentration exceeded 5000 micrograms per cubic meter (μg/m3). The peak PM10 concentration in Beijing rose to over 9000 μg/m3, according to the China Meteorological Administration (CMA) [12]. Because sandstorms often originate in deserts, (like the Gobi), wastelands and other inaccessible areas with sudden occurrence and short duration, effective monitoring of sandstorms have become increasingly important.
Currently, weather stations and remote sensing satellites equipped with MODIS sensors are mainly used to monitor the occurrence and changes of sandstorms [13,14,15,16,17]. However, due to the limited number of weather stations and the uneven spatial distribution, the transit time of remote sensing satellites equipped with MODIS sensors in China is generally from 10:30 to 12:00 during daytime and from 21:30 to 23:30 at night. Therefore, the above methods may fail to realize a real-time monitoring and forecasting of unforeseen meteorological conditions such as sandstorms. In recent years, the rapid development of the Global Navigation Satellite System (GNSS) has provided large-scale, real-time, and high-precision tropospheric products by improving the temporal and spatial resolution, effectively eliminating the shortcomings of traditional detection technology and promoting the development of GNSS in the field of meteorology [18,19,20,21,22,23]. GNSS technique is widely applied in the monitoring of haze, rainstorm, typhoon and other disasters, as well as forest fires, and has achieved improved results in the field of numerical meteorological forecasting [24,25,26,27,28]. For example, Zhao et al. [29] proposed and applied the method of using PWV data retrieved by GPS to forecast precipitation during typhoons. Choy et al. [30] monitored the storms in Melbourne in 2010 based on the PWV data retrieved from GPS and achieved ideal results. Nykiel et al. [31] successfully monitored the location and development path of the storm by using the GNSS observation network. These advantages of the GNSS technique exactly make up for the insufficiency of using meteorological stations and remote sensing methods to monitor sand and dust storms. During the outbreak of sandstorms, the rapid increase in the amount of particles in the air will inevitably cause changes in the tropospheric delay of GNSS, which makes it possible for GNSS to monitor sandstorms. Therefore, the important practical significance can be accomplished by in-depth analysis of the relationship between sandstorms and tropospheric delay, and research on methods of using the GNSS technique to monitor sandstorms.
The zenith total delay (ZTD) estimated by GNSS is the sum of zenith hydrostatic delay (ZHD) and zenith wet delay (ZWD) (also called zenith non-hydrostatic delay (ZNHD) in surveying). The ZHD can be accurately calculated by modeling. The ZNHD needs to be estimated as an unknown parameter during data processing, which will cause the ZNHD to include the delay caused by both water vapor and particulate matters [27,28]. Therefore, the method of ZNHD is proposed to monitor the occurrence of sandstorms. Firstly, the singular spectrum analysis (SSA) method is used to decompose the time series of the ZNHD in which the principal components are subtracted, and the remaining components are used as residuals. Finally, the method of using the ZNHD is researched to monitor sandstorms. Section 2 describes the different datasets, with their characteristics, and the methodology used in this work. Processing results and analysis are presented in Section 3. Finally, the conclusion is given in Section 4.

2. Materials and Methods

2.1. Materials

In order to study the feasibility of using the GNSS technique to monitor the sandstorm weather in northern China in March 2021, we conducted research on GPS data of BJFS, GSPL, NXZW and CHAN stations from 20th February to 20th March 2021. The data sampling rate was 30 s. The GPS data of BJFS, CHAN and GSPL, NXZW stations was provided by the International GNSS Service (IGS) data center of Wuhan University (igs.gnsswhu.cn) and The China Earthquake Administration [32]. The BJFS, CHAN, GSPL and NXZW stations were located in Beijing, Changchun in Jilin province, Pingliang in Gansu province and Zhongwei in Ningxia Hui Autonomous Region, respectively, which were among the areas severely affected by sandstorms in March 2021.
The GAMIT/GLOBK 10.7 was used to estimate the precipitable water vapor (PWV) and the ZNHD. The Saastamoinen model [33] was used to accurately estimate the ZHD. The ZNHD and PWV were estimated once every hour. The ZNHD uncertainty of 37-day data at four stations output by GAMIT/GLOBK 10.7 was statistically analyzed, and the results are listed in Table 1.
It can be seen from Table 1 that the mean of the ZNHD uncertainty of the four stations was between 4.28 mm and 4.81 mm. We took 4.45 mm (mean of the ZNHD uncertainty of four stations) as the uncertainty of the ZNHD. The uncertainty of the ZTD product provided by the International GNSS Service (IGS) was 5 mm [34]. Thus, according to the law of error propagation, the precision of ZHD is about 2.27 mm. The equation of error propagation law is
m ZHD = m ZTD 2 m ZNHD 2
where m ZHD , m ZTD and m ZNHD are the uncertainty of the ZHD, uncertainty of the ZTD and uncertainty of the ZNHD, respectively.
By virtue of all data of PM10 and PM2.5 provided by the air quality online monitoring platform with 1 h time resolution of air quality, we studied PM10 data from Langfang Weather station in Hebei, PM2.5 data from Fangshan Meteorological station in Beijing, and PM10/PM2.5 data from Jingyuetan Meteorological station in Changchun, Pingliang and Zhongwei from the 20th of February to the 20th of March 2021.

2.2. Methodology

2.2.1. PWV Inversion Based on GNSS Data

GAMIT/GLOBK 10.7 was used to estimate ZNHD/PWV. When processing data with GAMIT/GLOBK 10.7, the parameters were set as follows: the cutoff height angle was set to 10; the epoch interval was set to 30 s. The tropospheric delay model and tropospheric mapping function were selected as Saastamoinen model and VMF1 model, respectively. Tropospheric parameters were estimated every hour; the FES2004 model and BERNE model were used for the ocean tidal correction model and the solar photo-pressure perturbation model, respectively. Firstly, GNSS data were processed to get the ZTD as an unknown parameter. The tropospheric model was used to calculate the ZHD which was then subtracted from ZTD to obtain ZNHD [35]. Finally, the empirical equation was used to get PWV inversion based on the GNSS data. The GNSS phase observation equation is [36,37]
L i , f j = ρ i j + c ( d t i d t j ) + M ZTD I i , f j + λ f N i , f j + ε i , f j
where i and f denote the receiver and signal frequency, respectively, j denotes the satellite, ρ i j is the geometry distance from receiver to satellite, c   is the speed of light in vacuum, d t i is the receiver clock offset, d t j is the satellite clock offset, and M is the troposphere mapping function. I i , f j is the slant ionosphere delay. λ f is the wavelength of phase observation. N i , f j is the phase ambiguity that is not an integer since it includes the receiver and satellite initial phase biases. ε i , f j contains other unmodelled errors for phase observation. ZHD was calculated using the Saastamoinen model [33]. The equation is
ZHD = 0.0022768 P 1 0.00266 COS ( 2 L ) 0.00028 H
where P, L and H are the GNSS station atmospheric pressure, latitude and the GPS station geodetic height in the unit of metre, respectively. Finally, ZNHD can be calculated by
ZWD = ZTD ZHD
The PWV can be obtained from the empirical Equation (5) [18,38]:
PWV = ZNHD Π
Π = 10 6 ρ w g s ( k 2 + ( k 3 T m ) )  
where Π   is the conversion factor, g s (gas constant) = 461 J·kg−1 K−1; ρ w is the density of liquid water; k 2 , k 3 (refraction constant), k 2 = 16.48 K/hPa, k 3 = (3.776 ± 0.014) ∗ 105 K2/hPa; and T m is the weighted average temperature of the troposphere.
T m = ( e T ) d z ( e T 2 ) d z
where, e is the water vapor pressure and T is the atmospheric temperature (K). The PWV in this paper is calculated by GAMIT/GLOBK 10.7, in which the water vapor pressure ( e ) and atmospheric temperature ( T ) were from the global pressure and temperature 2 wet (GPT2w) model. The   T m at 4 GNSS stations is shown in the Figure 2.

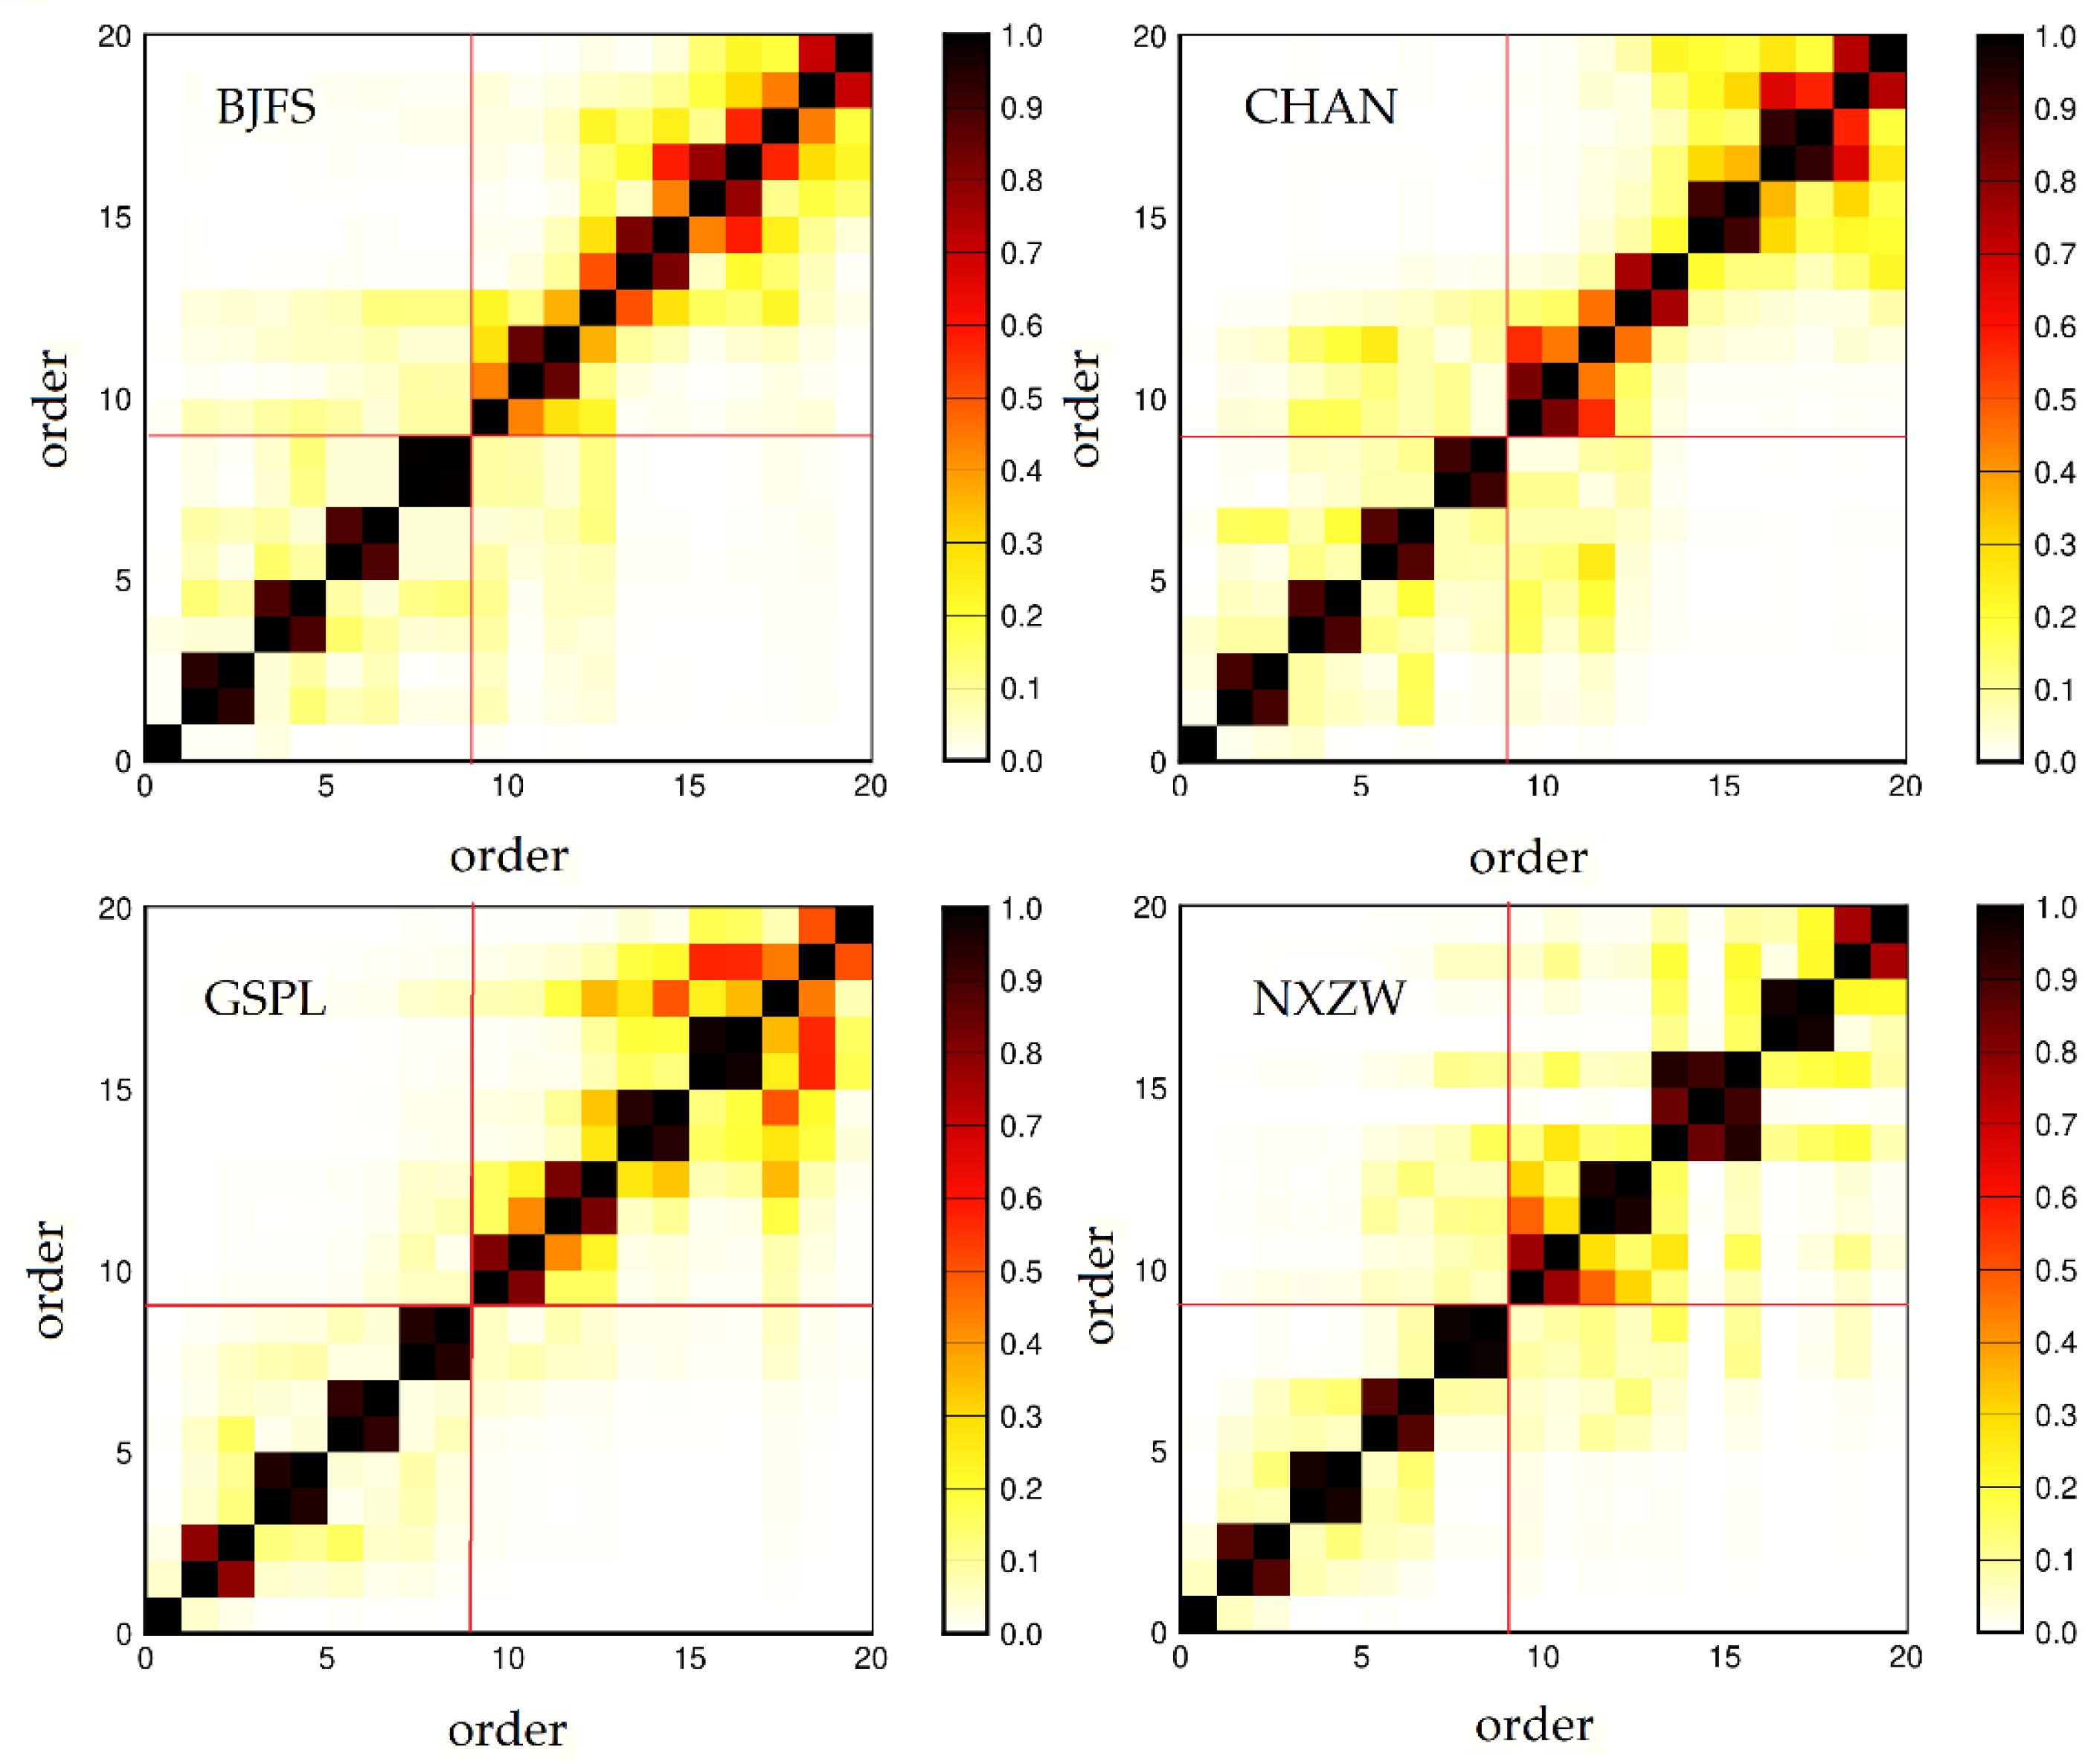
2.2.2. Singular Spectrum Analysis

As a digital signal processing technique, the SSA [39] has been applied in fields such as climatology, measurement [40], and oceanography [41,42,43]. SSA is an analysis and prediction method for nonlinear and nonstationary time series. It can extract valid information including slowly changing trends, oscillating components, noise, etc., from time series with unknown prior information.
Firstly, building the time-delay matrix, the ZNHD time series is X i =   [ x 1 , x 2 , x 3 , , x N ] . The window size M is generally greater than 1 and less than N/2, and a suitable M is selected to structure the trajectory matrix X of M × ( N     M + 1 ) . Let K = N     M + 1 . The trajectory matrix X is expressed as follows:
X =   [ X 1 : : X K ] = ( x i j ) i , j = 1 M , K =   [ x 1 x 2 x K x 2 x 3 x K + 1 x M x M + 1 x N ]
Secondly, singular values decomposition (SVD), there was a matrix S = XX T , λ 1 , , λ M   the eigenvalues of S arranged in descending order of magnitude as   λ 1 λ 2 λ M 0 , and the corresponding eigenvectors are U 1 , U 2 , U M , respectively. The matrices X i have rank 1; such matrices are sometimes called elementary matrices. The SVD of the time-delay matrix X can be expressed as:
X = X 1 + X 2 + + X d
where d = r a n k ( X ) , X i = λ i U i V i T , and V i = X T U i / λ i ( i = 1 , 2 , d ) . λ i   is a singular value of X i . The new matrix X ( r ) ( r < d ) can be constructed by selecting appropriate eigenvalues and corresponding eigenvectors. The collection ( λ i ,   U i ,   V i ) will be called i -th eigentriple (abbreviated as ET) of the SVD.
Thirdly, eigentriple grouping. The grouping procedure partitions the set of indices { 1 ,   ,   d } into m disjoint subsets I 1 ,   ,   I m . Let I = { i 3 , , i p }. Then the resultant matrix X I corresponding to group I is defined as X I = X I 1 + + X I p . The resultant matrices are computed for the groups   I = I 1 ,   ,   I m   and the expansion (7) leads to the decomposition
X = X I 1 + X I 2 + + X I m
The procedure of choosing the sets I 1 ,   ,   I m is called eigentriple grouping. If m = d and I j = {   j   } ,   j = 1 ,   ,   d , then the corresponding grouping is called elementary.
Fourthly, diagonal averaging. The purpose of diagonal averaging was to transform the decomposed elementary matrix X i into a new time series of length N , called the reconstruction component (RC), and the sum of all RCs was equal to the raw ZNHD time series x 1 , x 2 , x 3 , , x n . There is a matrix Z = X i , and z 1 , z 2 , , z N is the time series obtained by diagonal averaging of Z . Then the formula for diagonal averaging can be expressed as:
z i = { 1 i m = 1 k z m , i m + 1 1 i M 1 M m 1 L z m , i m + 1 M i K 1 N i + 1 m i K + 1 N K + 1 z m , i m + 1 K i N
where M = min ( M , K ) ,     K = max ( M , K ) , if M < K , then z i j = z i j , otherwise   z i j = z j i .
The various signals in the ZNHD time series after preprocessing are separated by SSA. The w-correlation method [44] was used to analyze the correlation between each reconstructed component. The reconstructed component with the same signal features was grouped, and the higher correlation part of the residual sequence was reconstructed. The reconstructed time series of each elementary matrix X k was defined as Y k which consists of elements y 1 k , y 2 k , , y N k . The correlation coefficients between each reconstructed time series can be expressed as:
ρ i , j w = ( Y k ( i ) , Y k ( j ) ) Y k ( i ) w Y k ( j ) w , ( 1 i , j N )
where Y k i w = ( Y k ( i ) , Y k ( i ) ) ,   ( Y k ( i ) , Y k ( j ) ) = k = 1 N w k y k i y k j . w k is the weight coefficient which can be defined as w k = min ( k , M , N k ) .

3. Results and Discussion

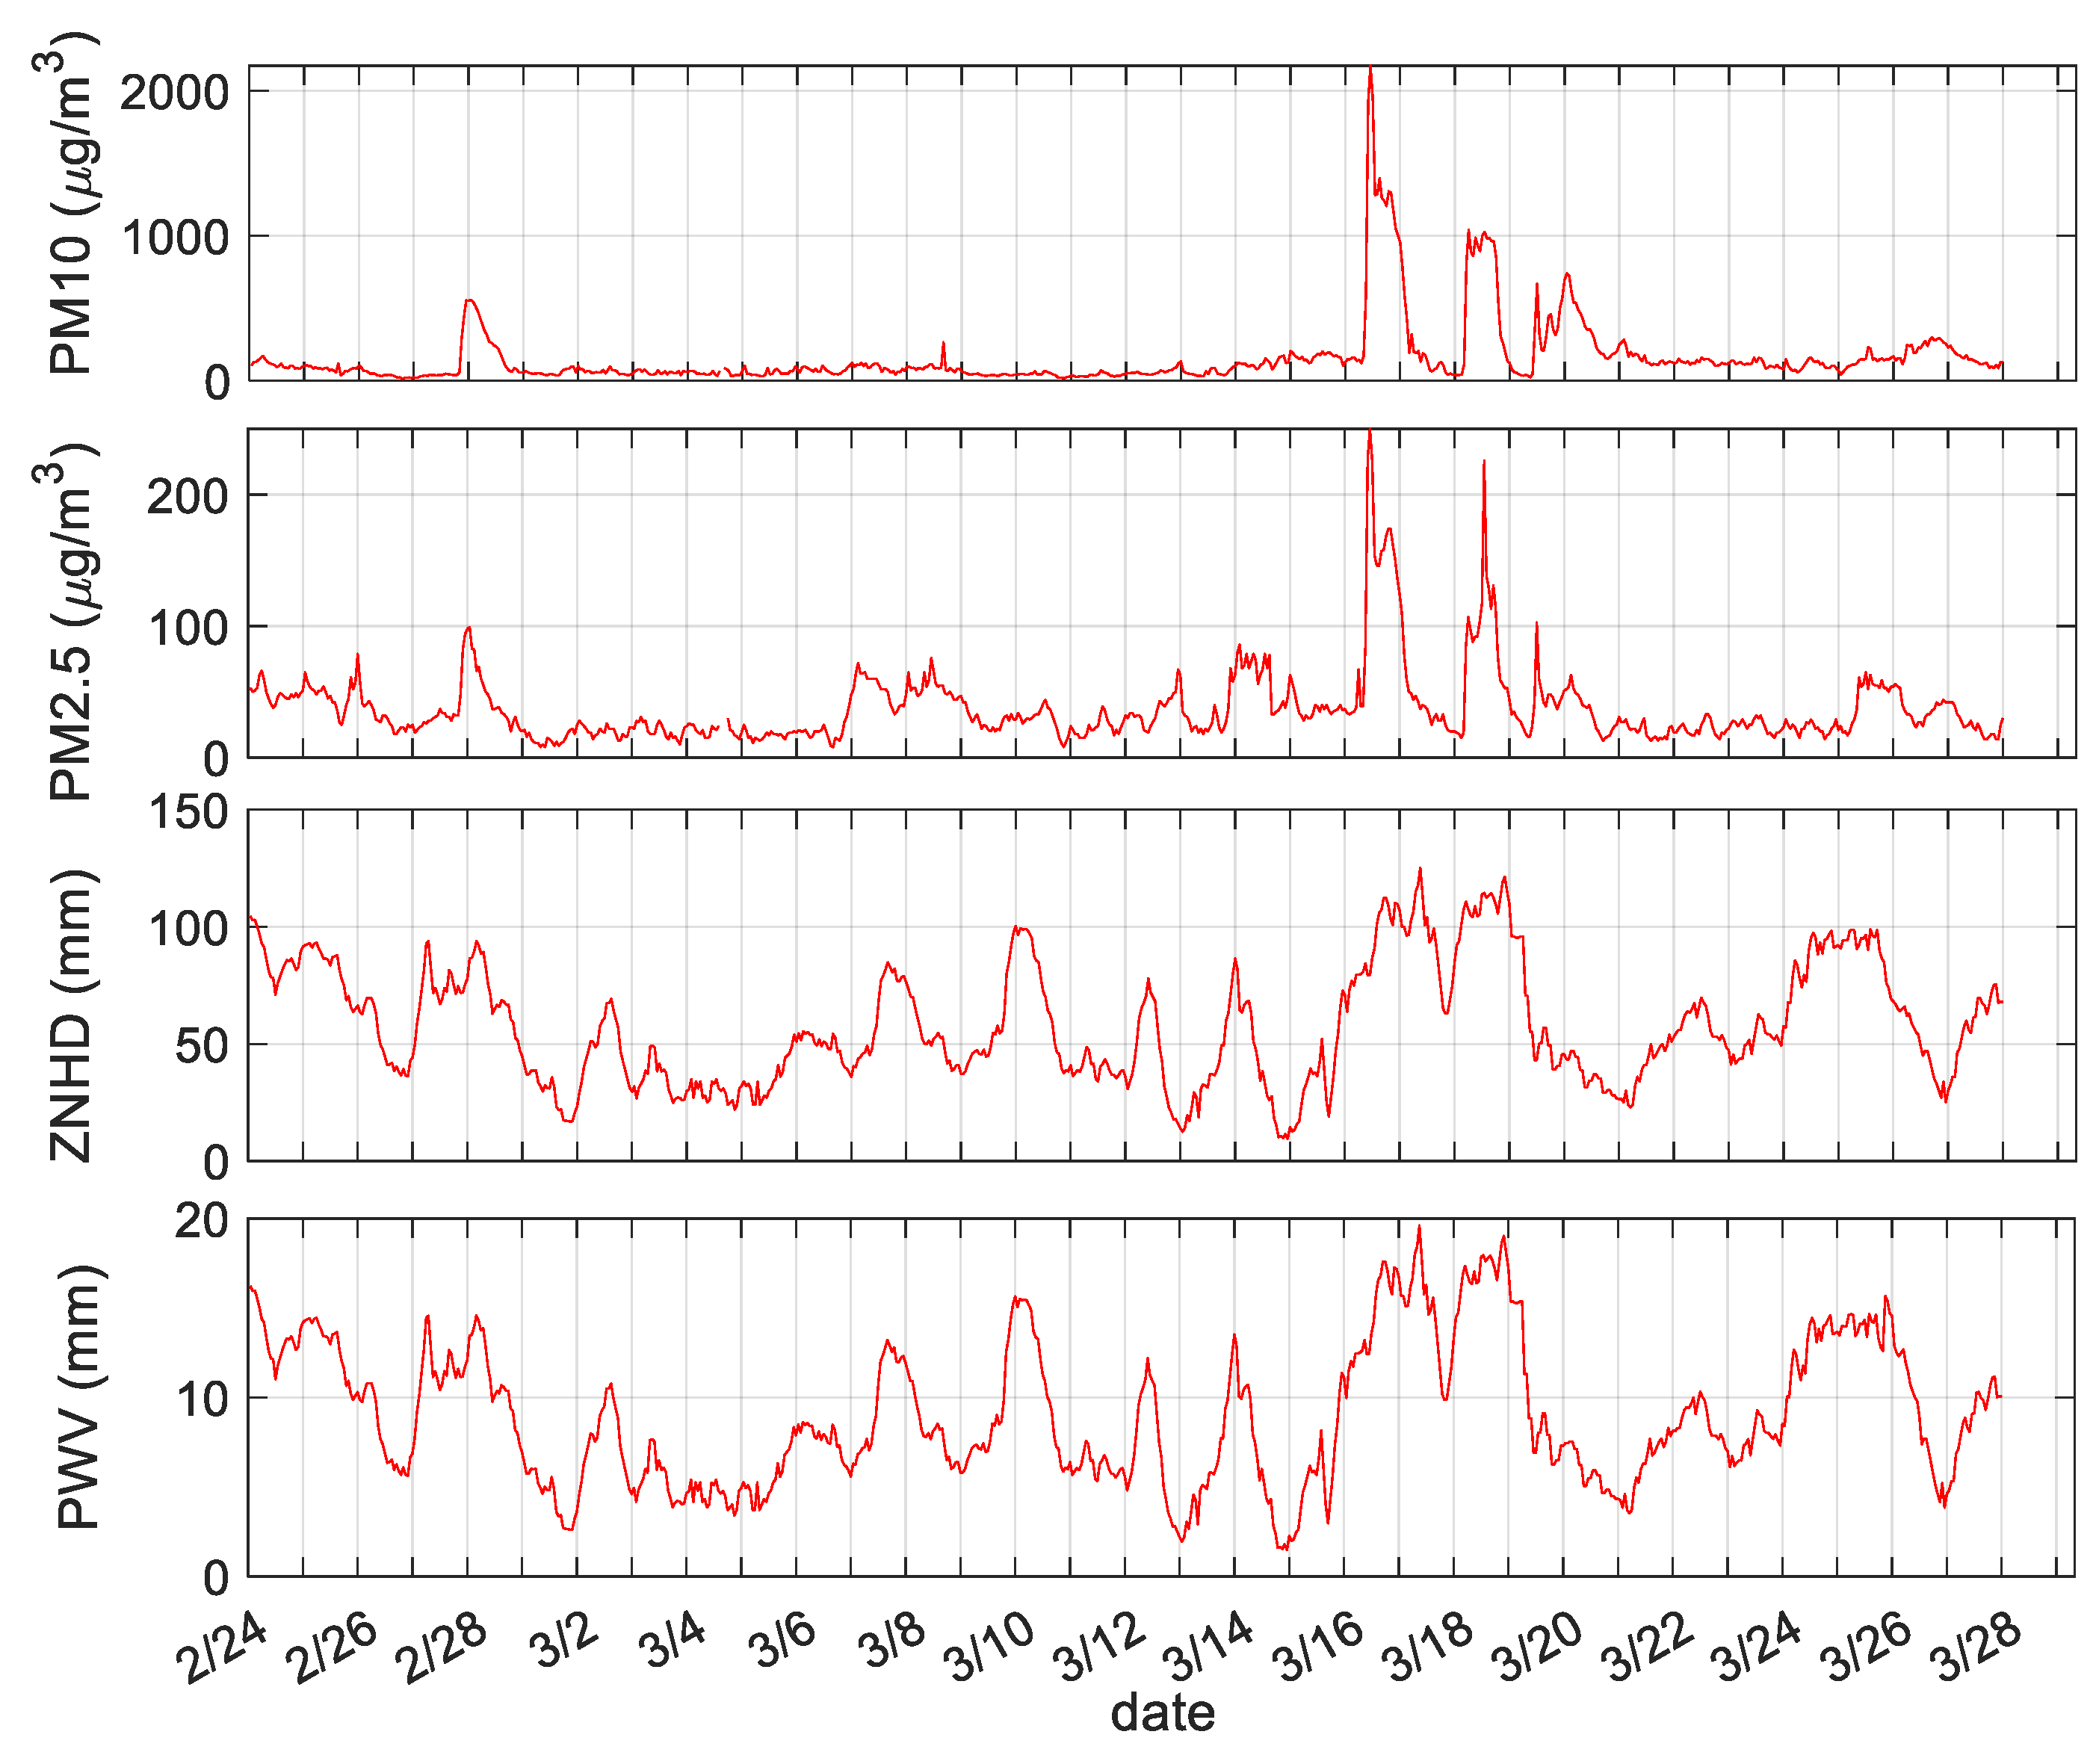
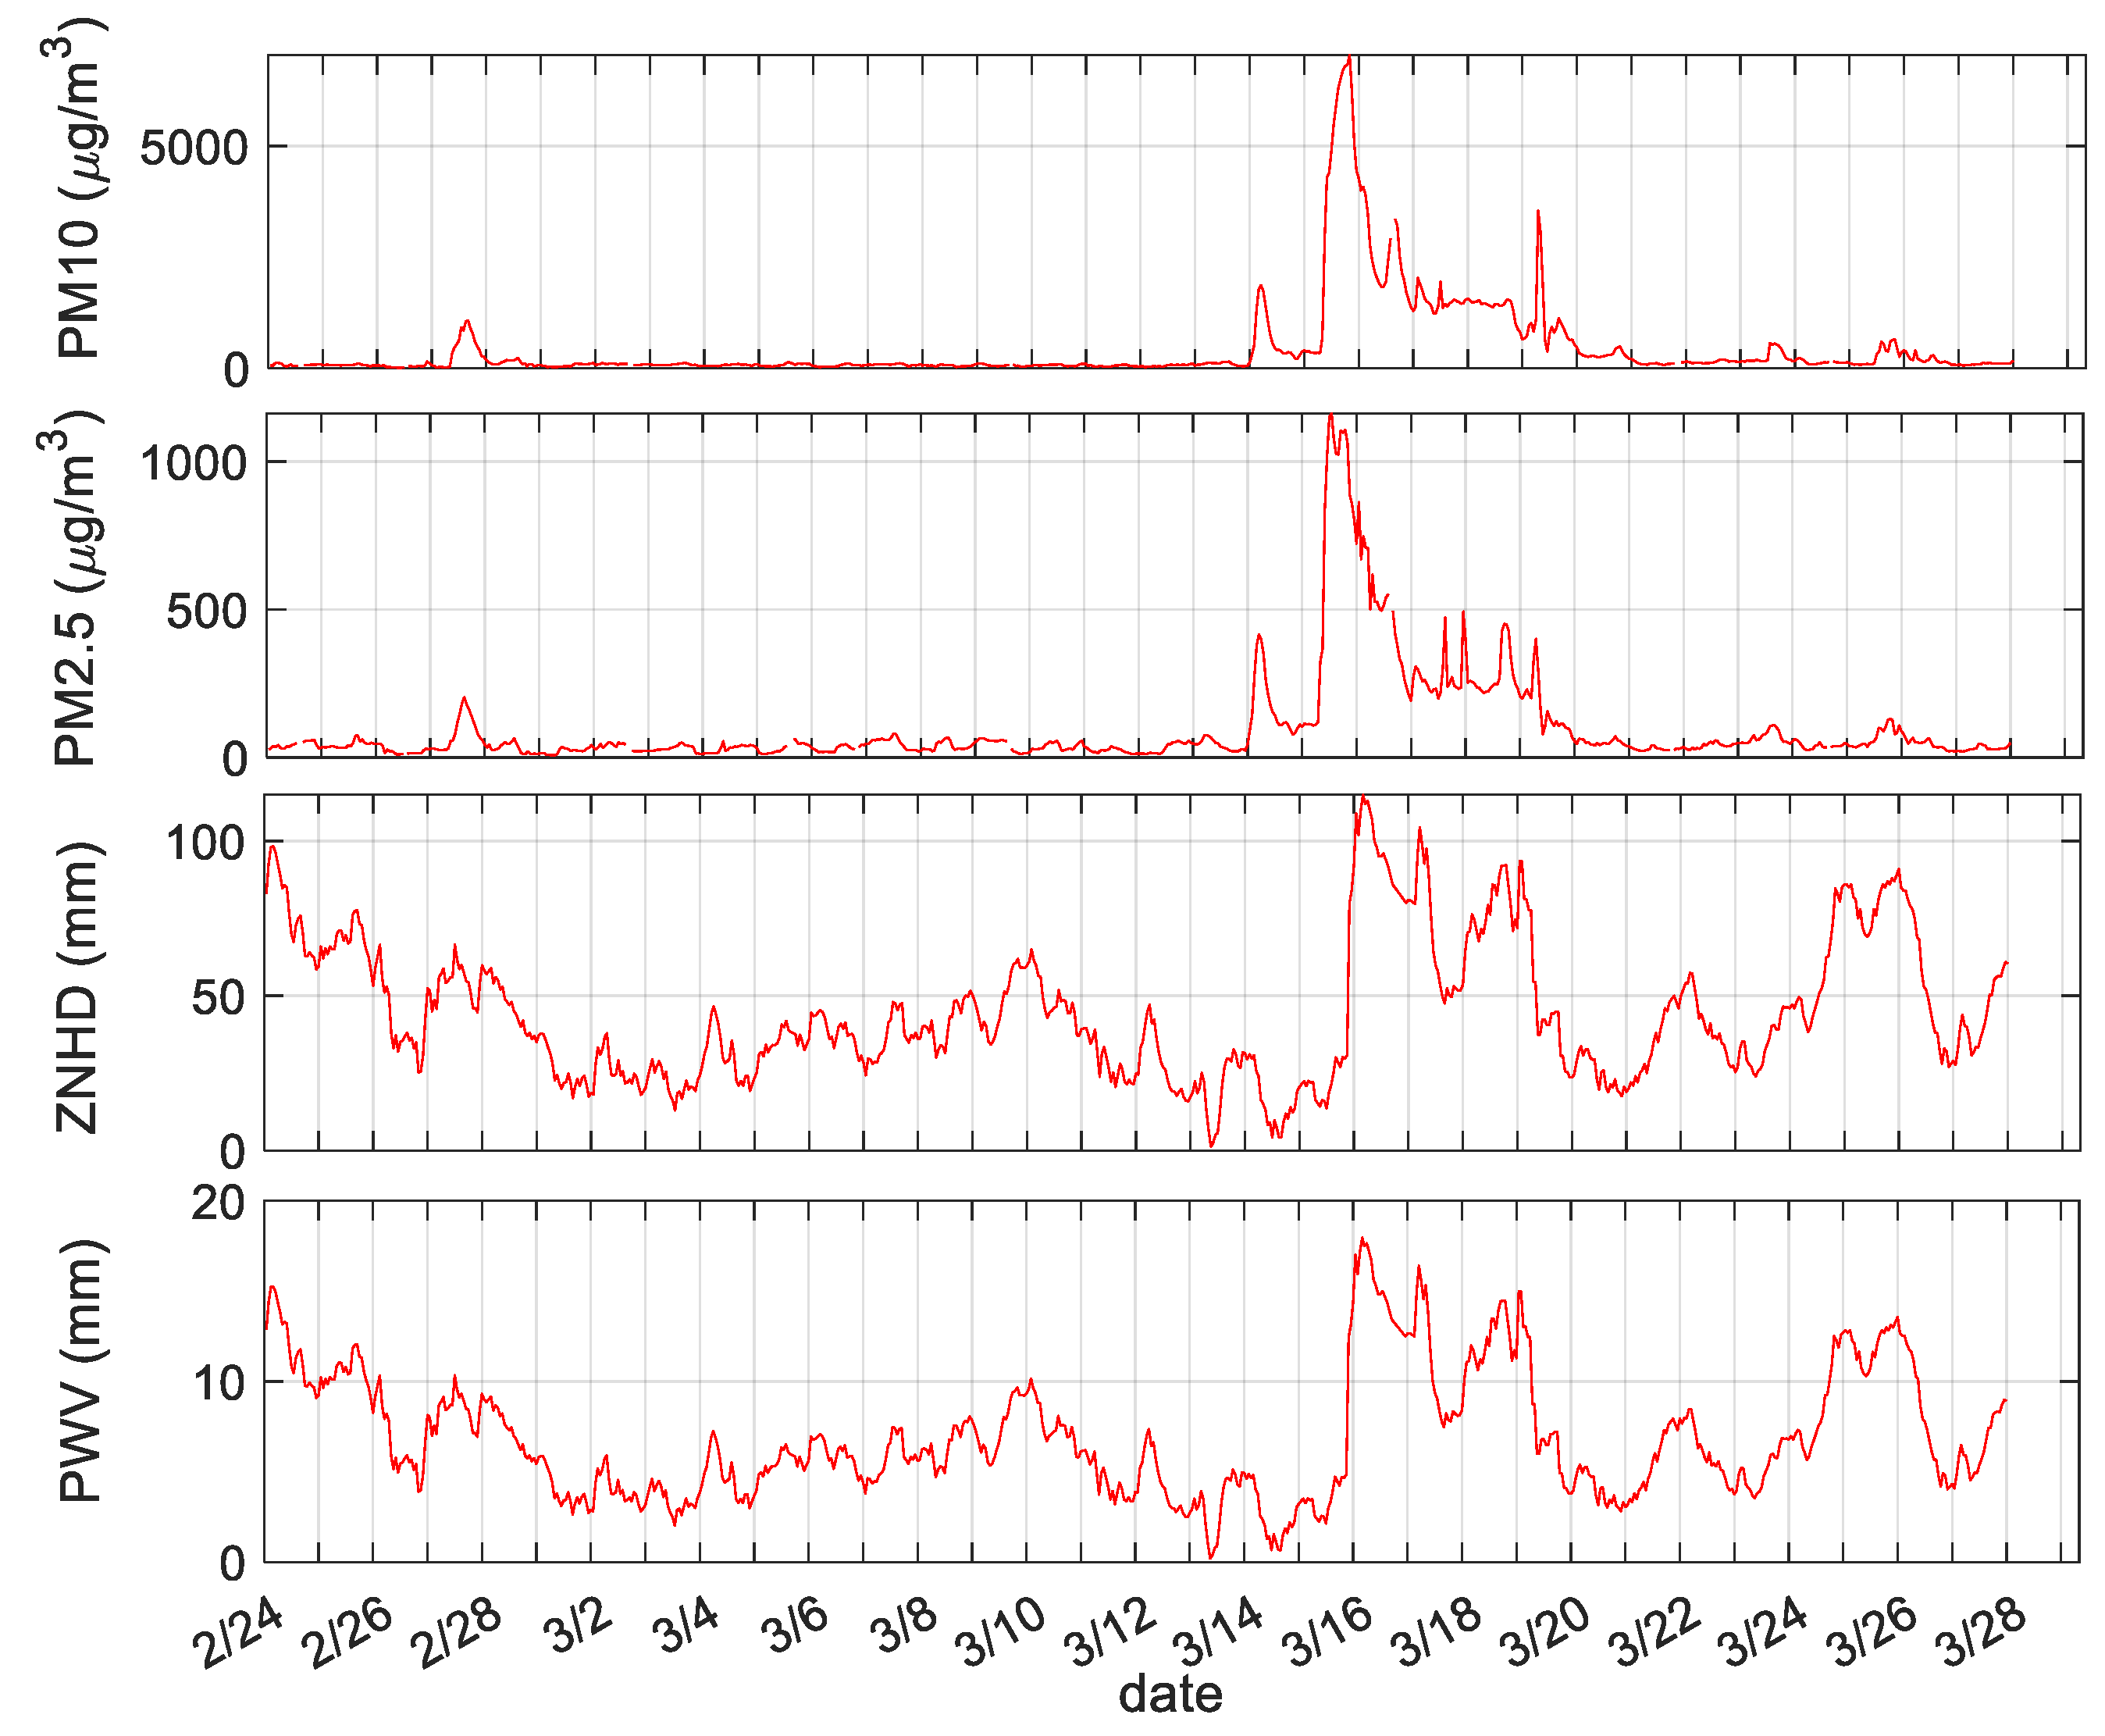
3.1. Relationship between ZNHD/PWV and PM2.5/PM10

It can be seen from Equations (6) and (7) that during the conversion from ZNHD(ZWD) to PWV, T m is a key coefficient, which changes with the water vapor pressure and atmospheric temperature in each region. Therefore, theoretically, ZNHD(ZWD) and PWV are different. Therefore, we analyzed the relationship between ZNHD/PWV and PM2.5/PM10, respectively.
Firstly, the change trends and correlations of ZNHD, PWV, PM10 and PM2.5 were analyzed before, during, and after the occurrence of sandstorms at the BJFS, GSPL, NXZW and CHAN stations. The results are shown in Figure 3, Figure 4, Figure 5 and Figure 6 and Table 2.
As can be seen from Figure 3, the concentrations of PM10 in Beijing was greater than 2300 μg/m3, about 11.2 times higher than usual. However, the change in PM2.5 was small, and the concentration of PM2.5 in Beijing reached approximately 330 μg/m3 when the sandstorm occurred. Between the 20th of February and the 14th of March the trends of ZNHD/PWV and PM10/2.5 at the BJFS station were relatively consistent; when the sandstorm occurred from the 15th of March to the 16th of March, the change consistency of ZNHD/PWV and PM10/2.5 reached an extremely high level; after the sandstorm from the 16th of March to the 20th of March the change of ZNHD/PWV and PM10/2.5 remained high. During the period from the 25th of March to the 27th of March ZNHD and PWV at BJFS station showed an obviously increasing trend. We know from the website of the China Meteorological Administration that there was obvious haze in Beijing during this period, which can also be reflected by PM2.5 data.
As can be seen from Figure 4, the concentrations of PM10 in Changchun are greater than 800 μg/m3, about seven times higher than usual. However, the change of PM2.5 in Changchun was not obvious, demonstrating that sandstorms mainly transfer large particles, with a greater impact on PM10, but less impact on PM2.5. Between the 20th of February and the 14th of March, the change trends of ZNHD/PWV and PM10/2.5 at Changchun station were relatively consistent; because the sandstorms in Changchun were mainly affected by large particles, exerting a relatively minor impact on PM2.5; when the sandstorm occurred from the 15th of March to the 16th of March the changes of ZNHD/PWV and PM10 possessed very high consistency, while the degree of compliance with PM2.5 failed to come up to a high level. From the 16th of March to the 20th of March after the sandstorms, the trends of ZNHD and PM10/2.5 had a relatively high consistency. During the period from the 26th of March to the 28th of March, ZNHD and PWV at CHAN station showed an obviously increasing trend. According to the website of the China Meteorological Administration, there was an obvious rainfall in Changchun during this period.
As can be seen from Figure 5, from the 27th of February to the 28th of February, a small-scale dust storm occurred in Zhongwei City, and both PM10/PM2.5 and ZNHD/PWV increased significantly. The concentrations of PM10 were greater than 7000 μg/m3, about 32 times higher than usual on the 15th of March 2021. The concentrations of PM2.5 were greater than 1000 μg/m3, about 7.5 times higher than usual on the 15th of March 2021. It can be seen that Zhongwei City in the Ningxia Hui Autonomous Region, was greatly affected by the sandstorm on the 15th of March 2021. On the 15th of March 2021, the change trend of ZNHD/PWV was very consistent with the change trend of PM10/PM2.5. The ZNHD and PWV exceed 100 mm and 15 mm respectively, reaching 2–3 times the usual. From the 25th of March to the 27th of March, ZNHD/PWV increased significantly. According to the website of the China Meteorological Administration, there was obvious rainfall and light haze in Zhongwei City during this period.
As can be seen from Figure 6, a small-scale dust storm occurred in Pingliang City on the 28th of February, and both PM10/PM2.5 and ZNHD/PWV increased significantly. The concentrations of PM10 were greater than 2000 μg/m3 on 15 March 2021, about 6.9 times higher than usual. The concentrations of PM2.5 were greater than 200 μg/m3 on the 15th of March 2021, about 2.4 times higher than usual. From the 16th of March to the 20th of March, the change trend of ZNHD/PWV is very consistent with the change trend of PM10/PM2.5. Both PM10/PM2.5 and ZNHD/PWV have obvious abnormalities from the 16th of March to the 20th of March. From the 25th of March to the 27th of March, ZNHD/PWV increased significantly. According to the website of the China Meteorological Administration, there was obvious rainfall in Pingliang City during this period.
In summary, the occurrence of sandstorms can be detected by using the GNSS-derived ZNHD/PWV. However, GNSS-derived ZNHD/PWV is also affected by abnormal weather such as rainfall, snowfall, and haze. Therefore, when using the GNSS-ZNHD to detect sandstorms, it is necessary to consider the impact of rain, snow and haze.
From the Figure 3, Figure 4, Figure 5 and Figure 6, sandstorms have a greater impact on PM10 than PM2.5, and the changes in ZNHD and PWV are highly consistent. Therefore, in order to discover the relationship more intuitively between ZNHD/PWV and PM10, we examined statistics of the correlation between ZNHD and PM10 before, during and after the occurrence of sandstorms. At the same time, we tested the significance level of α = 0.05 for the correlation coefficient. Except for the correlation coefficient between PM10 and ZNHD of BJFS station before sandstorm and the correlation coefficient between PM10 and ZNHD of Chan station after the sandstorm, all other correlation coefficients have passed the significance test. The statistical results are shown in Table 2.
According to Table 2, before sandstorms, the correlation between ZNHD and PM10 at four GNSS stations were low. This is mainly because the tropospheric delay caused by PM10 has little contribution to ZNHD, which is mainly caused by water vapor. The correlation between ZNHD and PM10 were increasing in significance when sandstorms occurred, for which the proportion of tropospheric delay caused by PM10 in ZNHD was obviously larger than that before the sandstorms. After the sandstorm, the correlation between PM10 and ZNHD decreased significantly, and the reason was similar to that before the sandstorm.

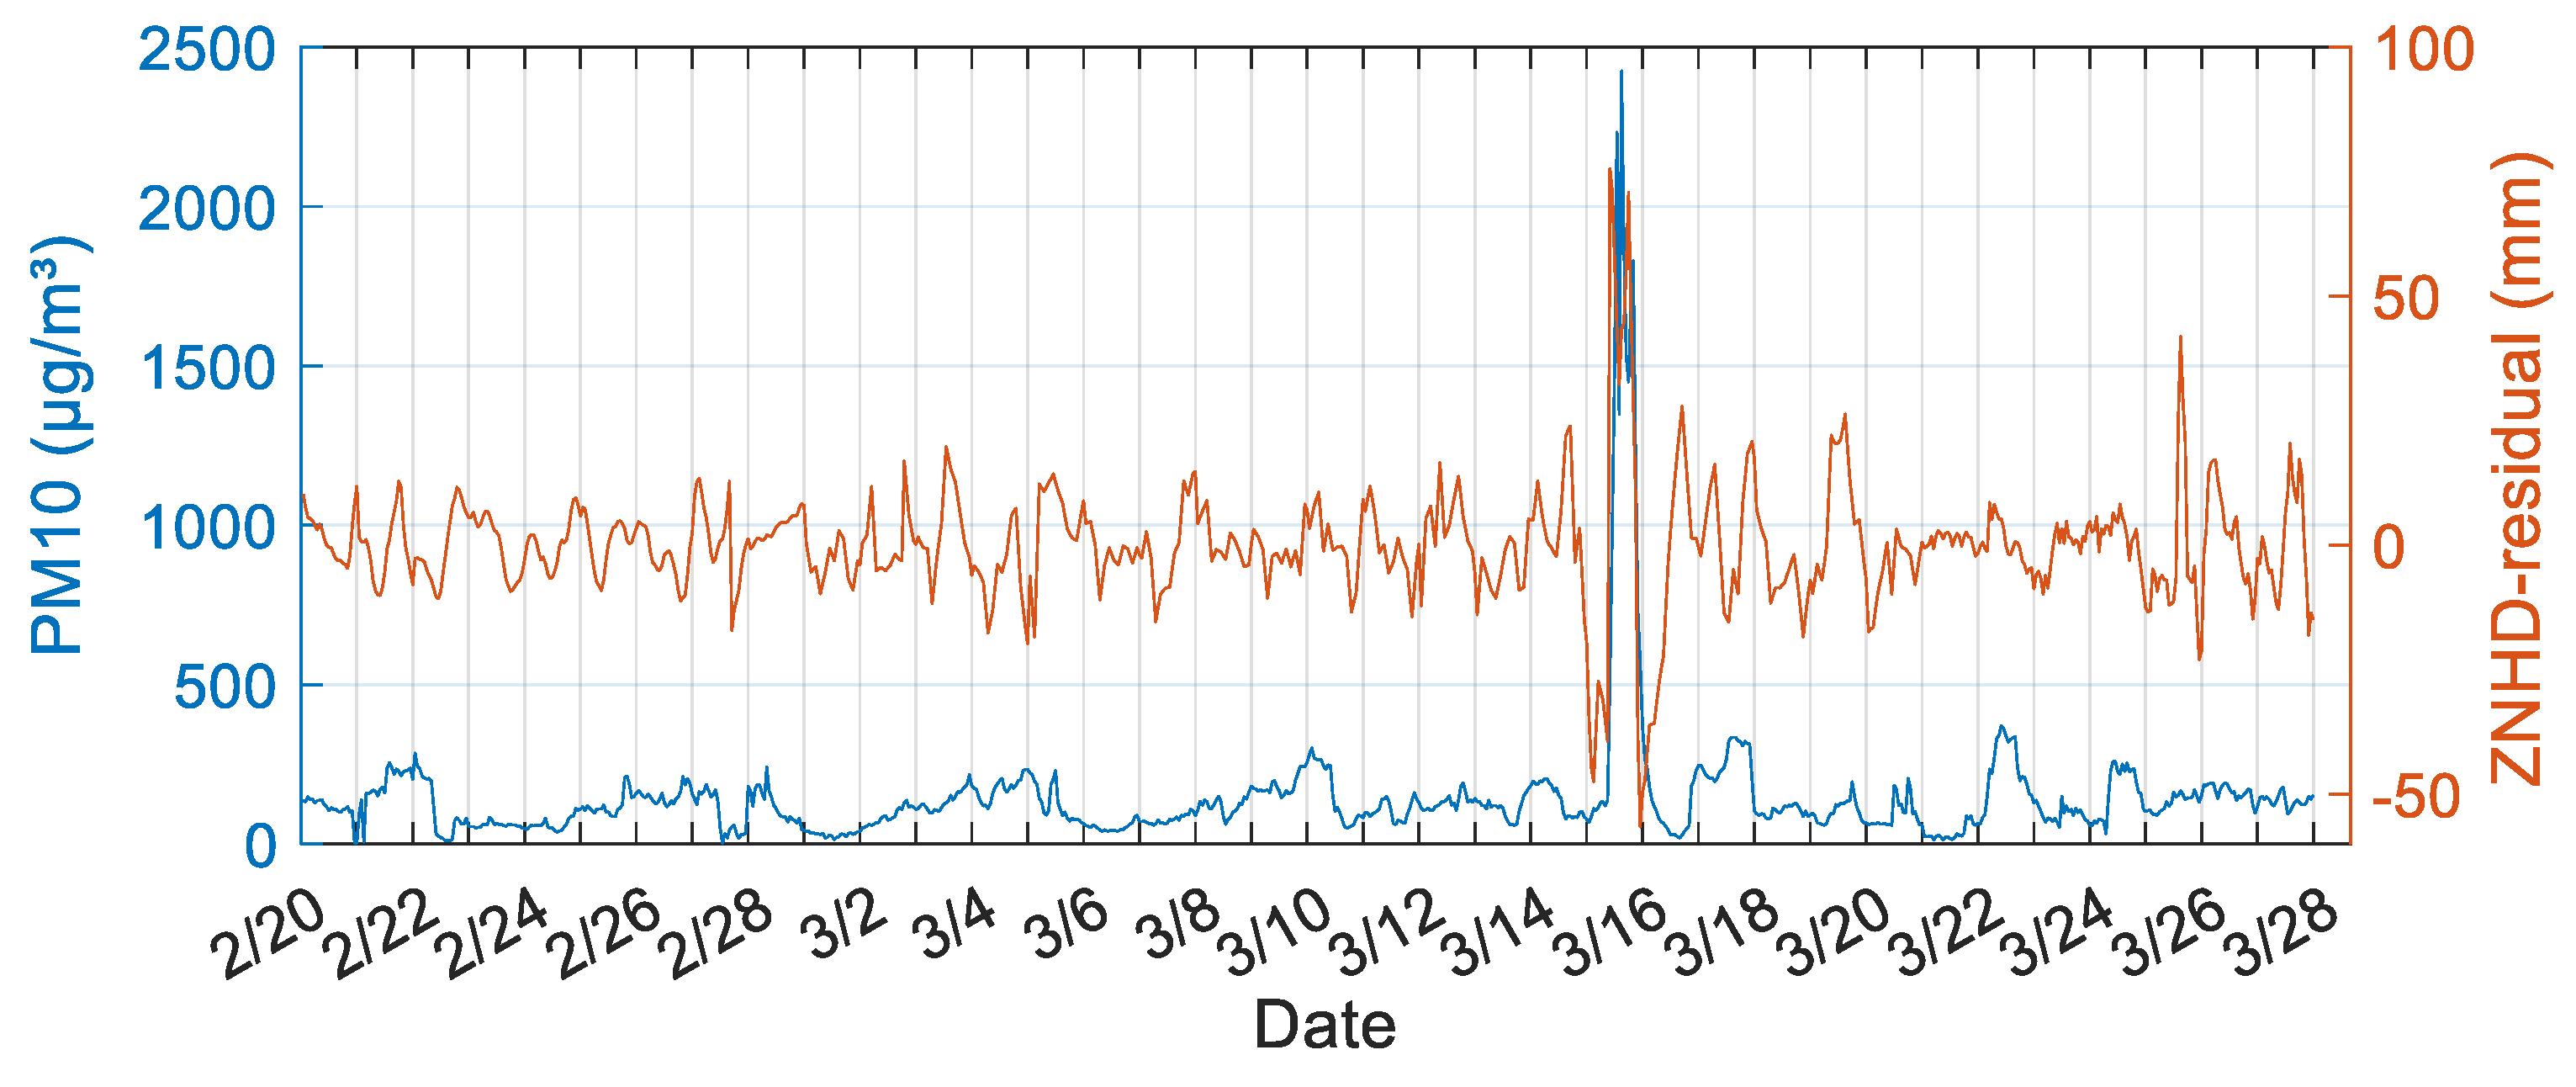
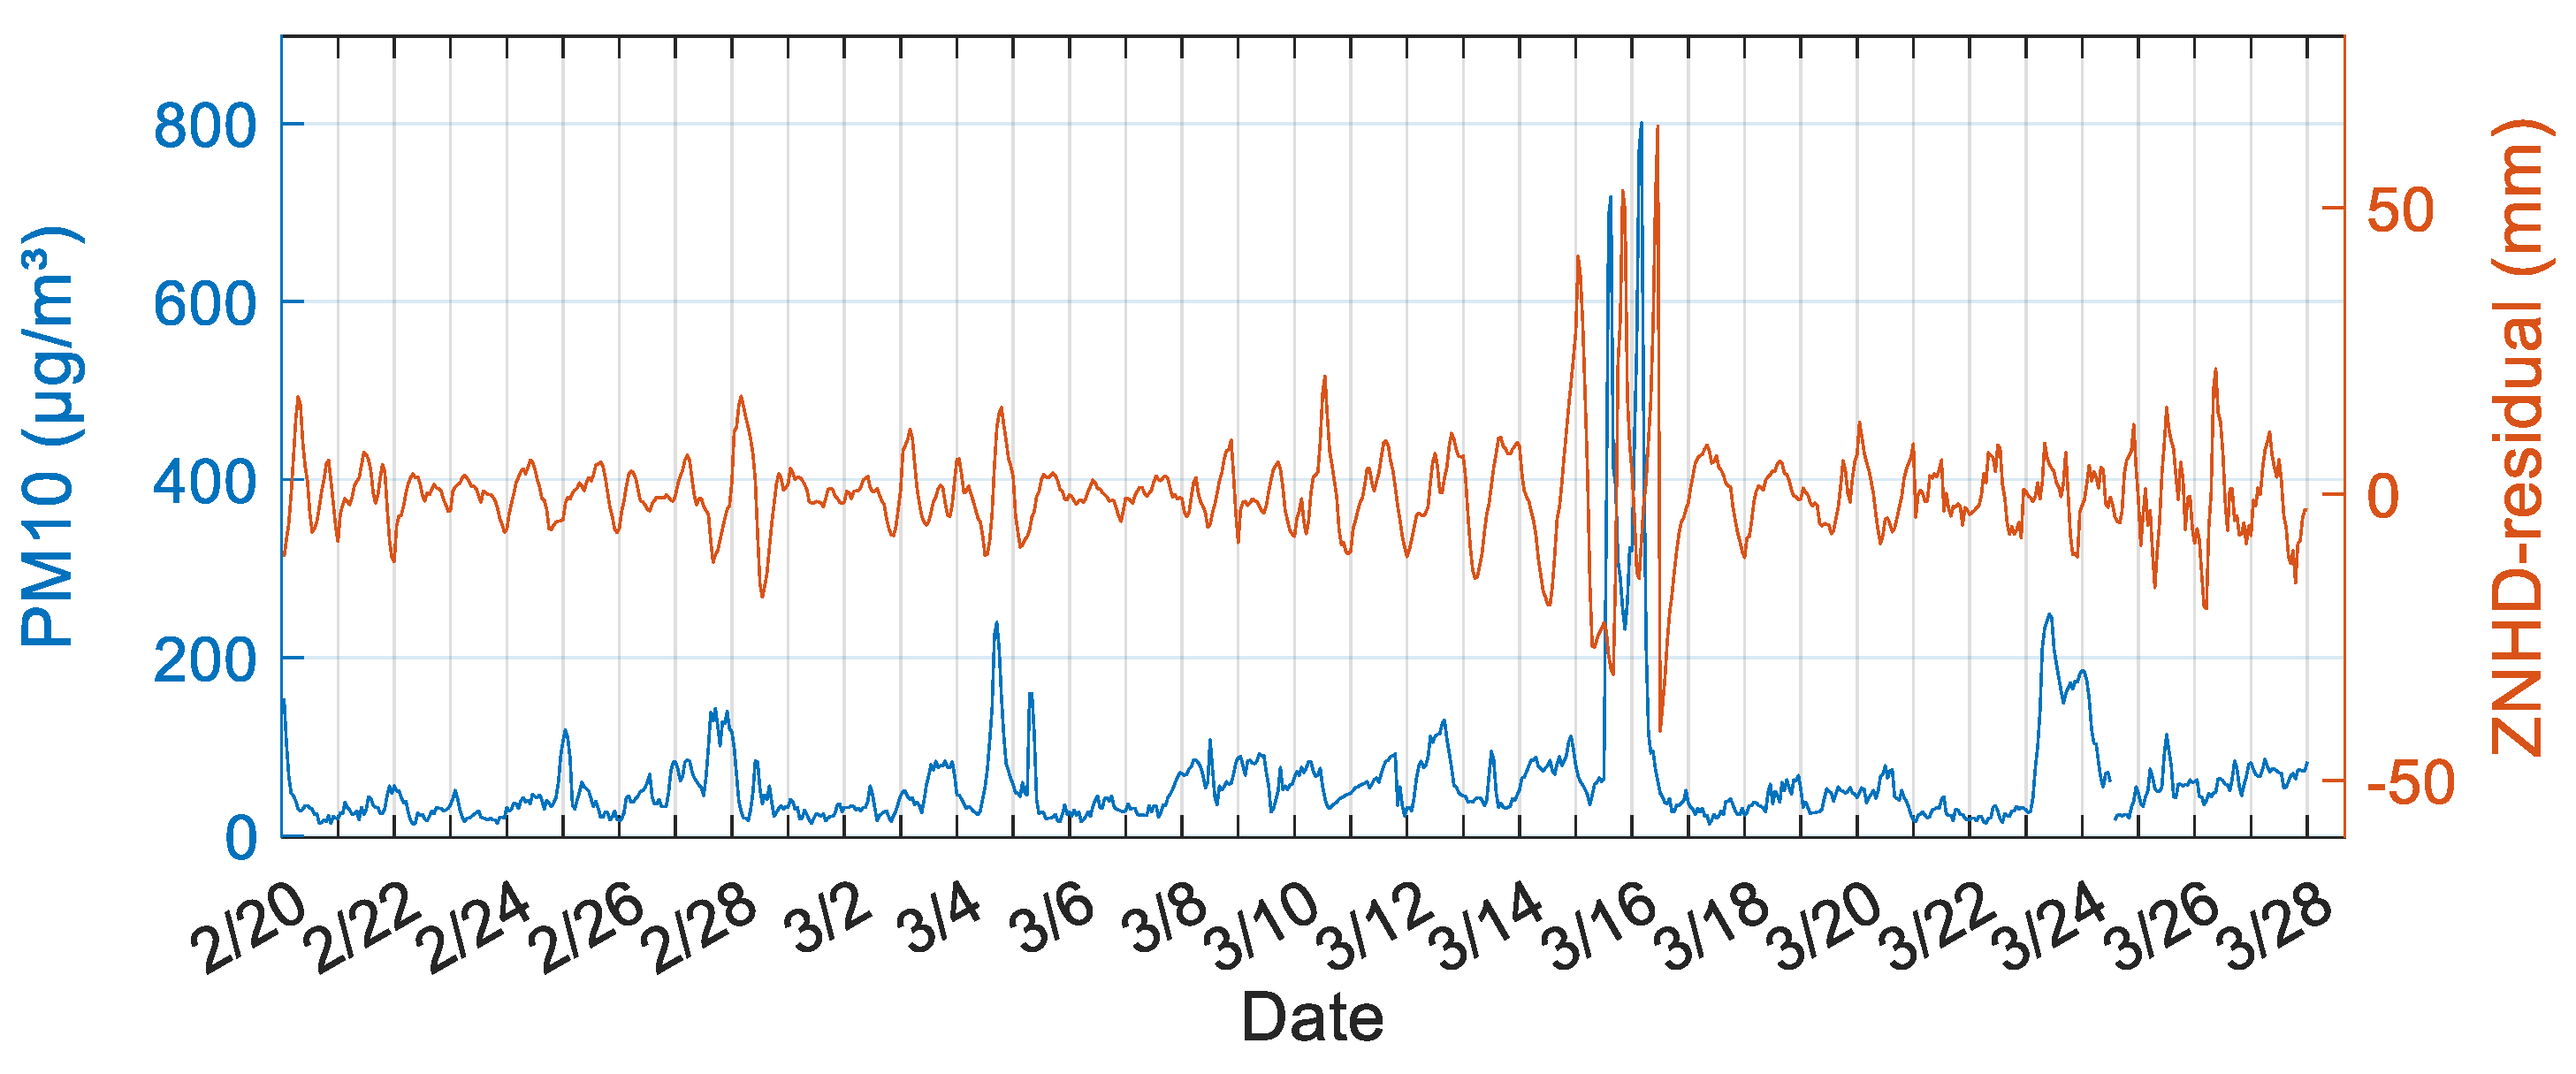
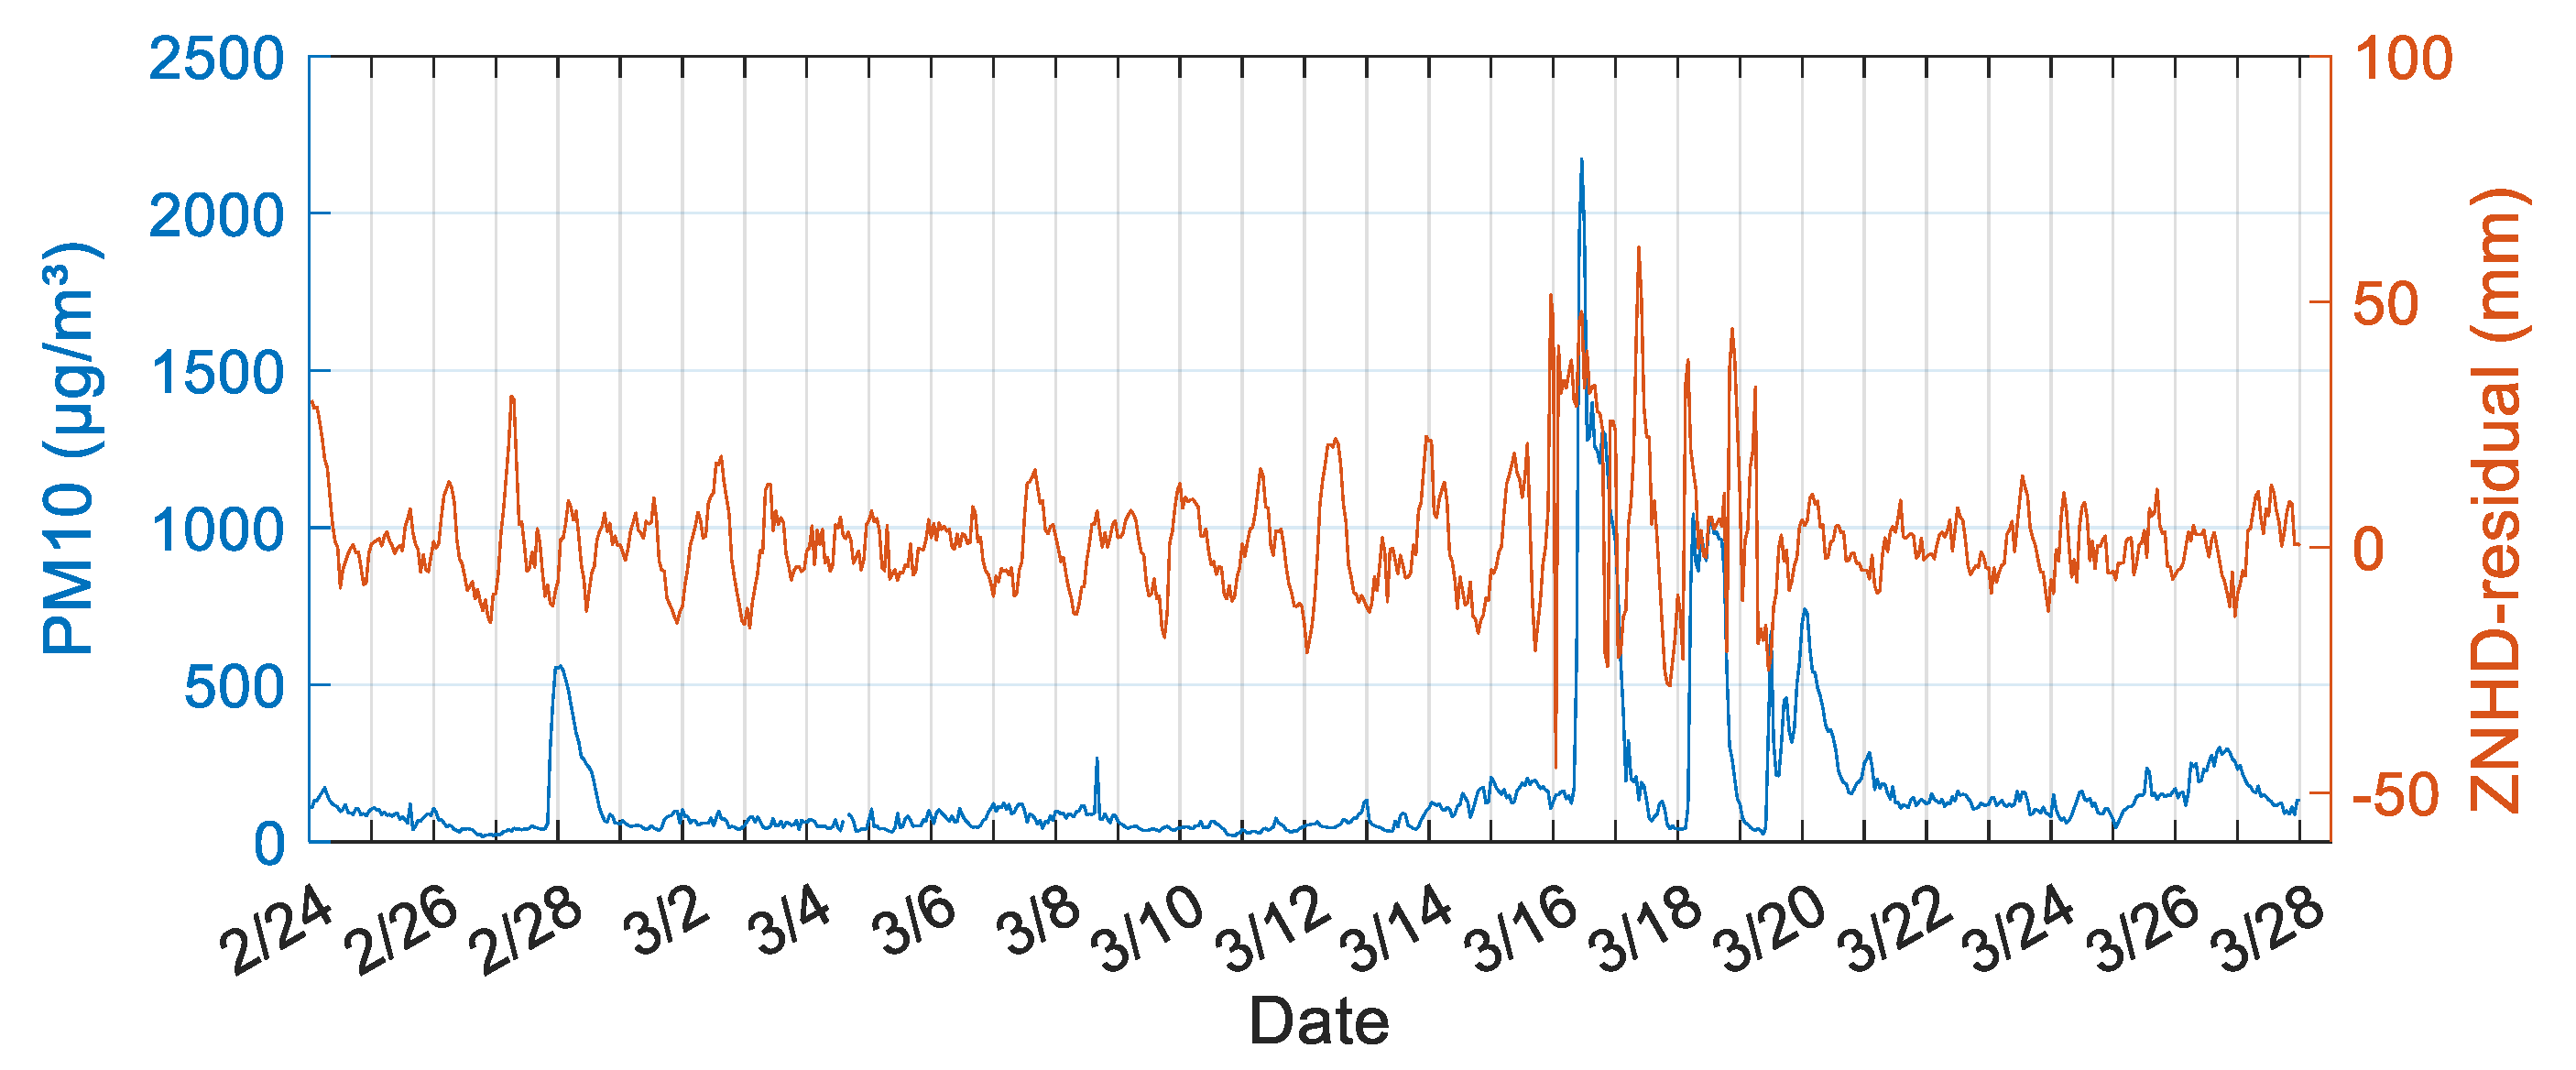
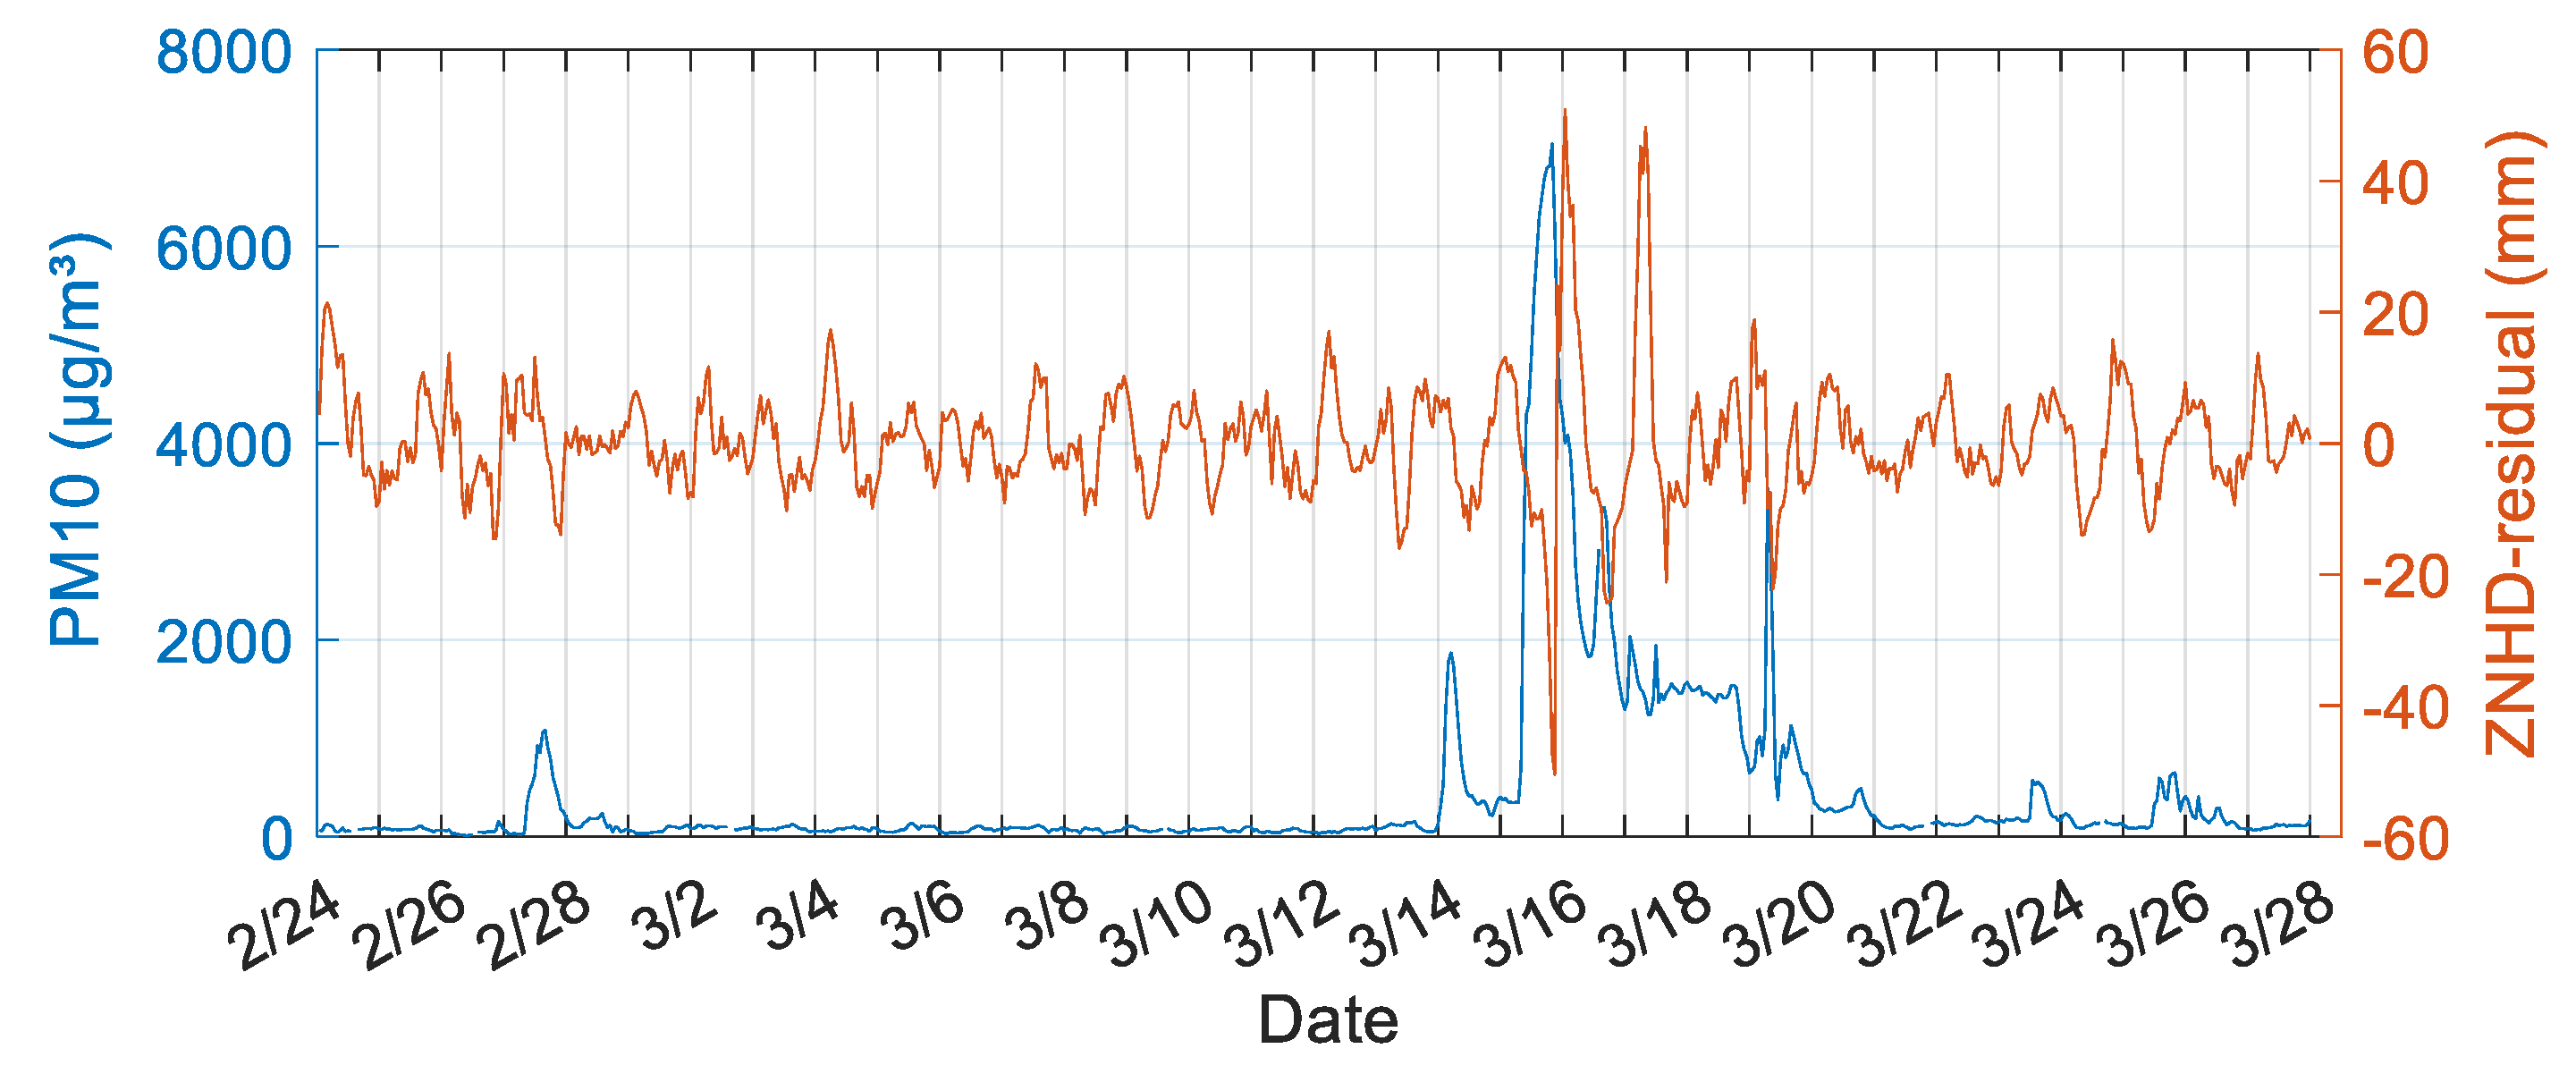
3.2. Monitoring Sandstorms Based on the ZNHD Residual

In order to use the GNSS to monitor sandstorms more effectively and accurately, we have proposed a method of monitoring sandstorms based on the ZNHD residual.
Firstly, the ZNHD time series was decomposed by SSA and the order of principal components was judged by the W-correlation method and eigenvalue ratio. The original series subtracts principal components to obtain the ZNHD residual. The results of W-correlation analysis of different orders are shown in Figure 7. It can be seen from Figure 7 that the first nine orders of ZNHD at BJFS station and CHAN station contain five signals with good frequency resolution, which can be effectively separated by SSA. The components after the 9th order have a poor separation effect. The eigenvalue contribution rates of the first nine orders of ZNHD decomposition results at BJFS station, CHAN station, GSPL station and NXZW station reach 98.2%, 98.1%, 98.9% and 99.1%, respectively, which shows that the first nine orders already contain most ZNHD signals. Therefore, we take the first nine orders as the principal components and the remaining components as the residuals.
After determining the ZNHD residual series, we compared the residual series with the PM10 series, and the comparison results are shown in Figure 8, Figure 9, Figure 10 and Figure 11.
According to Figure 8, the concentration of PM10 in Beijing increased significantly from about 9 am on the 15th of March and the concentration of PM10 returned to normal at about 5 am on the 16th of March. About 22:00 on the 14th of March, the ZNHD residuals began to show abnormalities. During the period from the 25th of March to the 27th of March, the ZNHD residuals at BJFS station showed an obvious increasing trend. We know from the website of the China Meteorological Administration that there was obvious haze in Beijing during this period.
According to Figure 9, the PM10 concentration in Changchun increased significantly from 12 pm on the 15th of March and the PM10 concentration returned to normal around 2 am on the 20th of March. The ZNHD residual showed obvious abnormalities from the early morning of the 15th of March to the noon of the 19th of March. Judging from the ZNHD residuals in Beijing and Changchun, the abnormal occurrence of ZNHD residuals was ahead of schedule. From the 23rd of March to the 24th of March, PM10 showed minor abnormalities, with PM10 content below 200, but there was no obvious abnormality in the ZNHD residual. This may be because the PM10 content was too low, and the impact on the GNSS signal is submerged in noise.
According to Figure 10 and Figure 11, the variation of ZNHD residuals in GSPL and NXZW stations is very similar to that in BJFS and CHAN stations. When the sandstorm occurs, the fluctuation of ZNHD residuals increases significantly, which can reach about ten times normal. The difference is that the ZNHD residuals anomaly of GSPL station appears before the PM10 anomaly, while the ZNHD residuals anomaly of NXZW station appears after the PM10 anomaly. The PM10 content in Pingliang City and Zhongwei city was abnormal on the 28th of February and the 27th of February, respectively, but there was no obvious abnormality in ZNHD residuals. This may be because the GNSS technology detects the particle anomaly on the signal path of the zenith direction of the observation station, and the meteorological observation station detects the particle anomaly on the ground. The wind direction may also be a factor that affects the difference in the time of anomaly detection by different technologies. The specific impact mechanism needs further research in the future.
In summary, the ZNHD and the PWV estimated by GNSS have obvious correlation with PM10. When sandstorms occur, the correlation increases in an obvious manner. Through the relationship between the ZNHD residual and PM10, it can be found that the peak-to-peak value of ZNHD residuals at the four GNSS stations exceeded 80 mm during the sandstorm. During the sandstorm, ZNHD and PWV will be obviously abnormal. This paper puts forward a feasible and effective new method for monitoring sandstorm weather.

4. Conclusions

In order to analyze the abnormal response of the ZNHD during a sandstorm, the relationship between ZNHD/PWV and PM10/PM2.5 before and after a sandstorm was analyzed. The method with the GNSS-derived ZNHD residual was proposed. The results show that the variation of PM10 is more dramatic than that of PM2.5 when a sandstorm occurs. Before sandstorms, the correlation between ZNHD and PM10 is less than 0.25. The correlation between ZNHD and PM10 increased significantly when sandstorms occurred, and the correlation coefficient can reach greater than 0.7. After sandstorms, the correlation between ZNHD and PM10 decreased significantly. Through the study of this sandstorm, it was found that the peak-to-peak value of the ZNHD residuals at the four GNSS stations exceeded 80 mm during the sandstorm. However, GNSS-derived ZNHD/PWV was also affected by abnormal weather such as rainfall, snowfall, and haze.

Author Contributions

M.Z.: Validation, Writing—Reviewing and Editing, Investigation. J.G.: Conceptualization, Methodology, Funding acquisition. X.L.: Supervision, Methodology. R.H.: Data curation, Software. X.J.: Software, Validation. All authors have read and agreed to the published version of the manuscript.

Funding

This study is supported by the National Natural Science Foundation of China (grant Nos. 41774001, 41374009), SDUST Research Fund (grant No. 2014TDJH101), and Autonomous and Controllable Special Project for Surveying and Mapping of China (grant No. 816-517).

Institutional Review Board Statement

Not applicable.

Informed Consent Statement

Not applicable.

Data Availability Statement

The GNSS observation data used in our work can be freely accessed at igs.gnsswhu.cn (accessed on 21 August 2022). The air quality monitoring data are obtained from https://www.aqistudy.cn/ (accessed on 21 August 2022).

Acknowledgments

We thank GAMIT for providing GNSS data processing software. We thank the International GNSS Service (IGS) data center of Wuhan University (igs.gnsswhu.cn (accessed on 21 August 2022)) and The China Earthquake Administration for providing GNSS data and ZNHD data. This research is supported by the National Natural Science Foundation of China (grant numbers 41774001, 41374009), the SDUST Research Fund (grant number 2014TDJH101), and Autonomous and Controllable Special Project for Surveying and Mapping of China (grant No. 816-517).

Conflicts of Interest

The authors declare no conflict interest.

References

  1. Yao, L.; Lu, N.; Yue, X.; Du, J.; Yang, C. Comparison of hourly PM2.5 observations between urban and suburban areas in Beijing, China. Int. J. Environ. Res. Public Health 2015, 12, 12264–12276. [Google Scholar] [CrossRef] [PubMed]
  2. Kiser, D.; Metcalf, W.; Elhanan, G.; Schnieder, B.; Schlauch, K.; Joros, A.; Petersen, C.; Grzymski, J. Particulate matter and emergency visits for asthma: A time-series study of their association in the presence and absence of wildfire smoke in Reno, Nevada, 2013–2018. Environ. Health 2020, 19, 92. [Google Scholar] [CrossRef] [PubMed]
  3. Kuempel, E.; Attfield, M.; Vallyathan, V.; Lapp, N.; Hale, J.; Smith, R.; Castranova, V. Pulmonary inflammation and crystalline silica in respirable coal mine dust: Dose response. J. Biosci. 2003, 28, 61. [Google Scholar] [CrossRef] [PubMed]
  4. Lei, Y.; Chan, C.; Wang, P.; Lee, C.; Cheng, T. Effects of Asian dust event particles on inflammation markers in peripheral blood and bronchoalveolar lavage in pulmonary hypertensive rats. Environ. Res. 2004, 95, 71–76. [Google Scholar] [CrossRef]
  5. Wang, P.; Vuran, M.; Al-Rodhaan, M.; Al-Dhelaan, A.; Akyildiz, I. Topology analysis of wireless sensor networks for sandstorm monitoring. In Proceedings of the IEEE International Conference on Communications (ICC), Kyoto, Japan, 5–9 June 2011. [Google Scholar]
  6. Pun, V.; Tian, L.; Ho, K. Particulate matter from re-suspended mineral dust and emergency cause-specific respiratory hospitalizations in Hong Kong. Atmos. Environ. 2017, 165, 191–197. [Google Scholar] [CrossRef]
  7. The New York Times. The Worst Dust Storm in a Decade Shrouds Beijing and Northern China. Available online: https://www.nytimes.com/2021/03/15/world/asia/china-sandstorm.html (accessed on 15 March 2021).
  8. NPR. Desert Dust Sweeps into Beijing, Causing China’s Worst Sandstorm in 10 Years. Available online: https://www.npr.org/2021/03/15/977397941/desert-dust-sweeps-into-beijing-causing-chinas-worst-sandstorm-in-10-years (accessed on 15 March 2021).
  9. Reuters. Beijing Choked in Dust Storm Stirred by Heavy Northwest Winds. 14 March 2021. Available online: https://www.reuters.com/article/us-china-weather-sandstorm/beijing-choked-in-duststorm-amid-heavy-northwest-winds-idUSKBN2B703O?il=0 (accessed on 15 March 2021).
  10. South China Morning Post. Six Dead, Dozens Missing as Beijing, Northern China and Mongolia Hit by Worst Sandstorm in a Decade. Available online: https://www.scmp.com/news/china/article/3125433/worst-sandstorm-decade-hits-beijing-huge-parts-northern-china (accessed on 15 March 2021).
  11. NASA Earth Observatory. Early Season Dust Storm Hits Beijing. Available online: https://earthobservatory.nasa.gov/images/148052/early-season-dust-storm-hits-beijing (accessed on 15 March 2021).
  12. World Meteorological Organization. Severe Sand and Dust Storm Hits Asia. Available online: https://public.wmo.int/en/media/news/severe-sand-and-dust-storm-hits-asia (accessed on 16 March 2021).
  13. Qu, J.; Hao, X.; Kafatos, M.; Wang, L. Asian dust storm monitoring combining terra and aqua MODIS SRB measurements. IEEE Geosci. Remote Sens. Lett. 2006, 3, 484–486. [Google Scholar] [CrossRef]
  14. Hao, X. Saharan dust storm detection using moderate resolution imaging spectroradiometer thermal infrared bands. J. Appl. Remote Sens. 2007, 1, 13510. [Google Scholar] [CrossRef]
  15. Xie, Y.; Zhang, W.; Qu, J. Detection of Asian dust storm using MODIS measurements. Remote Sens. 2017, 9, 869. [Google Scholar] [CrossRef]
  16. Sun, K.; Su, Q.; Ming, Y. Dust storm remote sensing monitoring supported by MODIS land surface reflectance database. Remote Sens. 2019, 11, 1772. [Google Scholar] [CrossRef]
  17. Rayegania, B.; Baratib, S.; Goshtasba, H.; Gachpaza, S.; Ramezanic, J.; Sarkheild, H. Sand and dust storm sources identification: A remote sensing approach. Ecol. Indic. 2020, 112, 106099. [Google Scholar] [CrossRef]
  18. Bevis, M.; Businger, S.; Herring, T.; Rocken, C.; Anthes, R.; Ware, R. GPS meteorology: Remote sensing of atmospheric water vapor using the global positioning system. J. Geophys. Res. Atmos. 1992, 97, 15787–15801. [Google Scholar] [CrossRef]
  19. Rohm, W. The precision of humidity in GNSS tomography. Atmos. Res. 2012, 107, 69–75. [Google Scholar] [CrossRef]
  20. Jiang, P.; Ye, S.; Liu, Y.; Zhang, J.; Xia, P. Near real-time water vapor tomography using ground-based GPS and meteorological data: Long-term experiment in Hong Kong. Ann. Geophys. 2014, 32, 911–923. [Google Scholar] [CrossRef]
  21. Benevides, P.; Catalao, J.; Miranda, P. On the inclusion of GPS precipitable water vapour in the nowcasting of rainfall. Nat. Hazards Earth Syst. Sci. 2015, 15, 2605–2616. [Google Scholar] [CrossRef]
  22. Yong, W.; Liu, Y.; Li, J.; Liu, L. The Effect of PM2. 5/PM10 variation based on precipitable water vapor and wind speed. J. Catastrophol. 2015, 30, 5–7. [Google Scholar]
  23. Ye, S.; Xia, P.; Cai, C. Optimization of GPS water vapor tomography technique with radiosonde and COSMIC historical data. Ann. Geophys. 2016, 34, 789–799. [Google Scholar] [CrossRef]
  24. Stoycheva, A.; Guerova, G. Study of fog in Bulgaria by using the GNSS tropospheric products and large scale dynamic analysis. J. Atmos. Sol. Terr. Phys. 2015, 133, 87–97. [Google Scholar] [CrossRef]
  25. Tang, X.; Hancock, C.; Xiang, Z.; Kong, Y.; Shi, L.; Jonathan Arthur Quaye-Ballard. Precipitable water vapour retrieval from GPS precise point positioning and NCEP CFSv2 dataset during typhoon events. Sensors 2018, 18, 3831. [Google Scholar] [CrossRef]
  26. Zhu, E.; Yang, L.; Jia, P.; Zhao, S.; Gao, Y. Correlation between GNSS Tropospheric Delay and Smog Haze; China Satellite Navigation System Management Office Academic Exchange Center: Beijing, China, 2018. [Google Scholar]
  27. Guo, J.; Hou, R.; Zhou, M.; Jin, X.; Li, C.; Liu, X.; Gao, H. Monitoring 2019 forest fires in southeastern Australia with GNSS technique. Remote Sens. 2021, 13, 386. [Google Scholar] [CrossRef]
  28. Guo, J.; Hou, R.; Zhou, M.; Jin, X.; Li, G. Detection of particulate matter changes caused by 2020 California wildfires based on GNSS and radiosonde station. Remote Sens. 2021, 13, 4557. [Google Scholar] [CrossRef]
  29. Zhao, Q.; Yao, Y.; Yao, W. GPS-based PWV for precipitation forecasting and its application to a typhoon event. J. Atmos. Sol. Terr. Phys. 2018, 167, 124–133. [Google Scholar] [CrossRef]
  30. Choy, S.; Wang, C.; Zhang, K.; Kuleshov, Y. GPS sensing of precipitable water vapour during the March 2010 Melbourne storm. Adv. Space Res. 2013, 52, 1688–1699. [Google Scholar] [CrossRef]
  31. Nykiel, G.; Figurski, M.; Baldysz, Z. Analysis of GNSS sensed precipitable water vapour and tropospheric gradients during the derecho event in Poland of 11 August 2017. J. Atmos. Sol. Terr. Phys. 2019, 193, 105082. [Google Scholar] [CrossRef]
  32. Yu, J.; Tan, K.; Zhang, C.; Zhao, B.; Wang, D.; Li, Q. Present-day crustal movement of the Chinese mainland based on Global Navigation Satellite System data from 1998 to 2018. Adv. Space Res. 2019, 63, 840–856. [Google Scholar] [CrossRef]
  33. Saastamoinen, J. Atmospheric correction for the troposphere and stratosphere in radio ranging satellites. Use Artif. Satell. Geod. 1972, 15, 247–251. [Google Scholar]
  34. Byun, S.H.; Bar-Sever, Y.E. A new type of troposphere zenith path delay product of the international GNSS service. J. Geod. 2009, 83, 367–373. [Google Scholar] [CrossRef]
  35. Wen, H.; Dang, Y.; Li, L. Short-Term PM2.5 concentration prediction by combining GNSS and meteorological factors. IEEE Access 2020, 8, 115202–115216. [Google Scholar] [CrossRef]
  36. Jin, S.G.; Luo, O.; Ren, C. Effects of physical correlations on long-distance GPS positioning and zenith tropospheric delay estimates. Adv. Space Res. 2010, 46, 190–195. [Google Scholar] [CrossRef]
  37. Liu, Z.; Li, Y.; Li, F.; Guo, J. Estimation and evaluation of the precipitable water vapor from GNSS PPP in Asia Region. In Lecture Notes in Electrical Engineering; Springer: Berlin/Heidelberg, Germany, 2017; pp. 85–95. [Google Scholar]
  38. Bevis, M.; Businger, S.; Chiswell, S.; Herring, T.A.; Randolph, H.W. GPS meteorology: Mapping zenith wet delays onto precipitable water. J. Appl. Meteorol. 1994, 33, 379–386. [Google Scholar] [CrossRef]
  39. Vautard, R.; Yiou, P.; Ghil, M. Singular spectrum analysis: A toolkit for short, noisy chaotic signals. Phys. D 1992, 58, 95–126. [Google Scholar] [CrossRef]
  40. Chen, Q.; van Dam, T.; Sneeuw, N.; Collilieux, X.; Weigelt, M.; Rebischung, P. Singular spectrum analysis for modeling seasonal signals from GPS time series. J. Geodyn. 2013, 72, 25–35. [Google Scholar] [CrossRef]
  41. Kondrashov, D.; Berloff, P. Stochastic modeling of decadal variability in ocean gyres. Geophys. Res Lett. 2015, 42, 1543–1553. [Google Scholar] [CrossRef]
  42. Shen, Y.; Guo, J.; Liu, X.; Kong, Q.; Guo, L.; Li, W. Long-term prediction of polar motion using a combined SSA and ARMA model. J. Geod. 2018, 92, 333–343. [Google Scholar] [CrossRef]
  43. Zhou, M.S.; Guo, J.Y.; Liu, X.; Shen, Y.; Zhao, C.M. Crustal movement derived by GNSS technique considering common mode error with MSSA. Adv. Space Res. 2020, 66, 1819–1828. [Google Scholar] [CrossRef]
  44. Hassani, H. Singular spectrum analysis: Methodology and comparison. J. Data Sci. 2007, 5, 239–257. [Google Scholar] [CrossRef]
Figure 1. Trends of sandstorms in northern China on 15 March 2021 provided by NASA [11].
Remotesensing 14 04678 g001
Figure 2. The   T m at four GNSS stations.
Remotesensing 14 04678 g002
Figure 3. Changes in PM10, PM2.5, zenith wet delay (ZNHD) and precipitable water vapor (PWV) at BJFS station.
Remotesensing 14 04678 g003
Figure 4. Changes in PM10, PM2.5, ZNHD and PWV at CHAN station.
Remotesensing 14 04678 g004
Figure 5. Changes in PM10, PM2.5, ZNHD and PWV at NXZW station.
Remotesensing 14 04678 g005
Figure 6. Changes in PM10, PM2.5, ZNHD and PWV at GSPL station.
Remotesensing 14 04678 g006
Figure 7. Results of W-correlation analysis.
Remotesensing 14 04678 g007
Figure 8. Variations in the PM10 and the ZNHD residual at the BJFS station.
Remotesensing 14 04678 g008
Figure 9. Variations in the PM10 and the ZNHD residual at CHAN station.
Remotesensing 14 04678 g009
Figure 10. Variations in the PM10 and ZNHD residual at GSPL station.
Remotesensing 14 04678 g010
Figure 11. Variations in the PM10 and ZNHD residual at NXZW station.
Remotesensing 14 04678 g011
Table 1. The uncertainty of ZNHD (unit: mm).
SiteGSPLNXZWBJFSCHAN
Maximum (Max)6.025.615.126.06
Minimum (Min)4.033.723.623.61
Mean4.814.414.284.32
Standard deviation (Std)0.530.540.430.57
Table 2. Correlation between ZNHD and PM10 in three periods.
Before SandstormsDuring SandstormsAfter Sandstorms
BJFS0.080.750.27
CHAN0.160.710.05
GSPL0.230.540.18
NXZW0.140.350.24
Publisher’s Note: MDPI stays neutral with regard to jurisdictional claims in published maps and institutional affiliations.

