Article

The Effect of Drought on Vegetation Gross Primary Productivity under Different Vegetation Types across China from 2001 to 2020

1
College of Environment & Safety Engineering, Fuzhou University, Fuzhou 350116, China
2
Instituto Dom Luiz (IDL), Faculdade de Ciências, Universidade de Lisboa, 1749-016 Lisboa, Portugal
3
School of Life Sciences, University of Technology Sydney, Sydney 2007, Australia
4
Earth System Science Interdisciplinary Center, University of Maryland, 5825 University Research Ct, College Park, MD 20740, USA
5
State Key Laboratory of Earth Surface Processes and Resource Ecology, Faculty of Geographical Science, Beijing Normal University, Beijing 100875, China
*
Author to whom correspondence should be addressed.
Remote Sens. 2022, 14(18), 4658; https://doi.org/10.3390/rs14184658
Submission received: 26 June 2022 / Revised: 22 August 2022 / Accepted: 14 September 2022 / Published: 18 September 2022
(This article belongs to the Special Issue Remote Sensing of Watershed)

Abstract

:

Highlights

  • Two drought indices (SPEI and VPD) were used to characterize the degree of dryness/wetness.
  • The water deficit represented by two drought indices was mostly negatively correlated with vegetation GPP, especially in summer and autumn.
  • The negative impact of water deficit/drought as measured by SPEI on vegetation GPP was more severe than that revealed by VPD.
  • During drought, both SPEI and VPD showed that drought had a negative impact on vegetation GPP in North China, Southwest China, and the Qinghai–Tibet Plateau.

Abstract

Climate change has exacerbated the frequency and severity of droughts worldwide. Evaluating the response of gross primary productivity (GPP) to drought is thus beneficial to improving our understanding of the impact of drought on the carbon cycle balance. Although many studies have investigated the relationship between vegetation productivity and dry/wet conditions, the capability of different drought indices of assessing the influence of water deficit is not well understood. Moreover, few studies consider the effects of drought on vegetation with a focus on periods of drought. Here, we investigated the spatial-temporal patterns of GPP, the standardized precipitation evapotranspiration index (SPEI), and the vapor pressure deficit (VPD) in China from 2001 to 2020 and examined the relationship between GPP and water deficit/drought for different vegetation types. The results revealed that SPEI and GPP were positively correlated over approximately 70.7% of the total area, and VPD was negatively correlated with GPP over about 66.2% of the domain. Furthermore, vegetation productivity was more negatively affected by water deficit in summer and autumn. During periods of drought, the greatest negative impact was on deciduous forests and croplands, and woody savannas were the least impacted. This research provides a scientific reference for developing mitigation and adaptation measures to lessen the impact of drought disasters under a changing climate.

1. Introduction

Droughts are among the most complex and costly natural disasters in the world. They are usually divided into meteorological, agricultural, hydrological, and economic droughts [1]. With global climate change and increased human activities, the frequent occurrence of droughts has become a serious challenge [2,3,4,5]. Under future climate change scenarios, the severity of droughts is expected to increase [6]. Since droughts profoundly impact the economy, society, ecology, and environment, they increasingly attract the attention of researchers in different fields.
China has suffered a growing number of drought events, including extreme drought episodes, since the 1990s [7,8]. Droughts in China are highly complex, since they are affected by many factors, such as climate, topography, and human activities [9]. The severity of droughts in the northern region of the country (drought-prone area) has intensified, while their frequency in the southern region is increasing [10,11]. The impacts of droughts on agriculture and ecology threaten food and ecological security in China, the most populous country in the world. Thus, assessing the temporal and spatial characteristics of droughts, as well as understanding their trends and behaviors, is a crucial task to provide a scientific basis for developing mitigation and adaptation measures to lessen the impact of drought disasters under a changing climate.
Drought indices are among the most popular methods for monitoring and evaluating droughts [12]. Many drought indices have been proposed in the literature, but the most commonly used drought indices are the standardized precipitation index (SPI) [13], Palmer drought severity index (PDSI) [14], and standardized precipitation evapotranspiration index (SPEI) [3,15]. SPI is a widely used drought index using a range of timescales that considers precipitation and ignores other climatic factors, such as temperature and evapotranspiration. On the other hand, PDSI combines the effects of precipitation and evapotranspiration, but with the handicap of having a fixed temporal scale. Vicente-Serrano et al. [15] introduced a multi-scale index based on SPI, with the inclusion of potential evapotranspiration—the SPEI. Using precipitation and evapotranspiration, SPEI not only retains PDSI’s evapotranspiration sensitivity to temperature, but also includes SPI’s calculation simplicity and suitability for multi-scale and multi-space comparison. Because this index is suitable for monitoring drought characteristics under climate change, it has been widely used worldwide. Moreover, SPEI may be used as a tool to assess the impacts of droughts on different systems (hydrology, agriculture, and ecology) [16].
Vapor pressure deficit (VPD) is the difference between the saturation and actual vapor pressure, and is an important indicator of the degree of air dryness considered as a key factor affecting the physiological function of vegetation [17]. High VPD is one of the main causes of vegetation drought and may inhibit photosynthesis in vegetation [18].
Vegetation is an essential component of terrestrial ecosystems, reflecting an ecosystem’s production and carbon sink capacities. However, it is sensitive to climate change, and its growth is strongly affected by droughts [19,20]. Drought is a vital factor leading to the decline of vegetation productivity [21,22,23]. However, the response of different ecosystems to drought varies [24]. Thus, assessing the impact of drought on vegetation has become a crucial scientific issue [25]. Many studies use gross primary productivity (GPP), net primary productivity (NPP), and the normalized difference vegetation index (NDVI) to characterize ecosystem productivity and analyze the productivity response to climate change [26,27,28]. Among these, GPP is the number of photosynthetic products, or total organic carbon, fixed by organisms through photosynthesis in a unit of time. It is the largest component and foundation of the carbon cycle of an ecosystem [29]. Thus, changes in GPP can accurately reflect ecosystem responses to extreme events [30], whereas many studies observe that drought occurrences decrease vegetation productivity, with different regions and vegetation types responding differently [31]. As a country with a vast territory, China has undergone complicated and extensive changes in vegetation types due to rapid economic development [32]. However, there is limited research regarding the impact of large-scale drought across China on different vegetation types during different seasons. Indeed, identifying the effects of drought on the productivity of different vegetation types is a significant achievement that may help to better develop strategies to protect the environment.
The aim of this study is to investigate the effects of water deficit/drought on vegetation productivity in various vegetation types across China during different seasons from 2001 to 2020. Specifically, we used two meteorological drought indices, SPEI and VPD, to characterize water deficit and drought, along with vegetation productivity, as indicated by GOSIF-GPP. We also examined the effect patterns of water deficit/drought on various vegetation types (including evergreen forests, deciduous forests, mixed forests, woody savannas, savannas, grasslands, and croplands). This study is developed to further grasp and respond to the impact of climate change on vegetation.

2. Materials and Methods
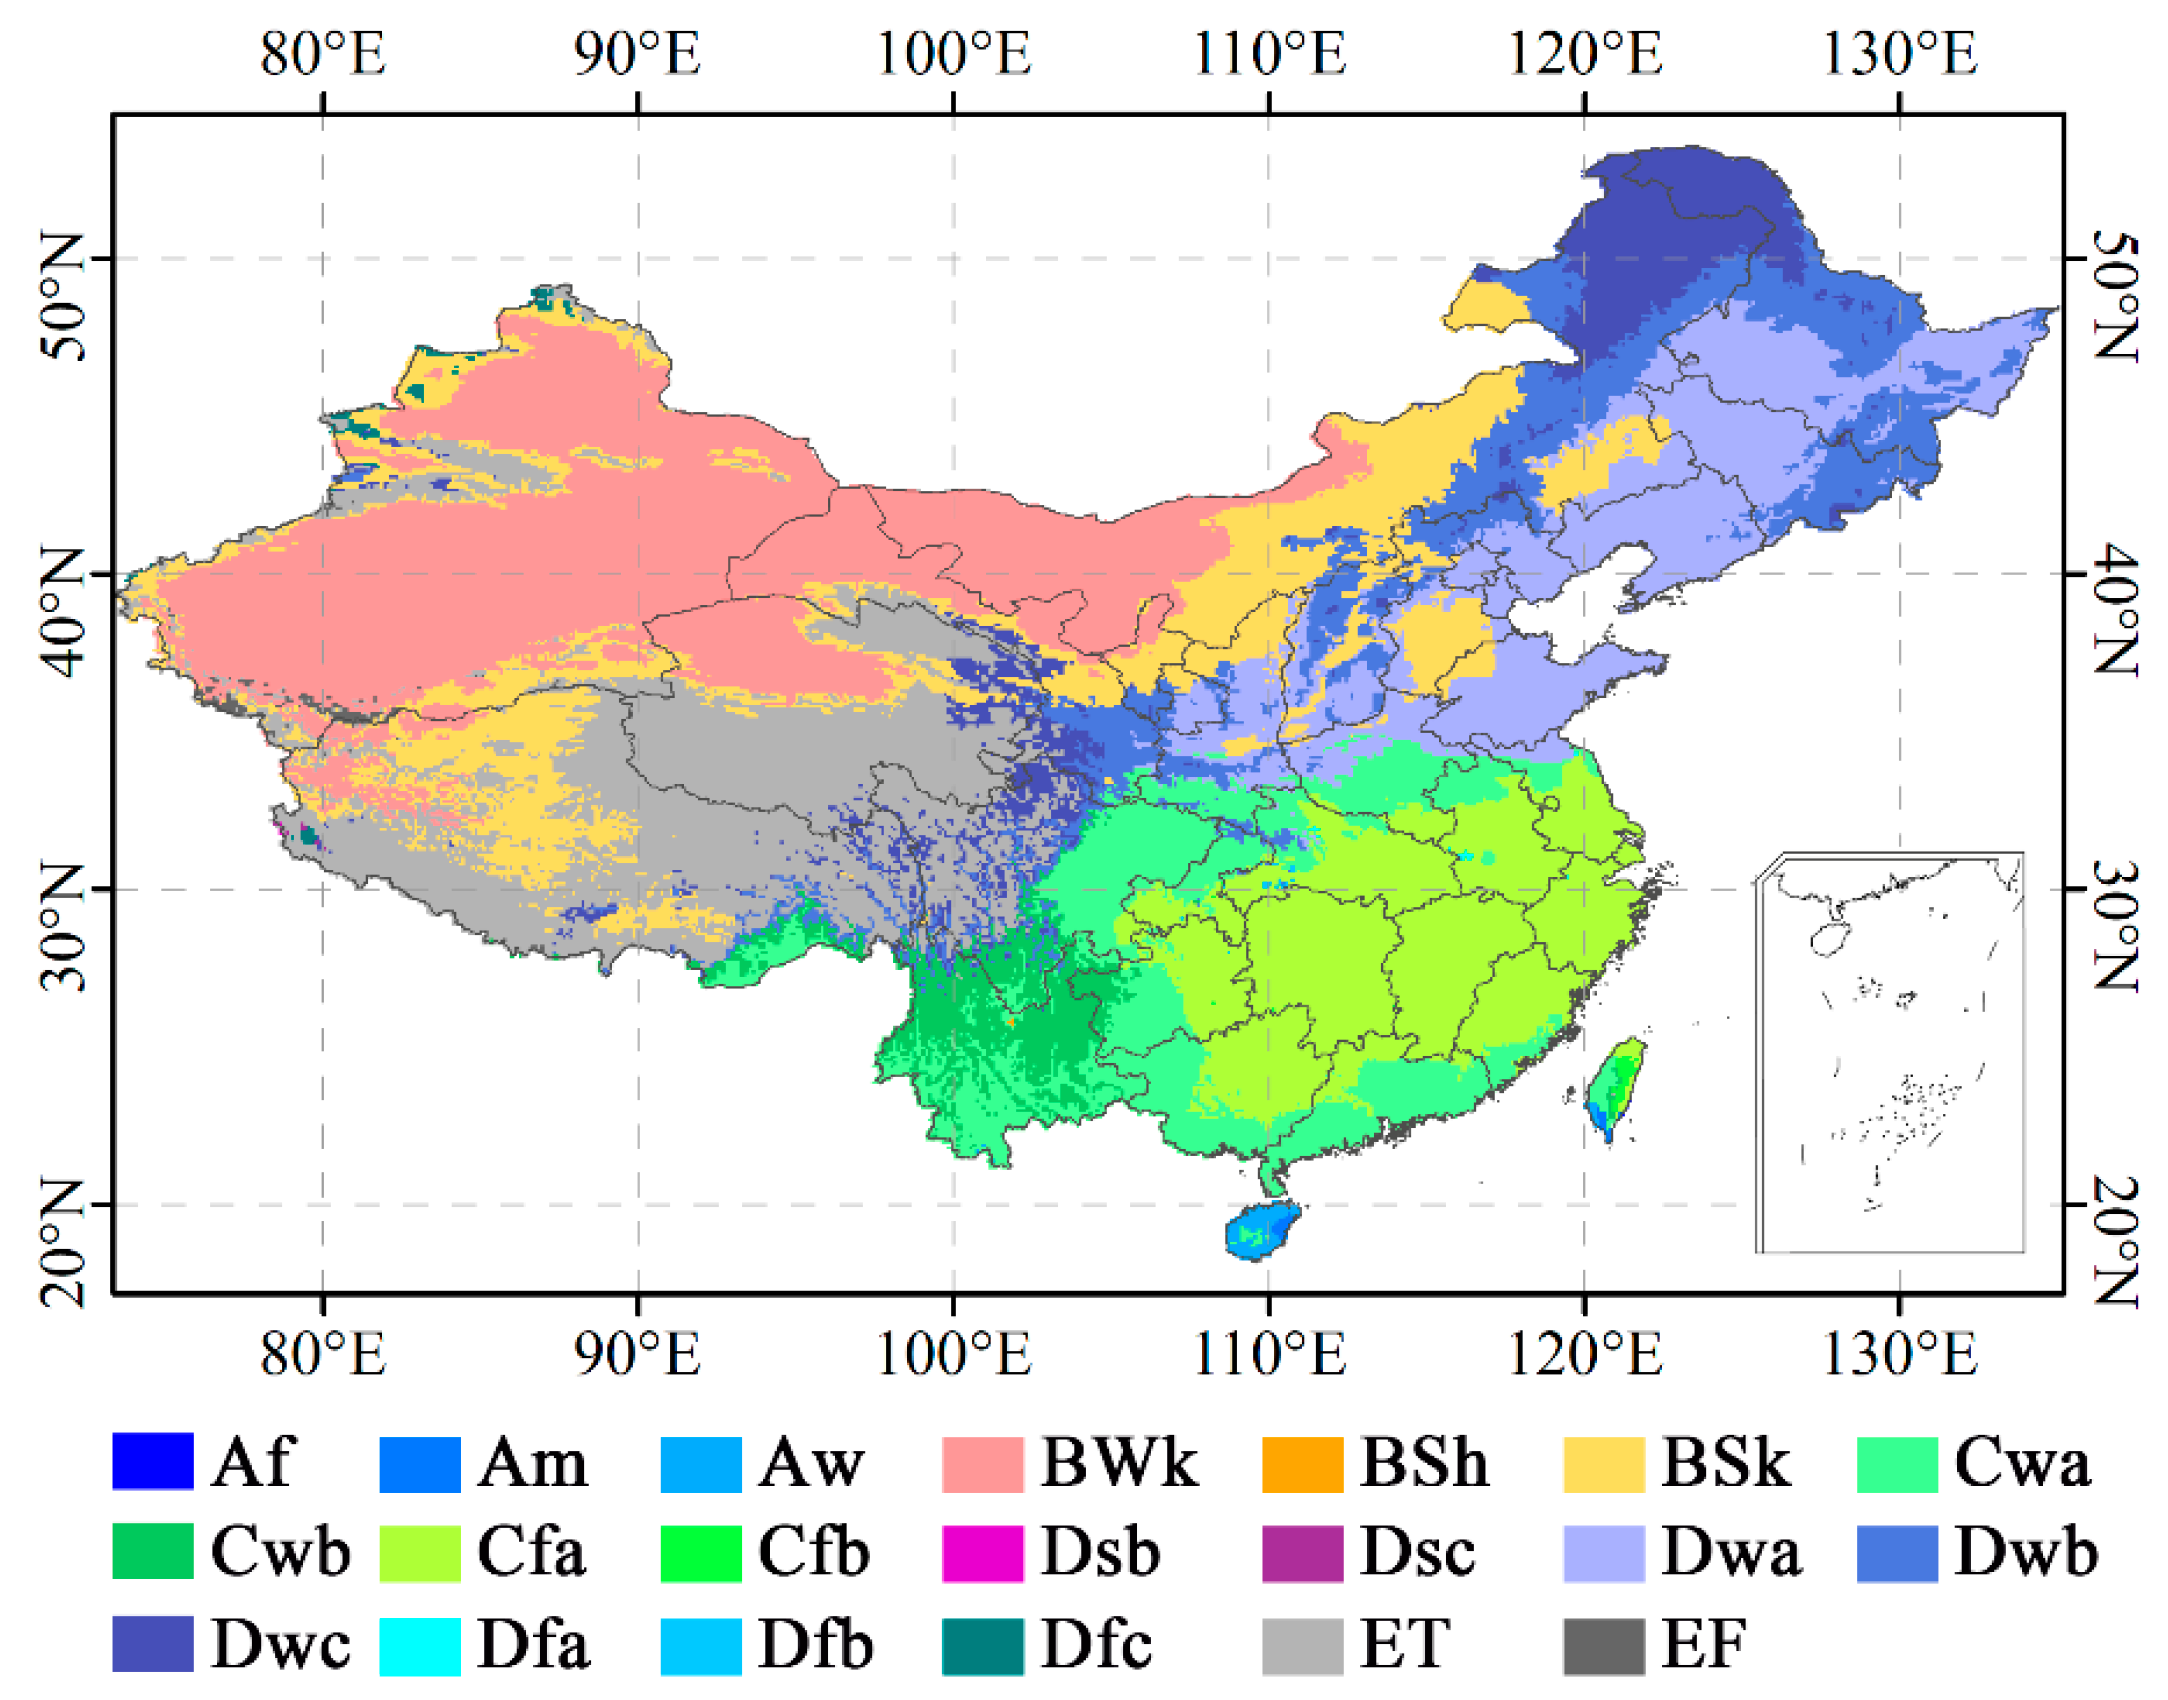
2.1. Study Area

This study is performed across China, which covers a vast territory (Figure 1). Because of conspicuous spatial differences in temperature, precipitation, and topography, land cover types over China show evident spatial heterogeneity. China can be divided into four climate regions according to the aridity index (the ratio between evapotranspiration and precipitation): humid, semi-humid, semi-arid, and arid regions [33]. The humid regions (mainly located in the south of China) are dominated by forests and savannas; the semi-humid regions are primarily covered by croplands and grasslands; the semi-arid regions are dominated by grasslands; and the arid areas are mostly barren (Figure 1).
To reduce the uncertainty of vegetation cover change, only the areas where the land cover type has not changed from 2001 to 2020 were selected for analysis. Specifically, the images of land cover in 2001 and 2020 were compared and subtracted. If the pixel value was equal to 0, it was assumed that the land cover type remained unchanged during the study period, and vice versa. In addition, the regions with non-vegetation cover (including water bodies, permanent wetlands, urban and built-up lands, permanent snow and ice, and barren) or shrublands cover (less than 100 pixels in the whole study area) were masked, i.e., excluded from this study. The final selected study area is shown in Figure 1. Within the selected study area, there are seven main vegetation types, namely evergreen forests, deciduous forests, mixed forests, woody savannas, savannas, grasslands, and croplands (Table 1). Among these, grasslands occupy the largest area, while mixed forests occupy the smallest area, accounting for 48.6% and 2.2%, respectively.

2.2. Datasets and Preprocessing

2.2.1. Meteorological Data

In this study, we used daily precipitation, temperature, and relative humidity data from monitoring stations provided by the China Meteorological Data Network (CMDN, http://data.cma.cn/ (accessed on 20 April 2022)). Observed near-surface meteorological data at weather stations in China are routinely publicized, with a lag of about three months, a period used for data compilation and quality control. Therefore, this dataset has high accuracy and timeliness, and has been widely used in studies related to climate change [34,35,36,37]. To ensure continuous and complete data records, 786 meteorological stations were chosen for our study. The data from the meteorological stations was interpolated to 0.1° grid points using ANUSPLIN software, which was generated using the thin-plate spline algorithm [38]. In order to improve the accuracy of interpolation in complex terrain areas, it is necessary to input elevation elements in the interpolation process. In China, interpolation of temperature and relative humidity based on this method has high confidence, and error estimates of precipitation for southern China were quite low [39]. This data was used to calculate SPEI and VPD.

2.2.2. Gross Primary Productivity Data

The monthly GOSIF-GPP data, with a spatial resolution of 0.05° for 2001–2020, was used (http://globalecology.unh.edu (accessed on 22 April 2022)). The data was constructed based on meteorological data, OCO-2 SIF data, remote sensing data from the Moderate Resolution Imaging Spectroradiometer (MODIS), and meteorological reanalysis data [40]. The GOSIF-GPP dataset is highly correlated with GPP estimated from EC flux sites (R2 = 0.73, p < 0.001); therefore, it is able to objectively reflect the primary productivity of vegetation in China [41].

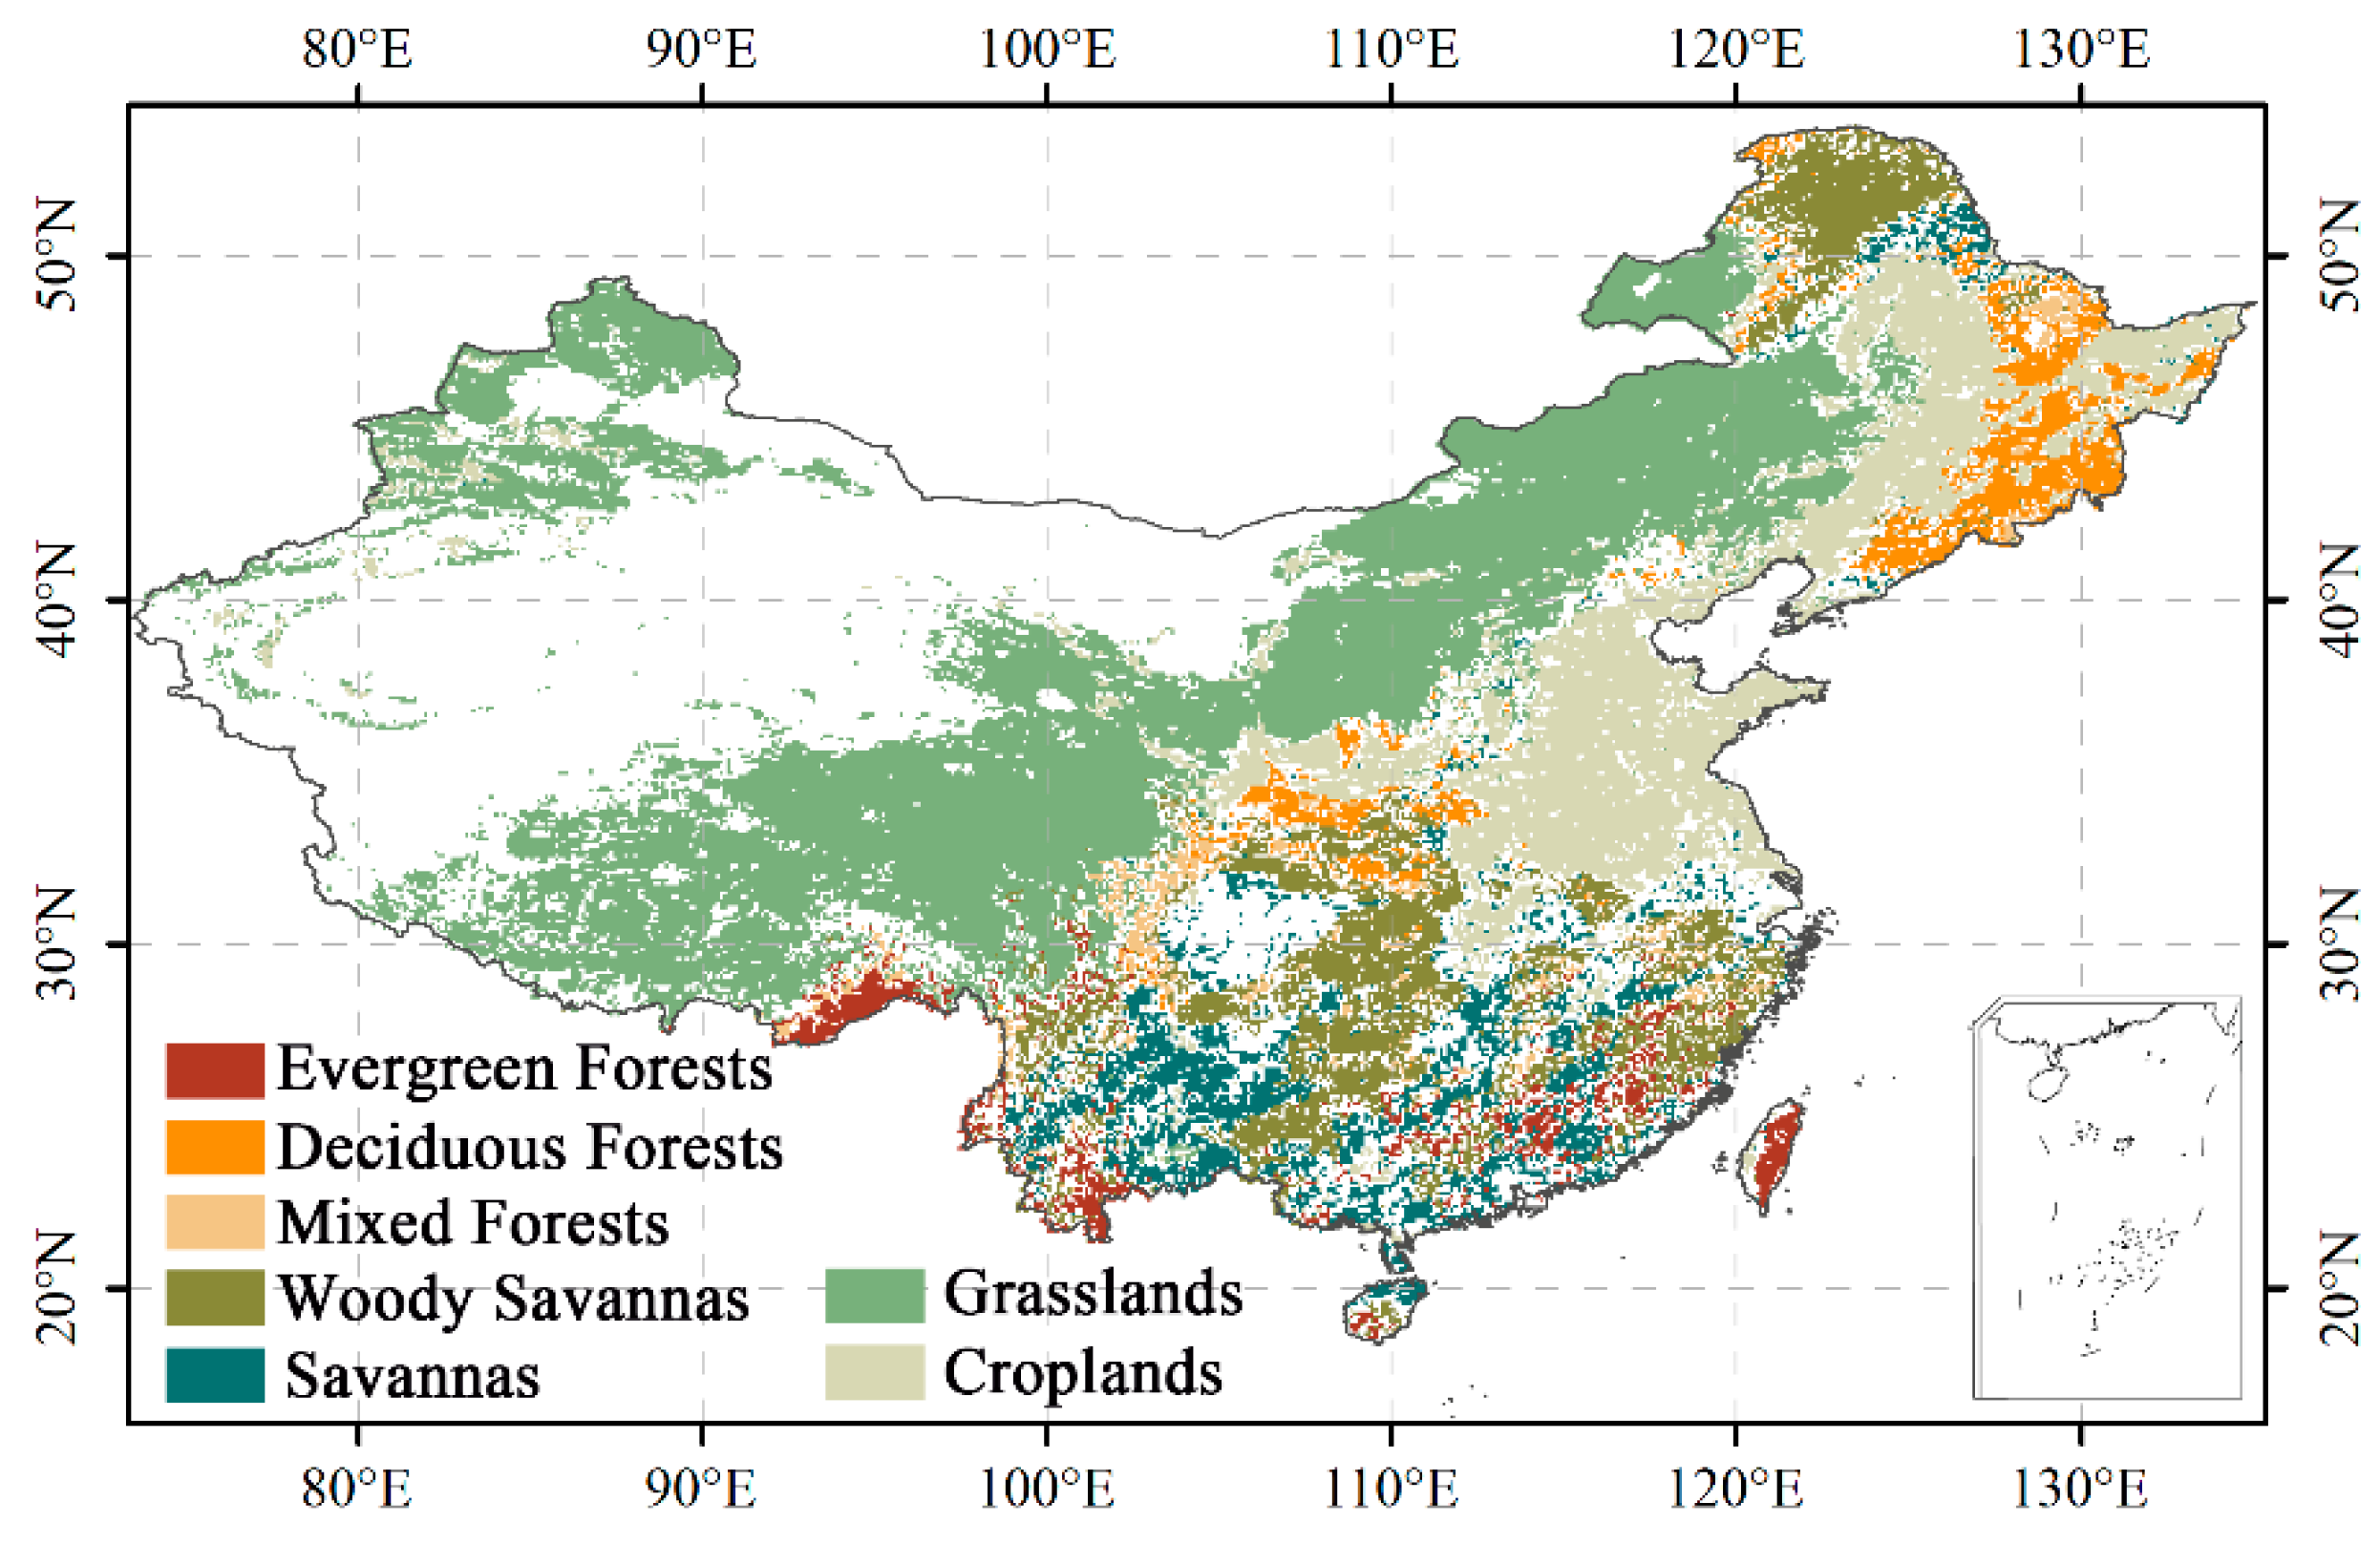
2.2.3. Land Cover Data

The Moderate Resolution Imaging Spectroradiometer (MODIS) Land Cover Climate Modeling Grid product (MCD12C1) of IGBP (International Geosphere-Biosphere Programme) classification (https://search.earthdata.nasa.gov/ (accessed on 3 May 2022)) for 2001–2020, with a spatial resolution of 0.05°, was used. Moreover, the land cover data were reclassified into seven classes (evergreen forests, deciduous forests, mixed forests, woody savannas, savannas, grasslands, and croplands). In addition, the vegetation cover data and GOSIF-GPP data were resampled to a spatial resolution of 0.1° using a nearest neighbor interpolation method.

2.3. Methods

2.3.1. Meteorological Drought Indices Calculation

Based on temperature (T) and relative humidity (RH), monthly VPD can be obtained using the following formula:
V P D = 0.61078 × e ( 17.27 × T T + 237.3 ) × ( 1 R H 100 )
SPEI is a probability distribution function that fits and normalizes cumulative water scarcity and can characterize the wetness and dryness of a region. It can be calculated using the difference between precipitation and potential evapotranspiration. The SPEI is characterized by multiple time scales. Furthermore, to match the time scale of GPP, this study calculated the SPEI at the 1-month scale. The Hargreaves model, which has strong accuracy in China [35], was used to estimate the monthly PET. The generalized extreme value (GEV) distribution was chosen to normalize the SPEI, as it has been shown to have strong stability in calculating shorter time scales SPEI [42].
Usually, When SPEI is less than −0.5, drought is indicated [15]. Previous studies have focused on the effect of dryness/wetness on vegetation [19,43]. In order to investigate the effect of drought on vegetation GPP, all drought months (i.e., months with SPEI less than −0.5) in each year were selected. The sum of the absolute SPEI values of all drought months, along with the sum of VPD and the mean GPP values corresponding to the drought months, were calculated. The calculation equations are as follows:
S P E I d r o u g h t _ m o n t h = | i = 1 n S P E I i | ( S P E I i < 0.5 )
V P D d r o u g h t _ m o n t h = i n V P D i
G P P d r o u g h t _ m o n t h = i n G P P i n
where S P E I d r o u g h t _ m o n t h represents the sum of the absolute values of SPEI for all drought months in a year, V P D d r o u g h t _ m o n t h represents the sum of the values of VPD for all drought months in a year, G P P d r o u g h t _ m o n t h represents the average GPP of all drought months in a year, i represents the ith month, and n represents the number of drought months in a year.

2.3.2. Meteorological Drought Indices Calculation

The Mann–Kendall (M–K) test was used to identify the annual trends of GPP and drought indices and their significance. This is a nonparametric statistical test method [44,45] recommended by the World Meteorological Organization. It presents advantages, since samples do not need specific distributions, and its calculation method is fairly simple. Therefore, the M–K method is widely used to analyze changing trends and qualify the significance of trends in the time series of drought, precipitation, and temperature, among others [46,47,48,49].
For the statistic Z of the M–K test, Z > 0 indicates an upward trend, and Z < 0 indicates a downward trend. When the significance levels are set to 0.01, 0.05, and 0.1, |Za| is 2.58, 1.96, and 1.65, respectively. At a certain significance level, if |Z| > |Za|, the statistics pass the corresponding significance test.

2.3.3. Correlation Analysis

The Pearson correlation analysis is usually used to investigate the degree of correlation between variables [50]. This method is frequently used in meteorology and ecology [31]. We selected this method to examine the response mechanism of vegetation to drought. An F test was performed, and it indicated that the correlation is significant when p < 0.05. Positive and negative correlations were represented by R > 0 and R < 0, respectively. Moreover, the closer |R| is to 1, the stronger the correlation. The correlation coefficient R was calculated as follows:
R = i = 1 n ( x i x ¯ ) ( y i y ¯ ) i = 1 n ( x i x ¯ ) 2 i = 1 n ( y i x ¯ ) 2
where R ranges from −1 to 1; x i and y i represent the value of factors in x and y in period i, respectively; x ¯ and y ¯ represent the average value of factors; and n represents the time series length.

3. Results

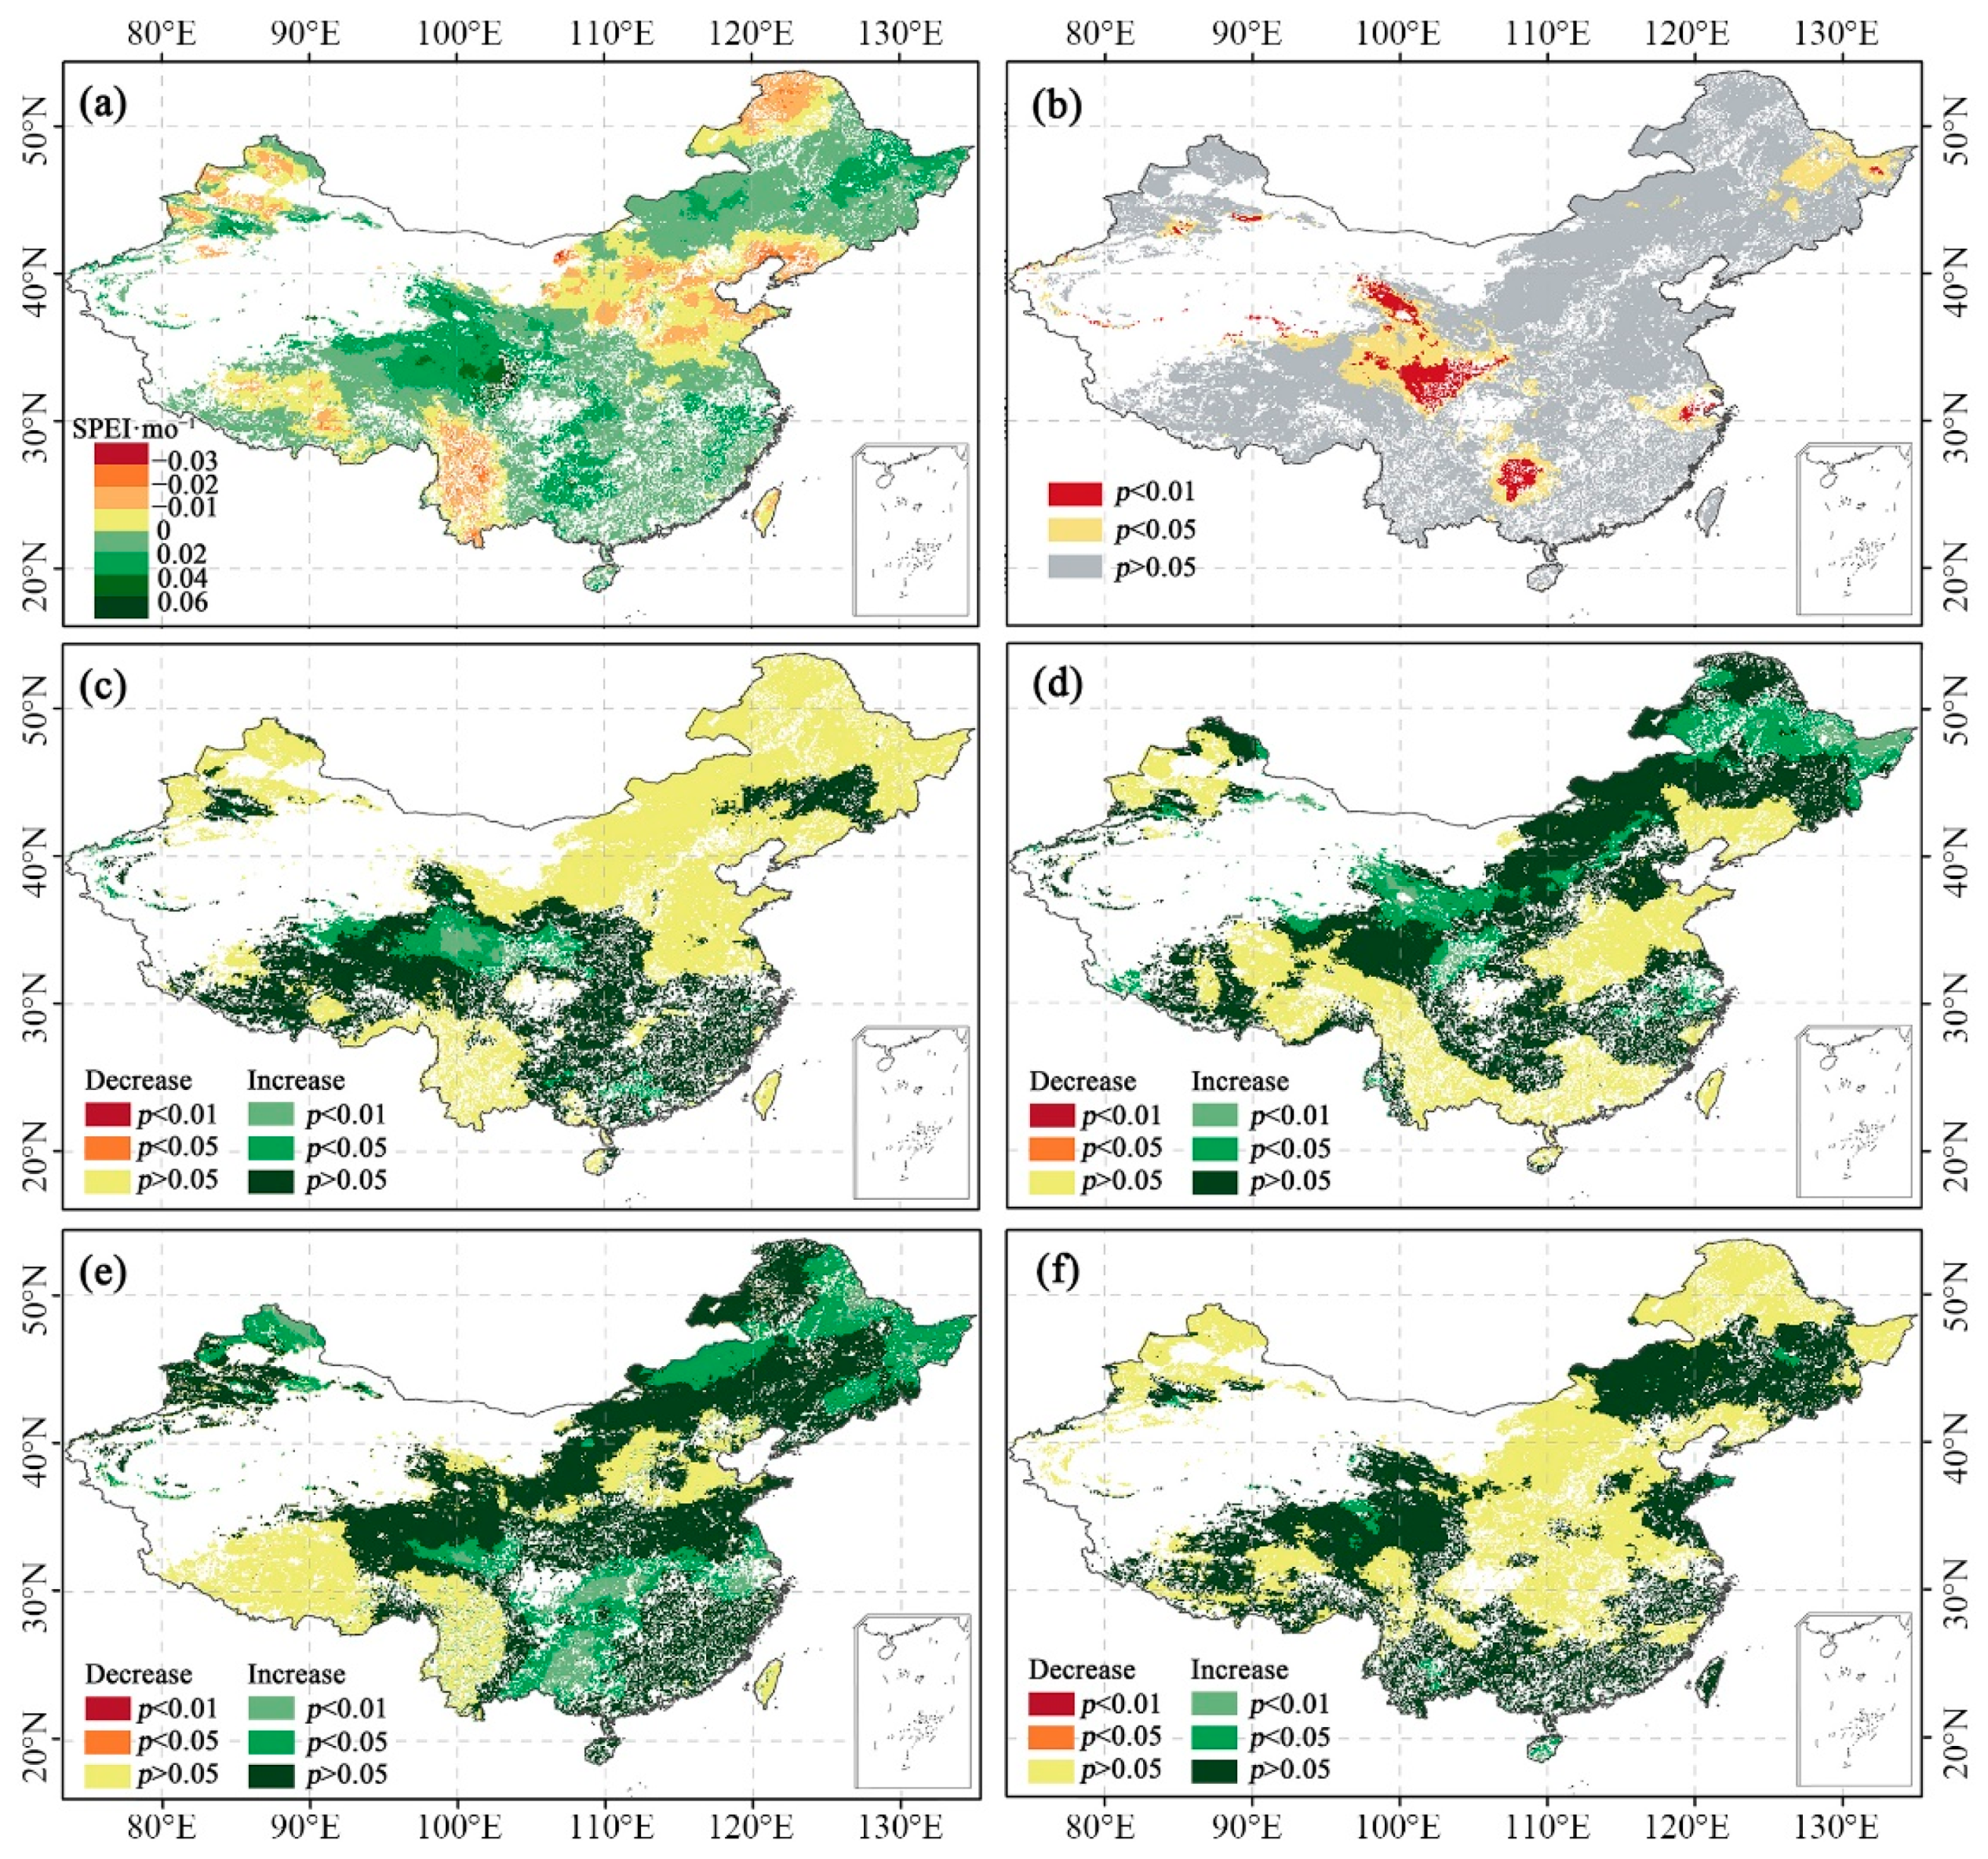
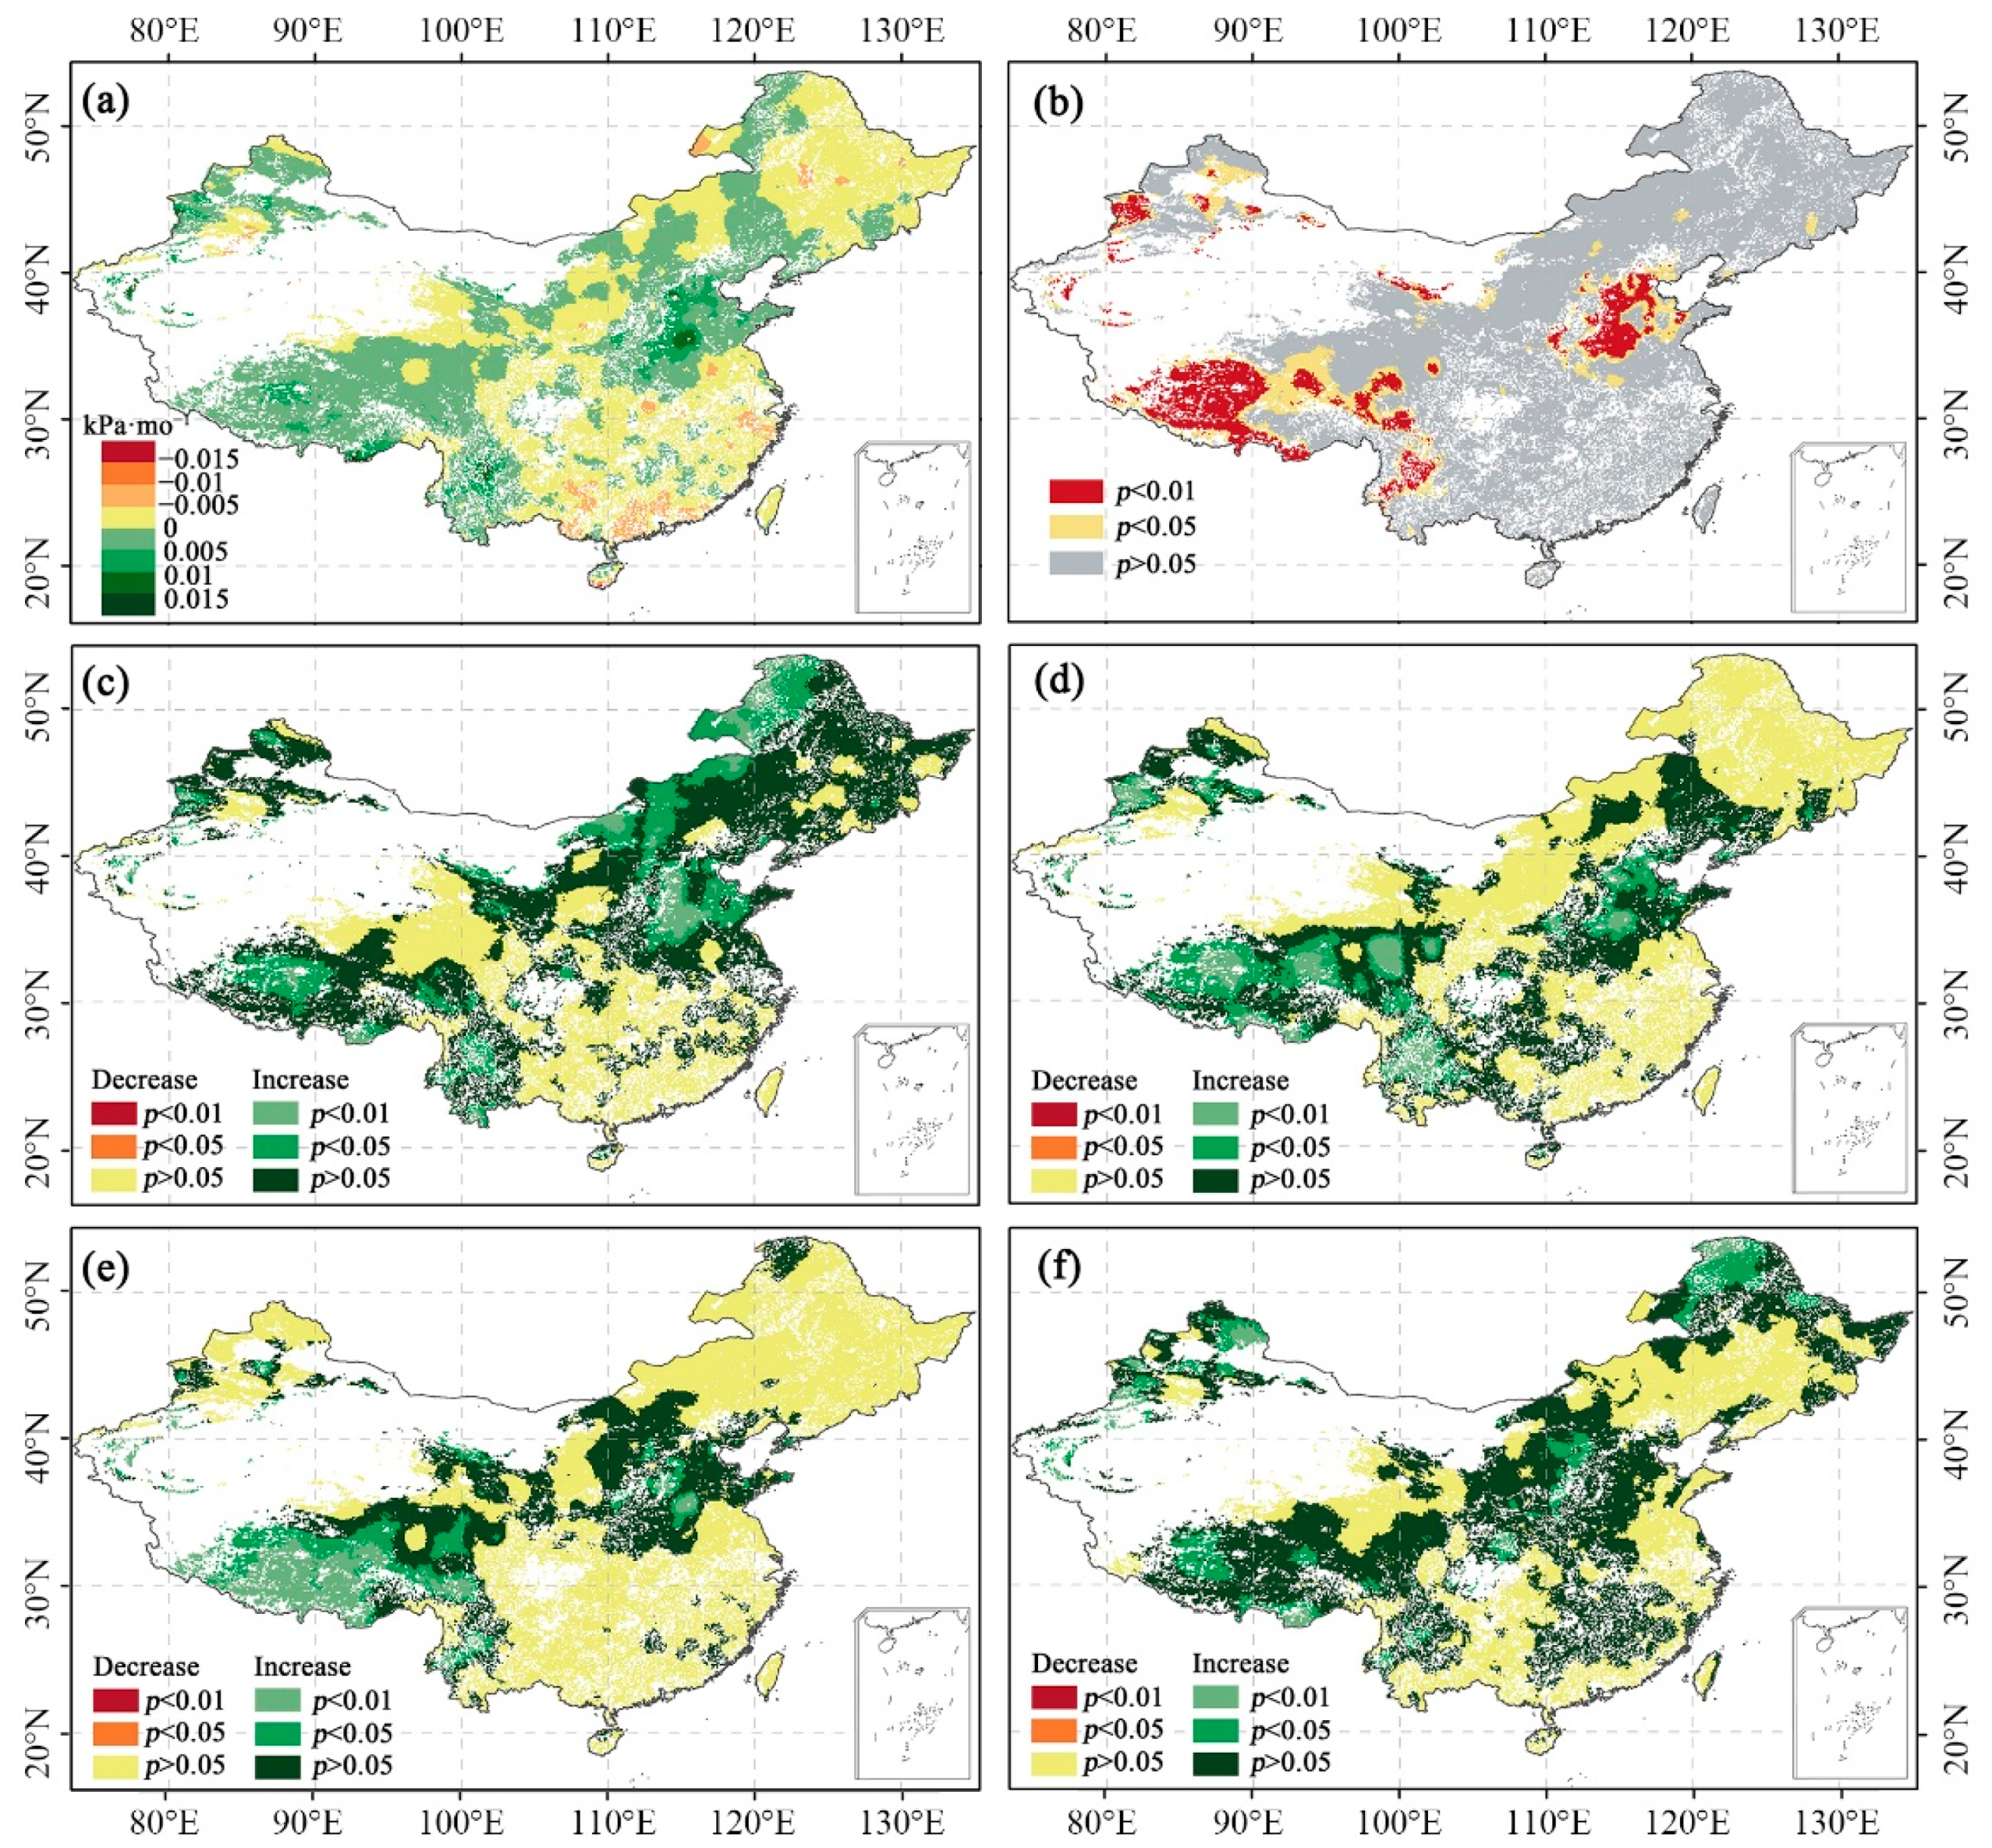
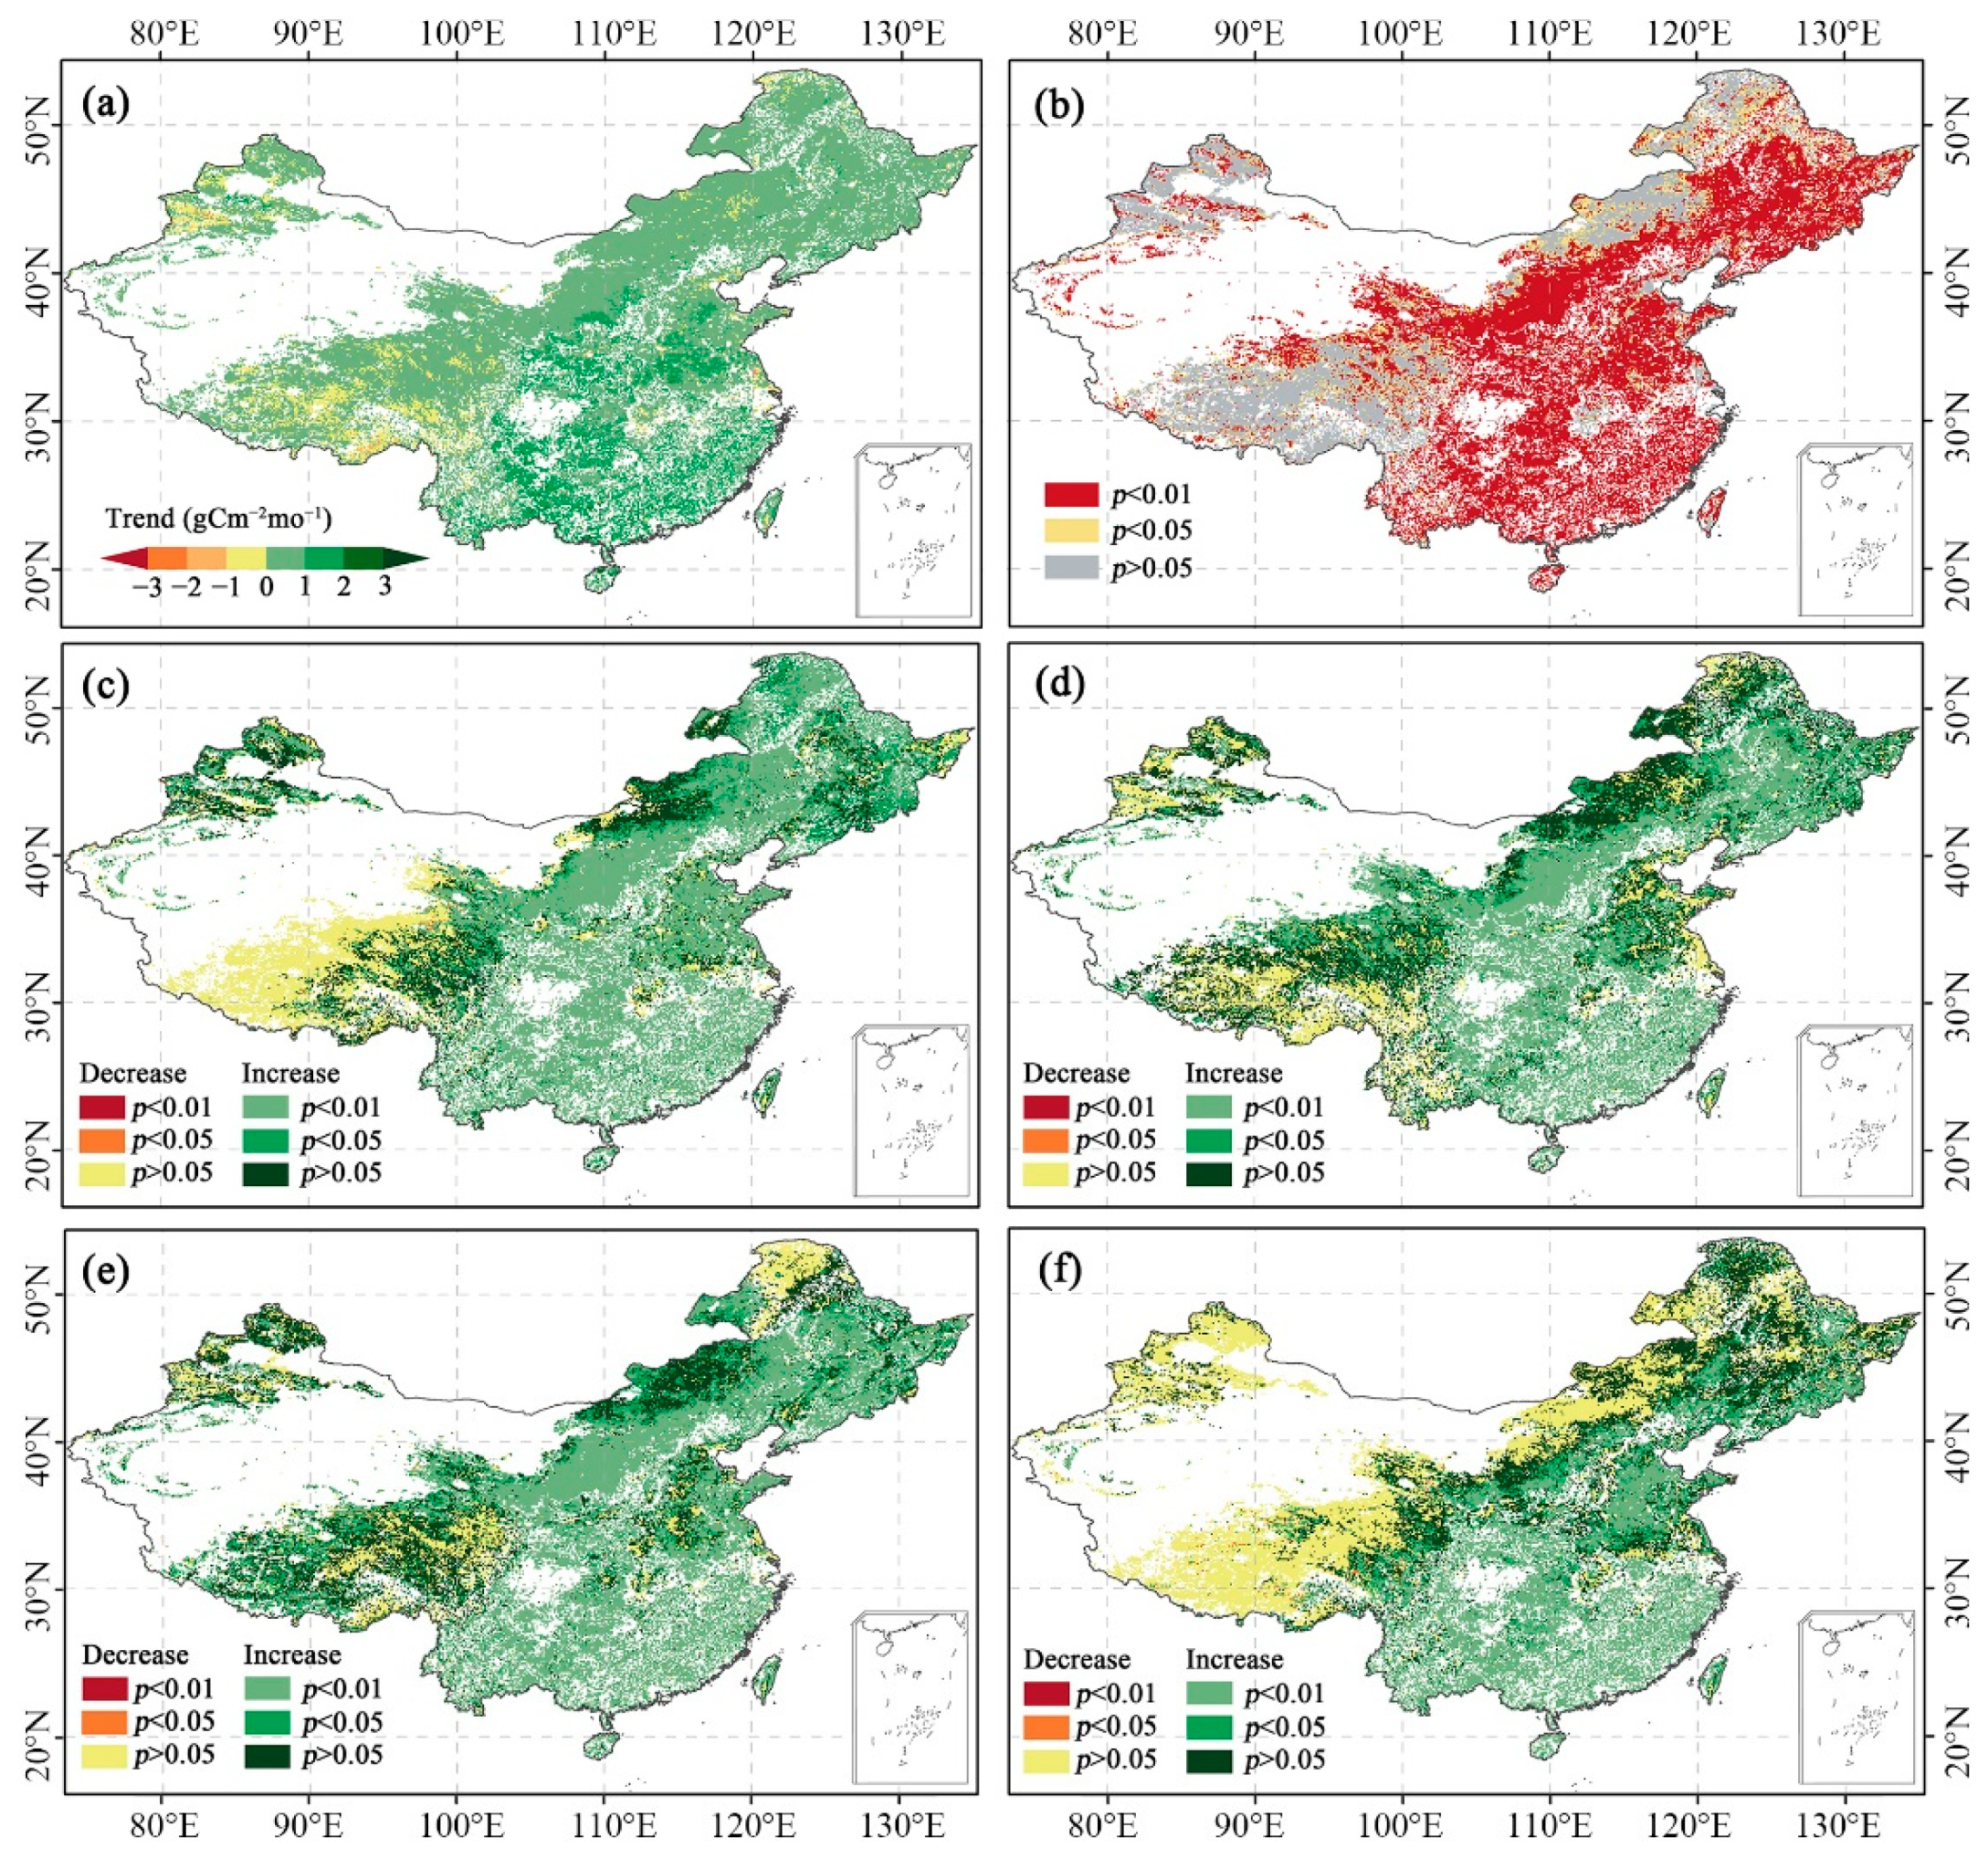
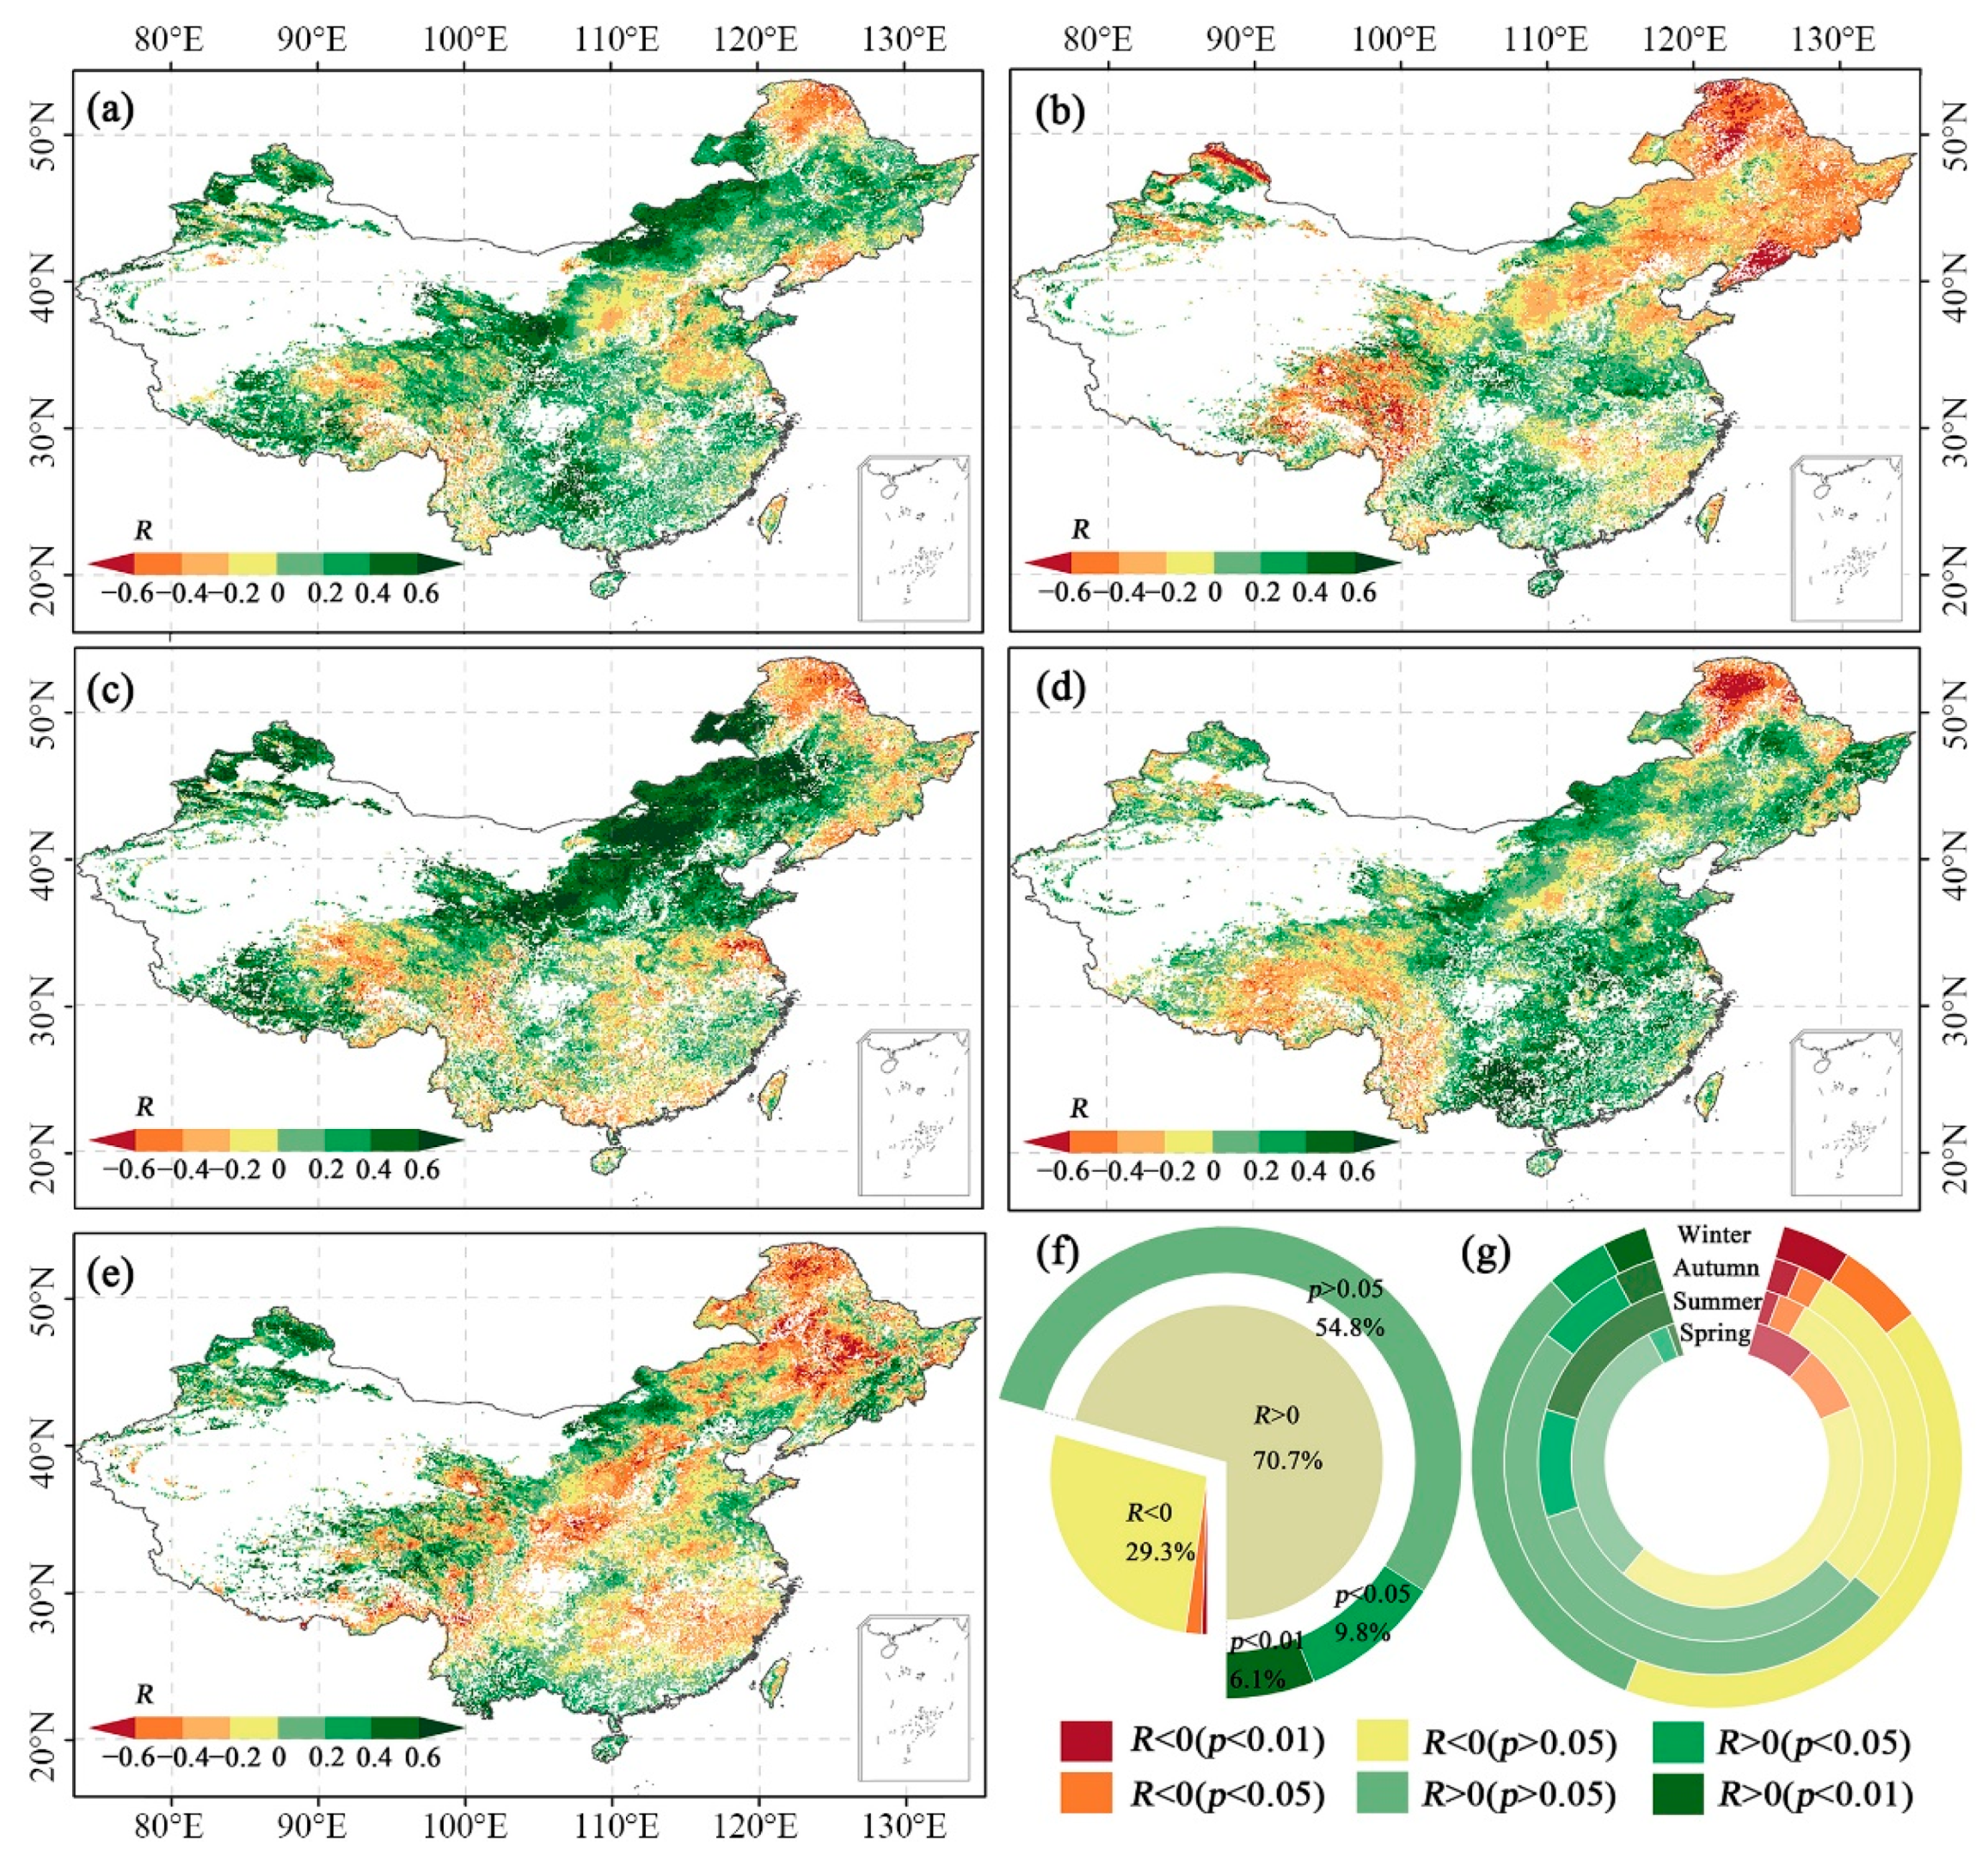
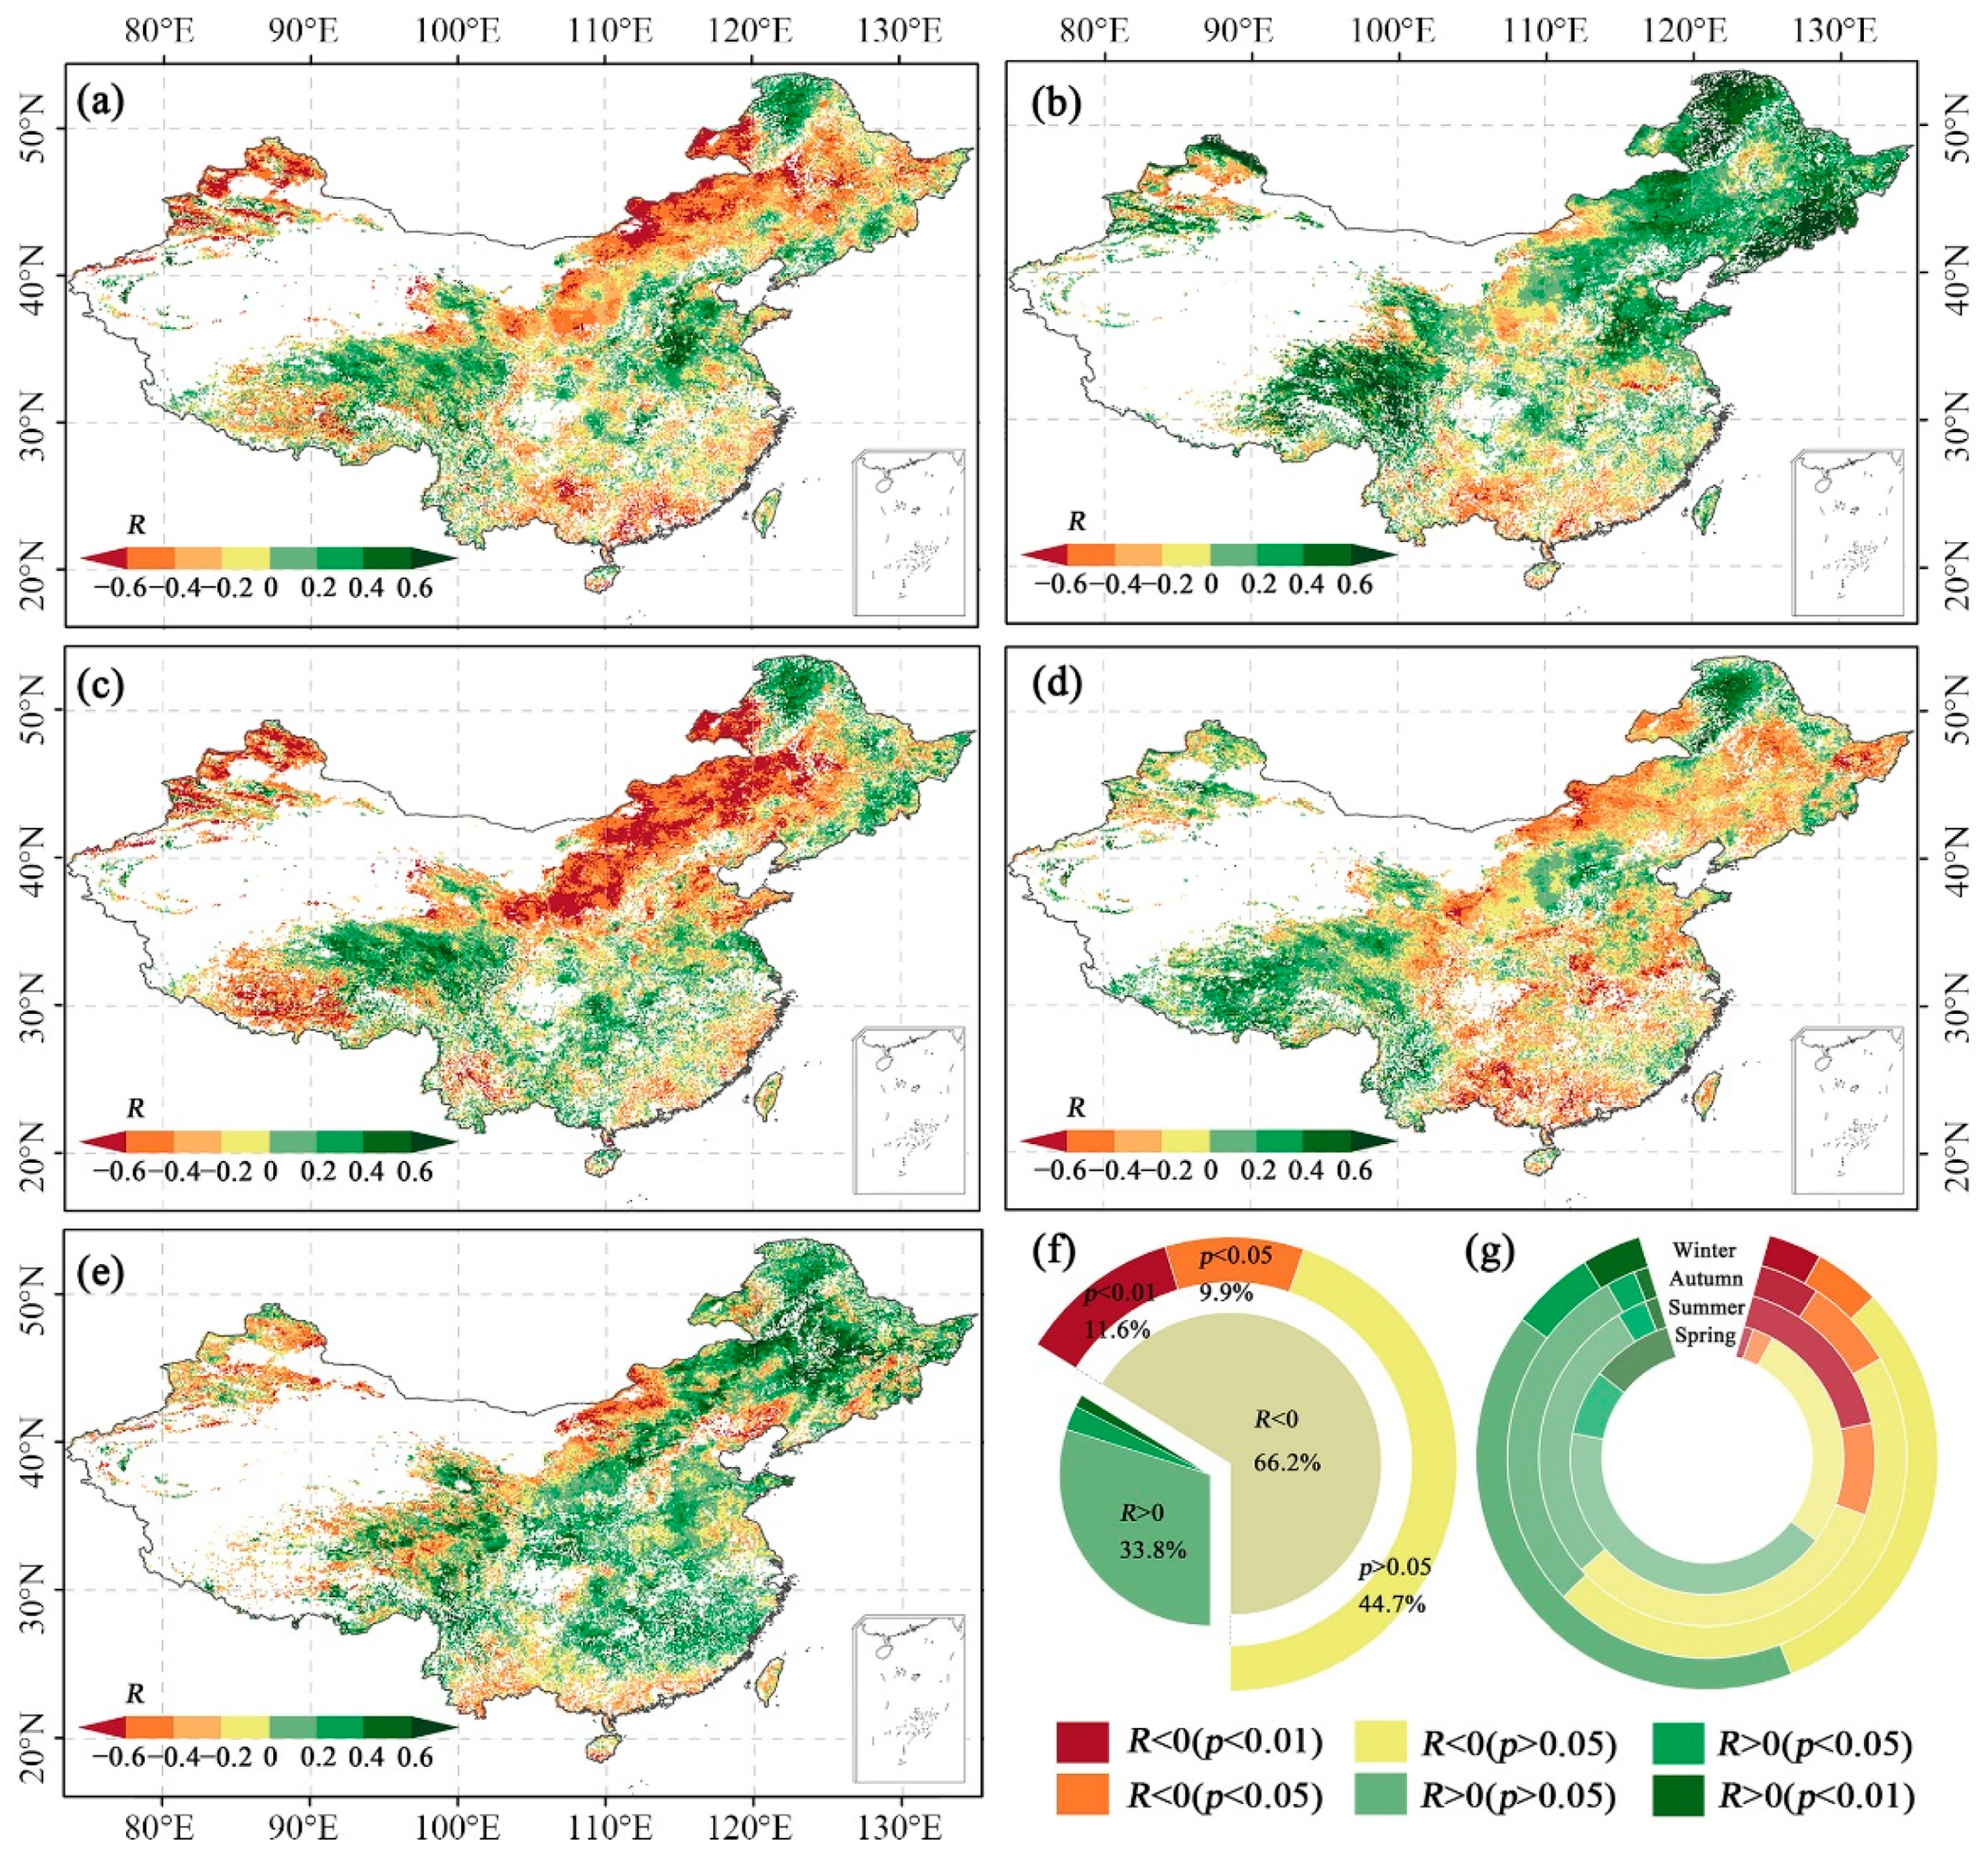
3.1. Variation Trends of Meteorological Drought Indices and Vegetation GPP

We used the M–K test method to analyze the annual trend, seasonal trend, and significance of SPEI and VPD trends from 2001 to 2020 (Figure 2). From the perspective of the annual average change trend (Figure 2a), the SPEI, accounting for 68.0% of the total area, showed an upward trend. The areas showing a decreasing trend were mainly distributed in southwest and northern China.
The analysis of the seasonal change trend in SPEI showed large differences in the changing trend when different seasons were considered (Figure 2c–f). Among the different seasons, the largest proportion of area (~54.3%) with a decreasing trend according to the SPEI was found in spring, while the smallest proportion (~19.9%) was found in autumn. However, it is worth noting that the regions with decreasing trends were not significant (p > 0.05) during the four seasons. In terms of vegetation types, for the annually averaged SPEI trends, evergreen forests presented the largest proportion (~46.4%) of decreasing trends, while mixed forests showed the smallest (~15.1%) (Table 2).
Similarly, the spatial distribution of the annual average and seasonal trends of VPD are shown in Figure 3. The trend of dryness and wetness changes, characterized by VPD and SPEI, are generally consistent. The area with an increasing trend of annual average VPD accounted for 53.1% of the total area. Furthermore, the regions with significant trends showed upward tendencies. As with SPEI, the changing trend of VPD in different seasons also varied. Among the different seasons, the largest proportion (~71.5%) of areas with an increasing trend of VPD was found in spring, while the smallest (~41.6%) was found in autumn. In all four seasons, a significant upward trend was observed. As for different vegetation types, grasslands had the largest proportion (~65.1%) of increasing trends, while mixed forests had the smallest (~25.2%) (Table 2).
Finally, the same results are presented for GPP in Figure 4. Annual GPP showed an overall upward trend, with 90.7% of the regions showing an increasing trend and 9.3% showing a decreasing trend from 2001 to 2020. Except for the decline in GPP in some areas in western China, most of the other regions presented positive tendencies, with highly significant increasing trends (p < 0.01). On the contrary, the values for the areas with a downward trend were not significant (p > 0.05). Among the different seasons, the largest proportion (~87.8%) of areas with an increasing trend of GPP was found in autumn, while the smallest (~65.9%) was found in winter. From the perspective of different vegetation types, deciduous forests had the largest proportion (~97.5%) of increasing trends, while evergreen forests had the smallest (80.1%) (Table 2).

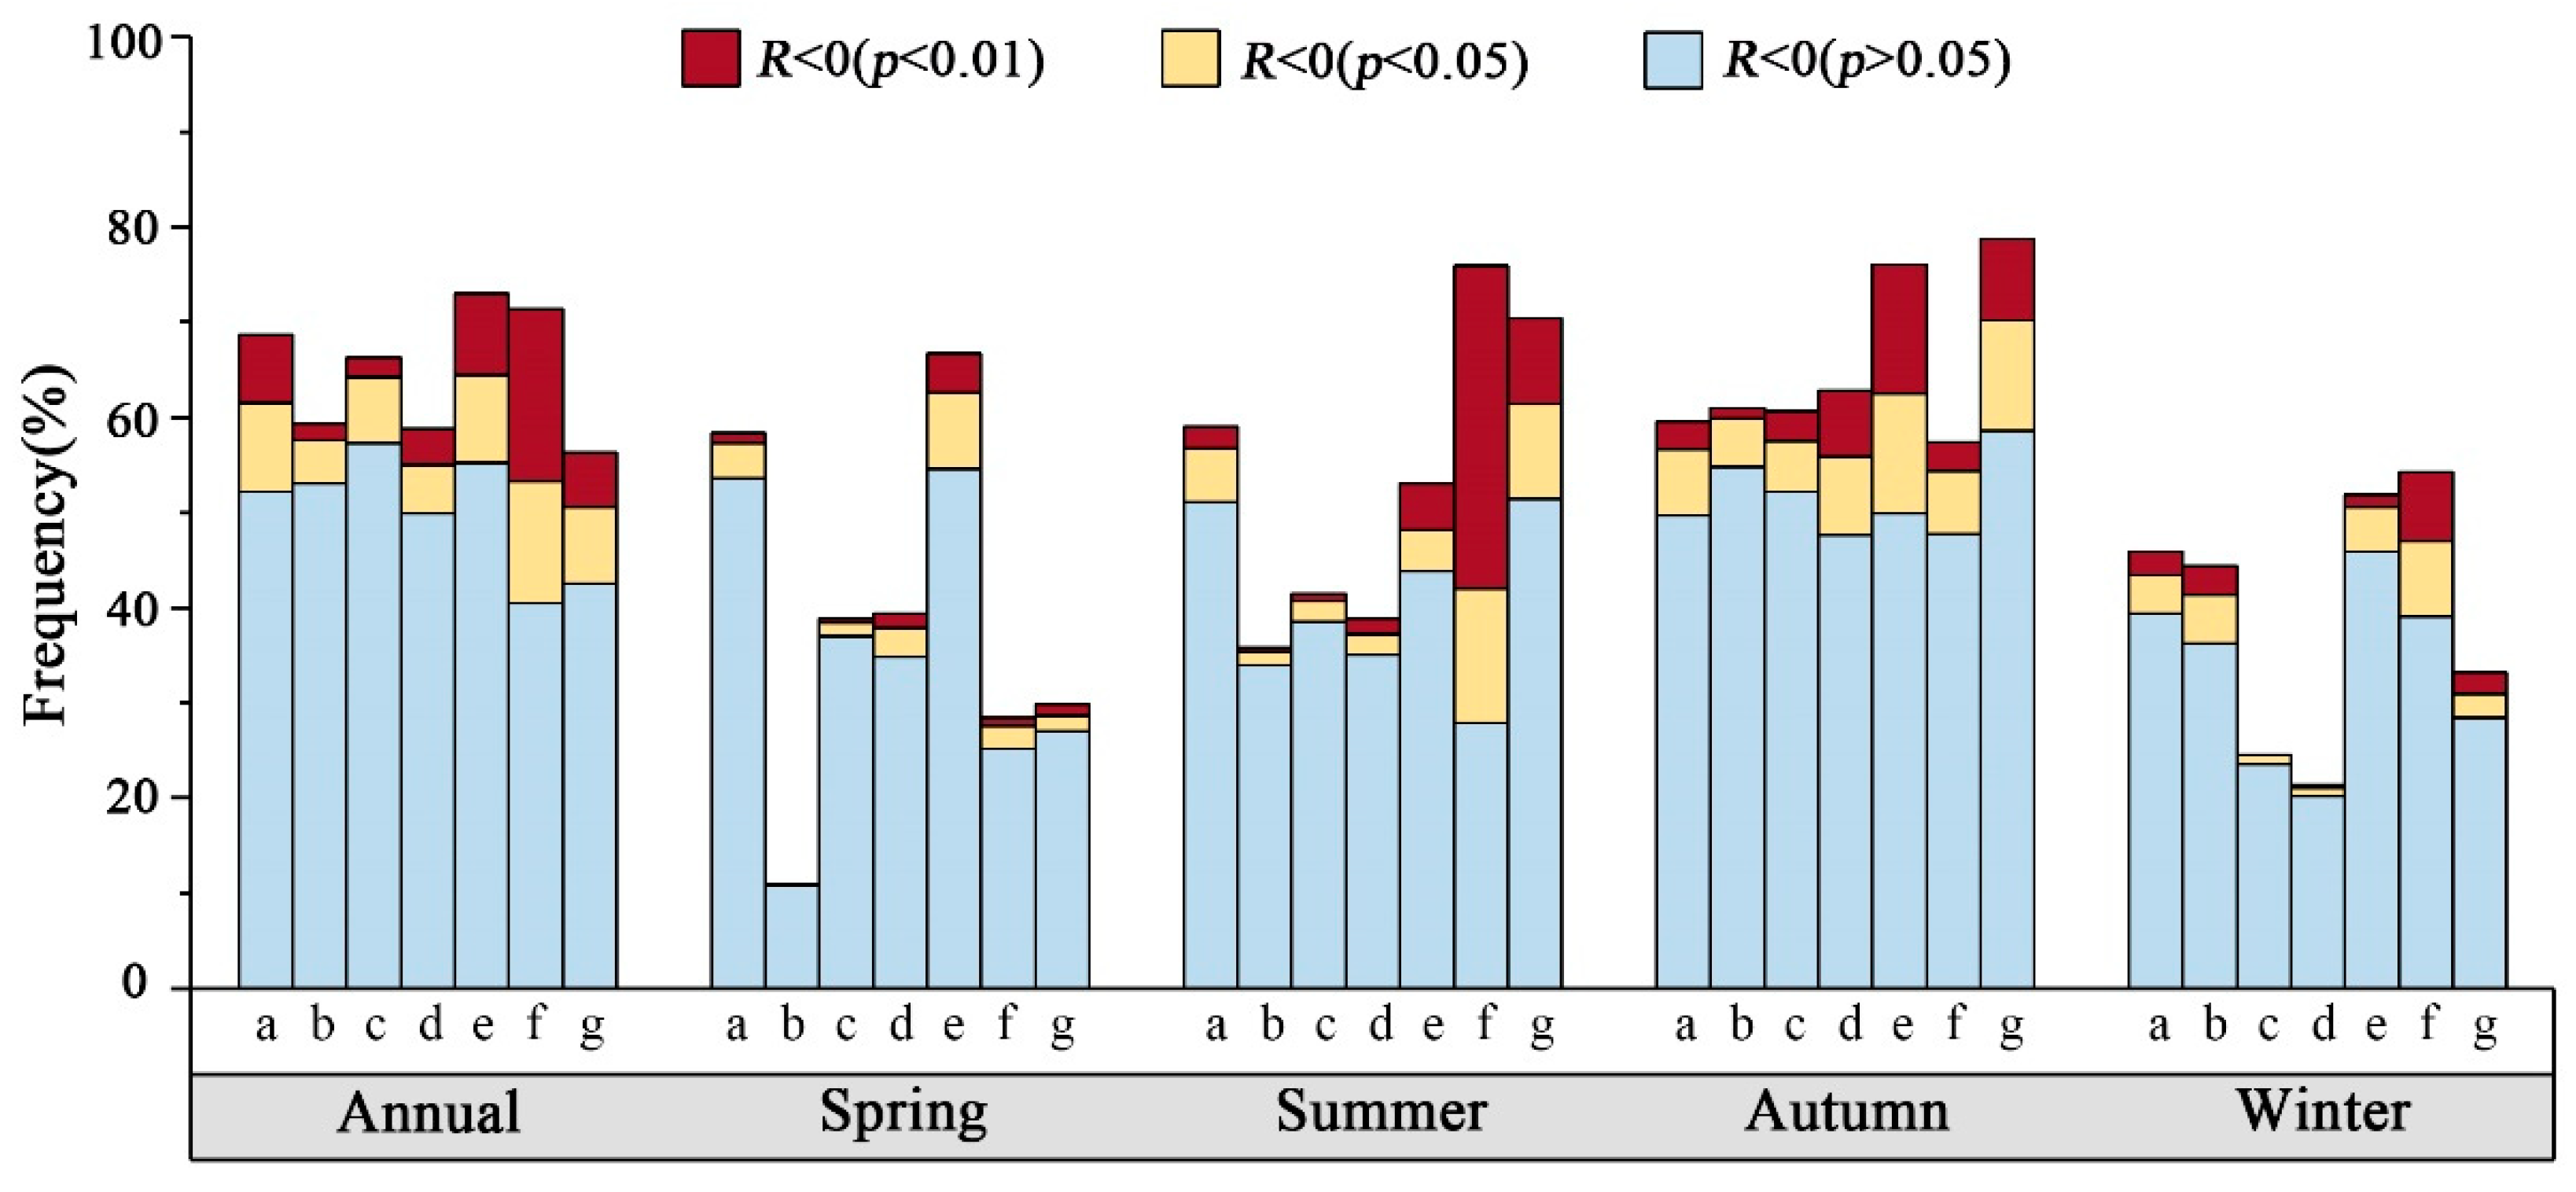
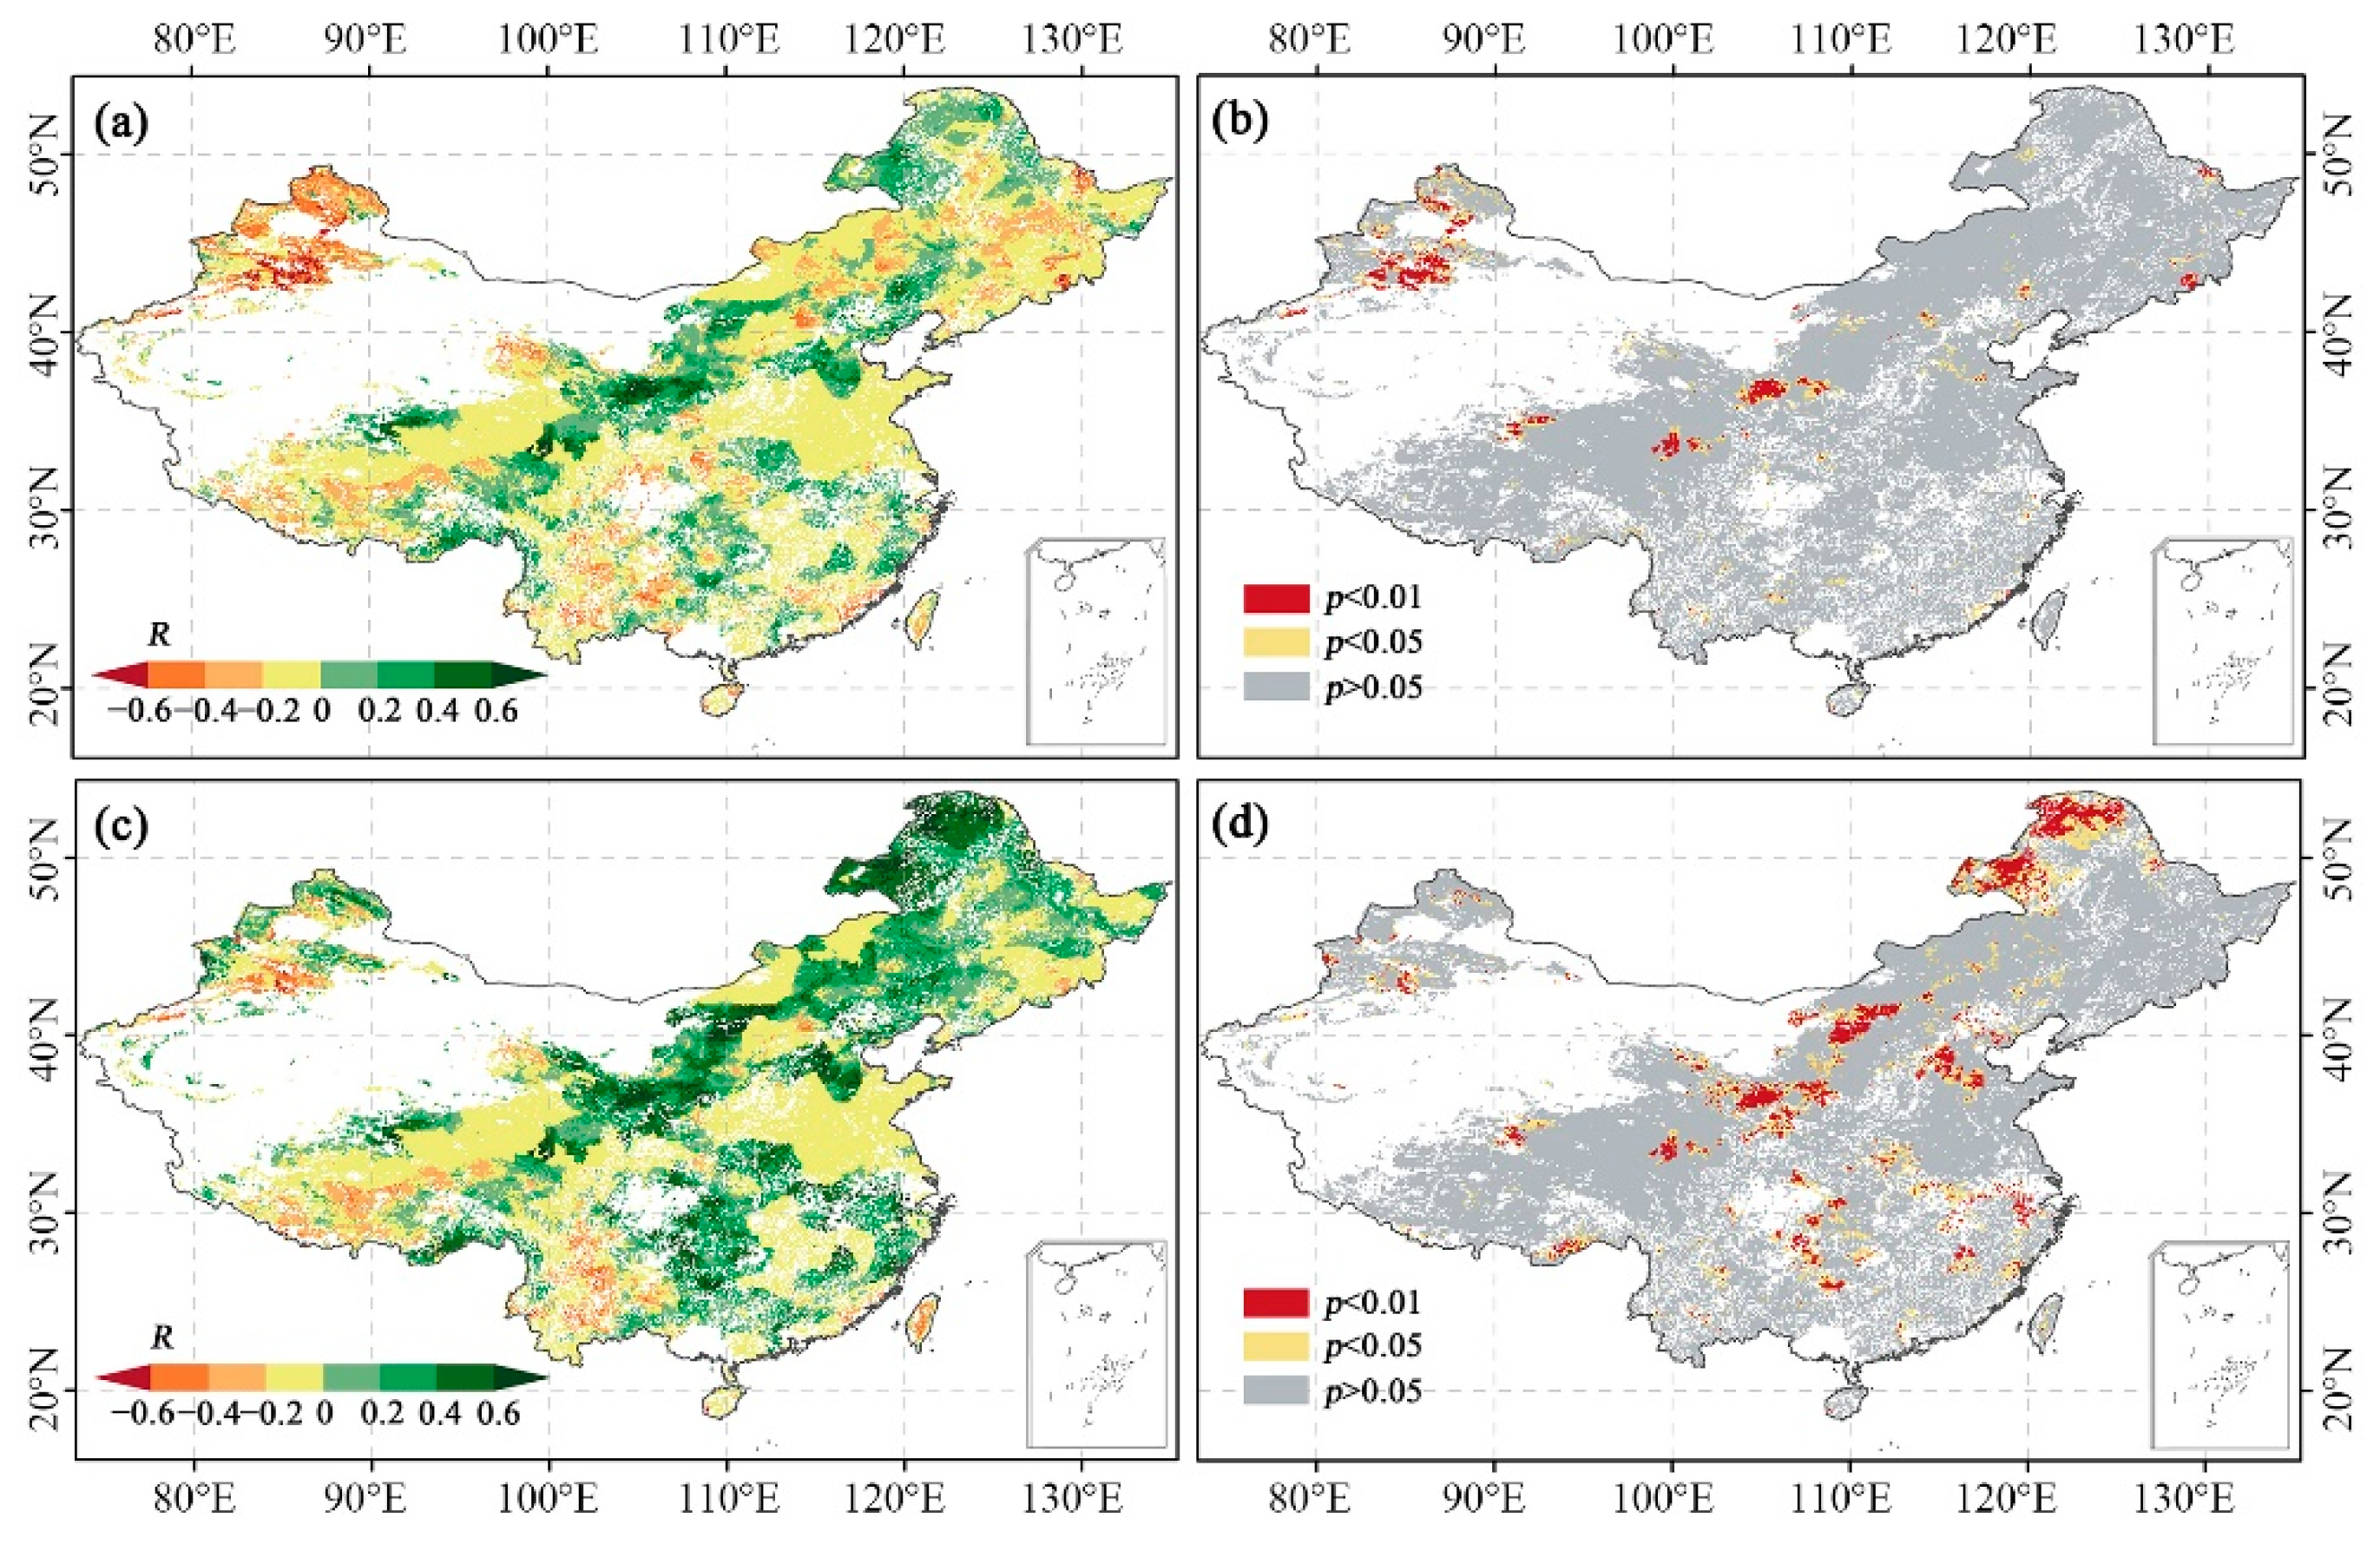
3.2. The Relationship between Meteorological Drought Indices and Vegetation GPP

To characterize the influence of water deficit on vegetation, the Pearson correlation was applied to evaluate the correlations between GPP and meteorological drought indices. As shown in Figure 5, 70.7% of the total area showed that SPEI and GPP were positively correlated. In addition, 9.8% of the area showed a significant positive correlation (p < 0.05), and 6.1% showed a highly significant positive correlation (p < 0.01). The regions that showed a significant positive correlation were mainly concentrated in northern China. For different seasons, the proportion of positively correlated GPP and SPEI is larger in summer and autumn, accounting for 64.6% (with 27.9% having a significant positive correlation, namely, p < 0.05 and p < 0.01) and 65.3% (with 11.1% having a significant positive correlation, namely, p < 0.05 and p < 0.01), respectively. On the contrary, the proportion of positive correlation in spring and winter is smaller, accounting for 37.6% and 43.2%, respectively.
Figure 6 shows the frequency distribution (%) of the areas with a positive correlation (R > 0) between GPP and SPEI among different seasons and vegetation types. At the annual scale, water deficit had the greatest negative impact (R > 0) on GPP in savannas (80.0%) and the least impact on evergreen forests (54.8%). The sensitivity of vegetation to water deficit varied in different seasons. Except for grasslands, all vegetation types showed the strongest sensitivity in autumn. In spring, savannas were the most sensitive to water deficit. Grasslands were the most sensitive to water deficit in both summer and winter, while in autumn, croplands were the most sensitive to water deficit.
We further examined the correlation between GPP and VPD. As shown in Figure 7, 66.2% of the total area showed that GPP and VPD were negatively correlated, indicating that water deficit has a particular inhibitory effect on GPP. In addition, 9.9% of the area showed a significant negative correlation (p < 0.05), and 11.6% showed a highly significant negative correlation (p < 0.01). Similar to SPEI, the regions that showed significant negative correlations were mainly concentrated in northern China. For different seasons, the proportion of negatively correlated GPP and VPD was larger in summer and autumn, accounting for 64.9% (with 28.8% having a significant positive correlation, namely, p < 0.05 and p < 0.01) and 64.2% (with 13.6% having a significant positive correlation, namely, p < 0.05 and p < 0.01), respectively. On the contrary, the proportion of negative correlation in spring and winter was smaller, 34.0% and 43.7%, respectively.
Figure 8 shows the frequency distribution (%) of the areas with a negative correlation (R < 0) between GPP and VPD for different seasons and vegetation types in the study area. At the annual scale, water deficit had the greatest negative impact (R < 0) on GPP in savannas (73.0%) and the least impact on croplands (56.3%). The sensitivity of vegetation to water deficit varied in different seasons. Except for grasslands, all vegetation types showed the strongest sensitivity in autumn. In spring, savannas were the most sensitive to water deficit. Grasslands were the most sensitive to water deficit in both summer and winter. In autumn, croplands were the most sensitive to water deficit. This result is consistent with the relationship between GPP and SPEI.

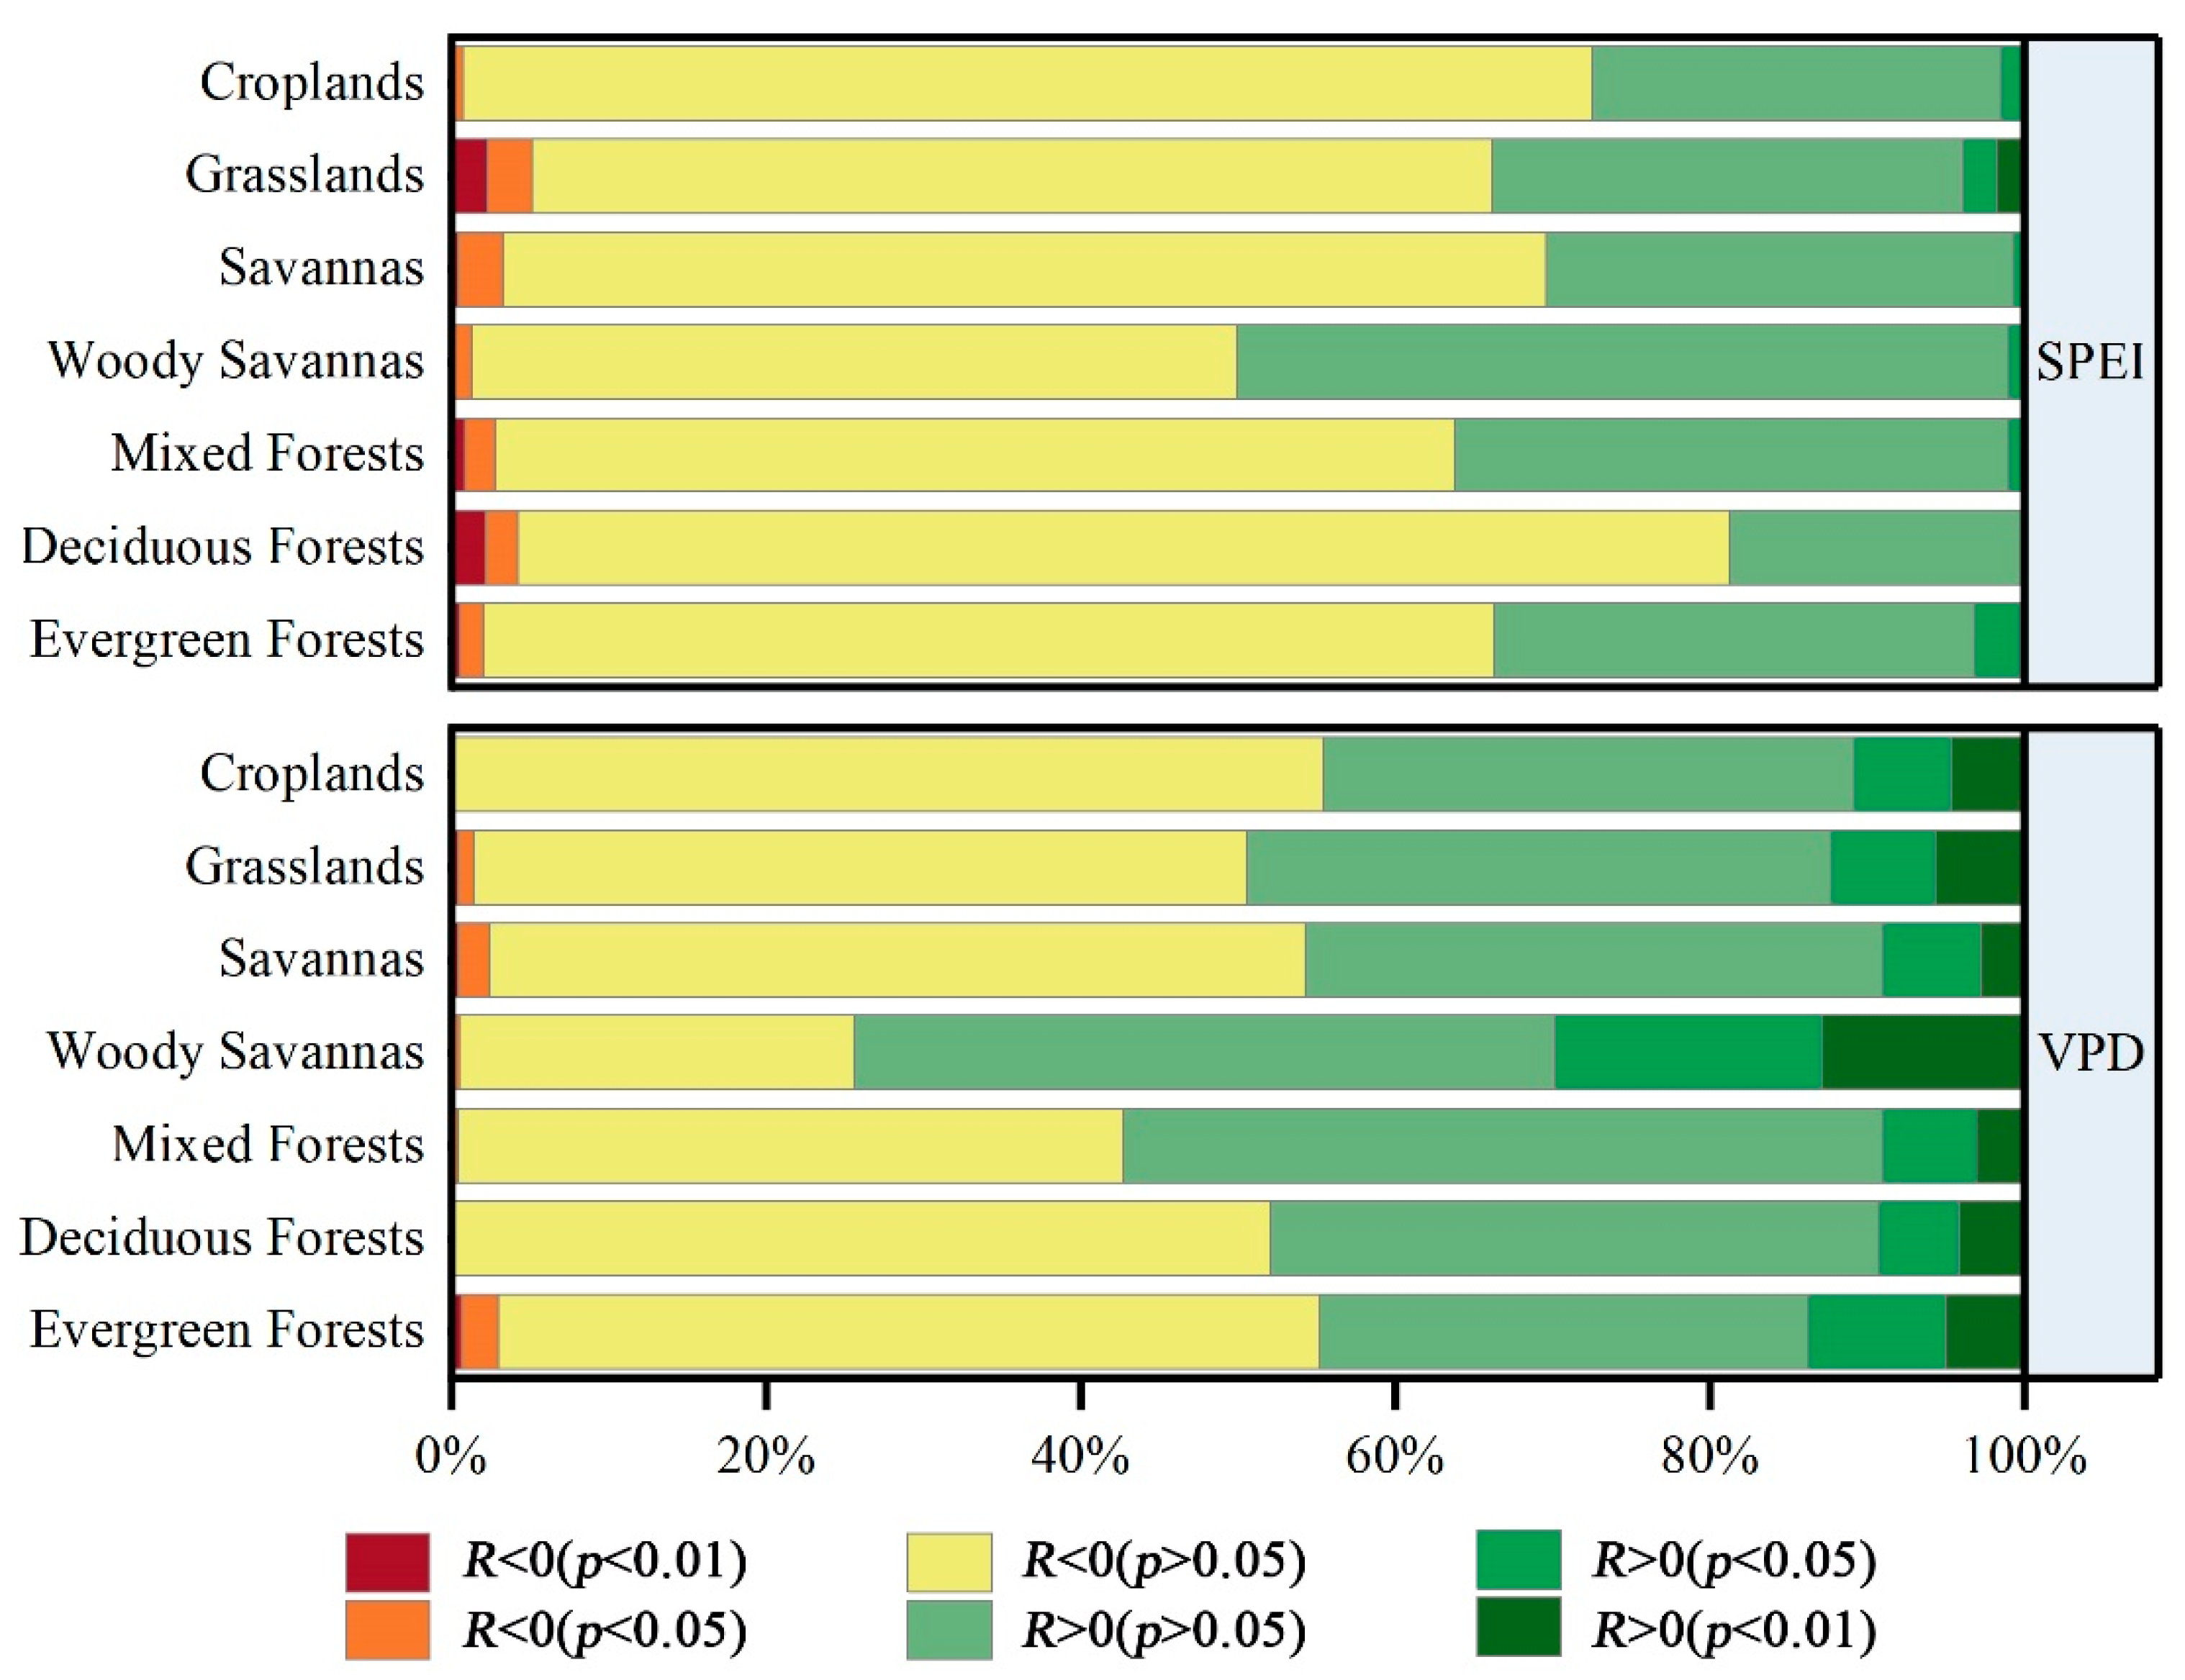
3.3. The Impact of Drought on Vegetation GPP

The spatial distribution of the correlation coefficients between GPPdrought_month and SPEIdrought_month/VPDdrought_month and the p-value are shown in Figure 9. We found that the GPPdrought_month was negatively correlated with SPEIdrought_month over 66.3% of the study area (Figure 9a). Among these, 5.1% showed a significant negative correlation (p < 0.05), which indicated an inhibitory effect of drought on GPP. The area in which GPPdrought_monthwas negatively correlated with VPDdrought_month was 48.7%, with only 1.1% showing a significant negative correlation (p < 0.05). Relative to VPD, the drought indicated by SPEI had a more severe negative impact on vegetation GPP. Furthermore, the spatial distribution showed that the correlation coefficients between the two drought indices and GPP are roughly the same during drought periods, and the regions with larger differences are mainly concentrated in northeast and northwestern China. Both drought indices showed that vegetation growth was inhibited during the drought period in northern and southwestern China, as well as in the Qinghai–Tibet Plateau (situated in southwestern China).
The correlation between GPPdrought_month and SPEIdrought_month/VPDdrought_month for the seven vegetation types in the study area is shown in Figure 10. The correlation coefficients between GPPdrought_month and SPEIdrought_month were mostly negative. Among them, deciduous forests were the most negatively affected by drought, and woody savannas were the least affected. However, the relationship between GPPdrought_month and VPDdrought_month of different types of vegetation showed that the proportion of positive correlation was less than that of SPEIdrought_month. Croplands were the most negatively affected by drought, while woody savannas were the least.

4. Discussion

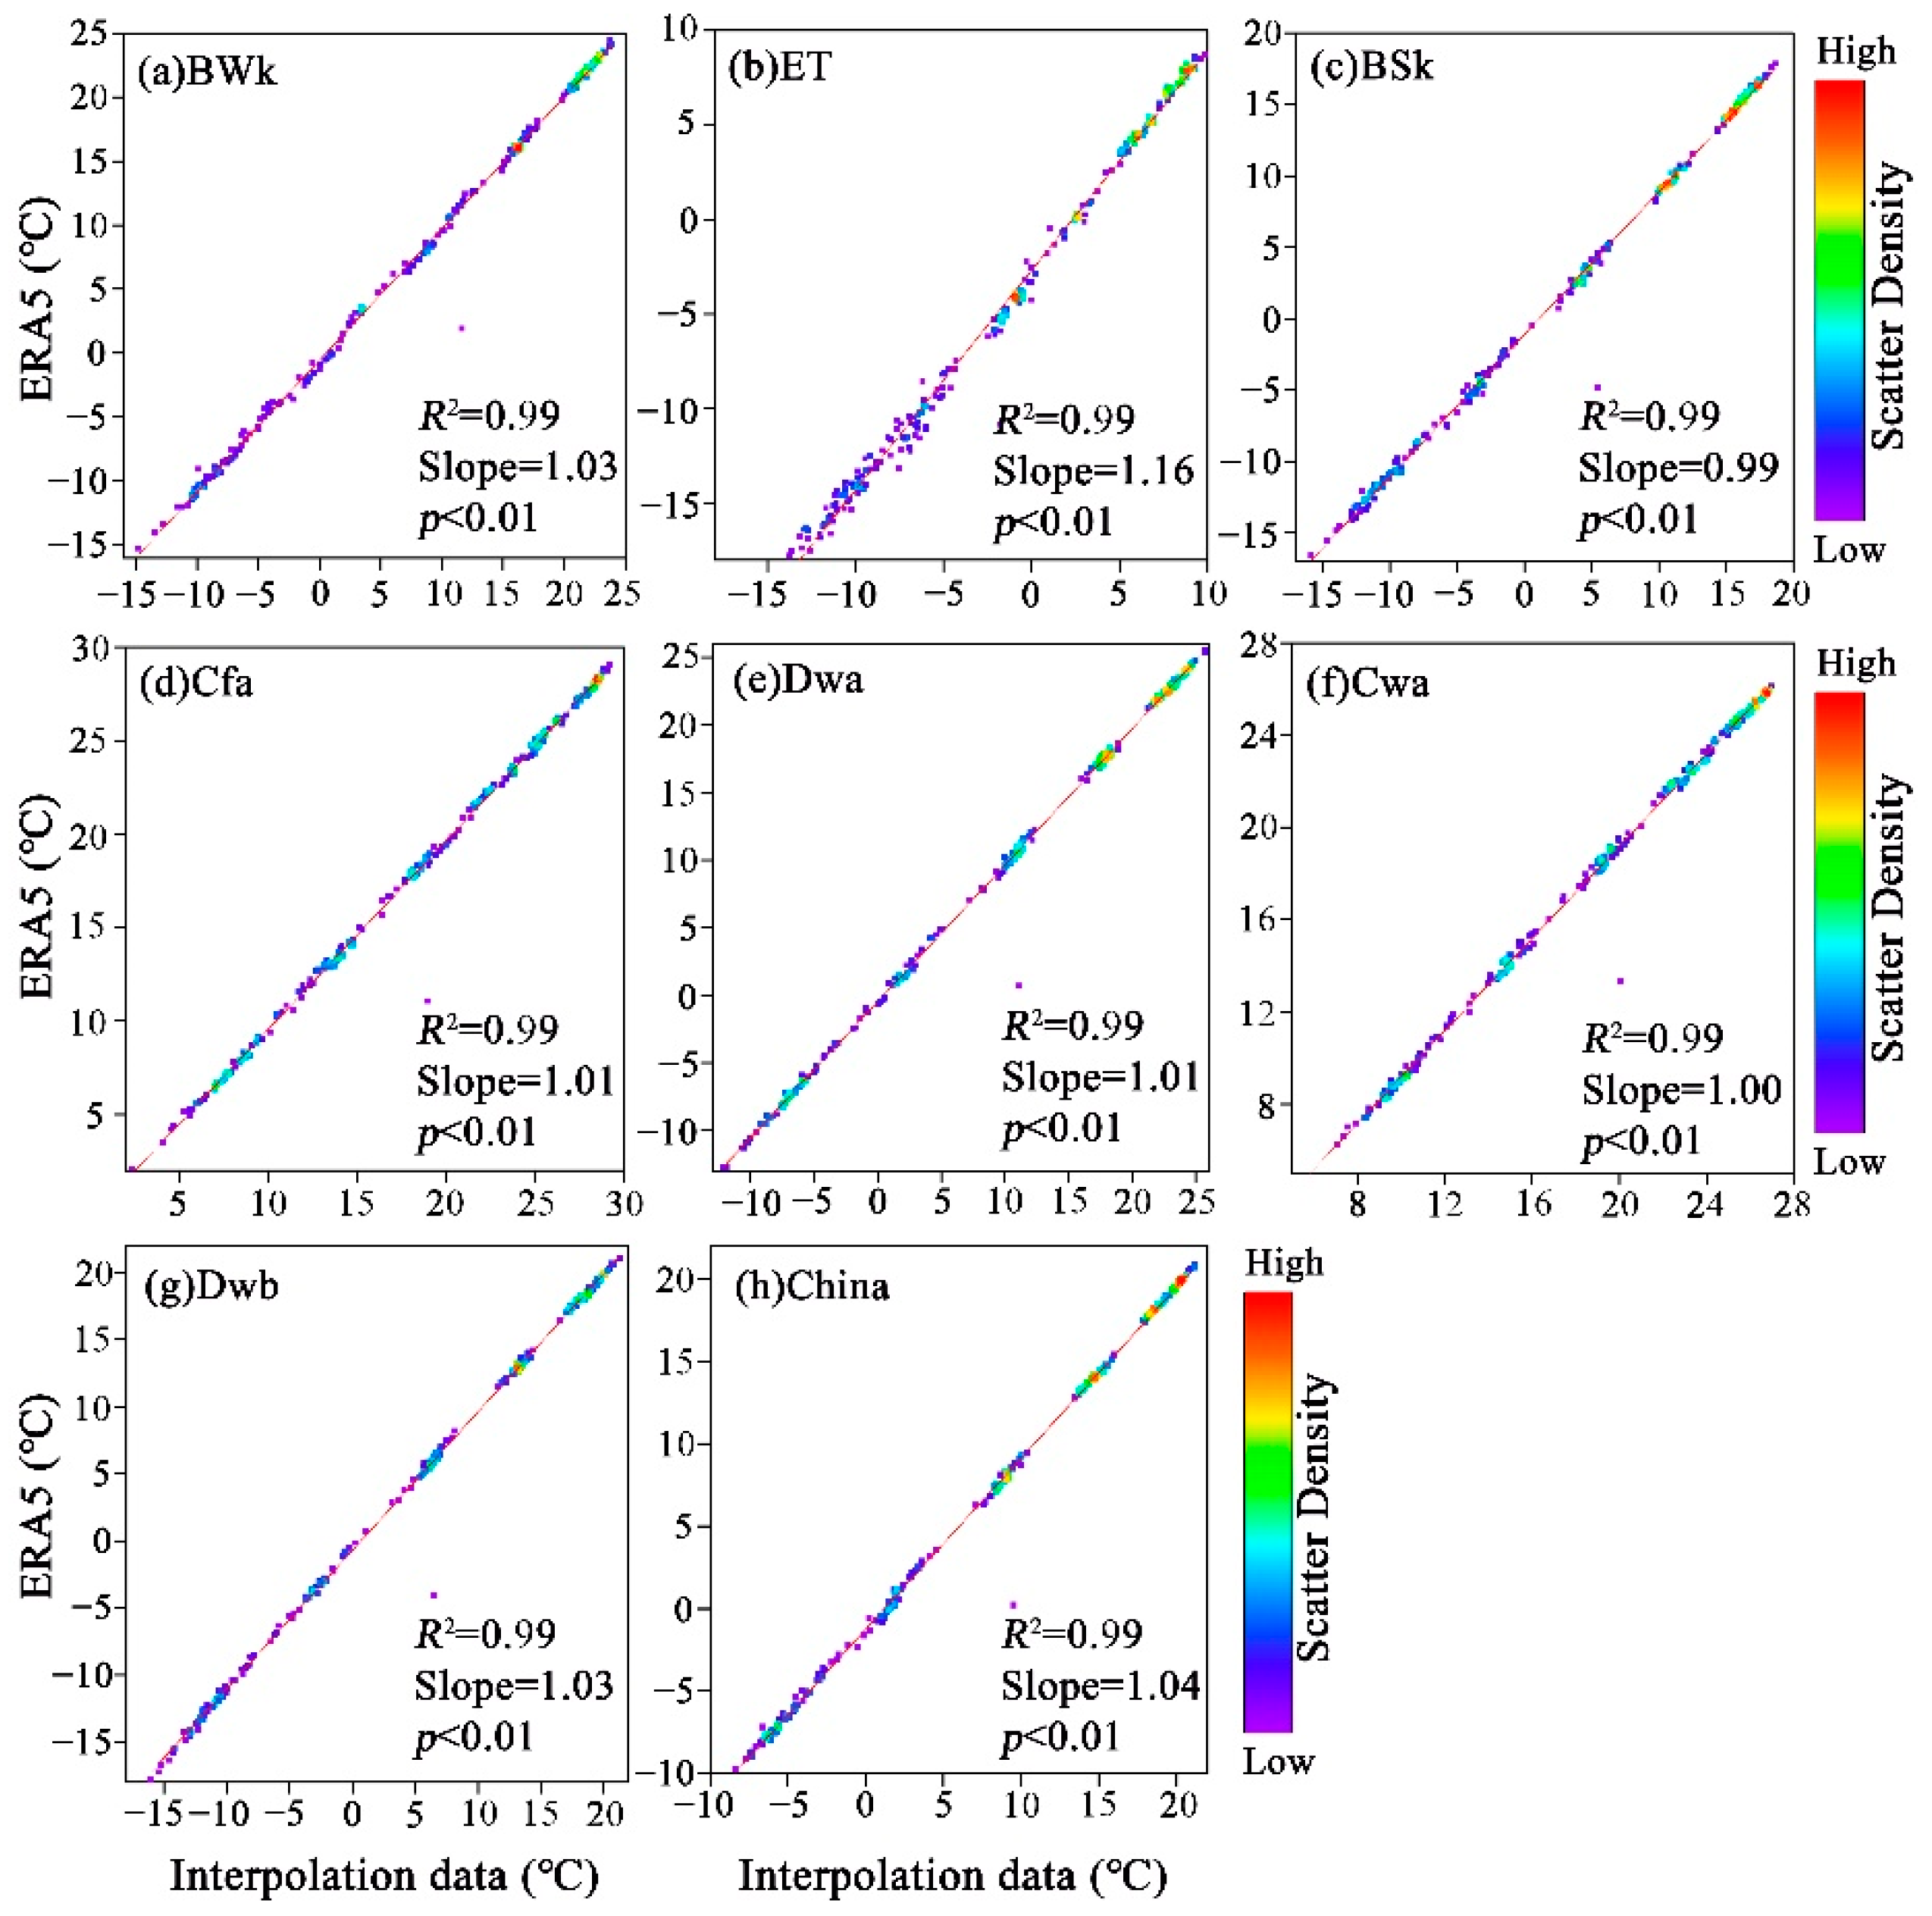
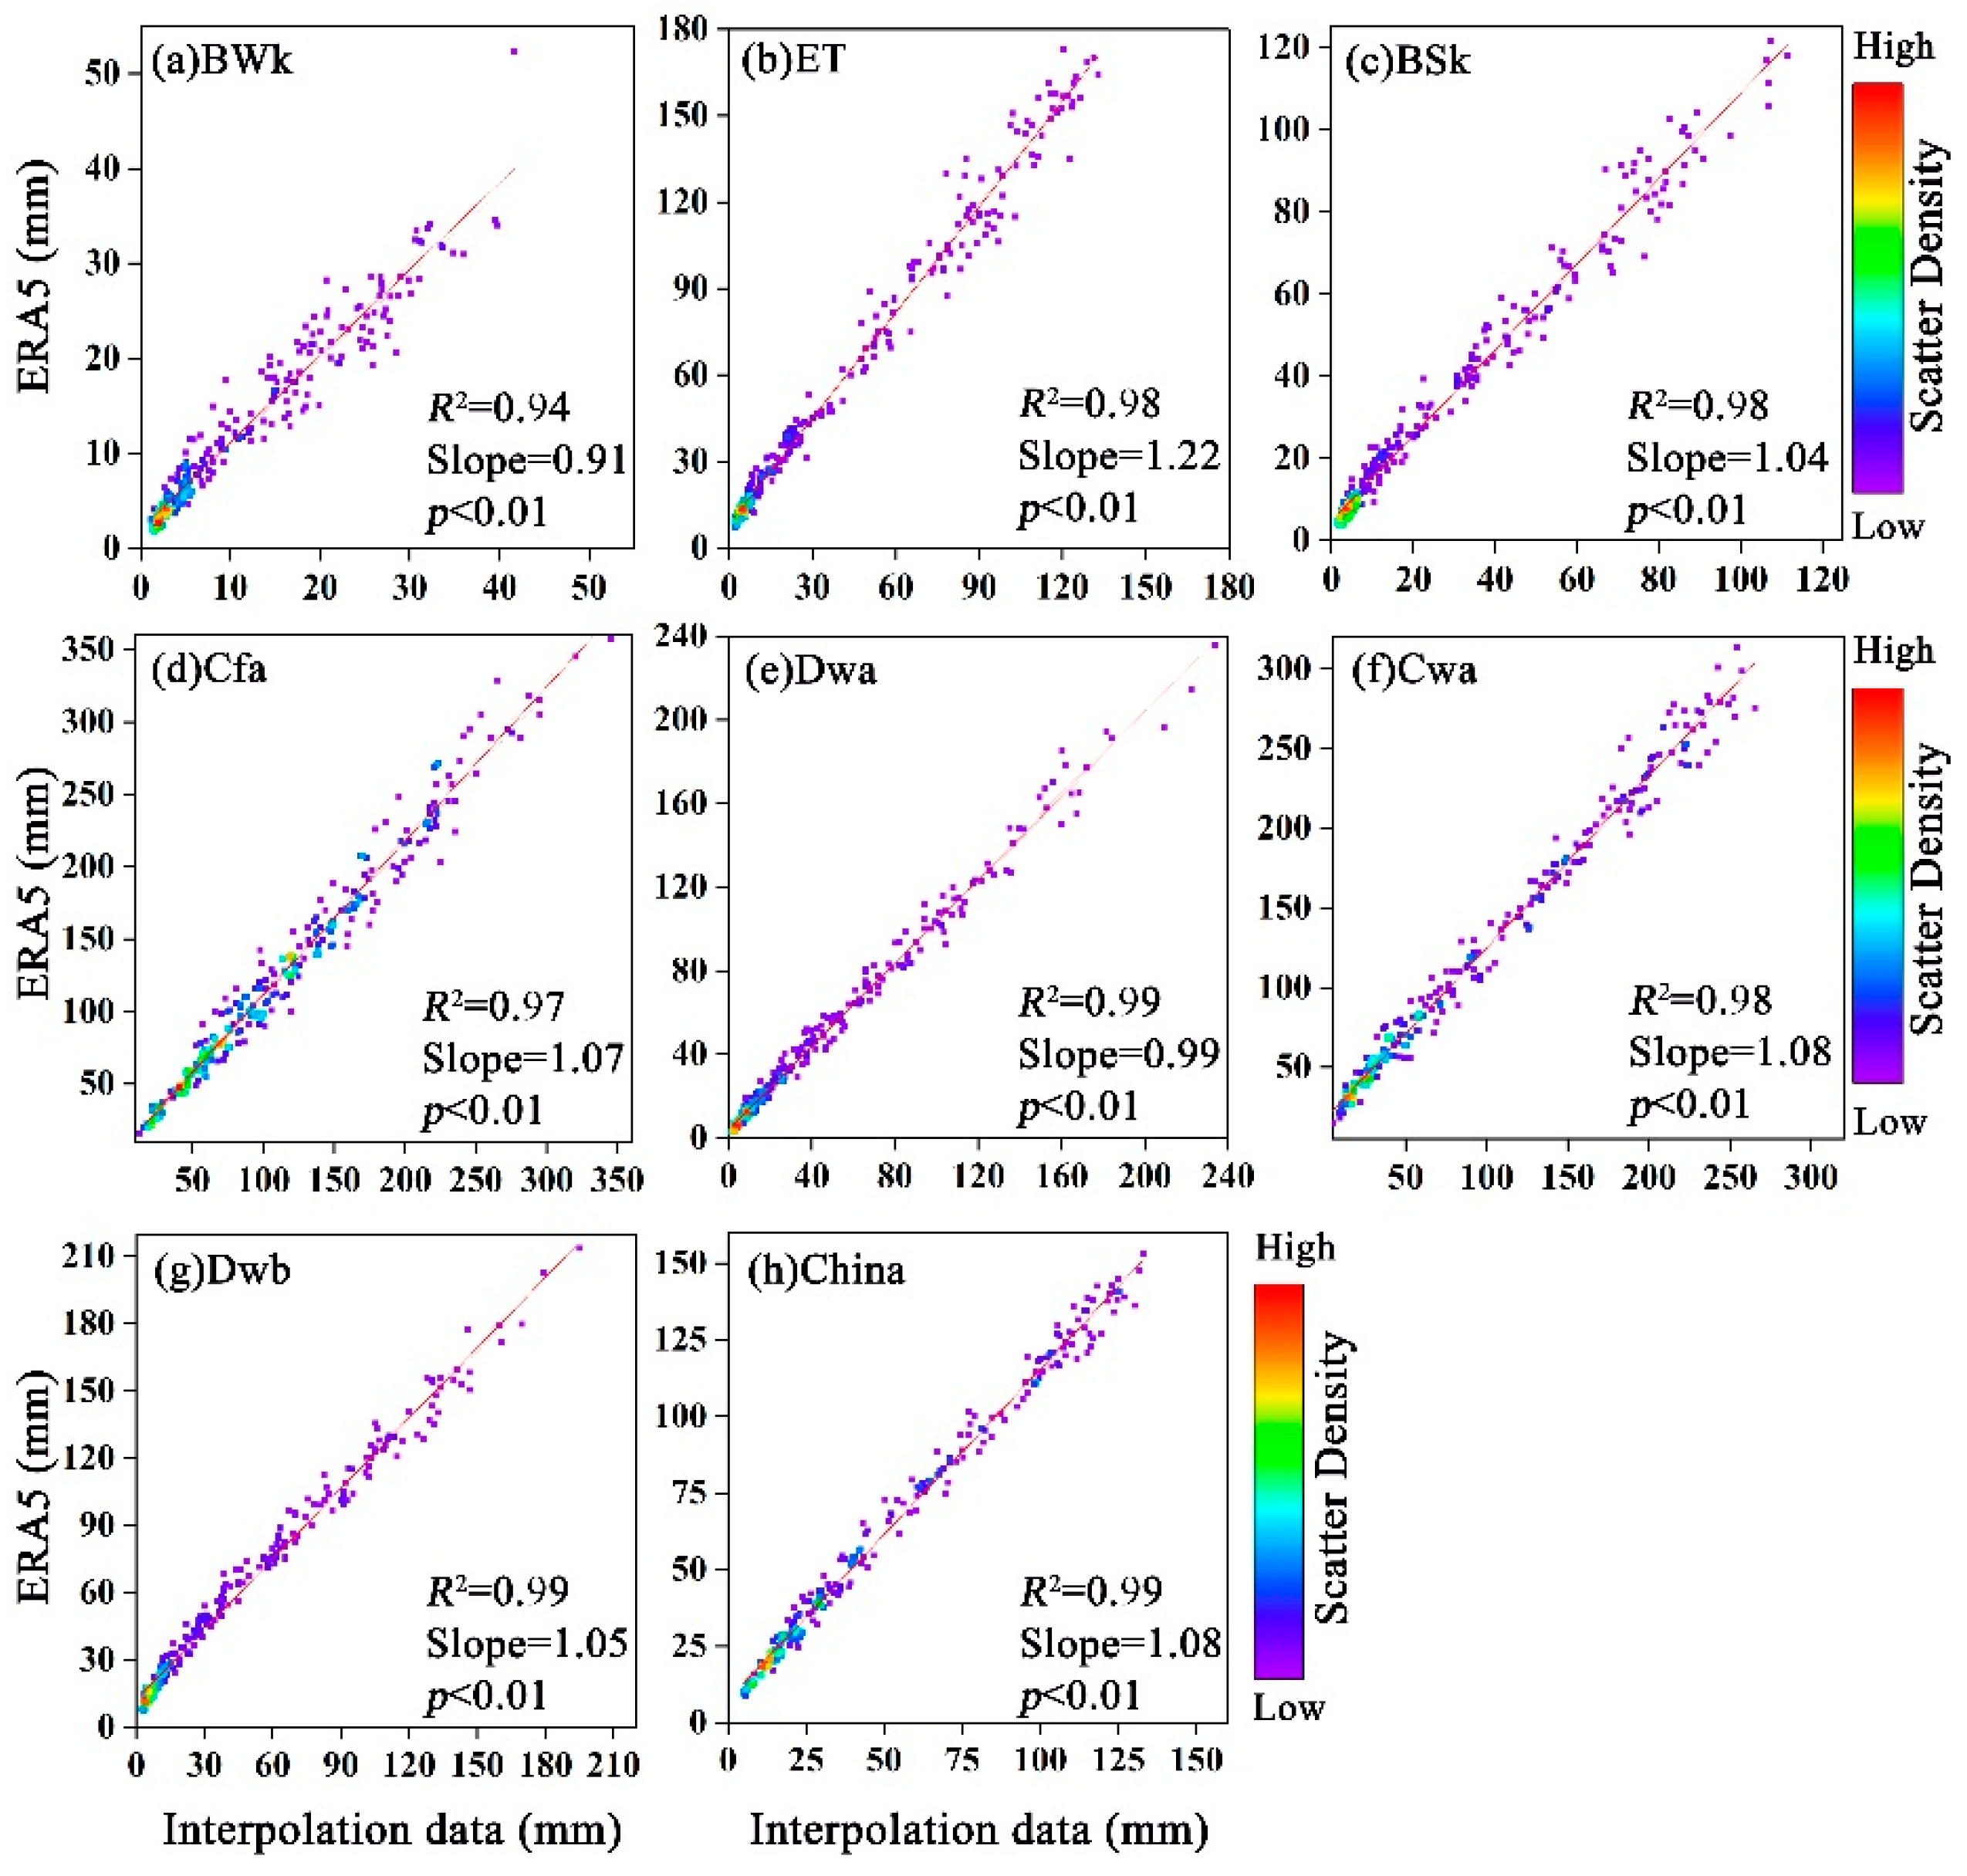
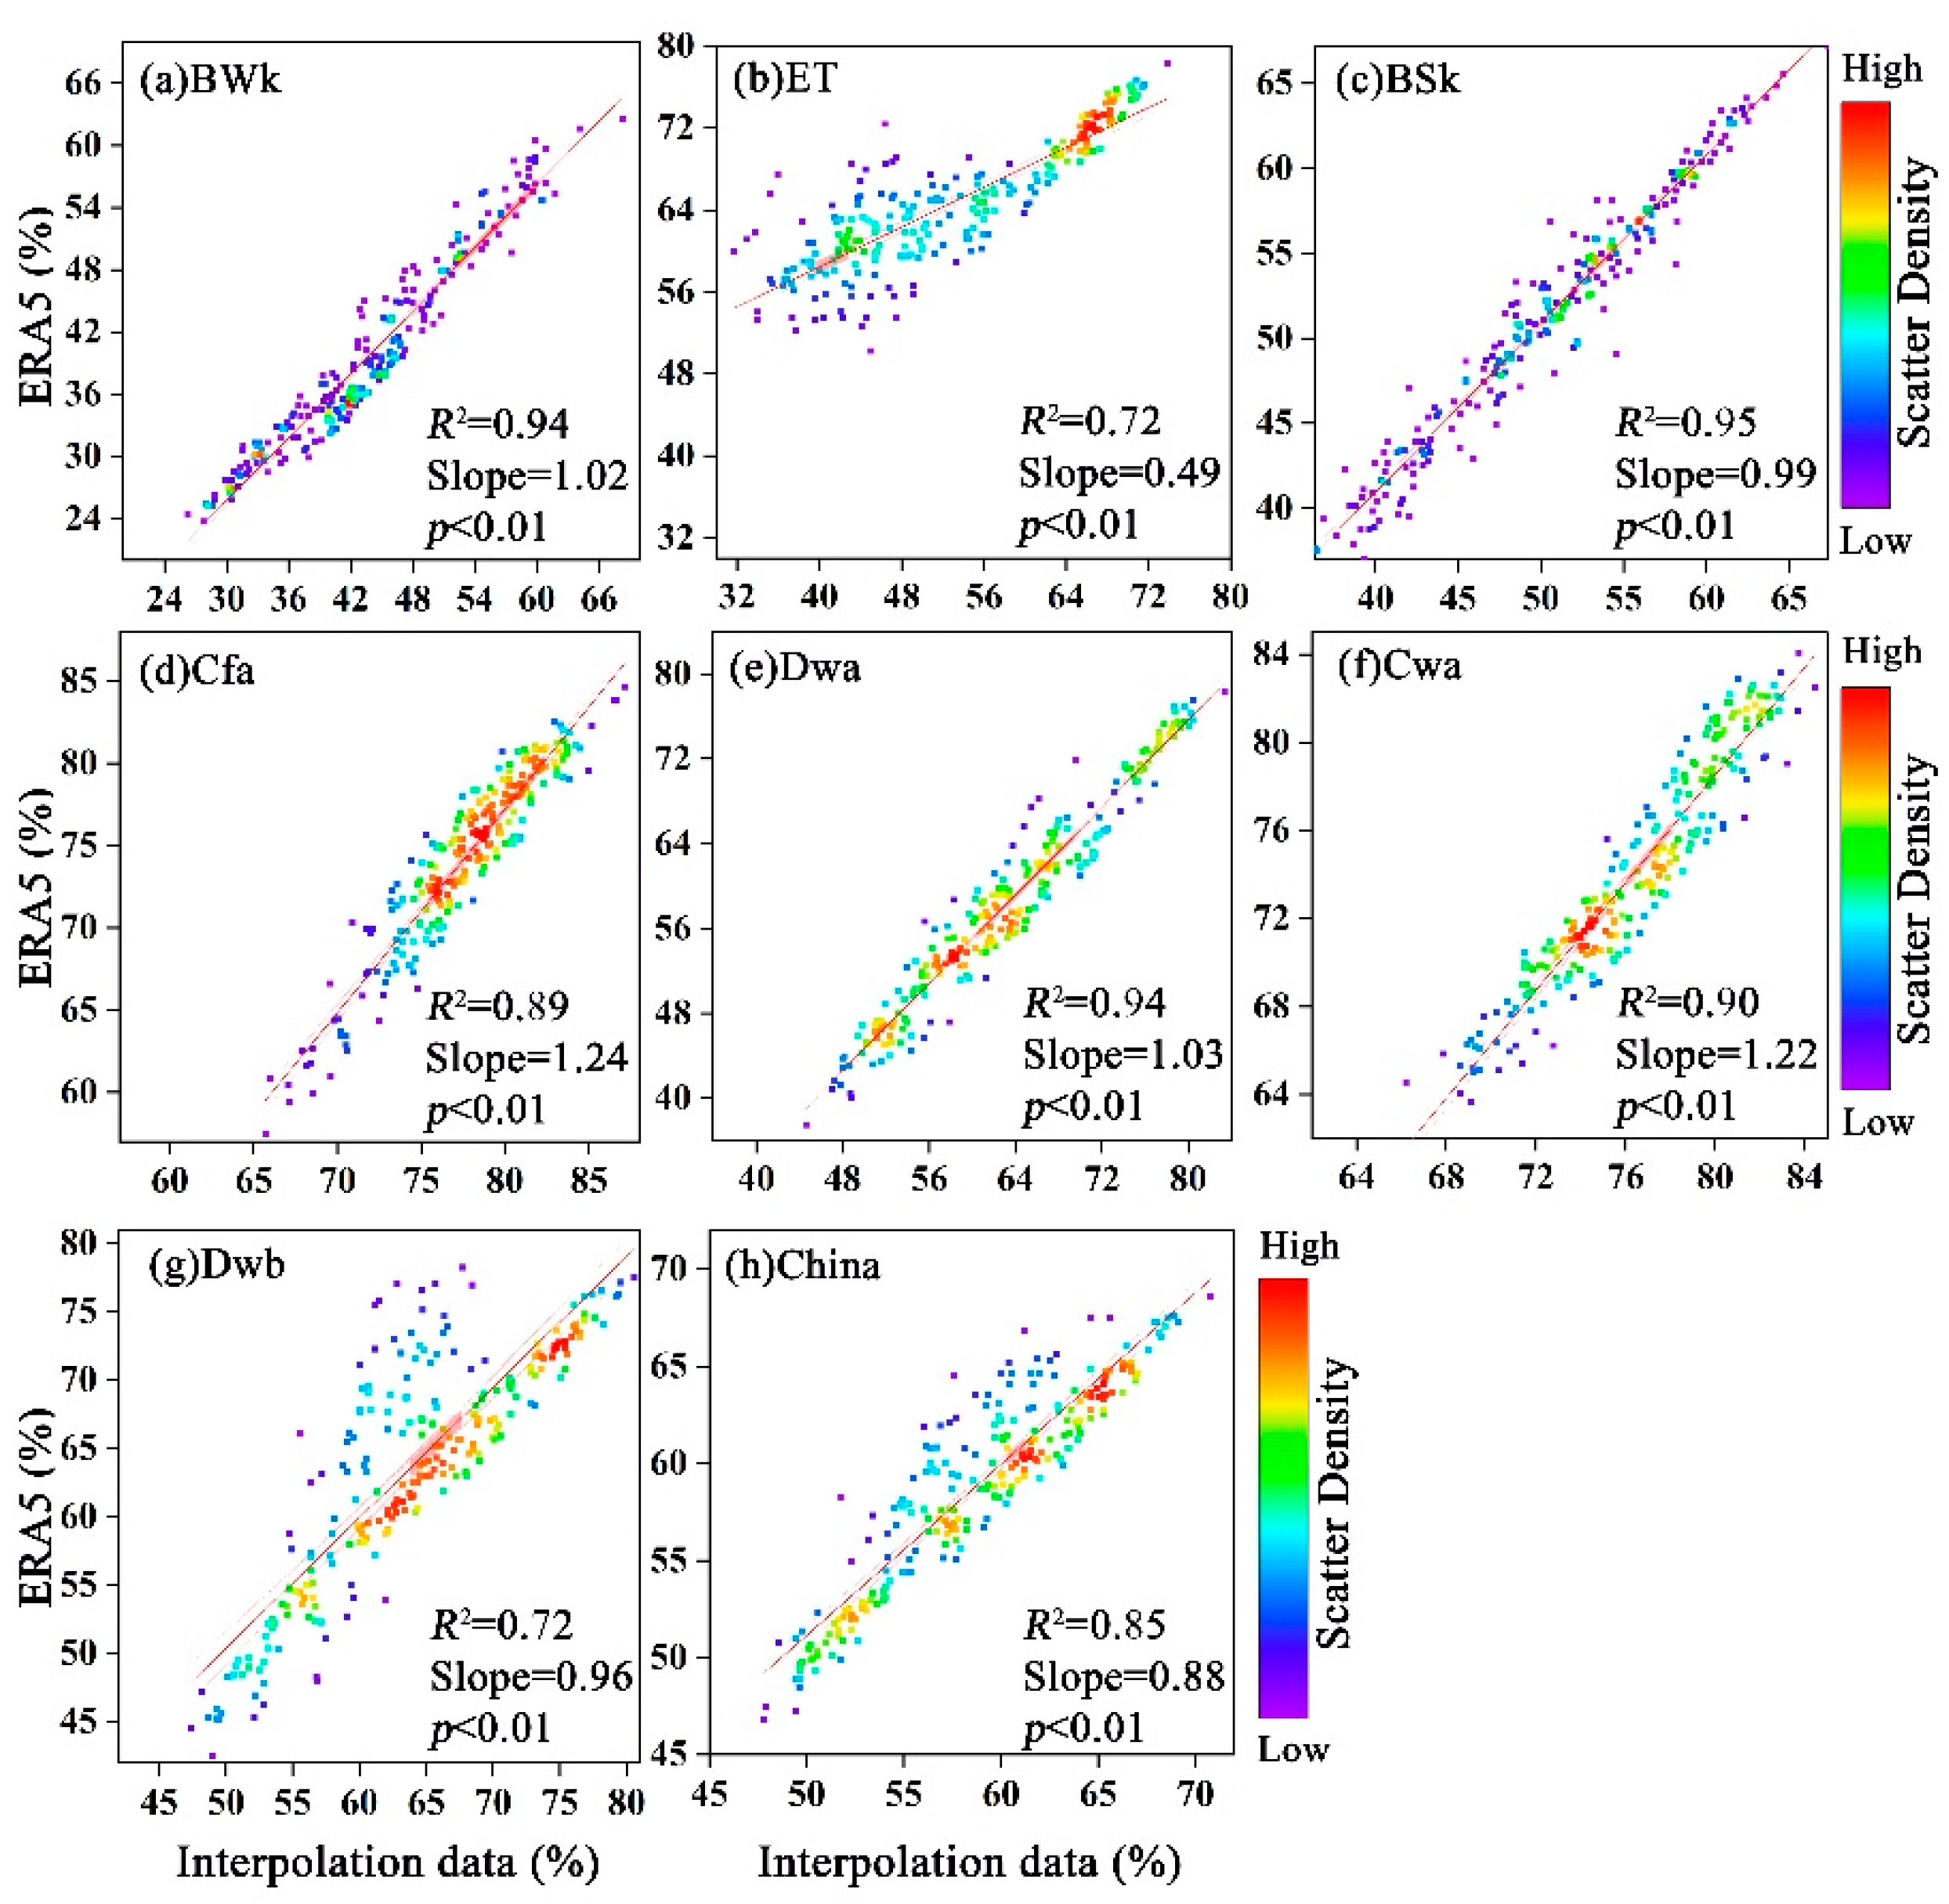
4.1. Validation of Meteorological Interpolation Data

The accuracy of meteorological data seriously affects the results of drought event assessment. We compared the interpolation data with the European Centre for Medium-Range Weather Forecasts Reanalysis 5 (ERA5, https://cds.climate.copernicus.eu/#!/home (accessed on 30 July 2022)) at monthly time-steps for the same period for verification. The datasets from the ERA5 potentially supersede other reanalysis products due to their high spatial and temporal resolution, and they have been widely used in meteorology-related research [51,52]. We analyzed the performance of the dataset across different climate zones according to new and improved current (1980–2016) Köppen–Geiger classifications (Figure 11). The classification is based on the threshold values and seasonality of monthly air temperature and precipitation, which can be used for studies based on differences in climatic regimes [53]. We selected climate classifications with an area greater than 8% of the total area (BWk, ET, BSk, Cfa, Dwa, Cwa, and Dwb) for analysis. Together, these classifications account for more than 90% of the total area. The selected Köppen–Geiger classifications as listed in Table 3.
The verification results of temperature, precipitation, and relative humidity data are shown in Figure 12, Figure 13 and Figure 14, respectively. The interpolation data were in good agreement with the ERA5 data, with most R2 greater than 0.90. The R2 of temperature data for climate classifications in China were all equal to 0.99, while precipitation data were all ≥ 0.94, and relative humidity data were all ≥ 0.72. In general, the interpolation data met the data accuracy requirements.

4.2. Spatiotemporal Variation and Characteristics of Drought and GPP

By analyzing the annual average trends of SPEI and VPD, we observed that both indicated a drying trend in northern China, southwest China (especially Yunnan Province), and the Qinghai–Tibet Plateau. Since the 21st century, southwest China has become one of the regions with the largest frequency of droughts [54]. This region is mainly influenced by the southwest monsoon, having the multi-seasonal and multi-level drought states superimposed, giving rise to the complexity of the drought situation. Therefore, the characteristics of drought events and their impacts in this region have been widely studied in recent years [24,55,56]. Another area frequently affected by drought is northern China, a region that is an important, but ecologically fragile, grain-producing hotspot; thus, its drying trend requires attention from the authorities. Due to the sensitivity of the plateau region to climate change, many researchers have analyzed the temporal and spatial characteristics of drought in the Qinghai–Tibet Plateau [57,58]. The results using SPEI showed a large area of the Qinghai–Tibet Plateau region with a drying trend in summer and autumn, while the VPD showed a more significant drying trend in autumn. Notably, in the future, projections point to the increasing risk of drought in southwest China and the Qinghai–Tibet Plateau, with the risk being almost twice as high as that for the rest of China [59].
As for the changing trend of vegetation GPP, we observed a significant upward trend in most parts of China. This phenomenon may be caused by several factors, such as atmospheric-CO2 fertilization effects, the increase in temperature, and solar radiation [60,61]. In addition, ecological restoration measures, such as the implementation of the Grain for Green Project, also play a vital role [62]. However, studies have shown that the increase in forest cover may lead to a decrease in soil moisture, which in turn may have negative impacts on plant growth and water resources [63]. The regions with a decreasing trend of GPP are mainly concentrated in the Qinghai–Tibet Plateau, with the trend being more obvious in spring and winter. This may be due to drought events caused by low rainfall. Water availability is the most important factor influencing GPP changes in this region [64].

4.3. Effects of Drought on Vegetation GPP

Few studies have analyzed the relationship between vegetation GPP and water deficit in different seasons at the national level. In China, we observed significant differences in the effects of water deficit on vegetation in different seasons. For different seasons, GPP correlated (in both positive and negative directions) almost identically with VPD and SPEI (Figure 7 and Figure 9). The relationship between SPEI and GPP and between VPD and GPP both indicated that the proportion of areas where water deficit negatively affected vegetation was greater in summer and autumn than in spring and winter. This result is consistent with previous studies in which vegetation activity was found to be more sensitive to drought events during the growing season [65]. In spring, vegetation grows well as long as there is sufficient soil moisture and atmospheric vapor pressure [66]. In addition, related studies have confirmed that spring vegetation greening may exacerbate summer drought [67,68]. Summer drought limits vegetation transpiration and directly reduces photosynthesis [69]. Similarly, autumn drought will also promote stomatal closure of leaves to decrease transpiration [70]. Moreover, the correlation between meteorological drought and hydrological drought is stronger in summer and autumn compared to spring and winter [71], which may be another crucial reason for the findings of our study. It was found that different vegetation had distinct sensitivity to water deficit in various seasons. All vegetation types were the most negatively affected by water deficit in the fall, except for grasslands, which were the most negatively affected in the summer. Previous studies only considered the relationship between drought index and vegetation in all periods of time, but did not pay attention to the relationship between drought index and GPP only during drought periods. This study found that there were some differences between the two results; in terms of spatial characteristics, drought had negative effects on vegetation GPP in northern China, southwest China, and the Qinghai–Tibet Plateau. It is worth noting that these areas are highly overlapped with areas where drought severity and frequency have been increasing in recent decades.
The serious adverse effects of water deficit on vegetation GPP were mainly concentrated in Inner Mongolia, of which the main vegetation type is grassland. Grasslands are among the most fragile ecosystems, where both climate change and human activities are significantly impacting their productivity [72]. Grasslands consist mainly of herbaceous plants whose roots can store a limited amount of water, resulting in a weak resistance to water deficit [73]. Furthermore, there are differences in the response of various grassland types. This study also investigated savannas and concluded that these were some of the more significantly negatively affected by water deficit among the different vegetation types. Indeed, more studies have focused on the response of forests and grasslands to drought, and relatively few studies have been conducted on the impact of drought on savannas [74,75]. Severe and persistent drought can significantly reduce savanna productivity, leading to structural and compositional changes and even widespread vegetation mortality [75]. As for croplands, this is the vegetation type that receives the most human intervention (e.g., irrigation), but it is still vulnerable to drought. Additional comparison of the differences in the response of crops, including detailed species, to drought would be better conducted at a regional scale. Environment monitoring by using remote sensing is an import measurement [76,77,78,79,80,81,82].

4.4. Potential Impact of Drought on the Ecosystem Regarding Future Climate Change

There is a common recognition that climate change poses an adverse effect on the natural ecosystem and human well-being [83]. In past decades, drought has led to severe effects on the terrestrial ecosystem in China [84]. Although we have investigate the impact of drought on vegetation GPP across different land cover types, excluding the land cover changed regions, the land use and land cover at the local scales may exacerbate or alleviate extreme climate events (such as drought) under climate change conditions [85]. It is necessary to consider land-use changes and drought patterns when exploring the impact of drought on ecosystems in the future by using ecological process models. The intensification of droughts, along with storm rainfall projected in future climate change scenarios, will increase soil carbon loss due to soil erosion [83]. However, the increasing CO2 may compensated for the negative effects of drought on net carbon uptake in the future [86]. Therefore, we should try to consider more environmental factors to analyze the relationships between drought and vegetation GPP in future research.

4.5. Impacts, Limitations, and Future Work

In this research, we used the M–K test to analyze changing trends, and Pearson correlation analysis was used to study the correlation between drought indices and vegetation GPP. This method is fairly simple to calculate and can be applied to assess and predict the impact of droughts and other extreme climate events on vegetation. Furthermore, we innovatively used two indices, SPEI and VPD, to characterize drought. Although both indices are able to assess the degree of drought, they have different theoretical foundations that result in different conditions characterized by different drought indices. In order to measure the effects of drought on vegetation, the combination of these two indices can comprehensively depict the drought dynamics and effectively reduce the uncertainty induced by each individual index. In this study, the trends and the effects of water deficit on vegetation assessed using the two drought indices are generally consistent, which improves the reliability of the results and strengthens our findings. The results also revealed that drought characterized by SPEI was negatively correlated with vegetation during drought in more areas compared to VPD. The main reason for this phenomenon may be the significant spatial and temporal differences in the effects of temperature and precipitation on drought [87]. SPEI is based on both precipitation and potential evapotranspiration (PET). PET is strongly influenced by temperature and is closely related to VPD. By contrast, VPD is computed without including precipitation. Therefore, further research could be conducted to explore the contribution of temperature and precipitation to drought in different regions of China.
Nevertheless, this study has some limitations. The first is data accuracy. There were still differences between the GOSIF data and the data measured on site [88]. Because of the influence of soil moisture on light energy use efficiency, GPP, obtained using remote sensing, tends to underestimate the impact of droughts on vegetation [89]. In addition, this study only considered the impact of drought on GPP. Vegetation growth results from a combination of several factors, and may also be affected by other extreme weather events, such as high temperatures, low temperatures, and floods [90]. Thus, the complexity of the causes of drought and the influencing factors on vegetation growth bring certain uncertainty to the results. Despite these shortcomings, the methods and conclusions of this study can be used as a reference for determining the impact of droughts on vegetation. These can be used to take timely and effective measures to prevent and mitigate the adverse effects of droughts on vegetation in relevant areas.

5. Conclusions

In the context of global climate change, enhancing our understanding of the effects of droughts on vegetation is of great significance for maintaining the balance of the carbon cycle in the ecosystem. In this study, we used SPEI and VPD to analyze spatial-temporal patterns of drought in China from 2001 to 2020. The vegetation parameter GPP was used to evaluate vegetation productivity and analyze the annual and seasonal trends of drought and GPP under different vegetation types. The response of vegetation GPP to water deficit/drought under different vegetation types was assessed using Pearson correlation analysis. The conclusions of this study are as follows:
In terms of annual trends, China’s SPEI and GPP showed an upward trend in most regions, whereas VPD showed an overall downward trend. Among the different seasons, both SPEI and VPD showed the most areas with an increasing trend of drought in spring and the least in autumn. GPP shows an upward trend, with the largest share of areas showing this trend in autumn.
About 70.7% of the pixels of the SPEI and GPP were positively correlated, which was greater than that of the negative correlation. About 66.2% of the total area showed that GPP and VPD were negatively correlated. The relationships of SPEI, VPD, and GPP indicated that the negative effects of water deficit on vegetation were more pronounced in summer and autumn. In spring, savannas were the most sensitive to water deficit. Grasslands were most sensitive to water deficit in both summer and winter. By contrast, croplands were the most sensitive to water deficit in autumn. During drought periods, vegetation growth was inhibited, especially in northern China, southwest China, and the Qinghai–Tibet Plateau.

Author Contributions

Conceptualization, X.W., R.Z. and Q.W.; data curation, R.Z.; formal analysis, X.W. and R.Z.; funding acquisition, Q.W.; investigation, X.W., R.Z., V.A.B., S.L., J.Q. and J.Z.; methodology, X.W. and Q.W.; project administration, Q.W.; software, X.W.; supervision, Q.W.; validation, V.A.B., S.L., J.Q., J.Z. and Q.W.; visualization, X.W.; writing—original draft, X.W.; writing—review and editing, R.Z., V.A.B., S.L., J.Q., J.Z. and Q.W. All authors have read and agreed to the published version of the manuscript.

Funding

This research was funded by the Natural Science Foundation of Fujian Province (2021J01627) and the National Natural Science Foundation of China (41601562).

Data Availability Statement

The SPEI and VPD data in this study are available from the corresponding author upon reasonable request.

Acknowledgments

Thanks to the Natural Science Foundation of Fujian Province (2021J01627) and the National Natural Science Foundation of China (No. 41601562) for funding this work. Special thanks to Wenping Yuan’s team for providing the interpolated meteorological data.

Conflicts of Interest

The authors declare no conflict of interest.

References

  1. Heim, R.R. A review of twentieth-century drought indices used in the United States. Bull. Am. Meteorol. Soc. 2002, 83, 1149–1165. [Google Scholar] [CrossRef]
  2. Mukherjee, S.; Mishra, A.; Trenberth, K.E. Climate Change and Drought: A Perspective on Drought Indices. Curr. Clim. Change Rep. 2018, 4, 145–163. [Google Scholar] [CrossRef]
  3. Wang, Q.; Shi, P.; Lei, T.; Geng, G.; Liu, J.; Mo, X.; Li, X.; Zhou, H.; Wu, J. The alleviating trend of drought in the Huang-Huai-Hai Plain of China based on the daily SPEI. Int. J. Climatol. 2015, 35, 3760–3769. [Google Scholar] [CrossRef]
  4. Wang, Q.; Qi, J.; Wu, H.; Zeng, Y.; Shui, W.; Zeng, J.; Zhang, X. Freeze-Thaw cycle representation alters response of watershed hydrology to future climate change. Catena 2020, 195, 104767. [Google Scholar] [CrossRef]
  5. Zhang, R.; Wu, X.; Zhou, X.; Ren, B.; Zeng, J.; Wang, Q. Investigating the effect of improved drought events extraction method on spatiotemporal characteristics of drought. Theor. Appl. Climatol. 2022, 147, 395–408. [Google Scholar] [CrossRef]
  6. Vicente-Serrano, S.M.; Quiring, S.M.; Pena-Gallardo, M.; Yuan, S.; Dominguez-Castro, F. A review of environmental droughts: Increased risk under global warming? Earth-Sci. Rev. 2020, 201, 102953. [Google Scholar] [CrossRef]
  7. Chen, H.; Sun, J. Changes in Drought Characteristics over China Using the Standardized Precipitation Evapotranspiration Index. J. Clim. 2015, 28, 5430–5447. [Google Scholar] [CrossRef]
  8. Yu, M.; Li, Q.; Hayes, M.J.; Svoboda, M.D.; Heim, R.R. Are droughts becoming more frequent or severe in China based on the Standardized Precipitation Evapotranspiration Index: 1951–2010? Int. J. Climatol. 2014, 34, 545–558. [Google Scholar] [CrossRef]
  9. Zhang, Q.; Yao, Y.; Li, Y.; Huang, J.; Ma, Z.; Wang, Z.; Wang, S.; Wang, Y.; Zhang, Y. Causes and Changes of Drought in China: Research Progress and Prospects. J. Meteorol. Res. 2020, 34, 460–481. [Google Scholar] [CrossRef]
  10. Begueria, S.; Vicente-Serrano, S.M.; Reig, F.; Latorre, B. Standardized precipitation evapotranspiration index (SPEI) revisited: Parameter fitting, evapotranspiration models, tools, datasets and drought monitoring. Int. J. Climatol. 2014, 34, 3001–3023. [Google Scholar] [CrossRef] [Green Version]
  11. Su, B.; Huang, J.; Fischer, T.; Wang, Y.; Kundzewicz, Z.W.; Zhai, J.; Sun, H.; Wang, A.; Zeng, X.; Wang, G.; et al. Drought losses in China might double between the 1.5 degrees C and 2.0 degrees C warming. Proc. Natl. Acad. Sci. USA 2018, 115, 10600–10605. [Google Scholar] [CrossRef] [PubMed]
  12. Zeng, J.; Zhang, R.; Qu, Y.; Bentod, V.A.; Zhou, T.; Lin, Y.; Wu, X.; Qi, J.; Shui, W.; Wang, Q. Improving the drought monitoring capability of VHI at the global scale via ensemble indices for various vegetation types from 2001 to 2018. Weather Clim. Extrem. 2022, 35, 100412. [Google Scholar] [CrossRef]
  13. McKee, T.B.; Doesken, N.J.; Kleist, J.R. The Relationship of Drought Frequency and Duration to Time Scales. In Proceedings of the 8th Conference on Applied Climatology, Anaheim CA, USA, 17–22 January 1993; American Meteorological Society: Boston, MA, USA, 1993. [Google Scholar]
  14. Palmer, W.C. Meteorological Drought; US Department of Commerce, Weather Bureau: Washington, DC, USA, 1965; Volume 30. [Google Scholar]
  15. Vicente-Serrano, S.M.; Begueria, S.; Lopez-Moreno, J.I. A Multiscalar Drought Index Sensitive to Global Warming: The Standardized Precipitation Evapotranspiration Index. J. Clim. 2010, 23, 1696–1718. [Google Scholar] [CrossRef]
  16. Vicente-Serrano, S.M.; Begueria, S.; Lorenzo-Lacruz, J.; Julio Camarero, J.; Lopez-Moreno, J.I.; Azorin-Molina, C.; Revuelto, J.; Moran-Tejeda, E.; Sanchez-Lorenzo, A. Performance of Drought Indices for Ecological, Agricultural, and Hydrological Applications. Earth Interact. 2012, 16, 1–27. [Google Scholar] [CrossRef]
  17. Grossiord, C.; Buckley, T.N.; Cernusak, L.A.; Novick, K.A.; Poulter, B.; Siegwolf, R.T.W.; Sperry, J.S.; McDowell, N.G. Plant responses to rising vapor pressure deficit. New Phytol. 2020, 226, 1550–1566. [Google Scholar] [CrossRef]
  18. Liu, L.; Gudmundsson, L.; Hauser, M.; Qin, D.; Li, S.; Seneviratne, S.I. Soil moisture dominates dryness stress on ecosystem production globally. Nat. Commun. 2020, 11, 4892. [Google Scholar] [CrossRef]
  19. Ding, Y.; Xu, J.; Wang, X.; Peng, X.; Cai, H. Spatial and temporal effects of drought on Chinese vegetation under different coverage levels. Sci. Total Environ. 2020, 716, 137166. [Google Scholar] [CrossRef]
  20. Zhang, R.; Qi, J.; Leng, S.; Wang, Q. Long-Term Vegetation Phenology Changes and Responses to Preseason Temperature and Precipitation in Northern China. Remote Sens. 2022, 14, 1396. [Google Scholar] [CrossRef]
  21. Sperry, J.S.; Love, D.M. What plant hydraulics can tell us about responses to climate-change droughts. New Phytol. 2015, 207, 14–27. [Google Scholar] [CrossRef]
  22. Leng, S.; Huete, A.; Cleverly, J.; Yu, Q.; Zhang, R.; Wang, Q. Spatiotemporal Variations of Dryland Vegetation Phenology Revealed by Satellite-Observed Fluorescence and Greenness across the North Australian Tropical Transect. Remote Sens. 2022, 14, 2985. [Google Scholar] [CrossRef]
  23. Leng, S.; Huete, A.; Cleverly, J.; Gao, S.; Yu, Q.; Meng, X.; Qi, J.; Zhang, R.; Wang, Q. Assessing the Impact of Extreme Droughts on Dryland Vegetation by Multi-Satellite Solar-Induced Chlorophyll Fluorescence. Remote Sens. 2022, 14, 1581. [Google Scholar] [CrossRef]
  24. Li, X.; Li, Y.; Chen, A.; Gao, M.; Slette, I.J.; Piao, S. The impact of the 2009/2010 drought on vegetation growth and terrestrial carbon balance in Southwest China. Agric. For. Meteorol. 2019, 269, 239–248. [Google Scholar] [CrossRef]
  25. Zhang, Q.; Kong, D.; Singh, V.P.; Shi, P. Response of vegetation to different time-scales drought across China: Spatiotemporal patterns, causes and implications. Glob. Planet. Change 2017, 152, 1–11. [Google Scholar] [CrossRef]
  26. Wu, D.; Zhao, X.; Liang, S.; Zhou, T.; Huang, K.; Tang, B.; Zhao, W. Time-lag effects of global vegetation responses to climate change. Glob. Change Biol. 2015, 21, 3520–3531. [Google Scholar] [CrossRef] [PubMed]
  27. Zheng, K.; Wei, J.-Z.; Pei, J.-Y.; Cheng, H.; Zhang, X.-L.; Huang, F.-Q.; Li, F.-M.; Ye, J.-S. Impacts of climate change and human activities on grassland vegetation variation in the Chinese Loess Plateau. Sci. Total Environ. 2019, 660, 236–244. [Google Scholar] [CrossRef]
  28. Campbell, J.E.; Berry, J.A.; Seibt, U.; Smith, S.J.; Montzka, S.A.; Launois, T.; Belviso, S.; Bopp, L.; Laine, M. Large historical growth in global terrestrial gross primary production. Nature 2017, 544, 84–87. [Google Scholar] [CrossRef]
  29. Verma, M.; Schimel, D.; Evans, B.; Frankenberg, C.; Beringer, J.; Drewry, D.T.; Magney, T.; Marang, I.; Hutley, L.; Moore, C.; et al. Effect of environmental conditions on the relationship between solar-induced fluorescence and gross primary productivity at an OzFlux grassland site. J. Geophys. Res. Biogeosci. 2017, 122, 716–733. [Google Scholar] [CrossRef]
  30. Zhang, Y.; Xiao, X.; Wu, X.; Zhou, S.; Zhang, G.; Qin, Y.; Dong, J. Data Descriptor: A global moderate resolution dataset of gross primary production of vegetation for 2000–2016. Sci. Data 2017, 4, 170165. [Google Scholar] [CrossRef]
  31. Chu, H.; Venevsky, S.; Wu, C.; Wang, M. NDVI-based vegetation dynamics and its response to climate changes at Amur-Heilongjiang River Basin from 1982 to 2015. Sci. Total Environ. 2019, 650, 2051–2062. [Google Scholar] [CrossRef]
  32. Liang, W.; Yang, Y.; Fan, D.; Guan, H.; Zhang, T.; Long, D.; Zhou, Y.; Bai, D. Analysis of spatial and temporal patterns of net primary production and their climate controls in China from 1982 to 2010. Agric. For. Meteorol. 2015, 204, 22–36. [Google Scholar] [CrossRef]
  33. Ma, D.; Yin, Y.; Wu, S.; Zheng, D. Sensitivity of arid/humid patterns in China to future climate change under high emission scenario. Acta Geogr. Sin. 2019, 74, 857–874. [Google Scholar] [CrossRef]
  34. He, J.; Yang, K.; Tang, W.; Lu, H.; Qin, J.; Chen, Y.; Li, X. The first high-resolution meteorological forcing dataset for land process studies over China. Sci. Data 2020, 7, 25. [Google Scholar] [CrossRef] [PubMed]
  35. Wang, Q.; Zeng, J.; Qi, J.; Zhang, X.; Zeng, Y.; Shui, W.; Xu, Z.; Zhang, R.; Wu, X.; Cong, J. A multi-scale daily SPEI dataset for drought characterization at observation stations over mainland China from 1961 to 2018. Earth Syst. Sci. Data 2021, 13, 331–341. [Google Scholar] [CrossRef]
  36. Wang, Q.; Zhang, R.; Qi, J.; Zeng, J.; Wu, J.; Shui, W.; Wu, X.; Li, J. An improved daily standardized precipitation index dataset for mainland China from 1961 to 2018. Sci. Data 2022, 9, 124. [Google Scholar] [CrossRef]
  37. He, B.; Wang, H.L.; Wang, Q.F.; Di, Z.H. A quantitative assessment of the relationship between precipitation deficits and air temperature variations. J. Geophys. Res. Atmos. 2015, 120, 5951–5961. [Google Scholar] [CrossRef]
  38. Hutchinson, M.F. Interpolating mean rainfall using thin-plate smoothing splines. Int. J. Geogr. Inf. Syst. 1995, 9, 385–403. [Google Scholar] [CrossRef]
  39. Yuan, W.; Xu, B.; Chen, Z.; Xia, J.; Xu, W.; Chen, Y.; Wu, X.; Fu, Y. Validation of China-wide interpolated daily climate variables from 1960 to 2011. Theor. Appl. Climatol. 2015, 119, 689–700. [Google Scholar] [CrossRef]
  40. Li, X.; Xiao, J. A global, 0.05-degree product of solar-induced chlorophyll fluorescence derived from OCO-2, MODIS, and reanalysis data. Remote Sens. 2019, 11, 517. [Google Scholar] [CrossRef]
  41. Zhang, X.; Wang, H.; Yan, H.; Ai, J. Analysis of spatio-temporal changes of gross primary productivity in China from 2001 to 2018 based on Romote Sensing. Acta Ecol. Sin. 2021, 41, 6351–6362. [Google Scholar]
  42. Khadka, D.; Babel, M.S.; Shrestha, S.; Virdis, S.G.P.; Collins, M. Multivariate and multi-temporal analysis of meteorological drought in the northeast of Thailand. Weather Clim. Extrem. 2021, 34, 100399. [Google Scholar] [CrossRef]
  43. Zhao, A.; Zhang, A.; Cao, S.; Liu, X.; Liu, J.; Cheng, D. Responses of vegetation productivity to multi-scale drought in Loess Plateau, China. Catena 2018, 163, 165–171. [Google Scholar] [CrossRef]
  44. Kendall, M.G. Kendall Rank Correlation Methods; Griffin: London, UK, 1975. [Google Scholar]
  45. Mann, H.B. Nonparametric Tests Against Trend. Econometrica 1945, 13, 245–259. [Google Scholar] [CrossRef]
  46. Gocic, M.; Trajkovic, S. Analysis of changes in meteorological variables using Mann-Kendall and Sen’s slope estimator statistical tests in Serbia. Glob. Planet. Change 2013, 100, 172–182. [Google Scholar] [CrossRef]
  47. Tosunoglu, F.; Kisi, O. Trend Analysis of Maximum Hydrologic Drought Variables Using Mann-Kendall and Sen’s Innovative Trend Method. River Res. Appl. 2017, 33, 597–610. [Google Scholar] [CrossRef]
  48. Wang, Q.; Tang, J.; Zeng, J.; Qu, Y.; Zhang, Q.; Shui, W.; Wang, W.; Yi, L.; Leng, S. Spatial-temporal evolution of vegetation evapotranspiration in Hebei Province, China. J. Integr. Agric. 2018, 17, 2107–2117. [Google Scholar] [CrossRef]
  49. Ghosh, K.G. Analysis of rainfall trends and its spatial patterns during the last century over the Gangetic West Bengal, Eastern India. J. Geovis. Spat. Anal. 2018, 2, 15. [Google Scholar] [CrossRef]
  50. Schober, P.; Boer, C.; Schwarte, L.A. Correlation Coefficients: Appropriate Use and Interpretation. Anesth. Analg. 2018, 126, 1763–1768. [Google Scholar] [CrossRef]
  51. Mukherjee, S.; Mishra, A.K. Increase in Compound Drought and Heatwaves in a Warming World. Geophys. Res. Lett. 2021, 48, e2020GL090617. [Google Scholar] [CrossRef]
  52. Hersbach, H.; Bell, B.; Berrisford, P.; Hirahara, S.; Horanyi, A.; Munoz-Sabater, J.; Nicolas, J.; Peubey, C.; Radu, R.; Schepers, D.; et al. The ERA5 global reanalysis. Q. J. R. Meteorol. Soc. 2020, 146, 1999–2049. [Google Scholar] [CrossRef]
  53. Beck, H.E.; Zimmermann, N.E.; McVicar, T.R.; Vergopolan, N.; Berg, A.; Wood, E.F. Present and future Koppen-Geiger climate classification maps at 1-km resolution. Sci. Data 2018, 5, 180214. [Google Scholar] [CrossRef]
  54. Zhang, Q.; Yao, Y.; Li, Y.; Huang, J.; Ma, Z.; Wang, Z.; Wang, S.; Wang, Y.; Zhang, Y. Progress and prospect on the study of causes and variation regularity of droughts in China. Acta Meteorol. Sin. 2020, 78, 500–521. [Google Scholar] [CrossRef]
  55. Sun, X.; Lai, P.; Wang, S.; Song, L.; Ma, M.; Han, X. Monitoring of Extreme Agricultural Drought of the Past 20 Years in Southwest China Using GLDAS Soil Moisture. Remote Sens. 2022, 14, 1323. [Google Scholar] [CrossRef]
  56. Mokhtar, A.; He, H.; Alsafadi, K.; Mohammed, S.; Ayantobo, O.O.; Elbeltagi, A.; Abdelwahab, O.M.M.; Zhao, H.; Quan, Y.; Abdo, H.G.; et al. Assessment of the effects of spatiotemporal characteristics of drought on crop yields in southwest China. Int. J. Climatol. 2022, 42, 3056–3075. [Google Scholar] [CrossRef]
  57. Gao, Y.; Li, X.; Leung, L.R.; Chen, D.; Xu, J. Aridity changes in the Tibetan Plateau in a warming climate. Environ. Res. Lett. 2015, 10, 034013. [Google Scholar] [CrossRef]
  58. Feng, W.; Lu, H.; Yao, T.; Yu, Q. Drought characteristics and its elevation dependence in the Qinghai-Tibet plateau during the last half-century. Sci. Rep. 2020, 10, 14323. [Google Scholar] [CrossRef]
  59. Wang, L.; Chen, W. A CMIP5 multimodel projection of future temperature, precipitation, and climatological drought in China. Int. J. Climatol. 2014, 34, 2059–2078. [Google Scholar] [CrossRef]
  60. Zhao, M.; Running, S.W. Drought-Induced Reduction in Global Terrestrial Net Primary Production from 2000 Through 2009. Science 2010, 329, 940–943. [Google Scholar] [CrossRef] [PubMed]
  61. Yan, H.; Wang, S.-Q.; Cao, Y.; Xu, L.-L.; Wu, M.-x.; Cheng, L.; Mao, L.-X.; Zhang, X.-Z.; Liu, Y.-F.; Wang, Y.-F.; et al. Multi-model analysis of climate impacts on plant photosynthesis in China during 2000–2015. Int. J. Climatol. 2019, 39, 5539–5555. [Google Scholar] [CrossRef]
  62. Qiu, L.; Chen, Y.; Wu, Y.; Xue, Q.; Shi, Z.; Lei, X.; Liao, W.; Zhao, F.; Wang, W. The Water Availability on the Chinese Loess Plateau since the Implementation of the Grain for Green Project as Indicated by the Evaporative Stress Index. Remote Sens. 2021, 13, 3302. [Google Scholar] [CrossRef]
  63. Qiu, L.; Wu, Y.; Shi, Z.; Yu, M.; Zhao, F.; Guan, Y. Quantifying spatiotemporal variations in soil moisture driven by vegetation restoration on the Loess Plateau of China. J. Hydrol. 2021, 600, 126580. [Google Scholar] [CrossRef]
  64. Zhang, T.; Zhang, Y.; Xu, M.; Zhu, J.; Chen, N.; Jiang, Y.; Huang, K.; Zu, J.; Liu, Y.; Yu, G. Water availability is more important than temperature in driving the carbon fluxes of an alpine meadow on the Tibetan Plateau. Agric. For. Meteorol. 2018, 256, 22–31. [Google Scholar] [CrossRef]
  65. Hua, T.; Wang, X.; Zhang, C.; Lang, L.; Li, H. Response of vegetation activity to drought in Northern China. Land Degrad. Dev. 2017, 28, 1913–1921. [Google Scholar] [CrossRef]
  66. Wu, X.; Liu, H.; Li, X.; Liang, E.; Beck, P.S.A.; Huang, Y. Seasonal divergence in the interannual responses of Northern Hemisphere vegetation activity to variations in diurnal climate. Sci. Rep. 2016, 6, 19000. [Google Scholar] [CrossRef] [PubMed]
  67. Buermann, W.; Bikash, P.R.; Jung, M.; Burn, D.H.; Reichstein, M. Earlier springs decrease peak summer productivity in North American boreal forests. Environ. Res. Lett. 2013, 8, 024027. [Google Scholar] [CrossRef]
  68. Lian, X.; Piao, S.; Li, L.Z.X.; Li, Y.; Huntingford, C.; Ciais, P.; Cescatti, A.; Janssens, I.A.; Penuelas, J.; Buermann, W.; et al. Summer soil drying exacerbated by earlier spring greening of northern vegetation. Sci. Adv. 2020, 6, eaax0255. [Google Scholar] [CrossRef]
  69. Zhang, L.; Xiao, J.; Zhou, Y.; Zheng, Y.; Li, J.; Xiao, H. Drought events and their effects on vegetation productivity in China. Ecosphere 2016, 7, e01591. [Google Scholar] [CrossRef]
  70. Kang, W.; Wang, T.; Liu, S. The Response of Vegetation Phenology and Productivity to Drought in Semi-Arid Regions of Northern China. Remote Sens. 2018, 10, 727. [Google Scholar] [CrossRef]
  71. Ding, Y.; Xu, J.; Wang, X.; Cai, H.; Zhou, Z.; Sun, Y.; Shi, H. Propagation of meteorological to hydrological drought for different climate regions in China. J. Environ. Manag. 2021, 283, 111980. [Google Scholar] [CrossRef]
  72. Wang, X.; Pan, S.; Pan, N.; Pan, P. Grassland productivity response to droughts in northern China monitored by satellite-based solar-induced chlorophyll fluorescence. Sci. Total Environ. 2022, 830, 154550. [Google Scholar] [CrossRef]
  73. Xu, H.; Wang, X.; Zhao, C. Drought sensitivity of vegetation photosynthesis along the aridity gradient in northern China. Int. J. Appl. Earth Obs. Geoinf. 2021, 102, 102418. [Google Scholar] [CrossRef]
  74. Case, M.F.; Wigley-Coetsee, C.; Nzima, N.; Scogings, P.F.; Staver, A.C. Severe drought limits trees in a semi-arid savanna. Ecology 2019, 100, e02842. [Google Scholar] [CrossRef] [PubMed]
  75. Sankaran, M.; Staver, C. Droughts and the ecological future of tropical savanna vegetation. J. Ecol. 2019, 107, 1531–1549. [Google Scholar] [CrossRef]
  76. Wang, J.; Ding, J.; Li, G.; Liang, J.; Yu, D.; Aishan, T.; Zhang, F.; Yang, J.; Abuldmiti, A.; Liu, J. Dynamic detection of water surface area of Ebinur Lake using multi-source satellite data (Landsat and Sentinel-1A) and its responses to changing environment. Catena 2019, 177, 189–201. [Google Scholar] [CrossRef]
  77. Wang, J.; Ding, J.; Yu, D.; Ma, X.; Zhang, Z.; Ge, X.; Teng, D.; Li, X.; Liang, J.; Lizag, I.; et al. Capability of Sentinel-2 MSI data for monitoring and mapping of soil salinity in dry and wet seasons in the Ebinur Lake region, Xinjiang, China. Geoderma 2019, 353, 172–187. [Google Scholar] [CrossRef]
  78. Wang, J.; Ding, J.; Yu, D.; Teng, D.; He, B.; Chen, X.; Ge, X.; Zhang, Z.; Wang, Y.; Yang, X.; et al. Machine learning-based detection of soil salinity in an arid desert region, Northwest China: A comparison between Landsat-8 OLI and Sentinel-2 MSI. Sci. Total Environ. 2020, 707, 136092. [Google Scholar] [CrossRef] [PubMed]
  79. Wang, J.; Shi, T.; Yu, D.; Teng, D.; Ge, X.; Zhang, Z.; Yang, X.; Wang, H.; Wu, G. Ensemble machine-learning-based framework for estimating total nitrogen concentration in water using drone-borne hyperspectral imagery of emergent plants: A case study in an arid oasis, NW China. Environ. Pollut. 2020, 266, 115412. [Google Scholar] [CrossRef] [PubMed]
  80. Wang, J.; Hu, X.; Shi, T.; He, L.; Hu, W.; Wu, G. Assessing toxic metal chromium in the soil in coal mining areas via proximal sensing: Prerequisites for land rehabilitation and sustainable development. Geoderma 2022, 405, 115399. [Google Scholar] [CrossRef]
  81. Yang, X.; Chen, Y.; Wang, J. Combined use of Sentinel-2 and Landsat 8 to monitor water surface area dynamics using Google Earth Engine. Remote Sens. Lett. 2020, 11, 687–696. [Google Scholar] [CrossRef]
  82. Ghasemloo, N.; Matkan, A.A.; Alimohammadi, A.; Aghighi, H.; Mirbagheri, B. Estimating the Agricultural Farm Soil Moisture Using Spectral Indices of Landsat 8, and Sentinel-1, and Artificial Neural Networks. J. Geovis. Spat. Anal. 2022, 6, 19. [Google Scholar] [CrossRef]
  83. Frank, D.; Reichstein, M.; Bahn, M.; Thonicke, K.; Frank, D.; Mahecha, M.D.; Smith, P.; Van der Velde, M.; Vicca, S.; Babst, F.; et al. Effects of climate extremes on the terrestrial carbon cycle: Concepts, processes and potential future impacts. Glob. Change Biol. 2015, 21, 2861–2880. [Google Scholar] [CrossRef]
  84. Deng, Y.; Wu, D.; Wang, X.; Xie, Z. Responding time scales of vegetation production to extreme droughts over China. Ecol. Indic. 2022, 136, 108630. [Google Scholar] [CrossRef]
  85. Kim, J.; Choi, J.; Choi, C.; Park, S. Impacts of changes in climate and land use/land cover under IPCC RCP scenarios on streamflow in the Hoeya River Basin, Korea. Sci. Total Environ. 2013, 452, 181–195. [Google Scholar] [CrossRef] [PubMed]
  86. Roy, J.; Picon-Cochard, C.; Augusti, A.; Benot, M.-L.; Thiery, L.; Darsonville, O.; Landais, D.; Piel, C.; Defossez, M.; Devidal, S.; et al. Elevated CO2 maintains grassland net carbon uptake under a future heat and drought extreme. Proc. Natl. Acad. Sci. USA 2016, 113, 6224–6229. [Google Scholar] [CrossRef] [PubMed]
  87. Sun, C.; Zhu, L.; Liu, Y.; Hao, Z.; Zhang, J. Changes in the drought condition over northern East Asia and the connections with extreme temperature and precipitation indices. Glob. Planet. Change 2021, 207, 103645. [Google Scholar] [CrossRef]
  88. Gao, H.; Liu, S.; Lu, W.; Smith, A.R.; Valbuena, R.; Yan, W.; Wang, Z.; Li, X.; Peng, X.; Li, Q.; et al. Global Analysis of the Relationship between Reconstructed Solar-Induced Chlorophyll Fluorescence (SIF) and Gross Primary Production (GPP). Remote Sens. 2021, 13, 2824. [Google Scholar] [CrossRef]
  89. Flach, M.; Brenning, A.; Gans, F.; Reichstein, M.; Sippel, S.; Mahecha, M.D. Vegetation modulates the impact of climate extremes on gross primary production. Biogeosciences 2021, 18, 39–53. [Google Scholar] [CrossRef]
  90. Zhu, X.; Zhang, S.; Liu, T.; Liu, Y. Impacts of Heat and Drought on Gross Primary Productivity in China. Remote Sens. 2021, 13, 378. [Google Scholar] [CrossRef]
Figure 1. Spatial distribution of vegetation types in the selected study area across China (the white area represents the pixels that were excluded for further analysis, including land cover type that has changed from 2001 to 2020, non-vegetation cover, and shrublands cover).
Remotesensing 14 04658 g001
Figure 2. Spatial distribution of annual (a) changing trend, (b) p-value, and seasonal changing trend in (c) spring, (d) summer, (e) autumn, and (f) winter across China from 2001 to 2020 using the standardized precipitation evapotranspiration index (SPEI) based on the Mann–Kendall (M–K) trend test.
Remotesensing 14 04658 g002
Figure 3. Spatial distribution of annual (a) changing trend, (b) p-value, and seasonal changing trend in (c) spring, (d) summer, (e) autumn, and (f) winter of vapor pressure deficit (VPD) across China from 2001 to 2020 based on the Mann–Kendall (M–K) trend test.
Remotesensing 14 04658 g003
Figure 4. Spatial distribution of annual (a) changing trend, (b) p-value, and seasonal changing trend in (c) spring, (d) summer, (e) autumn, and (f) winter of gross primary productivity (GPP) across China from 2001 to 2020 based on the Mann–Kendall (M–K) trend test.
Remotesensing 14 04658 g004
Figure 5. Spatial distribution of the correlation coefficients (R) between gross primary productivity (GPP) and standardized precipitation evapotranspiration index (SPEI) across China, under (a) annual and seasonal temporal scales including (b) spring, (c) summer, (d) autumn, and (e) winter from 2001 to 2020, and (f) annual and (g) seasonal frequency distribution of correlation coefficients (R) between GPP and SPEI.
Remotesensing 14 04658 g005
Figure 6. Frequency distribution of the areas with positive correlation (R > 0) between gross primary productivity (GPP) and standardized precipitation evapotranspiration index (SPEI) for different vegetation types, including (a) evergreen forests, (b) deciduous forests, (c) mixed forests, (d) woody savannas, (e) savannas, (f) grasslands, and (g) croplands under different temporal scales (annual and seasonal) across China from 2001 to 2020.
Remotesensing 14 04658 g006
Figure 7. Spatial distribution of the correlation coefficients (R) between gross primary productivity (GPP) and vapor pressure deficit (VPD) across China under (a) annual and seasonal temporal scales including (b) spring, (c) summer, (d) autumn, and (e) winter from 2001 to 2020, and (f) annual and (g) seasonal frequency distribution of correlation coefficients (R) between GPP and VPD.
Remotesensing 14 04658 g007
Figure 8. Frequency distribution of the areas with negative correlation (R < 0) between gross primary productivity (GPP) and vapor pressure deficit (VPD) for different vegetation types (a) evergreen forests, (b) deciduous forests, (c) mixed forests, (d) woody savannas, (e) savannas, (f) grasslands, and (g) croplands under different temporal scales (annual and seasonal) across China from 2001 to 2020.
Remotesensing 14 04658 g008
Figure 9. Spatial distribution of (a) the correlation coefficients (R) and (b) statistical significance (p-value) between GPPdrought_month (the average GPP of all drought months in a year) and SPEIdrought_month (the sum of the absolute values of SPEI for all drought months in a year), and the spatial distribution of (c) the correlation coefficients (R) and (d) statistical significance (p-value) between GPPdrought_month and VPDdrought_month (the sum of the values of VPD for all drought months in a year).
Remotesensing 14 04658 g009
Figure 10. Frequency distribution of the areas with correlation coefficients (R) between GPPdrought_month (the average GPP of all drought months in a year) and SPEIdrought_month (the sum of the absolute values of SPEI for all drought months in a year; upper panel)/VPDdrought_month (the sum of the values of VPD for all drought months in a year; lower panel) for different vegetation types.
Remotesensing 14 04658 g010
Figure 11. New and improved current (1980–2016) Köppen-Geiger classifications of China (for explanations of the abbreviations, please see Table 3).
Remotesensing 14 04658 g011
Figure 12. Comparison and verification of interpolation data and the European Centre for Medium-Range Weather Forecasts Reanalysis 5 (ERA5) data of temperature for selected Köppen–Geiger classifications (a) BWk, (b) ET, (c) BSk, (d) Cfa, (e) Dwa, (f) Cwa, (g) Dwb, and (h) across China (see Table 3 for explanations of the abbreviations).
Remotesensing 14 04658 g012
Figure 13. Comparison and verification of interpolation data and the European Centre for Medium-Range Weather Forecasts Reanalysis 5 (ERA5) data of precipitation for selected Köppen–Geiger classifications (a) BWk, (b) ET, (c) BSk, (d) Cfa, (e) Dwa, (f) Cwa, (g) Dwb, and (h) across China (see Table 3 for explanations of the abbreviations).
Remotesensing 14 04658 g013
Figure 14. Comparison and verification of interpolation data and the European Centre for Medium-Range Weather Forecasts Reanalysis 5 (ERA5) data of relative humidity for selected Köppen–Geiger classifications (a) BWk, (b) ET, (c) BSk, (d) Cfa, (e) Dwa, (f) Cwa, (g) Dwb, and (h) across China (see Table 3 for explanations of the abbreviations).
Remotesensing 14 04658 g014
Table 1. Vegetation types and their area proportions of the selected study area.
Vegetation TypesArea Proportions (%)
Evergreen Forests3.3
Deciduous Forests5.2
Mixed Forests2.2
Woody Savannas12.7
Savannas8.1
Grasslands48.6
Croplands19.9
Table 2. The area proportions of the annual decreasing trend of SPEI, increasing trend of VPD, and increasing trend of GPP from 2001 to 2020 across China, under different vegetation types (unit: %).
Vegetation TypesSPEIVPDGPP
Evergreen Forests46.449.780.1
Deciduous Forests16.227.697.5
Mixed Forests15.125.290.4
Woody Savannas27.131.296.8
Savannas20.737.196.1
Grasslands32.665.187.2
Croplands41.654.793.2
Table 3. Köppen–Geiger classifications and their area proportions of China (classifications with area proportions greater than 8% were selected for further analysis).
Köppen–Geiger ClassificationsAbbreviationsArea Proportions (%)
Arid, desert, coldBWk21.806
Polar, tundraET15.098
Arid, steppe, coldBSk12.792
Temperate, no dry season, hot summerCfa11.570
Cold, dry winter, hot summerDwa11.344
Temperate, dry winter, hot summerCwa9.271
Cold, dry winter, warm summerDwb8.545
Cold, dry winter, cold summerDwc5.602
Temperate, dry winter, warm summerCwb2.937
Tropical, savannahAw0.293
Polar, frostEF0.264
Cold, no dry season, cold summerDfc0.202
Temperate, no dry season, warm summerCfb0.082
Tropical, monsoonAm0.073
Cold, no dry season, warm summerDfb0.033
Cold, no dry season, hot summerDfa0.028
Cold, dry summer, cold summerDsc0.021
Arid, steppe, hotBSh0.014
Tropical, rainforestAf0.013
Cold, dry summer, warm summerDsb0.012
Publisher’s Note: MDPI stays neutral with regard to jurisdictional claims in published maps and institutional affiliations.

