Article

Monitoring Asian Dust Storms from NOAA-20 CrIS Double CO2 Band Observations

1
Collaborative Innovation Center on Forecast and Evaluation of Meteorological Disasters, Key Laboratory for Aerosol-Cloud-Precipitation of China Meteorological Administration, Nanjing University of Information Science & Technology, Nanjing 210044, China
2
CMA Earth System Modeling and Prediction Centre (CEMC), China Meteorological Administration, Beijing 100081, China
3
State Key Laboratory of Severe Weather, Chinese Academy of Meteorological Sciences, China Meteorological Administration, Beijing 100081, China
*
Author to whom correspondence should be addressed.
Remote Sens. 2022, 14(18), 4659; https://doi.org/10.3390/rs14184659
Submission received: 5 July 2022 / Revised: 4 September 2022 / Accepted: 14 September 2022 / Published: 18 September 2022

Abstract

:
Sand and dust storms (SDSs) are common environmental hazards in spring in Asian continent and have significant impacts on human health, weather, and climate. While many technologies have been developed to monitor SDSs, this study investigates the spectral characteristics of SDSs in satellite hyperspectral infrared observations and propose a new methodology to monitor the storms. An SDS emission and scattering index (SESI) is based on the differential responses of infrared CO2 shortwave and longwave IR bands to the scattering and emission of sand and dust particles. For a severe dust storm process during 14–17 March 2021, the SESI calculated by the Cross-track Infrared Sounder (CrIS) observations shows very negative values in the dusty region and is consistent with the spatial distribution of dust identified from the true-color RGB imagery and the dust RGB imagery of the Visible Infrared Imaging Radiometer Suite (VIIRS) on the NOAA-20 Satellite. The use of the SESI index in the near-surface layer allows for monitoring of the dust storm process and enables an effective classification between surface variations and dust weather events.

1. Introduction

Sand and dust storms (SDSs) usually occur when strong winds lift large amounts of sand and dust from bare and dry soils into the atmosphere. SDSs are common phenomena in the Middle East, North Africa, Asia, and Australia during spring, winter, and early summer [1]. Today, it has been gradually realized that there are huge impacts of SDSs on weather, climate, the environment, human health, and society. Dust particles can serve as condensation nuclei and efficient ice nuclei for warm cloud formation and cold cloud generation, respectively. Airborne dust also absorbs and scatters solar radiation entering the Earth’s atmosphere, reducing the amount reaching the surface, and absorbing long-wave radiation bouncing back up from the surface, re-emitting it in all directions. Dust can also have an impact on the environment and society. Dust transports of iron and phosphorus are known to benefit marine biomass production where the shortage of such elements is stored. However, dust also has many negative impacts on agriculture, reducing crop yields by burying seedlings, causing a loss of plant tissue, reducing photosynthetic activity, and increasing soil erosion. Dust particle size is a key determinant of the potential hazards to human health. Small dust particles pose a serious health risk for people with respiratory disorders while large particles can damage external organs, causing allergy, skin and eye irritations, conjunctivitis, and enhanced susceptibility to ocular infection. Thus, it is imperative to monitor dust storms and predict their evolution.
The Asian dust has interactions with the Indian summer monsoon (ISM), and the subtropical jet stream [2,3]. Dust particles can modulate the circulation and precipitation of the ISM through the absorption of solar and terrestrial radiation when suspended in the atmosphere and when deposited in snow and ice at the surface and by acting as a nuclei of liquid and ice clouds. In turn, the ISM can affect dust emissions, transport, and deposition through atmospheric circulation and wet scavenging. Aerosols can cool the land surface and warm the middle-to-lower atmosphere, which increases both the convective inhibition and the convective available potential energy in the afternoon and reduces precipitation [4]. The synoptic pattern of the Red Sea trough associated with spring dust over the northern and western Arabian Peninsula (AP) was analyzed, and a condition favorable for transporting dust westward into the AP occurs when interaction was produced between the low pressure over the southern AP and Sudan low and forms a wavy zonal pressure gradient [5,6,7].
The Modern-Era Retrospective Analysis for Research and Applications, version 2 (MERRA-2), and Copernicus Atmosphere Monitoring Service Reanalysis (CAMSRA) data were evaluated using Moderate Resolution Imaging Spectroradiometer (MODIS) aerosol optical depth (AOD) products over the Sichuan Basin (SCB) in China during 2003–2018 [8], where there has been a prominent slowing down of the severe air pollution status over the SCB since 2012. The temporal evolution of aerosols and their extreme events in Eastern China and India were interpreted with Terra-MODIS’s 20-year observations [9]. Both the magnitude and frequency of the aerosol pollution extreme events (APEE) increased in India from 2000 to 2010 and decreased in Eastern China from 2011 to 2019, while that of the APEE kept increasing during 2000–2019. Due to the meteorological condition, upward winter AOD trends were identified over the Eastern Mediterranean and the Middle East region from 2000 to 2019, using MERRA-2 and MODIS Collection 6.1 data [10]. With the multiple satellite retrievals and MERRA-2, the long-term trends of high APEE were derived during 2000–2017 [11]. It is indicated that both the frequency and spatial scale of the summer high APEE exhibited significant negative trends over the Eastern U.S., while those of moderate aerosol events exhibited weak upward trends. Opposing trends of smaller magnitude were derived in the Northwestern U.S. and Southwestern Canada.
Several methodologies have been proposed for detecting SDSs using visible, infrared, and microwave satellite instrument observations [12,13]. Using the singular value decomposition (SVD) method, the dust AOD in Beijing was retrieved from the hyperspectral observed data of the Atmospheric InfraRed Sounder (AIRS), which has shown consistent results with the ground-based observations of the Aerosol Observation Network (AERONET) data [14]. Empirical orthogonal functions (EOFs) and principal component analysis (PCA) were applied to analyze the spatiotemporal variability of the dust-aerosol optical depth and to identify the prevailing dust regimes over Southwest Asia and the Arabian Sea [15,16].
At visible wavelengths, the RGB true-color composite imagery can be used to detect the SDSs directly. The World Meteorological Organization (WMO) dust RGB natural composite scheme can detect the dust pixels in pink color and can determine the clear, cloudy, and sandy pixels effectively over deserts during both day and night. Ackerman [17] analyzed the brightness temperature difference (BTD) between 8 μm and 11 μm against that between 11 μm and 12 μm and concluded that this double difference from AVHHR and HIRS could robustly discriminate the dust from the clear sky over both oceans and land. However, this approach cannot determine the cirrus and dust since these channels are also sensitive to the upper cirrus cloud layer. Huang et al. [18] defined a microwave polarized index (MPI) with a brightness temperature difference between 23.8 GHz and 89 GHz of the Advanced Microwave Scanning Radiometer (AMSR-E) to monitor the dust storm and concluded that MPI can detect dust storms underneath cirrus clouds with about 90% accuracy. Ge et al. [19] studied the effects of dust storms on microwave radiation using AMSR-E observations and radiative transfer simulations over the Taklimakan desert. It was shown that the brightness temperatures at high microwave frequencies were depressed due to dust scattering and the dust particles also depolarized the surface microwave emission from deserts.
With different cloud emission and scattering effects at low (50–60 GHz) and high (~118.75 GHz) frequency oxygen bands, Han et al. [20] developed a cloud emission and scattering index (CESI) using the dual oxygen (O2) absorption bands on the Microwave Humidity Sounder (MWHS) and the Microwave Temperature Sounder (MWTS) onboard the Fengyun-3C satellite. Three pairs of the CESI at different vertical levels can detect the three-dimensional structures of the cloud and precipitation significantly. Similarly, the CESI was developed by using the Cross-track Infrared Sounder (CrIS)/Atmospheric Infrared Sounder (AIRS)/Hyperspectral Infrared Atmospheric Sounder (HIRAS) hyperspectral radiances at shortwave (~4.3 μm) and longwave (~15 μm) carbon dioxide (CO2) bands [21,22,23]. Unlike the CESI derived from the dual O2 band, it can provide more vertical CESI combinations with the hyperspectral IR radiances, which can measure the more detailed features of the cloud and precipitation. Whether the infrared CESI can detect SDSs still needs to be further explored.
The rest of this paper is structured as follows. Section 2 introduces the CrIS instruments and their observations for dust storm detection and studies the sensitivity from the radiative transfer simulations. Section 3 details three experiments of the concentration, effective radius, and height of the sand aerosols, which may have great influences on the CrIS brightness temperatures. The dust detection algorithm with CrIS double CO2 bands is then developed in Section 4. Section 5 demonstrates the observed SDSs from our algorithms and compares them with visible band true-color imagery and false-color imagery, respectively. The last section summarizes the major conclusions from this study.

2. Data and Model

2.1. NOAA-20 CrIS

The NOAA-20 satellite was launched successfully into Earth orbit on 18 November 2017. As one of five key instruments onboard NOAA-20, the Cross-track Infrared Sounder (CrIS) measures the radiations from three spectral bands: short-wave infrared (SWIR), medium-wave infrared (MWIR), and long-wave infrared (LWIR). As shown in Table 1, the CrIS full spectral resolution offers 2211 spectral channels with a resolution of 0.625 cm−1 for all three bands. The swath width of the CrIS is about 2200 km and the spatial resolution of the field of view (FOV) at the nadir is about 14 km. A typical cross-track scan consists of 34 FORs, 30 of which are Earth scene (ES) views, two deep space (DS) views, and two internal calibration target (ICT) views within 8 s. The ES field of regard (FOR) is defined by the combined 3 × 3 FOVs. CrIS data were also processed with Hamming apodization to reduce the noise, although unapodized data are also available for other research areas such as the retrievals of greenhouse gases.
In tandem with the Advanced Technology Microwave Sounder (ATMS), the CrIS provides improved measurements of the temperature and moisture profiles in the atmosphere. The combined data improves both the global and regional predictions of weather patterns, storm tracks, and precipitation through numerical weather prediction (NWP) data assimilation. The CrIS data alone also supplies the information to retrieve greenhouse gases, land surface, and cloud properties. The CrIS Sensor Data Record (SDR) can be ordered from the NOAA’s Comprehensive Large Array-Data Stewardship System (CLASS) website.

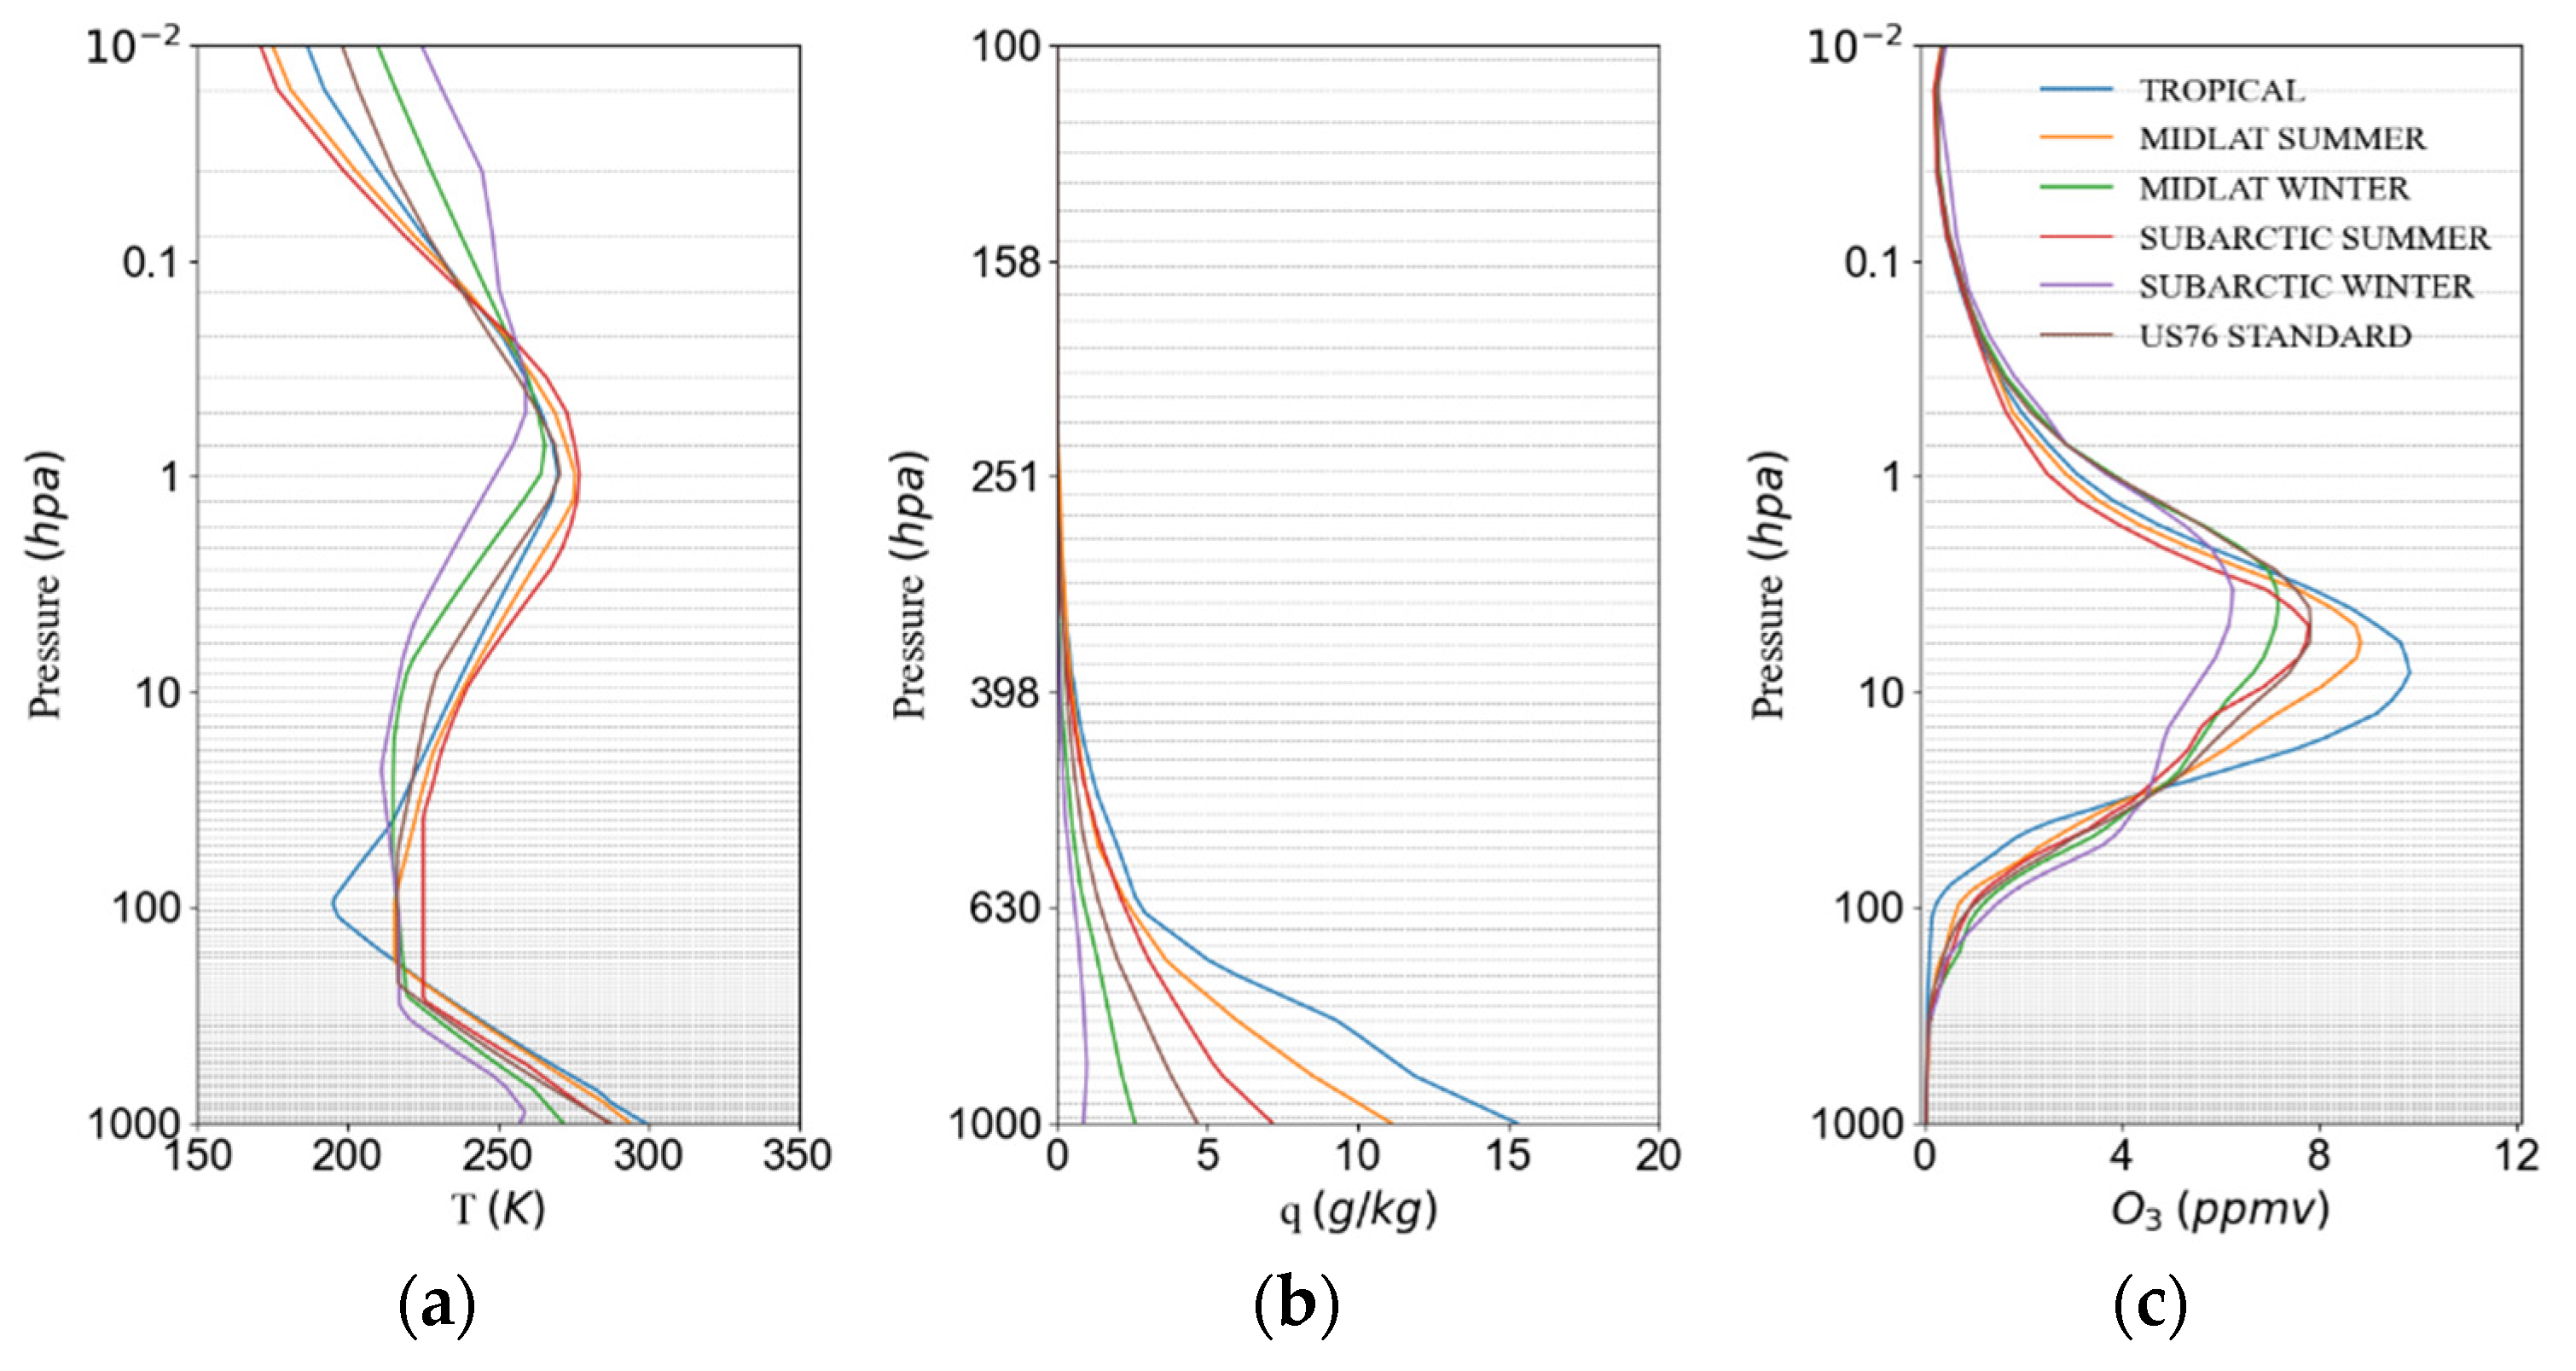
2.2. Radiative Transfer Model

The advanced radiative transfer modeling system (ARMS) was developed by the China Meteorological Administration (CMA) [24]. The ARMS is a fast radiative transfer model that is effective for the assimilation of satellite radiance data into NWP models. Given the atmospheric and surface parameters, it can accurately and rapidly simulate the microwave and infrared radiances and brightness temperatures observed by satellite instruments. Similar to the community radiative transfer model (CRTM) and the radiative transfer for TOVS (RTTOV), ARMS includes modular components: (1) atmospheric gaseous absorption; (2) aerosol and cloud absorption and scattering; (3) surface emission and reflection; and (4) radiative transfer schemes (both scaler and polarized solvers). In ARMS, the advanced doubling-adding (ADA) method [25] is employed as a scaler solver. Additionally, a polarized two-stream model (P2S) [26], the vector double and adding (VDA) scheme [27], hybrid radiative transfer solver (HRTS), and vector discrete ordinate radiative transfer model (VDISORT) [28,29] can also be implemented as alternative solvers for more accurate simulations in the events where scattering from molecules and aerosols can exhibit high anisotropic behaviors and require more streams in radiative transfer simulations. For the CrIS simulation, only a scaler solver is used for the sensitivity study.

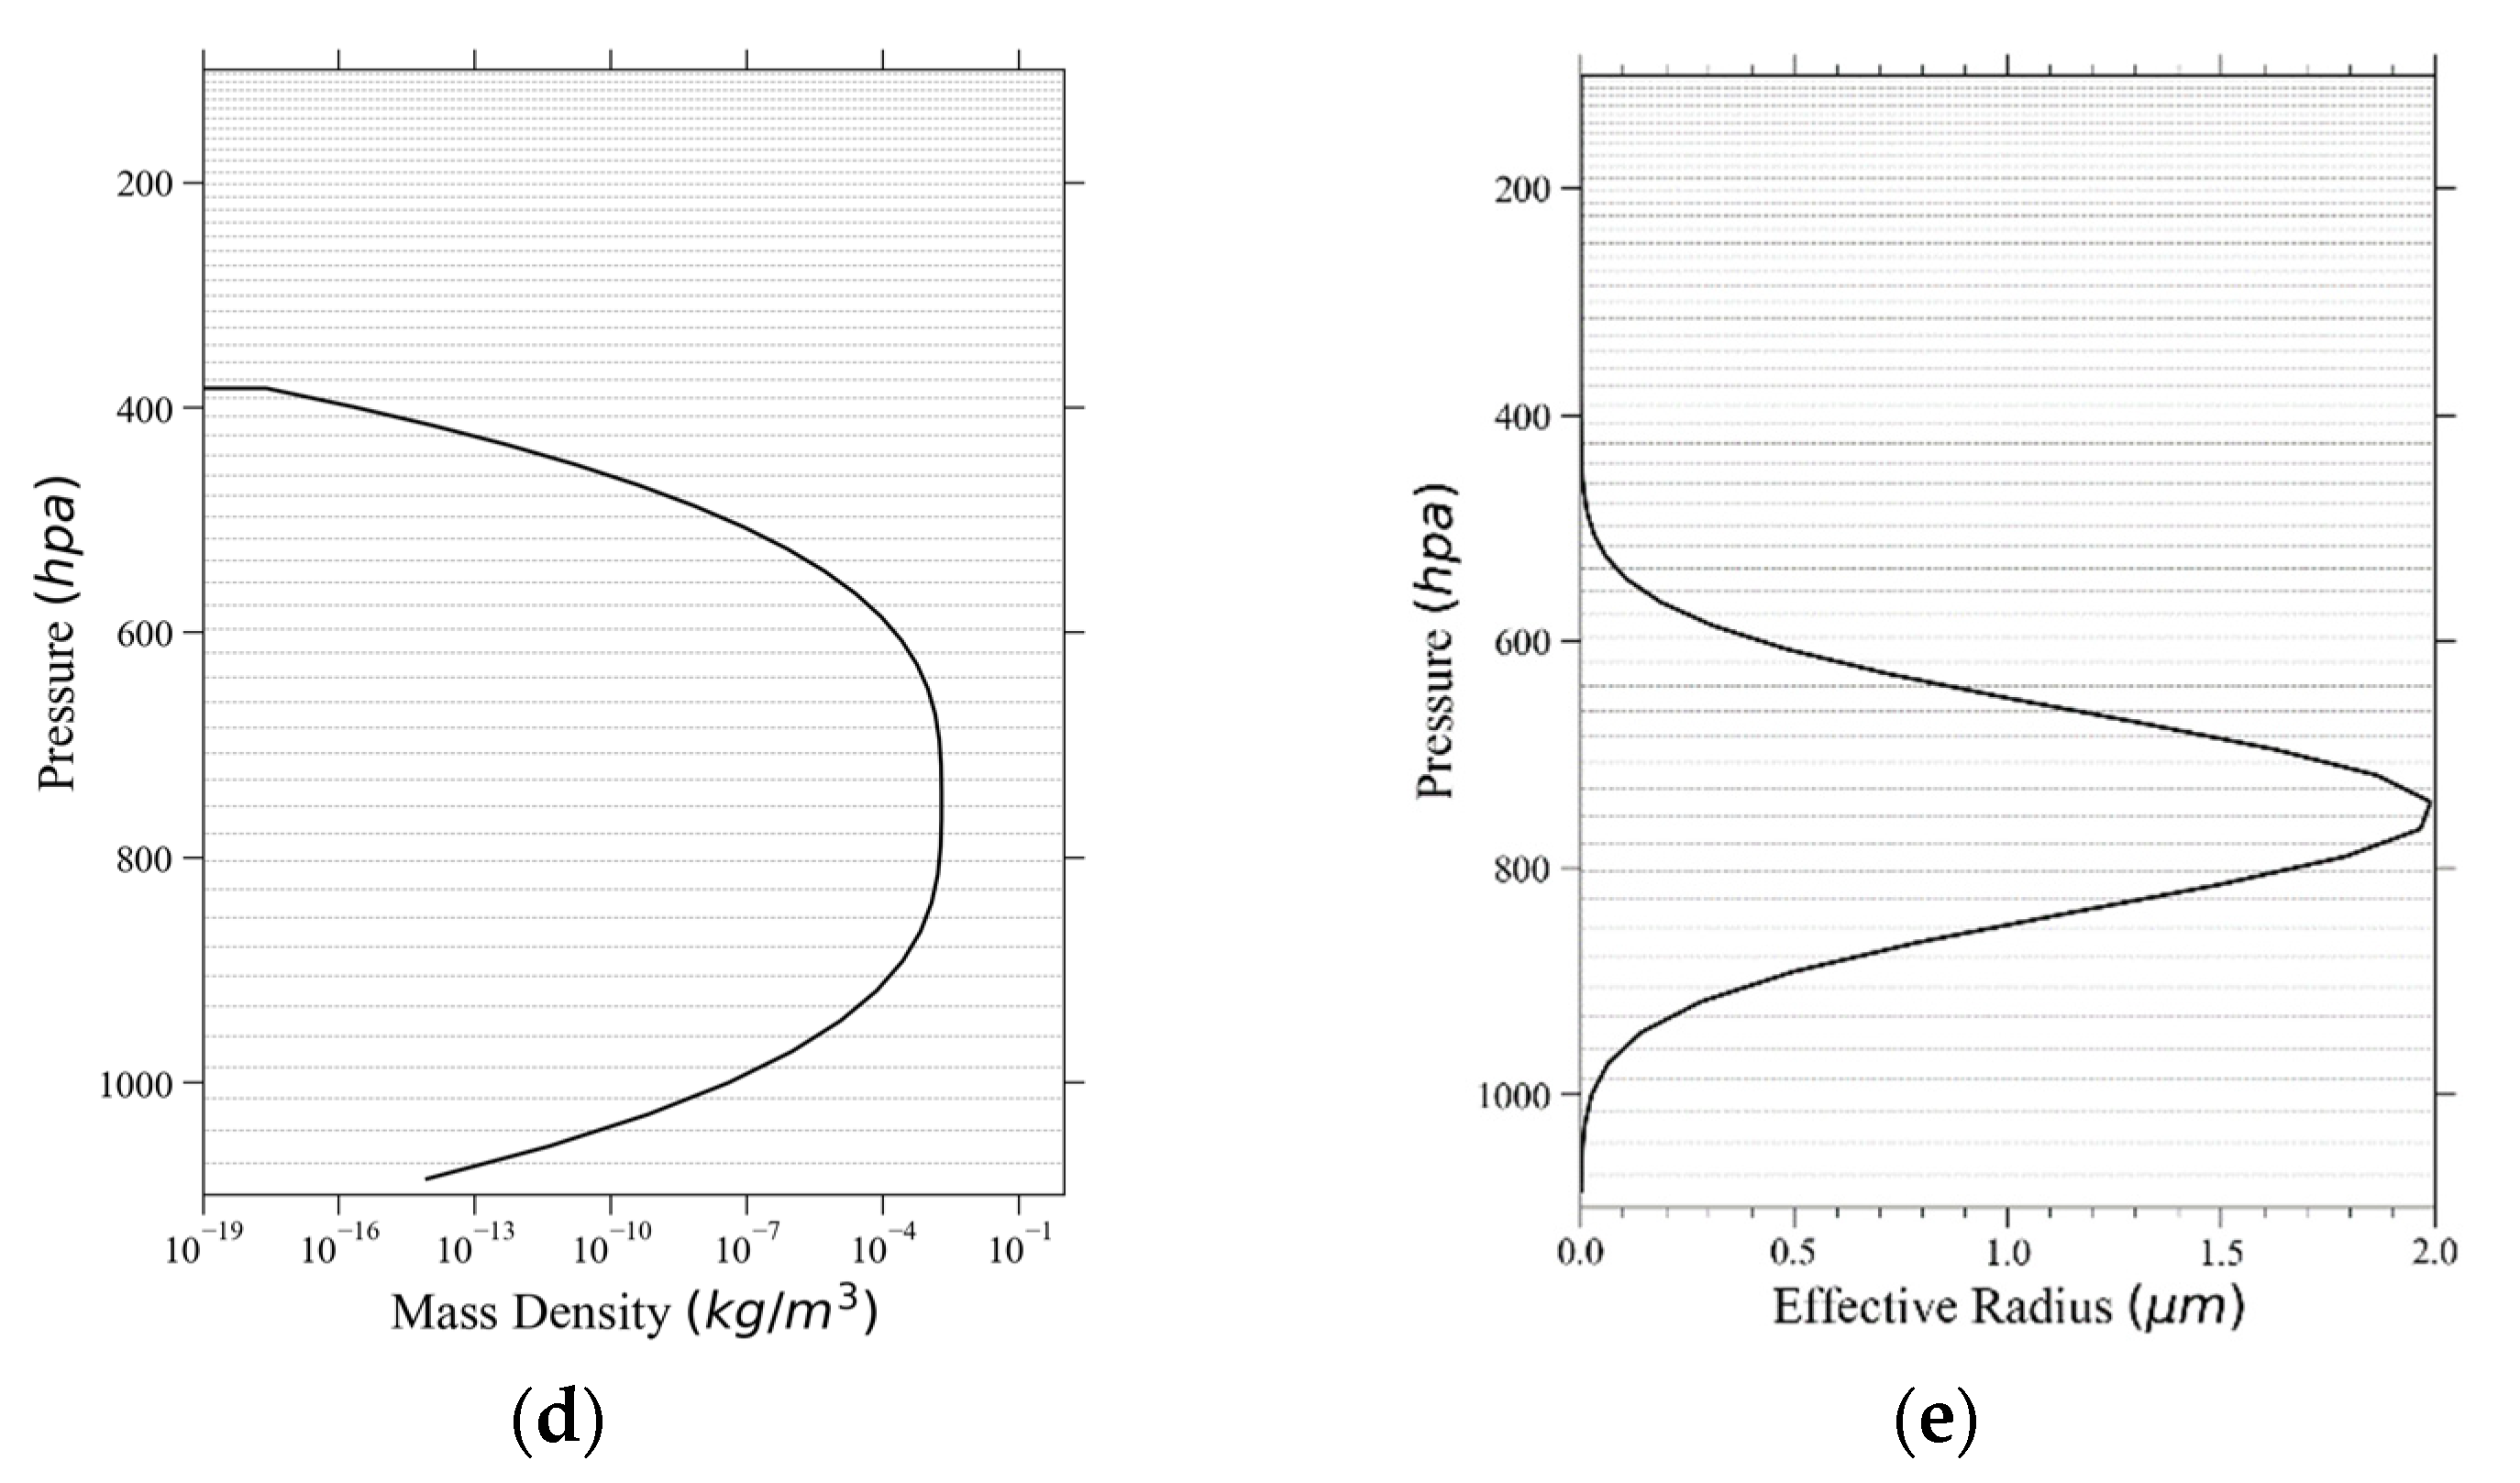
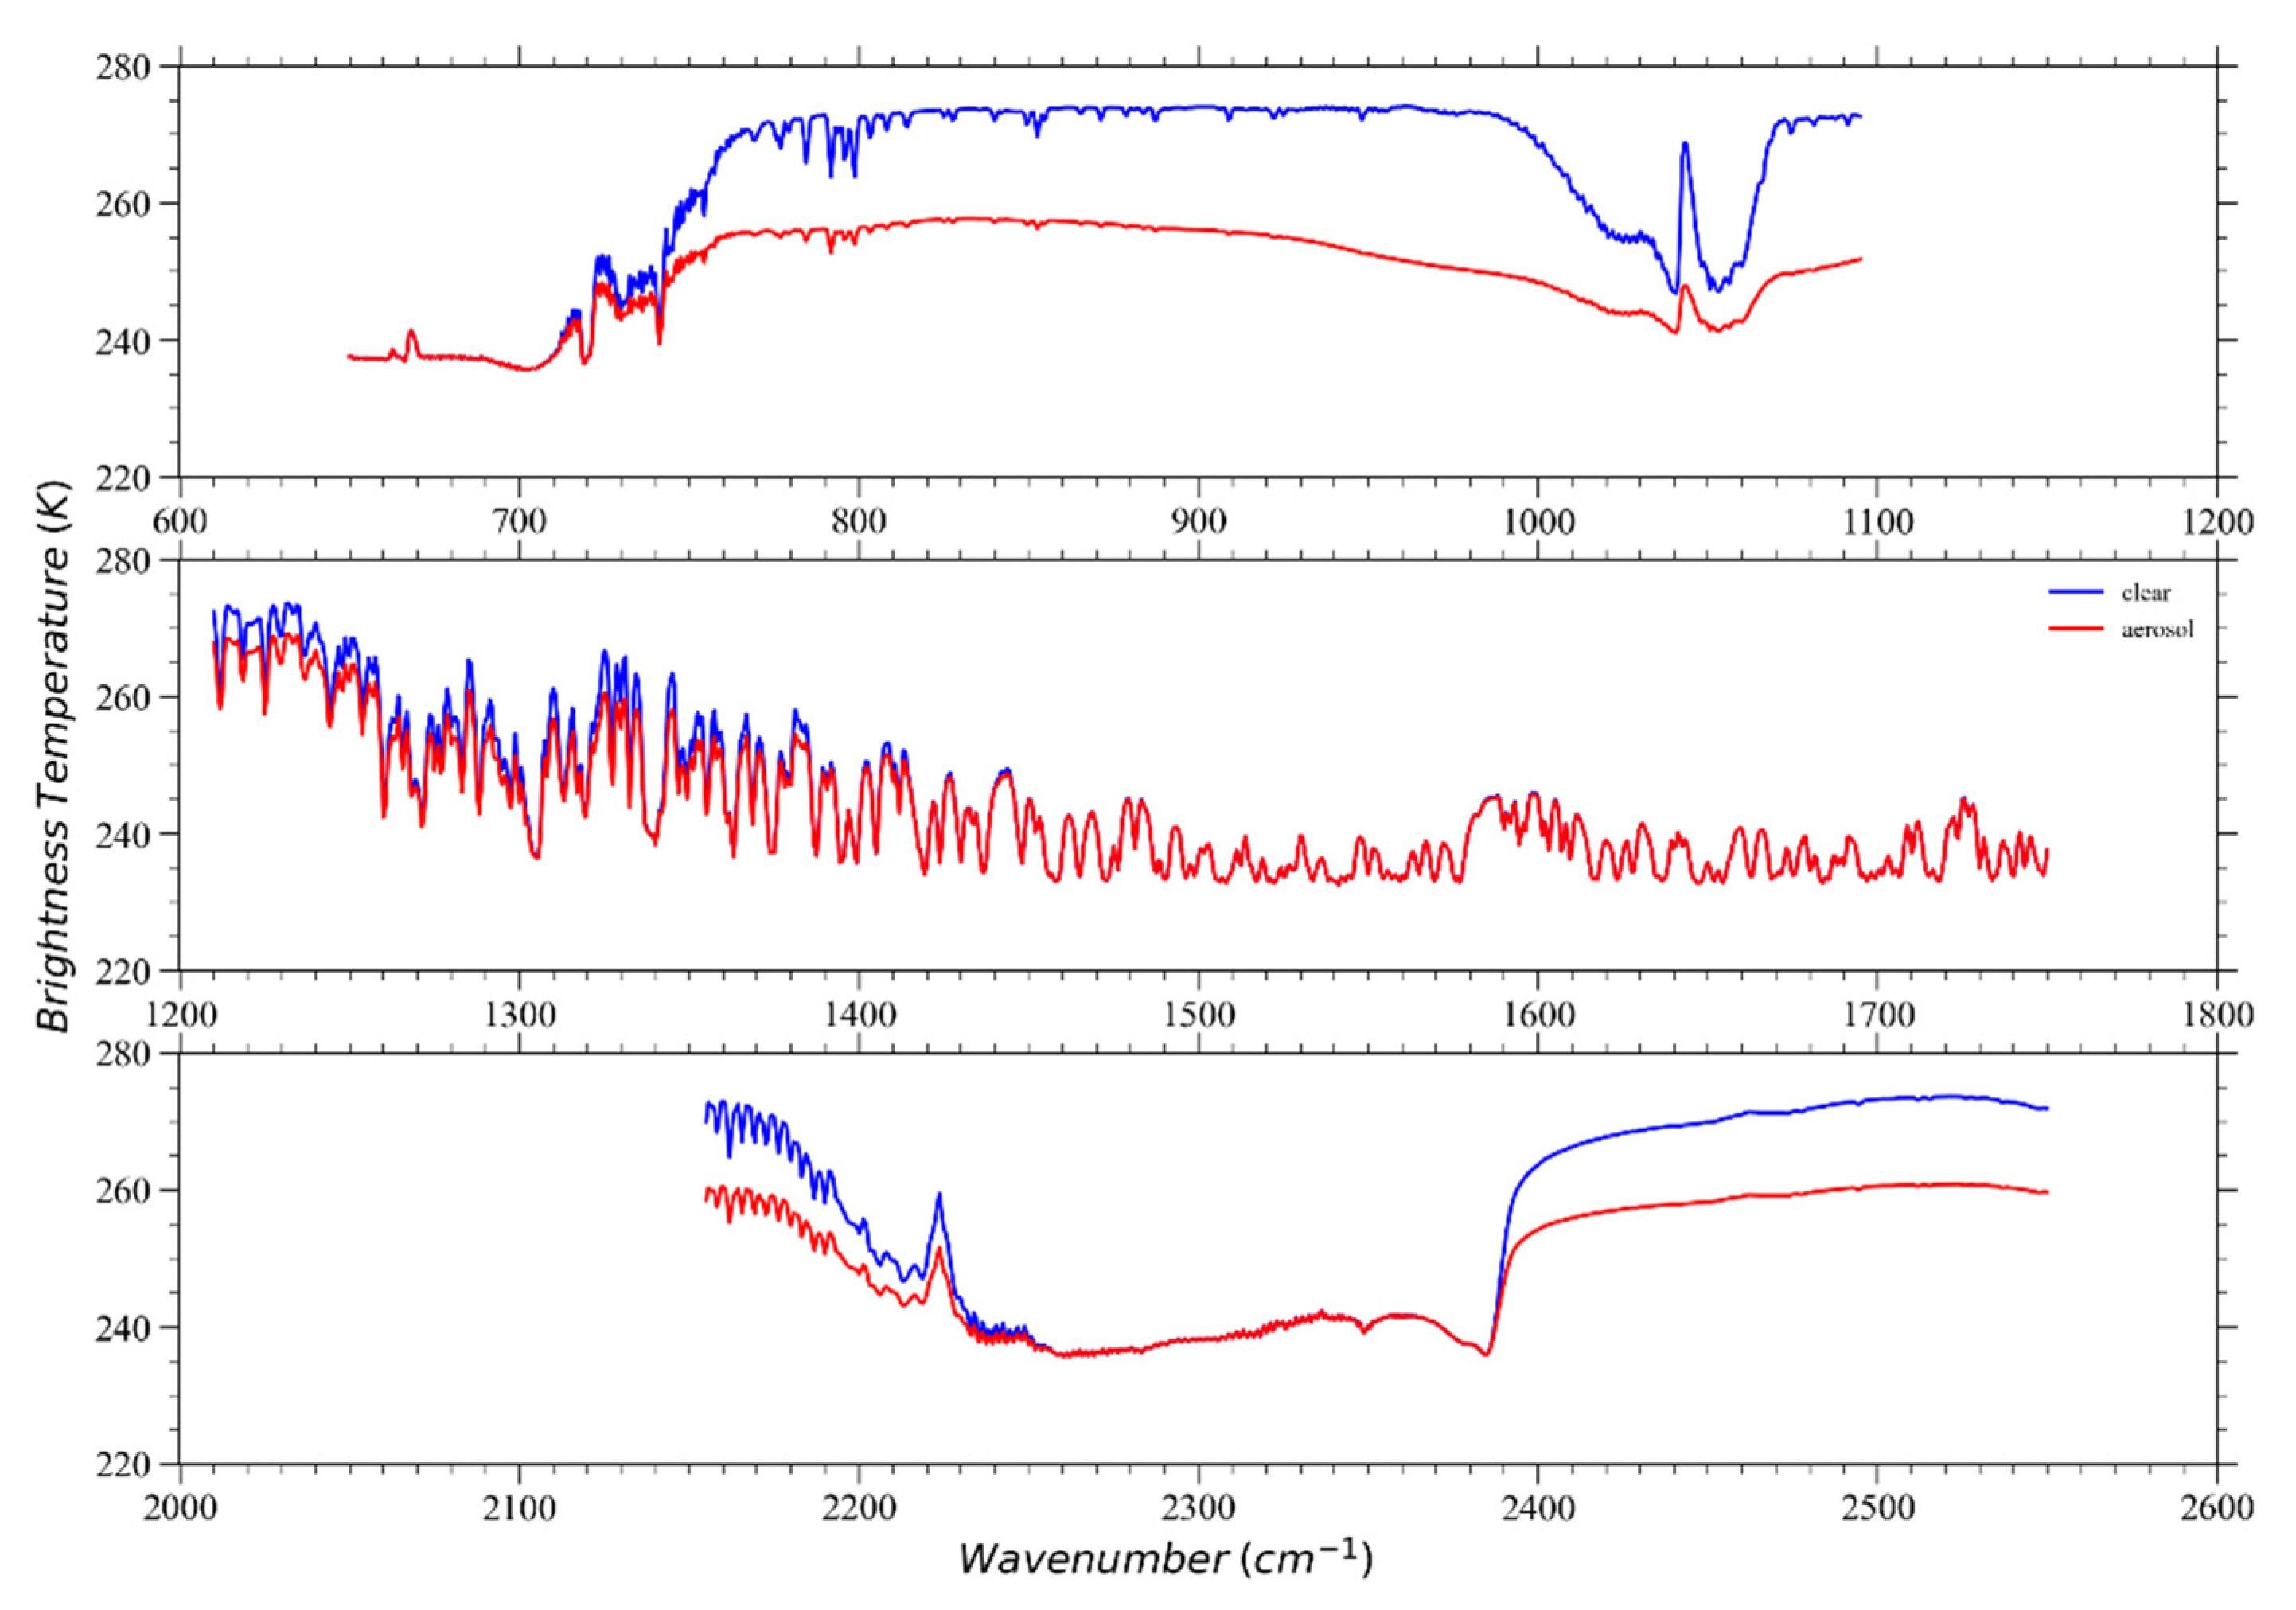
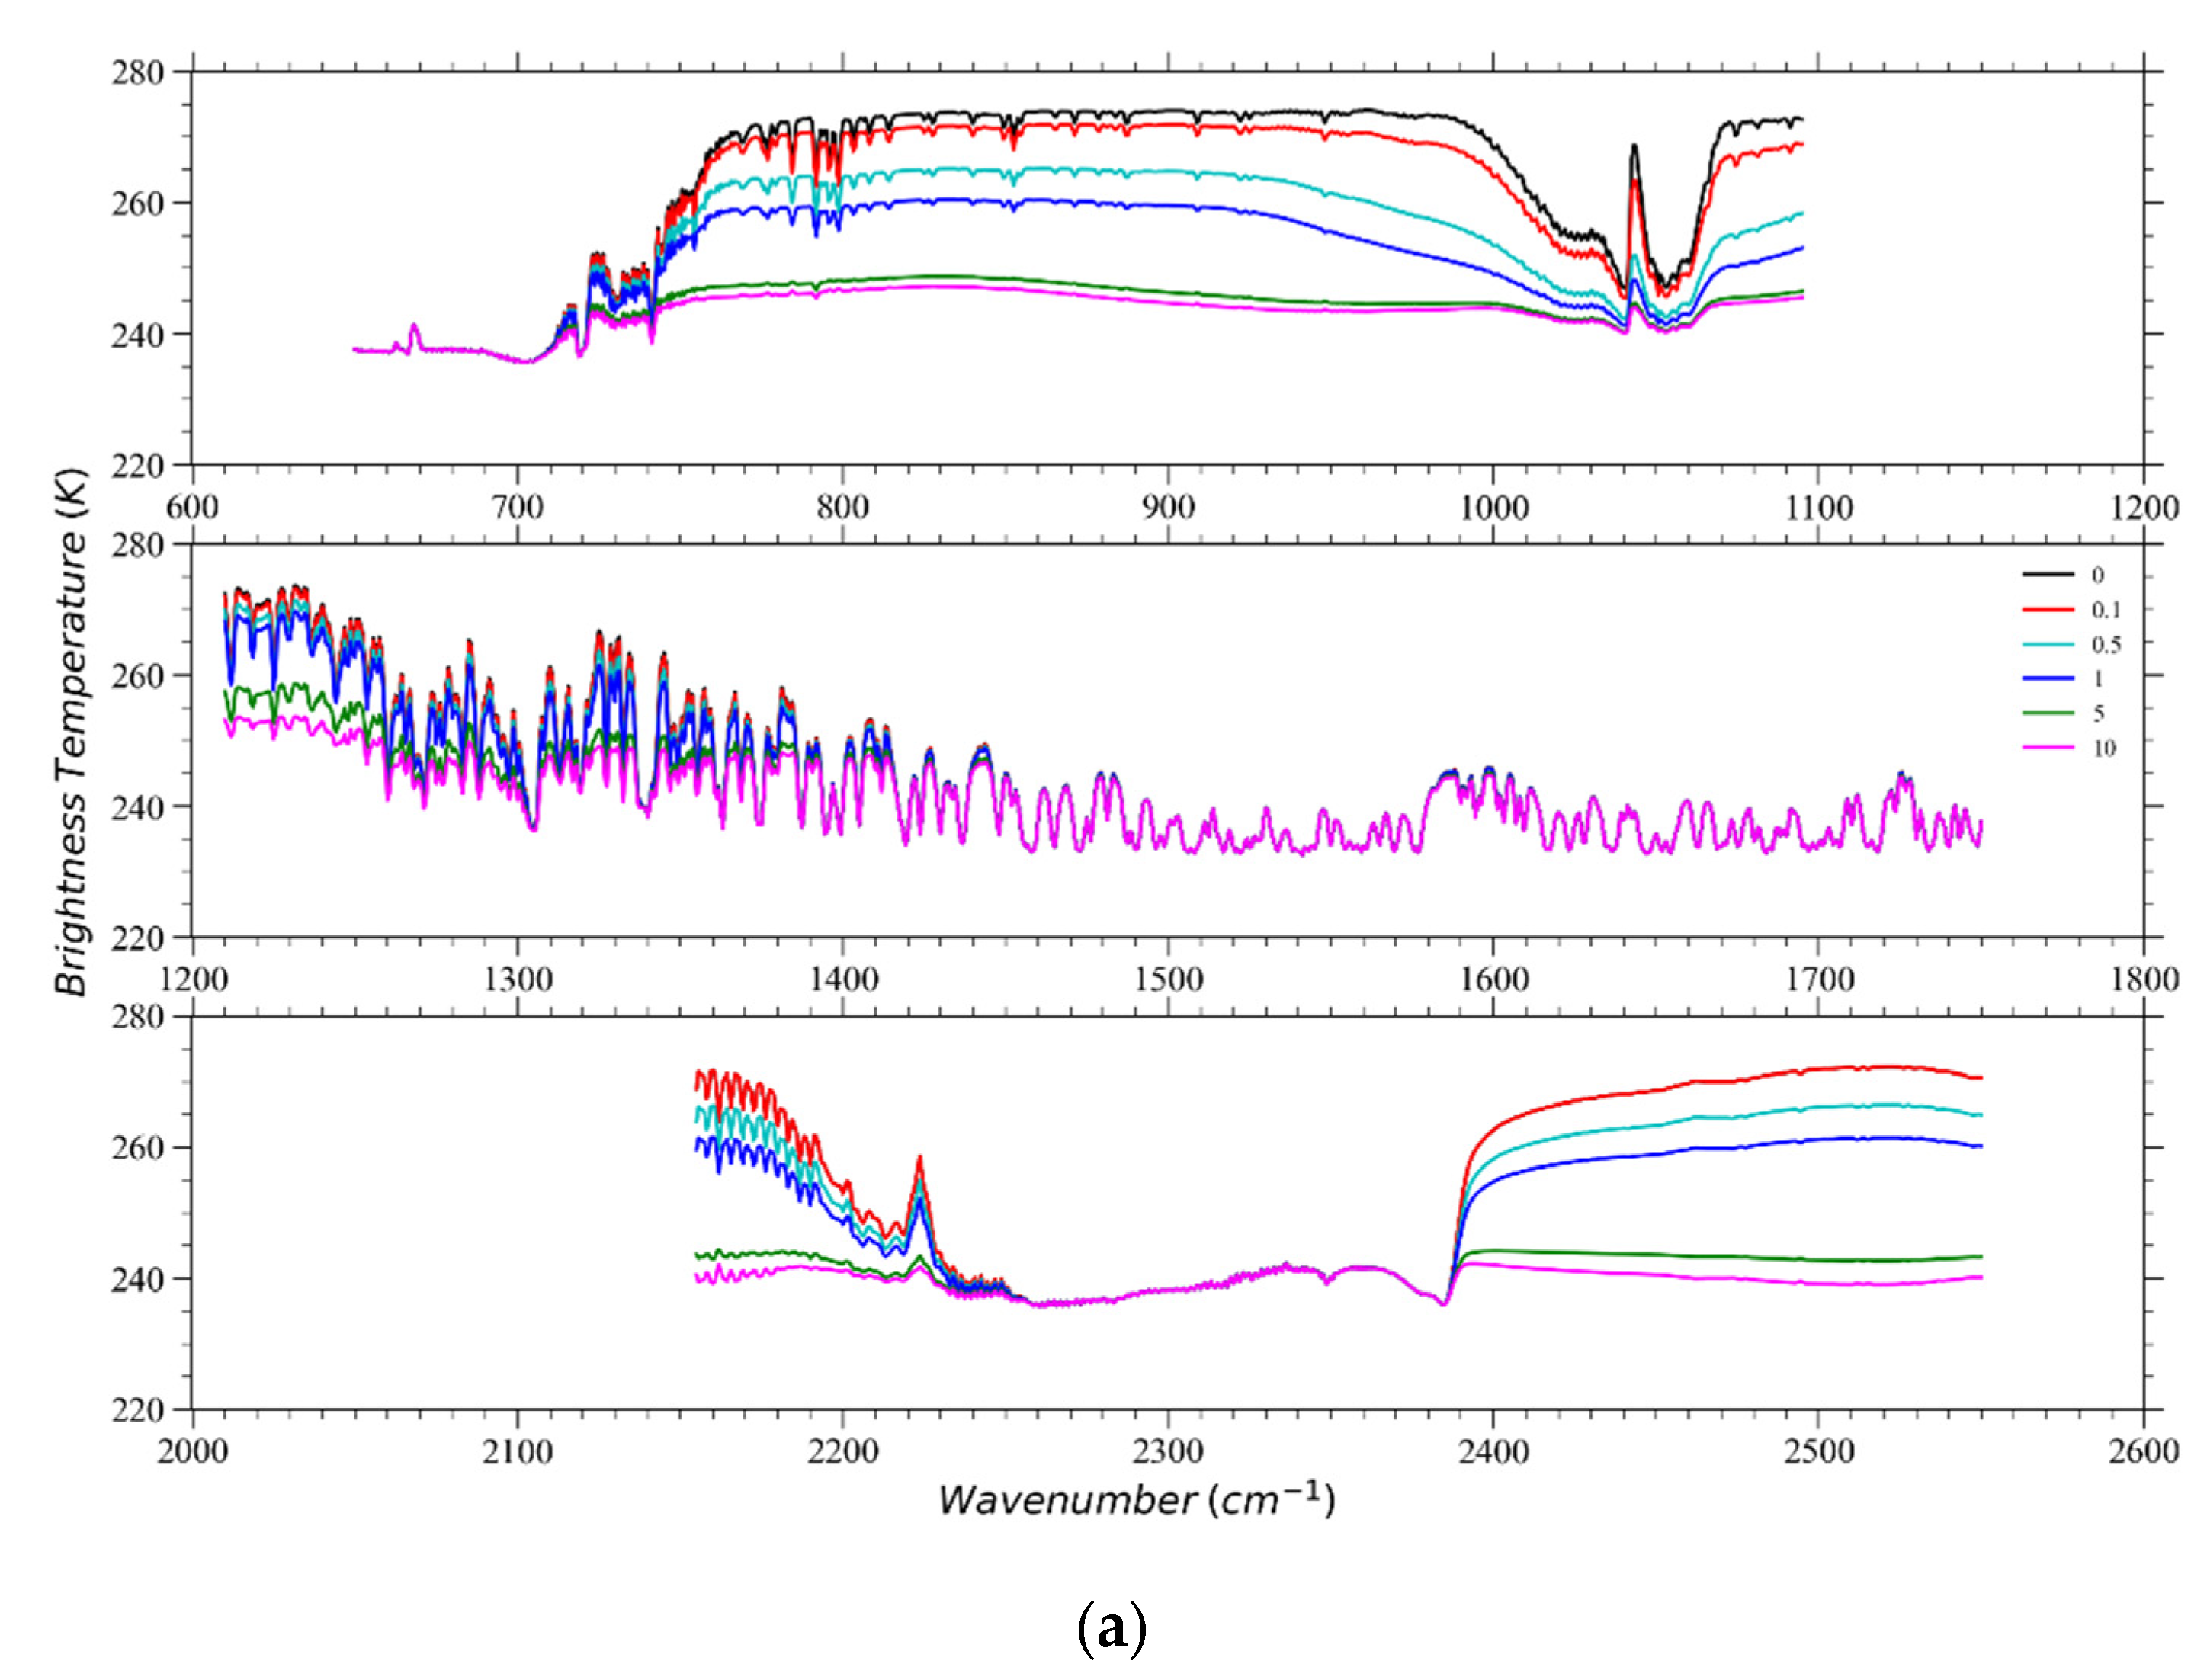
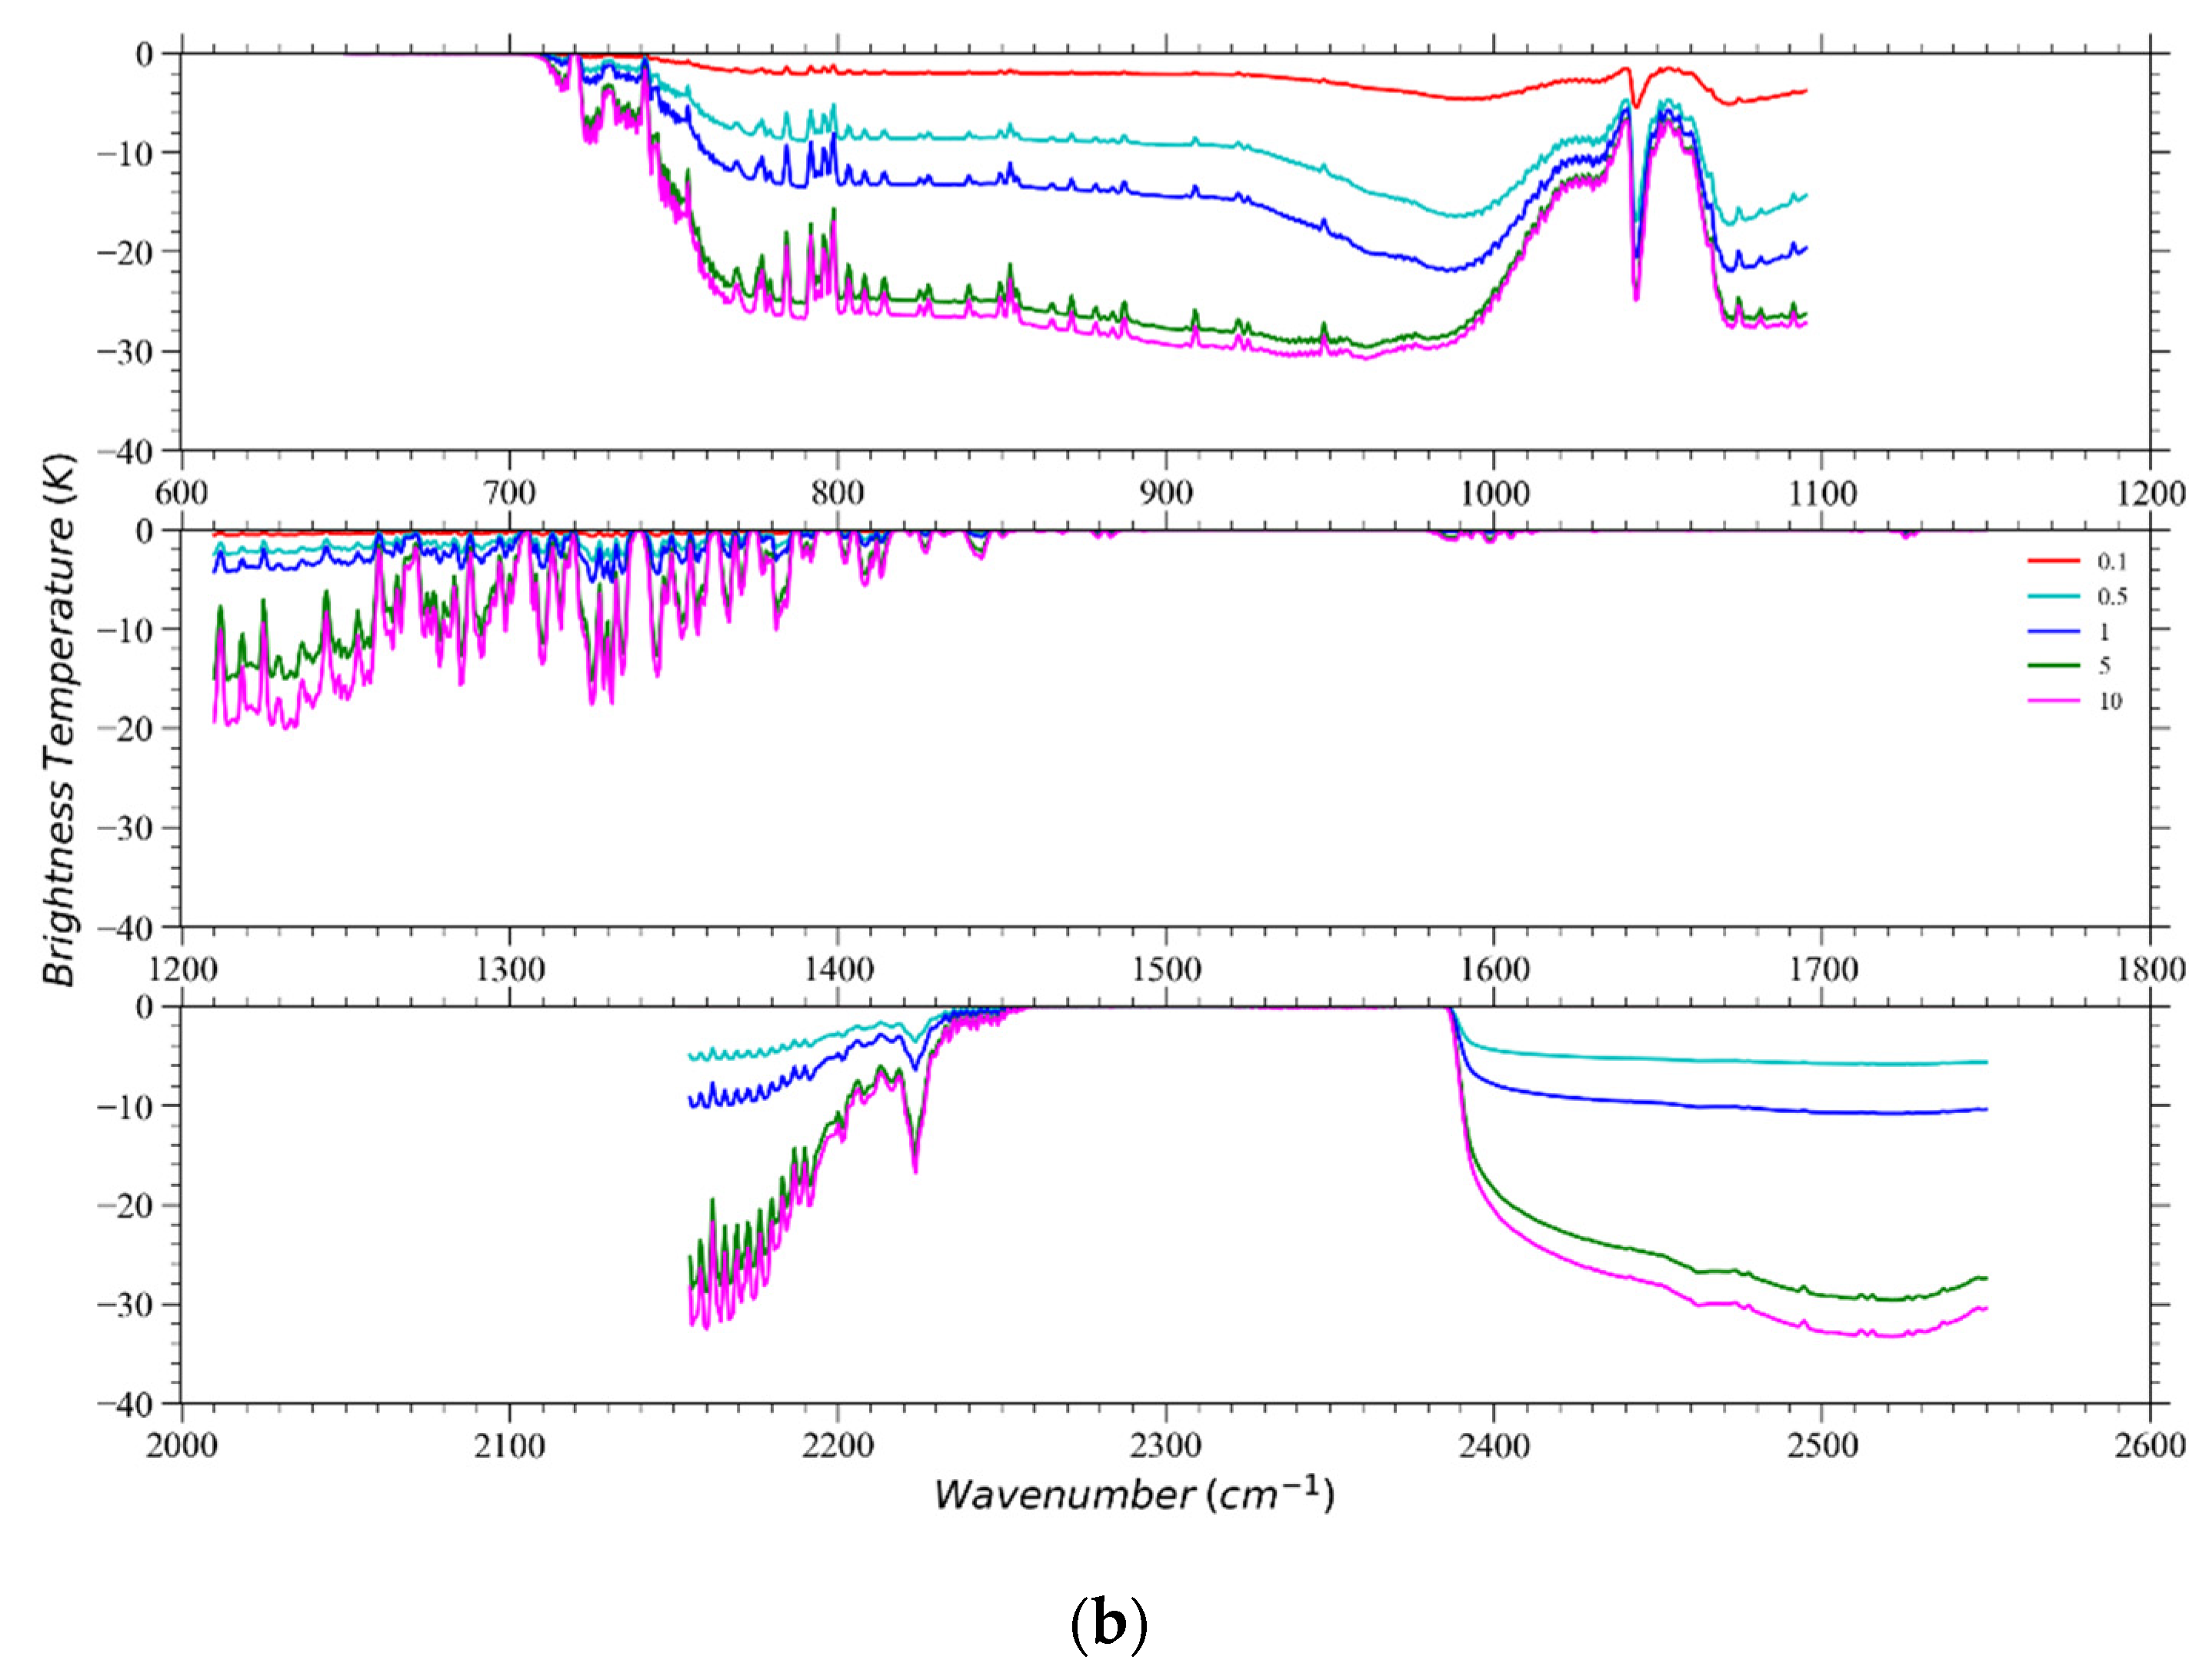
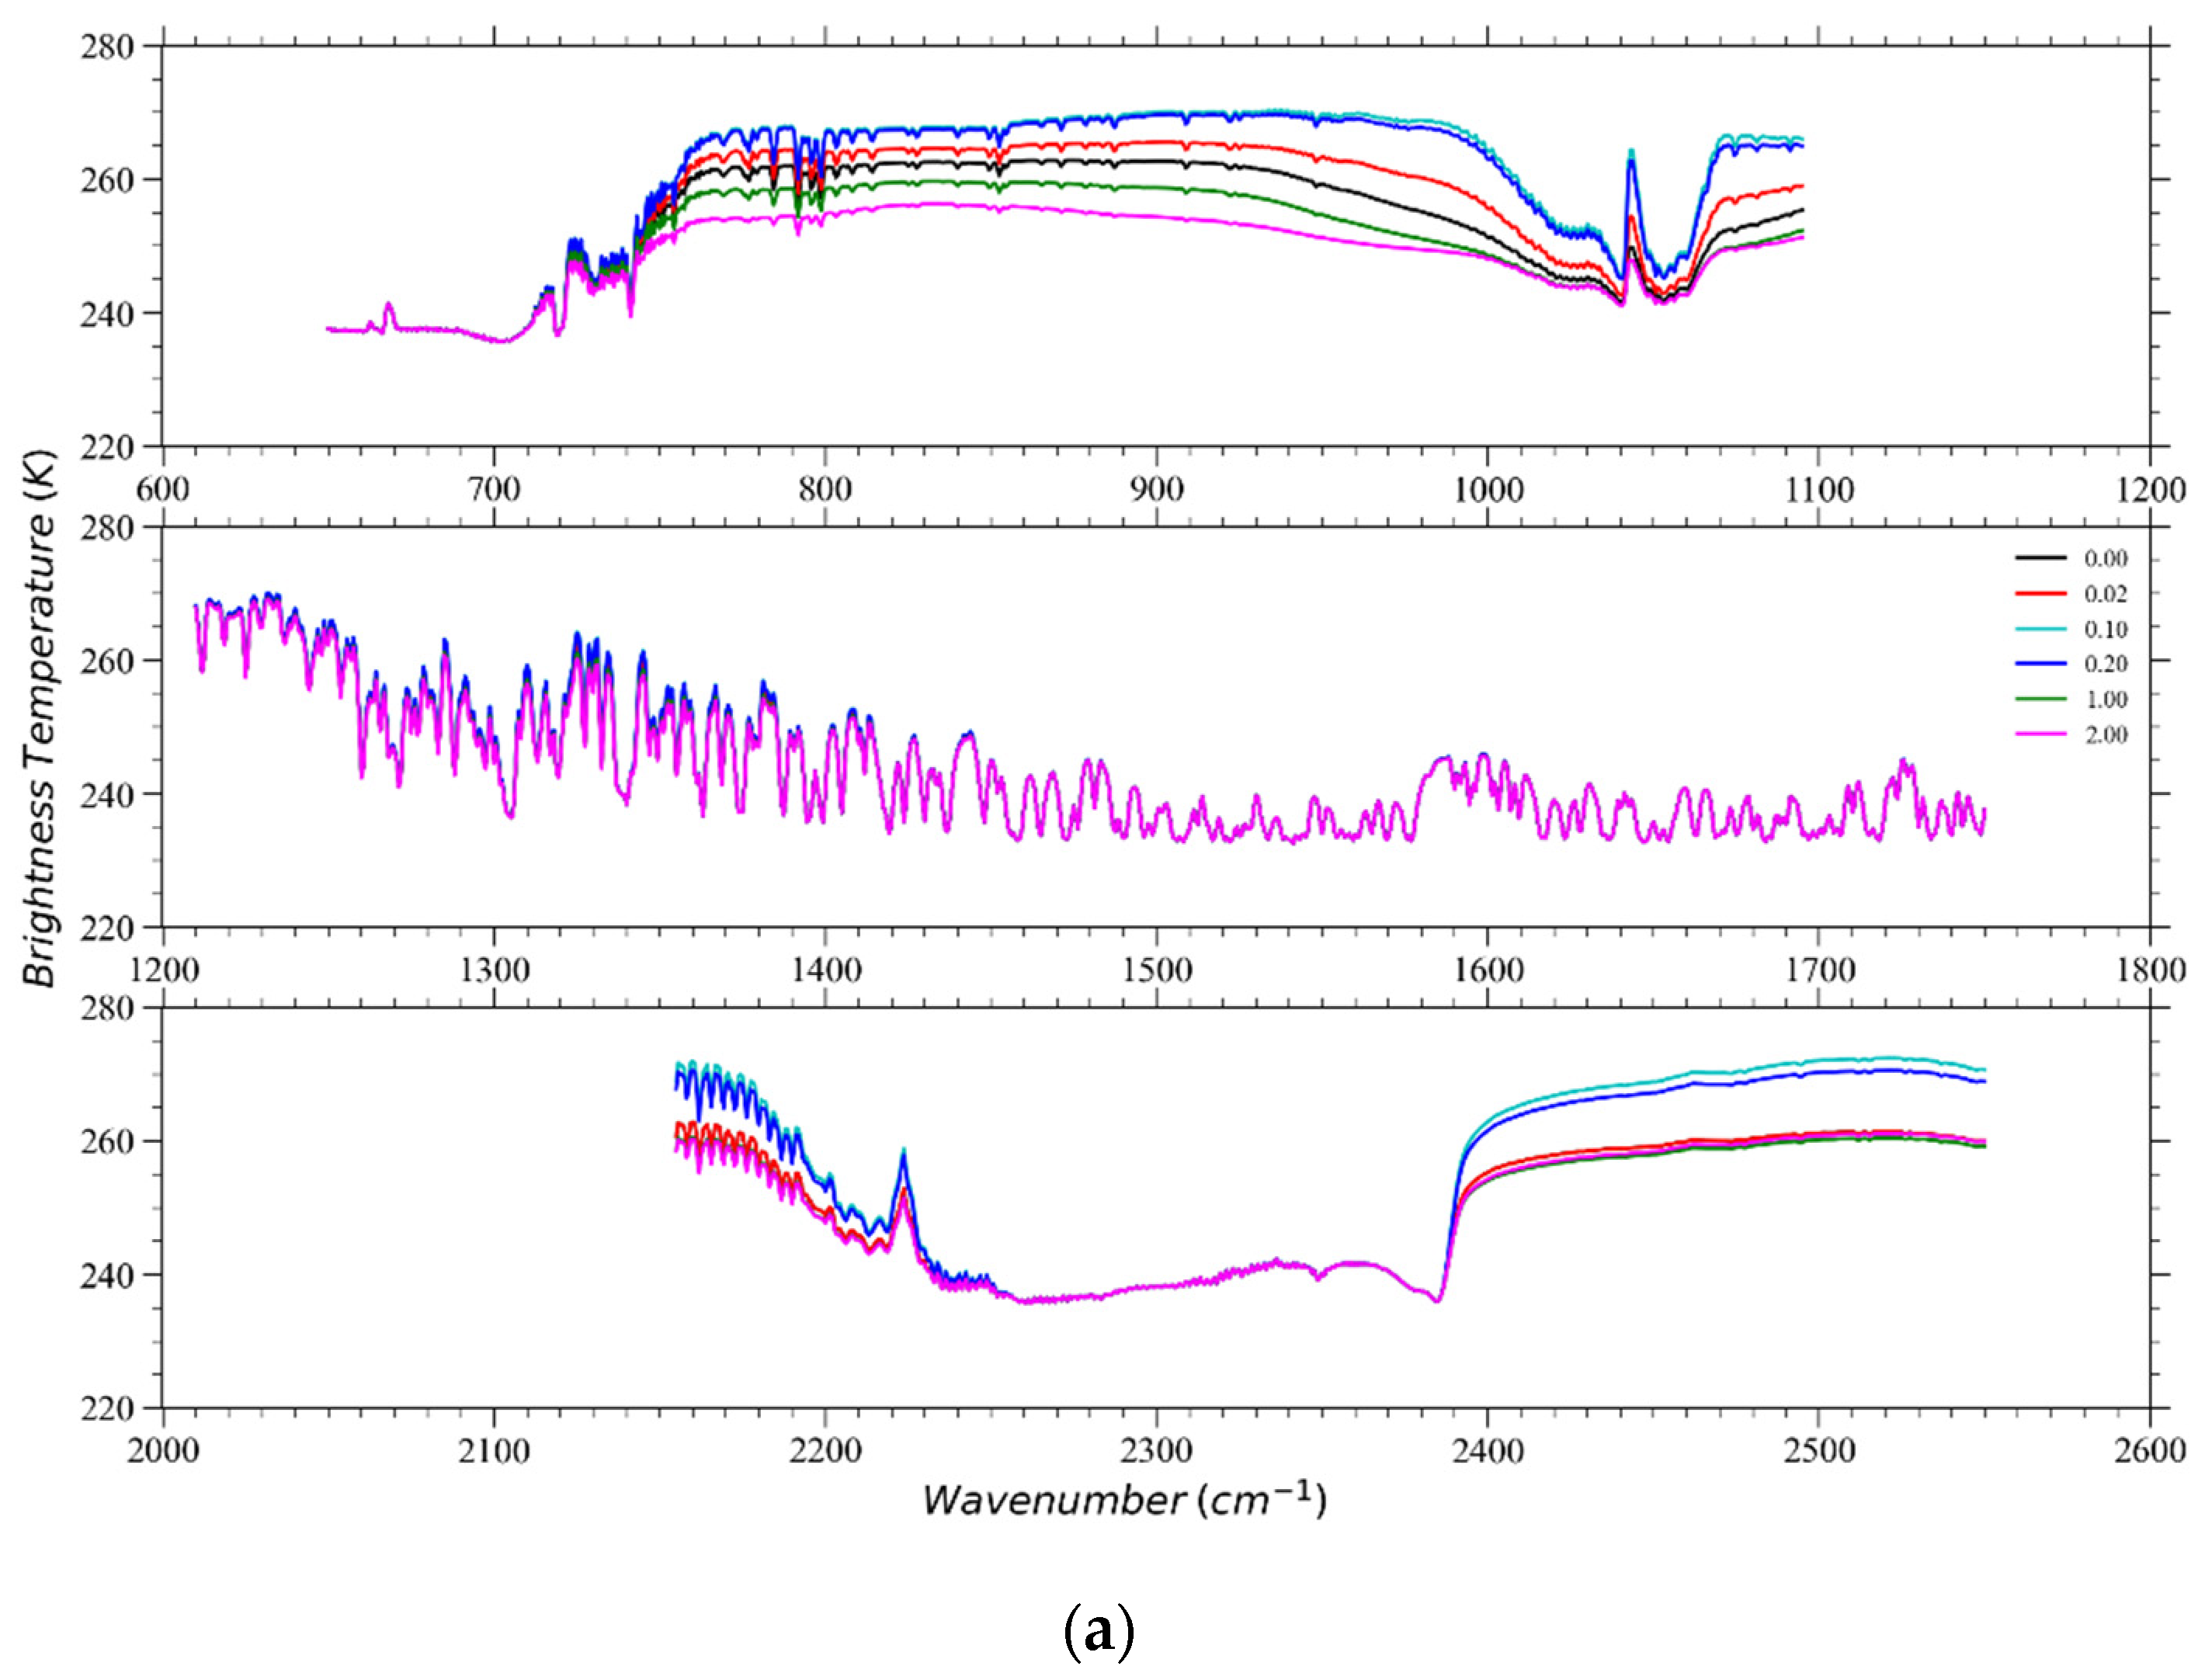
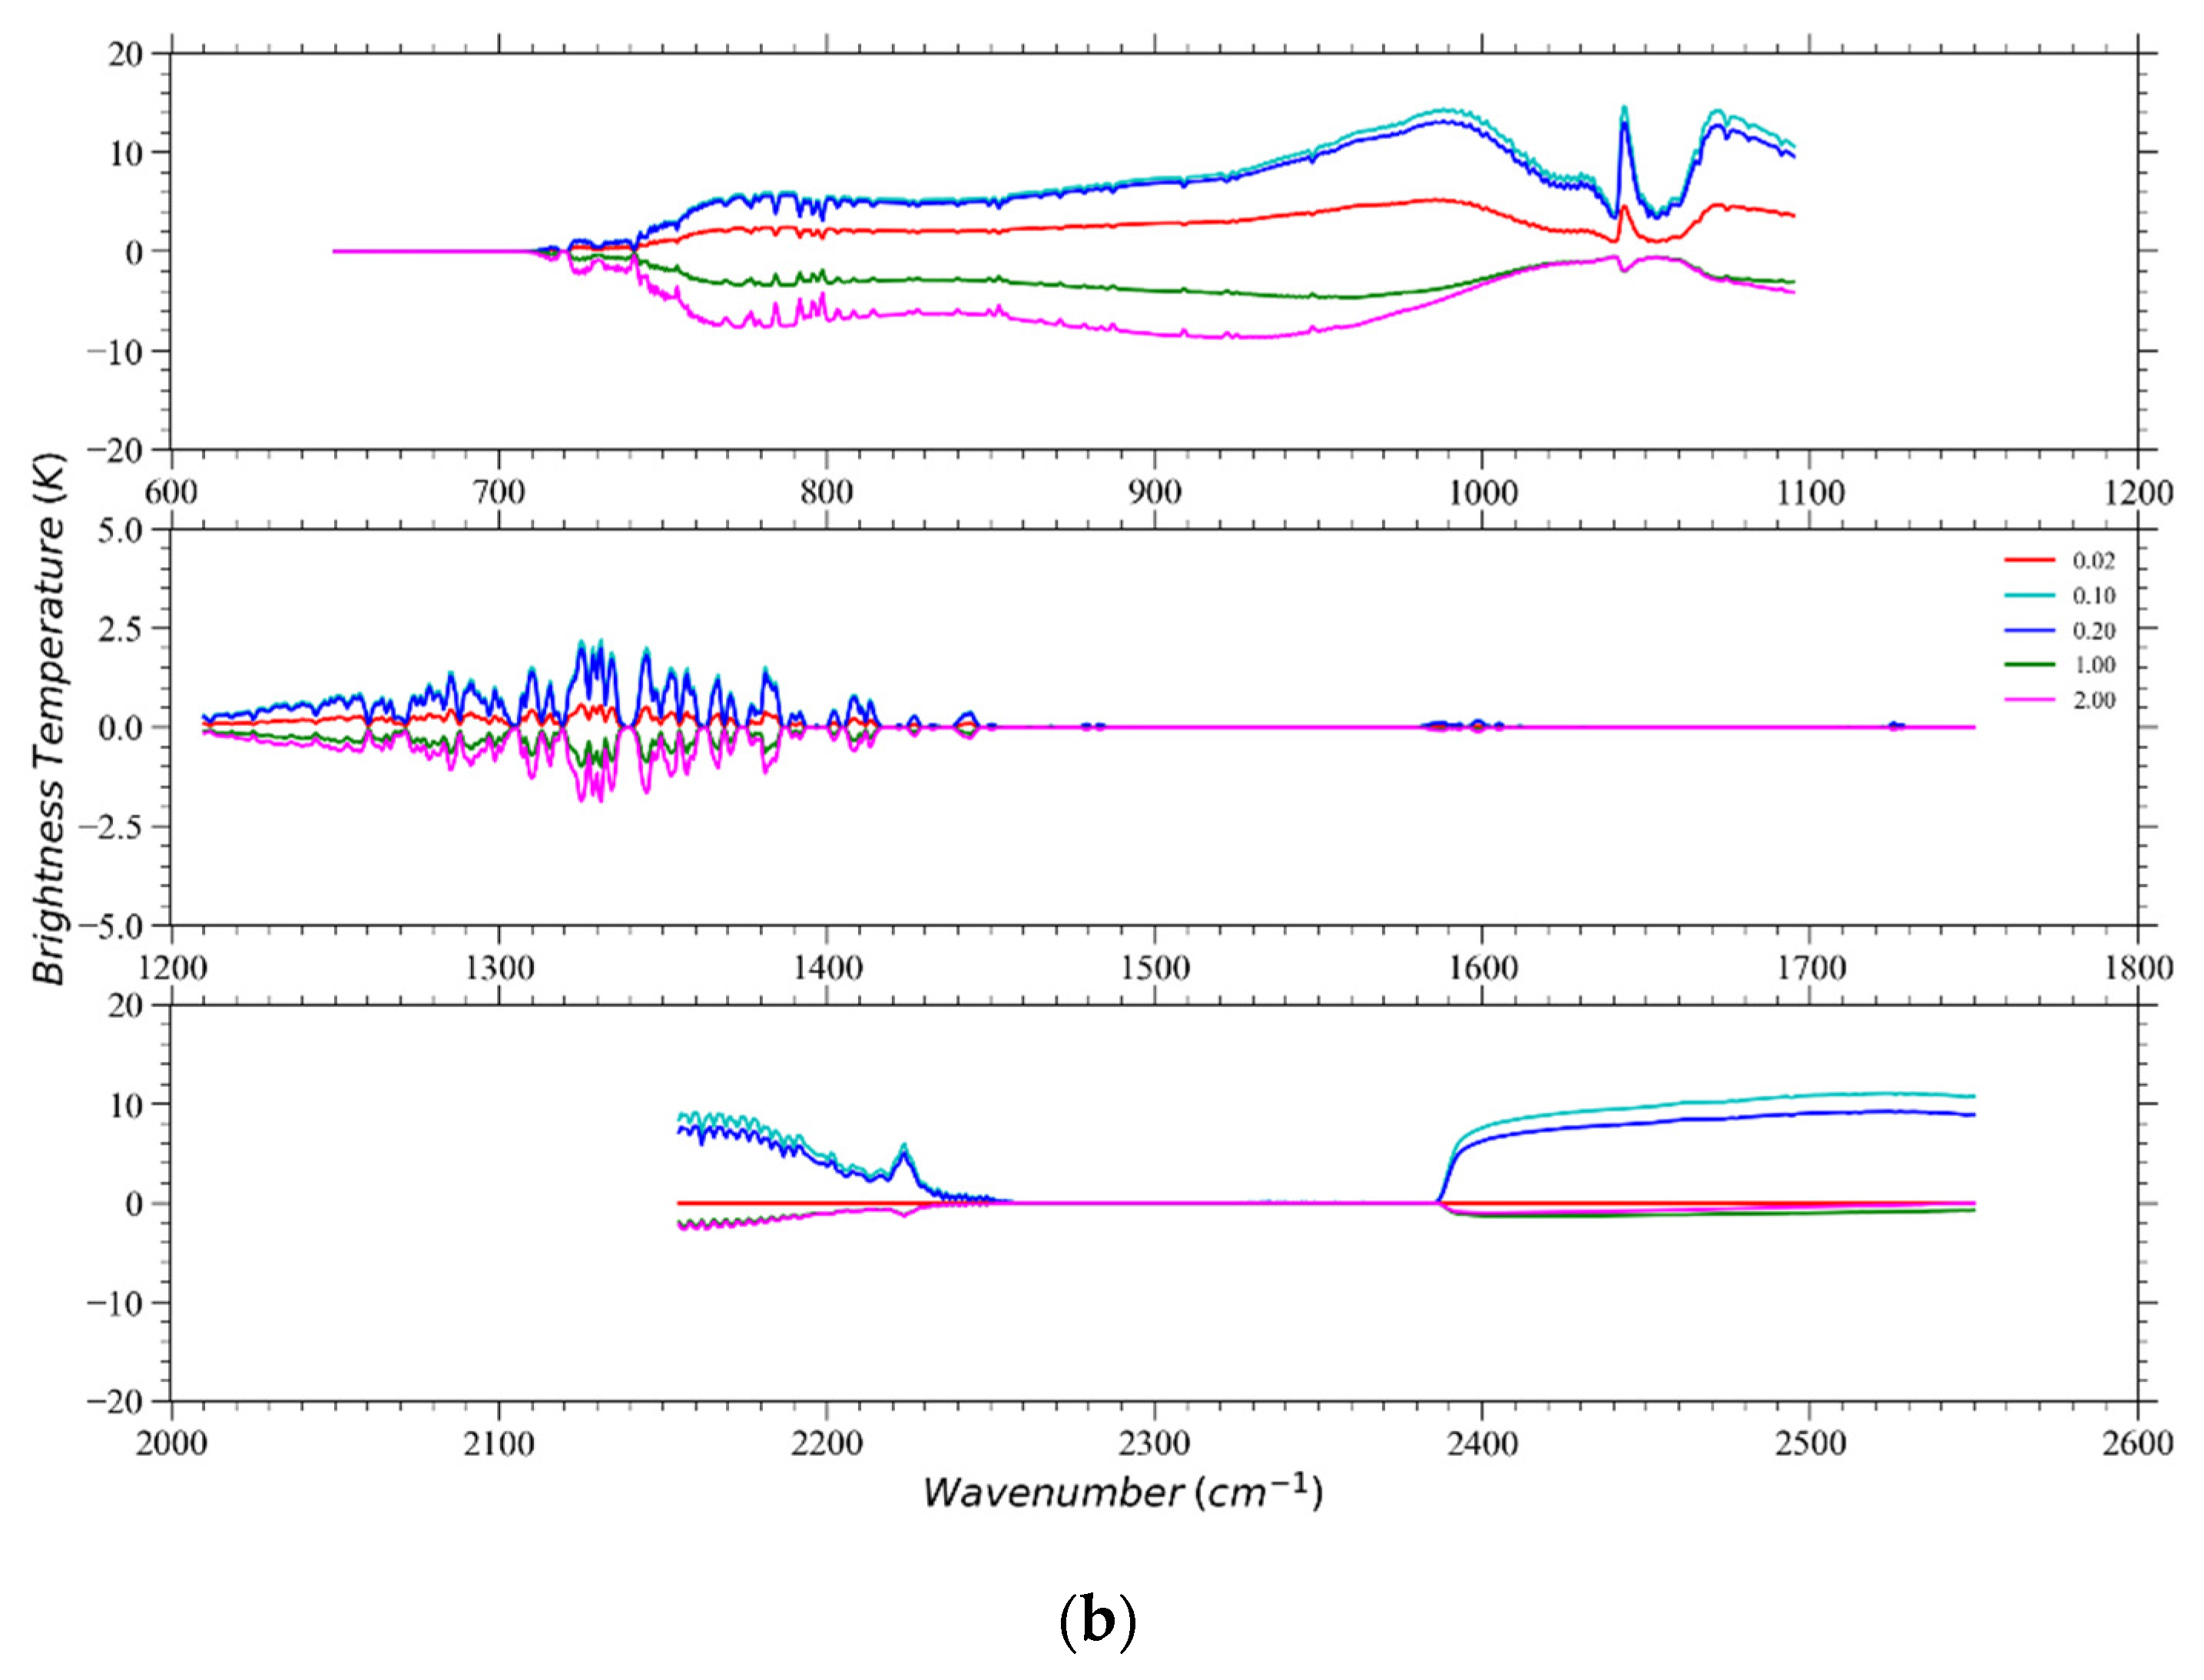
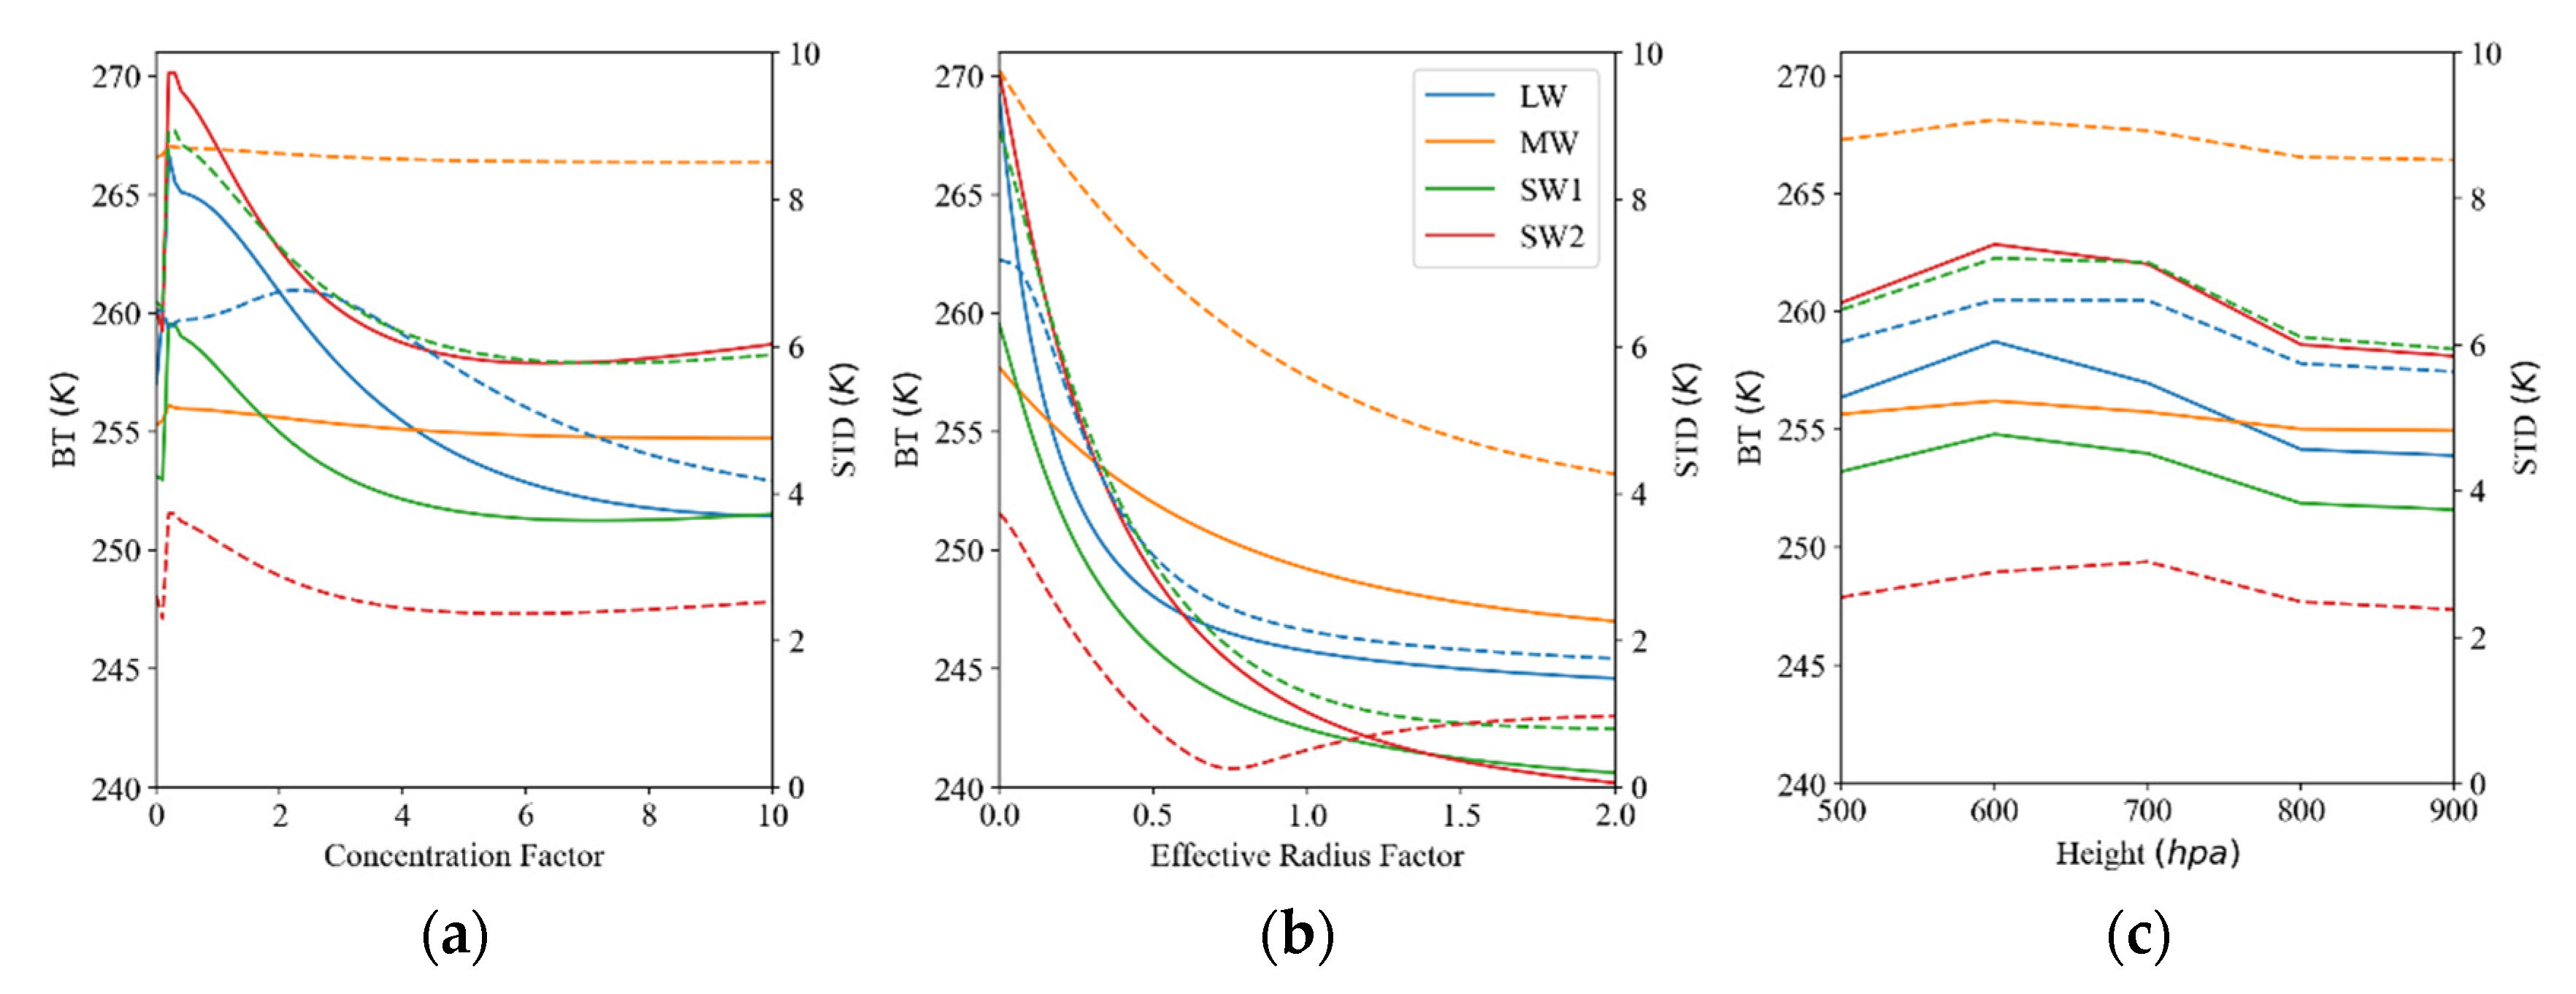
3. CrIS Sensitivity to Sand Aerosols
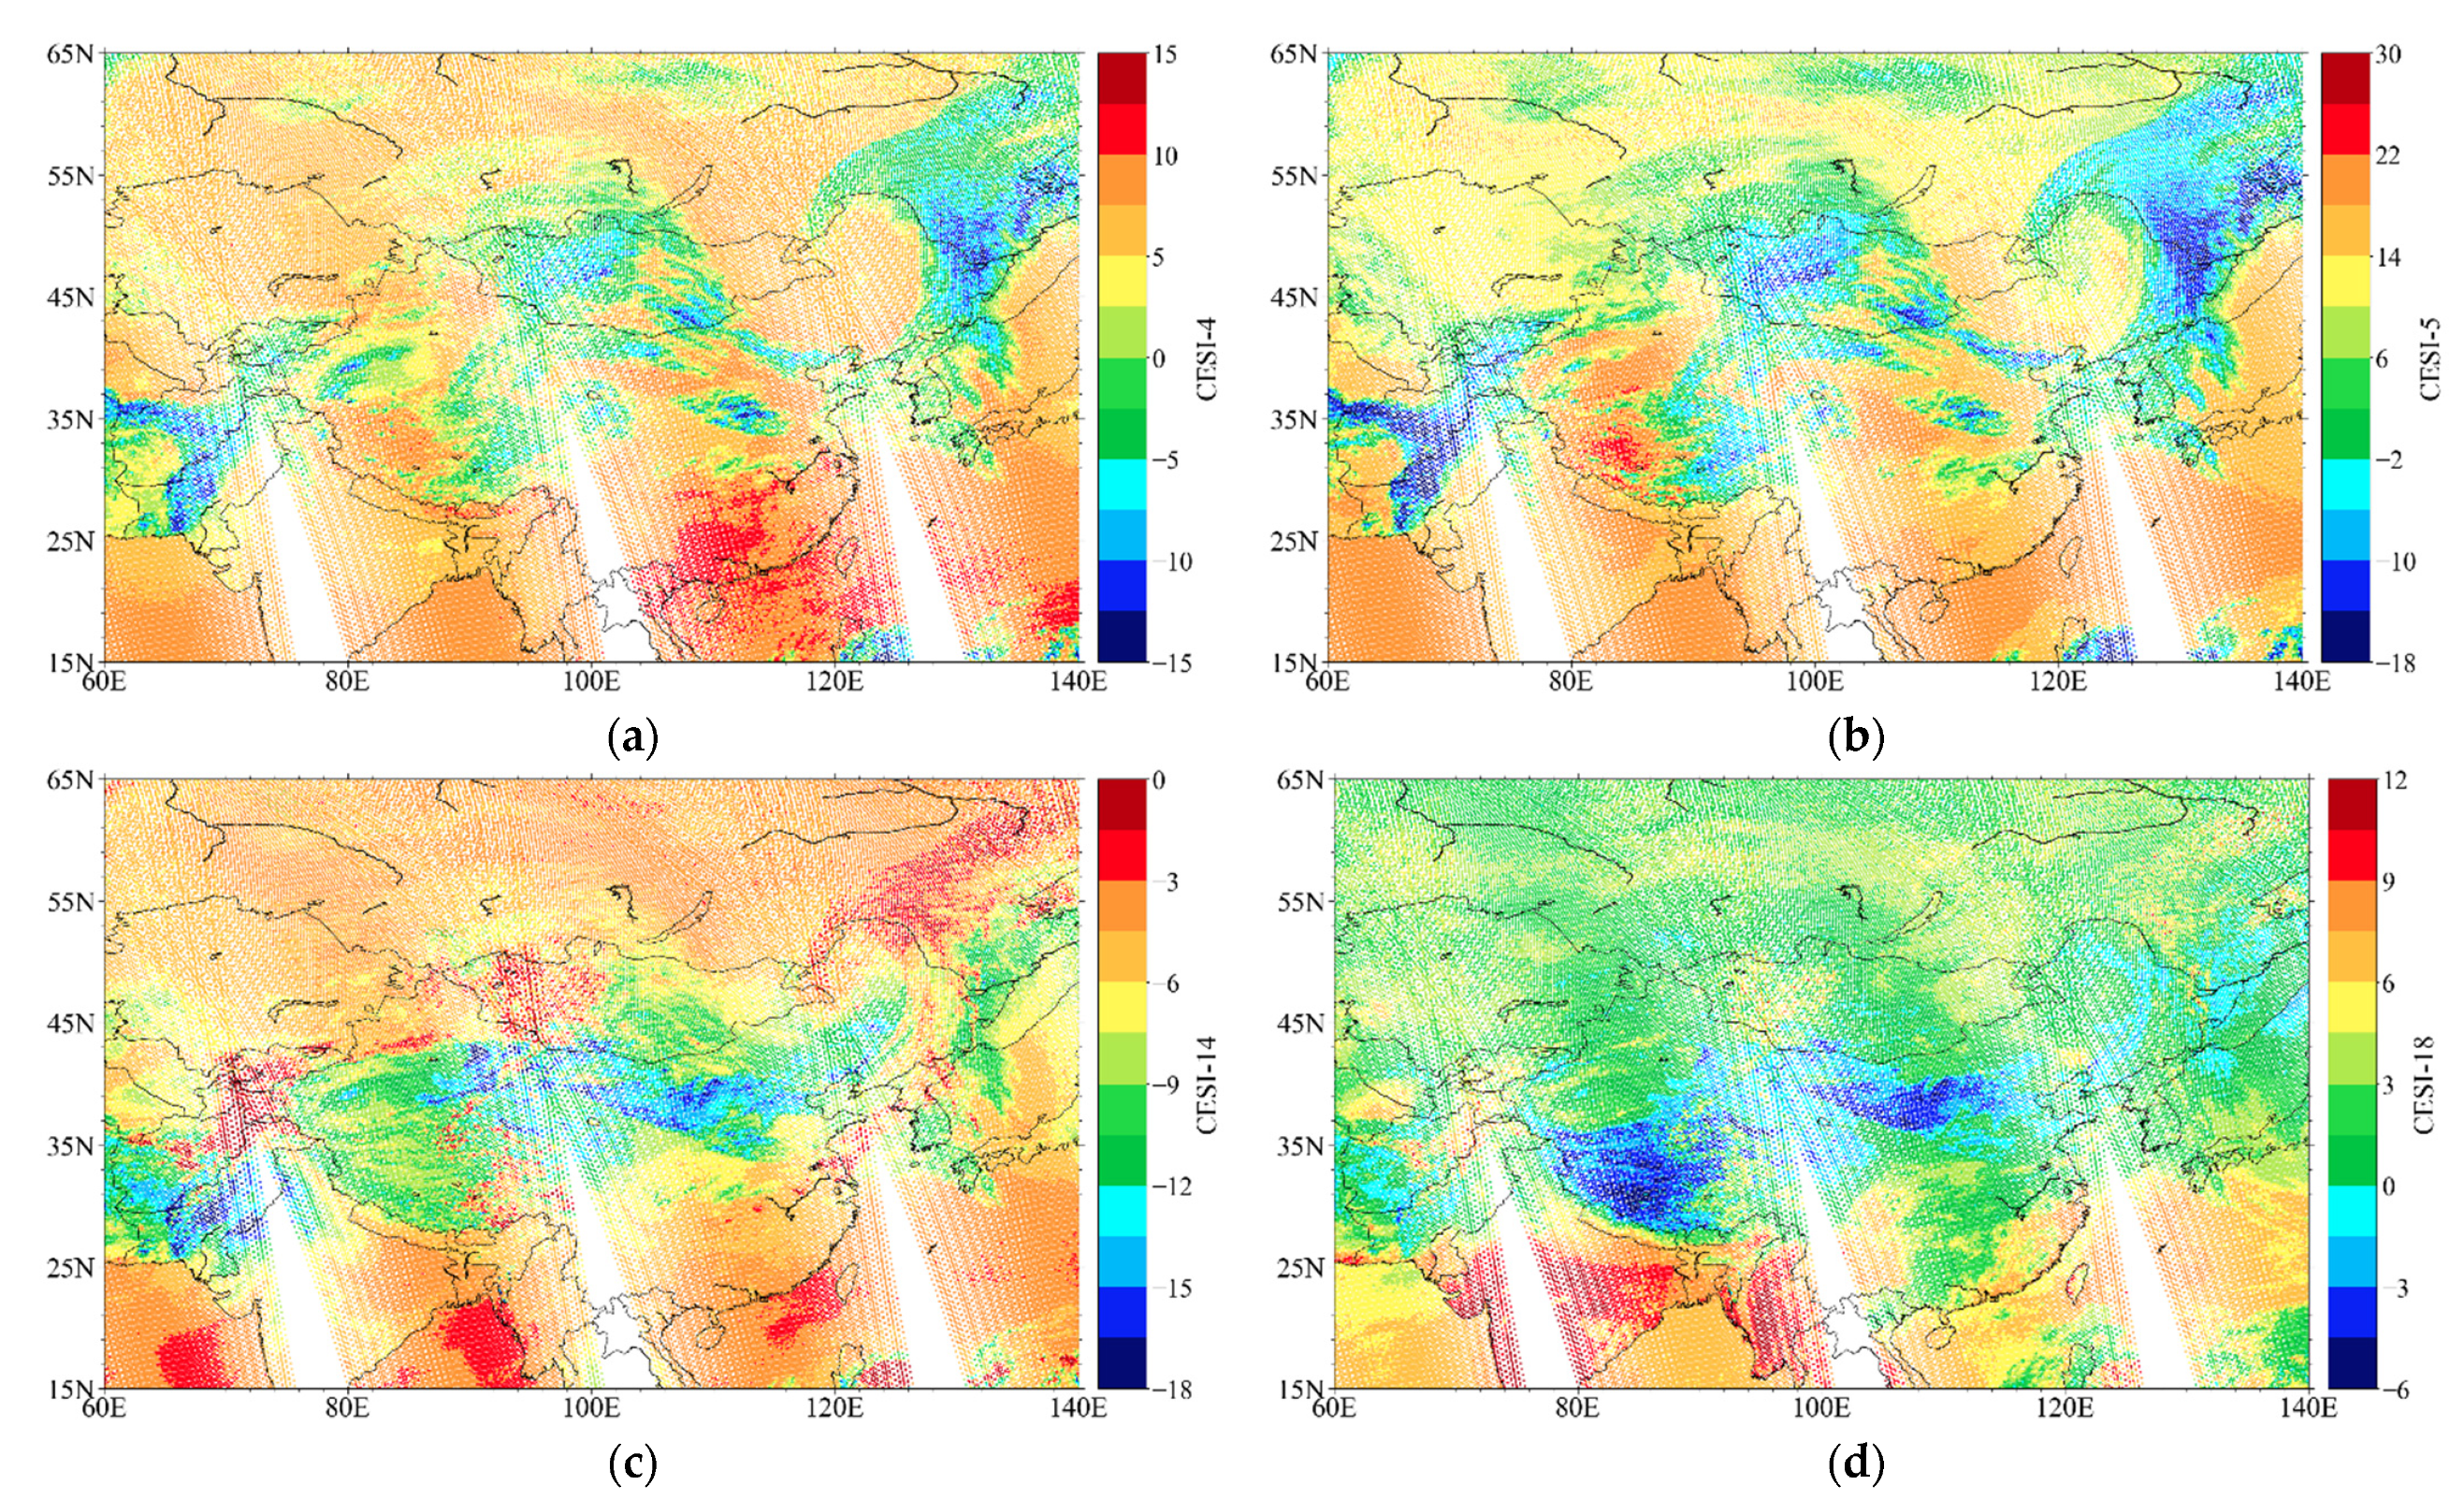
CrIS simulation was conducted using ARMS. Here, the atmosphere profiles were used with 100 layers of pressure, temperature, humidity, and ozone (Figure 1a–c). The surface temperature was 286.2 K, the surface emissivity was set to 0.98, and the satellite zenith and azimuthal angles were set to zero. To study the sensitivity of sand aerosols to the brightness temperature, the concentration and effective radius of sand aerosols from the Gobi were needed for the ARMS simulations (Figure 1d,e). The Gobi sand aerosol data were obtained from laboratory measurements of complex refractive index data for dust sampled from the Gobi Desert by Di Biago et al [30,31]. This dataset was then used to construct a suitable sand dust aerosol model in ARMS to support the application of infrared hyperspectral instrument simulations [32].
Figure 2 shows the simulated brightness temperature at the CrIS LWIR, MWIR, and SWIR bands under clear-sky and dusty conditions. The sand aerosol profile is located within the layers 69–100 from about 500 hPa to the surface with a peak sand aerosol concentration of about 0.002 kg/m3 at a pressure level of 741.69 hPa. Qualitatively, the brightness temperatures at the SWIR and LWIR bands were more sensitive to aerosols than those at the MWIR band. To be specific, the brightness temperatures with the wavenumber range of 750–1090 cm−1 in the LWIR band and 2150–2230 cm−1 and 2390–2550 cm−1 in the SWIR band were sensitive to the sand aerosol profile.
To further study the sensitivity of the CrIS brightness temperatures to the sand aerosol, three experiments were conducted by scaling the concentration and the effective radius of the sand aerosol profile and changing the heights of the sand aerosol layer (Table 2). Figure 3 shows the ARMS simulated brightness temperatures of the CrIS bands in three experiments. Experiment 1 was to scale the concentration of sand aerosol profile with the original effective radius, and similarly Experiment 2 scaled the effective radius with the constant sand aerosol concentration. Experiment 3 was designed to change the heights of the sand aerosol layer to check the sensitivity of the CrIS sounding capability to the sand aerosols.
Figure 3 shows the CrIS simulations from Experiment 1. Notice that the LWIR and SWIR bands were sensitive to the sand aerosol concentration, as seen in Figure 3a. In comparison with the brightness temperatures under clear-sky conditions (set the aerosol concentration to zero, the black curve in Figure 3a), a positive slope of the sand aerosol concentration led to the negative slope of brightness temperature, especially within the wavenumber within 750–1090 cm−1 in the LWIR band and 2150–2230 cm−1 and 2390–2550 cm−1 in the SWIR band. The difference between the brightness temperatures from the dusty and clear condition was up to about 30 K in the LWIR band when scaling the concentration of the sand aerosol profile by 10 times (see Figure 3b).
Figure 4 shows the brightness temperatures (Figure 4a) and the differences (Figure 4b) in the brightness temperatures between the dusty and clear conditions by scaling the effective radius of the sand aerosol with the original concentration of the sand aerosol profile. With an increasing scale factor in the effective radius, the difference at LWIR behaved differently compared to that at SWIR. At LWIR, the difference was positive for smaller sizes and then became negative for the aerosol with a large effective radius. At SWIR, a smaller effective radius of sand particles resulted in a more positive brightness temperature difference.
Experiment 3 was designed to study the impact of the aerosol layer height on the brightness temperature (Figure 5). The sand aerosol layer was set within 500–1000 hPa in the five simulations. The aerosol layer was about 100 hPa. At the LWIR band, the differences in the brightness temperatures were mostly positive for higher aerosol layers (600–700 hPa) and then became negative for lower aerosol layers (800–900 hPa). The slope of the differences in the brightness temperatures increased from 960 cm−1 in the LWIR band. When the sand aerosol layer was placed at a high level (e.g., within 500–600 hPa), slightly negative differences could be found at wavenumbers from 750 to 1000 cm−1 in the LWIR band while positive differences were found at the right wing of the SWIR band. Overall, the responses of the LWIR and SWIR bands to the aerosol heights were very different and offer a foundation for the hyperspectral IR sounding of sand and dust aerosols. Figure 6 shows the mean and standard deviation of the simulated brightness temperatures in the four dust-sensitive bands as a function of the aerosol concentration factor, effective radius factor, and layer height, respectively. It can be easily seen that the mean brightness temperatures in the LW, SW1, and SW2 bands decreased significantly with the increasing concentration when the concentration factor was between 0 and 4 (a concentration factor equal to 0 implies the clear sky simulation), and then became stable as the concentration increased. The mean and standard deviation of the simulation in four bands shared a relatively similar trend as the effective radius factor increased. The variation in the aerosol layer height was consistent with the results in Figure 5, where the mean brightness temperatures of the four bands reached the highest when the layer height was at 600 hPa.

4. CESI

The cloud emission and scattering index (CESI) was initially proposed by Lin et al. [21] as the difference of the brightness temperatures from paired channels between the CrIS SWIR and LWIR bands, and it has been successfully used for AIRS and HIRAS [22,23] to detect cirrus clouds. To pair the SWIR and LWIR channels for the CESI, three conditions shall be satisfied and briefly summarized as follows:
  • The difference in the peak weighting function height for the SWIR and LWIR channels shall be less than 50 hPa. In another word, it promises that the SWIR and LWIR channels are paired to detect the atmosphere profile at almost the same height.
  • Aerosol-sensitive levels shall be determined by the following equations:
    | R LW aerosol R LW clear R LW clear | 0.01 , | R SW aerosol R SW clear R SW clear | 0.1 ,
    where R c l e a r and R a e r o s o l represent the ARMS-simulated radiance for the LW or SW channels under clear and aerosol conditions, respectively.
  • Upon the above two conditions, the smallest standard deviation of the brightness temperatures or radiance from the LWIR channel should be chosen to pair the SWIR channels. It has been found that a SWIR channel could be paired with more than one LWIR channel. This condition is to make the optimal pairing with the dual CO2 channels at a specified weighting function peak pressure level.
Therefore, the CESI can be derived by
C E S I = T b , r e g S W I R T b , o b s S W I R ,
where
T b , r e g S W I R = α T b , o b s L W I R + β ,
where α and β are the regression coefficients whose values are obtained by the least-square method under clear conditions. T b , o b s S W I R and T b , o b s L W I R are the observed brightness temperatures from the CrIS SWIR and LWIR band, respectively. There are 19 pairs of dual CO2 channels finally chosen for the CESI. For details on developing the index, please refer to [21]. In terms of the scan-dependent feature of CrIS observation, the regression coefficients (α and β) for 30 FORs of each pair were derived individually to avoid the interference of the contribution from the scan bias to the CESI.
It was found that the CESI values over the storm regions with optically thin cirrus, fog, and super-cooled water clouds were positively larger than those over optically thick opaque ice and overshooting clouds or in clear-sky conditions. The LWIR and SWIR CO2 bands behaved differently due to the scattering and emission effect from optically thick clouds. With the CESI from the paired channels with the different weighting function peaks, the cloud and aerosol at different pressure layers can be detected. The use of near-surface CESI channel pair combinations can be applied to monitor SDS and can respond to a certain extent to SDS concentrations.
Figure 7 shows the spatial distribution of CESI-4 (469 hpa), CESI-5 (750 hpa), CESI-14 (near surface), and CESI-18 (near surface) on 15 March 2021. The strong Mongolian cyclonic cloud system in Northeast China and the upper-level cloud system over Afghanistan can be seen clearly in the two upper-level CESI indices (Figure 7a,b), and they both had large absolute negative values, indicating the strong scattering effect in the SWIR channel of the cloud system. The large absolute negative values in the two near-surface CESI indices showed strong scattering effects at lower levels (Figure 7c,d) with high negative values over large areas in Northern China, which corresponded to the SDS region in the true-color imagery (Figure 8b), reflecting the strong scattering properties of SDS. However, large negative areas also appeared in the Pakistan region in CESI-14, which, when combined with the true-color imagery and the upper-level CESI, was not an SDS but rather a more vigorously developing cloud, while CESI-18 also reflected large negative values in the exposed surface of the Tibetan Plateau. This indicates that both CESI-14 and -18 are not suitable for monitoring dusty weather alone, and we need to combine them for more comprehensive applications (see Section 5.3).

5. Monitoring Asian Sand Storms

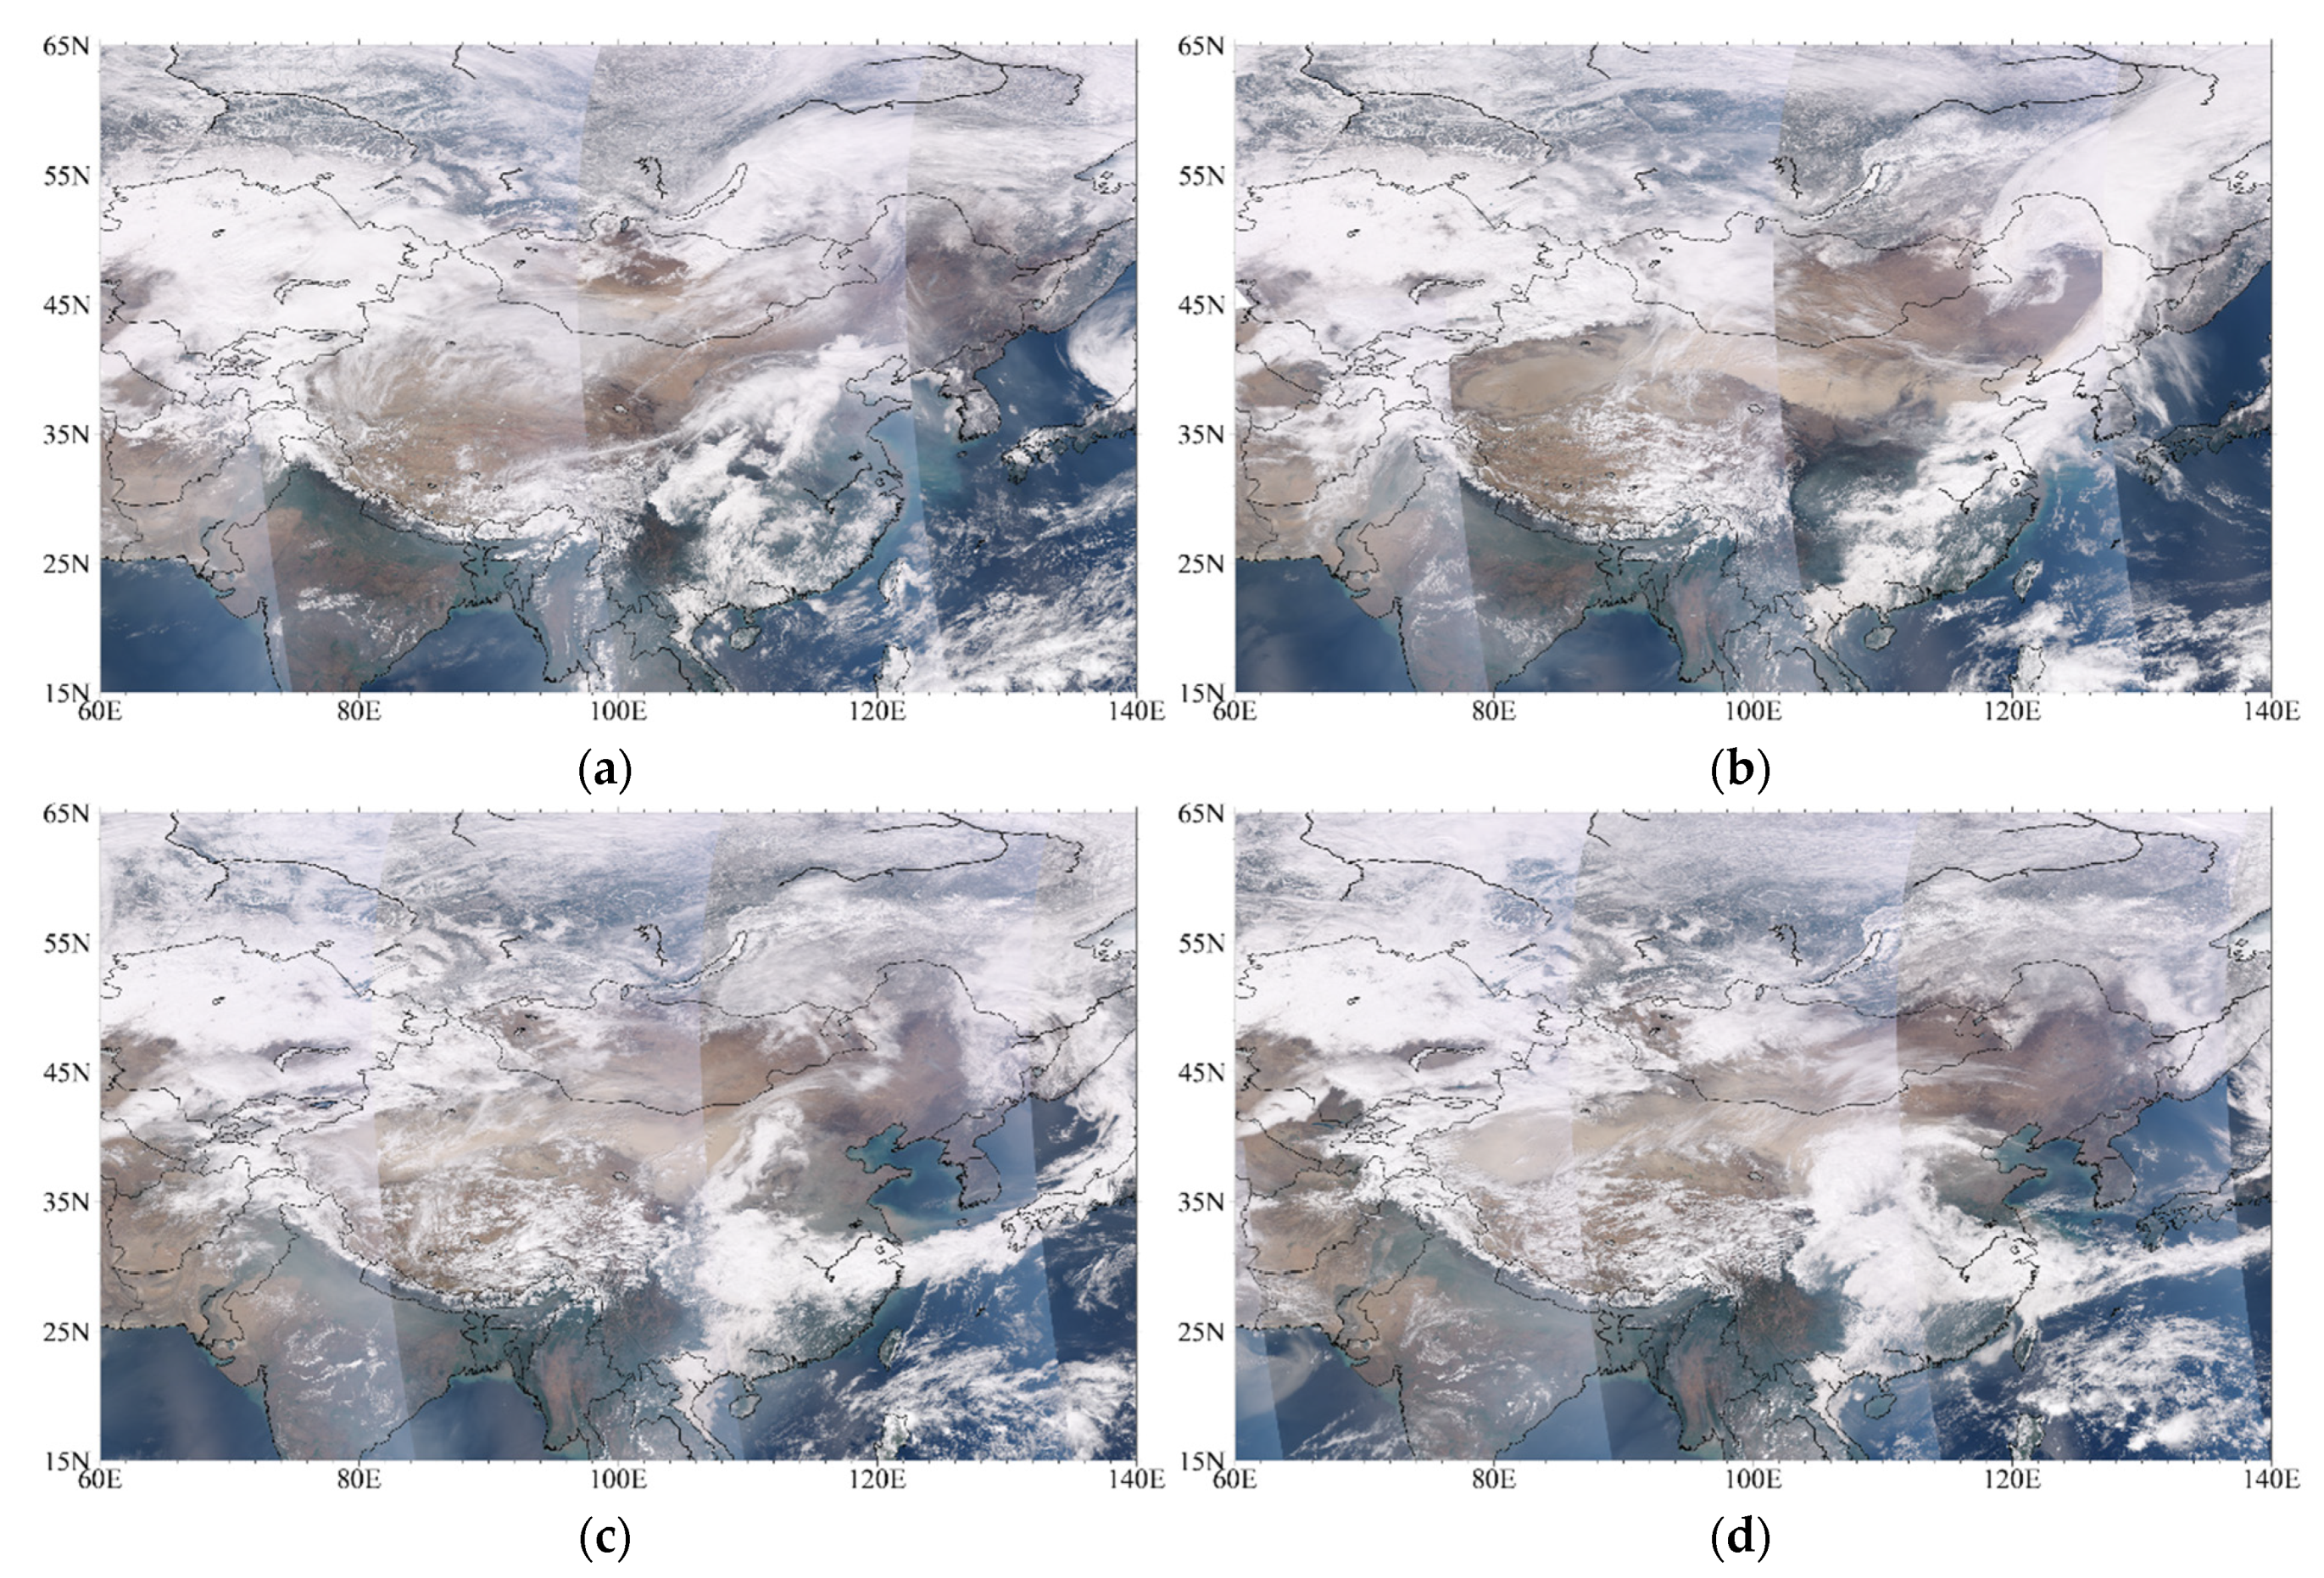
5.1. Asian Sand Storm

Dust storms commonly occur across Asia in springtime. On 14–17 March 2021, the largest and strongest SDSs in a decade struck Northern China. The dust is visible in this natural-color image (Figure 8a) from the Visible Infrared Imaging Radiometer Suite (VIIRS) on the NOAA-20 satellite. An enormous plume of sand and dust from the Taklimakan blanketed inner Mongolia and moved southward and eastward for thousands of kilometers with the strong winds of spring. Three main factors caused the SDS: (1) The high temperature in Mongolia and the western part of Inner Mongolia in China had been unusually higher by about 2–6 °C since late February this year, resulting in the melting of snow and the exposure of barren land; (2) since vegetation had not yet grown, the dry, barren area provided a sufficient “sand source” for the SDS and the airborne dust could travel especially high and far on the strong winds in spring; and (3) the Mongolian cyclone was extremely active this spring.
With enhanced Siberian high-pressure, the Asian mid-latitude meridional circulation is enhanced (resulting in the strengthened northerly wind) and leads to the development of Mongolian cyclones and rapid eastward movement. Mongolia and Northern China are affected by low-level northwest wind anomalies, and the meteorological conditions are conducive to the emergence and development of dusty weather. Mongolian cyclones and winds are the “movers” of sand and dust, responsible for completing the two important aspects of sand initiation and transport, affecting a wide range of areas in Northern China. In addition to the unusual magnitude and early season timing of the event, it is uncommon for dust storms to grow so large so fast. Satellite observations on 14 March showed no signs of dust transport; one day later, the event developed into a widespread, severe storm, then the dust storm gradually weakened throughout the rest of the week.

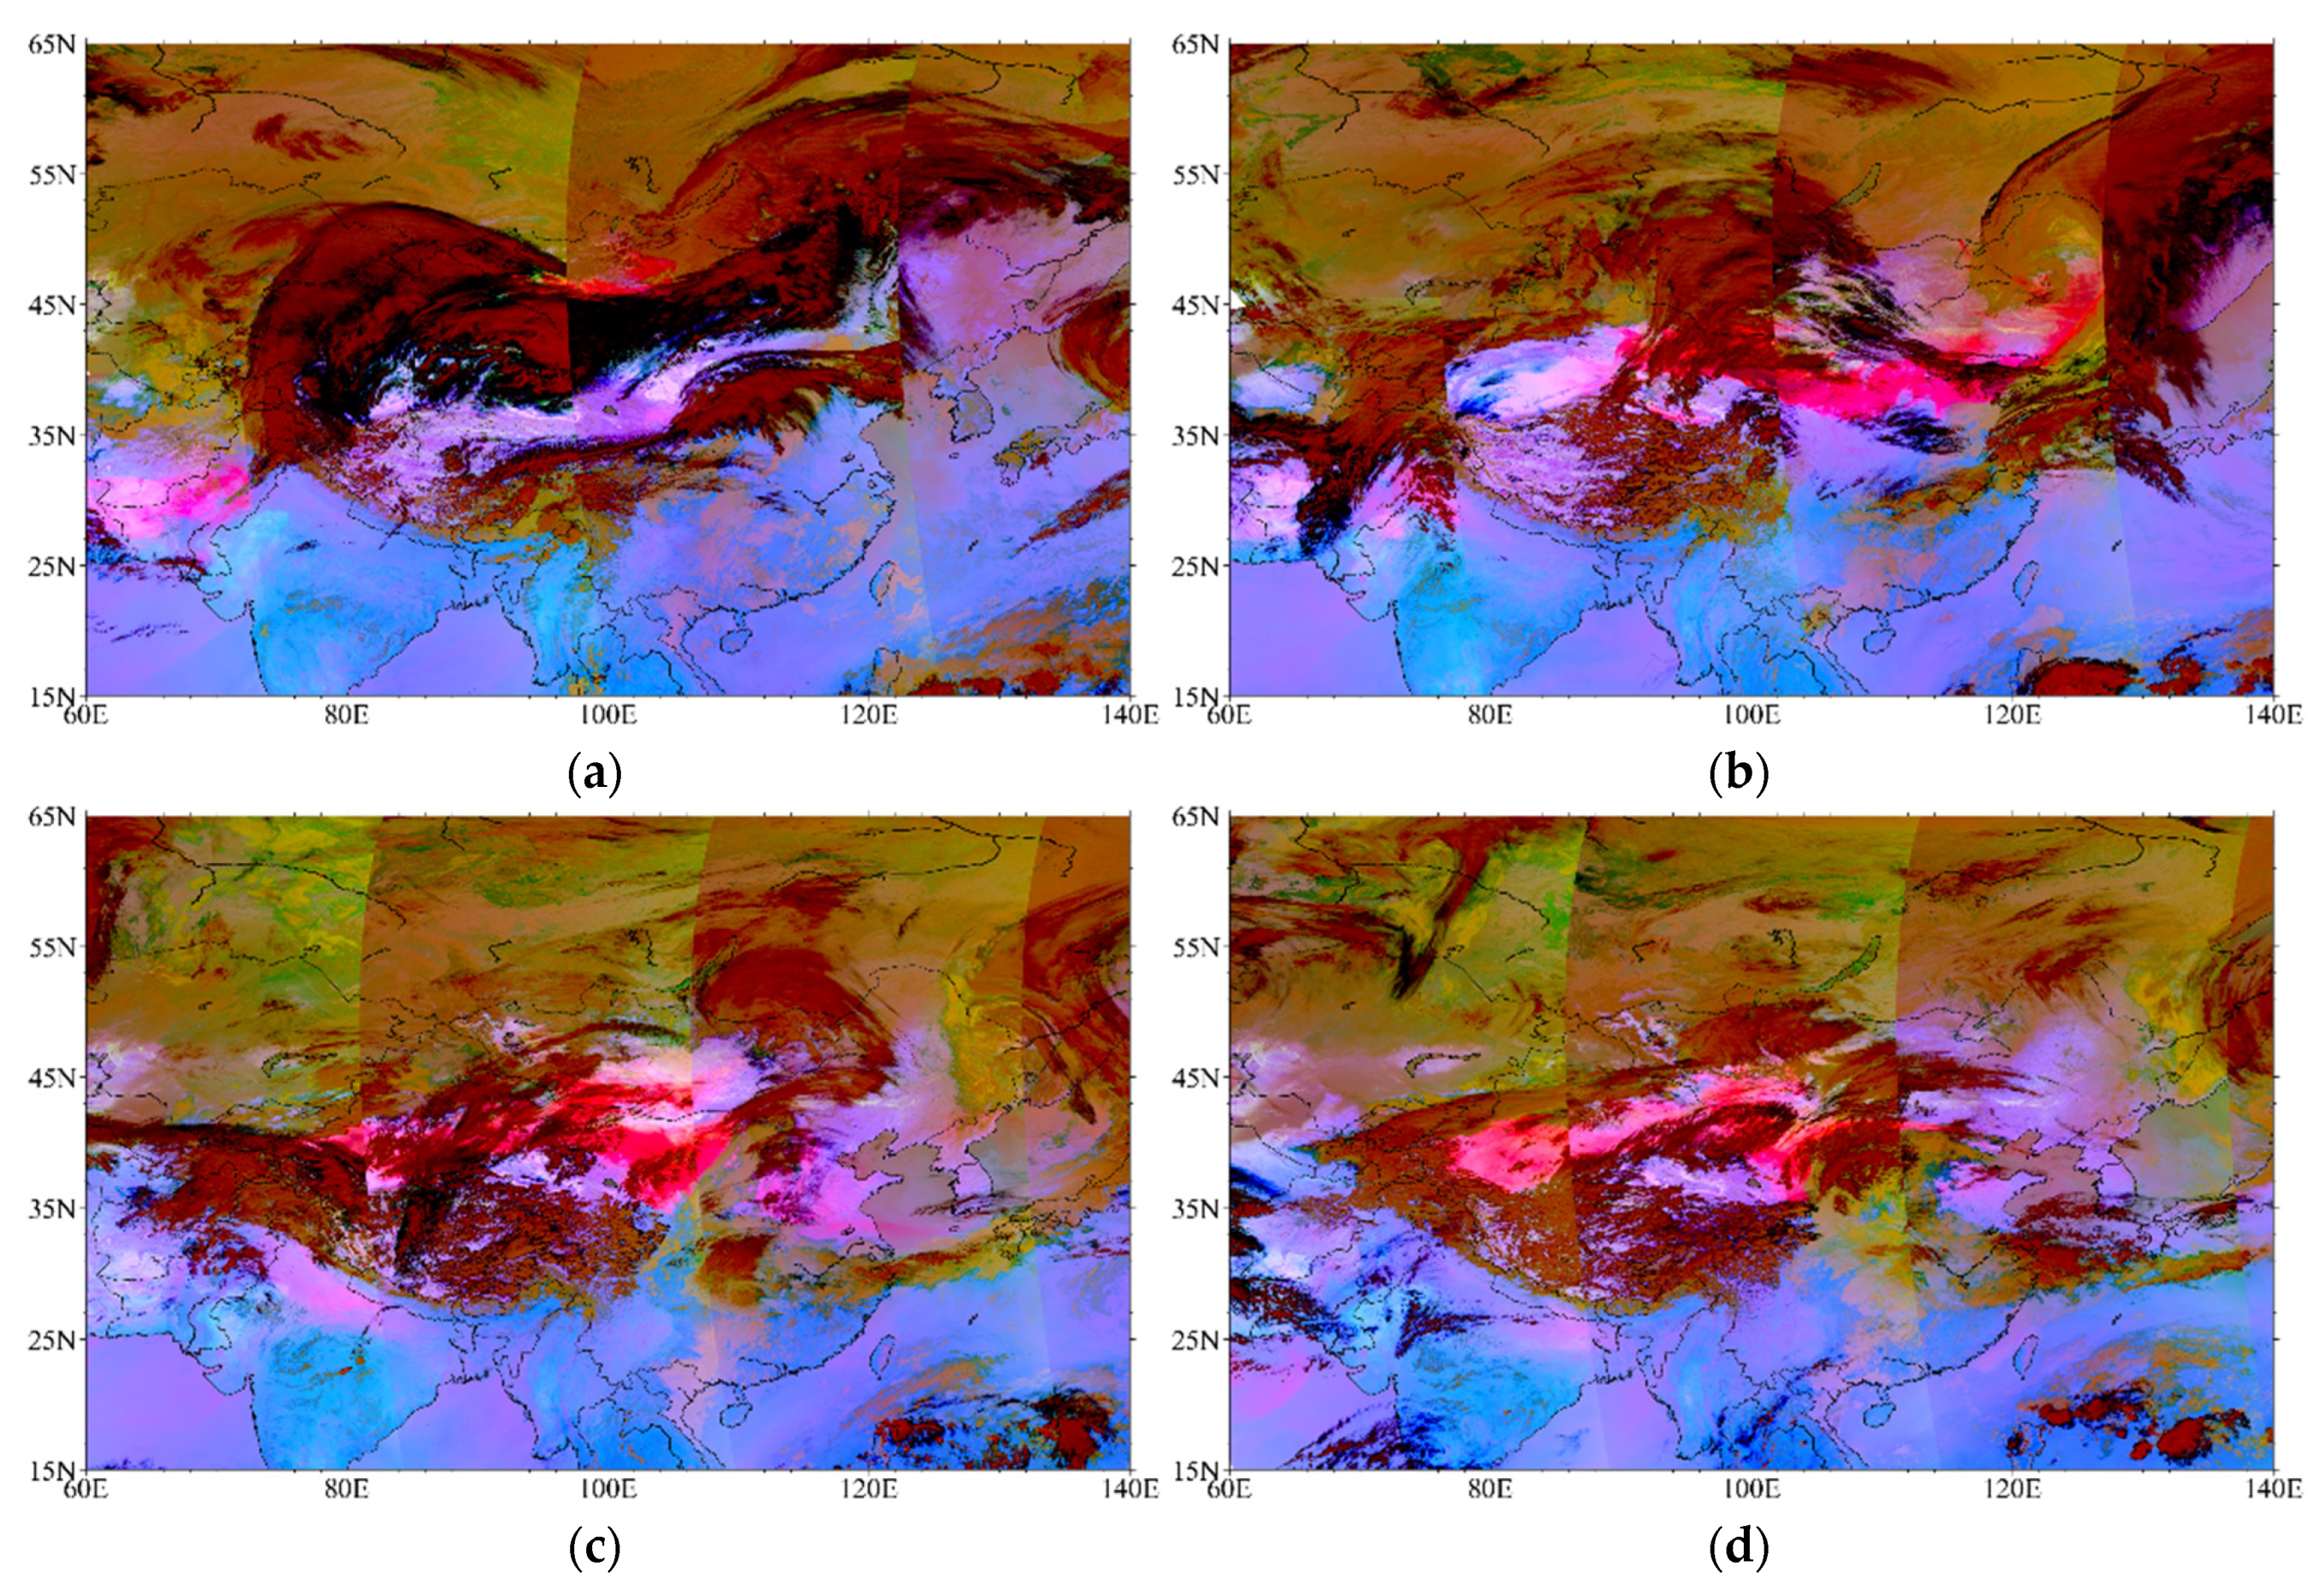
5.2. VIIRS Dust RGB Product

The dust RGB product is currently the common approach to interpreting sand and dust areas. The product uses three infrared channels with wavelengths of 8.5 μm, 10.8 μm, and 12 μm. The method of combining the three channels to detect sand and dust was first proposed by Ackerman [17]. To generate false-color RGB images of sand and dust, the R, G, and B channels of the imagery were BT12.0-BT10.8, BT10.8-BT8.5, and BT10.8, respectively, and to enhance the sand and dust features in the images, the three RGB channels were set with thresholds and coefficients for GAMMA correction (Table 3). The color intensity of the R, G, and B shading was based upon the following equation, and more details can be found in [33,34]:
( R , G , B ) = 255 [ ( ( T B o r Δ T B ) M I N ) / ( M A X M I N ) ] ( 1 / γ R , G , B ) ,
The pink or magenta color in Figure 9 is considered to be the sandy area. It can be seen that the pink areas on the dust false-color imagery were in good agreement with the dust areas in the true-color imagery in the south-central part of Mongolia and Afghanistan and Pakistan on 14 March (Figure 9a). On 15 March (Figure 9b), the dust continued to spread to most of Northern China with the strong Mongolian cyclone. On 16 March (Figure 9c), dust could be seen to persist in the northern part of China and spread to the south. In Northwest China, the sand and dust could not be determined from the true-color composite imagery, which was influenced by cirrus clouds, while it could be seen that the sand and dust in the Taklimakan Desert region were carried eastward by strong spring winds in the dust RGB imagery.

5.3. SESI Monitoring SDS

Due to the extinction characteristics of sand and dust on infrared radiation and the ideal experiment above-mentioned, its attenuation effect on the LWIR channel was greater than that of the SWIR channel. Under sand and dust conditions, the SWIR bright temperature obtained from the regression simulation using the LWIR channel was much smaller than the bright temperature obtained from the actual corresponding SWIR observations, and based on this characteristic, the large negative value in the CESI can be used to show some scattering properties of the sand and dust.
By analyzing several indices with the intensity of aerosol scattering from the near-surface layer, none of them were suitable to monitor dusty weather alone. Therefore, the SESI (SESI = CESI-14 + CESI-18) was defined to combine the advantages of the two near-surface indices to monitor the changes of dust together. Comparing the SESI with the false-color imagery above, it can be seen that a relatively high agreement between the spatial distribution of the dark-blue area of the SESI and the pink area (dust) in the dust RGB composite imagery (Figure 10), and it also corresponded well with the dust storm area in the true-color imagery (Figure 8).
By overlapping the false-color imagery with the sand dust masks (the grey area) and the SESI simultaneously (Figure 11) and from the sand and dust masks identified by the SESI method in the false-color scheme, it can be seen that the detected sand and dust of the two methods were consistent from 15 March to 17 March (Figure 11b–d), and the consistency could reach 70.5%, 67.2%, and 69.9%, respectively, during 14–17 March 2021 (Table 4). Combined with the true-color imagery (Figure 8), the SESI on 14 March could identify the Taklimakan region and the border between Inner Mongolia and Mongolia as sandy and dusty. Overall, the SESI can be used to detect dusty weather processes, and it can well-distinguish the desert from dust storm weather compared to the traditional method.

6. Conclusions

Infrared hyperspectral observations are usually used in data assimilation in the NWP model or atmospheric profile and surface parameter retrieval. In this study, a new method was put forward with infrared hyperspectral observations to detect the SDSs. To prove the physical mechanism, an idealized sensitivity experiment was conducted using the U.S. standard atmospheric profile and additional aerosol profiles with the ARMS. By scaling the concentration and effective radius of the aerosol profile and shifting the height of the aerosol profile, a negative slope of brightness temperature was found, especially within the wavenumber within 750–1090 cm−1 in the LW band and 2150–2230 cm−1 and 2390–2550 cm−1 in the SWIR band.
Due to the different scattering effects of sand and dust within the CO2 absorbing band at LWIR and SWIR, multiple CESI indices were constructed to detect sand and dust aerosols at different heights. The SESI was defined by the summation of CESI-14 and CESI-18 to monitor dust storms because of the strong scattering effect of sand and dust on the short-wave band. The SESI showed very negative values in the dust storm area, typically less than −18 K. The SDS areas identified by the SESI had a high spatial agreement with the sand and dust areas in the true-color imagery and the pink and magenta areas in the WMO dust false-color imagery. It can also distinguish the cirrus clouds and dust storms that are not easily distinguished in the true-color imagery due to the contrast or other reasons. Similar to the false-color imagery, the SESI can also distinguish the bare desert surface from the SDS when comparing the traditional SDS detection algorithms.
In subsequent work, the SESI will be collocated with the in situ observed sand and dust concentration data and the CALIPSO dust products or MERRA reanalysis data to quantitively assess its accuracy. Furthermore, the SESI will be utilized to analyze the vertical distribution of the SDSs and resolve the spread height of the SDSs to provide more significant information on SDS monitoring and forecasting.

Author Contributions

Conceptualization, F.W.; Methodology, Y.H. and C.F.; Validation, C.F.; Writing—original draft preparation, Y.H. and C.F.; Writing—review and editing, F.W. All authors have read and agreed to the published version of the manuscript.

Funding

This research was funded by the National Key Research and Development Program of China (2021YFB3900400) and the National Natural Science Foundation of China (U2142212).

Data Availability Statement

The CrIS data can be downloaded from NOAA class archives.

Acknowledgments

We thank the reviewers and editors for their insightful comments.

Conflicts of Interest

The authors declare no conflict of interest.

References

  1. Tsolmon, R.; Ochirkhuyag, L.; Sternberg, T. Monitoring the source of trans-national dust storms in north East Asia. Int. J. Digit. Earth 2008, 1, 119–129. [Google Scholar] [CrossRef]
  2. Jin, Q.; Wei, J.; Lau, W.K.M.; Pu, B.; Wang, C. Interactions of Asian mineral dust with Indian summer monsoon: Recent advances and challenges. Earth-Sci. Rev. 2021, 215, 103562. [Google Scholar] [CrossRef]
  3. Asiri, M.A.; Almazroui, M.; Awad, A.M. Synoptic features associated with the winter variability of the subtropical jet stream over Africa and the Middle East. Arch. Meteorol. Geophys. Bioclimatol. Ser. B 2020, 132, 819–831. [Google Scholar] [CrossRef]
  4. Wei, J.; Lu, B.; Song, Y.; Jin, Q.; Yang, Y.; Chen, Q.; Chen, H. Impact of Aerosol Radiative Effect on the Diurnal Cycle of Summer Precipitation Over North China: Distinct Results From Simulations With Parameterized Versus Explicit Convection. Geophys. Res. Lett. 2022, 49, e2022GL098795. [Google Scholar] [CrossRef]
  5. Mashat, A.-W.S.; Awad, A.M.; Assiri, M.E.; Labban, A.H. Dynamic and synoptic study of spring dust storms over northern Saudi Arabia. Arch. Meteorol. Geophys. Bioclimatol. Ser. B 2020, 140, 619–634. [Google Scholar] [CrossRef]
  6. Mashat, A.-W.S.; Awad, A.M.; Assiri, M.E.; Labban, A.H. Synoptic pattern of the Red Sea trough associated with spring dust over the northern and western Arabian Peninsula. Arch. Meteorol. Geophys. Bioclimatol. Ser. B 2021, 133, 655–673. [Google Scholar] [CrossRef]
  7. Francis, D.; Chaboureau, J.-P.; Nelli, N.; Cuesta, J.; Alshamsi, N.; Temimi, M.; Pauluis, O.; Xue, L. Summertime dust storms over the Arabian Peninsula and impacts on radiation, circulation, cloud development and rain. Atmos. Res. 2021, 250, 105364. [Google Scholar] [CrossRef]
  8. Liu, H.; Yan, R.; Yang, J. Credibility and statistical characteristics of CAMSRA and MERRA-2 AOD reanalysis products over the Sichuan Basin during 2003–2018. Atmos. Environ. 2021, 244, 117980. [Google Scholar] [CrossRef]
  9. Hu, Z.; Jin, Q.; Ma, Y.; Pu, B.; Ji, Z.; Wang, Y.; Dong, W. Temporal evolution of aerosols and their extreme events in polluted Asian regions during Terra’s 20-year observations. Remote Sens. Environ. 2021, 263, 112541. [Google Scholar] [CrossRef]
  10. Shaheen, A.; Wu, R.; Lelieveld, J.; Yousefi, R.; Aldabash, M. Winter AOD trend changes over the Eastern Mediterranean and Middle East region. Int. J. Clim. 2021, 41, 5516–5535. [Google Scholar] [CrossRef]
  11. Jin, Q.; Pryor, S.C. Long-Term Trends of High Aerosol Pollution Events and Their Climatic Impacts in North America Using Multiple Satellite Retrievals and Modern-Era Retrospective Analysis for Research and Applications version 2. J. Geophys. Res. Atmos. 2020, 125, e2019JD031137. [Google Scholar] [CrossRef]
  12. Shao, Y.; Dong, C.H. A review on East Asian dust storm climate, modelling and monitoring. Glob. Planet. Change 2006, 52, 1–22. [Google Scholar] [CrossRef]
  13. Muhammad, A.; Sheltami, T.R.; Mouftah, H.T. A review of techniques and technologies for sand and dust storm detection. Rev. Environ. Sci. Bio/Technol. 2012, 11, 305–322. [Google Scholar] [CrossRef]
  14. Lv, R.L.; Deng, X.B.; Ding, J.L.; Liu, H.L.; Huang, Q.H. Hyperspectral Satellite Remote Sensing Dust Aerosol Depth: A New Retrieval Method Based on SVD. Appl. Mech. Mater. 2014, 644–650, 2071–2075. [Google Scholar] [CrossRef]
  15. Mohammadpour, K.; Rashki, A.; Sciortino, M.; Kaskaoutis, D.G.; Darvishi Boloorani, A. A statistical approach for identification of dust-AOD hotspots climatology and clustering of dust regimes over Southwest Asia and the Arabian Sea. Atmos. Pollut. Res. 2022, 13, 101395. [Google Scholar] [CrossRef]
  16. Mohammadpour, K.; Sciortino, M.; Kaskaoutis, D.G.; Rashki, A. Classification of synoptic weather clusters associated with dust accumulation over southeastern areas of the Caspian Sea (Northeast Iran and Karakum desert). Aeolian Res. 2022, 54, 100771. [Google Scholar] [CrossRef]
  17. Ackerman, S.A. Remote sensing aerosols using satellite infrared observations. J. Geophys. Res. Earth Surf. 1997, 102, 17069–17079. [Google Scholar] [CrossRef]
  18. Huang, J.; Minnis, P.; Yi, Y.; Tang, Q.; Wang, X.; Hu, Y.; Liu, Z.; Ayers, K.; Trepte, C.; Winker, D. Summer dust aerosols detected from CALIPSO over the Tibetan Plateau. Geophys. Res. Lett. 2007, 34, L18805. [Google Scholar] [CrossRef]
  19. Ge, J.; Huang, J.; Weng, F.; Sun, W. Effects of dust storms on microwave radiation based on satellite observation and model simulation over the Taklamakan desert. Atmos. Chem. Phys. 2008, 8, 4903–4909. [Google Scholar] [CrossRef]
  20. Han, Y.; Zou, X.; Weng, F. Cloud and precipitation features of Super Typhoon Neoguri revealed from dual oxygen absorption band sounding instruments on board FengYun-3C satellite. Geophys. Res. Lett. 2015, 42, 916–924. [Google Scholar] [CrossRef]
  21. Lin, L.; Zou, X.; Weng, F. Combining CrIS double CO2 bands for detecting clouds located in different layers of the atmosphere. J. Geophys. Res. Atmos. 2017, 122, 1811–1827. [Google Scholar] [CrossRef]
  22. Wang, L.; Zheng, Y.; Liu, C.; Niu, Z.; Xu, J.; Chen, W.; Jiang, R. Combination of AIRS Dual CO2 Absorption Bands to Develop an Ice Clouds Detection Algorithm in Different Atmospheric Layers. Remote Sens. 2020, 12, 6. [Google Scholar] [CrossRef]
  23. Xia, X.; Zou, X. Development of CO2 Band-Based Cloud Emission and Scattering Indices and Their Applications to FY-3D Hyperspectral Infrared Atmospheric Sounder. Remote Sens. 2020, 12, 4171. [Google Scholar] [CrossRef]
  24. Weng, F.; Yu, X.; Duan, Y.; Yang, J.; Wang, J. Advanced Radiative Transfer Modeling System (ARMS): A New-Generation Satellite Observation Operator Developed for Numerical Weather Prediction and Remote Sensing Applications. Adv. Atmos. Sci. 2020, 37, 131–136. [Google Scholar] [CrossRef]
  25. Weng, F.; Liu, Q. Satellite data assimilation in numerical weather prediction models, 1. Forward radiative transfer and Jacobian models under cloudy conditions. J. Atmos. Sci. 2003, 60, 2633–2646. [Google Scholar] [CrossRef]
  26. Liu, Q.; Weng, F. A microwave polarimetric two-stream radiative transfer model. J. Atmos. Sci. 2002, 59, 2396–2402. [Google Scholar] [CrossRef]
  27. Evans, K.F.; Stephens, G.L. A new polarized atmospheric radiative transfer model. J. Quant. Spectrosc. Radiat. Transf. 1991, 46, 413–423. [Google Scholar] [CrossRef]
  28. Weng, F. A multi-layer discrete-ordinate method for vector radiative transfer in a vertically-inhomogeneous, emitting and scattering atmosphere—I. Theory. J. Quant. Spectrosc. Radiat. Transf. 1992, 47, 19–33. [Google Scholar] [CrossRef]
  29. Shi, Y.-N.; Yang, J.; Weng, F. Discrete Ordinate Adding Method (DOAM), a new solver for Advanced Radiative transfer Modeling System (ARMS). Opt. Express 2021, 29, 4700–4720. [Google Scholar] [CrossRef]
  30. Di Biagio, C.; Formenti, P.; Styler, S.A.; Pangui, E.; Doussin, J.F. Laboratory chamber measurements of the longwave extinction spectra and complex refractive indices of African and Asian mineral dusts. Geophys. Res. Lett. 2015, 41, 6289–6297. [Google Scholar] [CrossRef]
  31. Di Biagio, C.; Formenti, P.; Balkanski, Y.; Caponi, L.; Cazaunau, M.; Pangui, E.; Journet, E.; Nowak, S.; Caquineau, S.; Andreae, M.O.; et al. Global scale variability of the mineral dust longwave refractive index: A new dataset of in situ measurements for climate modelling and remote sensing. Atmos. Chem. Phys. 2017, 17, 1901–1929. [Google Scholar] [CrossRef]
  32. Bi, L.; Ding, S.; Zong, R.; Yi, B. Examining Asian dust refractive indices for brightness temperature simulations in the 650-1135 cm−1 spectral range. J. Quant. Spectrosc. Radiat. Transf. 2020, 247, 106945. [Google Scholar] [CrossRef]
  33. Fuell, K.K.; Guyer, B.J.; Kann, D.; Molthan, A.L.; Elmer, N. Next generation satellite RGB dust imagery leads to operational changes at NWS Alburquerque. J. Oper. Meteorol. 2016, 4, 75–91. [Google Scholar] [CrossRef]
  34. Zhang, H.; Ciren, P.; Kondragunta, S.; Laszlo, I. Evaluation of VIIRS dust detection algorithms over land. J. Appl. Remote Sens. 2018, 12, 042609. [Google Scholar] [CrossRef]
Figure 1. The vertical distributions of the atmospheric profiles: (a) temperature, (b) specific humidity, (c) ozone, (d) aerosol concentration, (e) aerosol effective radius.
Remotesensing 14 04659 g001aRemotesensing 14 04659 g001b
Figure 2. The simulated brightness temperatures of the CrIS LWIR (upper panel), MWIR (middle panel), and SWIR (bottom panel) band under the clear-sky (blue curve) and dusty (red curve) condition (with sand aerosol profile).
Remotesensing 14 04659 g002
Figure 3. Simulated brightness temperatures (a) of the CrIS LWIR (upper panels), MWIR (middle panels), and SWIR (bottom panels) bands and the difference (b) between the clear condition and scaling of the concentration of the sand aerosol profile.
Remotesensing 14 04659 g003aRemotesensing 14 04659 g003b
Figure 4. The same as Figure 3 except for scaling of the effective radius (shown in Figure 1e) of the sand aerosol profile. (a) Simulated brightness temperatures. (b) difference between the clear condition and scaling of the effective radius.
Remotesensing 14 04659 g004aRemotesensing 14 04659 g004b
Figure 5. The same as Figure 3 except for a change in the vertical location of the sand aerosol profile. (a) Simulated brightness temperatures. (b) difference between the clear condition and different heights of the sand aerosol layers.
Remotesensing 14 04659 g005
Figure 6. Variation in the mean (solid line) and standard deviation (dashed line) of the simulated brightness temperatures with an aerosol concentration scaling factor (a), effective radius scaling factor (b), and layer height (c) for the four dust-sensitive bands, respectively (LW: 750~1090 cm−1; MW: 1210~1350 cm−1; SW1: 2155~2230 cm−1; SW2: 2390~2550 cm−1).
Remotesensing 14 04659 g006
Figure 7. The CESI indices for 15 March 2021. (a) CESI-4; (b) CESI-5; (c) CESI-14; (d) CESI-18.
Remotesensing 14 04659 g007
Figure 8. The VIIRS natural-color image of 14–17 March 2021. (a) 14 March 2021; (b) 15 March 2021; (c) 16 March 2021; (d) 17 March 2021.
Remotesensing 14 04659 g008
Figure 9. The VIIRS false-color RGB images of 14–17 March 2021. (a) 14 March 2021; (b) 15 March 2021; (c) 16 March 2021; (d) 17 March 2021.
Remotesensing 14 04659 g009
Figure 10. The CrIS SESI image of 14–17 March 2021. (a) 14 March 2021; (b) 15 March 2021; (c) 16 March 2021; (d) 17 March 2021.
Remotesensing 14 04659 g010
Figure 11. SESI (the yellow pixel) overlapped with false-color imagery (the grey area) on 14–17 March 2021. (a) 14 March 2021, (b) 15 March 2021, (c) 16 March 2021, and (d) 17 March 2021.
Remotesensing 14 04659 g011
Table 1. The NOAA-20 CrIS instrument and data characteristics.
Frequency BandSpectral Range (cm−1)Spectral Range (µm)Number of Channel (Unapodized)Spectral Resolution (cm−1)Effective Maximum Path Difference (cm)Number of Channels with Guard Bands
LWIR650–109515.38–9.14713 * (717)0.6250.8864
MWIR1210–17508.26–5.71865 * (869)0.6250.81050
SWIR2155–25504.64–3.92633 * (637)0.6250.8797
* means the apodized number of channels.
Table 2. The descriptions of the three sensitivity experiments.
ExperimentDescription
Exp. 1Aerosol concentration is scaled with a factor of 0.1–10
Exp. 2Aerosol effective radius is scaled with a factor of 0.0–2.0
Exp. 3Change the height of the sand aerosol layers from 500 to 900 hPa
Table 3. The channels of the VIIRS, associated thresholds, and Gamma correction factor used to create the dust RGB product.
ColorWavelengthsMinMaxGamma
R12.0 μm–10.8 μm−4 K+2 K1.0
G10.8 μm–8.7 μm0 K15 K2.5
B10.8 μm261 K289 K1.0
Table 4. The pixel statistics of sand and dust identified by SESI and false-color imagery (“True Positive” means that both methods identified sand and dust pixels, “True Negative” means that the SESI method identifies but the false-color imagery does not).
DateTrue PositiveTrue NegativeTotal MatchupsPositive Percent
2021.3.143391039137832.63%
2021.3.1562926389270.5%
2021.3.161135554168967.2%
2021.3.171431616204769.9%
Total35342472600658.8%
Publisher’s Note: MDPI stays neutral with regard to jurisdictional claims in published maps and institutional affiliations.

