Article

Power Line Extraction Framework Based on Edge Structure and Scene Constraints

School of Electrical Engineering and Automation, Jiangsu Normal University, Xuzhou 221116, China
*
Author to whom correspondence should be addressed.
Remote Sens. 2022, 14(18), 4575; https://doi.org/10.3390/rs14184575
Submission received: 8 August 2022 / Revised: 8 September 2022 / Accepted: 9 September 2022 / Published: 13 September 2022
(This article belongs to the Special Issue State-of-the-Art Remote Sensing Image Scene Classification)

Abstract

:
Power system maintenance is an important guarantee for the stable operation of the power system. Power line autonomous inspection based on Unmanned Aerial Vehicles (UAVs) provides convenience for maintaining power systems. The Power Line Extraction (PLE) is one of the key issues that needs solved first for autonomous power line inspection. However, most of the existing PLE methods have the problem that small edge lines are extracted from scene images without power lines, and bringing about that PLE method cannot be well applied in practice. To solve this problem, a PLE method based on edge structure and scene constraints is proposed in this paper. The Power Line Scene Recognition (PLSR) is used as an auxiliary task for the PLE and scene constraints are set first. Based on the characteristics of power line images, the shallow feature map of the fourth layer of the encoding stage is transmitted to the middle three layers of the decoding stage, thus, structured detailed edge features are provided for upsampling. It is helpful to restore the power line edges more finely. Experimental results show that the proposed method has good performance, robustness, and generalization in multiple scenes with complex backgrounds.

1. Introduction

Nowadays, the transmission lines network has spread to all parts of the world with the increasing electricity demand. The widely distributed power network is a serious challenge to the safety of the low-altitude flights, e.g., the Unmanned Aerial Vehicles (UAVs), helicopters and so on. It is very important to detect the power lines in advance and carry out obstacle avoidance for the safety of low altitude flights. Simultaneously, the power line collision accidents of low altitude flights will lead to serious power line damage. The damaged power lines will induce a large area of power outages and affect the reliability of transmission lines.
The power lines exposed in the open air for a long time would bear the influence of their tension, load and aging. The power lines could be easily damaged by natural disasters and line collision accidents [1]. Power lines play an important role in the stable and safe operation of the power system, thus, it is necessary to overhaul and maintain the power lines and their components periodically. Power line inspection based on aerial image has become a hot issue in recent years [2,3,4,5], and Power Line Extraction (PLE) is the first question that should be solved as an automatic power line inspection task [6,7,8].
The research of power line extraction has aroused the enthusiasm of many scholars [9,10,11], and many PLE methods, both traditional image processing based and deep learning based, have been proposed in recent years. The widely used traditional image processing based method is line detection. Tong et al. [12] proposed a PLE method, which embedded a foreground enhancement module before line detection based on the Hough transform. Similarly, the partial derivative enhancement was added before the Radon Transform by Cao et al. [13]. The distance filters with four directions and the double sided filters were used as the foreground enhancement methods, respectively, in references [14,15], respectively. A weighted Radon transform based line detection and a Radon transform method based on parallel line constraints were proposed in references [16,17], respectively.
In general, the PLE method based on traditional image processing is simple and easy to implement. In the aerial image of power lines with single backgrounds, power lines can be extracted quickly and accurately. However, these methods only pay attention to the characteristics of the power line itself and neglect the relative relationship between the power line and other objects in space, thus, the noise resistance of these methods is weak. When the background of an aerial image is complex, or there is pseudo power line component interference, it cannot accurately distinguish power lines from pseudo ones and has a high false alarm rate.
In recent years, with the widespread application of deep learning in the field of image processing, researchers have tried to apply deep learning to power line extraction and detection [6,7,8]. The PLE method based on deep learning does not need to manually extract features of power line images, and the established deep learning model can automatically extract effective power line features. Although deep learning methods require a lot of offline training, once the model is trained, online detection will be convenient, fast and effective.
Therefore, in this paper, a novel deep learning based PLE framework embedded with edge structure and scene constraints is proposed. The main contribution is summarized as follows:
(1) A multi-task PLE framework is proposed based on the encoding–decoding structure of the semantic segmentation model. The power line scene classification is used as an auxiliary task for the PLE (main task). The proposed PLE model combined with power line scene classification can improve the extraction performance. Robustness and generalization tests are conducted for evaluating the possibility of the actual application of the proposed model;
(2) To make the proposed model more effective, The scene constraints are appropriately set, to solve the problem that small edge lines are extracted from non-powerline scenarios. The shallow features that characterize the structural details of the power line edge are transferred to the middle three layers of the decoding stage, to recover the power line edge more finely; and the self-learning multi-loss smoothing is used to balance the results of the main task (PLE) and auxiliary task (PLSR).

2. Related Works

For the traditional image processing based PLE methods, Chen et al. [18] proposed a clustering Radon transform that can reduce false positives. Zhao et al. [19] enhanced the power lines using the histogram at first. Then, they used an improved Edge Drawing Parameter Free (EDPF) algorithm to identify the edges of power lines. Finally, they detected power lines by using the Radon transform. Zhao et al. [20] proposed an edge detection operator based on local context information, which fit the power line segmentally through the envelope. Shan et al. [21] proposed a new PLE method, with the help of optimization-based auxiliary selection and context acquisition scheme, the PLE results were generated by the Bayesian model. Pan et al. [22] proposed a PLE method with auxiliary information using the spatial environment parallax. They used the spatial environment difference to evaluate the auxiliary equipment in the PLE task. Zhang et al. [23] proposed a PLE method using the spatial correlation between towers and lines, which has a high extraction rate and a low false alarm rate. Luo et al. [24] proposed an object-aware-based extraction method using object attributes. Firstly, the RGB image was fused with the NIR image in the same scene, and edge detection was used to generate the candidate edges; secondly, the linear object region was constructed according to the thin-line structure properties of the power line object; thirdly, the potential was re-discovered according to the local intensity of the near-infrared image. Finally, the target was verified using the uniform color feature. Zhao et al. [25] proposed a method combining semantic segmentation and line detection, and a multi-scale Line Segment Detector (LSD) is used to determine power line candidate regions at first. Then, a weighted region adjacency graph was constructed based on the object-based Markov random field. Meanwhile, the Gaussian mixture model was utilized to form the likelihood function. Finally, the least-squares method and a Kalman filter were used to realize pixel fitting and tracking of power lines.
The above-mentioned works applied or improved the state-of-the-art image processing algorithms, which had been successfully applied in other image processing or computer vision fields. Thus, these methods were simple and easy to implement, but a lot of their parameters needed to be set in general. Furthermore, when the image pixel is relatively low, has existing curved power lines or complicated backgrounds, the extraction performance will be affected by using these methods.
For deep learning based PLE methods, Gerek used Convolutional Neural Network (CNN) to extract power line features at first, and then divided the images into two types: with power lines and without power lines. Next, the partial derivative of the classification loss function was used to generate a saliency map. Finally, it was superimposed on the image containing the power lines to realize an enhanced display [26]. Gubbi used the Gradient characteristic histogram to guarantee the accuracy of line features as the input of CNN, and extracted the power lines by using the LSD method [27]. Pan [28] embedded CNN to classify the images before the final PLE to reduce the background noise. A fast PLD network for pixel-wise straight and curved power lines was proposed in [29]. The edge attention fusion module and a high pass block were combined together by them, which extracted the semantic and spatial information to improve the PLD result along the boundary.
A PLE method based on weakly supervised learning, which solves the problem of labeling large-scale datasets, was proposed in [30]. A PLE method based on pyramid patch classification, which used a CNN-based classifier to help eliminate power line pseudo-targets, is proposed in [31]. The Generative adversarial network was combined with the conic and hue perturbation to enhance datasets, which reduced model parameters and the computational complexity through the model in [32]. The artificially synthesized power line images were used as the training data, and a fast single-shot line segment detector was proposed in [33]. A real-time segmentation model for power lines was proposed in [34], in which the context branch utilized the Asymmetric Factorized Depth-wise Bottleneck (AFDB) module to achieve efficient short-range feature extraction with a large receptive field. The spatial branch helped to capture rich spatial information and utilized classification with the subnet-level skip connections. It recovered the long-distance features and improved the performance of power line extraction. Liu improved the Unet model and its variants to adapt to the power line dataset, and then extracted the power lines from the image dataset [35].
Information fusion can make full use of the semantic and location information contained in the features. Thus, it is considered to be embedded in the deep learning network model. Information fusion was used to improve the accuracy of power line extraction in [36] and [37], respectively. A PLE method using convolution and structured features was proposed by Zhang et al. [38]. Firstly, an improved VGG16 neural network was constructed to obtain the hierarchical response of each layer; secondly, the rich feature maps were integrated to generate a fusion output, and the structural information from the roughest feature map was extracted; finally, the fusion output was combined with the structured information to obtain a clear background result.
In the practical application of power line extraction, the images obtained by the capture device are not necessarily containing power lines. However, traditional image processing methods and deep learning models usually use power line scene images as the data set, which is not suitable for the PLE application. However, when using power line scene images and non-power line scene images as the data set of for training, the extraction performance is not good, and problems occur as non-power line scene images are segmented into small targets, and the practical application of PLE cannot be performed.
The PLE results based on a typical deep learning based model [39] are shown in Figure 1. The input aerial images are shown in Figure 1a. The Ground Truth (GT) labels of the corresponded power lines are shown in Figure 1b, and the extract results are shown in Figure 1c. The first, second, and third images are aerial images containing power line scenes, and the fourth, fifth, and sixth images are aerial images without power line scenes (the order is left to right). In aerial images containing power line scenes, there are cases of false detections, but power lines can be extracted relatively completely. In non-powerline scenarios, there is a common problem that small edge lines are extracted.

3. The Proposed PLE Framework

3.1. Scene Rule Constraints

In order to solve small edge lines extracted from non-powerline scenarios, the idea of PLSR is integrated into the PLE. The branch of PLSR is drawn from the encoder, and then the scene constraints are set. The specific description of the constraint rules is expressed as follows.
Let the label set of power line scene recognition be M = { m 1 , m 2 } , where m 1 means that the image belongs to the non-power line scene, and m 2 means that the image belongs to the power line scene. Let the reasoning set of the power line scene recognition branch be R = { r 1 % , r 2 % } , where r 1 % means that the inference image belongs to the non-power line scene, and r 2 % means that the inference image belongs to the power line scene. Let the extracted label set of power lines be N = { n 1 , n 2 } , where indicates that the pixel belongs to the non-power line, and n 2 indicates that the pixel belongs to the power line. Let the inference set of the PLE branch be E = { e 1 , e 2 , , e i } , where the pixel size of the image is a × b , e i represents the gray value of the pixel point i, the value set of e i is { 0 , 255 } .
For an image with a pixel size of a × b , the scene recognition branch reasoning set R = { r 1 % , r 2 % } and the extraction branch reasoning set E = { e 1 , e 2 , , e i } are obtained through model inference. If r 1 % r 2 % , the image is divided into category m 1 , otherwise the images are divided into category m 2 . If the image is divided into category m 1 , reset the element with value of 255 to 0, and update it, otherwise keep E = { e 1 , e 2 , , e i } unchanged.

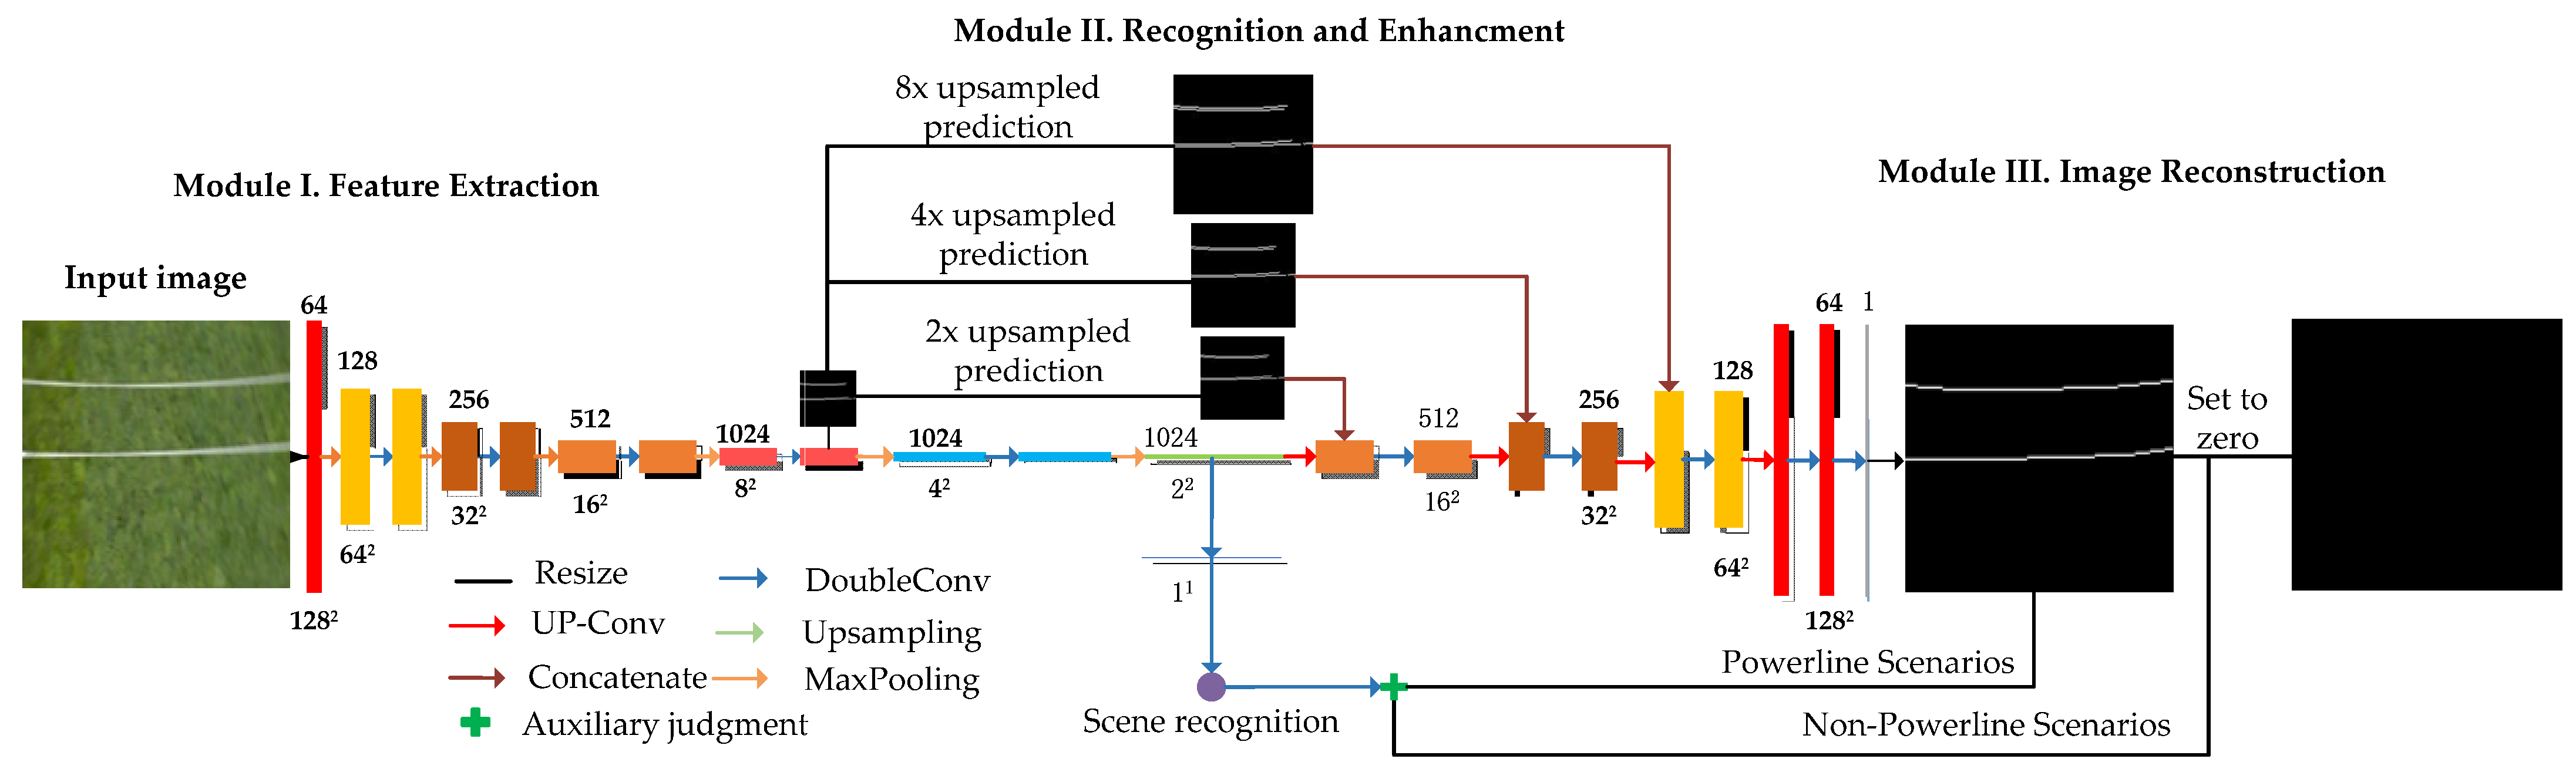
3.2. Network Model Design

The architecture of the proposed network model is constructed based on the structural characteristics of the encoder–decoder mode, which is shown in Figure 2. Where each colored box corresponds to a multi- channel feature map, the number of channels is denoted on top of the colored box. The x-y size is listed at the bottom of the colored box. Box without numbers means it has the same channel and size with the same colored box. The colored arrows and lines denote the different operations. The mostly used operator “DoubleConv” in Figure 2 means applying the convolution operation twice continuously. The sequence can be represented as “Conv2d-> BN-> ReLU-> Conv2d-> BN -> ReLU”. where Conv2d applies a 2D convolution over an image, BN applies batch normalization over an image, and ReLU represents the nonlinear activation unit. The operator “Up-Conv” denotes upscaling the size of the image based on upsampling and deconvolution. The operator “Concatenate”denotes merging the two images. Other operators denote the operation as its name.
For a better understanding of the network architecture, it is divided into three modules by us. The input image is transferred into 1024 feature maps with 8x8 in Module I, after four times of DoubleConv and MaxPooling. It mainly refers to feature extraction. Module II refers to recognition of power line scenarios and edge enhancement for power lines. Images had a better edge effect after three or four times of pooling is shown in a semantic segmentation model [31], so the edge structured feature map after four times of pooling of the proposed network are sent to the middle three layers of the decoder, in order to better restore power line edges. The idea of power line scene recognition is integrated into the PLE model, which is set as the scene constraints. Extract the power line scene recognition branch from the encoder at first, and set the scene constraints as follows. When the power line identification result contains power lines, keep the original PLE results unchanged; when the power line identification results do not contain power lines, set all PLE results as the background area. Module III is image reconstruction from 128 feature maps with the size 64 × 64. Powerline scenarios or Non-powerline scenarios are displayed in this part.
The PLSR results directly affect the PLE results. Literature [39] mentioned that in the classification task, the classification accuracy increases with the deepening of the deep learning network to a certain extent. By deepening the network depth, the abstract features of the original information is increased, both the power line recognition effect and extraction accuracy results are improved. In the semantic segmentation model based on deep learning, the features extracted by the shallow convolution layer are detailed features such as edges, textures, etc., and the features extracted by the deep convolution layer are abstract features. Abstract features are helpful for category judgment, and detailed features are helpful for edge recovery. Therefore, the model proposed in this paper transfers the shallow feature map of the fourth layer in the encoding stage to the middle three layers in the decoding stage, providing structured detail edge features for upsampling, which helps to restore the power line edge more finely. Furthermore, the latest state-of-the-art semantic segmentation methods based on the encoder–decoder framework, e.g., FCN-transformer [40], ViT adapter [41], SSformer [42], could be embedded in the proposed PLE framework in this paper.

3.3. Self-Learning Multi-Loss Smoothing Technique

3.3.1. Label Smoothing

Label smoothing is used as a regularization strategy in this paper. When calculating the loss function, noise is added to reduce the weight of the real sample label category. This can be avoided by the model being overconfident in the correct label. The difference of the output values between the predicted positive and negative samples is not so big. It ultimately inhibits overfitting and better generalizes the network. The label smoothing combines uniform distribution to replace the one-hot encoded label vector y ^ i with the updated label vector y h o t , which is calculated as shown in Equation (1).
y ^ i = y h o t ( 1 α ) + α / K
where K is the total number of multi-class categories, and ε is a small hyperparameter.

3.3.2. Self-Learning Smoothing Loss

The proposed model includes a segmentation module and a classification module. Self-learning and label smoothing are used to establish a new loss function. Then the results of the PLE (main task) and PLSR (auxiliary task) are balanced for better generalizing the network. Which is calculated as shown in Equation (2).
Loss = λ 1 L o s s 1 + λ 2 ϑ ( L o s s 2 )
where L o s s 1 is the loss function BCELoss of the segmentation module; L o s s 2 is the loss function CrossEntropyLoss of the classification module; ϑ ( ) is the label smoothing operation; λ 1 and λ 2 are the self-learning coefficients, which are optimized and updated as a weight parameter during the network training, where λ 1 + λ 2 = 1 .

4. Experimental Results and Analysis

4.1. Power Line Dataset and Experimental Configuration

The public power line image dataset [35,43] is used in this paper. A total of 4000 Infrared Radiation (IR) images and 4000 visible light images were collected in this dataset and scaled to 128 × 128. There are 2000 IR scene images with and without power lines, respectively, in the IR folder. There are 2000 visible light scene images with and without power lines in the visible light folder.
The configuration used in this paper in terms of the hardware and the software platform is shown in Table 1.
The experimental parameters used to train the proposed network are shown in Table 2.

4.2. Performance Evaluation Metrics

The commonly used performance evaluation metrics for the PLE task and image segmentation are the Pixel Accuracy (PA) [44], Mean Intersection over Union (MIoU) [44], and Frequency Weighted Intersection over Union (FWIoU) [44]. All of them are used as the performance evaluation of the power line extraction.

4.2.1. MIoU [44]

MIoU is an important metric to measure the accuracy of image segmentation, that is, the ratio of the intersection and union of the two sets is calculated for each category, and finally, the overall average is obtained. The larger the value of MIoU, the better the prediction ability of the model and the higher segmentation accuracy. The calculation formula is given as shown in Equation (3).
MIoU = 1 n + 1 i = 0 n p i i j = 0 n p i j + j = 0 n p j i p i i
where n represents the number of categories; p i i represents the number of real-valued pixels i and predicted results i ; p i j represents the number of real-valued pixels i and predicted results j ; p j i represents the number of real-valued pixels j and predicted results i .

4.2.2. PA [44]

Pixel accuracy is the proportion of correctly classified pixels to the total pixels. The calculation formula is given as shown in Equation (4).
PA = i = 0 n p i i i = 0 n j = 0 n p i j
where n represents the categories number; p i i represents the number of real-valued pixels i and predicted results i ; p i j represents the number of real-valued pixels i and predicted results j .

4.2.3. FWIoU [44]

The FWIoU is to set the weight according to the frequency of occurrence of each category, multiply the weight by the IoU of each category and sum it up. The calculation formula is given as shown in Equation (5).
F W I o U = i = 0 n ( j = 0 n p i j p i i ( j = 0 n p i j + j = 0 n p j i p i i ) ) i = 0 n j = 0 n p i j
where n represents the number of categories; p i i represents the number of real-valued pixels i and predicted results i ; p i j represents the number of real-valued pixels i and predicted results j ; p j i represents the number of real-valued pixels j and predicted results i .

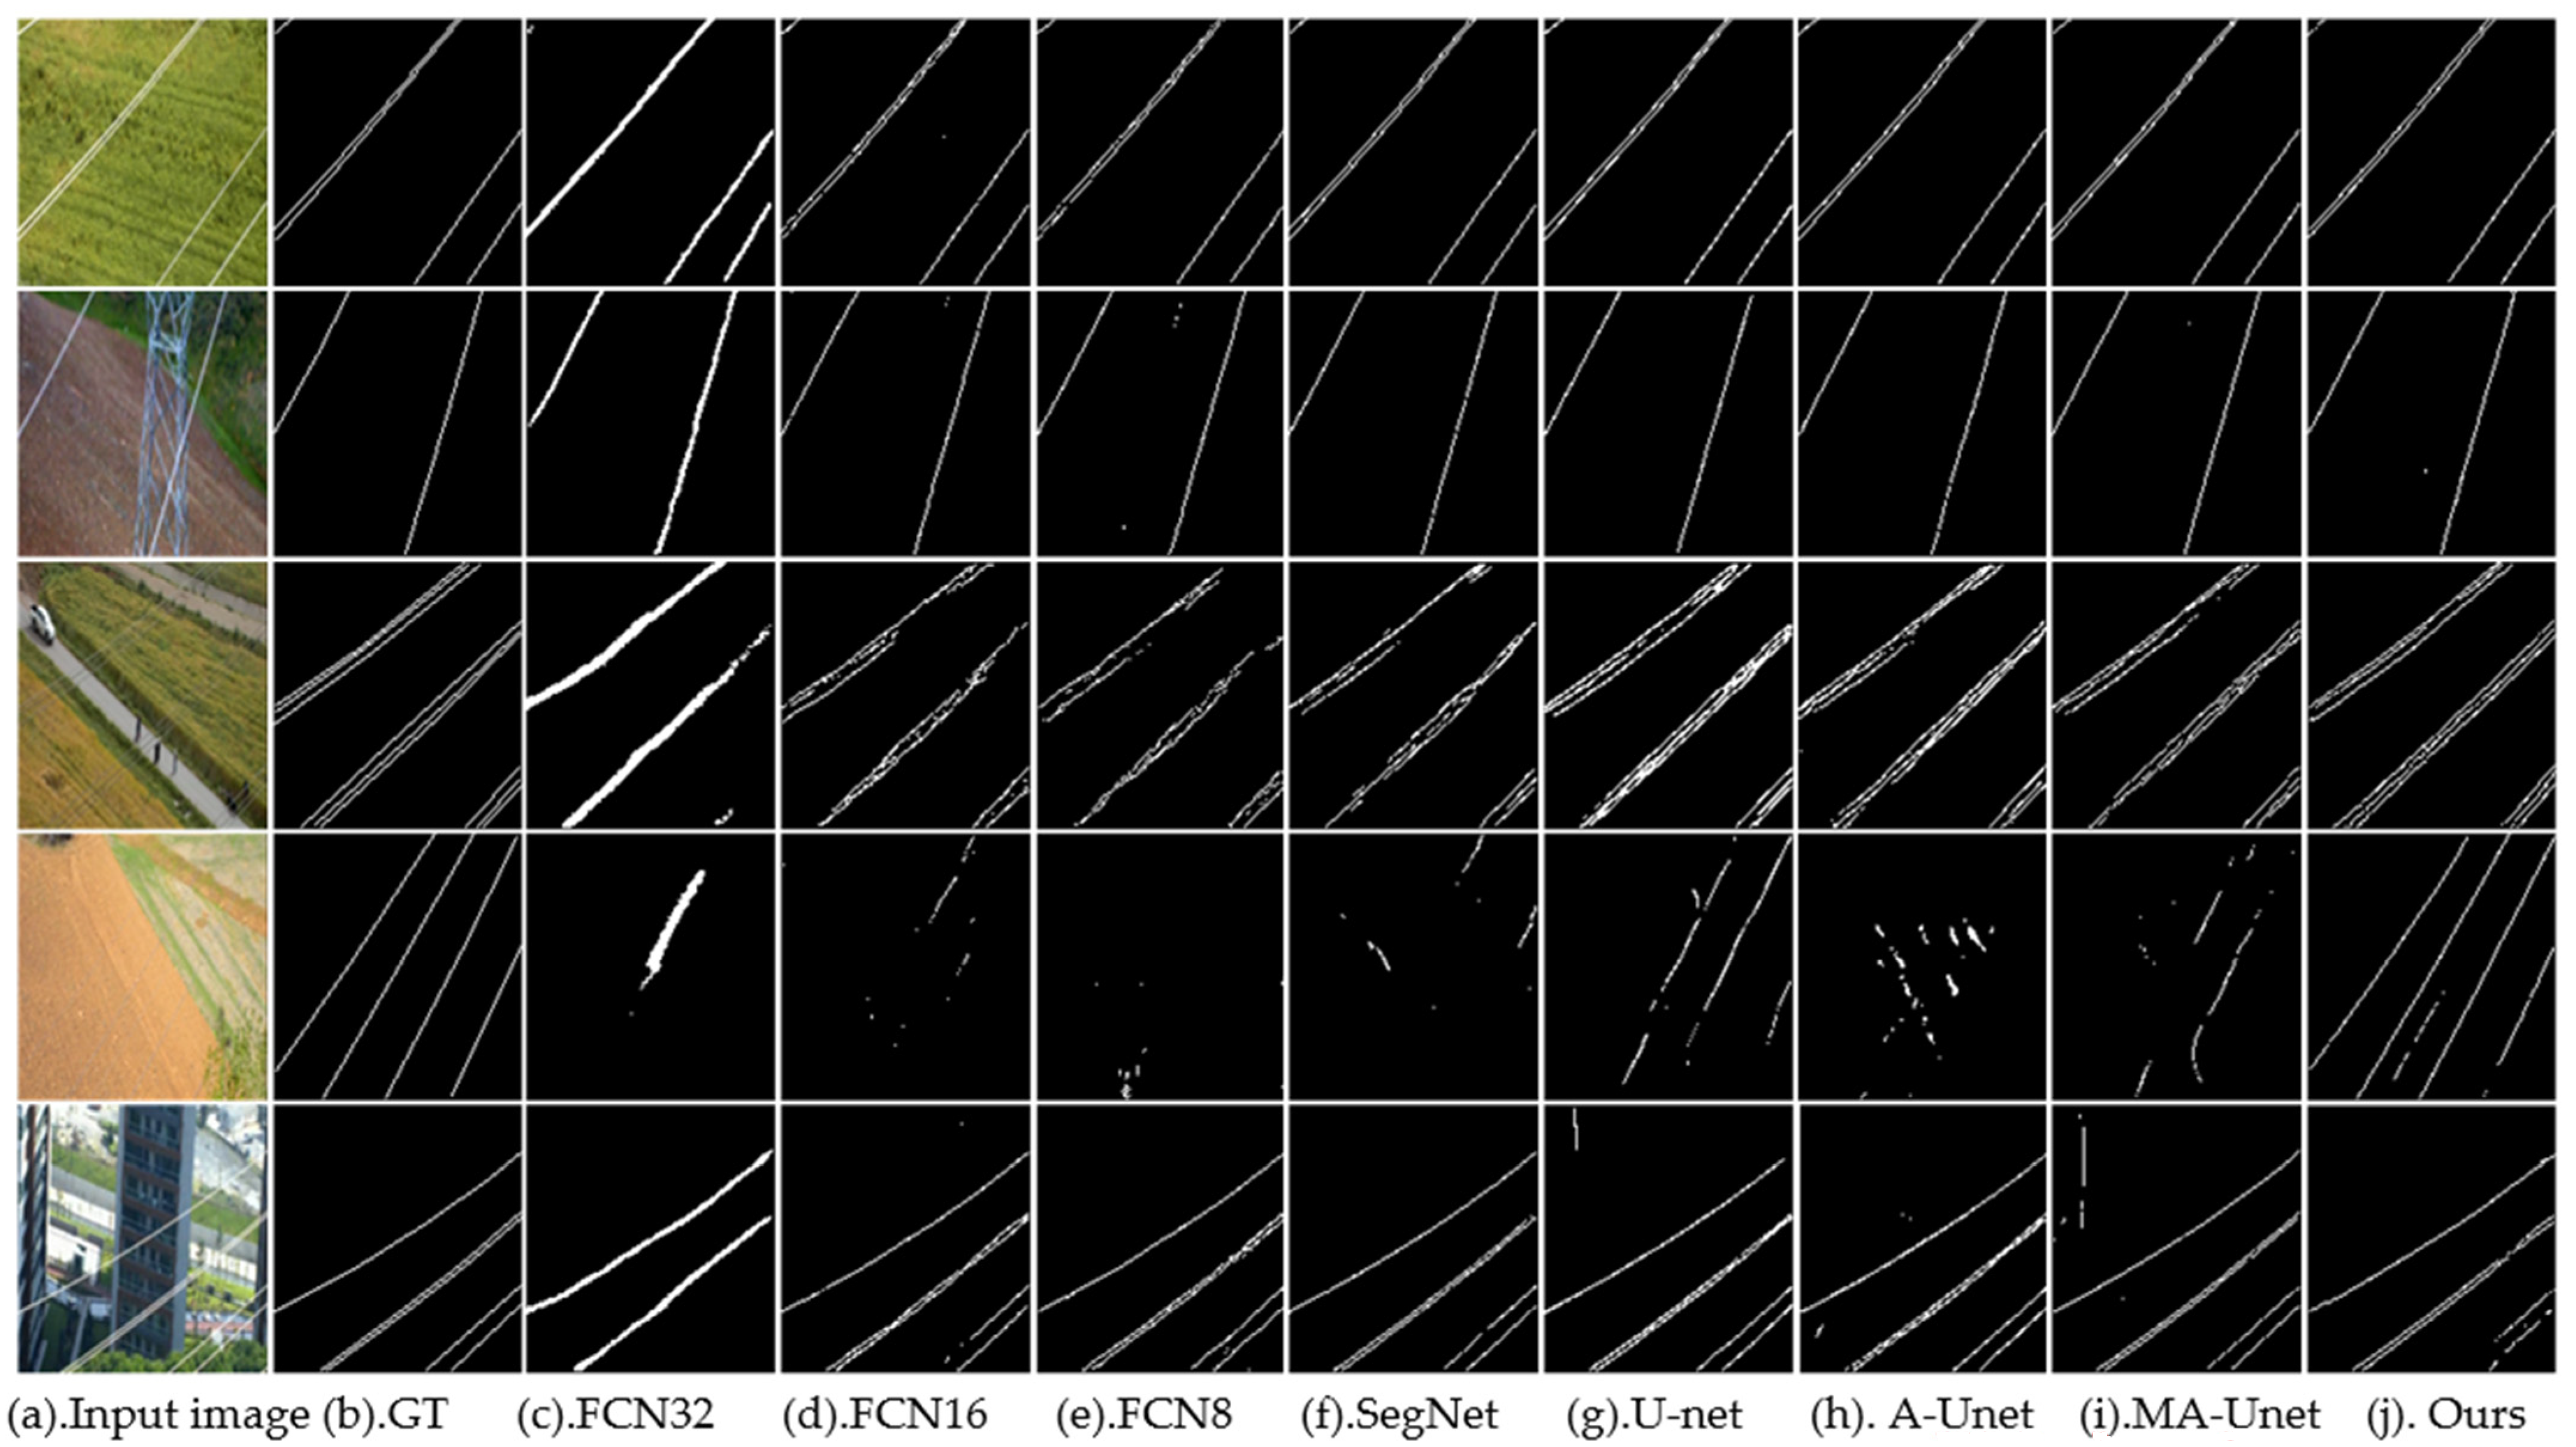
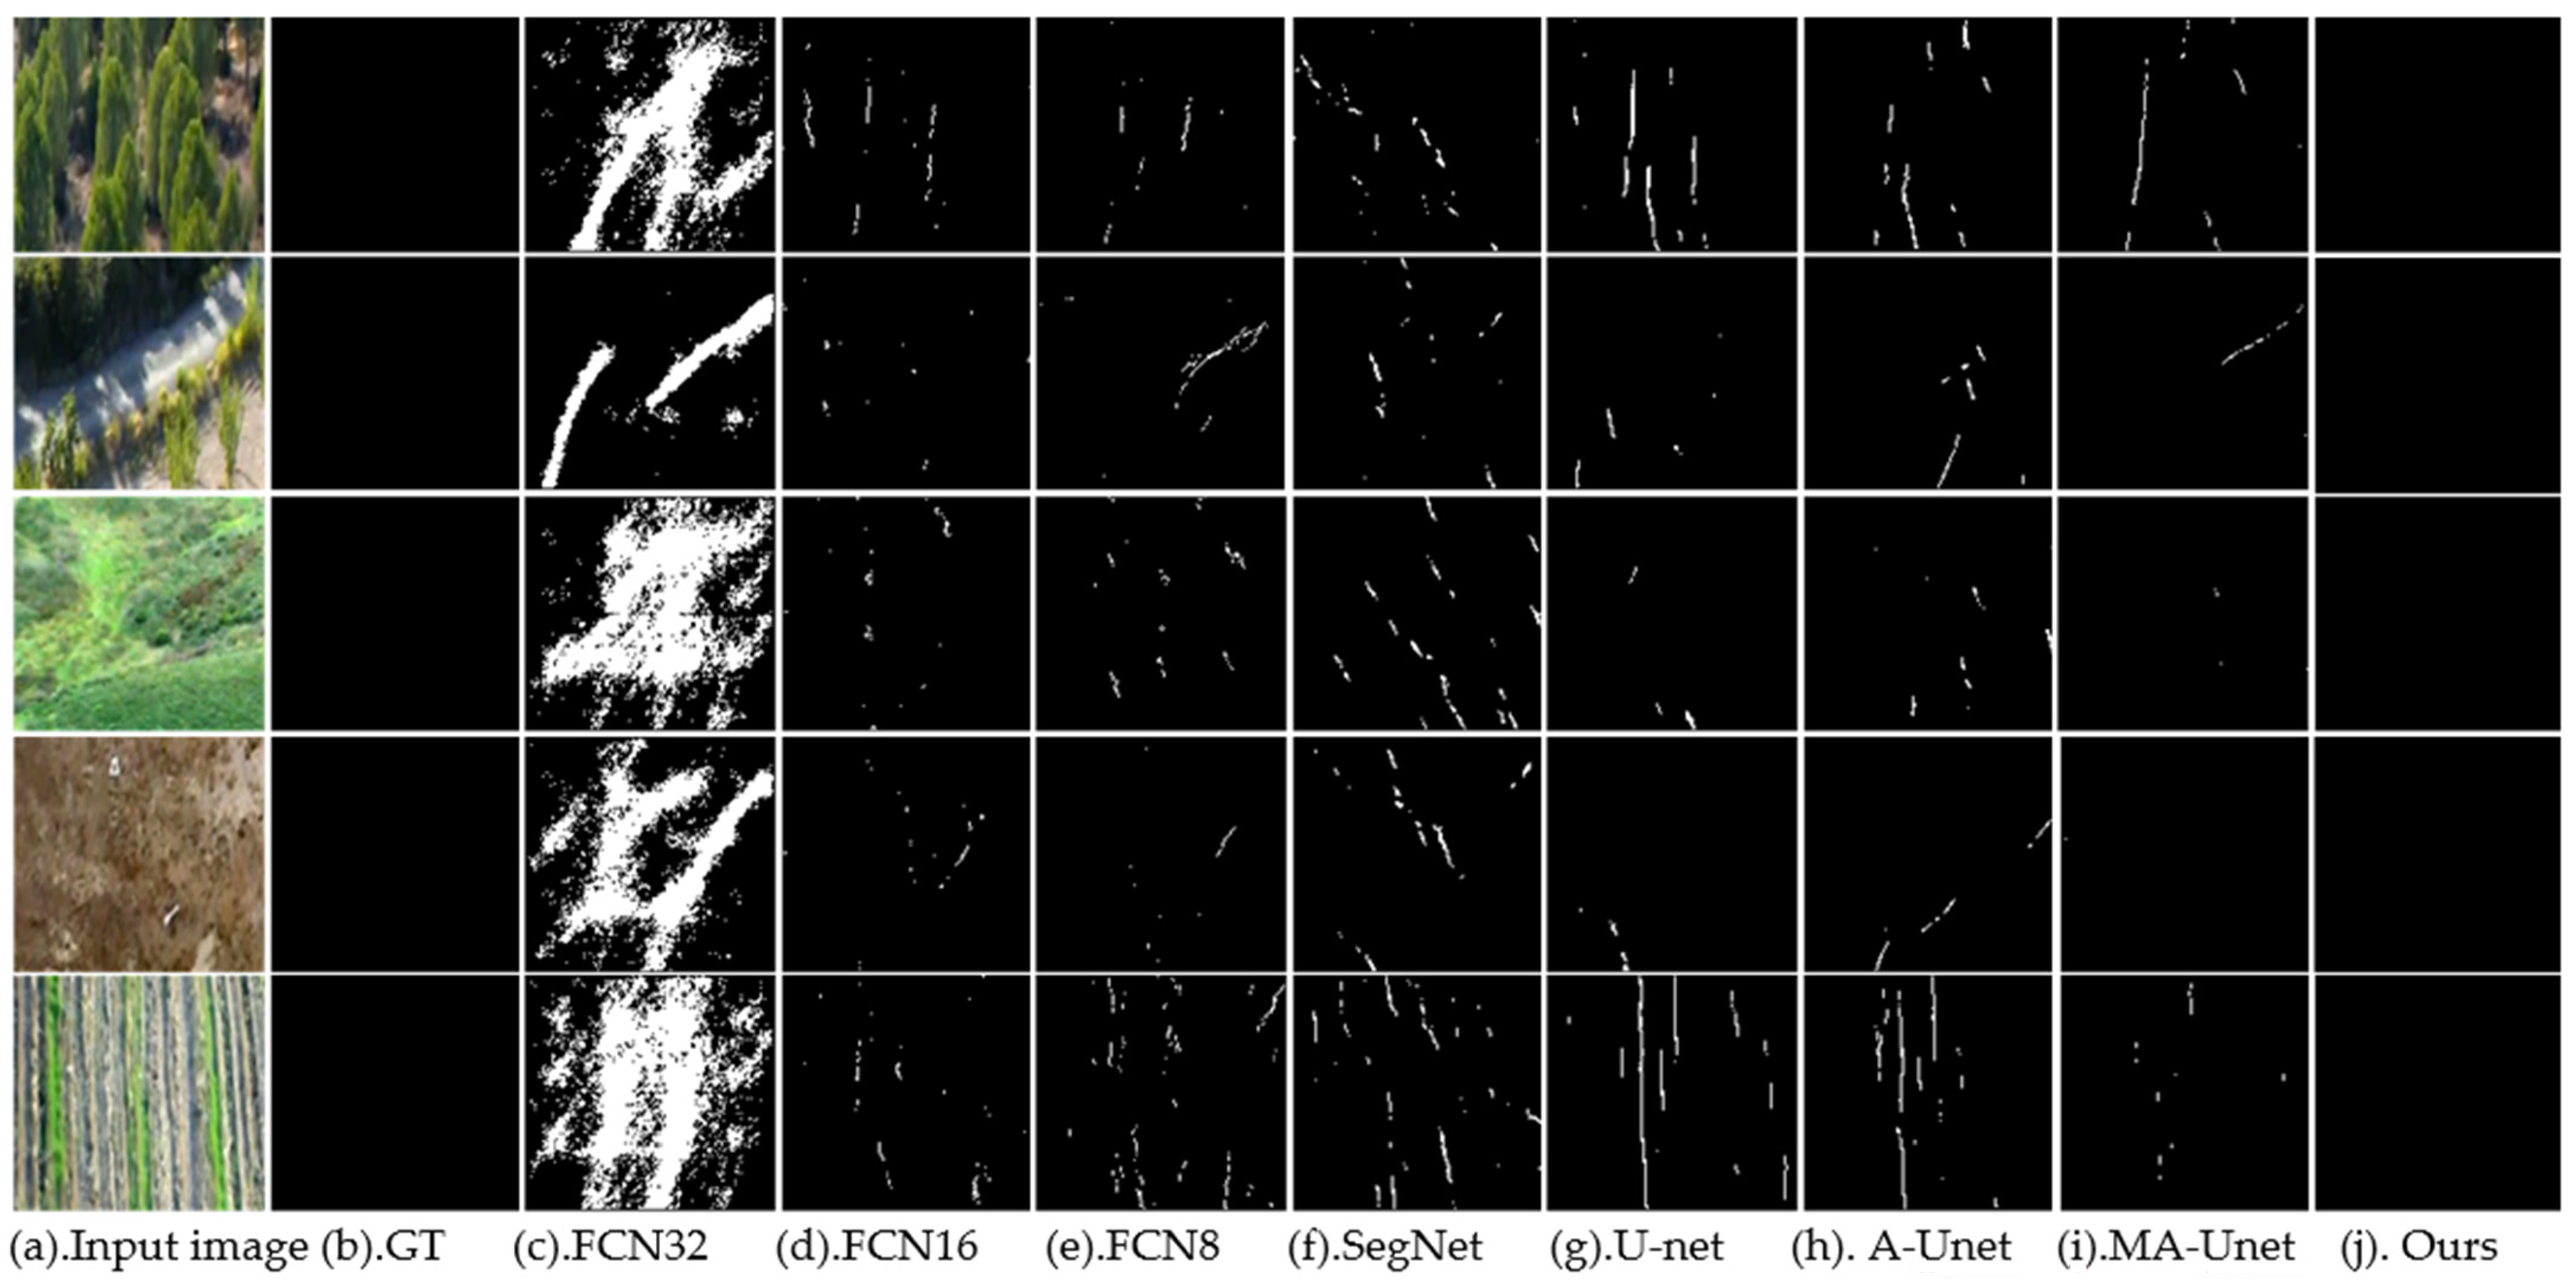
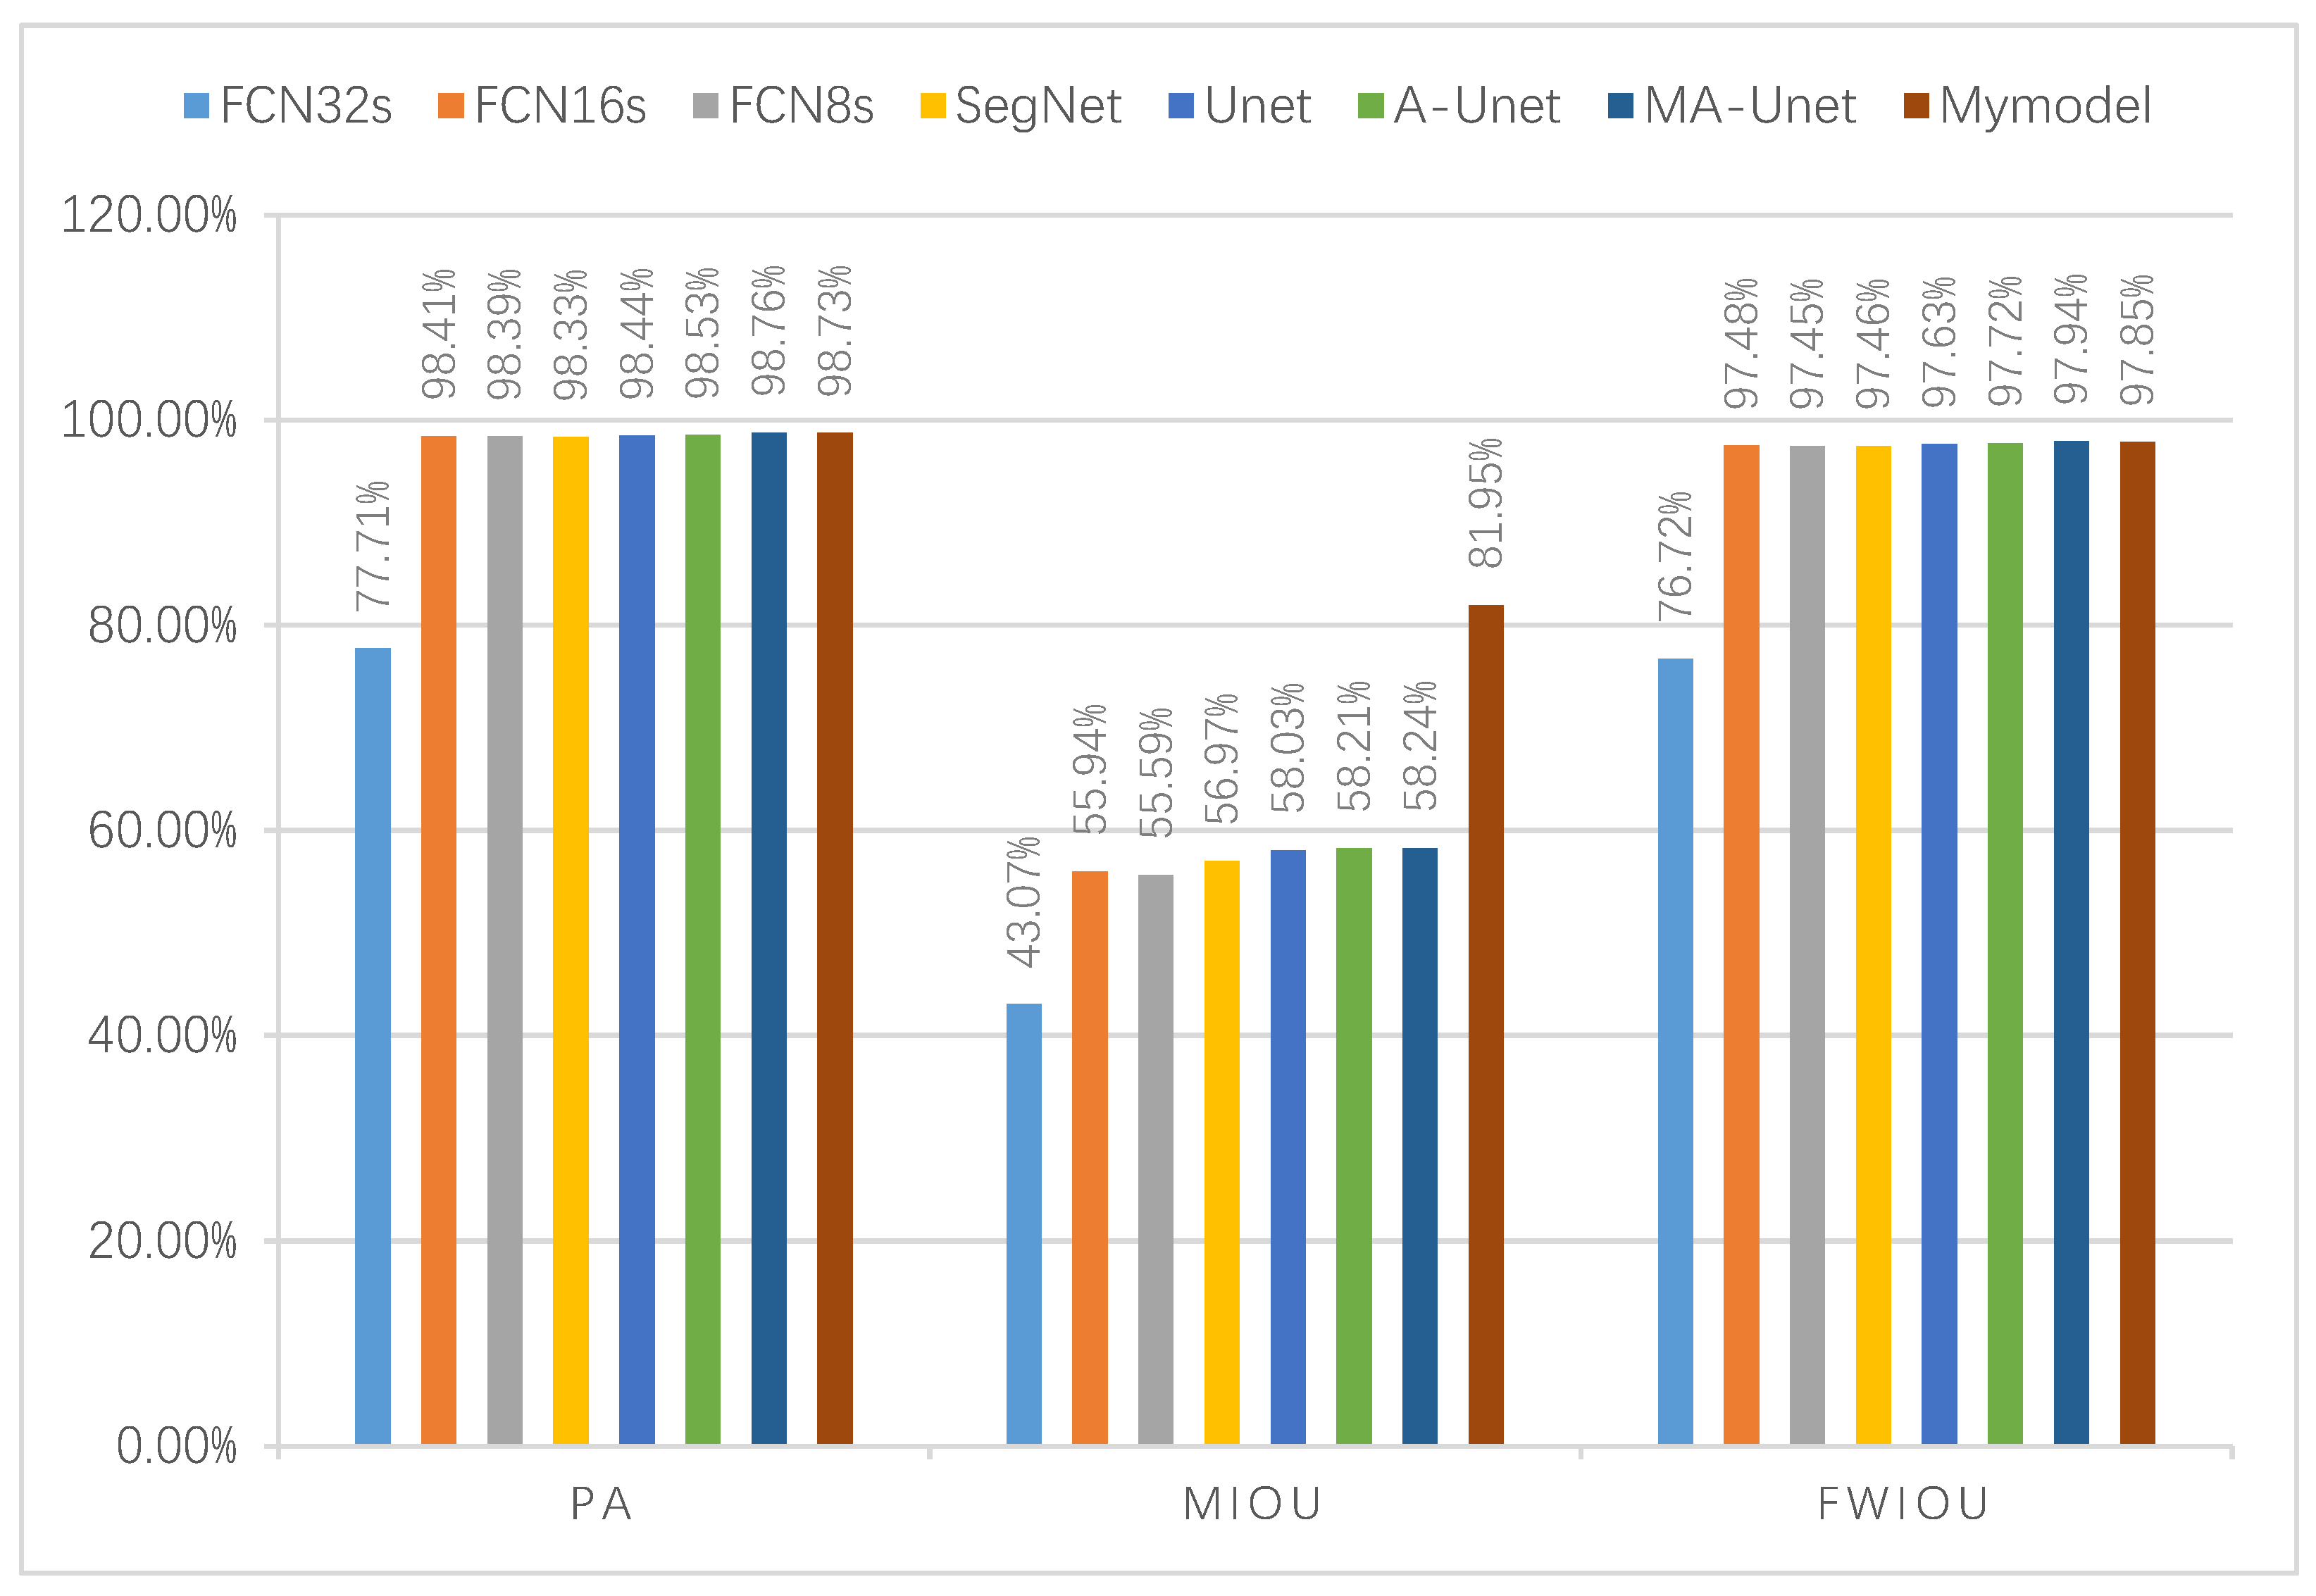
4.3. Comparison Results

The extract results of the FCN32s [45], FCN16s [45], FCN8s [45], SegNet [46], Unet [35,47], Attention-Unet (A-Unet) [48] and MA-Unet [49] are compared with the proposed method on the dataset [43]. The parameters of the input size, batch size, optimizer, Learning rate, and training epochs of all the compared methods are set the same with the proposed model, as shown in Table 2. The extraction results are shown in Figure 3. The input images, ground truth, results of the FCN32s, FCN16s, FCN8s, SegNet, Unet, Attention-Unet, MA-Unet and the proposed model are corresponded to (a), (b), (c), (d), (e), (f), (g), (h), (i) and (j), respectively, in Figure 3.
Five power line images with different backgrounds are shown in Figure 3a. The background is grassland, power towers, country road, rural field, and urban building, respectively (order from top to bottom). The ground truth label corresponding to the image in Figure 3a is shown in Figure 3b. The PLE results of the eight models are given in Figure 3c–j, respectively. For the first and second images, the background is simple and the power lines are clear, so all the eight models successfully extract the power lines. However, the FCN32s model is less able to handle details and does not correctly distinguish adjacent power lines in the first image. For the third image, the background is complex and the power lines are not clear, and the extraction performance of the eight models is worse than the first two images. The FCN32s does not correctly distinguish adjacent power lines and ignores the short power line in the lower right corner, while the FCN16s, FCN8s and SegNet appear severe discontinuities. The Unet, Attention-Unet, MA-Unet and the proposed model have slight discontinuities, but the proposed model controls the edge details of the power line more accurately. For the fourth image, the power line is almost invisible due to illumination, which greatly increases the difficulty of the PLE task. The FCN32s, FCN16s, FCN8s, SegNet and Attention-Unet have not correctly extracted the power lines and have false detections. The Unet and MA-Unet extracts individual power lines but the phenomenon of discontinuity and false detection is obvious, while the proposed model extracts all the power lines and has slight discontinuity and multi-detection problems. For the fifth image, the FCN32s still does not correctly distinguish adjacent power lines and misses the short power line in the lower right corner. The Unet and MA-Unet mistakenly detect the edge of the building as a power line, and the rest of the models have varying degrees of discontinuity. Overall, the proposed model achieves the best results, and the advantages are more obvious in the case of complex backgrounds and inconspicuous power lines.
The extraction results of test images without power lines are shown in Figure 4. The input images, ground truth, results of the FCN32s, FCN16s, FCN8s, SegNet, Unet, Attention-Unet, MA-Unet and the proposed model are corresponded to (a), (b), (c), (d), (e), (f), (g), (h), (i) and (j), respectively, in Figure 4.
Five images without power lines in different backgrounds are shown in Figure 4a. These backgrounds are the forest, country road, mountain, land and farmland, respectively (order from top to bottom). Figure 4b shows the ground truth labels of the power line corresponding to the input image. The PLE results of the eight models are given in Figure 4c–j, respectively. There are different degrees of the problem that edge lines are extracted from scenes images without power lines, except for the proposed model. The FCN32s and SegNet have serious false detections for these five images. The FCN16s, FCN8s, Unet and Attention-Unet have fewer false detections than the FCN32s and SegNet. The false detection of the MA-Unet are significantly better than the above six models. No false detection has occurred by the proposed model. Overall, the false detections in the first image and the fifth image are relatively serious, mainly as the edge of the trees in the first image and the edge of the field in the fifth image, are similar with the power lines, which lead to the false detection of the PLE methods.
The performance evaluation of the FCN32s, FCN16s, FCN8s, SegNet, Unet, Attention-Unet, MA-Unet and the proposed model are verified on 200 test set images. The MIoU, PA and FWIoU are used as the evaluation metrics, the extraction results are shown in Figure 5. The FCN32s has the lowest score among the three metrics and is not discussed in the following analysis. The remaining seven models achieved high scores in the PA and FWIoU. The difference between the highest and the worst is less than 0.5%. 0.09% behind the best. As the power lines occupy fewer pixels in the aerial images, this results in the PA and FWIoU being determined by the non-power line parts, so the difference between the models is not large. In terms of the MIoU, the proposed model achieved the highest score and 23.71% higher than the second place. It is also easy to explain that the proposed model can accurately predict non-power line scene images, and other models have a large number of false detections. For the MIoU, whether there are power line scenes or non-power line scenes that have the same degree of impact, the proposed model has been greatly improved on the MIoU. In brief, the proposed model uses the PA and FWIOU to be negligible in performance loss in exchange for a substantial increase in the MIOU.
The average inference time of a power line image by using different methods is shown in Table 3. Obviously, the proposed method needs more interference time than other models except for the MA-Unet. Considering that the proposed method contains two tasks (PLE and PLSR), the edge structure is enhanced with better extraction performance, and the inference time is still faster than other methods [18], the overall performance of the proposed model is acceptable.

5. Robustness and Generalization Test

The model proposed in this paper demonstrated good extraction performance on the power line public dataset. However, the practical application scenario is more complicated. In order to make the proposed model faster and better for application in practical scenarios, this section conducts a more in-depth discussion and analysis on the extraction of power lines by testing the robustness and generalization of the proposed method.

5.1. Performance Robustness Test
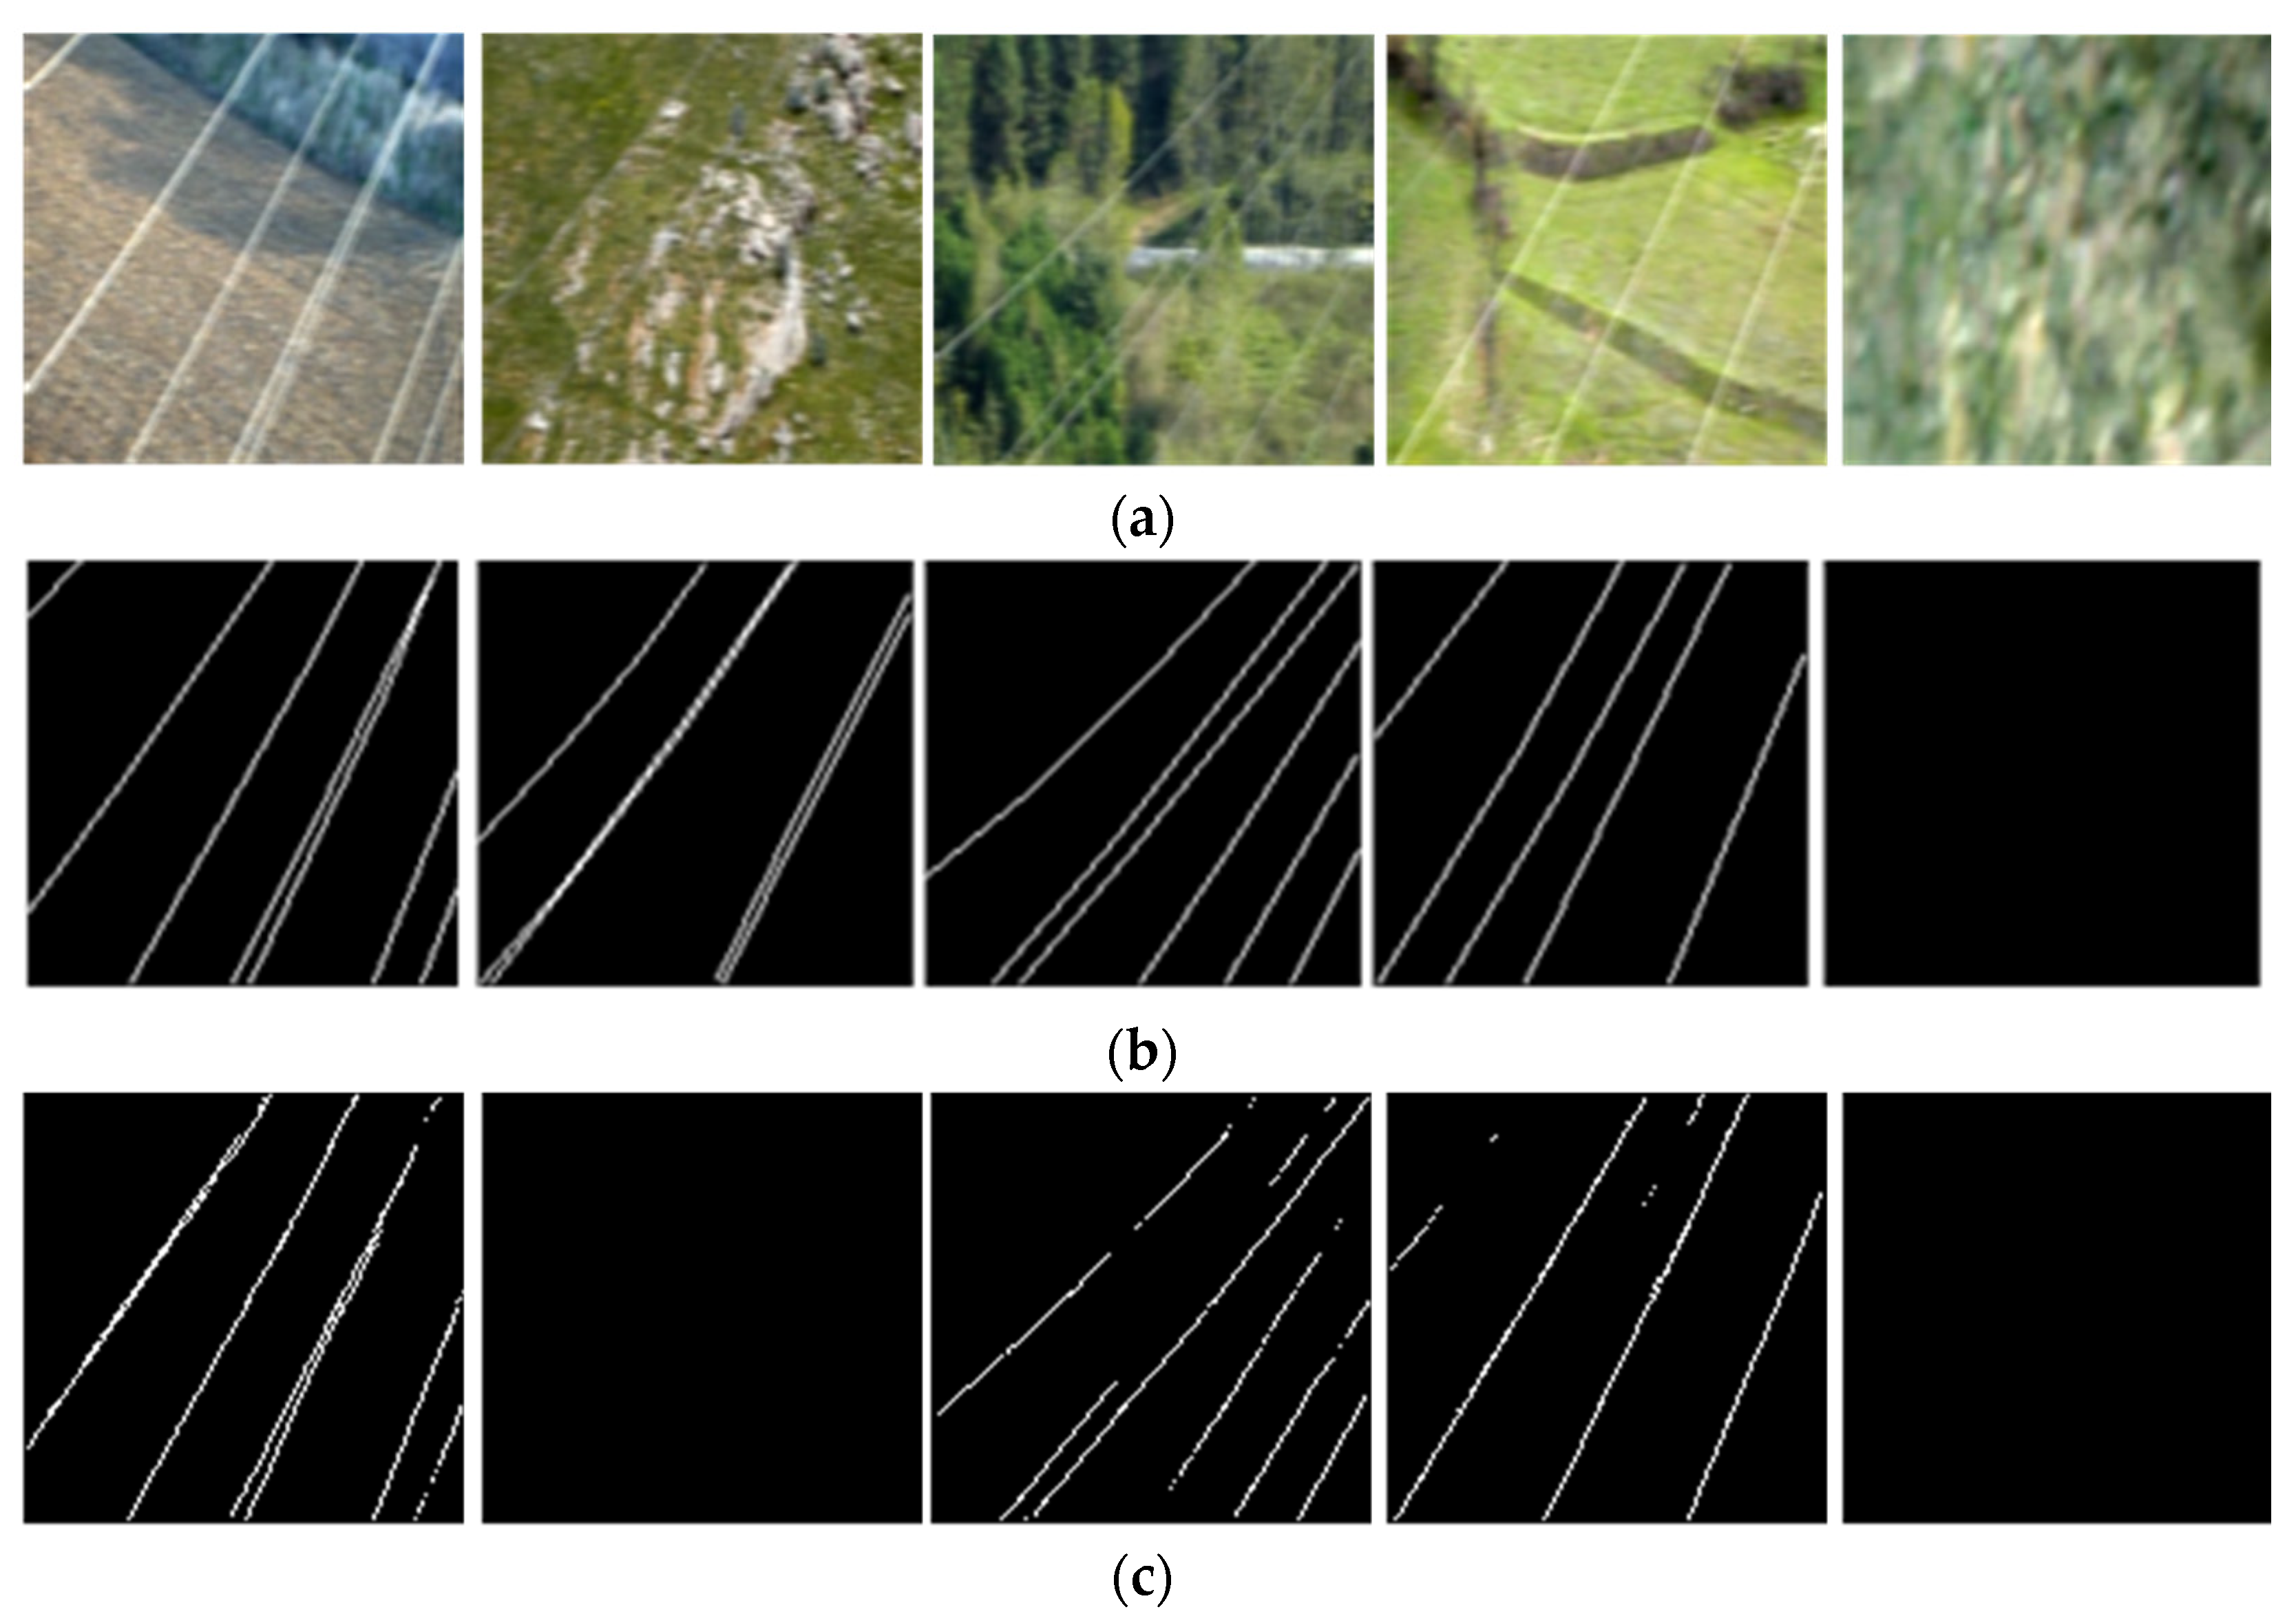
In order to verify the applicability of the proposed method under force majeure factors, digital image processing technology is used to process the test set images to form foggy, strong lighting, snowfall and motion blur scene environment. The performance metrics of the proposed method in these four scenes are shown in Table 4.
Compared with the normal scene, the maximum bias of the PA and FWIOU in the above four scenes is −1.4%, −1.55%, respectively. Both of the two maximum biases are in the snow fall environment. The bias of the MIoU in these four scenes is −1.28%, −2.14%, −34.29% and −4.95%, respectively. In total, the proposed method has a high robustness with these four scenes, except that snowfall will have a certain impact on the robustness of the performance. For the issue of non-perfect performance robustness in a snowfall environment, the fusion of infrared images and visible light images can be introduced in the future. Since in a snowfall environment, although the power lines are indistinguishable from the snowy background, the high-temperature power lines can be distinguished from the low-temperature background environment. In order to evaluate the performance robustness of the proposed model more clearly, the evaluation results of some typical images with complex scenes are shown as follows.

5.1.1. Fog Test

The test results of the proposed PLE method in a foggy environment are shown in Figure 6. The power line images in a foggy environment are shown in Figure 6a. The ground truth of power line labels are shown in Figure 6b. The predicted results of the proposed method are shown in Figure 6c. The first four images show power line scene images, and the fifth image shows non-power line scene images (order from left to right). The foggy environment brings certain difficulties to the PLE, so there are slight discontinuities and missed detections in the second image, but the power lines are still extracted relatively complete, so the proposed method has a high robustness in foggy environment.

5.1.2. Strong Light Test

The test results of the proposed PLE method in a strong light environment are shown in Figure 7. Power line images in a strong light environment are shown in Figure 7a. The ground truth of power line labels are shown in Figure 7b, and the prediction results of the proposed method are shown in Figure 7c. The first four images show power line scene images, and the fifth image shows non-power line scene images (order from top to bottom). The strong lighting environment brings certain difficulties to the PLE, so there are slight discontinuities and missed detection in the second image, and there are discontinuities in the fourth image. Overall, the proposed PLE method is relatively good, so it has a high robustness in the strong light environment.

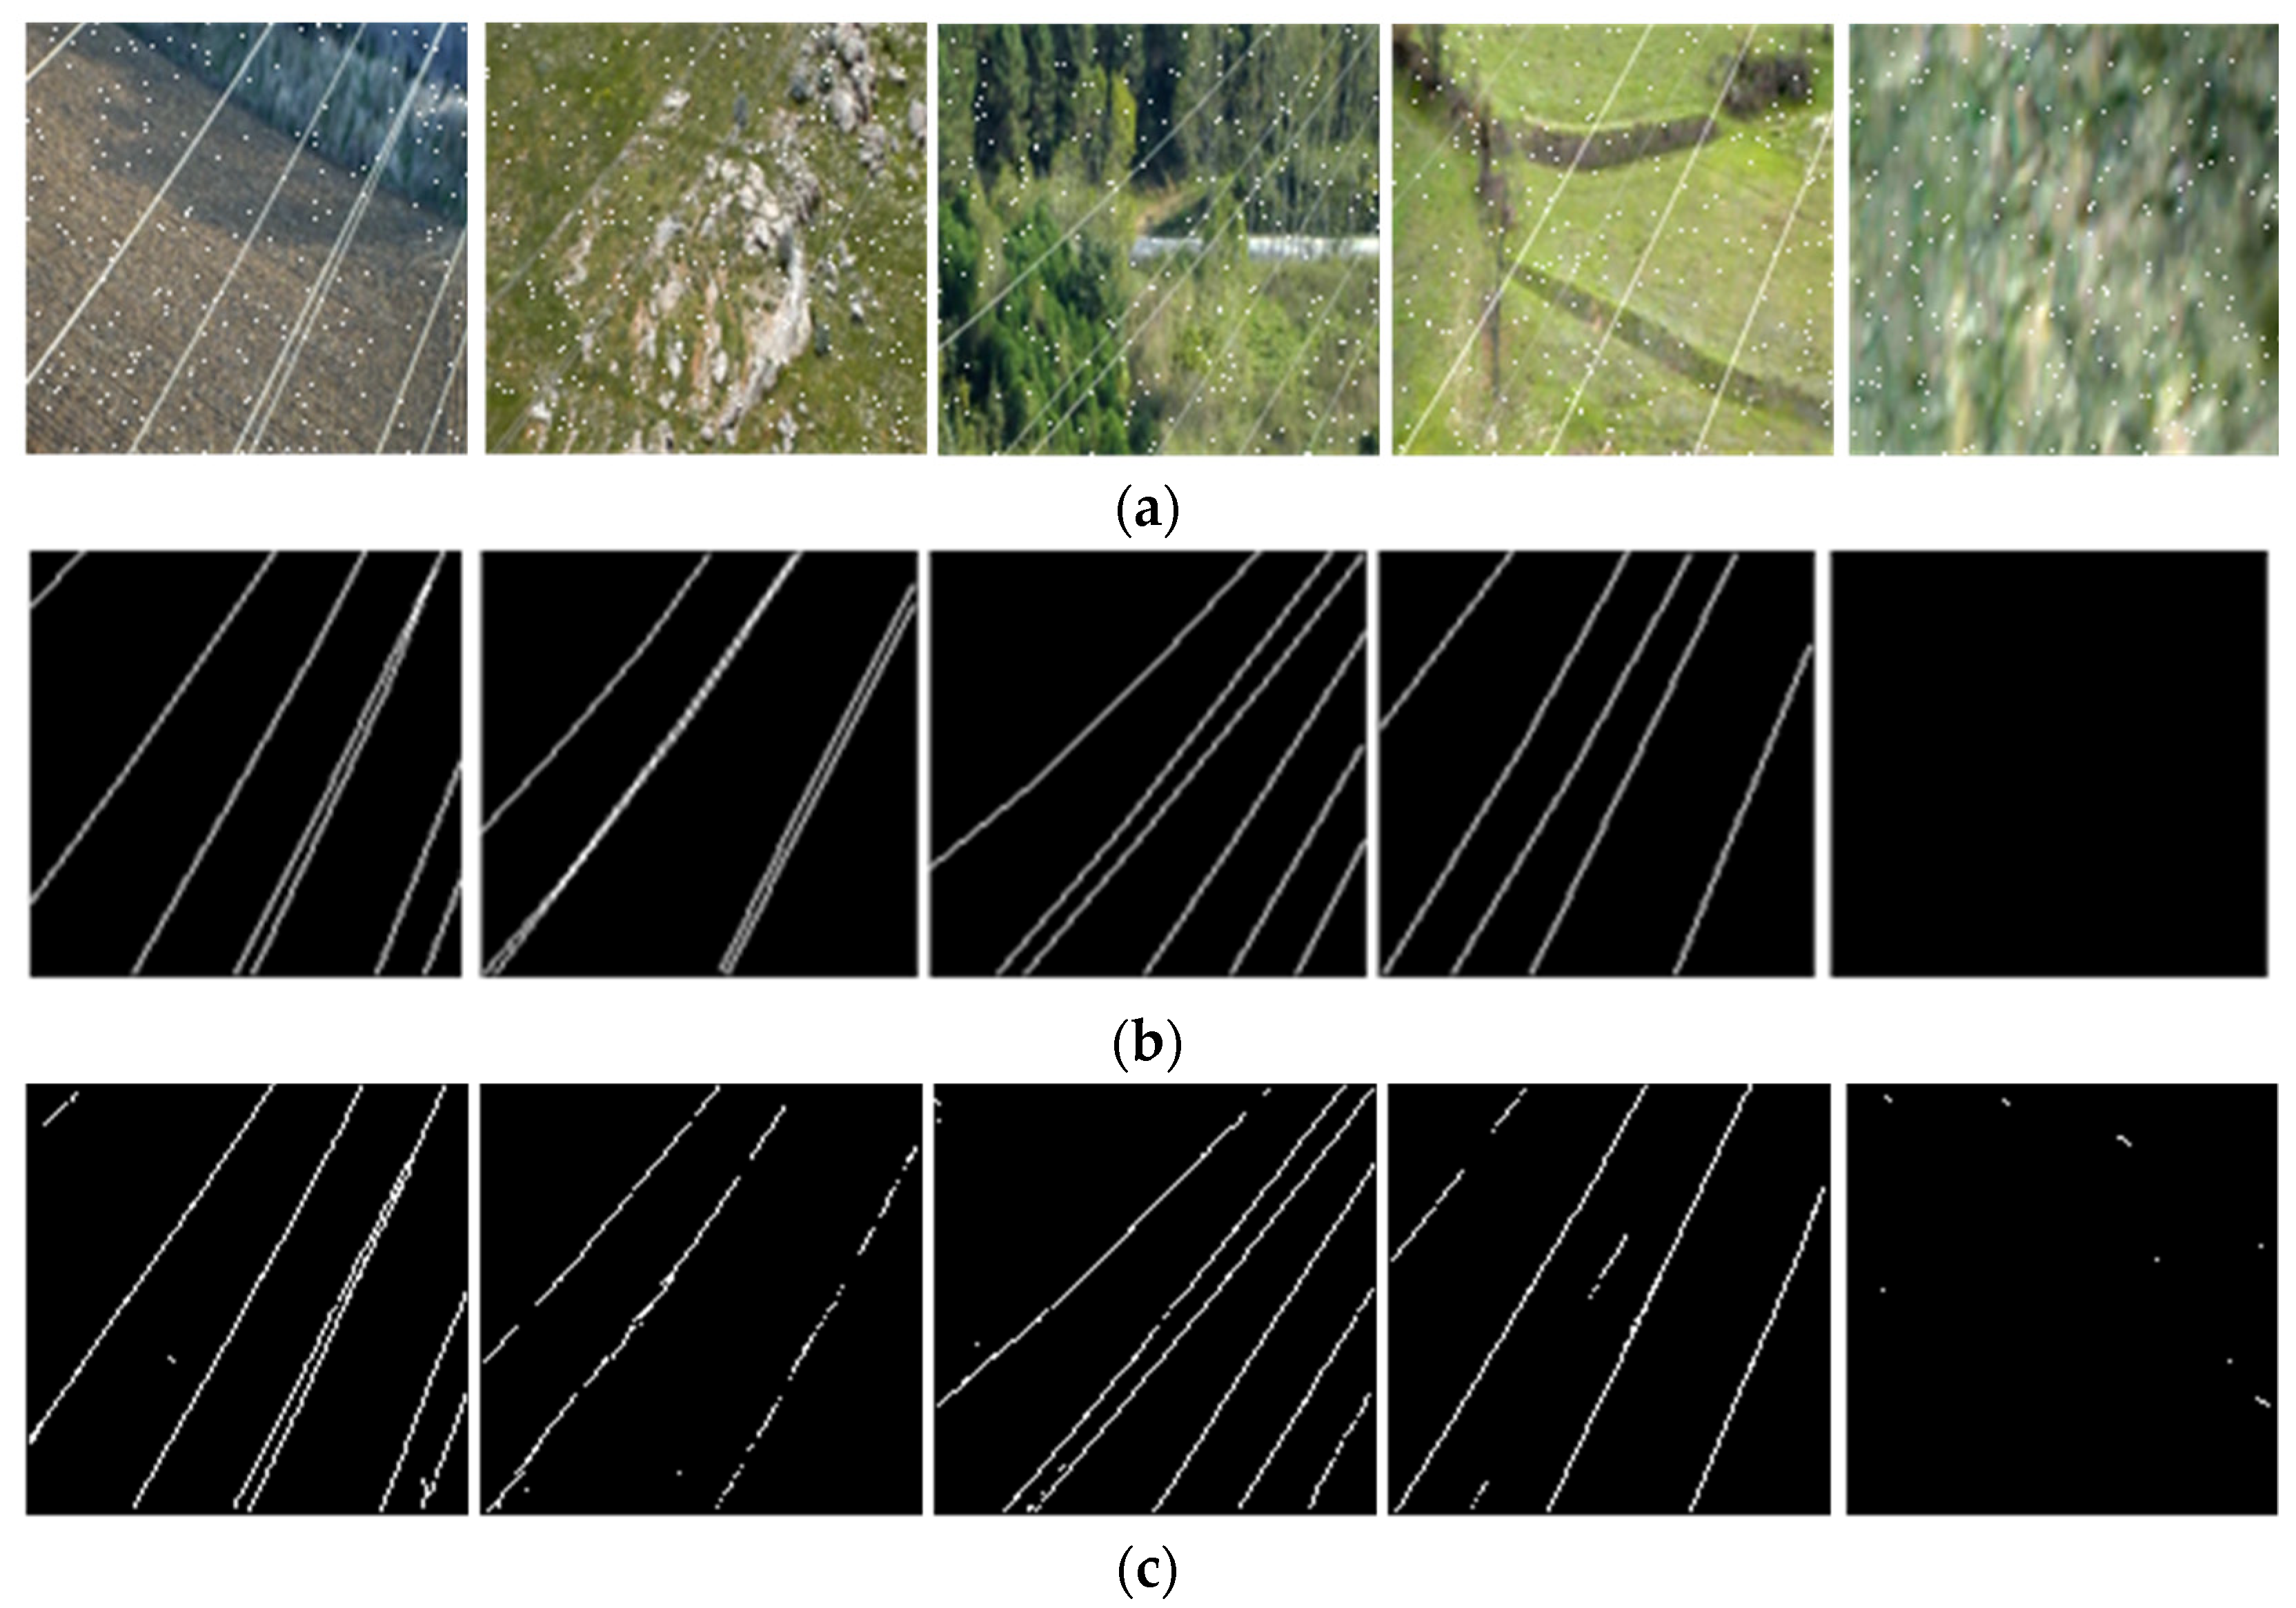
5.1.3. Snow Fall Test

The test results of the proposed PLE method under the snowfall environment are shown in Figure 8. Power line images in a snowfall environment are shown in Figure 8a. The ground truth of power line labels are shown in Figure 8b. The prediction results of the proposed method are shown in Figure 8c. The first four images show power line scene images, and the fifth image shows non-power line scene images (order from left to right). The snowfall environment brings certain difficulties to the PLE, so there are slight discontinuities and missed detection in the second image, discontinuities in the fourth image, and a small number of snowflakes are falsely detected in the fifth image as a power line. Although the snowfall has a certain adverse effect on the PLE, the proposed method has a certain robustness in the snowfall environment as a whole.

5.1.4. Motion Blur Test

The test results of the proposed PLE method in the motion blur scenario are shown in Figure 9. Power line images in the motion blur scenario are shown in Figure 9a. The ground truth of power line labels are shown in Figure 9b. The prediction results of the proposed method are shown in Figure 9c. The first four images show power line scene images, and the fifth image shows non-power line scene images (order from left to right). Motion blur brings certain difficulties to the extraction of power lines, so the second image is misidentified as having no power lines, and there are intermittent problems in the third and fourth images. Although motion blur has a certain adverse effect on the PLE, overall the method has a certain robustness in motion blur scenarios.

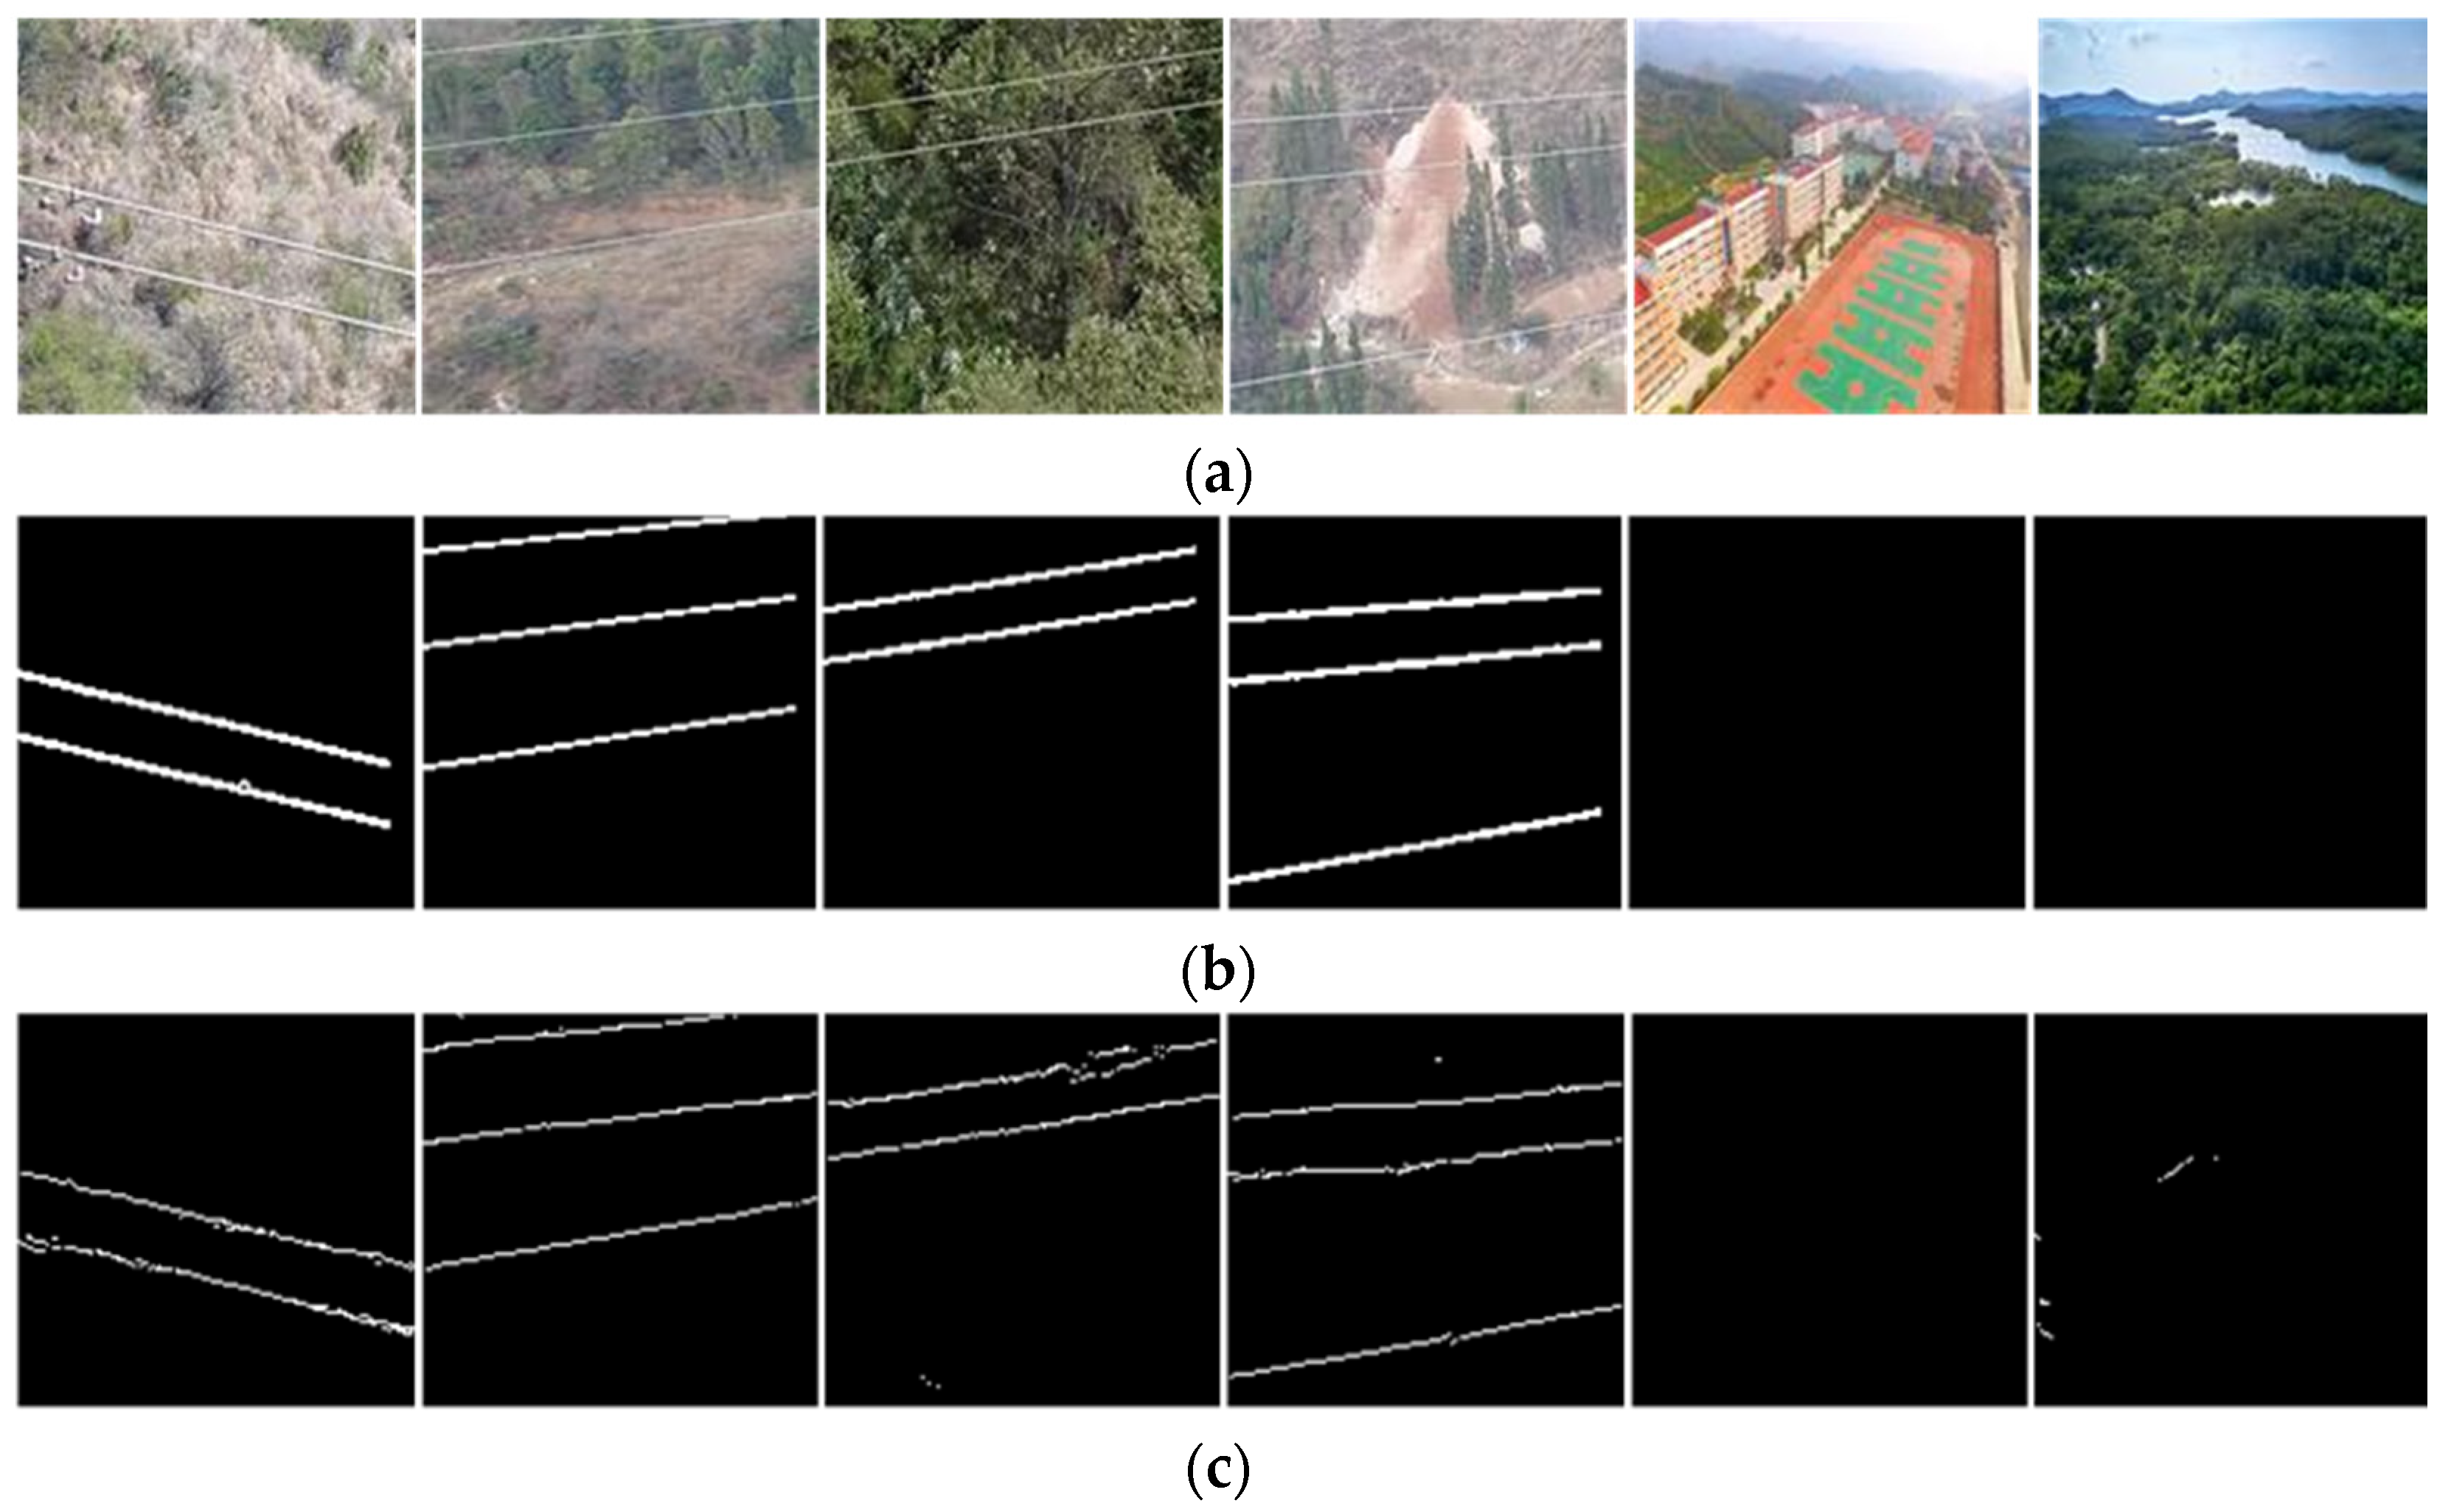
5.2. Generalization Test

In order to verify the applicability in a new environment, six power line images without the data sets are used to test the generalization of the proposed method. The performance metrics of them are shown in Table 5. Compared with the normal scene, the bias of the three metrics is −0.68%, −14.51%, and −1.62%, respectively. To summarize, the proposed method has a better generalization, except for a slightly lower MIOU value. In order to evaluate the performance more clearly, the evaluation results of tested images are shown in Figure 10.
The generalization test results of the proposed PLE are shown in Figure 10. The tested images are shown in Figure 10a, the ground truths are shown in Figure 10b and the prediction results are shown in Figure 10c. The first four contain the power line scene, and the last two do not contain power line scene (order from left to right). The power lines are completely extracted in the first four images, but the details of the power lines need to be optimized. Non-power lines are falsely detected in the fifth image. Overall, the generalization performance of power lines is acceptable.

6. Conclusions

In this paper, a deep learning model is introduced into the PLE process, and a novel method based on conditional constraints is proposed. The main task is power line extraction based on deep learning, and the auxiliary task is power line scene recognition based on the encoding–decoding structure of the semantic segmentation model. Auxiliary task is used as the conditional constraint of the main task, which solves the problem that small edge lines are extracted from the scene images without power lines. Comparing the proposed model with seven common semantic segmentation methods, it achieves better results on the PA, MIoU and FWIoU.
Power lines are small target objects in aerial images, occupying very few pixels, and the features that can be extracted are limited. Due to the influence of factors such as environment and illumination, some power lines are invisible. Therefore, the semantic segmentation model based on a single data source generally has problems such as low segmentation accuracy and even some power lines cannot be extracted. Although all the power line and non-power line scenarios are correctly recognized on the public dataset. There is false recognition in special scenarios (snow fall in Figure 8 and generalization in Figure 10). In practice, the probability will be higher. The following research can be carried out to weaken this issue. First, the PLE method that integrates multiple data sources could be explored, and multi-modal information could be used to improve the segmentation accuracy of methods on small targets and weak feature objects. Second, a multi-class semantic segmentation model could be explored based on the power line scene. We not only extract the power line and the background image, but also segment the specific background such as forests, rivers, fields, etc., establish some new databases, and propose new methods. Third, more stable and active disturbance rejection UAV trajectory-tracking methods could be studied to obtain a better image capture effect, and reduce motion blur in aerial images.

Author Contributions

Conceptualization, methodology, validation, writing—review and editing, supervision, project administration, K.Z.; software, formal analysis, investigation, resources, data curation, visualization, writing—original draft, Z.J. All authors have read and agreed to the published version of the manuscript.

Funding

This research received no external funding.

Data Availability Statement

The data that support the findings of this study are openly available in [Mendeley Data] at [https://data.mendeley.com/datasets/n6wrv4ry6v/8] and [Mendeley Data] at [https://data.mendeley.com/datasets/twxp8xccsw/9]. The data partly support for generalization test are openly available in [Github] at [https://github.com/SnorkerHeng/PLD-UAV] (all above mentioned accessed on 14 June 2020).

Conflicts of Interest

The authors declare no conflict of interest.

References

  1. Jenssen, R.; Roverso, D. Automatic autonomous vision-based power line inspection: A review of current status and the potential role of deep learning. Int. J. Electr. Power Energy Syst. 2018, 99, 107–120. [Google Scholar]
  2. Liu, M.; Li, Z.; Li, Y.; Liu, Y. A fast and accurate method of power line intelligent inspection based on edge computing. IEEE Trans. Instrum. Meas. 2022, 71, 3506512. [Google Scholar] [CrossRef]
  3. Yang, L.; Fan, J.; Liu, Y.; Li, E.; Peng, J.; Liang, Z. A review on state-of-the-art power line inspection techniques. IEEE Trans. Instrum. Meas. 2020, 69, 9350–9365. [Google Scholar] [CrossRef]
  4. Zhou, Z.; Zhang, C.; Xu, C.; Xiong, F.; Zhang, Y.; Umer, T. Energy-effificient industrial internet of UAVs for power line inspection in smart grid. IEEE Trans. Ind. Inform. 2018, 14, 2705–2714. [Google Scholar] [CrossRef]
  5. Silano, G.; Baca, T.; Penicka, R.; Liuzza, D.; Saska, M. Power line inspection tasks with multi-aerial power line inspection tasks with multi-aerial logic specifications. IEEE Robot. Autom. Lett. 2021, 6, 4169–4176. [Google Scholar] [CrossRef]
  6. Sumagayan, M.; Premachandra, C.; Mangorsi, R.; Salaan, C.; Premachandra, H.; Kawanaka, H. Detecting power lines using point instance network for distribution line inspection. IEEE Access 2021, 9, 107998–108008. [Google Scholar] [CrossRef]
  7. Shuang, F.; Chen, X.; Li, Y.; Wang, Y.; Miao, N.; Zhou, Z. PLE: Power Line Extraction Algorithm for UAV-Based Power Inspection; IEEE: Piscataway, NJ, USA, 2022. [Google Scholar] [CrossRef]
  8. Xu, C.; Li, Q.; Zhou, Q.; Zhang, S.; Yu, D.; Ma, Y. Power line-guided automatic electric transmission line inspection system. IEEE Trans. Instrum. Meas. 2022, 71, 3512118. [Google Scholar] [CrossRef]
  9. Zhang, X.; Xiao, G.; Gong, K.; Ye, P. Power line detection for aircraft safety based on image processing techniques: Advances and recommendations. IEEE Aerosp. Electron. Syst. Mag. 2019, 34, 54–62. [Google Scholar] [CrossRef]
  10. Zhao, L.; Wang, X.; Yao, H.; Tian, M. Survey of power line extraction methods based on visible light aerial image. Power Syst. Technol. 2021, 45, 1536–1546. [Google Scholar]
  11. Zou, K.; Jiang, Z.; Zhang, Q. Research progresses and trends of power line extraction based on machine learning. In Proceedings of the 2nd International Symposium on Computer Engineering and Intelligent Communications (ISCEIC), Nanjing, China, 6–8 August 2021; pp. 211–215.
  12. Tong, W.; Li, B.; Yuan, J.; Zhao, S. Transmission line extraction and recognition from natural complex background. In Proceedings of the 2009 International Conference on Machine Learning and Cybernetics (ICMLC), Baoding, China, 12–15 July 2009; pp. 2473–2477. [Google Scholar]
  13. Cao, W.; Yang, X.; Zhu, L.; Han, J.; Wang, T. Power line detection based on symmetric partial derivative distribution prior. In Proceedings of the 2013 IEEE International Conference on Information and Automation (ICIA), Yinchuan, China, 26–28 August 2013; pp. 767–772. [Google Scholar]
  14. Gerke, M.; Seibold, P. Visual inspection of power lines by UAS. In Proceedings of the 2014 International Conference and Exposition on Electrical and Power Engineering (EPE), Iasi, Romania, 16–18 October 2014; pp. 1077–1082. [Google Scholar]
  15. Tian, F.; Wang, Y.; Zhu, L. Power line recognition and tracking method for UAVs inspection. In Proceedings of the 2015 IEEE International Conference on Information and Automation, Lijiang, China, 8–10 August 2015; pp. 2136–2141. [Google Scholar]
  16. Alpatov, B.; Babayan, P.; Shubin, N. Robust line detection using Weighted Radon Transform. In Proceedings of the 2014 3rd Mediterranean Conference on Embedded Computing (MECO), Budva, Montenegro, 15–19 June 2014; pp. 148–151. [Google Scholar]
  17. Zhu, L.Y.; Cao, Y.; Han, J.; Du, Y. A double-side filter based power line recognition method for UAV vision system. In Proceedings of the 2013 IEEE International Conference on Robotics and Biometric (ROBIO), Shenzhen, China, 12–14 December 2013; pp. 2655–2660. [Google Scholar]
  18. Chen, Y.; Li, Y.; Zhang, H.; Tong, L.; Cao, Y.; Xue, Z. Automatic power line extraction from high resolution remote sensing imagery based on an improved radon transform. Pattern Recognit. 2016, 49, 174–186. [Google Scholar] [CrossRef]
  19. Zhao, H.; Lei, J.; Wang, X.; Zhao, L.; Tian, M.; Cao, W.; Yao, H.; Cai, B. Power line identification algorithm for aerial image in complex background. Bull. Surv. Mapp. 2019, 0, 28–32. [Google Scholar]
  20. Zhao, L.; Wang, X.; Yao, H.; Tian, M.; Gong, L. Power line extraction algorithm based on local context information. High Volt. Eng. 2021, 47, 2553–2563. [Google Scholar]
  21. Shan, H.; Zhang, J.; Cao, X.; Li, X.; Wu, D. Multiple auxiliaries assisted airborne power line detection. IEEE Trans. Ind. Electron. 2017, 64, 4810–4819. [Google Scholar] [CrossRef]
  22. Pan, C.; Shan, H.; Cao, X.; Li, X.; Wu, D. Leveraging spatial context disparity for power line detection. Cognit. Comput. 2017, 9, 766–779. [Google Scholar] [CrossRef]
  23. Zhang, J.; Shan, H.; Cao, X.; Yan, P.; Li, X. Pylon line spatial correlation assisted transmission line detection. IEEE Trans. Aerosp. Electron. Syst. 2014, 50, 2890–2905. [Google Scholar] [CrossRef]
  24. Luo, X.; Zhang, J.; Cao, X.; Yan, P.; Li, X. Object-aware power line detection using color and near-infrared images. IEEE Trans. Aerosp. Electron. Syst. 2014, 50, 1374–1389. [Google Scholar] [CrossRef]
  25. Zhao, W.; Dong, Q.; Zuo, Z. A method combining line detection and semantic segmentation for power line extraction from unmanned aerial vehicle images. Remote Sens. 2022, 14, 1367. [Google Scholar] [CrossRef]
  26. Gerek, Ö.; Benligiray, B. Visualization of power lines recognized in aerial images using deep learning. In Proceedings of the 26th IEEE Signal Processing and Communications Applications Conference, Izmir, Turkey, 2–5 May 2018; pp. 1–4. [Google Scholar]
  27. Gubbi, J.; Varghese, A.; Balamuralidhar, P. A new deep learning architecture for detection of long linear infrastructure. In Proceedings of the 2017 Fifteenth IAPR International Conference on Machine Vision Applications, Nagoya, Japan, 8–12 May 2017; pp. 207–210. [Google Scholar]
  28. Pan, C.X.; Cao, X.; Wu, D. Power line detection via background noise removal. In Proceedings of the 2016 IEEE Global Conference on Signal and Information Processing, Washington, DC, USA, 7–9 December 2016; pp. 871–875. [Google Scholar]
  29. Zhu, K.; Xu, C.; Cai, G.; Wei, Y. Fast-PLDN: Fast power line detection network. J. Real-Time Image Process. 2022, 19, 3–13. [Google Scholar] [CrossRef]
  30. Choi, H.; Koo, G.; Kim, B.; Kim, S. Weakly supervised power line detection algorithm using a recursive noisy label update with refined broken line segments. Expert Syst. Appl. 2021, 165, 113895.1–113895.9. [Google Scholar] [CrossRef]
  31. Li, Y.; Pan, C.; Cao, X.; Wu, D. Power line detection by pyramidal patch classification. IEEE Trans. Emerg. Top. Comput. Intell. 2018, 3, 416–426. [Google Scholar] [CrossRef]
  32. Xu, G.; Li, G. Research on lightweight neural network of aerial power line image segmentation. J. Image Gr. 2021, 26, 2605–2618. [Google Scholar]
  33. Nguyen, V.; Jenssen, R.; Roverso, D. LS-Net: Fast single-shot line-segment detector. Mach. Vis. Appl. 2021, 32, 12. [Google Scholar] [CrossRef]
  34. Gao, Z.; Yang, G.; Li, E.; Liang, Z.; Guo, R. Efficient parallel branch network with multi-scale feature fusion for real-time overhead power line segmentation. IEEE Sens. J. 2021, 21, 12220–12227. [Google Scholar] [CrossRef]
  35. Liu, J.; Li, Y.; Gong, Z.; Liu, X.; Zhou, Y. Power line recognition method via fully convolutional network. J. Image Gr. 2020, 25, 956–966. [Google Scholar]
  36. Yetgin, Ö.; Benligiray, B.; Gerek, Ö. Power line recognition from aerial images with deep learning. IEEE Trans. Aerosp. Electron. Syst 2019, 55, 2241–2252. [Google Scholar] [CrossRef]
  37. Li, Y.; Xiao, Z.; Zhen, X.; Cao, X. Attentional information fusion networks for cross-scene power line detection. IEEE Geosci. Remote Sens. Lett. 2019, 16, 1635–1639. [Google Scholar] [CrossRef]
  38. Zhang, H.; Yang, W.; Yu, H.; Zhang, H.; Xia, G. Detecting power lines in UAV images with convolutional features and structured constraints. Remote Sens. 2019, 11, 1342. [Google Scholar] [CrossRef]
  39. He, K.; Zhang, X.; Ren, S.; Sun, J. Deep residual learning for image recognition. In Proceedings of the IEEE conference on Computer Vision and Pattern Recognition (CVPR), Las Vegas, NV, USA, 27–30 June 2016; pp. 770–778. [Google Scholar]
  40. Sanderson, E.; Matuszewski, B.J. FCN-transformer feature fusion for polyp segmentation. Lect. Notes Comput. Sci. 2022, 13413, 892–907. [Google Scholar] [CrossRef]
  41. Chen, Z.; Duan, Y.; Wang, W.; He, J.; Lu, T.; Dai, J.; Qiao, Y. Vision transformer adapter for dense predictions. arXiv 2022, arXiv:2205.08534v2. [Google Scholar]
  42. Shi, W.; Xu, J. SSformer: A lightweight transformer for semantic segmentation. arXiv 2022, arXiv:2208.02034v1. [Google Scholar]
  43. Yetgin, Ö.; Gerek, Ö. Ground Truth of Powerline Dataset (Infrared-IR and Visible Light-VL), Mendeley Data, V9. Available online: https://data.mendeley.com/datasets/twxp8xccsw/9 (accessed on 26 June 2019). [CrossRef]
  44. Garcia, A.; Escolano, S.; Oprea, S.; Martinez, V.; Rodriguez, J. A review on deep learning techniques applied to semantic segmentation. arXiv 2017, arXiv:1704.06857. [Google Scholar]
  45. Long, J.; Shelhamer, E.; Darrell, T. Fully convolutional networks for semantic segmentation. IEEE Trans. Pattern Anal. Mach. Intell. 2015, 39, 640–651. [Google Scholar]
  46. Badrinarayanan, V.; Kendall, A.; Cipolla, R. SegNet: A deep convolutional encoder-decoder architecture for image segmentation. IEEE Trans. Pattern Anal. Mach. Intell. 2017, 39, 2481–2495. [Google Scholar] [CrossRef]
  47. Ronneberger, O.; Fischer, P.; Brox, T. U-net: Convolutional networks for biomedical image segmentation. Lect. Notes Comput. Sci. 2015, 9351, 234–241. [Google Scholar]
  48. Schlemper, J.; Oktay, O.; Schaap, M.; Heinrich, M.; Kainz, B.; Glocker, B.; Rueckert, D. Attention gated networks: Learning to leverage salient regions in medical images. Med. Image Anal. 2019, 53, 197–207. [Google Scholar] [CrossRef] [PubMed]
  49. Cai, Y.; Wang, Y. MA-Unet: An improved version of Unet based on multi-scale and attention mechanism for medical image segmentation, In Proceedings of the 3rd International conference on Electronics and Communication Network and Computer Technology (ECNCT), Harbin, China, 7 March 2022; Volume 12167. [CrossRef]
Figure 1. Results of traditional deep learning based PLE in practice. (a) Aerial images. (b) Ground Truth. (c) Extract results.
Remotesensing 14 04575 g001
Figure 2. The architecture of the proposed PLE model. Each colored box corresponds to a multi- channel feature map. The number of channels is denoted on top of the colored box. The x-y size is listed at the bottom of the colored box. Box without numbers means it has the same channel and size with the same colored box. The colored arrows and lines denote the different operations.
Remotesensing 14 04575 g002
Figure 3. The PLE results of datasets containing power lines. The more similar the extracted images (cj) with the GT (b) denotes the better performance of the method used.
Remotesensing 14 04575 g003
Figure 4. The PLE results of datasets without power lines. Other methods false detected edge lines more or less, the non-powerline scenarios are correctly recognized by the proposed method.
Remotesensing 14 04575 g004
Figure 5. Comparison experiment results of power line extraction.
Remotesensing 14 04575 g005
Figure 6. Test results in a foggy environment. The first four show power line scene images, and the last one shows non-power line scene images (order from left to right). (a) Power line images in a foggy environment. (b) Ground Truth. (c) The predicted results of the proposed method.
Remotesensing 14 04575 g006aRemotesensing 14 04575 g006b
Figure 7. Test results in strong light environment. The first four show power line scene images, and the last one shows non-power line scene images (order from left to right). (a) Power line images in a strong light environment. (b) Ground Truth. (c) The predicted results of the proposed method.
Remotesensing 14 04575 g007
Figure 8. Test results in a snowfall environment. The first four show power line scene images, and the last one shows non-power line scene images (order from left to right). (a) Power line images in a snowfall environment. (b) Ground Truth. (c) The prediction results of the proposed method.
Remotesensing 14 04575 g008
Figure 9. Test results in motion blur environment. The first four show power line scene images, and the last one shows non-power line scene images (order from left to right). (a) Power line images in motion blur environment. (b) Ground Truth. (c) The prediction results of the proposed method.
Remotesensing 14 04575 g009
Figure 10. Generalization test results by using the proposed PLE method. The first four contain the power line scene, and the last two do not contain power line scene (order from left to right). (a) Images used for generalization test. (b) Ground truth. (c) Results of the proposed PLE model.
Remotesensing 14 04575 g010
Table 1. Configuration of the experimental environment.
PlatformConfiguration
Operating system64 bit version of Windows 10
Central Processing Unit (CPU) Graphic Processing Unit (GPU)Intel(R) Core(TM) i9-10900k CPU @ 3.70 GHz NVIDIA GeForce RTX 2070 8G
Deep learning frameworkPyTorch1.7
CompilersPyCharm
Scripting languagePython 3.7
Solid State Disk (SSD)500 GB
Table 2. Experimental parameters.
ParametersConfiguration
Input Size128 × 128 × 3
Batch size10
OptimizerAdam
Learning rate0.001
Training epochs50
Table 3. The average inference time of a power line image by using different methods.
PLE MethodsAverage Inference Time (ms)
FCN32s167.78
FCN16s163.65
FCN8s174.83
SegNet225.68
Unet214.27
Attention-Unet227.69
MA-Unet388.05
The proposed383.35
Table 4. The robustness test metrics in the four scenes.
ScenesPAMIOUFWIOU
Foggy97.75%80.90%96.86%
Strong light97.73%80.20%96.85%
Snow fall97.35%53.85%96.33%
motion blur97.71%77.89%96.63%
Table 5. The metrics of generalization test.
MethodPAMIOUFWIOU
The proposed model98.06%70.07%96.26%
Publisher’s Note: MDPI stays neutral with regard to jurisdictional claims in published maps and institutional affiliations.

