

Assessing FY-3E HIRAS-II Radiance Accuracy Using AHI and MERSI-LL
Abstract
:1. Introduction
2. Data Used in the Research
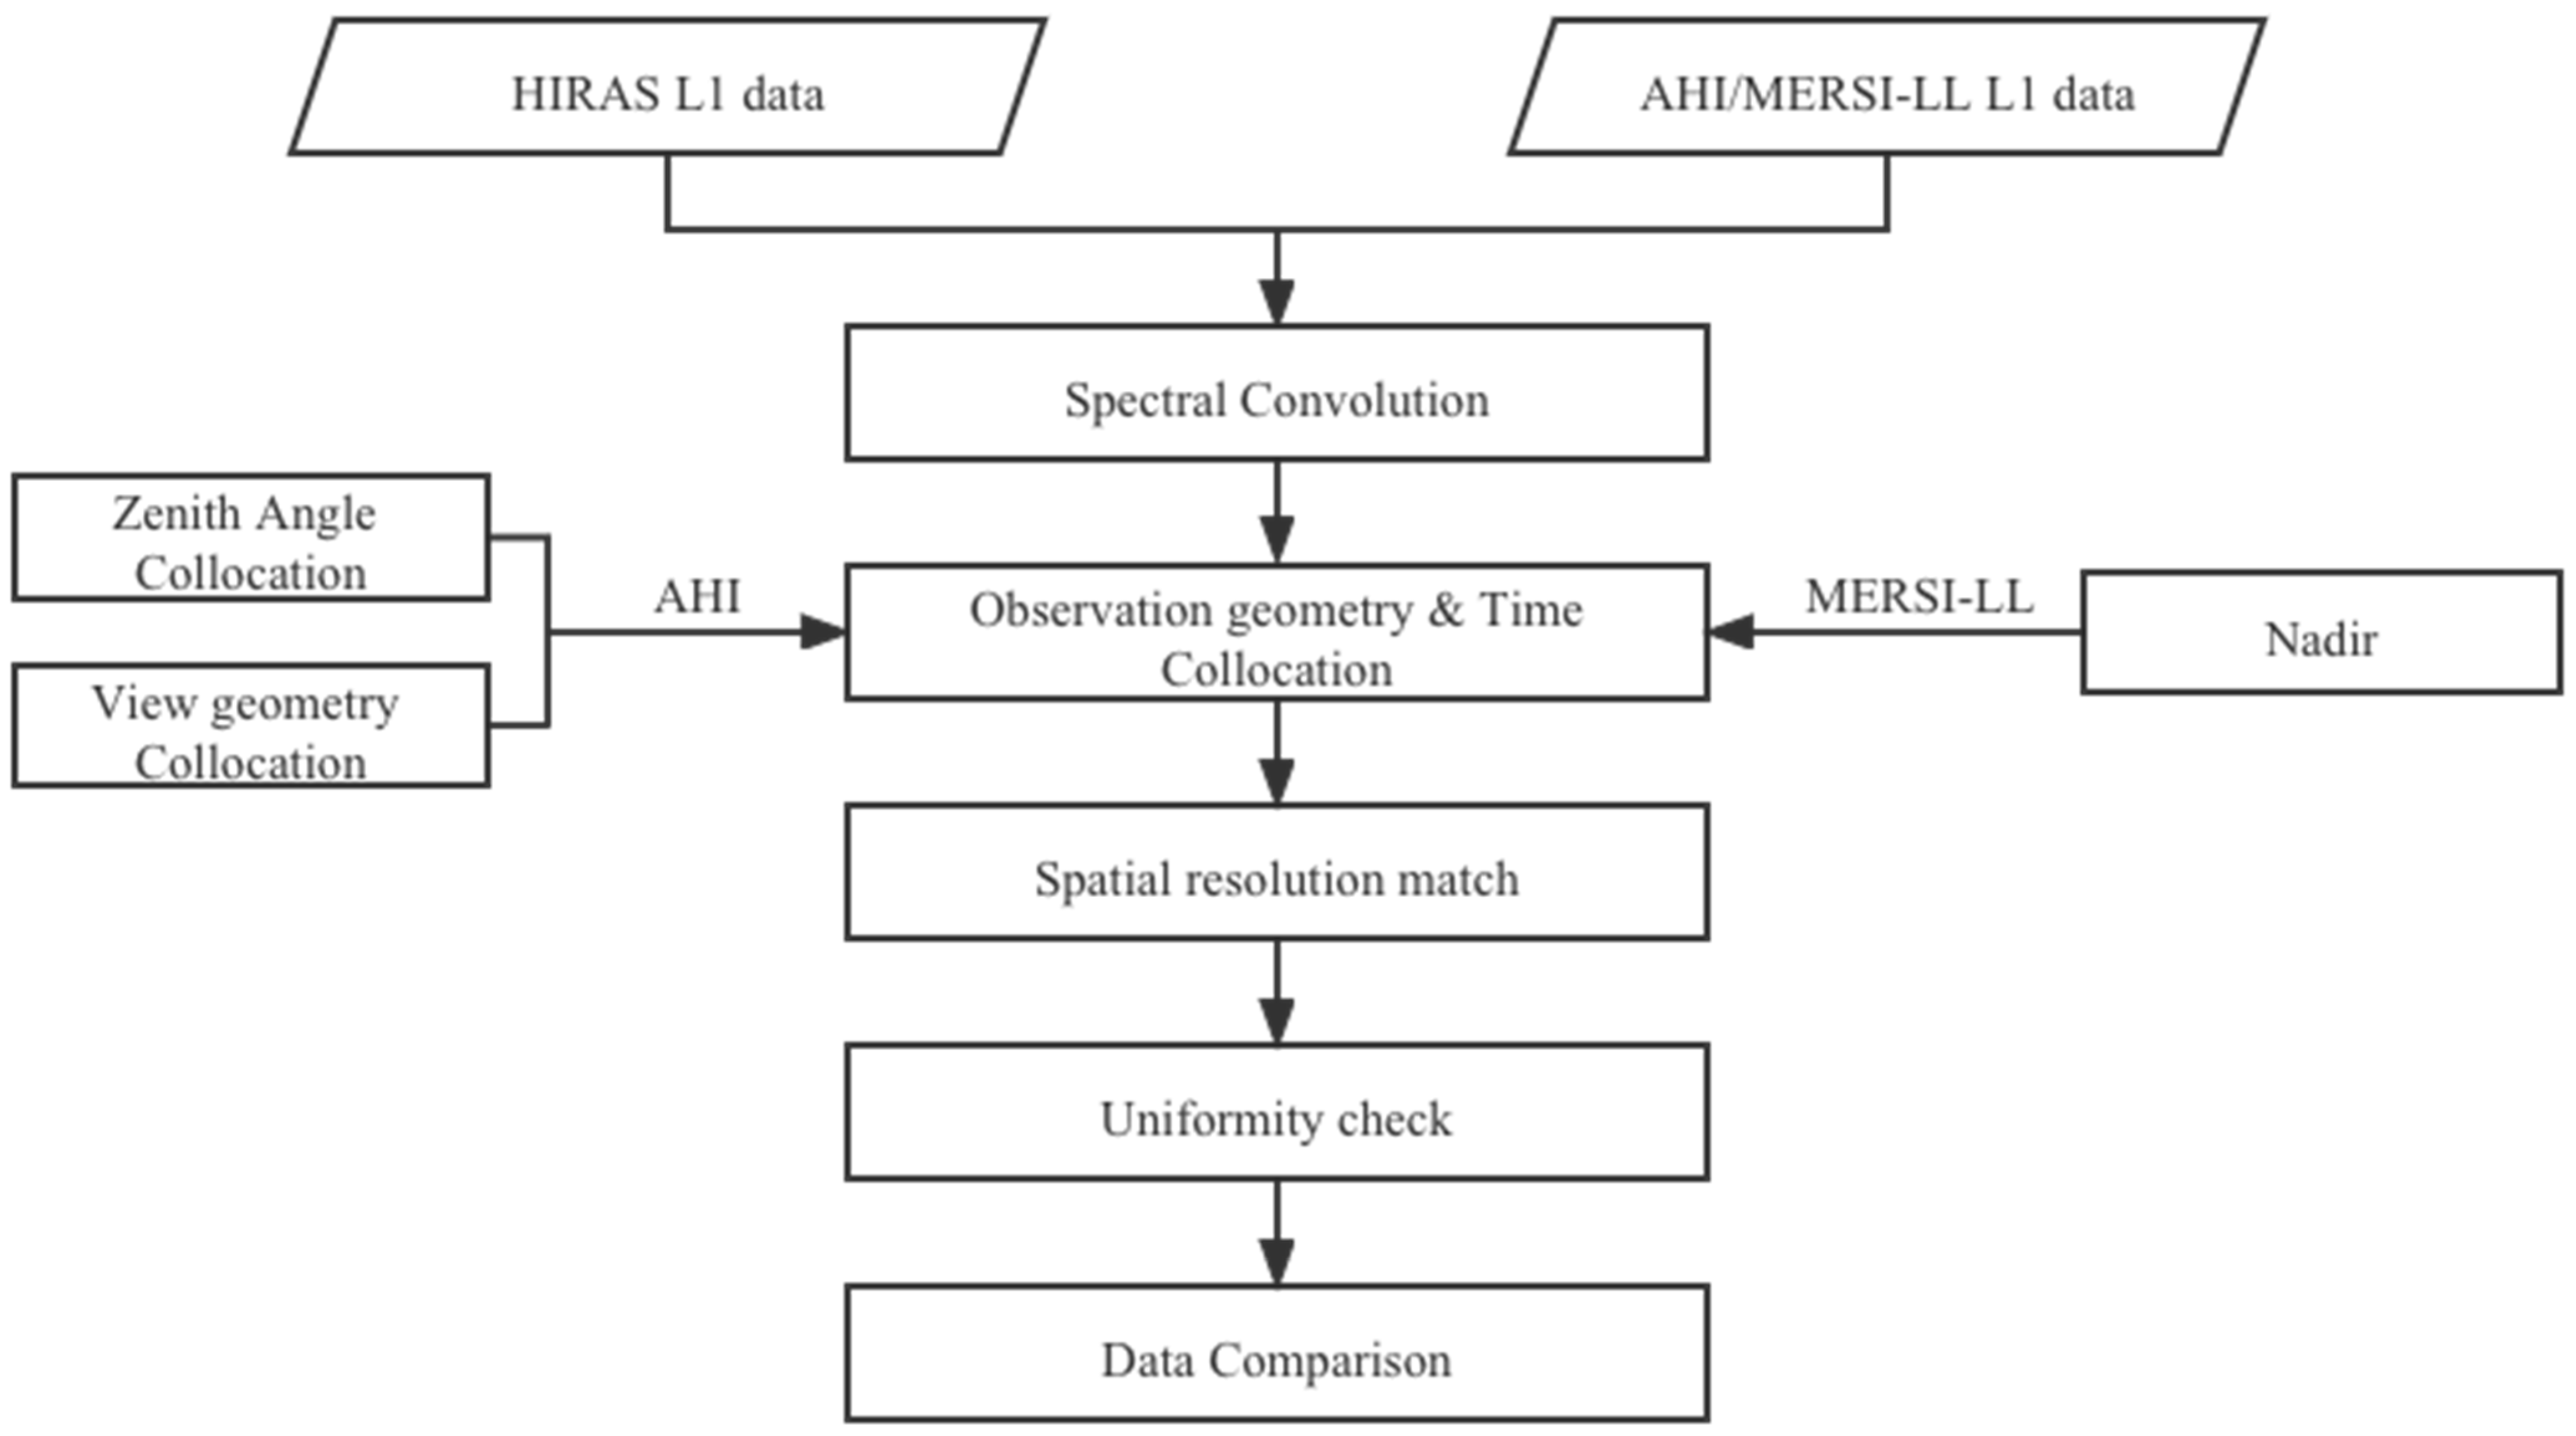
3. Observation Data Matching and Evaluation Method
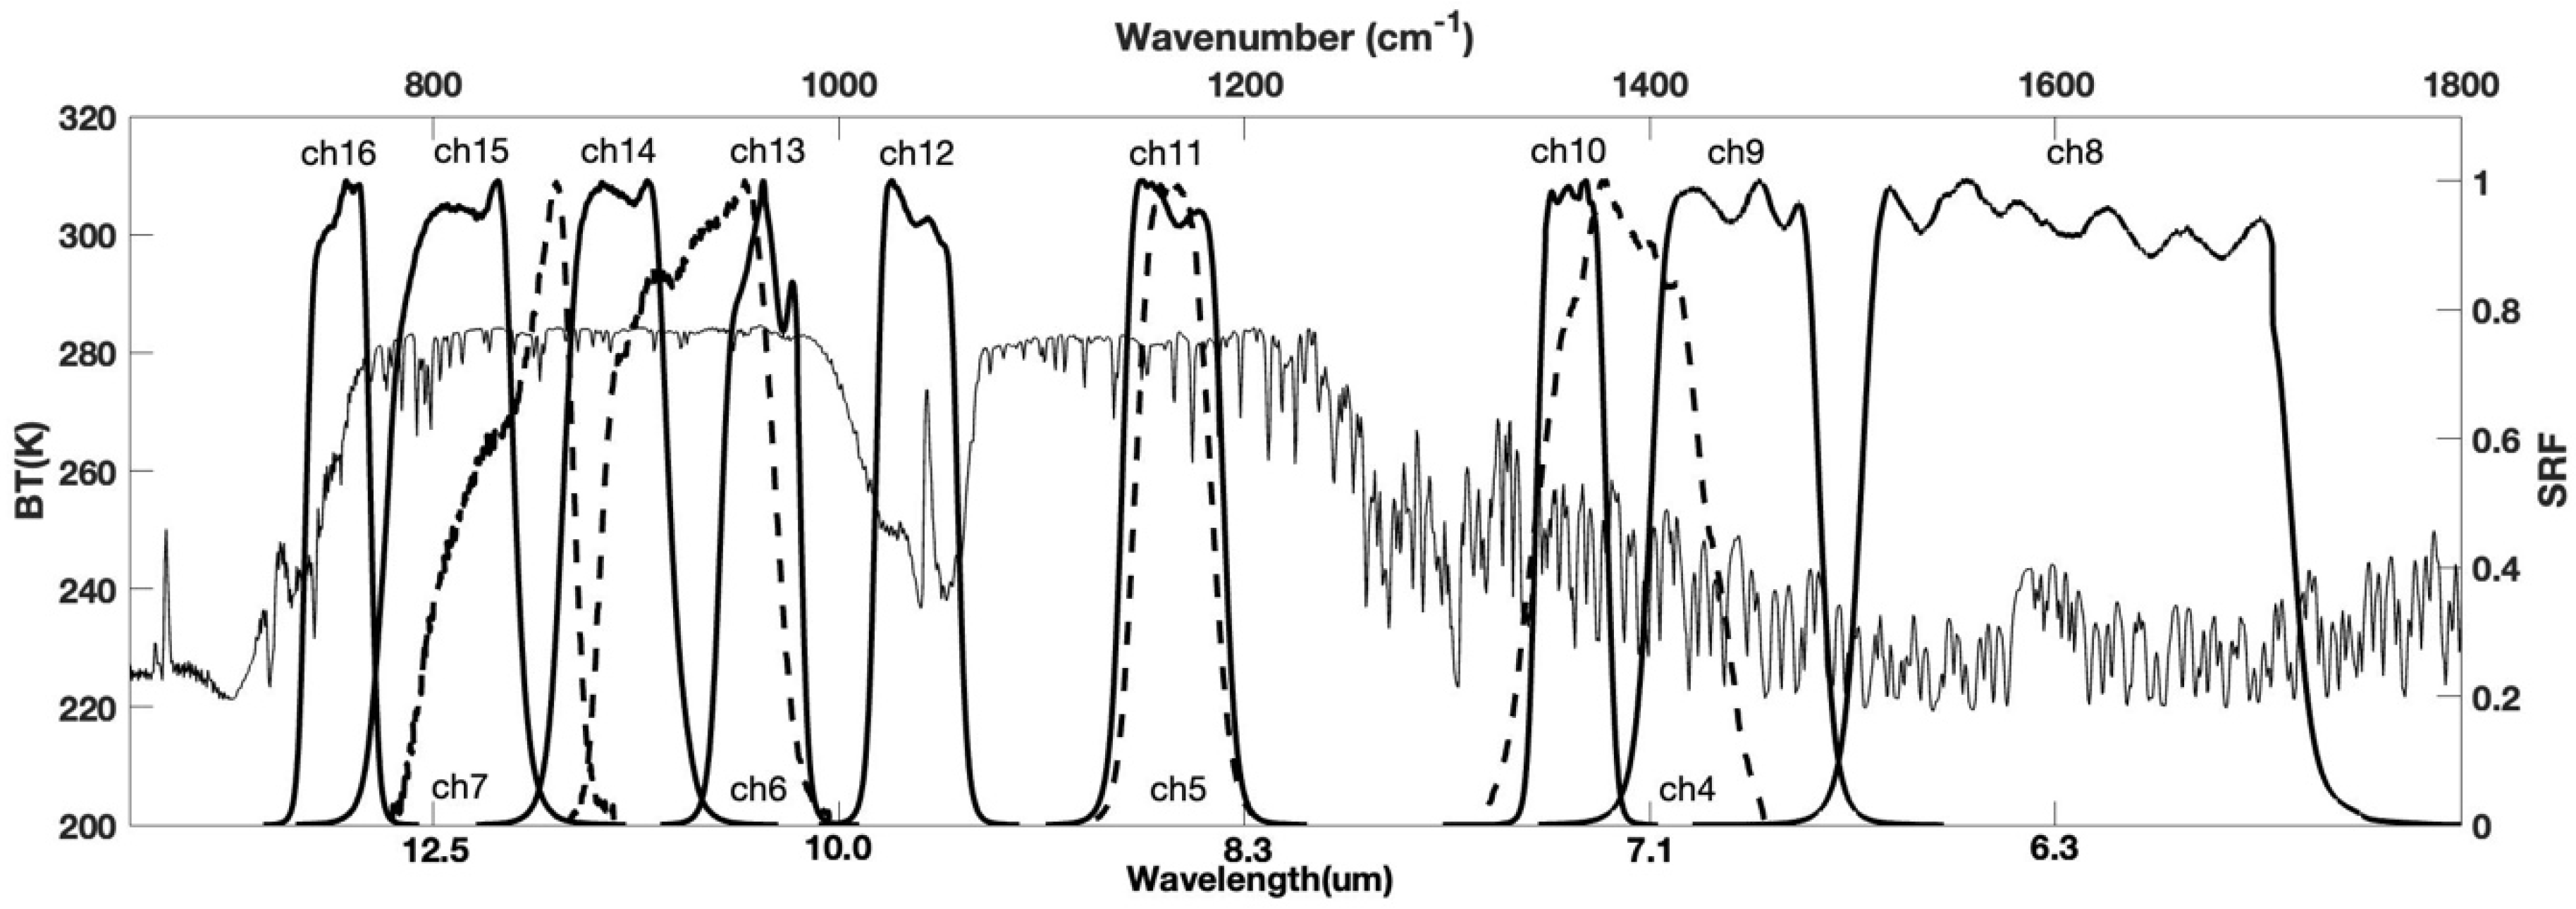
3.1. Spectral Convolution
3.2. Observation Geometry and Temporal Matching
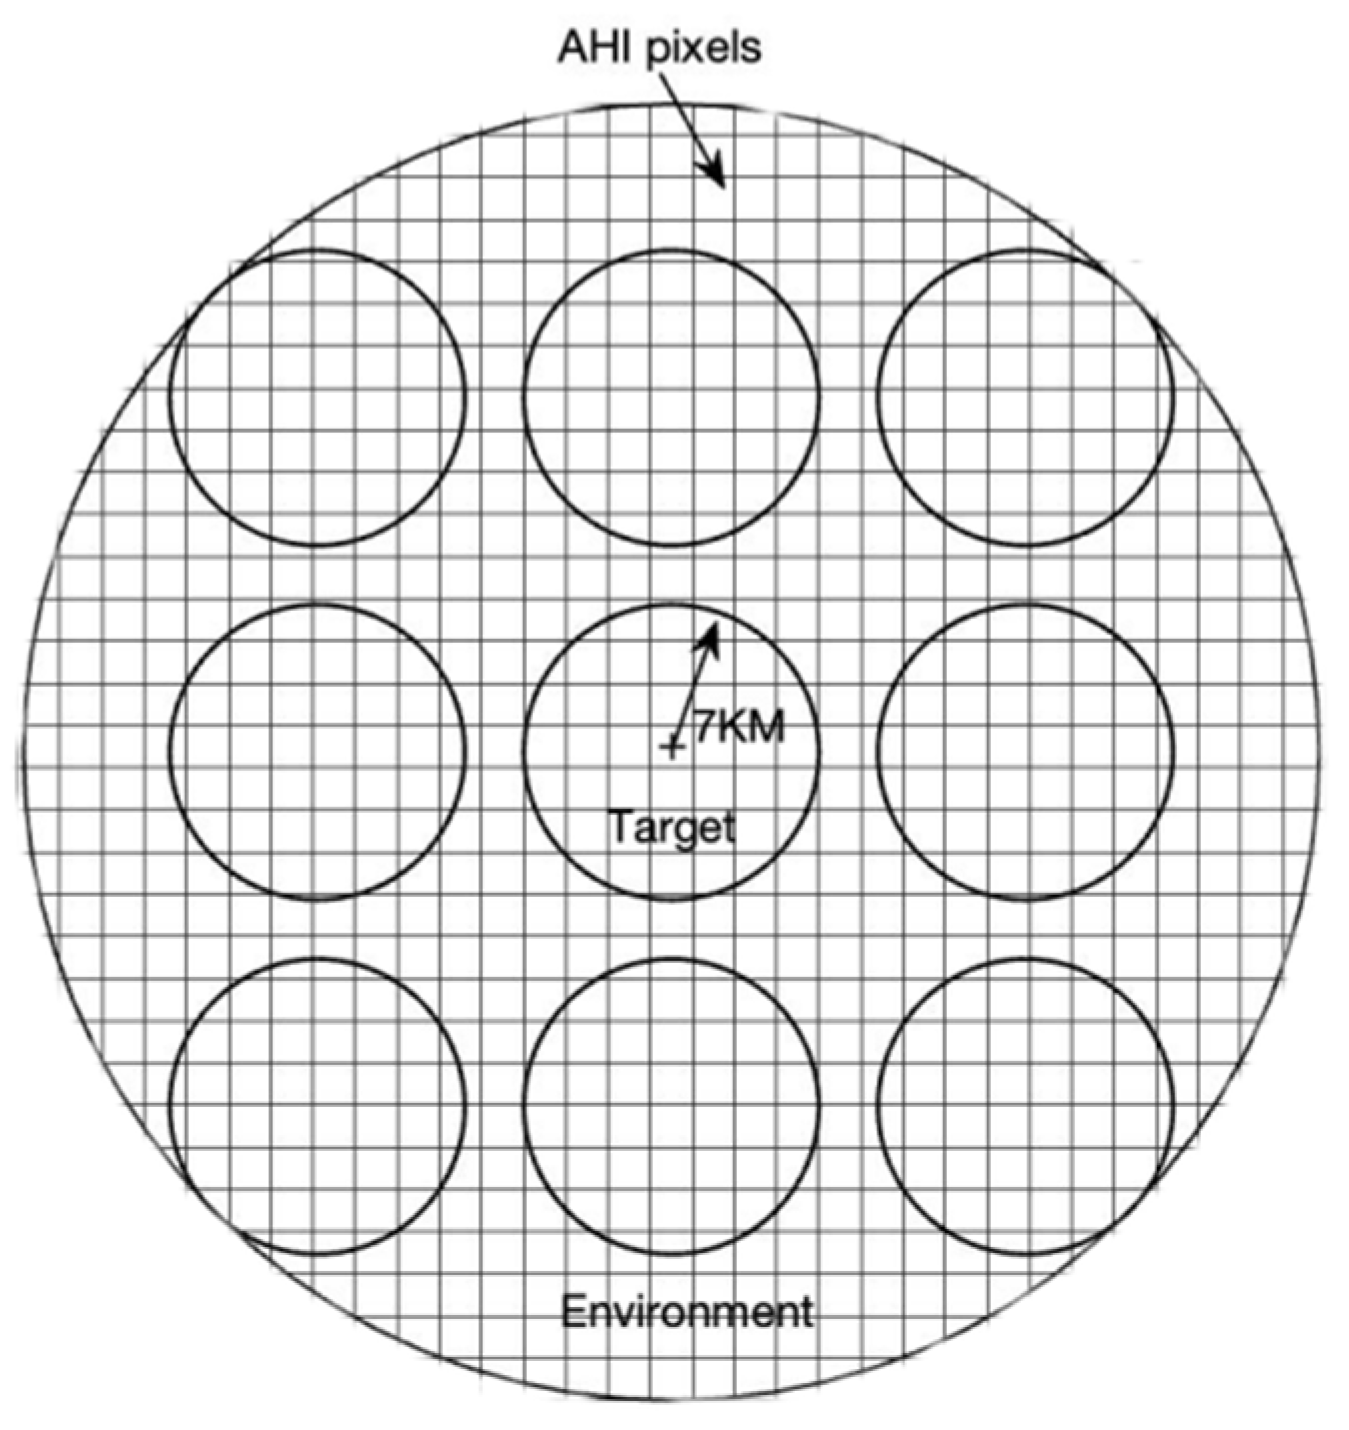
3.3. Spatial Matching and Uniformity Check
3.4. Statistical Calculation
3.5. Matching with MERSI-LL on the Same Platform
4. Results and Discussion
4.1. Comparison of HIRAS-II with AHI
4.2. Comparison of HIRAS-II with MERSI-LL
5. Conclusions
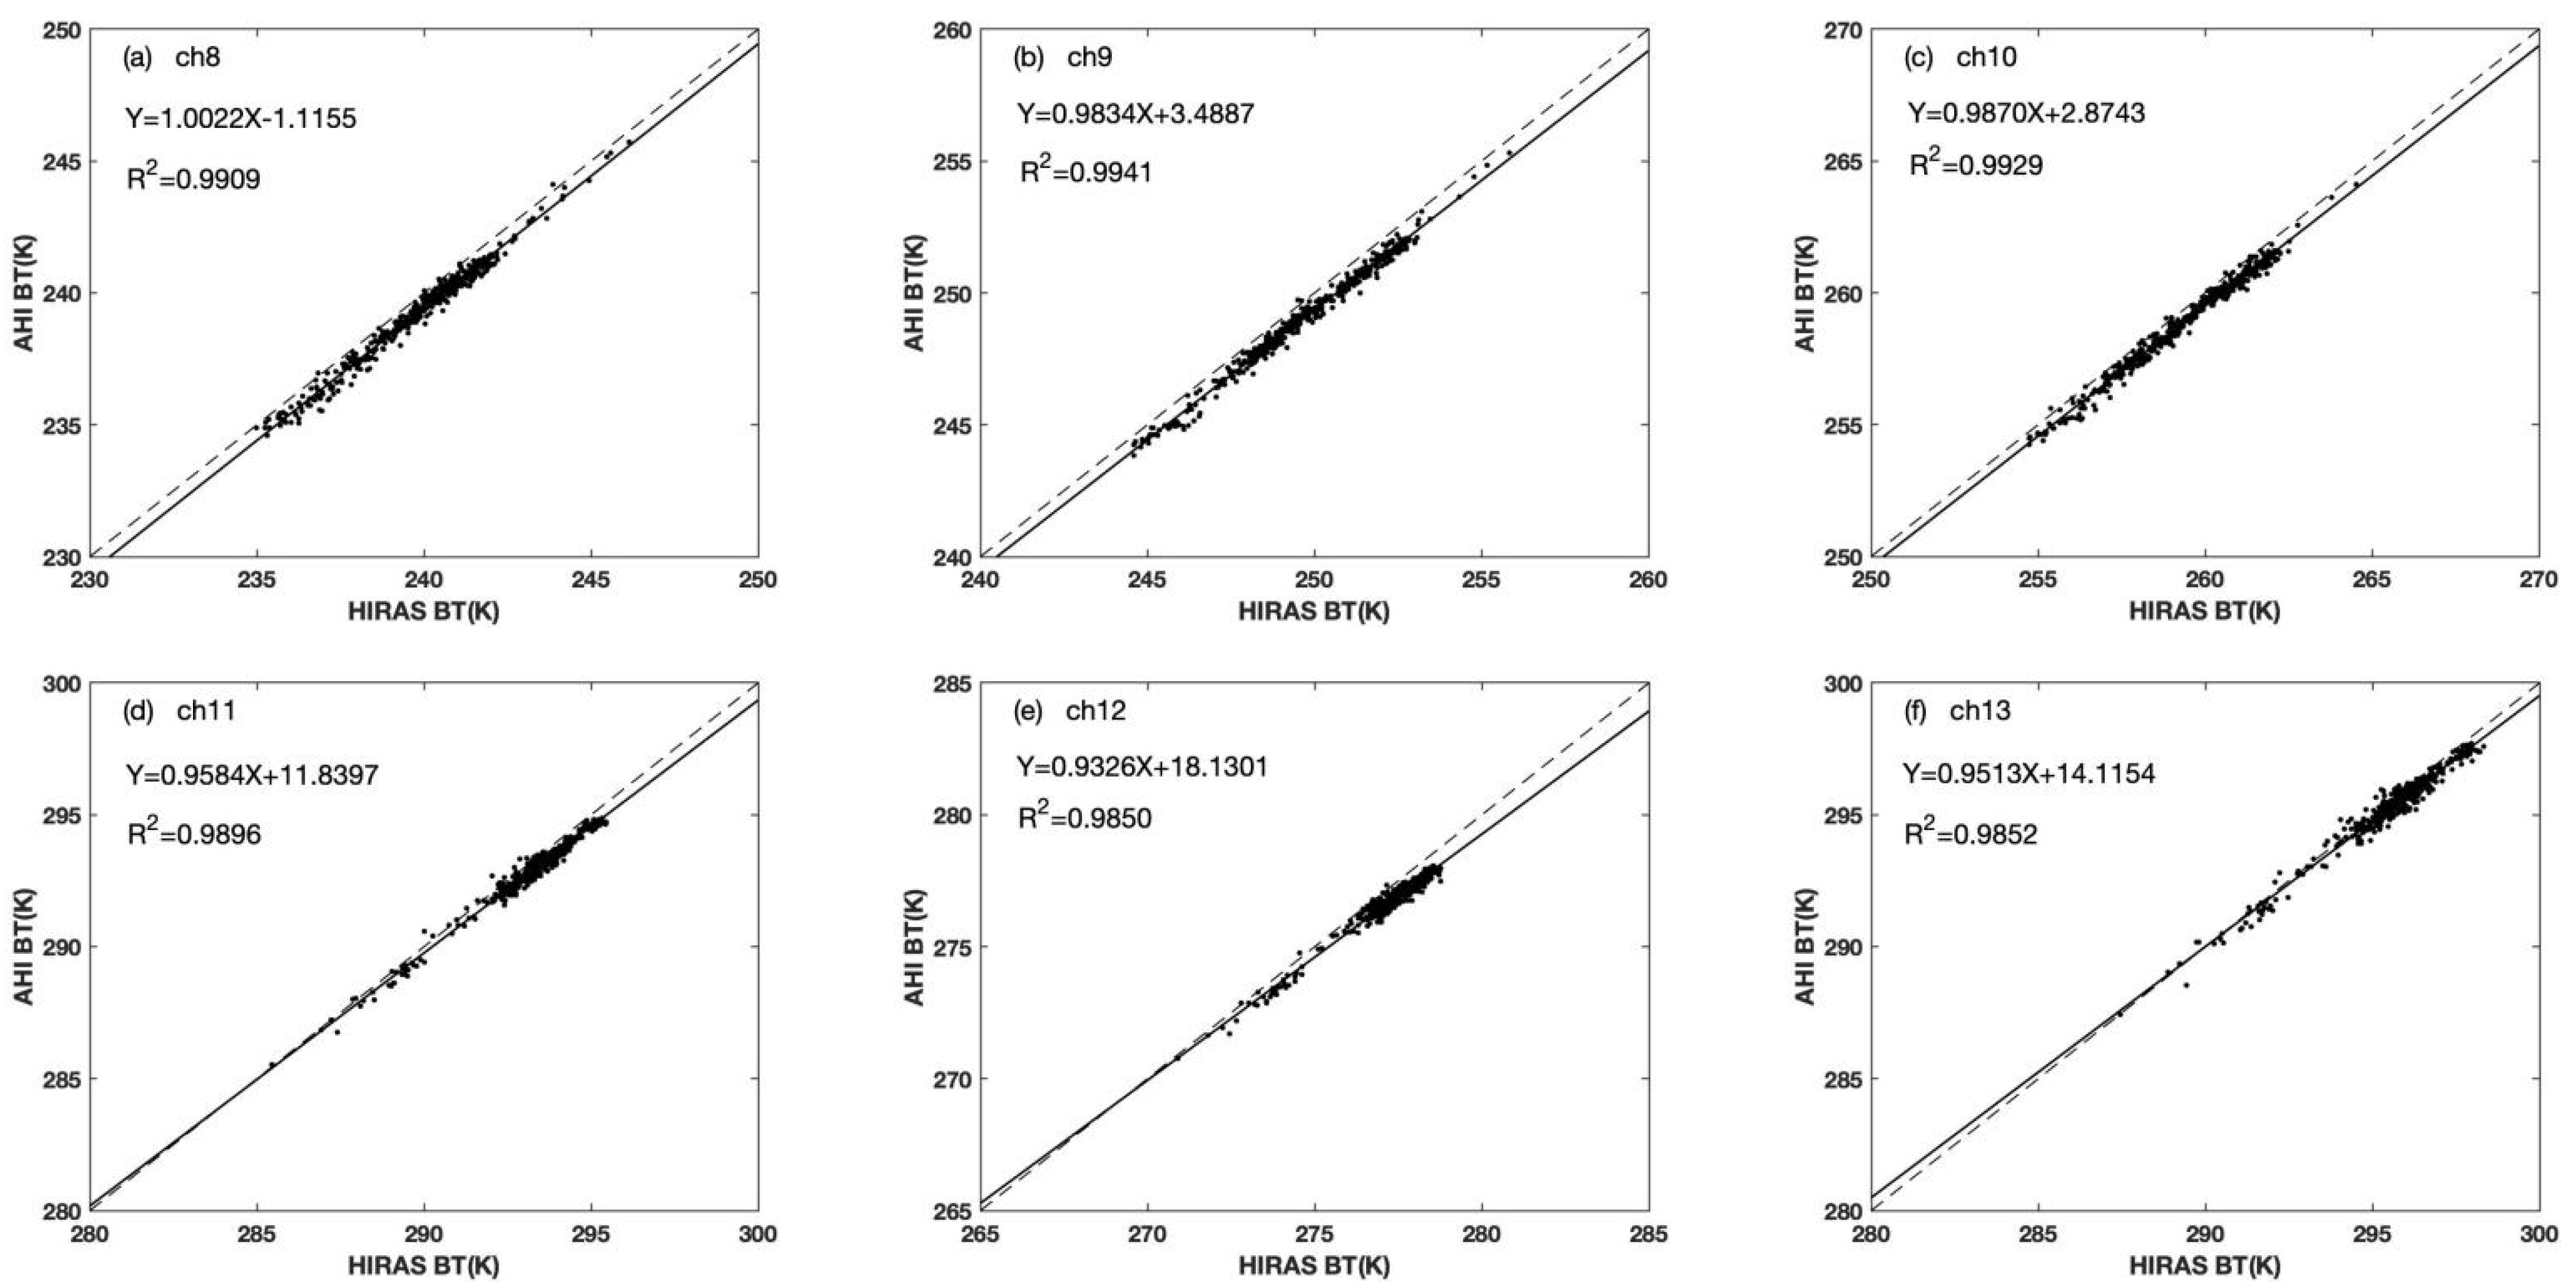
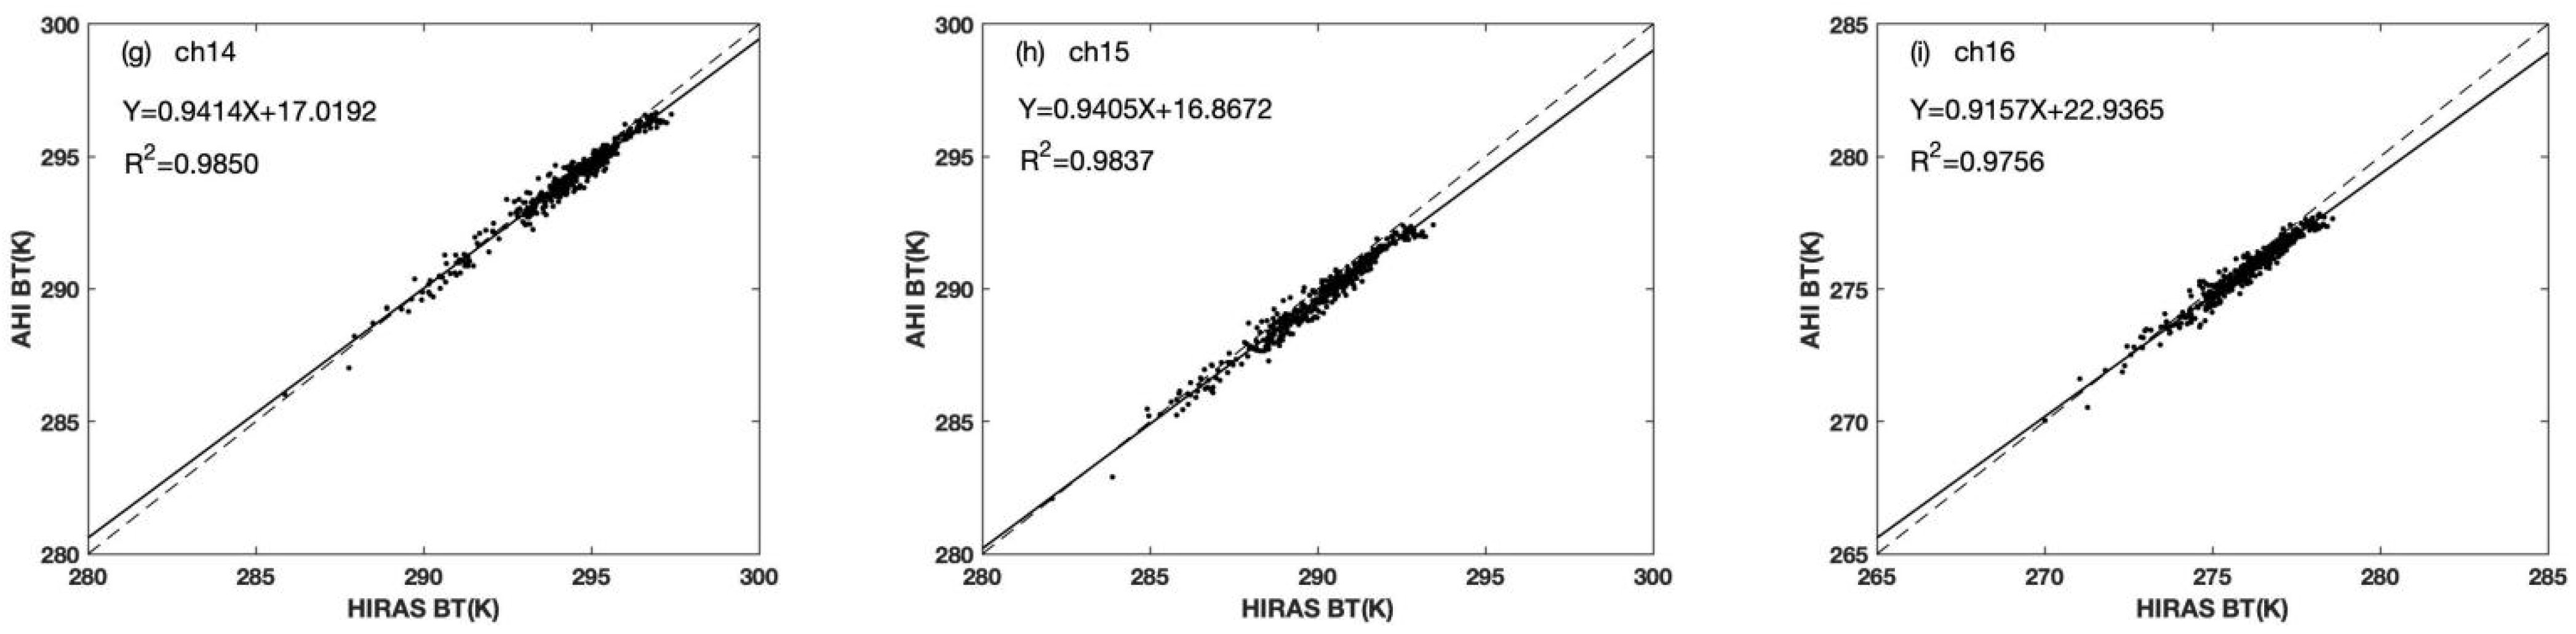
- The HIRAS-II on-orbit observed brightness temperatures are slightly warmer than the AHI observations, with a small positive bias in all the matched channels. The brightness temperature scatters of both observations are distributed near the y = x line with a correlation coefficient higher than 0.98 in all channels. The biases of water vapor channels 8–10 and ozone absorption channel 12 are relatively large, with a maximum of 0.65 K (channel 9 in the water vapor wing), and the biases of the window channels are relatively small, with a minimum of 0.22 K (channel 14). The standard deviations for all channels are small (0.22–0.31 K) and there is little difference between the channels.
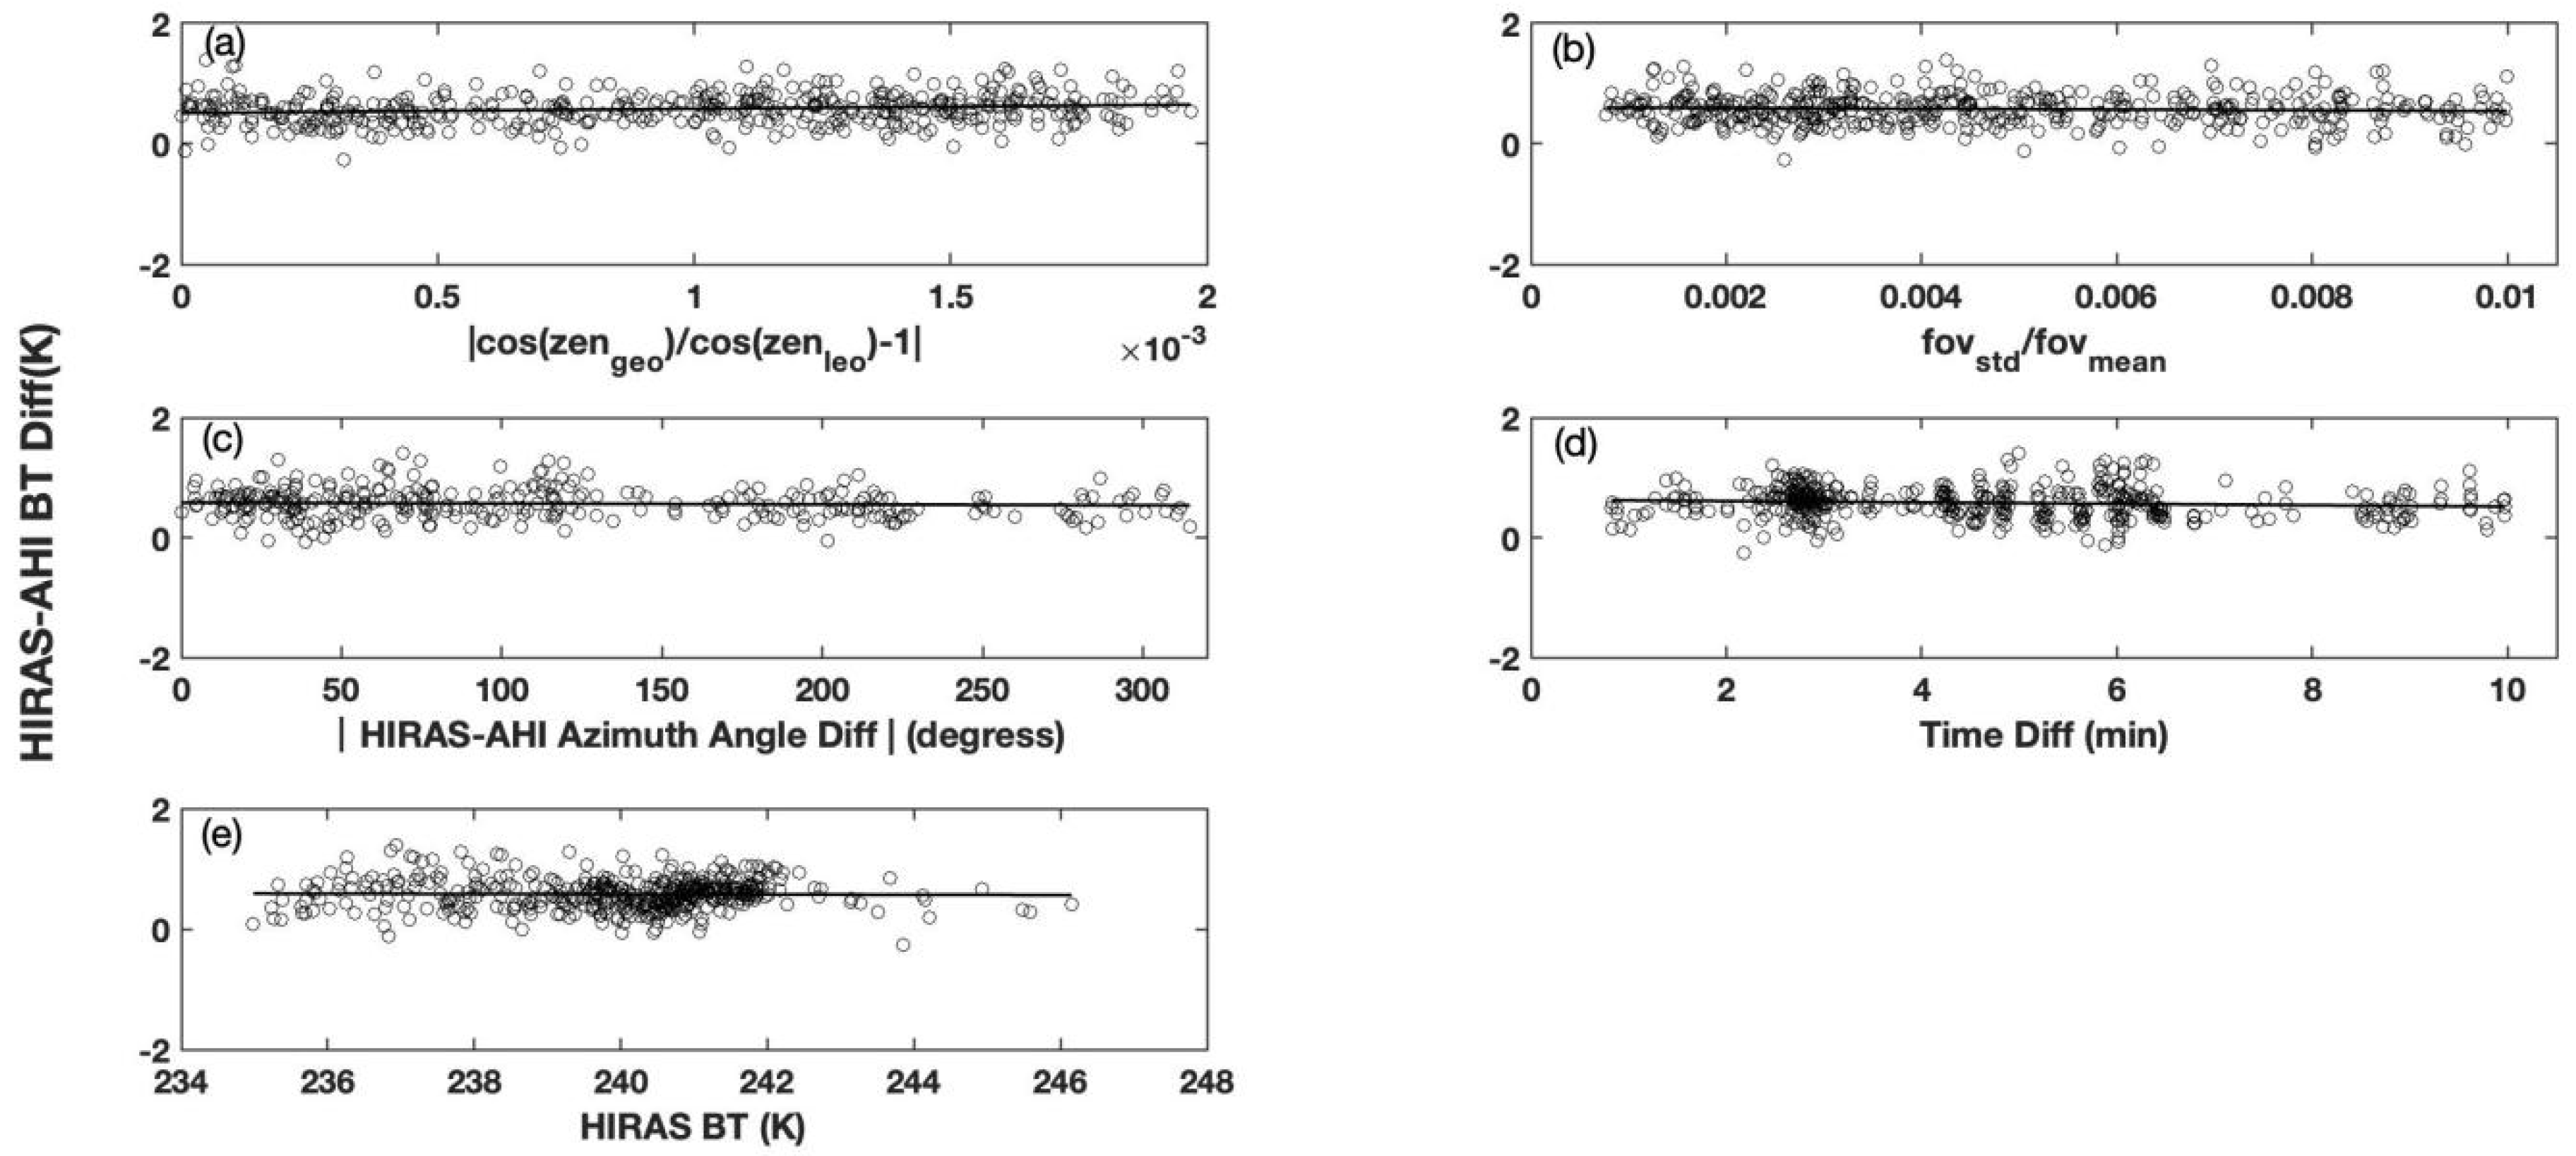
- The thresholds chosen for the colocation approximation factors (e.g., observation geometry angle, field of view uniformity, observation azimuth, and observation time) when matching the HIRAS-II with AHI contribute little and negligible uncertainty to the bias assessment, so the difference between the two observed radiations is considered to be mainly from the systematic bias of the two instrument measurements.
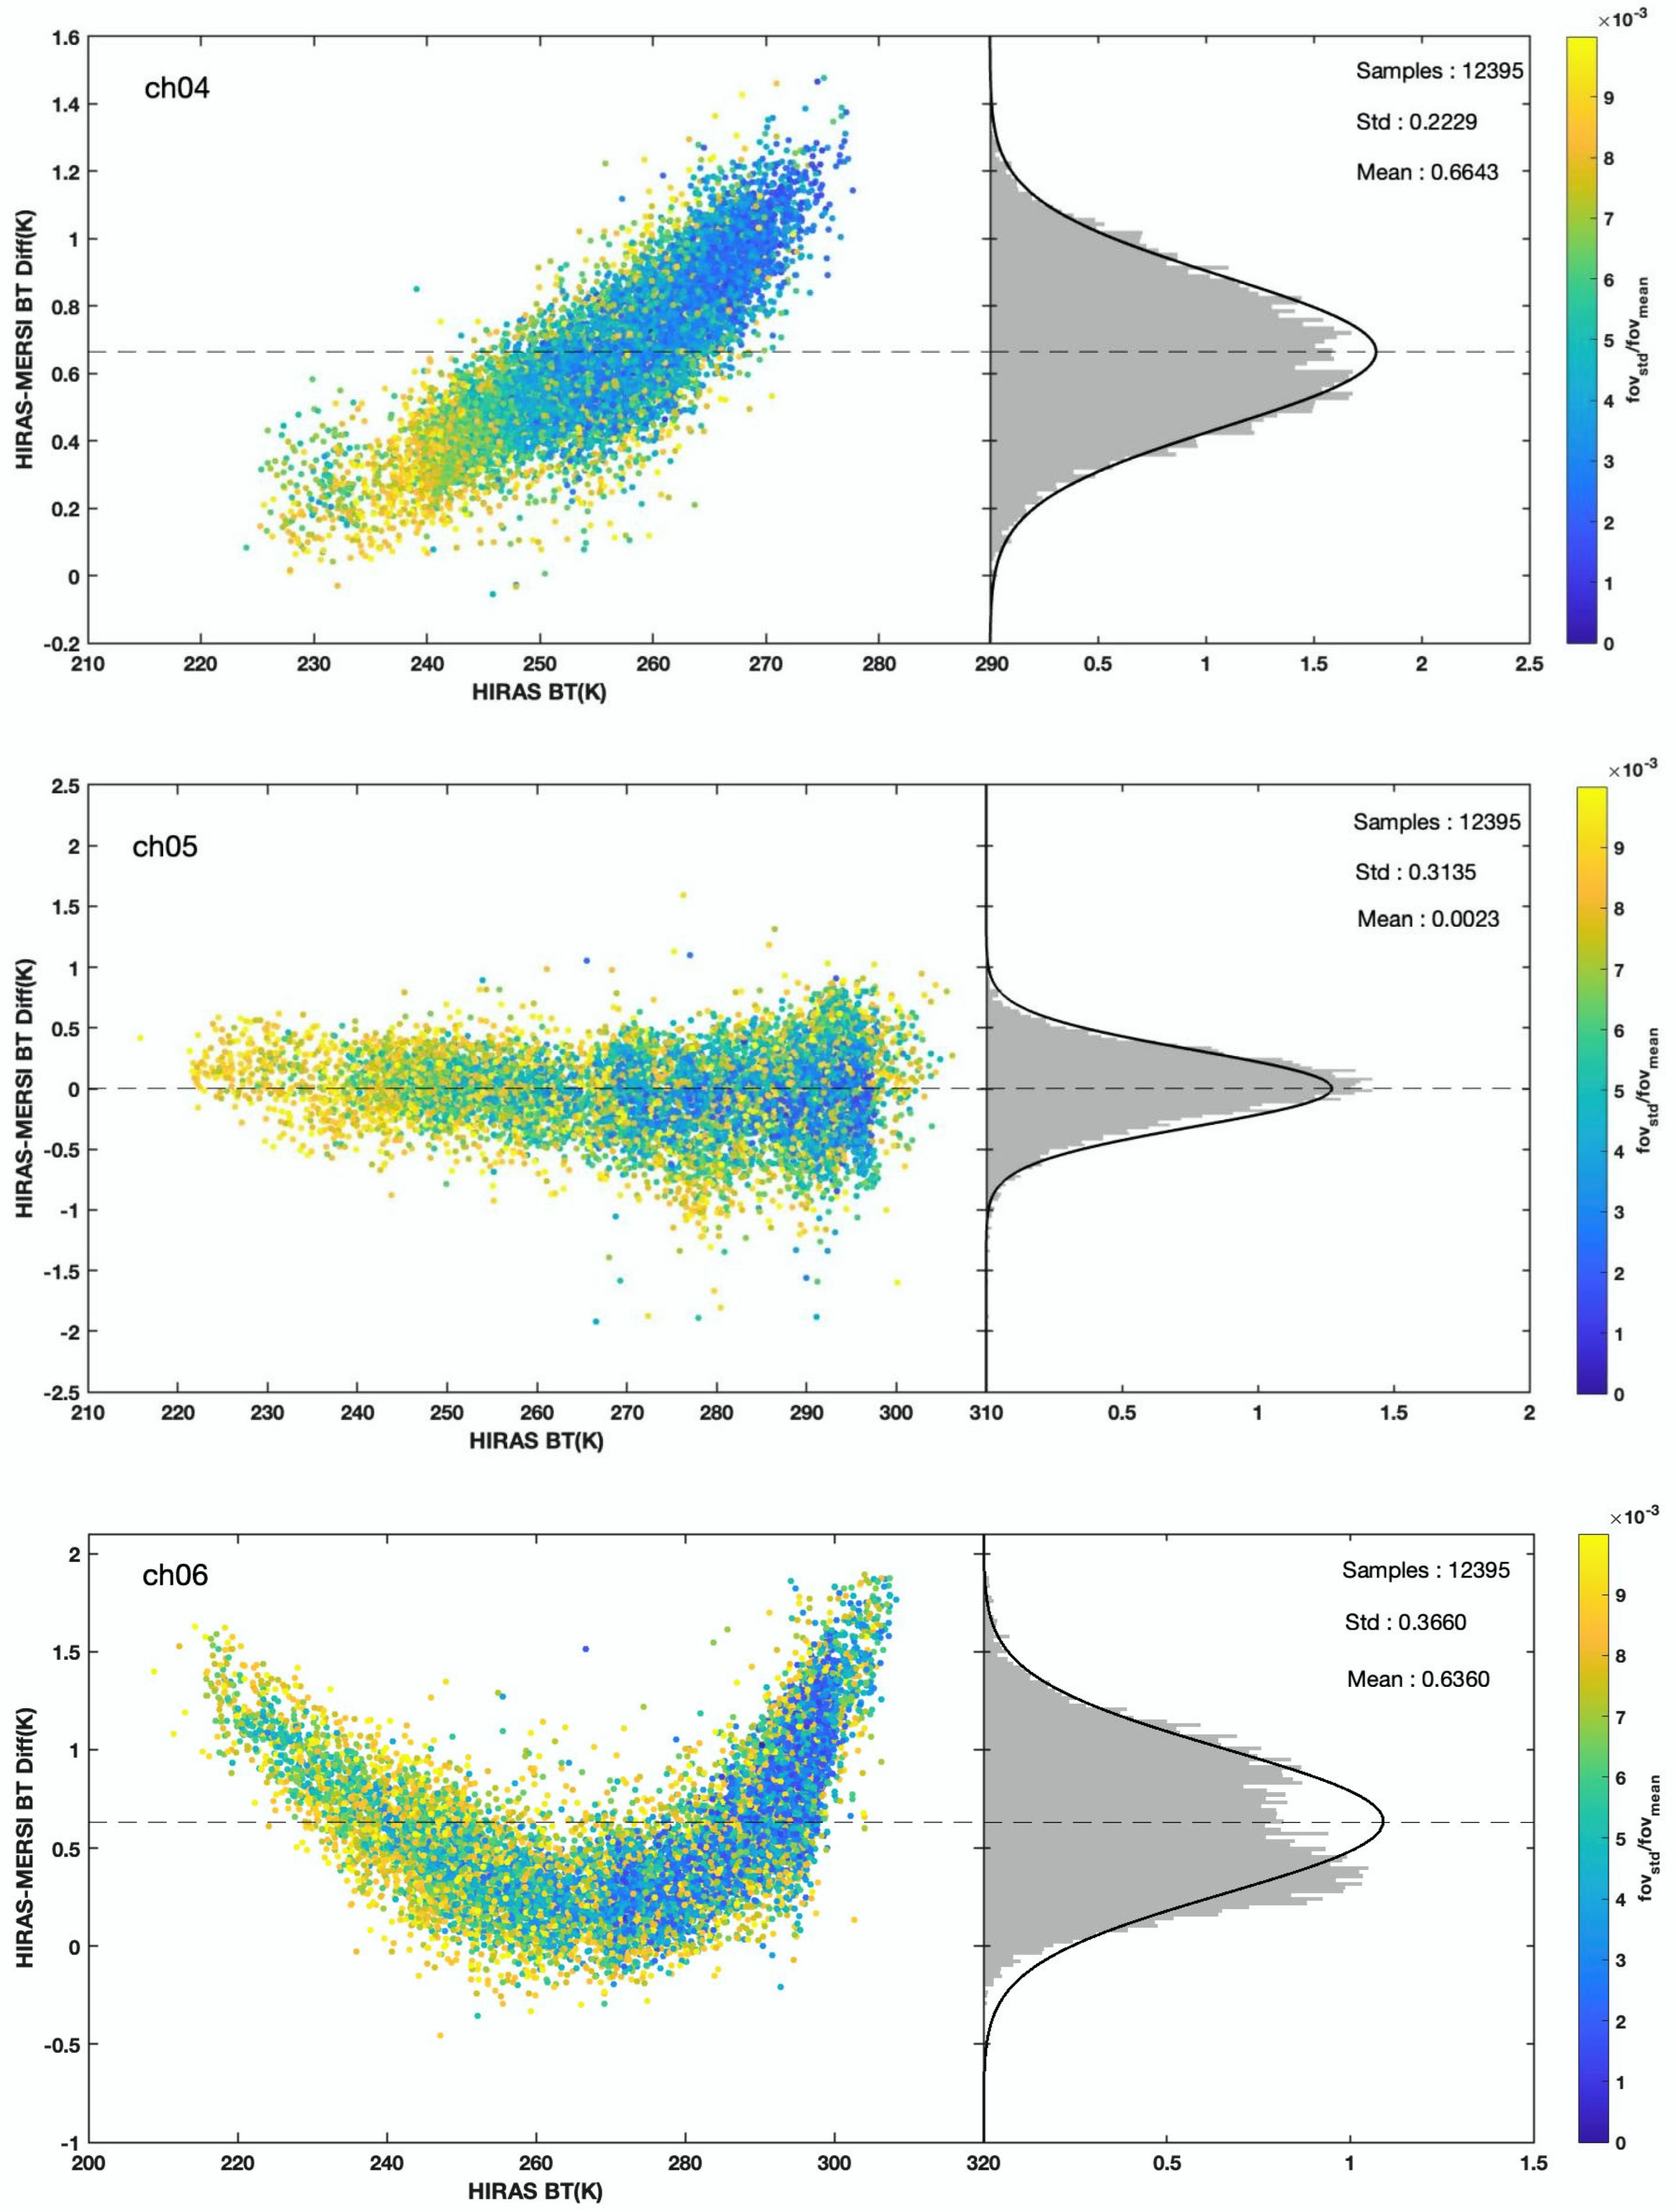
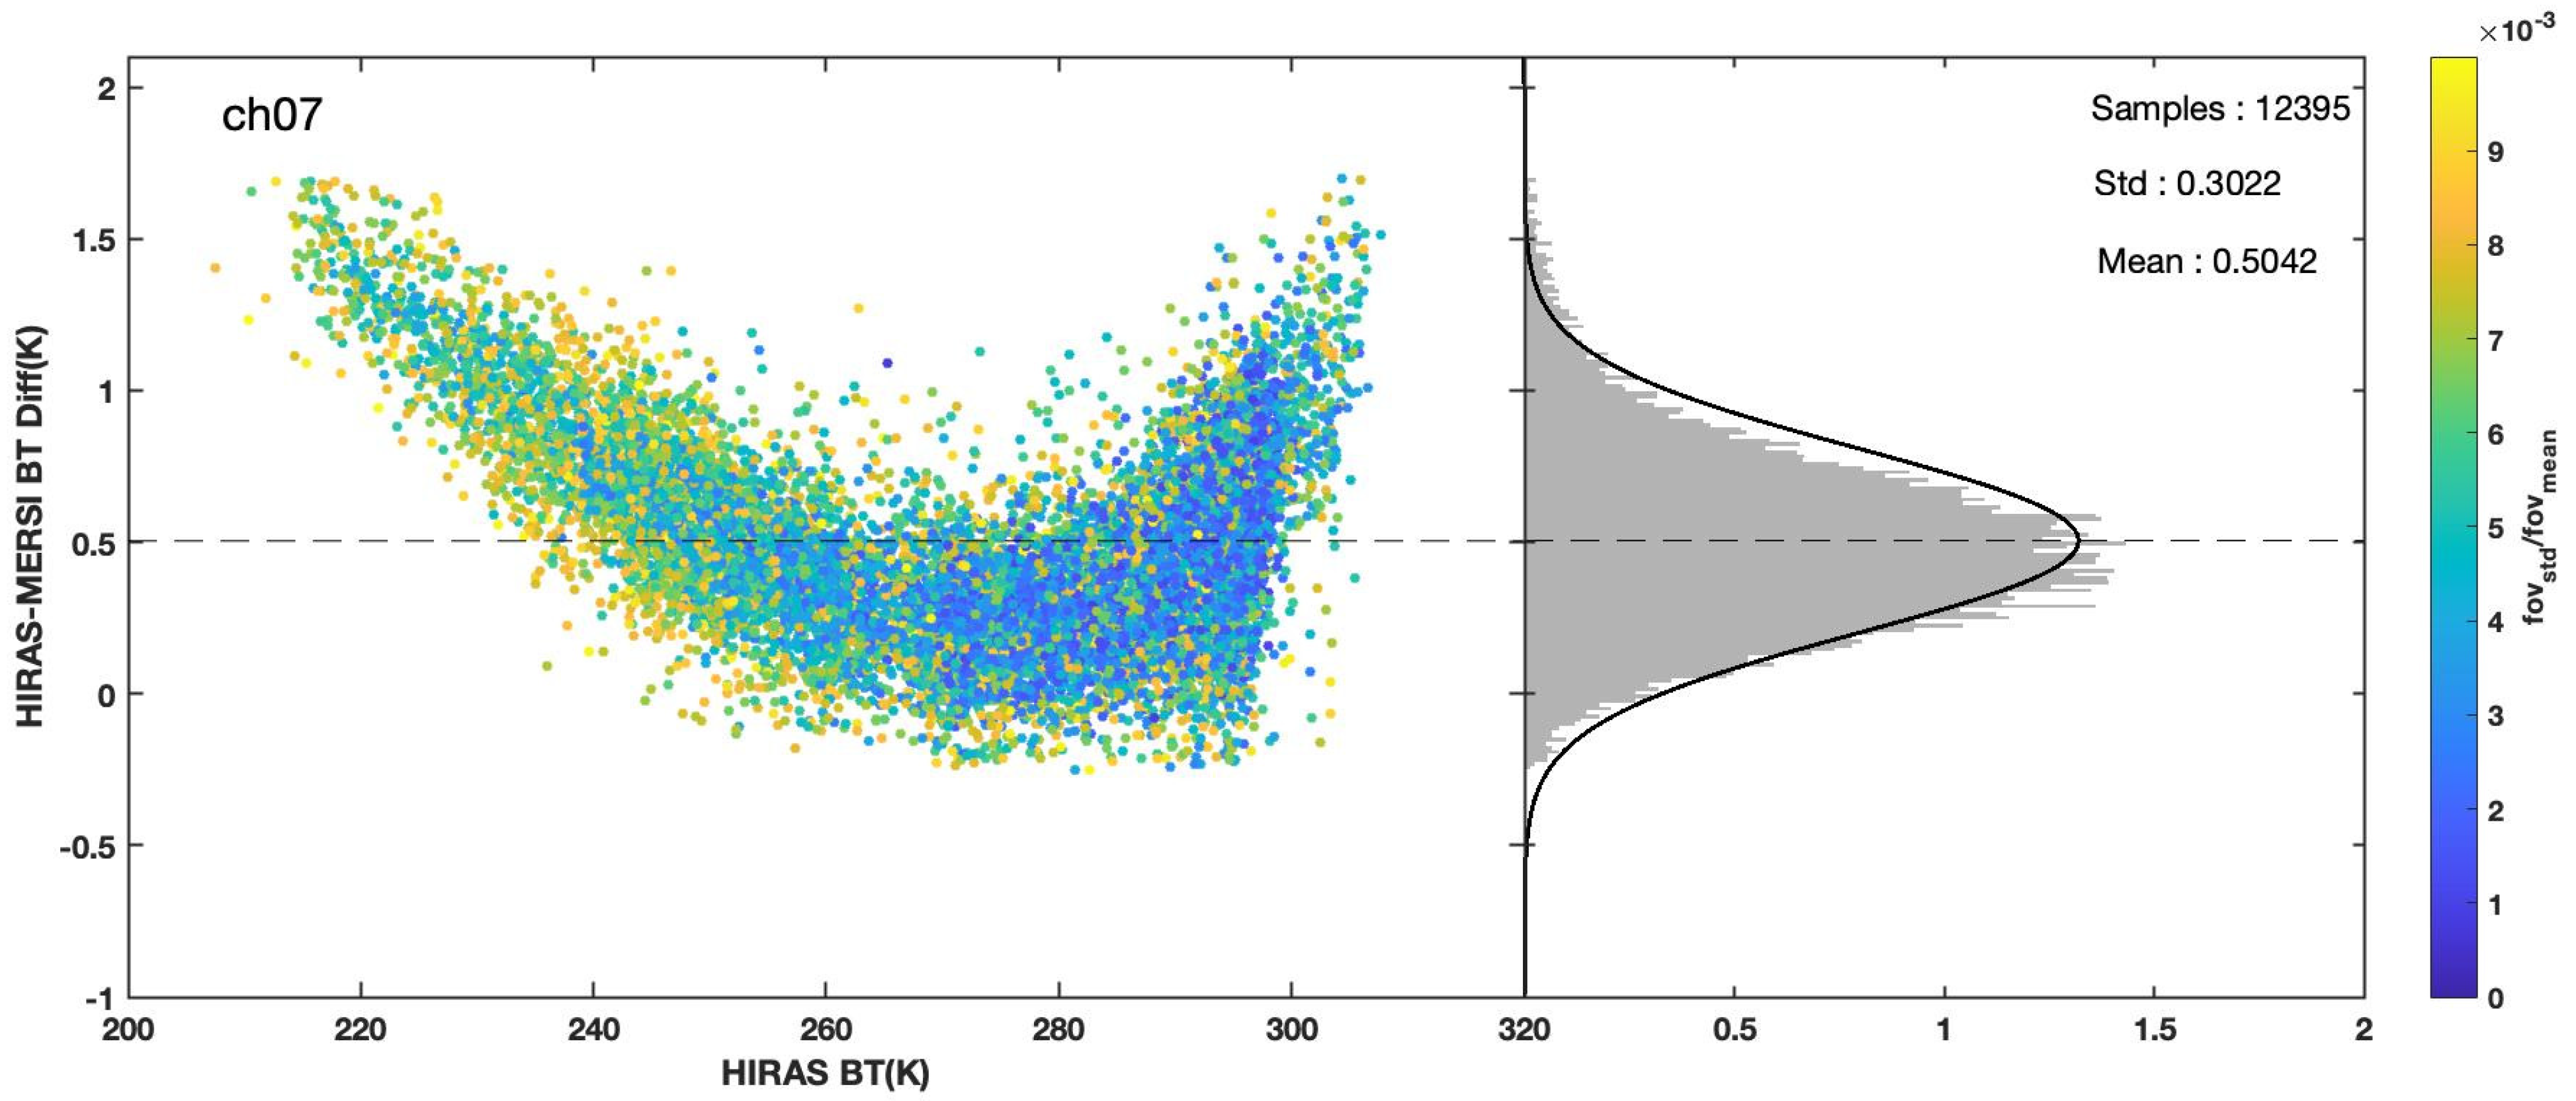
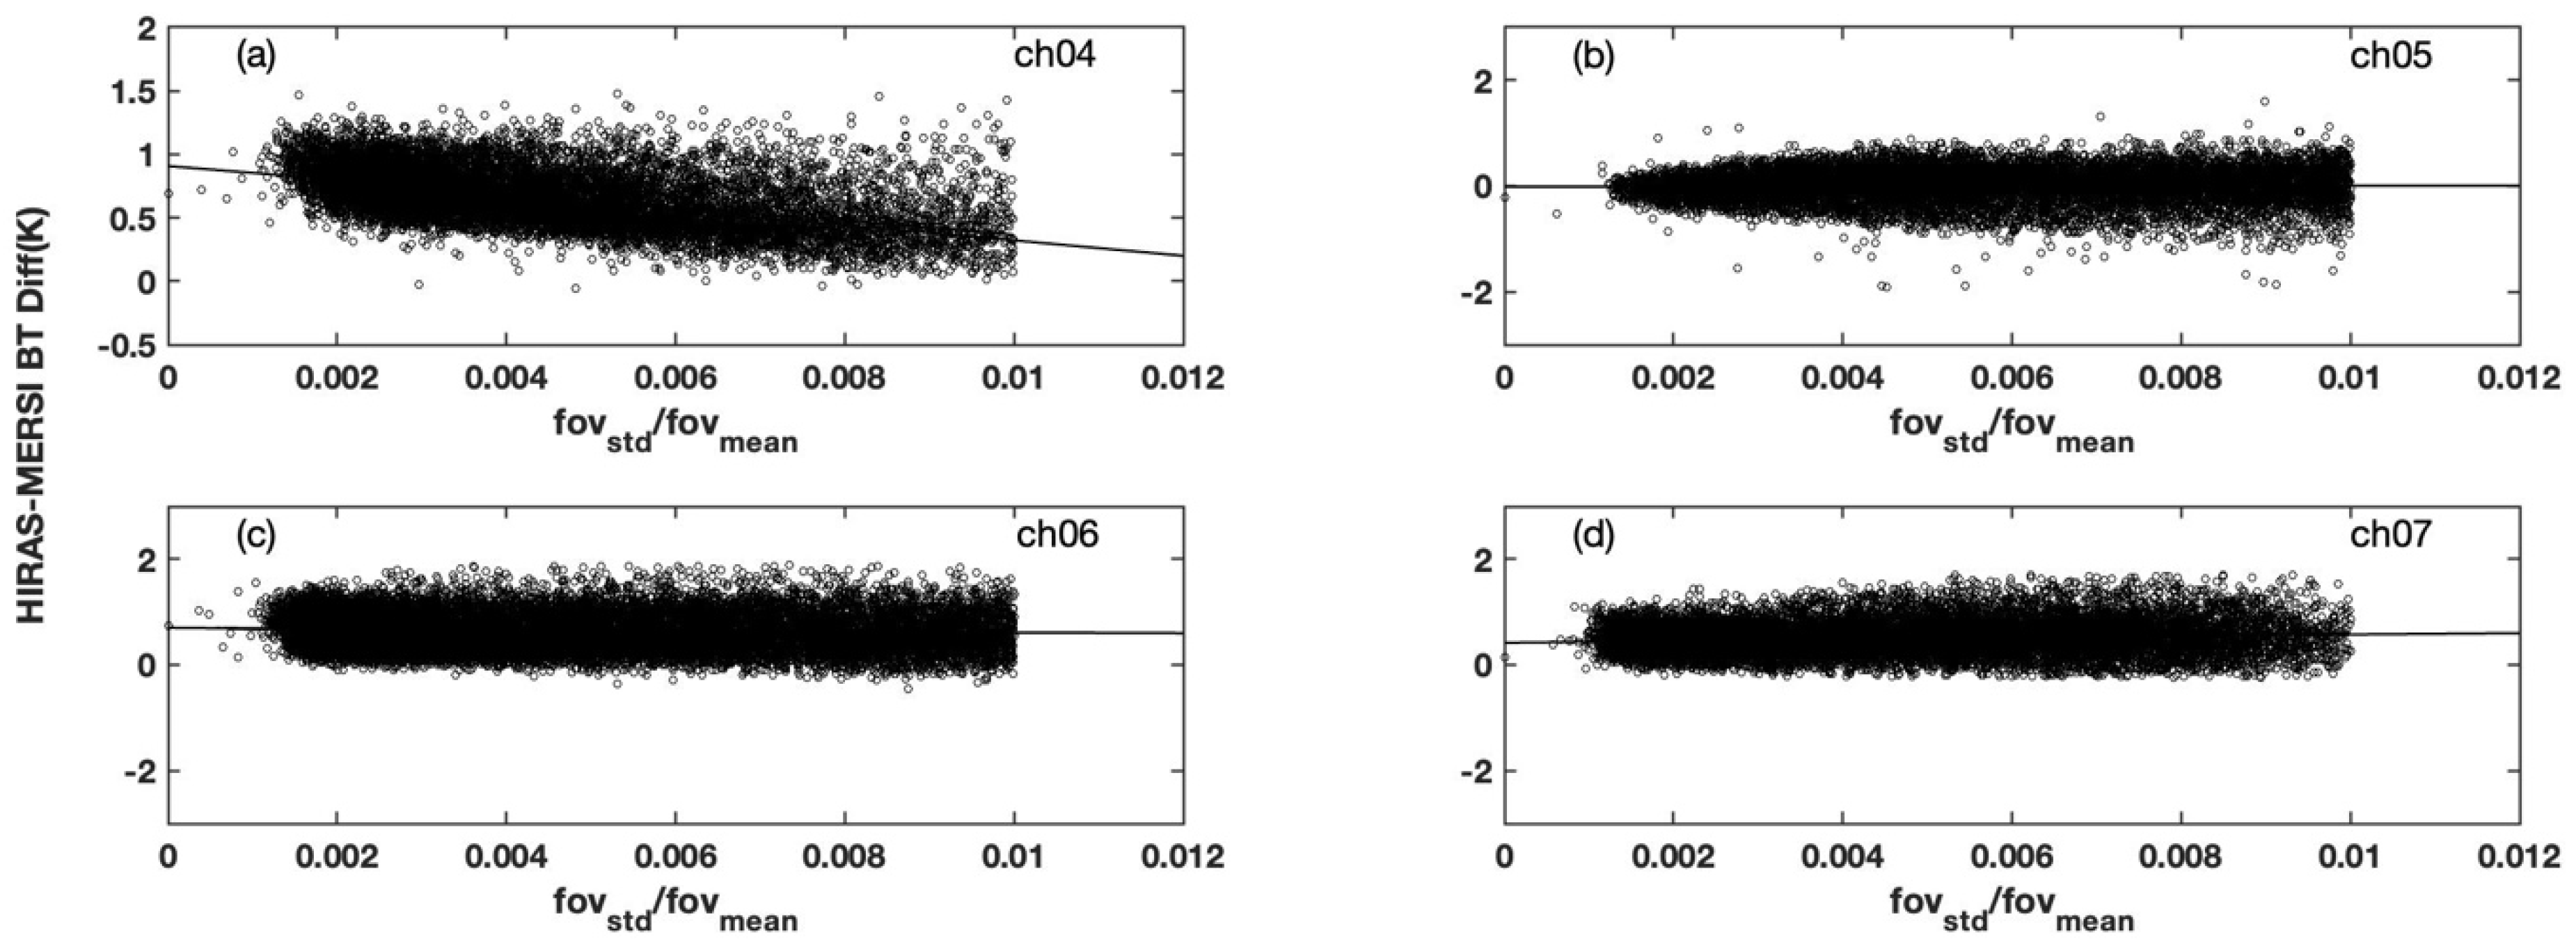
- Since HIRAS-II and MERSI-LL are mounted on the same platform, the scene uniformity is the only factor introducing matching uncertainty in the intercomparison. The mean brightness temperature bias (HIRAS-II minus MERSI-LL) of the MERSI-LL water vapor channel 4 is 0.66 K with a standard deviation of 0.22 K. To window channel 5, the observations of both instruments are very close, with a mean bias of 0.002 K and a standard deviation of 0.31 K. Both channel 6 and 7 have relatively larger brightness temperature differences at lower scene temperatures and higher scene temperatures, with a mean bias of 0.63 K (the standard deviation is 0.36 K) and 0.5 K (the standard deviation is 0.3 K), respectively.
- The biases of MERSI-LL channel 4 are obviously positively correlated with the target scene temperature. The biases of channel 6 and 7 show a U-shaped change with the increase in the scene temperature, and the biases are smallest (close to 0 K) when the scene temperature is between 250 K and 280 K. The statistical characteristics of the HIRAS-II–MERSI-LL difference vary minimally and almost constantly over a period of time, indicating that the performance of the HIRAS-II instrument is stable.
Author Contributions
Funding
Data Availability Statement
Acknowledgments
Conflicts of Interest
References
- Yang, T.; Hu, X.; Xu, H.; Wu, C.; Qi, C.; Gu, M. Radiation Calibration Accuracy Assessment of FY-3D Hyperspectral Infrared Atmospheric Sounder Based on Inter-Comparison. Acta Opt. Sin. 2019, 39, 337–387. [Google Scholar] [CrossRef]
- Guan, L.; Ren, X.Y. The observation quality assessment of satellite borne microwave imager at new-added frequency over East Asia land. Trans. Atmos. Sci. 2018, 41, 554–560. [Google Scholar] [CrossRef]
- Lu, Q.-F.; Zhou, F.; Qi, C.-L.; Hu, X.; Xu, H.-L.; Wu, C.-Q. Spectral performance evaluation of high-spectral resolution infrared atmospheric sounder onboard FY-3D. Opt. Precis. Eng. 2019, 27, 2105–2115. [Google Scholar] [CrossRef]
- Zhang, P.; Hu, X.; Lu, Q.; Zhu, A.; Lin, M.; Sun, L.; Chen, L.; Xu, N. FY-3E: The First Operational Meteorological Satellite Mission in an Early Morning Orbit. Adv. Atmos. Sci. 2022, 39, 1–8. [Google Scholar] [CrossRef]
- Gunshor, M.M.; Schmit, T.J.; Menzel, W.P. Intercalibration of the Infrared Window and Water Vapor Channels on Operational Geostationary Environmental Satellites Using a Single Polar-Orbiting Satellite. J. Atmos. Ocean. Technol. 2004, 21, 61–68. [Google Scholar] [CrossRef]
- Tobin, D.C.; Revercomb, H.E.; Moeller, C.C.; Pagano, T.S. Use of Atmospheric Infrared Sounder High–Spectral Resolution Spectra to Assess the Calibration of Moderate Resolution Imaging Spectroradiometer on EOS Aqua. J. Geophys. Res. 2006, 111, D09S05. [Google Scholar] [CrossRef]
- Wang, L.; Cao, C.; Goldberg, M. Intercalibration of GOES-11 and GOES-12 Water Vapor Channels with MetOp IASI Hyperspectral Measurements. J. Atmos. Ocean. Technol. 2009, 26, 1843–1855. [Google Scholar] [CrossRef]
- Xu, N.; Hu, X.; Chen, L.; Zhang, Y.; Hu, J.; Sun, L. On-Orbit Radiometric Calibration Accuracy of FY-3A MERSI Thermal Infrared Channel. Spectrosc. Spectr. Analysis 2014, 34, 3429–3434. [Google Scholar] [CrossRef]
- Gong, X.; Li, Z.; Li, Z.; Moeller, C.; Cao, C.; Wang, W.-H.; Menzel, W.P. Intercomparison Between VIIRS and CrIS by Taking Into Account the CrIS Subpixel Cloudiness and Viewing Geometry. J. Geophys. Res. Atmos. 2018, 123, 5335–5345. [Google Scholar] [CrossRef]
- Zhou, W.; Jiang, G.-M. Cross-calibration of VIRR/FY-3A split-window channels with AIRS/AQUA and IASI/METOP-A data. Opt. Precis. Eng. 2015, 23, 1892–1902. [Google Scholar] [CrossRef]
- Zhang, P.; Guo, Q.; Chen, B.-Y.; Feng, X. The Chinese Next-Generation Geostationary Meteorological Satellite FY-4 Compared with the Japanese Himawari-8/9 Satellite. Adv. Meteorol. Sci. Technol. 2016, 6, 72–75. [Google Scholar] [CrossRef]
- Okuyama, A.; Takahashi, M.; Date, K.; Hosaka, K.; Murata, H.; Tabata, T.; Yoshino, R. Validation of Himawari-8/AHI Radiometric Calibration Based on Two Years of In-Orbit Data. J. Meteorol. Soc. Jpn. 2018, 96, 91–109. [Google Scholar] [CrossRef]
- Bessho, K.; Date, K.; Hayashi, M.; Ikeda, A.; Imai, T.; Inoue, H.; Kumagai, Y.; Miyakawa, T.; Murata, H.; Ohno, T.; et al. An Introduction to Himawari-8/9—Japan’s New-Generation Geostationary Meteorological Satellites. J. Meteorol. Soc. Jpn. 2016, 94, 151–183. [Google Scholar] [CrossRef]
- Di, D. Data Assimilation Research for Geosynchronous Interferometric Infrared Sounder Onboard FengYun-4 Satellite; Chinese Academy of Meteorological Sciences: Beijing, China, 2019. [Google Scholar]
- Wang, L.; Wu, X.; Goldberg, M.; Cao, C.; Li, Y.; Sohn, S.-H. Comparison of AIRS and IASI Radiances Using GOES Imagers as Transfer Radiometers toward Climate Data Records. J. Appl. Meteorol. Climatol. 2010, 49, 478–492. [Google Scholar] [CrossRef]
- Wang, L.; Cao, C.; Ciren, P. Assessing NOAA-16 HIRS Radiance Accuracy Using Simultaneous Nadir Overpass Observations from AIRS. J. Atmos. Ocean. Technol. 2007, 24, 1546–1561. [Google Scholar] [CrossRef]
- Xu, N.; Hu, X.-Q.; Chen, L.; Zhang, Y.-X. Cross-calibration of FY-2E/VISSR infrared window and water vapor channels with TERRA/MODIS: Cross-calibration of FY-2E/VISSR infrared window and water vapor channels with TERRA/MODIS. J. Infrared Millim. Waves 2012, 31, 319–324. [Google Scholar] [CrossRef]
- Wang, H.-M.; Zhao, Q.-C.; Wang, Y.-M.; Zhang, Z.; Yang, X.-J.; Hu, X. Check Analysis of In-Orbit Cross-Calibration Between FY-3A/TOU and Metop-B/GOME-2. Acta Opt. Sin. 2017, 37, 320–328. [Google Scholar] [CrossRef]


| HIRAS-II | AHI | MERSI-LL | |
|---|---|---|---|
| Satellite platform | FY-3E | Himawari-8 | FY-3E |
| Spatial resolution/km | 14 km (at nadir) | Infrared: 2 km | Infrared: 1 km |
| Spectral coverage | 3041 channels (3.92–15.38 μm) with spectral resolution 0.625 cm−1 | Ch8: 6.2 μm (300 hPa) Ch9: 6.9 μm (371 hPa) Ch10: 7.3 μm (532 hPa) Ch11: 8.6 μm (window) Ch12: 9.6 μm (40 hPa) Ch13: 10.4 μm (window) Ch14: 11.2 μm (window) Ch15: 12.4 μm (window) Ch16: 13.3 μm (863 hPa) | Ch4: 7.2 μm (400 hPa) Ch5: 8.55 μm (window) Ch6: 10.8 μm (window) Ch7:12.0 μm (window) |
| AHI | |||||||||
|---|---|---|---|---|---|---|---|---|---|
| ch8 | ch9 | ch10 | ch11 | ch12 | ch13 | ch14 | ch15 | ch16 | |
| Mean (k) | 0.5780 | 0.6465 | 0.4909 | 0.3726 | 0.5465 | 0.2688 | 0.2274 | 0.3935 | 0.3259 |
| Std (k) | 0.2527 | 0.2398 | 0.2185 | 0.2165 | 0.2171 | 0.2881 | 0.2917 | 0.3061 | 0.2814 |
| Mean HIRAS BT (k) | 240.1 | 250.0 | 259.7 | 293.4 | 277.4 | 295.8 | 294.5 | 290.2 | 276.2 |
| Correlation coefficient | 0.9909 | 0.9941 | 0.9929 | 0.9896 | 0.9850 | 0.9852 | 0.9850 | 0.9837 | 0.9756 |
Publisher’s Note: MDPI stays neutral with regard to jurisdictional claims in published maps and institutional affiliations. |
© 2022 by the authors. Licensee MDPI, Basel, Switzerland. This article is an open access article distributed under the terms and conditions of the Creative Commons Attribution (CC BY) license (https://creativecommons.org/licenses/by/4.0/).
Share and Cite
Chen, H.; Guan, L. Assessing FY-3E HIRAS-II Radiance Accuracy Using AHI and MERSI-LL. Remote Sens. 2022, 14, 4309. https://doi.org/10.3390/rs14174309
Chen H, Guan L. Assessing FY-3E HIRAS-II Radiance Accuracy Using AHI and MERSI-LL. Remote Sensing. 2022; 14(17):4309. https://doi.org/10.3390/rs14174309
Chicago/Turabian StyleChen, Hongtao, and Li Guan. 2022. "Assessing FY-3E HIRAS-II Radiance Accuracy Using AHI and MERSI-LL" Remote Sensing 14, no. 17: 4309. https://doi.org/10.3390/rs14174309