Article

Development Status and Service Performance Preliminary Analysis for BDSBAS

1
Shanghai Astronomical Observatory, Chinese Academy of Sciences, Shanghai 200030, China
2
Shanghai Key Laboratory of Space Navigation and Position Techniques, Shanghai 200030, China
3
Beijing Satellite Navigation Center, Beijing 100094, China
4
Space Star Technology Co., Ltd., Beijing 100095, China
5
Beijing Research Institute of Telemetry, Beijing 100076, China
*
Author to whom correspondence should be addressed.
Remote Sens. 2022, 14(17), 4314; https://doi.org/10.3390/rs14174314
Submission received: 14 July 2022 / Revised: 24 August 2022 / Accepted: 25 August 2022 / Published: 1 September 2022
(This article belongs to the Special Issue Space-Geodetic Techniques)

Abstract

:
The BeiDou global navigation satellite system (BDS-3) provides positioning, navigation and timing services for global users, moreover, it provides BDS satellite-based augmentation system (BDSBAS) single-frequency (SF) and dual-frequency multi-constellation (DFMC) services for users in China and its surrounding areas. The BDSBAS SF service is in accordance with Radio Technical Commission for Aeronautics (RTCA) standard protocol (RTCA MOPS) and augment GPS constellation, while the BDSBAS DFMC service is in line with SBAS L5 DFMC standard protocol and is aimed at supporting any combination of BDS/GPS/Galileo/GLONASS constellations, including only a single constellation operation. We introduced the development status of the BDSBAS system, including the system architecture and navigation user algorithms. Based on the GPS measurements, the accuracy, integrity and availability of the BDSBAS SF service were evaluated, and with the BDS measurements, the accuracy of the BDSBAS DFMC service was preliminarily analyzed. The integrity and availability of the BDSBAS DFMC service will be discussed in future work as some of the DFMC integrity parameters are still under discussion for optimization. The results show that, for BDSBAS SF service, the horizontal and vertical position accuracy were about 1.0 m and 2.0 m (95%), respectively, which were improved by 39% and 33%, respectively, compared with the GPS SF position accuracy. For BDSBAS DFMC service, the horizontal and vertical position accuracy were about 0.6 m and 1.2 m (95%), respectively, which were improved by about 25% and 20% compared with the BDS dual-frequency position accuracy. No system integrity risk event was detected during the testing period for BDSBAS SF service. The average availability of the BDSBAS SF service was about 98% which was mainly affected by the availability of ionospheric grid delay corrections.

Graphical Abstract

1. Introduction

The satellite-based augmentation system (SBAS) can broadcast ephemeris and clock error corrections, ionospheric delay corrections and the corresponding integrity information to users through geostationary orbit satellites (GEO), to improve the accuracy, integrity, continuity and availability of the Global Navigation Satellite System (GNSS) core constellations service. Because of the benefits of the augmentation service, including large service areas and relatively low construction and maintenance costs, many countries and regions have established SBAS systems to meet the navigation performance requirements of high real-time and integrity applications such as aviation users for all phases of flight, from en route through category I approach [1].
Current global SBAS operational systems include the Wide Area Augmentation System (WAAS) of the United States which has been operational since 2003 and can support CAT I-like approach capability (LPV-200) [2,3]; Japan’s Multi-functional Transport Satellite Satellite-based Augmentation System (MSAS) has been operational since 2007 and supported non-precision approach operations [4,5,6]; the European Geostationary Navigation Overlay Service (EGNOS) system in European Union whose precision approach operations capability began in 2011 [7,8,9]; both the Indian Global Positioning System (GPS) Aided Geostationary Earth Orit Augmented Navigation (GAGAN) system [10,11] and the Russian System of Differential Correction and Monitoring (SDCM) system [12,13] are in development with plans for horizontal and vertical guidance. In addition to the system already in operation, there are some future SBAS under development: the BeiDou Satellite-Based Augmentation System (BDSBAS) by China, the Korea Augmentation Satellite System (KASS) by South Korea, the SBAS for Africa and Indian Ocean (A-SBAS) and the Australian SBAS (AUSBAS) [14].
BDSBAS is an important part of the BDS system, and provides services for users in China and the surrounding areas. It will be an important supplement to the availability of Global SBAS services. Since civil aviation is the most demanding user for SBAS, the International Civil Aviation Organization (ICAO) established standards and recommended practices (SARPs) providing overarching standards and guidance for global SBAS implementation, and organized the SBAS Interoperability Working Group (IWG) for SBAS service providers to assure common understanding and implementation of the SARPs [15,16,17]. Incorporation of the ICAO SARPs has become one of the most important jobs of BDSBAS system construction, and BDSBAS provides two kinds of augmentation service: single-frequency (SF) service and dual-frequency multi-constellation (DFMC) service, both in accordance with ICAO standards [18,19].
The BDSBAS SF service augments GPS constellation and meets the RTCA minimum operational performance standards (RTCA MOPS) which defined the GPS L1 C/A signal minimum performance, functions and characteristics. The service provides GPS satellite ephemeris and clock error corrections referenced to the L1 NAV message, ionospheric grid delay corrections, integrity information of corrections, GEO navigation and almanacs, degradation factors and clock–ephemeris covariance matrix, and uses BDSBAS-B1C signal of GEO satellites to broadcast the augmentation messages to GPS/SBAS users, aiming to support APV-I precision approach [19].
The BDSBAS DFMC service is compatible with the SBAS L5 DFMC protocol and the augmentation messages are transmitted by GEO satellites through BDSBAS-B2a signal to augment BDS/GPS/Galileo/GLONASS dual-frequency signals. For BDS, it is recommended to use B1C and B2a dual-frequency signals and the ephemeris corrections are referenced to the B1C CNAV1 navigation message. For GPS, it is recommended to use L1 C/A and L5 dual-frequency signals and the ephemeris corrections are referenced to the L1 NAV navigation message. For Galileo, it is recommended to use E1 and E5a dual-frequency signals and the ephemeris corrections are referenced to the E5a F/NAV navigation message. For GLONASS, it is advised to use L1OC and L3OC dual-frequency signals and the ephemeris corrections reference is to be determined (TBD). BDSBAS DFMC message mainly contains GNSS ephemeris and clock error corrections, integrity messages, clock–ephemeris covariance matrix, degradation parameters, and SBAS satellites ephemeris and almanacs. Compared with SF service, the DFMC service increases the SBAS availability and performance by direct mitigation of ionospheric delay with dual-frequency and inclusion of additional GNSS constellations such as BDS, Galileo and GLONASS, aiming to achieve CAT-I precision approach.
The DFMC service is intended to support any combination of constellations, including only a single constellation operation. At the current test stage, the BDSBAS DFMC service provides BDS and GPS augmentation information, and will gradually increases the dual-frequency augmentation information for the Galileo and GLONASS systems. Table 1 shows the comparison of the BDSBAS SF service and the DFMC service.
The BDSBAS SF service has already begun to provide initial service since 31 July 2020. Reference [20] shows the BDSBAS general design, system time datum, coordinate reference system and signal characteristics, [21] analyzed the pseudorange bias errors of BDSBAS monitoring receivers and their effect on the performance of the BDSBAS service. A general aviation flight test performance of BDSBAS was given by [22]. We focus to introduce the BDSBAS architecture design, user algorithms of broadcast messages and preliminarily evaluated the system performance of accuracy, integrity and availability in accordance with ICAO standards based on monitoring receivers distributed in the China service area with the real observations.

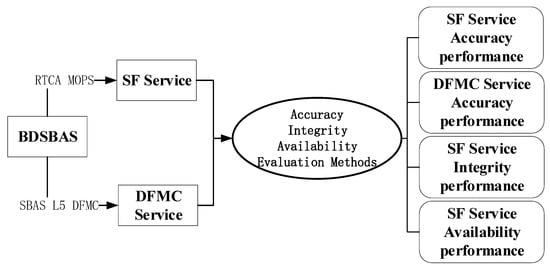
2. BDSBAS Architecture Overview

BDSBAS is operated by the BDS control system and consists of a regional monitoring network in China, two master control stations and three GEO satellites. The two master control stations are backup to each other to enhance the system robustness. To meet the needs of current SBAS users as well as the next generation of SBAS system construction, two parallel threads are dealt with in each master control station processing center for SF service messages and DFMC service messages, respectively.
BDSBAS has chosen a regional network for the SBAS services. To estimate and model the regional ionosphere for SF service, the receiver network is evenly distributed in the service area of China [23]. Each monitoring station is equipped with three independent receivers identified as A/B/C which can receive BDS and GPS pseudorange and carrier phase observation data at present. The observation data from monitoring stations are sent to the master control stations through ground and satellite network links for information processing. Some of monitoring stations equipped with hydrogen atomic clocks are identified as class I stations to ensure the system time reference stability, and the others are identified as class II stations which are widely distributed in the service area. Both the measurements of class I and class II monitoring stations are used to compute differential corrections and integrity information. The workflow of the BDSBAS system is shown in Figure 1.
The master control station is the data processing center. The received GNSS measurements are first dealt with at the preprocessing facility to identify and eliminate outliers, detect the cycle slip of carrier phase data, correct the code noise and multipath errors in real time, and compute the common errors in the propagation path, such as tropospheric delay, ionospheric delay, receiver antenna phase center corrections. The code noise and multipath errors are corrected in real time with the code noise and multipath correction (CNMC) algorithm which is a kind of carrier-smoothing pseudorange method detail described in [23]. The tropospheric delay is corrected with Black model and the ionospheric delay is corrected with dual-frequency iono-free combination. The preprocessed observations are then sent to the differential correction processing (CP) facility and integrity processing (IP) facility to calculate the differential corrections and evaluate the system output safety.
The CP facility selects preprocessing measurements from A receivers of the monitoring stations, and calculates the differential corrections for SF and DFMC services. For SF service, GPS ephemeris and clock-slow corrections, clock-fast corrections and ionospheric grid delay corrections are determined with respect to L1 C/A signal. For DFMC service, ephemeris and clock corrections are calculated for multiple constellations with dual-frequency. The calculation methods of ephemeris and clock corrections were introduced by [24,25]. GEO Cartesian and Keplerian parameters as well as almanacs are also computed. The corrections are then passed along to the IP facility for evaluation. The IP facility uses preprocessing data screening from B receivers of the monitoring stations to ensure the reliability of SBAS services. The user differential range error (UDRE) monitor determines a confidence bound on the satellite ephemeris and clock corrections with the carrier smoothed iono-free pseudoranges. In parallel, the grid ionospheric vertical error (GIVE) monitor estimates the ionospheric delay confidence bounds for a set of ionospheric grid points (IGPs).
If all the corrections are properly bounded, the corrections and integrity information are then arranged in accordance with RTCA MOPS and SBAS L5 DFMC standards separately and uploaded to the three GEO satellites in a sequence of messages by the message arrangement and upload facility. Both SF and DFMC SBAS messages are broadcast to the SBAS users with the data rate of 250 bits per second. BDSBAS SF messages are broadcast on BDSBAS-B1C signal and BDSBAS DFMC messages are broadcast on BDSBAS-B2a signal of GEO satellites.

3. Message User Algorithms and Service Performance Evaluation Methods

SBAS can be used in many non-aviation applications and the SARPs proposed by ICAO for the SBAS system can be also extend beyond aviation to other SBAS users. This section describes the user algorithm referred to ICAO SARPs for determination of user position as well as the protection levels with BDSBAS message type (MT) information. The navigation and protection level results of monitoring receivers are used to evaluate the BDSBAS service performance and the evaluation methods are detailed discussed in the following paragraphs.

3.1. Message User Algorithm

The user algorithms include application methods for differential corrections and integrity information. The satellite position and clock-slow corrections will be added to the satellite coordinate vector and clock offset computed from the broadcast ephemeris. The fast corrections will be applied to correct pseudorange measurements. SBAS ionospheric grid delay corrections should be used for single frequency users, to correct the ionospheric delay error of the observation data. For a given satellite without satellite position and clock corrections, it shall not be used in the position equation.
The integrity information is used to indicate an alert condition on one satellite or multiple satellites. Anytime a “don’t use” or “not monitored” indication is received, the corresponding satellite should not be used for navigation. Otherwise UDREIs are used for the evaluation of σ UDRE 2 indicating the accuracy of combined fast and slow error corrections. The accuracy of ionospheric grid delay corrections indicated in σ GIVE 2 is computed form the GIVEIs. These correction accuracies will be applied to determine the weighting matrix for the weighed least squares solution of SBAS user position equation.
Compared with the navigation messages broadcast by the core constellations, the information broadcast by the SBAS system has high frequency update. The fast corrections, slow corrections, and ionospheric corrections are all designed to provide the most recent information to the user. However, there is always the possibility that the user will fail to receive one of these messages. To guarantee integrity even when some messages are not received, SBAS designs the degradation factors of this information to monitor the old data to ensure that they remain valid until they time out. To provide increased availability inside the service volume and increased integrity outside, SBAS broadcast the relative covariance matrix for clock and ephemeris errors to calculate the broadcast σ UDRE degradation values specified as δ UDRE , as a function of user position. The degradation information is broadcast through different message types and applied to calculate the model variance for the measurements.
The user algorithms of SBAS SF messages are described in detail in RTCA MOPS DO-229D, and the comparable definition of SBAS DFMC operations are given in SBAS L5 DFMC ICD. The calculation processing for SF and DFMC messages are similar. Taking the SF messages as an example, the user computation processing with SBAS messages is introduced as shown in Figure 2.
According to Figure 2, after receiving GPS L1 signal and SBAS augmentation messages, the satellites used for navigation are selected according to the satellite vehicle (SV) health status, whether the differential corrections were received and the corresponding integrity information. Once the satellite is unhealthy, or its differential corrections are not received, or the UDREI of the satellite is greater than 12, the measurements of the satellite will not be used. If the MT 28 messages are received normally, the UDRE degradation value δ UDRE will be computed with MT 28 as Equation (1), otherwise δ UDRE is equal to 1 [19,22].
δ UDRE = l T C l + ε C C = ( E F s c a l ) T ( E F s c a l ) F s c a l = 2 ( s c a l e 5 ) ε C = C cov a r i a n c e F s c a l E = [ E 1 , 1 E 1 , 2 E 1 , 3 E 1 , 4 0 E 2 , 2 E 2 , 3 E 2 , 4 0 0 E 3 , 3 E 3 , 4 0 0 0 E 4 , 4 ]
where l is the line-of-sight vector from the user to the satellite. ε C indicates the quantization errors, derived from C cov a r i a n c e which is broadcast in an MT 10 message. If MT 10 data are not available, ε C is set to zero. C is the relative clock–ephemeris correction covariance matrix reconstructed with the parameters E i , j broadcast in MT 28 message, s c a l e is the scale exponent also broadcast in an MT 28 message.
Degradation value δ UDRE is applied to model the variance for the measurement residual error σ f i t 2 . If MT 7 and MT 10 are successfully received, the variance for the measurement residual error σ f i t 2 will be computed with δ UDRE as well as the degradation parameters obtained from MT 7 and MT10. Otherwise, σ f i t 2 will be computed with δ UDRE as well as the default value. The detail computation methods of the measurement residual error variance σ f i t 2 are shown in [19].
Then, the position results and corresponding protection levels are calculated based on the weighted least squares solutions, as expressed as Equation (2).
X = ( G T W G ) 1 G T W L
where X is the unknown position parameters, G is the observation geometry matrix, L is the observations vector, W is the weight matrix which can be expresses as a diagonal matrix, at least four satellites are visible and useful to ensure that the first term is inversed.
W = d i a g ( 1 σ 1 2 , 1 σ n 2 )
where σ i 2 is expressed as
σ i 2 = σ i , f i t 2 + σ i , U I R E 2 + σ i , t r o p o 2 + σ i , a i r 2
In the Equation (4), σ i , f i t 2 is the variance for the measurement residual error of satellite I, σ i , U I R E 2 is the variance of residual of ionospheric model correction, σ i , t r o p o 2 is the variance of the residual of tropospheric model correction, and σ i , a i r 2 is the variance of the observation noise.
The protection level equations are described in detail by [26].

3.2. Service Integrity Evaluation Method

With the continuous improvement of the service accuracy of GNSS core constellations such as the GPS and BDS, SBAS systems pay more attention to the service integrity augmentation. In the actual navigation processing, users usually do not know their true position error (PE), they can only compute the protection levels (PL), taking all relevant error sources into account associated with the observation geometry and integrity data provided by the SBAS system. The definition of the system integrity performance requirement includes an alert limit (AL) against which the requirement can be assessed. If the PL is too large to be contained within the AL, the SBAS service will be indicated as not available. We used the monitoring receivers with precisely known coordinates evenly distributed in the service area to analyze the BDSBAS service integrity. Once a PE of any monitoring receiver exceeds the AL without receiving an alert in time, while the calculated PL is smaller than the AL, a piece of hazardously misleading information (HMI) exists. The SBAS service integrity orders that the HMI probability ( P H M I ) should be less than a certain probability. ICAO provides specific requirements of P H M I for different operations. The evaluation method of SBAS service integrity is shown as follows:
(1)
During the testing period, the starting and ending epochs are indicated as t s t a r t and t e n d , respectively, and the observation sampling interval is expressed as T .
(2)
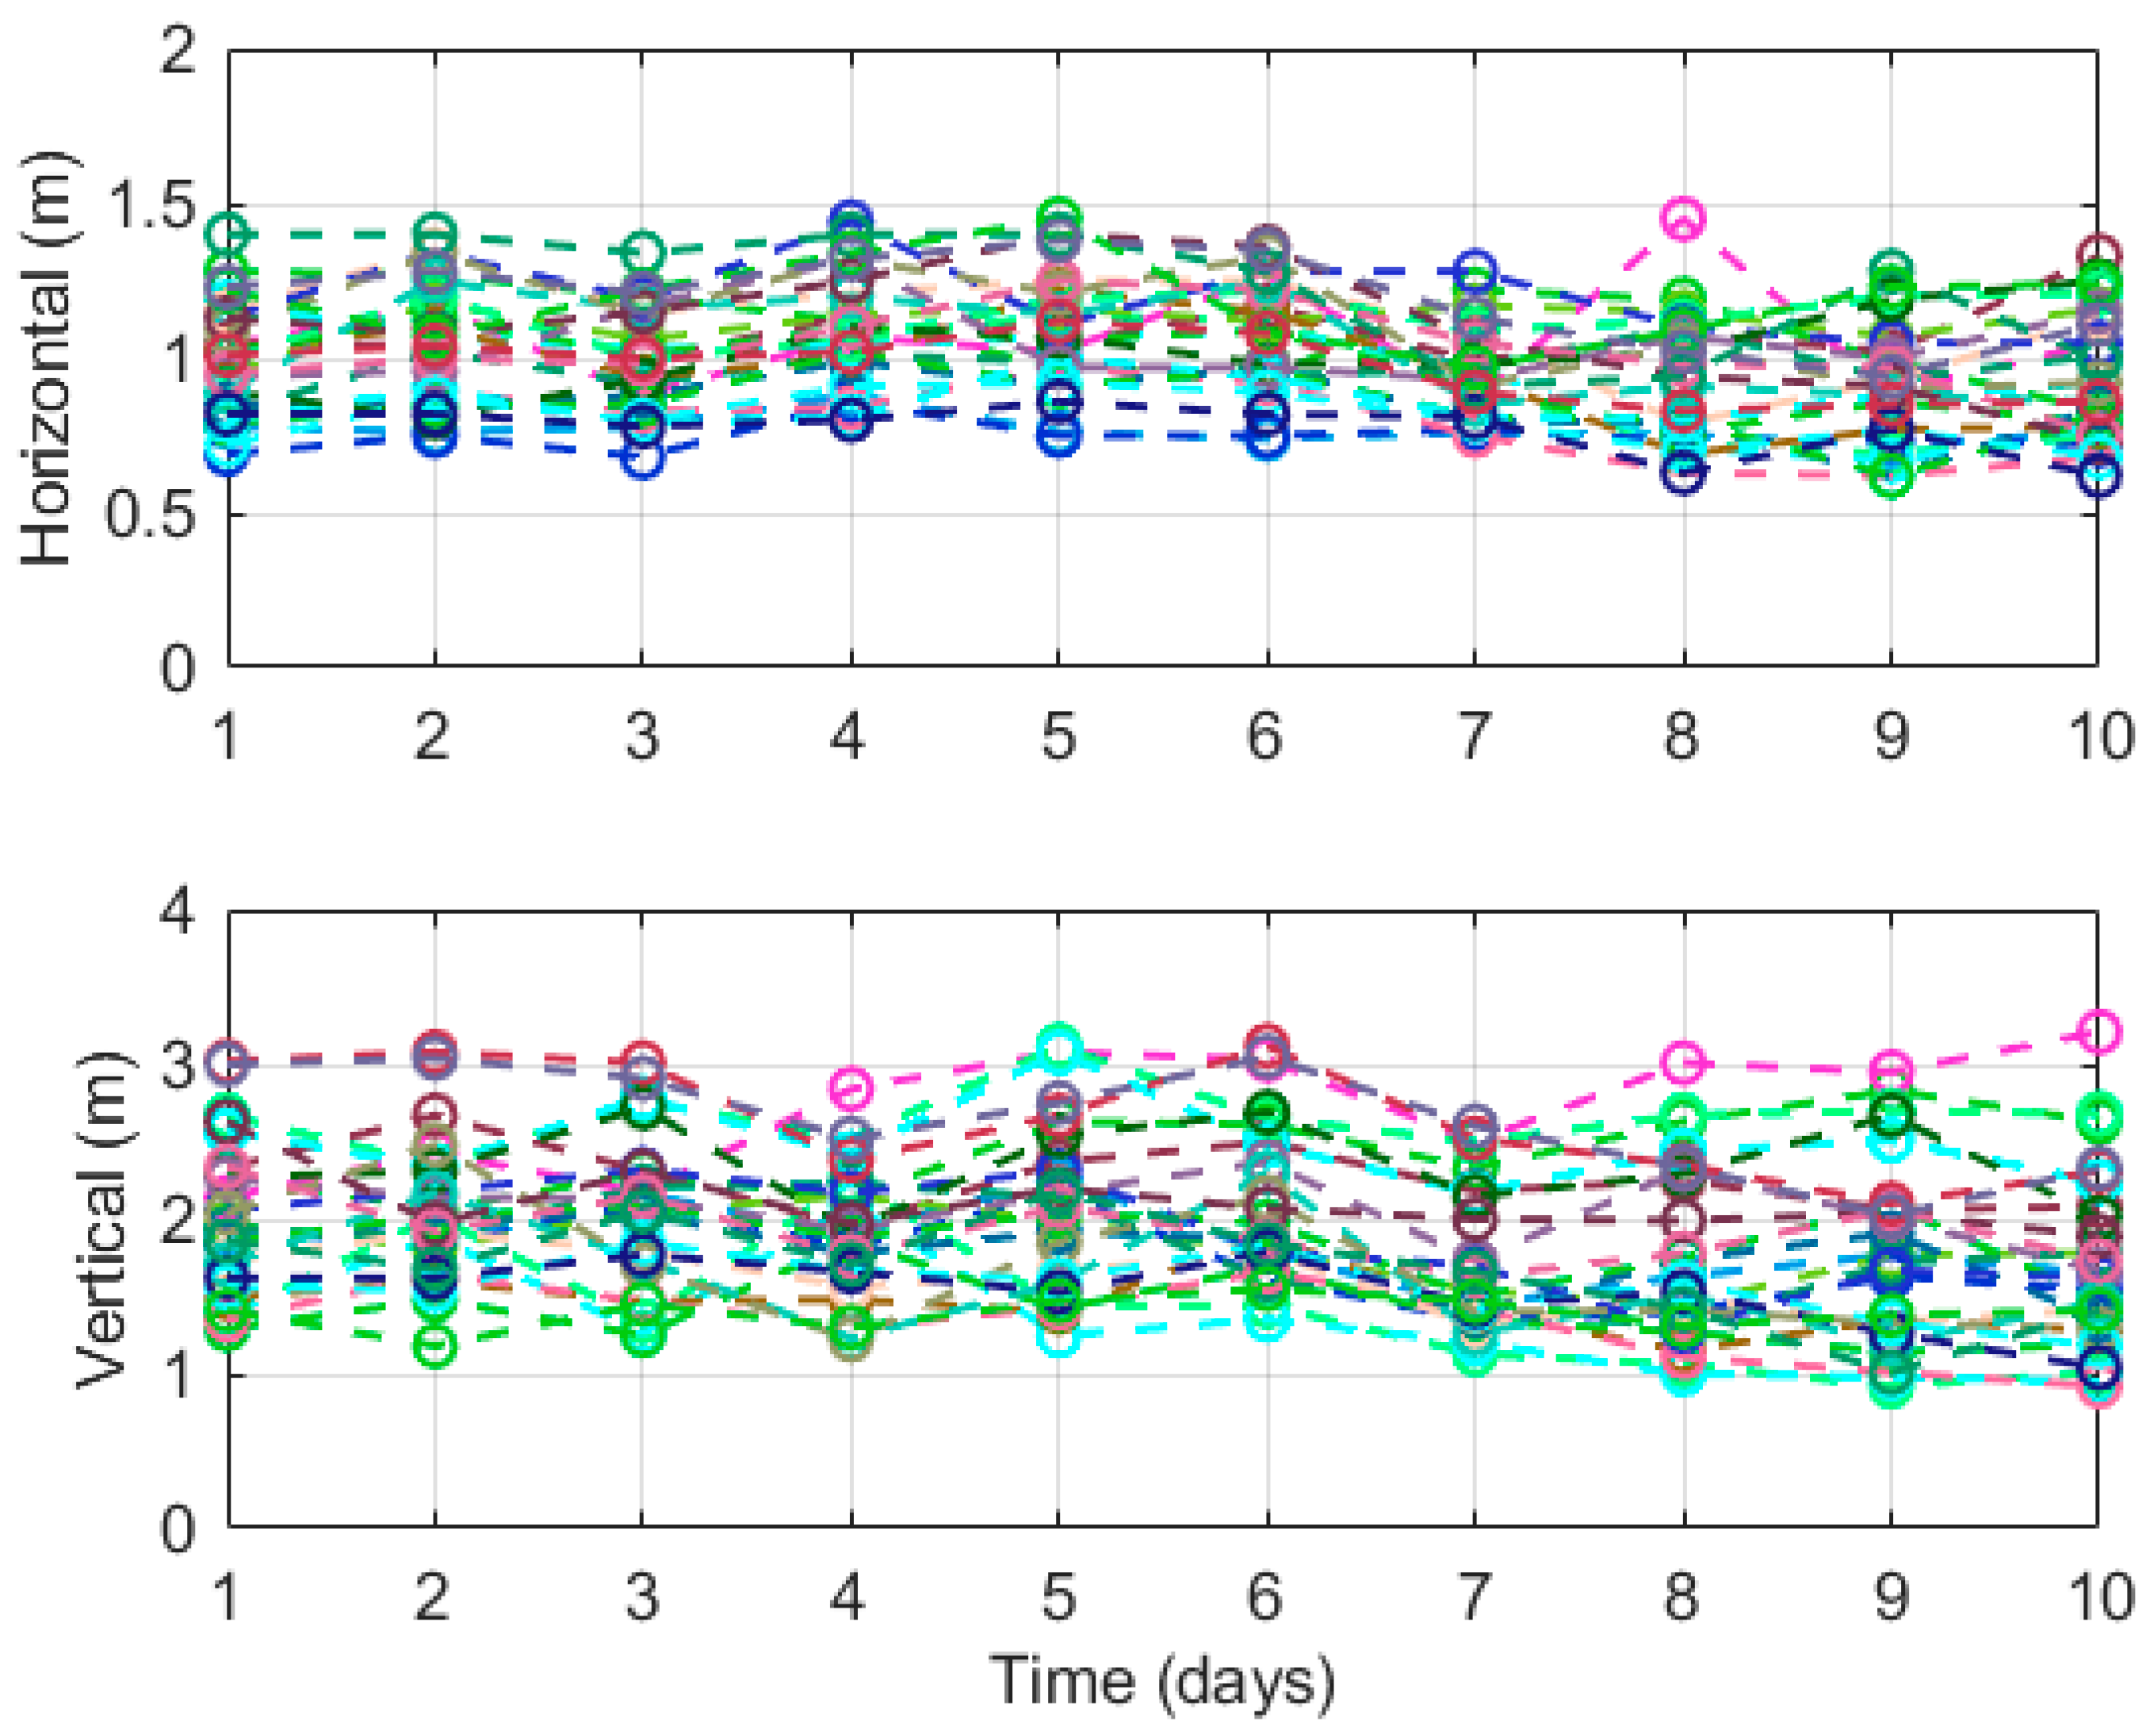
The position coordinates of the monitoring receivers are calculated with BDSBAS broadcast information. The deviation of the estimate coordinates from the true coordinates of the receivers are computed and divided into horizontal position errors (HPE) and vertical position errors (VPE). The time series of HPE and VPE are taken as the statistical samples.
(3)
The associated integrity messages of BDSBAS are used to compute the horizontal protection levels (HPL) and vertical protection levels (VPL) for the monitoring receivers.
(4)
At epoch i , comparing the HPE value and HPL value against the horizontal alert limit (HAL) value. If the three values satisfy the relationship as HPL < HAL < HPE, it indicates a horizontal HMI event, B o o l ( x ) is set equal to 1, otherwise, B o o l ( x ) is set equal to 0. Meanwhile, comparing the VPE value, VPL value against the vertical alert limit (VAL) value, if the three values satisfy VPL < VAL < VPE, it indicates a vertical HMI event, and B o o l ( y ) is set equal to 1, otherwise, B o o l ( y ) is set equal to 0.
(5)
Using all the experimental samples, the probability of HMI of service integrity is determined as:
P H M I = 1 t = t s t a r t , i n c = T o p t e n d T o p { i = t , i n c = T t + T o p I n t e g r i t y _ F l a g ( i ) } t e n d t s t a r t T o p
I n t e g r i t y _ F l a g ( i ) = { 0 , ( B o o l ( x ) i + B o o l ( y ) i ) > 0 1 , o t h e r
where I n t e g r i t y _ F l a g ( i ) is the service integrity indicator, where “0” indicates integrity risk occurred and “1” indicates there is no integrity risk; P H M I is the probability of HMI; T o p is the service sample interval and usually is set to 150 s for APV I approach; T is observation data sampling interval.

3.3. Service Availability Evaluation Method

Service availability is an indication of the ability of the system to provide usable service within the specified coverage area. It can be expressed as the percentage of time that the position accuracy and integrity of the SBAS service remain within the specified threshold. The availability determined with the GNSS and SBAS observations is described below:
(1)
During the testing period, the starting and ending epochs are indicated as t s t a r t and t e n d , respectively, and the observation sampling interval is expressed as T .
(2)
The time series of receiver HPE and VPE are calculated with SBAS corrections and the corresponding HPL and VPL are determined with the SBAS integrity information.
(3)
At observation epoch i , the receiver HPE and VPE are compared with the service horizontal accuracy threshold ( H P O S l i m ) and vertical accuracy threshold ( V P O S l i m ), respectively, to determine the accuracy availability indicator at epoch i .
P o s _ f l a g ( i ) = { 1 , H P E < H P O S l i m & V P E < V P O S l i m 0 , o t h e r
where P o s _ f l a g ( i ) is the accuracy availability indicator at epoch i , “1” indicates service accuracy is available, and “0” indicates service accuracy is not available.
(4)
The service integrity indicator is calculated as Equation (5). Considering both the service integrity indicator and accuracy availability indicator, the service availability is given by Equation (7):
A v a i l = t = t s t a r t , i n c = T o p t e n d T o p { i = t , i n c = T t + T o p [ I n t e g r i t y _ F l a g ( i ) P o s _ f l a g ( i ) ] } t e n d t s t a r t T o p
where A v a i l means the service availability, T o p is the service sample interval and usually is set to 150 s for APV I approach.
Based on the service integrity and availability evaluation methods, the BDSBAS service performance is preliminarily evaluated with real observation data.

4. BDSBAS Service Performance Evaluation

Currently, the BDSBAS SF service augments GPS L1 C/A signal, and BDSBAS DFMC service augments BDS B1C and B2a dual-frequency signals and GPS L1 C/A and L5 dual-frequency signals. Since only a few of GPS satellites broadcast L5 signal and can be monitored in the Chinese service area, the GPS dual-frequency service performance cannot be reasonably evaluated. In addition, the definitions of some degradation parameters in the BDSBAS DFMC protocol are under discussion for optimization, the integrity and availability of the DFMC service will be discussed in future work. The BDSBAS DFMC service only evaluates the accuracy performance based on BDS constellation.
The performance accuracy, integrity and availability of the BDSBAS SF service as well as the accuracy of the BDSBAS DFMC service are preliminarily evaluated, using the observations of 30 monitoring receivers evenly distributed in China from 1 July to 10 July in 2020. These monitoring receivers are independent from those generating BDSBAS differential corrections.

4.1. BDSBAS SF Service Accuracy

According to the user algorithms of BDSBAS messages, the single point position (SPP) results of the BDSBAS SF service were achieved through 30 monitoring receivers’ data. To reduce the observation errors such as multipath error, observation noise, carrier smoothed pseudoranges are used in the SPP estimation. In consideration of calculation efficiency and carrier-smoothed pseudoranges accuracy, the data with 20 s observation sampling interval were adopted. The coordinates of the monitoring receivers are regularly maintained with geodetic survey and GNSS network adjustment calculation, and the 3D coordinate accuracy of these receivers is usually better than 5 cm. As the precise coordinates of the monitoring receivers were already known, the position errors in horizontal and vertical directions were analyzed. The 95th percentile values of absolute value of horizontal and vertical position errors of each day were evaluated, and the time series results during 10 days for 30 receivers were shown in Figure 3.
In Figure 3, the lines in the top subgraph indicate the time series of horizontal position errors of 30 receivers and the lines in the bottom subgraph show the position errors in the vertical direction. Different colors indicate different monitoring receivers. The horizontal axis represents time in days, and the vertical axis represents position errors in meters. It shows that the variance of position errors for the same monitoring receiver is relatively stable in different days. The HPE of different receivers has little difference, varying from 1 m to 1.5 m, while the dispersion of VPE among different receivers is relatively large, varying from 1.5 m to 3 m. The VPE variation of different receivers is mainly caused by the accuracy of corresponding ionospheric grid corrections.
The 24 h time series of position errors of one monitoring receiver are shown as an example, compared between the BDSBAS + GPS SF service and the GPS SF service. The position errors in the north–south, east–west and vertical directions are shown in the top, middle and bottom subgraphs of Figure 4, respectively. In the figure, the red lines indicate the positions errors of the BDSBAS + GPS SF service and the black lines represent the position errors of GPS SF service. The horizontal axis expresses time in hours. As shown in Figure 4, the 95% position errors of the BDSBAS + GPS SF service are 0.638 m, 0.506 m and 1.548 m in the north–south, east–west, and vertical directions, respectively, while the 95% position errors of the GPS SF service are 1.388 m, 0.851 m and 2.427 m in the north–south, east–west, and vertical directions, respectively. The position accuracy of the BDSBAS + GPS SF service is obviously improved compared with the GPS SF service.
The average value of 95% absolute value of position errors over 10 days is used to evaluate the position accuracy of the monitoring receiver. The position accuracies of the BDSBAS + GPS SF service and the GPS SF service are compared analyzed and the statistics for 30 monitoring receivers are listed in Table 2.
The results show that the horizontal and vertical position accuracies of the 30 monitoring receivers are less than 1.5 m and 3 m, respectively, achieved with BDSBAS + GPS SF service. The average accuracies of all 30 receivers in horizontal and vertical directions are about 1 m and 2 m and are improved by about 39% and 33%, respectively, compared with GPS SF service.

4.2. BDSBAS DFMC Service Accuracy

The service accuracy of the BDSBAS DFMC service is similarly analyzed with 30 BDS monitoring receivers. The testing data sampling interval is 20 s. The absolute value of horizontal and vertical position errors with 95% confidence level are calculated every day and the time series of all monitoring receivers 95th percentile position errors are displayed in Figure 5.
In Figure 5, the lines in the top subgraph indicate the time series of horizontal position errors and the lines in the bottom subgraph show the position errors in vertical direction. Different colors indicate different monitoring receivers. The X-axis represents time in days, and the Y-axis represents position errors in meters. It shows that the variance of position errors for the same monitoring receiver is relatively stable in different days, and the position errors of all receivers are relatively consistent. The HPE of different monitoring receivers varies from 0.5 m to 1.0 m, and the VPE of different monitoring receivers varies from 1.0 m to 1.5 m. As most ionospheric delay errors can be eliminated by using dual-frequency observations, the vertical position accuracy of the BDSBAS DFMC service is significantly improved compared with the BDSBAS SF service.
The time series of position errors are compared analyzed between the BDSBAS DFMC service and the BDS dual-frequency service and the results of one monitoring receiver are shown in Figure 6 as an example. The position errors in the north–south, east–west and vertical directions are shown in the top, middle and bottom subgraphs, respectively. The red lines indicate the BDSBAS DFMC service and the black lines represent the BDS dual-frequency service. The X-axis represents time in hours. It is noted that the position errors (95%) are 0.51 m, 0.57 m and 1.60 m in north–south, east–west and vertical directions, respectively, under BDS dual-frequency service, and the position errors (95%) are 0.25 m, 0.23 m and 0.77 m in north–south, east–west and vertical directions under BDSBAS DFMC service. The position accuracy of the BDSBAS DFMC service is also clearly improved compared with the BDS dual-frequency service.
The average value of 95% absolute value of position errors of 10 days is calculated to represent the position accuracy of the monitoring receiver. The position accuracies of 30 monitoring receivers under the BDSBAS DFMC service and the BDS dual-frequency service are comparatively analyzed and the statistics results are listed in Table 3.
The results show that the horizontal and vertical position accuracies of 30 monitoring receivers are less than 1.0 m and 1.5 m, respectively, under BDSBAS DFMC service. The average values of the 30 monitoring receivers’ position accuracies in horizontal and vertical directions are about 0.6 m and 1.2 m, respectively, which are improved by about 25% and 20% compared with BDS dual-frequency service.

4.3. SF Service Integrity and Availability

According to the performance specifications of ICAO Annex 10 for APV-I approach, the HAL and VAL are 40 m and 50 m, respectively, and the horizontal and vertical accuracy thresholds (95%) are required to be above 16 m and 20 m, respectively. The position errors and position protection levels are calculated with the monitoring receiver observations from 1 July to 10 July in 2020. The horizontal integrity and vertical integrity are assessed by the accumulate Stanford diagrams and shown in Figure 7 and Figure 8, respectively.
Stanford diagram outlines the key concepts related to integrity. The X-axis represents the position error and the Y-axis represents the protection level. The misleading information (MI) is defined as when the position error exceeds the protection level but is still less than the required alert limit of the system. If the protection level is less than the alert limit while the position error exceeds the alert limit, it is labelled as hazardously misleading information (HMI). When this occurs, the user is in a potentially dangerous situation as the system is providing dangerous information to the user who is unaware. The integrity risk is the probability that a position error is larger than the alert limit without any alert. If the protection level is less than the system alert limit and the position error is less than the protection level, then the system is available and operating within its normal bounds. If the protection level has exceeded the alert limit, the system service cannot be trusted even though the position error may be acceptable.
It is noted that no integrity risk event occurred during the whole test interval. The availability percentages of the integrity service are about 99.9% and 99.8% in the horizontal and vertical directions, respectively.
To illustrate the detail relation between the protection level and the position error, the 24 h time series of position errors and the corresponding protection levels are shown in Figure 9 at the Beijing station. HPE and HPL are shown in the top subgraph and VPE and VPL are presented in the bottom subgraph. The unit of the X-axis is hours and of the Y-axis is meters. The blue lines indicate position error and the black lines indicate protection level. It shows that the protection level can envelope the position error with 100% confidence, which means that there is no integrity risk event.
If the position error is less than the system accuracy threshold as well as the integrity service is under normal operation, the system service is considered available. Considering both the accuracy and the integrity performance, the service availabilities of all monitoring receivers are analyzed and shown in Table 4.
The results shown that the average value of the service availabilities of the 30 monitoring receivers is about 98%. Some of the receivers located at the service marginal areas have lower service availabilities as their vertical position errors exceed vertical accuracy threshold (20 m), mainly related to the low accuracy of nearby grid corrections as well as the poor dilution of precision (DOP). The accuracy and availability of grid ionospheric corrections at the service marginal areas are low for very few monitoring stations distributed at these areas, which leads to a smaller number of augmented satellites which could be observed in the areas at some time, and leads to the challenge of the service availability.

5. Conclusions

We introduce the development status of the BDSBAS system, including the system architecture and the message user algorithms. The accuracies of the BDSBAS SF service and the DFMC service are discussed with system monitoring receiver observations. The preliminary performance of the BDSBAS SF service integrity and availability are evaluated according to ICAO standards. The results show that the position accuracies of the BDSBAS SF service are about 1.0 m and 2.0 m in the horizontal and vertical directions, respectively, which are improved by about 39% and 33% compared with the GPS SF service. The position accuracies of the BDSBAS DFMC service are about 0.6 m and 1.2 m in the horizontal and vertical directions, respectively, which are improved by about 25% and 20% compared with the BDS dual-frequency service. For the BDSBAS SF service, no integrity risk event was detected during the test period, and the average service availability is about 98%. By increasing the effective monitoring areas of grid ionospheric corrections, the availability of the BDSBAS SF service could be further improved, which is an important research field for BDSBAS system upgrading.

Author Contributions

Conceptualization, Y.C., J.C., X.H. and S.Z.; methodology, Y.C., J.X., L.Z. and S.Z.; software, Y.L. and Q.T.; validation, X.H. and B.W.; formal analysis, L.L.; investigation, Y.C. and Q.T.; resources, Y.L.; data curation, Y.L. and J.X.; writing—original draft preparation, Y.C.; writing—review and editing, Y.C., J.C., L.L., X.H. and B.W.; visualization, Y.C.; supervision, J.C. and L.L.; project administration, J.C., L.L., X.H. and B.W.; funding acquisition, Y.C. and S.Z. All authors have read and agreed to the published version of the manuscript.

Funding

This research was funded by the National Key Research Program of China as the “Collaborative Precision Positioning Project”, grant number [2016YFB0501900], National Natural Science Foundation of China, grant number [41674041, 12173072 and 11203059] and the Shanghai Key Laboratory of Space Navigation and Position Techniques, grant number [12DZ2273300].

Acknowledgments

The authors are grateful for the comments and remarks of the reviewers, which helped to improve the manuscript.

Conflicts of Interest

The authors declare no conflict of interest.

References

  1. FAA. Global Positioning System Wide Area Augmentation System (WAAS) Performance Standard, 1st ed.; FAA: Washington, WA, USA, 2008. [Google Scholar]
  2. Bunce, D. Wide Area Augmentation System (WAAS)—Program Update. In Proceedings of the 26th International Technical Meeting of the Satellite Division of The Institute of Navigation (ION GNSS+ 2013), Nashville, TN, USA, 16–20 September 2013; pp. 2299–2326. [Google Scholar]
  3. Walter, T.; Shallberg, K.; Altshuler, E.; Wanner, W.; Harris, C.; Stimmler, R. WAAS at 15. Navigation 2018, 65, 581–600. [Google Scholar] [CrossRef]
  4. Sakai, T. MSAS Status. In Proceedings of the 26th International Technical Meeting of the Satellite Division of The Institute of Navigation (ION GNSS+ 2013), Nashville, TN, USA, 16–20 September 2013; pp. 2343–2360. [Google Scholar]
  5. Kitamura, M.; Aso, T.; Sakai, T.; Hoshinoo, K. Development of Prototype Dual-frequency Multi-constellation SBAS for MSAS. In Proceedings of the 30th International Technical Meeting of the Satellite Division of The Institute of Navigation (ION GNSS+ 2017), Portland, OR, USA, September 25–29 2017; pp. 997–1007. [Google Scholar]
  6. Kitamura, M.; Sakai, T. DFMC SBAS Prototype System Performance Using Global Monitoring Stations of QZSS. In Proceedings of the ION 2019 Pacific PNT Meeting, Hawaii, HI, USA, 8–11 April 2019; pp. 382–387. [Google Scholar]
  7. Thomas, D. EGNOS V2 Program Update. In Proceedings of the 26th International Technical Meeting of the Satellite Division of The Institute of Navigation (ION GNSS+ 2013), Nashville, TN, USA, 16–20 September 2013; pp. 2327–2342. [Google Scholar]
  8. Fielitz, K.; Meindl, Q.; Breitenacher, A.; Daubrawa, J.; Frankenberger, H.; Braun, R.; Schmitz-Peiffer, A.; Ridings, A.; Marcote, M.; Auz, A.; et al. New Integrity SBAS Test Bed NISTB—DFMC Simulation Results for EGNOS V3 services. In Proceedings of the 31st International Technical Meeting of the Satellite Division of The Institute of Navigation (ION GNSS+ 2018), Miami, FL, USA, 24–28 September 2018; pp. 2104–2118. [Google Scholar]
  9. Bauer, F.; Greze, G.; Haddad, F.; Tourtier, A.; Rols, B.; Urbanska, K. A Study on a New EGNOS V2 Release with Enhanced System Performances. In Proceedings of the 32nd International Technical Meeting of the Satellite Division of The Institute of Navigation (ION GNSS+ 2019), Miami, FL, USA, 16–20 September 2019; pp. 902–919. [Google Scholar]
  10. Rao, K.N.S. GAGAN—The Indian satellite based augmentation system. Indian J. Radio Space Phys. 2007, 36, 293–302. [Google Scholar]
  11. Tsai, Y.-F.; Low, K.-S. Performance assessment on expanding SBAS service areas of GAGAN and MSAS to Singapore region. In Proceedings of the2014 IEEE/ION Position, Location and Navigation Symposium-PLANS 2014, Monterey, CA, USA, 5–8 May 2014; pp. 686–691. [Google Scholar]
  12. Karutin, S. SDCM grogram status. In Proceedings of the 25th International Technical Meeting of the Satellite Division of the Institute of Navigation (ION GNSS 2012), Nashville, TN, USA, 17–21 September 2012; pp. 1034–1044. [Google Scholar]
  13. Karutin, S. SDCM development strategy. In Proceedings of the 23rd International Technical Meeting of The Satellite Division of the Institute of Navigation (ION GNSS 2010), Nashville, TN, USA, 16–20 September 2013; pp. 2361–2372. [Google Scholar]
  14. Choy, S.; Kuckartz, J.; Dempster, A.G.; Rizos, C.; Higgins, M. GNSS satellite-based augmentation systems for Australia. GPS Solutions 2016, 21, 835–848. [Google Scholar] [CrossRef]
  15. RTCA. Minimum Operational Performance Standards for Global Positioning System/Satellite-Based Augmentation System Airborne Equipment; RTCA: Washington, DC, USA, 2013. [Google Scholar]
  16. IWG. SBAS L5 DFMC Interface Control Document (SBAS L5 DFMC ICD); IWG: Brussels, Belgium, 2016. [Google Scholar]
  17. ICAO. Annex 10 to the Convention on International Civil Aviation; ICAO: Montreal, QC, Canada, 2013; Volume 1. [Google Scholar]
  18. China Satellite Navigation Office. The Application Service Architecture of BeiDou Navigation Satellite System (Version 1.0); China Satellite Navigation Office: Beijing, China, 2019. [Google Scholar]
  19. China Satellite Navigation Office. BeiDou Navigation Satellite System Signal In Space Interface Control Document. Satellite Based Augmentation System Service Signal BDSBAS-B1C (Version 1.0); China Satellite Navigation Office: Beijing, China, 2020. [Google Scholar]
  20. Liu, C.; Gao, W.; Shao, B.; Lu, J.; Wang, W.; Chen, Y.; Su, C.; Xiong, S.; Ding, Q. Development of BeiDou Satellite-Based Augmentation System. Navigation 2021, 68, 405–417. [Google Scholar]
  21. Liu, Y.; Cao, Y.; Tang, C.; Chen, J.; Zhao, L.; Zhou, S.; Hu, X.; Tian, Q.; Yang, Y. Pseudorange Bias Analysis and Preliminary Service Performance Evaluation of BDSBAS. Remote Sens. 2021, 13, 4815. [Google Scholar] [CrossRef]
  22. Gao, W.; Cao, Y.; Liu, C.; Lu, J.; Shao, B.; Xiong, S.; Su, C. Construction Progress and Aviation Flight Test of BDSBAS. Remote Sens. 2022, 14, 1218. [Google Scholar] [CrossRef]
  23. Cao, Y.; Hu, X.; Zhou, J.; Wu, B.; Liu, L.; Zhou, S.; Su, R.; Chang, Z.; Wu, X. Kinematic Wide Area Differential Corrections for BeiDou Regional System Basing on Two-Way Time Synchronization. Lect. Notes Electr. Eng. 2014, 305, 277–288. [Google Scholar]
  24. Liu, J.-L.; Cao, Y.-L.; Hu, X.-G.; Tang, C.-P. Beidou wide-area augmentation system clock error correction and performance verification. Adv. Space Res. 2020, 65, 2348–2359. [Google Scholar] [CrossRef]
  25. Zhao, L.; Hu, X.; Tang, C.; Cao, Y.; Zhou, S.; Yang, Y.; Liu, L.; Guo, R. Generation of DFMC SBAS corrections for BDS-3 satellites and improved positioning performances. Adv. Space Res. 2020, 66, 702–714. [Google Scholar] [CrossRef]
  26. Cao, Y.; Chen, J.; Hu, X.; He, F.; Bian, L.; Wang, W.; Wu, B.; Yu, Y.; Wang, J.; Tian, Q. Design of BDS-3 integrity monitoring and preliminary analysis of its performance. Adv. Space Res. 2019, 65, 1125–1138. [Google Scholar] [CrossRef]
Figure 1. The workflow of the BDSBAS system. The red line indicates the SF service messages processing and the green line indicates the DFMC service messages processing.
Remotesensing 14 04314 g001
Figure 2. Algorithm flowchart of BDSBAS SF messages [19].
Remotesensing 14 04314 g002
Figure 3. Time series of 95th percentile position errors for 30 monitoring receivers under BDSBAS SF service. One color represents one receiver.
Remotesensing 14 04314 g003
Figure 4. Comparison of position errors between the BDSBAS + GPS SF service (red lines) and the GPS SF service (black lines).
Remotesensing 14 04314 g004
Figure 5. Time series of 95th percentile position errors of 30 monitoring receivers under BDSBAS DFMC service. One color represents one receiver.
Remotesensing 14 04314 g005
Figure 6. Comparison of position errors between the BDSBAS DFMC service (red lines) and the BDS dual-frequency service (black lines).
Remotesensing 14 04314 g006
Figure 7. Horizontal integrity assessment with Stanford diagram. No misleading information (MI) and no hazardously misleading information events exist. The 99.9375% testing epochs are operating within their normal bounds in horizontal direction according to APV-I approach requirement.
Remotesensing 14 04314 g007
Figure 8. Vertical integrity assessment with Stanford diagram. No misleading information (MI) and no hazardously misleading information events exist. The 99.8025% testing epochs are operating within their normal bounds in vertical direction according to APV-I approach requirement.
Remotesensing 14 04314 g008
Figure 9. Time series of position errors and protection levels at the Beijing station.
Remotesensing 14 04314 g009
Table 1. Comparison of the BDSBAS SF service and the DFMC service.
SF ServiceDFMC Service
Broadcast SignalBDSBAS-B1CBDSBAS-B2a
Broadcast Satellites3GEO3GEO
Augmentation constellation(s)GPSBDS/GPS/Galileo/GLONASS
SBAS Network TimeGPS TimeBDS Time
Clock and Ephemeris slow correctionsBroadcastBroadcast
Clock fast correctionsBroadcastNot Broadcast
Clock–Ephemeris correction integrityBroadcastBroadcast
Clock–Ephemeris covariance matrixBroadcastBroadcast
Ionospheric grid delay corrections and integrityBroadcastNot Broadcast
Degradation informationBroadcastBroadcast
SBAS (GEO) satellites ephemeris and almanacsBroadcastBroadcast
Table 2. The position accuracy statistics of monitoring receivers under the BDSBAS + GPS SF service and the GPS SF service (unit is meters).
Rcv IDHorizontal
(95%)
Vertical
(95%)
Rcv IDHorizontal
(95%)
Vertical
(95%)
BDSBAS + GPSGPSBDSBAS + GPSGPSBDSBAS + GPSGPSBDSBAS + GPSGPS
10.7691.6991.8372.488161.1291.6312.6623.039
20.7441.6881.7392.477170.8651.6292.5032.708
31.1011.6932.4443.727181.1971.4801.9102.451
40.9641.5381.3982.773191.0221.9802.3583.157
50.9611.5581.3382.840201.0481.9102.0722.868
61.0711.9772.7363.304211.0391.4141.6172.654
71.0852.1472.2703.254221.1201.3961.6862.668
81.1161.4951.8292.424231.1011.6892.1072.675
90.9711.5311.8232.479241.0251.6651.9312.716
100.9621.5741.4512.791250.8061.5881.5592.915
110.9721.5241.3932.782260.7731.5951.5262.972
120.7941.5261.3312.806271.2341.5931.6822.265
131.1291.6511.6002.619281.1921.6441.3932.600
140.8491.6681.7822.617290.9701.6332.6563.964
150.8411.6621.8682.752301.1971.6312.6564.060
Mean1.001.651.912.86
Table 3. The position accuracy comparison under the BDSBAS DFMC service and the BDS dual-frequency service (unit is meters).
Rcv IDHorizontal
(95%)
Vertical
(95%)
Rcv IDHorizontal
(95%)
Vertical
(95%)
BDSBAS + BDSBDSBDSBAS + BDSBDSBDSBAS + BDSBDSBDSBAS + BDSBDS
10.5580.7651.0501.176160.6770.9311.2371.377
20.3650.6420.7331.079170.7410.9281.2631.469
30.5710.7581.1401.485180.5520.8441.0251.392
40.5470.7481.1861.507190.5150.7371.0851.379
50.4230.6491.0011.353200.5600.7061.2101.455
60.5390.7841.2591.537210.4800.6530.9871.403
70.6240.8921.2771.606220.6790.8451.0891.361
80.8341.0231.3331.537230.6760.8351.1581.343
90.5030.7300.8301.144240.5260.7011.1401.400
100.7580.9041.3221.459250.5520.7561.0311.395
110.5080.7081.0661.307260.6590.8551.3331.706
120.5030.7540.8961.287270.4670.7161.1761.343
130.5720.7150.9811.244280.7040.8591.0921.314
140.5860.7670.9651.298290.7250.9151.2591.342
150.8811.1331.2031.520300.5710.7890.9811.200
Mean0.600.801.111.38
Table 4. Statistics results of monitoring receiver service availability.
RcvIDAvailabilityRcvIDAvailability
10.995160.995
20.999170.995
30.984180.995
40.984190.944
50.926200.961
60.934210.993
70.981220.914
80.989230.988
90.991240.973
100.995250.976
110.993260.995
120.994270.995
130.983280.994
140.978290.979
150.995300.982
Average value0.98
Publisher’s Note: MDPI stays neutral with regard to jurisdictional claims in published maps and institutional affiliations.

