Next Issue
Volume 14, September-2
Previous Issue
Volume 14, August-2
 
 
remotesensing-logo

Journal Browser

Journal Browser

Remote Sens., Volume 14, Issue 17 (September-1 2022) – 301 articles

Cover Story (view full-size image): 
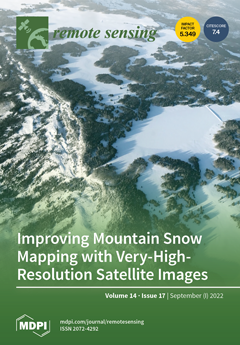
Very-high-resolution (VHR) optical imaging satellites can offer precise, accurate, and direct measurements of snow-covered areas and small-scale snow features in regions of complex land cover and terrain. We explored the potential of Maxar WorldView-2 and WorldView-3 stereo images for land and snow cover mapping using machine learning models. Our results demonstrate that strategic observations with VHR satellites complement operational snow data products from Landsat and MODIS to map the evolution of seasonal snow cover. View this paper
  • Issues are regarded as officially published after their release is announced to the table of contents alert mailing list.
  • You may sign up for e-mail alerts to receive table of contents of newly released issues.
  • PDF is the official format for papers published in both, html and pdf forms. To view the papers in pdf format, click on the "PDF Full-text" link, and use the free Adobe Reader to open them.
Order results
Result details
Section
Select all
Export citation of selected articles as:
27 pages, 11706 KiB  
Article
Synchronous Atmospheric Correction of High Spatial Resolution Images from Gao Fen Duo Mo Satellite
by Lingling Xu, Wei Xiong, Weining Yi, Zhenwei Qiu, Xiao Liu, Dongying Zhang, Wei Fang, Zhengqiang Li, Weizhen Hou, Jun Lin, Zhongzheng Hu, Tao Wang and Wenyu Cui
Remote Sens. 2022, 14(17), 4427; https://doi.org/10.3390/rs14174427 - 05 Sep 2022
Viewed by 2326
Abstract
Atmospheric conditions vary significantly in terms of the temporal and spatial scales. Therefore, it is critical to obtain atmospheric parameters synchronized with an image for atmospheric correction based on radiative transfer calculation methods. On 3 July 2020, the high resolution and multimode imaging [...] Read more.
Atmospheric conditions vary significantly in terms of the temporal and spatial scales. Therefore, it is critical to obtain atmospheric parameters synchronized with an image for atmospheric correction based on radiative transfer calculation methods. On 3 July 2020, the high resolution and multimode imaging satellite, Gao Fen Duo Mo (GFDM), which was the first civilian high-resolution remote sensing satellite equipped with the Synchronization Monitoring Atmospheric Corrector (SMAC), was launched. The SMAC is a multispectral and polarization detection device that is used to retrieve atmospheric parameters that are time-synchronized with the image sensor of GFDM in the same field-of-view. On the basis of the atmospheric parameters obtained from the SMAC, a synchronization atmospheric correction (Syn-AC) method is proposed to remove the influence of the atmosphere and the adjacency effects to retrieve the surface reflectance. The Syn-AC method was applied in the experiments of synchronous atmospheric correction for GFDM images, where the surface reflectance retrieved via the Syn-AC method was compared with the field-measured values. In addition, the classical correction method, the FLAASH, was applied in the experiments to compare its performance with that of the Syn-AC method. The results indicated that the image possessed better clarity and contrast with the blurring effect removed, and the multispectral reflectance was in agreement with the field-measured spectral reflectance. The deviations between the reflectance retrievals of Syn-AC and the field-measured values of the selected targets were within 0.0625, representing a higher precision than that of the FLAASH method (the max deviation was 0.2063). For the three sites, the mean relative error of Syn-AC was 19.3%, and the mean relative error of FLAASH was 76.6%. Atmospheric correction based on synchronous atmospheric parameters can improve the quantitative accuracy of remote sensing images, and it is meaningful for remote sensing applications. Full article
(This article belongs to the Topic Advances in Environmental Remote Sensing)
Show Figures

Graphical abstract

21 pages, 12123 KiB  
Article
Crop Monitoring Using Sentinel-2 and UAV Multispectral Imagery: A Comparison Case Study in Northeastern Germany
by Minhui Li, Redmond R. Shamshiri, Cornelia Weltzien and Michael Schirrmann
Remote Sens. 2022, 14(17), 4426; https://doi.org/10.3390/rs14174426 - 05 Sep 2022
Cited by 17 | Viewed by 4872
Abstract
Monitoring within-field crop variability at fine spatial and temporal resolution can assist farmers in making reliable decisions during their agricultural management; however, it traditionally involves a labor-intensive and time-consuming pointwise manual process. To the best of our knowledge, few studies conducted a comparison [...] Read more.
Monitoring within-field crop variability at fine spatial and temporal resolution can assist farmers in making reliable decisions during their agricultural management; however, it traditionally involves a labor-intensive and time-consuming pointwise manual process. To the best of our knowledge, few studies conducted a comparison of Sentinel-2 with UAV data for crop monitoring in the context of precision agriculture. Therefore, prospects of crop monitoring for characterizing biophysical plant parameters and leaf nitrogen of wheat and barley crops were evaluated from a more practical viewpoint closer to agricultural routines. Multispectral UAV and Sentinel-2 imagery was collected over three dates in the season and compared with reference data collected at 20 sample points for plant leaf nitrogen (N), maximum plant height, mean plant height, leaf area index (LAI), and fresh biomass. Higher correlations of UAV data to the agronomic parameters were found on average than with Sentinel-2 data with a percentage increase of 6.3% for wheat and 22.2% for barley. In this regard, VIs calculated from spectral bands in the visible part performed worse for Sentinel-2 than for the UAV data. In addition, large-scale patterns, formed by the influence of an old riverbed on plant growth, were recognizable even in the Sentinel-2 imagery despite its much lower spatial resolution. Interestingly, also smaller features, such as the tramlines from controlled traffic farming (CTF), had an influence on the Sentinel-2 data and showed a systematic pattern that affected even semivariogram calculation. In conclusion, Sentinel-2 imagery is able to capture the same large-scale pattern as can be derived from the higher detailed UAV imagery; however, it is at the same time influenced by management-driven features such as tramlines, which cannot be accurately georeferenced. In consequence, agronomic parameters were better correlated with UAV than with Sentinel-2 data. Crop growers as well as data providers from remote sensing services may take advantage of this knowledge and we recommend the use of UAV data as it gives additional information about management-driven features. For future perspective, we would advise fusing UAV with Sentinel-2 imagery taken early in the season as it can integrate the effect of agricultural management in the subsequent absence of high spatial resolution data to help improve crop monitoring for the farmer and to reduce costs. Full article
(This article belongs to the Special Issue UAV Imagery for Precision Agriculture)
Show Figures

Graphical abstract

17 pages, 5495 KiB  
Technical Note
Evaluating and Analyzing the Potential of the Gaofen-3 SAR Satellite for Landslide Monitoring
by Ningling Wen, Fanru Zeng, Keren Dai, Tao Li, Xi Zhang, Saied Pirasteh, Chen Liu and Qiang Xu
Remote Sens. 2022, 14(17), 4425; https://doi.org/10.3390/rs14174425 - 05 Sep 2022
Cited by 8 | Viewed by 1661
Abstract
Gaofen-3 is the first Chinese spaceborne C-band SAR satellite with multiple polarizations. The Gaofen-3 satellite’s data has few applications for monitoring landslides at present, and its potential for use requires further investigation. Consequently, we must evaluate and analyze the landslide interference quality and [...] Read more.
Gaofen-3 is the first Chinese spaceborne C-band SAR satellite with multiple polarizations. The Gaofen-3 satellite’s data has few applications for monitoring landslides at present, and its potential for use requires further investigation. Consequently, we must evaluate and analyze the landslide interference quality and displacement monitoring derived from the Gaofen-3 SAR satellite’s data, particularly in high and steep, mountainous regions. Based on the nine Gaofen-3 SAR datasets gathered in 2020–2021, this study used DInSAR technology to track landslide displacement in Mao County, Sichuan Province, utilizing data from Gaofen-3. Our findings were compared to SENTINEL-1 and ALOS-2 data for the same region. This study revealed that due to its large spatial baseline, Gaofen-3’s SAR data have a smaller interference effect and weaker coherence than the SENTINEL-1 and ALOS-2 SAR data. In addition, the displacement sensitivity of the Gaofen-3 and SENTINEL-1 data (C-band) is higher than that of the ALOS-2 data (L-band). Further, we conducted a study of observation applicability based on the geometric distortion distribution of the three forms of SAR data. Gaofen-3’s SAR data are very simple to make layover and have fewer shadow areas in hilly regions, and it theoretically has more suitable observation areas (71.3%). For its practical application in mountainous areas, we introduced the passive geometric distortion analysis method. Due to its short incidence angle (i.e., 25.8°), which is less than the other two satellites’ SAR data, only 39.6% of the Gaofen-3 SAR data in the study area is acceptable for suitable observation areas. This study evaluated and analyzed the ability of using Gaofen-3’s data to monitor landslides in mountainous regions based on the interference effect and observation applicability analysis, thereby providing a significant reference for the future use and design of Gaofen-3’s data for landslide monitoring. Full article
Show Figures

Graphical abstract

21 pages, 35860 KiB  
Article
Performance Analysis of GPS/BDS Broadcast Ionospheric Models in Standard Point Positioning during 2021 Strong Geomagnetic Storms
by Qiang Li, Xing Su, Yan Xu, Hongyang Ma, Zhimin Liu, Jianhui Cui and Tao Geng
Remote Sens. 2022, 14(17), 4424; https://doi.org/10.3390/rs14174424 - 05 Sep 2022
Cited by 7 | Viewed by 1638
Abstract
The broadcast ionospheric model is one of the main methods for eliminating ionospheric delay errors for the Global Navigation Satellite Systems (GNSS) single-frequency users. GPS Klobuchar model (GPSK8) is the widely used broadcast ionospheric model for GPS, while BDS usually implements the BDS [...] Read more.
The broadcast ionospheric model is one of the main methods for eliminating ionospheric delay errors for the Global Navigation Satellite Systems (GNSS) single-frequency users. GPS Klobuchar model (GPSK8) is the widely used broadcast ionospheric model for GPS, while BDS usually implements the BDS Klobuchar model (BDSK8) and BeiDou Global Broadcast Ionospheric Delay Correction Model (BDGIM). Geomagnetic storms may cause interference within the ionosphere and near-Earth space, compromising the accuracy of ionospheric models and adversely affecting the navigation satellite systems. This paper analyzes the static Standard Point Positioning (SPP) accuracy of GPS and BDS by implementing the broadcast ionospheric models and then investigates the impact of strong geomagnetic storms occurring in 2021 on positioning accuracy. The results show that the global 3D positioning accuracy (95%) of GPS + GPSK8, BDS + BDSK8, and BDS + BDGIM are 3.92 m, 4.63 m, and 3.50 m respectively. BDS has a better positioning accuracy in the northern hemisphere than that of the southern hemisphere, while the opposite is valid for GPS. In the mid-latitude region of the northern hemisphere, BDS + BDSK8 and BDS + BDGIM have similar positioning accuracy and are both better than GPS + GPSK8. The positioning accuracy after applying those three broadcast ionospheric models shows the superior performances of winter and summer over spring and autumn (based on the northern hemisphere seasons). With the exception of during winter, nighttime accuracy is better than that of daytime. The strong geomagnetic storm that occurred on the day of year (DOY) 132, 2021 has an impact on the positioning accuracy for only a small number of stations; however, the global average positioning accuracy is not significantly affected. The strong geomagnetic storms that occurred in DOY 307 and DOY 308 have a significant impact on the positioning accuracy of dozens of stations, and the global average positioning accuracy is affected to a certain extent, with some stations experiencing a serious loss of accuracy. Decreased degrees in positioning accuracy is proportional to the intensity of the geomagnetic storm. Of the 33 IGS Multi-GNSS Experiment (MGEX) stations worldwide, those located in the low and mid-latitudes are more significantly affected by the geomagnetic storms compared with higher latitudes. Evident fluctuations of the positioning errors existed during the strong geomagnetic storms, with an increase in extreme values, particularly in the up direction. Full article
(This article belongs to the Special Issue Advances in Beidou/GNSS High Precision Positioning and Navigation)
Show Figures

Graphical abstract

26 pages, 20496 KiB  
Article
Remote Sensing Scene Image Classification Based on mmsCNN–HMM with Stacking Ensemble Model
by Xiang Cheng and Hong Lei
Remote Sens. 2022, 14(17), 4423; https://doi.org/10.3390/rs14174423 - 05 Sep 2022
Cited by 9 | Viewed by 1955
Abstract
The development of convolution neural networks (CNNs) has become a significant means to solve the problem of remote sensing scene image classification. However, well-performing CNNs generally have high complexity and are prone to overfitting. To handle the above problem, we present a new [...] Read more.
The development of convolution neural networks (CNNs) has become a significant means to solve the problem of remote sensing scene image classification. However, well-performing CNNs generally have high complexity and are prone to overfitting. To handle the above problem, we present a new classification approach using an mmsCNN–HMM combined model with stacking ensemble mechanism in this paper. First of all, a modified multi-scale convolution neural network (mmsCNN) is proposed to extract multi-scale structural features, which has a lightweight structure and can avoid high computational complexity. Then, we utilize a hidden Markov model (HMM) to mine the context information of the extracted features of the whole sample image. For different categories of scene images, the corresponding HMM is trained and all the trained HMMs form an HMM group. In addition, our approach is based on a stacking ensemble learning scheme, in which the preliminary predicted values generated by the HMM group are used in an extreme gradient boosting (XGBoost) model to generate the final prediction. This stacking ensemble learning mechanism integrates multiple models to make decisions together, which can effectively prevent overfitting while ensuring accuracy. Finally, the trained XGBoost model conducts the scene category prediction. In this paper, the six most widely used remote sensing scene datasets, UCM, RSSCN, SIRI-WHU, WHU-RS, AID, and NWPU, are selected to carry out all kinds of experiments. The numerical experiments verify that the proposed approach shows more important advantages than the advanced approaches. Full article
(This article belongs to the Section AI Remote Sensing)
Show Figures

Graphical abstract

17 pages, 3548 KiB  
Article
Application and Analysis of XCO2 Data from OCO Satellite Using a Synthetic DINEOF–BME Spatiotemporal Interpolation Framework
by Yutong Jiang, Zekun Gao, Junyu He, Jiaping Wu and George Christakos
Remote Sens. 2022, 14(17), 4422; https://doi.org/10.3390/rs14174422 - 05 Sep 2022
Cited by 6 | Viewed by 1750
Abstract
Carbon dioxide (CO2) is one of the main greenhouse gases leading to global warming, and the ocean is the largest carbon reservoir on the earth that plays an important role in regulating CO2 concentration on a global scale. The column-averaged [...] Read more.
Carbon dioxide (CO2) is one of the main greenhouse gases leading to global warming, and the ocean is the largest carbon reservoir on the earth that plays an important role in regulating CO2 concentration on a global scale. The column-averaged dry-air mole fraction of atmospheric CO2 (XCO2) is a key parameter in describing ocean carbon content. In this paper, the Data Interpolation Empirical Orthogonal Function (DINEOF) and the Bayesian Maximum Entropy (BME) methods are combined to interpolate XCO2 data of Orbiting Carbon Observatory 2 (OCO-2) and Orbiting Carbon Observatory 3 (OCO-3) from January to December 2020 occurring within the geographical range of 15–45°N and 120–150°E. At the first stage of our proposed analysis, spatiotemporal information was used by the DINEOF method to perform XCO2 interpolation that improved data coverage; at the second stage, the DINEOF-generated interpolation results were regarded as soft data and were subsequently assimilated using the BME method to obtain improved XCO2 interpolation values. The performance of the synthetic DINEOF–BME interpolation method was evaluated by means of a five-fold cross-validation method. The results showed that the Mean Absolute Error (MAE), the Root Mean Square Error (RMSE), and the Bias of the DINEOF-based OCO-2 and OCO-3 interpolations were 2.106 ppm, 3.046 ppm, and 1.035 ppm, respectively. On the other hand, the MAE, RMSE, and Bias of the cross-validation results obtained by the DINEOF–BME were 1.285 ppm, 2.422 ppm, and −0.085 ppm, respectively, i.e., smaller than the results obtained by DINEOF. In addition, based on the in situ measured XCO2 data provided by the Total Carbon Column Observing Network (TCCON), the original OCO-2 and OCO-3 data were combined and compared with the interpolated products of the synthetic DINEOF–BME framework. The accuracy of the original OCO-2 and OCO-3 products is lower than the DINEOF–BME-generated XCO2 products in terms of MAE (1.751 ppm vs. 2.616 ppm), RMSE (2.877 ppm vs. 3.566 ppm) and Bias (1.379 ppm vs 1.622 ppm), the spatiotemporal coverage of XCO2 product also improved dramatically from 16% to 100%. Lastly, this study demonstrated the feasibility of the synthetic DINEOF–BME approach for XCO2 interpolation purposes and the ability of the BME method to be successfully combined with other techniques. Full article
Show Figures

Graphical abstract

37 pages, 20131 KiB  
Article
Implementation of an Artificial Intelligence Approach to GPR Systems for Landmine Detection
by Oleksandr A. Pryshchenko, Vadym Plakhtii, Oleksandr M. Dumin, Gennadiy P. Pochanin, Vadym P. Ruban, Lorenzo Capineri and Fronefield Crawford
Remote Sens. 2022, 14(17), 4421; https://doi.org/10.3390/rs14174421 - 05 Sep 2022
Cited by 10 | Viewed by 3031
Abstract
Artificial Neural Network (ANN) approaches are applied to detect and determine the object class using a special set of the UltraWideBand (UWB) pulse Ground Penetrating Radar (GPR) sounding results. It used the results of GPR sounding with the antenna system, consisting of one [...] Read more.
Artificial Neural Network (ANN) approaches are applied to detect and determine the object class using a special set of the UltraWideBand (UWB) pulse Ground Penetrating Radar (GPR) sounding results. It used the results of GPR sounding with the antenna system, consisting of one radiator and four receiving antennas located around the transmitting antenna. The presence of four receiving antennas and, accordingly, the signals received from four spatially separated positions of the antennas provide a collection of signals received after reflection from an object at different angles and, due to this, to determine the location of the object in a coordinate system, connected to the antenna. We considered the sums and differences of signals received by two of the four antennas in six possible combinations: (1 and 2, 1 and 3, 2 and 3, 1 and 4, etc.). These combinations were then stacked sequentially one by one into one long signal. Synthetic signals constructed in such a way contain many more notable differences and specific information about the class to which the object belongs as well as the location of the searched object compared to the signals obtained by an antenna system with just one radiating and one receiving antenna. It therefore increases the accuracy in determining the object’s coordinates and its classification. The pulse radiation, propagation, and scattering are numerically simulated by the finite difference time domain (FDTD) method. Results from the experiment on mine detection are used to examine ANN too. The set of signals from different objects having different distances from the GPR was used as a training and testing dataset for ANN. The training aims to recognize and classify the detected object as a landmine or other object and to determine its location. The influence of Gaussian noise added to the signals on noise immunity of ANN was investigated. The recognition results obtained by using an ANN ensemble are presented. The ensemble consists of fully connected and recurrent neural networks, gated recurrent units, and a long-short term memory network. The results of the recognition by all ANNs are processed by a meta network to provide a better quality of underground object classification. Full article
Show Figures

Figure 1

21 pages, 7826 KiB  
Article
An Analysis of Spatio-Temporal Relationship between Satellite-Based Land Surface Temperature and Station-Based Near-Surface Air Temperature over Brazil
by Jiang Liu, Daniel Fiifi Tawia Hagan, Thomas R. Holmes and Yi Liu
Remote Sens. 2022, 14(17), 4420; https://doi.org/10.3390/rs14174420 - 05 Sep 2022
Cited by 6 | Viewed by 2055
Abstract
A better understanding of the relationship between land surface temperature (Ts) and near-surface air temperature (Ta) is crucial for improving the simulation accuracy of climate models, developing retrieval schemes for soil and vegetation moisture, and estimating large-scale Ta from satellite-based Ts observations. In [...] Read more.
A better understanding of the relationship between land surface temperature (Ts) and near-surface air temperature (Ta) is crucial for improving the simulation accuracy of climate models, developing retrieval schemes for soil and vegetation moisture, and estimating large-scale Ta from satellite-based Ts observations. In this study, we investigated the relationship between multiple satellite-based Ts products, derived from the Atmospheric Infrared Sounder (AIRS) and the Moderate Resolution Imaging Spectroradiometer (MODIS) onboard Aqua satellite, and Ta from 204 meteorological stations over Brazil during 2003–2016. Monthly satellite-based Ts products used in this study include: (1) AIRS Version 6 with 1° spatial resolution, (2) AIRS Version 7 with 1° spatial resolution, (3) MODIS Collection 6 with 0.05° spatial resolution, and (4) MODIS Collection 6 with 1° spatial resolution re-sampled from (3) for a direct comparison with AIRS products. We found that satellite-based Ts is lower than Ta over the forest area, but higher than Ta over the non-forest area. Nevertheless, the correlation coefficients (R) between monthly Ta and four Ts products during 2003–2016 are greater than 0.8 over most stations. The long-term trend analysis shows a general warming trend in temperatures, particularly over the central and eastern parts of Brazil. The satellite products could also observe the increasing Ts over the deforestation region. Furthermore, we examined the temperature anomalies during three drought events in the dry season of 2005, 2010, and 2015. All products show similar spatio-temporal patterns, with positive temperature anomalies expanding in areal coverage and magnitude from the 2005 to 2015 event. The above results show that satellite-based Ts is sensitive in reflecting environmental changes such as deforestation and extreme climatic events, and can be used as an alternative to Ta for climatological studies. Moreover, the observed differences between Ts and Ta may inform how thermal assumptions can be improved in satellite-based retrievals of soil and vegetation moisture or evapotranspiration. Full article
(This article belongs to the Special Issue Remote Sensing Monitoring of Land Surface Temperature (LST) II)
Show Figures

Graphical abstract

19 pages, 8687 KiB  
Article
Unsupervised Change Detection around Subways Based on SAR Combined Difference Images
by Aihui Jiang, Jie Dai, Sisi Yu, Baolei Zhang, Qiaoyun Xie and Huanxue Zhang
Remote Sens. 2022, 14(17), 4419; https://doi.org/10.3390/rs14174419 - 05 Sep 2022
Cited by 1 | Viewed by 1628
Abstract
Prompt and precise acknowledgement of surface change around subways is of considerable significance in urban rail protection and local environmental management. Research has proven the considerable potential of synthetic aperture radar (SAR) images for detecting such information; however, previous studies have mostly focused [...] Read more.
Prompt and precise acknowledgement of surface change around subways is of considerable significance in urban rail protection and local environmental management. Research has proven the considerable potential of synthetic aperture radar (SAR) images for detecting such information; however, previous studies have mostly focused on change intensity using single Difference images (DIs), e.g., difference value DI (DVDI) and mean value DI (MVDI). With the aim of more accurate information with respect to surface changes around subways, in this study, we proposed a novel SAR detection method that involved three steps: (1) the calculation of three single DIs, (2) the combination of the single DIs and (3) the delineation of the changed area. Compared to existing detection methods, the proposed method represents three major improvements. First, both the intensity information and phase information were applied by combining the DVDI, MVDI and coherent difference images (CDIs). Secondly, a local energy weight (LEW) approach was proposed to combine single DIs instead of the normally used equal weights. Because the changed area often comprises continuous rather than discrete pixels, a combined DI with the LEW (“CoDI-LEW” hereafter) fully considers the attributes of adjacent pixels and enhances the signal-to-noise ratio of SAR images. Thirdly, the FCM algorithm, instead of the widely used threshold methods, was applied to distinguish changed areas from unchanged areas. An experimental comparison with several existing detection methods showed that the proposed method could delineate changed areas with higher accuracy in terms of both quality and quantity. Furthermore, it can effectively execute detection under diverse surface change conditions with good feasibility and applicability. Full article
Show Figures

Graphical abstract

21 pages, 2503 KiB  
Article
Semi-Supervised DEGAN for Optical High-Resolution Remote Sensing Image Scene Classification
by Jia Li, Yujia Liao, Junjie Zhang, Dan Zeng and Xiaoliang Qian
Remote Sens. 2022, 14(17), 4418; https://doi.org/10.3390/rs14174418 - 05 Sep 2022
Cited by 6 | Viewed by 1650
Abstract
Semi-supervised methods have made remarkable achievements via utilizing unlabeled samples for optical high-resolution remote sensing scene classification. However, the labeled data cannot be effectively combined with unlabeled data in the existing semi-supervised methods during model training. To address this issue, we present a [...] Read more.
Semi-supervised methods have made remarkable achievements via utilizing unlabeled samples for optical high-resolution remote sensing scene classification. However, the labeled data cannot be effectively combined with unlabeled data in the existing semi-supervised methods during model training. To address this issue, we present a semi-supervised optical high-resolution remote sensing scene classification method based on Diversity Enhanced Generative Adversarial Network (DEGAN), in which the supervised and unsupervised stages are deeply combined in the DEGAN training. Based on the unsupervised characteristic of the Generative Adversarial Network (GAN), a large number of unlabeled and labeled images are jointly employed to guide the generator to obtain a complete and accurate probability density space of fake images. The Diversity Enhanced Network (DEN) is designed to increase the diversity of generated images based on massive unlabeled data. Therefore, the discriminator is promoted to provide discriminative features by enhancing the generator given the game relationship between two models in DEGAN. Moreover, the conditional entropy is adopted to make full use of the information of unlabeled data during the discriminator training. Finally, the features extracted from the discriminator and VGGNet-16 are employed for scene classification. Experimental results on three large datasets demonstrate that the proposed scene classification method yields a superior classification performance compared with other semi-supervised methods. Full article
(This article belongs to the Special Issue State-of-the-Art Remote Sensing Image Scene Classification)
Show Figures

Graphical abstract

19 pages, 6693 KiB  
Article
Waterlogging Assessment of Chinese Ancient City Sites Considering Microtopography: A Case Study of the PuZhou Ancient City Site, China
by Xinyuan Chai, Youqiang Dong and Yihao Li
Remote Sens. 2022, 14(17), 4417; https://doi.org/10.3390/rs14174417 - 05 Sep 2022
Cited by 1 | Viewed by 1250
Abstract
A waterlogging assessment framework based on the stormwater management model (SWMM), considering the microtopography, is proposed (taking into account the complexity of the underlying surface, which contains various micro-surface features within the Chinese ancient city site). We used the ancient city site of [...] Read more.
A waterlogging assessment framework based on the stormwater management model (SWMM), considering the microtopography, is proposed (taking into account the complexity of the underlying surface, which contains various micro-surface features within the Chinese ancient city site). We used the ancient city site of PuZhou as the study case and the framework is detailed in this paper. First, the land cover was classified by combining the analysis of UAVs and field surveys; subsequently, a revised sub-catchment division method considering the land cover was proposed to obtain more accurate and reliable sub-catchments; thirdly, the parameters used in SWMM were determined by analyzing the micro-surface features; finally, the inundation area was calculated based on the SWMM-GIS. To verify the advantage of our proposed framework, two comparative experiments where the land cover and the micro-surface features were not considered in the stages of the sub-catchment division and parameter estimations were carried out. The simulated inundation area derived from our proposed framework with the return periods of 10a., 50a., 100a., and 1000a. were (separately) 22,500 m2, 29,500 m2, 33,600 m2, and 44,200 m2, which are more in line with the actual situation compared with the two designed comparative experiments. The experimental results show that our proposed framework has significant meaning to the waterlogging assessment on the Chinese ancient city site. Full article
Show Figures

Figure 1

27 pages, 14057 KiB  
Article
Creation of Wildfire Susceptibility Maps in Plumas National Forest Using InSAR Coherence, Deep Learning, and Metaheuristic Optimization Approaches
by Arip Syaripudin Nur, Yong Je Kim and Chang-Wook Lee
Remote Sens. 2022, 14(17), 4416; https://doi.org/10.3390/rs14174416 - 05 Sep 2022
Cited by 10 | Viewed by 2589
Abstract
Plumas National Forest, located in the Butte and Plumas counties, has experienced devastating wildfires in recent years, resulting in substantial economic losses and threatening the safety of people. Mapping damaged areas and assessing wildfire susceptibility are necessary to prevent, mitigate, and manage wildfires. [...] Read more.
Plumas National Forest, located in the Butte and Plumas counties, has experienced devastating wildfires in recent years, resulting in substantial economic losses and threatening the safety of people. Mapping damaged areas and assessing wildfire susceptibility are necessary to prevent, mitigate, and manage wildfires. In this study, a wildfire susceptibility map was generated using a CNN and metaheuristic optimization algorithms (GWO and ICA) based on images of areas damaged by wildfires. The locations of damaged areas were identified using the damage proxy map (DPM) technique from Sentinel-1 synthetic aperture radar (SAR) data collected from 2016 to 2020. The DPMs’ depicting areas damaged by wildfires were similar to fire perimeters obtained from the California Department of Forestry and Fire Protection (CAL FIRE). Data regarding damaged areas were divided into a training set (50%) for modeling and a testing set (50%) for assessing the accuracy of the models. Sixteen conditioning factors, categorized as topographical, meteorological, environmental, and anthropological factors, were selected to construct the models. The wildfire susceptibility models were evaluated using the area under the receiver operating characteristic (ROC) curve (AUC) and root mean square error (RMSE) analysis. The evaluation results revealed that the hybrid-based CNN-GWO model (AUC = 0.974, RMSE = 0.334) exhibited better performance than the CNN (AUC = 0.934, RMSE = 0.780) and CNN-ICA (AUC = 0.950, RMSE = 0.350) models. Therefore, we conclude that optimizing a CNN with metaheuristics considerably increased the accuracy and reliability of wildfire susceptibility mapping in the study area. Full article
(This article belongs to the Special Issue Machine Learning and Remote Sensing for Geohazards)
Show Figures

Graphical abstract

19 pages, 21402 KiB  
Article
Mapping the Spatio-Temporal Distribution of Fall Armyworm in China by Coupling Multi-Factors
by Yanru Huang, Hua Lv, Yingying Dong, Wenjiang Huang, Gao Hu, Yang Liu, Hui Chen, Yun Geng, Jie Bai, Peng Guo and Yifeng Cui
Remote Sens. 2022, 14(17), 4415; https://doi.org/10.3390/rs14174415 - 05 Sep 2022
Cited by 2 | Viewed by 2870
Abstract
The fall armyworm (FAW) (Spodoptera frugiperda) (J. E. Smith) is a migratory pest that lacks diapause and has raised widespread concern in recent years due to its global dispersal and infestation. Seasonal environmental changes lead to its large-scale seasonal activities, and [...] Read more.
The fall armyworm (FAW) (Spodoptera frugiperda) (J. E. Smith) is a migratory pest that lacks diapause and has raised widespread concern in recent years due to its global dispersal and infestation. Seasonal environmental changes lead to its large-scale seasonal activities, and quantitative simulations of its dispersal patterns and spatiotemporal distribution facilitate integrated pest management. Based on remote sensing data and meteorological assimilation products, we constructed a mechanistic model of the dynamic distribution of FAW (FAW-DDM) by integrating weather-driven flight of FAW with host plant phenology and environmental suitability. The potential distribution of FAW in China from February to August 2020 was simulated. The results showed a significant linear relationship between the dates of the first simulated invasion and the first observed invasion of FAW in 125 cities (R2 = 0.623; p < 0.001). From February to April, FAW was distributed in the Southwestern and Southern Mountain maize regions mainly due to environmental influences. From May to June, FAW spread rapidly, and reached the Huanghuaihai and North China maize regions between June to August. Our results can help in developing pest prevention and control strategies with data on specific times and locations, reducing the impact of FAW on food security. Full article
Show Figures

Graphical abstract

19 pages, 6693 KiB  
Article
Climatology of Dust Aerosols over the Jianghan Plain Revealed with Space-Borne Instruments and MERRA-2 Reanalysis Data during 2006–2021
by Chuan Liu, Zhenping Yin, Yun He and Longlong Wang
Remote Sens. 2022, 14(17), 4414; https://doi.org/10.3390/rs14174414 - 05 Sep 2022
Cited by 8 | Viewed by 1866
Abstract
In recent years, climate change and the intervention of anthropogenic activities have altered the seasonal features of Asian dust storms. This may also cause seasonal variations (including dust occurrence frequency and optical/microphysical properties) in dust aerosols transported to downstream regions. The Jianghan Plain [...] Read more.
In recent years, climate change and the intervention of anthropogenic activities have altered the seasonal features of Asian dust storms. This may also cause seasonal variations (including dust occurrence frequency and optical/microphysical properties) in dust aerosols transported to downstream regions. The Jianghan Plain is dramatically influenced by multiple dust sources due to its geographical location in central China. In this study, we focused on the climatology of dust aerosols over the Jianghan Plain based on the 15-year (2006–2021) continuous space-borne observations of the Cloud-Aerosol Lidar with Orthogonal Polarization (CALIOP) as well as Modern-Era Retrospective Analysis for Research and Applications version 2 (MERRA-2) reanalysis data. A typical dust event that intrudes the Jianghan Plain was studied in detail. According to the statistical results, dust aerosols frequently intrude into the Jianghan Plain in spring and winter, with occurrence frequencies (under cloud free condition hereafter) exceeding 0.70 and higher altitudes of 4–6 km. The dust occurrence frequency declined to approximately 0.40 in autumn and nearly zero in summer, while the dust plumes were generally located at lower altitudes of 1–3 km. The dust plumes observed in the Jianghan Plain were simultaneously linked to the Taklimakan Desert and Gobi Desert in spring and mainly originated from the Taklimakan Desert in winter and autumn. The dust particles were mainly distributed below 4-km altitude, with the largest dust extinction coefficients and dust mass concentrations in spring. In all seasons, the particle depolarization ratios are 0.1–0.2 below 4-km altitude, suggesting a possible mix with local anthropogenic aerosols. The mean dust column mass concentrations in spring showed an evident declining trend from 210 µg m−2 in 2006 to 100 µg m−2 in 2021 in the Jianghan Plain, attributed to the reduced dust activity in the source regions of Asian dust. Full article
(This article belongs to the Special Issue Remote Sensing of Aerosol, Cloud and Their Interactions)
Show Figures

Figure 1

26 pages, 9046 KiB  
Article
Interannual and Decadal Variability of Sea Surface Temperature and Sea Ice Concentration in the Barents Sea
by Bayoumy Mohamed, Frank Nilsen and Ragnheid Skogseth
Remote Sens. 2022, 14(17), 4413; https://doi.org/10.3390/rs14174413 - 05 Sep 2022
Cited by 7 | Viewed by 3990
Abstract
Sea ice loss and accelerated warming in the Barents Sea have recently been one of the main concerns of climate research. In this study, we investigated the trends and possible relationships between sea surface temperature (SST), sea ice concentration (SIC), and local and [...] Read more.
Sea ice loss and accelerated warming in the Barents Sea have recently been one of the main concerns of climate research. In this study, we investigated the trends and possible relationships between sea surface temperature (SST), sea ice concentration (SIC), and local and large-scale atmospheric parameters over the last 39 years (1982 to 2020). We examined the interannual and long-term spatiotemporal variability of SST and SIC by performing an empirical orthogonal function (EOF) analysis. The SST warming rate from 1982 through 2020 was 0.35 ± 0.04 °C/decade and 0.40 ± 0.04 °C/decade in the ice-covered and ice-free regions, respectively. This climate warming had a significant impact on sea-ice conditions in the Barents Sea, such as a strong decline in the SIC (−6.52 ± 0.78%/decade) and a shortening of the sea-ice season by about −26.1 ± 7.5 days/decade, resulting in a 3.4-month longer summer ice-free period over the last 39 years. On the interannual and longer-term scales, the Barents Sea has shown strong coherent spatiotemporal variability in both SST and SIC. The temporal evolution of SST and SIC are strongly correlated, whereas the Atlantic Multidecadal Oscillation (AMO) influences the spatiotemporal variability of SST and SIC. The highest spatial variability (i.e., the center of action of the first EOF mode) of SST was observed over the region bounded by the northern and southern polar fronts, which are influenced by both warm Atlantic and cold Arctic waters. The largest SIC variability was found over the northeastern Barents Sea and over the Storbanken and Olga Basin. The second EOF mode revealed a dipole structure with out-of-phase variability between the ice-covered and ice-free regions for the SST and between the Svalbard and Novaya Zemlya regions for SIC. In order to investigate the processes that generate these patterns, a correlation analysis was applied to a set of oceanic (SST) and atmospheric parameters (air temperature, zonal, and meridional wind components) and climate indices. This analysis showed that SST and SIC are highly correlated with air temperature and meridional winds and with two climate indices (AMO and East Atlantic Pattern (EAP)) on an interannual time scale. The North Atlantic Oscillation (NAO) only correlated with the second EOF mode of SST on a decadal time scale. Full article
(This article belongs to the Special Issue Remote Sensing of the Polar Oceans)
Show Figures

Figure 1

22 pages, 6603 KiB  
Article
Real-Time Multi-GNSS Precise Orbit Determination Based on the Hourly Updated Ultra-Rapid Orbit Prediction Method
by Bingfeng Tan, Yunbin Yuan, Qingsong Ai and Jiuping Zha
Remote Sens. 2022, 14(17), 4412; https://doi.org/10.3390/rs14174412 - 05 Sep 2022
Cited by 4 | Viewed by 1746
Abstract
Offering real-time precise point positioning (PPP) services for global and large areas based on global navigation satellite systems (GNSS) has drawn more and more attention from institutions and companies. A precise and reliable satellite orbit is a core premise for multi-GNSS real-time services, [...] Read more.
Offering real-time precise point positioning (PPP) services for global and large areas based on global navigation satellite systems (GNSS) has drawn more and more attention from institutions and companies. A precise and reliable satellite orbit is a core premise for multi-GNSS real-time services, especially for the GPS and GLONASS, which are undergoing modernization, whereas the Galileo, BDS and QZSS have just fulfilled the construction stage. In this contribution, a real-time precise orbit determination (POD) strategy for the five operational constellations based on the hourly updated ultrarapid orbit prediction method is presented. After combination of 72 h arc through three adjacent 24 h arc normal equations, the predicted orbits are finally generated (hourly updated). The POD results indicate that the mean one-dimensional (1-D) root mean square (RMS) values compared with the Deutsches GeoForschungsZentrum (GFZ) final multi-GNSS orbits are approximately 3.7 cm, 10.2 cm, 5.8 cm, 5.7 cm, 4.1 cm and 25.1 cm for GPS, BDS IGSOs, BDS MEOs, GLONASS, Galileo and QZSS NONE GEOs, respectively. The mean 1-D RMS values of the hourly updated ultrarapid orbit boundary overlapping comparison are approximately 1.6 cm, 6.9 cm, 3.2 cm, 2.7 cm, 1.8 cm and 22.2 cm for GPS, BDS IGSOs, BDS MEOs, GLONASS, Galileo and QZSS NONE GEOs, respectively. The satellite laser ranging (SLR) validation illuminates that the mean RMS values are approximately 4.53 cm and 4.73 cm for the four MEOs of BDS-3 and four BDS-2 satellites, respectively. Full article
(This article belongs to the Special Issue Precision Orbit Determination of Satellites)
Show Figures

Figure 1

22 pages, 9121 KiB  
Article
Quantitative Assessment of Impact of Climate Change and Human Activities on Streamflow Changes Using an Improved Three-Parameter Monthly Water Balance Model
by Hao Chen, Saihua Huang, Yue-Ping Xu, Ramesh S. V. Teegavarapu, Yuxue Guo, Jingkai Xie and Hui Nie
Remote Sens. 2022, 14(17), 4411; https://doi.org/10.3390/rs14174411 - 05 Sep 2022
Cited by 1 | Viewed by 1889
Abstract
Understanding the impact of climate change and human activities on the hydrological cycle of any watershed can provide a scientific basis for regional water resource planning, flood management, and disaster mitigation. An improved three-parameter hydrological model (CM) based on monthly water balance using [...] Read more.
Understanding the impact of climate change and human activities on the hydrological cycle of any watershed can provide a scientific basis for regional water resource planning, flood management, and disaster mitigation. An improved three-parameter hydrological model (CM) based on monthly water balance using an exponential equation to depict the distribution of groundwater storage capacity was developed and evaluated. The model uses Asian Precipitation Highly Resolved Observational Data Integration Towards Evaluation (APHRODITE) rainfall data as input, with the Zhejiang Province as the case application, and the effects of climate change and human activities on streamflow changes were assessed by separating environmental variables in this study. The results indicate that APHRODITE data has excellent monthly accuracy, with a mean correlation coefficient (CC) of more than 0.96 and an average absolute percentage bias (Pbais) of less than 5%. The three models are relatively close in their ability to simulate high flows, but the CM simulated low flow is better than the other two models. Positive and negative Pbais phenomena occur in the CM model in each catchment, and absolute levels are regulated by 5%. Furthermore, the CM model’s average Nash efficiency coefficient (NSE) is greater than 0.9, indicating that it can correctly fulfill the water balance. The results are more consistent throughout multiple catchments in each watershed using Budyko-based and hydrological model technique to evaluate the influence of climate change and human activities on streamflow. Climate change dominated streamflow variations in 18 of the 21 catchments in Zhejiang Province, whereas human activities dominated the rest. The findings of the study will be used to influence the management, development, and usage of water resources in the watershed. Full article
Show Figures

Figure 1

14 pages, 1307 KiB  
Technical Note
Examining the Role of UAV Lidar Data in Improving Tree Volume Calculation Accuracy
by Kuo Liao, Yunhe Li, Bingzhang Zou, Dengqiu Li and Dengsheng Lu
Remote Sens. 2022, 14(17), 4410; https://doi.org/10.3390/rs14174410 - 05 Sep 2022
Cited by 12 | Viewed by 2495
Abstract
Traditional forest inventories are based on field surveys of established sample plots, which involve field measurements of individual trees within a sample plot and the selection of proper allometric equations for tree volume calculation. Thus, accurate field measurements and properly selected allometric equations [...] Read more.
Traditional forest inventories are based on field surveys of established sample plots, which involve field measurements of individual trees within a sample plot and the selection of proper allometric equations for tree volume calculation. Thus, accurate field measurements and properly selected allometric equations are two crucial factors for providing high-quality tree volumes. One key problem is the difficulty in accurately acquiring tree height data, resulting in high uncertainty in tree volume calculation when the diameter at breast height (DBH) alone is used. This study examined the uncertainty of tree height measurements using different means and the impact of allometric models on tree volume estimation accuracy. Masson pine and eucalyptus plantations in Fujian Province, China, were selected as examples; their tree heights were measured three ways: using an 18-m telescopic pole, UAV Lidar (unmanned aerial vehicle, light detection and ranging) data, and direct measurement of felled trees, with the latest one as a reference. The DBH-based and DBH–height-based allometric equations corresponding to specific tree species were used for the calculations of tree volumes. The results show that (1) tree volumes calculated from the DBH-based models were lower than those from the DBH–height-based models. On average, tree volumes were underestimated by 0.018 m3 and 0.117 m3 for Masson pine and eucalyptus, respectively, while the relative root-mean-squared errors (RMSEr) were 24.04% and 33.90%, respectively, when using the DBH-based model; (2) the tree height extracted from UAV Lidar data was more accurate than that measured using a telescopic pole, because the pole measurement method generally underestimated the tree height, especially when the trees were taller than the length of the pole (18 m in our study); (3) the tree heights measured using different methods greatly impacted the accuracies of tree volumes calculated using the DBH–height model. The telescopic-pole-measured tree heights resulted in a relative error of 9.1–11.8% in tree volume calculations. This research implies that incorporation of UAV Lidar data with DBH field measurements can effectively improve tree volume estimation and could be a new direction for sample plot data collection in the future. Full article
(This article belongs to the Special Issue UAV Applications for Forest Management: Wood Volume, Biomass, Mapping)
Show Figures

Figure 1

21 pages, 5635 KiB  
Article
Coastal Vulnerability Assessment of Bali Province, Indonesia Using Remote Sensing and GIS Approaches
by Amandangi Wahyuning Hastuti, Masahiko Nagai and Komang Iwan Suniada
Remote Sens. 2022, 14(17), 4409; https://doi.org/10.3390/rs14174409 - 05 Sep 2022
Cited by 7 | Viewed by 4963
Abstract
Coastal zones are considered to be highly vulnerable to the effects of climate change, such as erosion, flooding, and storms, including sea level rise (SLR). The effects of rising sea levels endanger several nations, including Indonesia, and it potentially affects the coastal population [...] Read more.
Coastal zones are considered to be highly vulnerable to the effects of climate change, such as erosion, flooding, and storms, including sea level rise (SLR). The effects of rising sea levels endanger several nations, including Indonesia, and it potentially affects the coastal population and natural environment. Quantification is needed to determine the degree of vulnerability experienced by a coast since measuring vulnerability is a fundamental phase towards effective risk reduction. Therefore, the main objective of this research is to identify how vulnerable the coastal zone of Bali Province by develop a Coastal Vulnerability Index (CVI) of areas exposed to the sea-level rise on regional scales using remote sensing and Geographic Information System (GIS) approaches. This study was conducted in Bali Province, Indonesia, which has a beach length of ~640 km, and six parameters were considered in the creation to measure the degree of coastal vulnerability by CVI: geomorphology, shoreline change rate, coastal elevation, sea-level change rate, tidal range, and significant wave height. The different vulnerability parameters were assigned ranks ranging from 1 to 5, with 1 indicating the lowest and 5 indicating the highest vulnerabilities. The study revealed that about 138 km (22%) of the mapped shoreline is classified as being at very high vulnerability and 164 km (26%) of shoreline is at high vulnerability. Of remaining shoreline, 168 km (26%) and 169 km (26%) are at moderate and low risk of coastal vulnerability, respectively. This study outcomes can provide an updated vulnerability map and valuable information for the Bali Province coast, aimed at increasing awareness among decision-makers and related stakeholders for development in mitigation and adaptation strategies. Additionally, the result may be utilized as basic data to build and implement appropriate coastal zone management. Full article
(This article belongs to the Special Issue Inauguration of Earth Observation for Emergency Management Section)
Show Figures

Graphical abstract

20 pages, 4114 KiB  
Article
Evaluation of Three Gridded Precipitation Products in Characterizing Extreme Precipitation over the Hengduan Mountains Region in China
by Wenchang Dong, Genxu Wang, Li Guo, Juying Sun and Xiangyang Sun
Remote Sens. 2022, 14(17), 4408; https://doi.org/10.3390/rs14174408 - 05 Sep 2022
Cited by 4 | Viewed by 1581
Abstract
Extreme precipitation events can lead to severe mountain hazards, and they have therefore received widespread attention. The study of extreme precipitation can be hindered by the insufficient number and uneven distribution of rain gauge stations, especially in mountainous areas with complex terrain. In [...] Read more.
Extreme precipitation events can lead to severe mountain hazards, and they have therefore received widespread attention. The study of extreme precipitation can be hindered by the insufficient number and uneven distribution of rain gauge stations, especially in mountainous areas with complex terrain. In this study, the daily precipitation data of three gridded precipitation products (Integrated Multi-satellite Retrievals for GPM, IMERG; Multi-Source Weighted-Ensemble Precipitation, MSWEP; and Tropical Rainfall Measuring Mission, TRMM) were compared with rain gauge observations at 62 ground stations from 2001 to 2016 over the Hengduan Mountain region in China. Deviations between the gridded and ground precipitation datasets were compared using four daily heavy rainfall sequences. Various extreme precipitation indices were used to evaluate the performance of selected precipitation products. The results show that IMERG and TRMM are better than MSWEP in characterizing extreme precipitation. The accuracy of these three products in detecting heavy precipitation varied with altitude gradient. All products provided more accurate estimates of heavy precipitation in higher-altitude areas than in lower-altitude areas. Notably, they are more applicable for heavy precipitation detection in subalpine or alpine regions, and there are still uncertainties in capturing the accurate characterization of extreme precipitation at low (<1000 m) altitudes in the Hengduan Mountain region. These precipitation products should be used with caution in future applications when analyzing extreme precipitation at low elevations. Full article
(This article belongs to the Special Issue Remote Sensing for Precipitation Retrievals)
Show Figures

Graphical abstract

2 pages, 667 KiB  
Correction
Correction: Webb et al. In Situ Determination of Dry and Wet Snow Permittivity: Improving Equations for Low Frequency Radar Applications. Remote Sens. 2021, 13, 4617
by Ryan W. Webb, Adrian Marziliano, Daniel McGrath, Randall Bonnell, Tate G. Meehan, Carrie Vuyovich and Hans-Peter Marshall
Remote Sens. 2022, 14(17), 4407; https://doi.org/10.3390/rs14174407 - 05 Sep 2022
Viewed by 960
Abstract
In the original article [...] Full article
Show Figures

Figure 4

17 pages, 6037 KiB  
Article
A New Framework for Reconstructing Time Series DMSP-OLS Nighttime Light Data Using the Improved Stepwise Calibration (ISC) Method
by Mingyue Wang, Chunhui Feng, Bifeng Hu, Nan Wang, Jintao Xu, Ziqiang Ma, Jie Peng and Zhou Shi
Remote Sens. 2022, 14(17), 4405; https://doi.org/10.3390/rs14174405 - 05 Sep 2022
Cited by 2 | Viewed by 2205
Abstract
Calibration and reconstruction of time series DMSP-OLS nighttime light images are critical for understanding urbanization processes and the evolution of urban spatial patterns from a unique perspective. In this study, we developed an improved stepwise calibration (ISC) method based on numerical constancy to [...] Read more.
Calibration and reconstruction of time series DMSP-OLS nighttime light images are critical for understanding urbanization processes and the evolution of urban spatial patterns from a unique perspective. In this study, we developed an improved stepwise calibration (ISC) method based on numerical constancy to correct and reconstruct the time series of China’s regional nighttime light data, thus eliminating the drawbacks of the invariant target region method. We evaluated the different calibration methods and quantitatively validated the calibrated nighttime light data using gross domestic product (GDP) and electricity consumption (EC) at municipal, provincial, and national scales. The results indicated that the ISC method demonstrated its advantage in screening stable lit pixels and maintaining the temporal variability of multi-year nighttime light variation. The variation curve of reconstructed multi-year nighttime light obtained by the ISC method based on numerical constancy was more consistent with the actual urban development. The ISC method retained the original data’s most abundant and complete information than other calibration methods. Moreover, the significant advantages of this method in the low-light high-variation regions and high-light low-variation regions offered new possibilities for understanding the development of small- and medium-sized nighttime light centers such as towns and villages from a nighttime light perspective. This is an advantage that other calibration methods do not offer. The correlation between the multi-year nighttime light dataset obtained by the ISC method and the socio-economic data was significantly improved. The correlation coefficients with GDP and EC are 0.9695 and 0.9923, respectively. Last but not least, the ISC method is more straightforward to implement. The new framework developed in this study produces a more accurate and reliable long time series nighttime light dataset and provides quality assurance for subsequent research in socio-economic development, urban development, natural disasters, and other fields. Full article
(This article belongs to the Special Issue Urban Sensing Methods and Technologies)
Show Figures

Figure 1

19 pages, 4807 KiB  
Article
Assessing the Potential of IMERG and TMPA Satellite Precipitation Products for Flood Simulations and Frequency Analyses over a Typical Humid Basin in South China
by Shanhu Jiang, Yu Ding, Ruolan Liu, Linyong Wei, Yating Liu, Mingming Ren and Liliang Ren
Remote Sens. 2022, 14(17), 4406; https://doi.org/10.3390/rs14174406 - 04 Sep 2022
Cited by 6 | Viewed by 1440
Abstract
The availability of the new generation Integrated Multi-satellitE Retrievals for Global Precipitation Measurement (IMERG) V06 products facilitates the utility of long-term higher spatial and temporal resolution precipitation data (0.1° × 0.1° and half-hourly) for monitoring and modeling extreme hydrological events in data-sparse watersheds. [...] Read more.
The availability of the new generation Integrated Multi-satellitE Retrievals for Global Precipitation Measurement (IMERG) V06 products facilitates the utility of long-term higher spatial and temporal resolution precipitation data (0.1° × 0.1° and half-hourly) for monitoring and modeling extreme hydrological events in data-sparse watersheds. This study aims to evaluate the utility of IMERG Final run (IMERG-F), Late run (IMERG-L) and Early run (IMERG-E) products, in flood simulations and frequency analyses over the Mishui basin in Southern China during 2000–2017, in comparison with their predecessors, the Tropical Rainfall Measuring Mission Multi-satellite Precipitation Analysis (TMPA) products (3B42RT and 3B42V7). First, the accuracy of the five satellite precipitation products (SPPs) for daily precipitation and extreme precipitation events estimation was systematically compared by using high-density gauge station observations. Once completed, the modeling capability of the SPPs in daily streamflow simulations and flood event simulations, using a grid-based Xinanjiang model, was assessed. Finally, the flood frequency analysis utility of the SPPs was evaluated. The assessment of the daily precipitation accuracy shows that IMERG-F has the optimum statistical performance, with the highest CC (0.71) and the lowest RMSE (8.7 mm), respectively. In evaluating extreme precipitation events, among the IMERG series, IMERG-E exhibits the most noticeable variation while IMERG-L and IMERG-F display a relatively low variation. The 3B42RT exhibits a severe inaccuracy and the improvement of 3B42V7 over 3B42RT is comparatively limited. Concerning the daily streamflow simulations, IMERG-F demonstrates a superior performance while 3B42V7 tends to seriously underestimate the streamflow. With regards to the simulations of flood events, IMERG-F has performed optimally, with an average DC of 0.83. Among the near-real-time SPPs, IMERG-L outperforms IMERG-E and 3B42RT over most floods, attaining a mean DC of 0.81. Furthermore, IMERG-L performs the best in the flood frequency analyses, where bias is within 15% for return periods ranging from 2–100 years. This study is expected to contribute practical guidance to the new generation of SPPs for extreme precipitation monitoring and flood simulations as well as promoting the hydro-meteorological applications. Full article
Show Figures

Graphical abstract

18 pages, 4438 KiB  
Article
Sparse SAR Imaging Method for Ground Moving Target via GMTSI-Net
by Luwei Chen, Jiacheng Ni, Ying Luo, Qifang He and Xiaofei Lu
Remote Sens. 2022, 14(17), 4404; https://doi.org/10.3390/rs14174404 - 04 Sep 2022
Cited by 5 | Viewed by 1613
Abstract
Ground moving targets (GMT), due to the existence of velocity in range and azimuth direction, will lead to the deviation from their true position and defocus in the azimuth direction during the synthetic aperture radar (SAR) imaging process. To address this problem and [...] Read more.
Ground moving targets (GMT), due to the existence of velocity in range and azimuth direction, will lead to the deviation from their true position and defocus in the azimuth direction during the synthetic aperture radar (SAR) imaging process. To address this problem and compress the amount of echo data, a sparse SAR imaging method for ground moving targets is proposed. Specifically, we first constructed a two-dimensional sparse observation model of the GMT based on matched filter operators. Then, the observation model was solved by a deep network, GMT sparse imaging network (GMTSI-Net), which was mainly obtained by unfolding an iterative soft threshold algorithm (ISTA)-based iterative solution. Furthermore, we designed an adaptive unfolding module in the imaging network to improve the adaptability of the network to the input of echo data with different sampling ratios. The proposed imaging network can achieve faster and more accurate SAR images of ground moving targets under a low sampling ratio and signal-to-noise ratio (SNR). Simulated and measured data experiments were conducted to demonstrate the performance of imaging quality of the proposed method. Full article
(This article belongs to the Special Issue SAR Images Processing and Analysis)
Show Figures

Graphical abstract

29 pages, 6109 KiB  
Article
Effect of Image-Processing Routines on Geographic Object-Based Image Analysis for Mapping Glacier Surface Facies from Svalbard and the Himalayas
by Shridhar D. Jawak, Sagar F. Wankhede, Alvarinho J. Luis and Keshava Balakrishna
Remote Sens. 2022, 14(17), 4403; https://doi.org/10.3390/rs14174403 - 04 Sep 2022
Cited by 7 | Viewed by 1781
Abstract
Advancements in remote sensing have led to the development of Geographic Object-Based Image Analysis (GEOBIA). This method of information extraction focuses on segregating correlated pixels into groups for easier classification. This is of excellent use in analyzing very-high-resolution (VHR) data. The application of [...] Read more.
Advancements in remote sensing have led to the development of Geographic Object-Based Image Analysis (GEOBIA). This method of information extraction focuses on segregating correlated pixels into groups for easier classification. This is of excellent use in analyzing very-high-resolution (VHR) data. The application of GEOBIA for glacier surface mapping, however, necessitates multiple scales of segmentation and input of supportive ancillary data. The mapping of glacier surface facies presents a unique problem to GEOBIA on account of its separable but closely matching spectral characteristics and often disheveled surface. Debris cover can induce challenges and requires additions of slope, temperature, and short-wave infrared data as supplements to enable efficient mapping. Moreover, as the influence of atmospheric corrections and image sharpening can derive variations in the apparent surface reflectance, a robust analysis of the effects of these processing routines in a GEOBIA environment is lacking. The current study aims to investigate the impact of three atmospheric corrections, Dark Object Subtraction (DOS), Quick Atmospheric Correction (QUAC), and Fast Line-of-Sight Atmospheric Analysis of Hypercubes (FLAASH), and two pansharpening methods, viz., Gram–Schmidt (GS) and Hyperspherical Color Sharpening (HCS), on the classification of surface facies using GEOBIA. This analysis is performed on VHR WorldView-2 imagery of selected glaciers in Ny-Ålesund, Svalbard, and Chandra–Bhaga basin, Himalaya. The image subsets are segmented using multiresolution segmentation with constant parameters. Three rule sets are defined: rule set 1 utilizes only spectral information, rule set 2 contains only spatial and contextual features, and rule set 3 combines both spatial and spectral attributes. Rule set 3 performs the best across all processing schemes with the highest overall accuracy, followed by rule set 1 and lastly rule set 2. This trend is observed for every image subset. Among the atmospheric corrections, DOS displays consistent performance and is the most reliable, followed by QUAC and FLAASH. Pansharpening improved overall accuracy and GS performed better than HCS. The study reports robust segmentation parameters that may be transferable to other VHR-based glacier surface facies mapping applications. The rule sets are adjusted across the processing schemes to adjust to the change in spectral characteristics introduced by the varying routines. The results indicate that GEOBIA for glacier surface facies mapping may be less prone to the differences in spectral signatures introduced by different atmospheric corrections but may respond well to increasing spatial resolution. The study highlighted the role of spatial attributes for mapping fine features, and in combination with appropriate spectral features may enhance thematic classification. Full article
Show Figures

Graphical abstract

27 pages, 13086 KiB  
Article
Spatio-Temporal Patterns and Driving Factors of Vegetation Change in the Pan-Third Pole Region
by Xuyan Yang, Qinke Yang and Miaomiao Yang
Remote Sens. 2022, 14(17), 4402; https://doi.org/10.3390/rs14174402 - 04 Sep 2022
Cited by 1 | Viewed by 1644
Abstract
The Pan-Third Pole (PTP) region, one of the areas with the most intense global warming, has seen substantial changes in vegetation cover. Based on the GIMMS NDVI3g and meteorological dataset from 1982 to 2015, this study evaluated the spatio-temporal variation in fractional vegetation [...] Read more.
The Pan-Third Pole (PTP) region, one of the areas with the most intense global warming, has seen substantial changes in vegetation cover. Based on the GIMMS NDVI3g and meteorological dataset from 1982 to 2015, this study evaluated the spatio-temporal variation in fractional vegetation coverage (FVC) by using linear regression analysis, standard deviation, correlation coefficient, and multiple linear regression residuals to explore its response mechanism to climate change and human activities. The findings showed that: (1) the FVC was progressively improved, with a linear trend of 0.003•10a−1. (2) The largest proportion of the contribution to FVC change was found in the unchanged area (39.29%), followed by the obvious improvement (23.83%) and the mild improvement area (13.53%). (3) The impact of both climate change and human activities is dual in FVC changes, and human activities are increasing. (4) The FVC was positively correlated with temperature and precipitation, with a stronger correlation with temperature, and the climate trend was warm and humid. The findings of the study serve to understand the impacts of climate change and human activities on the dynamic changes in the FVC and provide a scientific foundation for ecological conservation and sustainable economic development in the PTP region. Full article
(This article belongs to the Special Issue Correlation between NDVI and Crop Production)
Show Figures

Figure 1

18 pages, 4278 KiB  
Article
Exploring the Individualized Effect of Climatic Drivers on MODIS Net Primary Productivity through an Explainable Machine Learning Framework
by Luyi Li, Zhenzhong Zeng, Guo Zhang, Kai Duan, Bingjun Liu and Xitian Cai
Remote Sens. 2022, 14(17), 4401; https://doi.org/10.3390/rs14174401 - 04 Sep 2022
Cited by 8 | Viewed by 4366
Abstract
Along with the development of remote sensing technology, the spatial–temporal variability of vegetation productivity has been well observed. However, the drivers controlling the variation in vegetation under various climate gradients remain poorly understood. Identifying and quantifying the independent effects of driving factors on [...] Read more.
Along with the development of remote sensing technology, the spatial–temporal variability of vegetation productivity has been well observed. However, the drivers controlling the variation in vegetation under various climate gradients remain poorly understood. Identifying and quantifying the independent effects of driving factors on a natural process is challenging. In this study, we adopted a potent machine learning (ML) model and an ML interpretation technique with high fidelity to disentangle the effects of climatic variables on the long-term averaged net primary productivity (NPP) across the Amazon rainforests. Specifically, the eXtreme Gradient Boosting (XGBoost) model was employed to model the Moderate-resolution Imaging Spectroradiometer (MODIS) NPP data, and the Shapley addictive explanation (SHAP) method was introduced to account for nonlinear relationships between variables identified by the model. Results showed that the dominant driver of NPP across the Amazon forests varied in different regions, with temperature dominating the most considerable portion of the ecoregion with a high importance score. In addition, light augmentation, increased CO2 concentration, and decreased precipitation positively contributed to Amazonia NPP. The wind speed for most vegetated areas was under the optimum, which benefits NPP, while sustained high wind speed would bring substantial NPP loss. We also found a non-monotonic response of Amazonia NPP to VPD and attributed this relationship to the moisture load in Amazon forests. Our application of the explainable machine learning framework to identify the underlying physical mechanism behind NPP could be a reference for identifying relationships between components in natural processes. Full article
(This article belongs to the Special Issue Remote Sensing of Primary Production)
Show Figures

Graphical abstract

13 pages, 6823 KiB  
Article
Remote Sensing Image Information Quality Evaluation via Node Entropy for Efficient Classification
by Jiachen Yang, Yue Yang, Jiabao Wen, Yang Li and Sezai Ercisli
Remote Sens. 2022, 14(17), 4400; https://doi.org/10.3390/rs14174400 - 04 Sep 2022
Cited by 4 | Viewed by 1546
Abstract
Combining remote sensing images with deep learning algorithms plays an important role in wide applications. However, it is difficult to have large-scale labeled datasets for remote sensing images because of acquisition conditions and costs. How to use the limited acquisition budget to obtaina [...] Read more.
Combining remote sensing images with deep learning algorithms plays an important role in wide applications. However, it is difficult to have large-scale labeled datasets for remote sensing images because of acquisition conditions and costs. How to use the limited acquisition budget to obtaina better remote sensing image dataset is a problem worth studying. In response to this problem, this paper proposes a remote sensing image quality evaluation method based on node entropy, which can be combined with active learning to provide low-cost guidance for remote sensing image collection and labeling. The method includes a node selection module and a remote sensing image quality evaluation module. The function of the node selection module is to select representative images, and the remote sensing image quality evaluation module evaluates the remote sensing image information quality by calculating the node entropy of the images. The image at the decision boundary of the existing images has a higher information quality. To validate the method proposed in this paper, experiments are performed on two public datasets. The experimental results confirm the superiority of this method compared with other methods. Full article
Show Figures

Graphical abstract

28 pages, 4563 KiB  
Review
Remote Sensing Precursors Analysis for Giant Landslides
by Hengxing Lan, Xiao Liu, Langping Li, Quanwen Li, Naiman Tian and Jianbing Peng
Remote Sens. 2022, 14(17), 4399; https://doi.org/10.3390/rs14174399 - 04 Sep 2022
Cited by 8 | Viewed by 2642
Abstract
Monitoring and early warning systems for landslides are urgently needed worldwide to effectively reduce the losses of life and property caused by these natural disasters. Detecting the precursors of giant landslides constitutes the premise of landslide monitoring and early warning, and remote sensing [...] Read more.
Monitoring and early warning systems for landslides are urgently needed worldwide to effectively reduce the losses of life and property caused by these natural disasters. Detecting the precursors of giant landslides constitutes the premise of landslide monitoring and early warning, and remote sensing is a powerful means to achieve this goal. In this work, we aim to summarize the basic types and evolutionary principles of giant landslide precursors, describe the remote sensing methods capable of identifying those precursors, and present typical cases of related sliding. Based on a review of the literature and an analysis of remote sensing imagery, the three main types of remote sensing techniques for capturing the geomorphological, geotechnical, and geoenvironmental precursors of giant landslides are optical, synthetic aperture radar (SAR), and thermal infrared methods, respectively. Time-series optical remote sensing data from medium-resolution satellites can be used to obtain abundant information on geomorphological changes, such as the extension of cracks and erosion ditches, and band algebraic analysis, image enhancement, and segmentation techniques are valuable for focusing on the locations of geomorphological landslide precursors. SAR sensors have the ability to monitor the slight slope deformation caused by unfavorable geological structures and can provide precursor information on imminent failure several days before a landslide; furthermore, persistent scatterer interferometric SAR has significant advantages in large-scale surface displacement monitoring. Thermal infrared imagery can identify landslide precursors by monitoring geoenvironmental information, especially in permafrost regions where glaciers are widely distributed; the reason may be that freeze–thaw cycles and snowmelt caused by increased temperatures affect the stability of the surface. Optical, SAR, and thermal remote sensing all exhibit unique advantages and play an essential role in the identification of giant landslide precursors. The combined application of these three remote sensing technologies to obtain the synthetic geomorphological, geotechnical, and geoenvironmental precursors of giant landslides would greatly promote the development of landslide early warning systems. Full article
(This article belongs to the Special Issue Geological Applications of Remote Sensing and Photogrammetry)
Show Figures

Figure 1

14 pages, 7432 KiB  
Communication
Analysis of Optical Turbulence over the South China Sea Using Balloon-Borne Microthermal Data and ERA5 Data
by Manman Xu, Shiyong Shao, Ningquan Weng and Qing Liu
Remote Sens. 2022, 14(17), 4398; https://doi.org/10.3390/rs14174398 - 04 Sep 2022
Cited by 2 | Viewed by 1436
Abstract
It is very useful for adaptive optics (AO) systems to have appropriate knowledge of optical turbulence. However, due to the limitations of space and time, it is difficult to obtain turbulence parameters, especially in the far sea area. In this paper, the characteristics [...] Read more.
It is very useful for adaptive optics (AO) systems to have appropriate knowledge of optical turbulence. However, due to the limitations of space and time, it is difficult to obtain turbulence parameters, especially in the far sea area. In this paper, the characteristics of optical turbulence over the South China Sea are obtained by analyzing the meteorological data obtained from the field experiment of ocean optical parameters and the fifth set of reanalysis data of the European Centre for Medium-Range Weather Forecasts (ECMWF) for 10 years (2011–2020). Firstly, a new statistical model is proposed based on the measured data and the Hufnagel-Valley 5/7, which can well reconstruct the atmospheric turbulence characteristics of the South China Sea. Secondly, according to the comparison between the temperature and wind speed data in ERA5 data and microthermal measurement, the ERA5 data have good reliability, with the temperature deviation basically less than 1.5 K and the wind speed deviation basically less than 2 m∙s−1. Thirdly, the vertical distributions and seasonal behavior of the turbulence strength at the determined location are analyzed, which shows that the turbulence strength in the upper atmosphere is strongest in summer, followed by autumn and winter, and weakest in spring. Then, the distribution profile of the Richardson number provides us with the relative probability of the existence of optical turbulence. During summer and September, the instability of the atmosphere is significantly larger than other months and the extremely low intensity in April indicates the most stable condition in all months. Finally, the analysis results of turbulence parameter profiles for many years show that there is good consistency between different parameters. Full article
Show Figures

Graphical abstract

Previous Issue
Back to TopTop