Technical Note

A Statistical Approach to Satellite Time Series Analysis to Detect Changes in Thermal Activities: The Vulcano Island 2021 Crisis

by
Federico Rabuffi
1,2,*,
Malvina Silvestri
1,
Massimo Musacchio
1,
Vito Romaniello
1 and
Maria Fabrizia Buongiorno
1
1
Istituto Nazionale di Geofisica e Vulcanologia, Osservatorio Nazionale Terremoti, Via di Vigna Murata 605, 00143 Rome, Italy
2
Dipartimento di Scienze, Università degli Studi Roma Tre, 00146 Rome, Italy
*
Author to whom correspondence should be addressed.
Remote Sens. 2022, 14(16), 3933; https://doi.org/10.3390/rs14163933
Submission received: 12 July 2022 / Revised: 9 August 2022 / Accepted: 12 August 2022 / Published: 13 August 2022
(This article belongs to the Special Issue Remote Sensing of Geothermal and Volcanic Environments)

Abstract

:
Vulcano belongs to the seven volcanic islands forming the Aeolian archipelago (Italy) and has the privilege to define an eruptive style as “Vulcanian”. It has to be considered as an active volcano as its most recent activity demonstrated. Starting by late spring 2021, the thermal state of the Vulcano summit area changed and the gas emission increased. During the summer and, in particular, starting from September, geophysical and geochemical signals, precisely those linked to the activity of the hydrothermal system that feeds the fumaroles of the Fossa crater, varied. The temperature of the gases emitted by the fumaroles on the crater rim has increased and the composition of the gases has showed an increase in CO2 and SO2 (carbon dioxide and sulfur dioxide) concentration. For such reasons, the authors decided to follow this event by analyzing the remotely sensed available data suitable for detecting changes in thermal state. By processing the TIRS (Landsat 8) and ASTER time series, two long-term surface temperature logs were obtained and, therefore, by adopting a statistical approach, an analysis in both space and time domains has emphasized a thermal signature since mid-September 2021.

Graphical Abstract

1. Introduction

The island of Vulcano is the southernmost emerged volcanic edifice in the Aeolian archipelago. Vulcano has erupted in historical times and the most recent activity occurred between August 1888 and March 1890 [1]. Given the small size of the island (about 20 km2) and of the volcano-related active phenomena (fumaroles, hot muds, etc.), the observability by space represents an interesting challenge. Because of its characteristics, a huge volume of scientific literature has been written focusing on the different aspects: concerning the geology and the eruptive dynamics of Vulcano, only in recent years [2,3,4,5]; the gas dispersal, lava flows, pyroclastic density currents, ballistic blocks, and tephra accumulation were deeply described by [2,6,7,8,9,10]. The remote sensing community has demonstrated that the use of Thermal Infrared (TIR) satellite sensors represents a reliable method [11] to identify volcanic activity [12]. Despite the monitoring activity that could be performed only by using low-spatial-resolution and high-revisit-time sensors, such as Meteosat Second Generation (MSG) [13,14], Moderate Resolution Imaging Spectroradiometer (MODIS), or Sea and Land Surface Temperature Radiometer (SLSTR) on board Sentinel 3 (with 1 km ground resolution) [15,16,17], sensors with higher spatial resolution (but lower revisit time) allow for the analysis of smaller phenomena, both in terms of spatial extension and magnitude of the event [18,19,20].
In this work, an Advanced Spaceborne Thermal Emission and Reflection Radiometer (ASTER) sensor embarked on Terra and Thermal Infrared Sensor (TIRS), embarked on Landsat 8 (L8), time series are processed in order to verify if the surface hydrothermal crisis on the Island of Vulcano, occurring since summer 2021, can be detectable by space-based TIR sensors, contributing to the identification of possible changes in volcanic activity and following the variation trends. This identification is allowed by the availability, in the spectral range of the TIR (8–12 microns) of data acquired with Ground Sampling Distance (GSD, more generally, spatial resolution) of 90–100 m, as only TIRS L8 and ASTER have.
Starting from September 2021, the monitoring systems managed by Istituto Nazionale di Geofisica e Vulcanologia (INGV) recorded significant variation in micro-seismicity linked to the circulation of fluids and soil deformations in the La Fossa crater area [21]. Moreover, significant changes in the composition and temperature of the fumaroles on the crater rim and an increase in degassing diffused from the soil in the areas adjacent to the crater [22] were also measured. As a consequence of this unrest phase, we decided to investigate the capability of a space-based TIR sensor to support the surveillance activities on the island of Vulcano, with particular regard to surface thermal state, related to the increase in temperature in the fumarolic fields.
In [23], the authors built a complete heat loss model for a hydrothermal system feeding fumarolic emission from the Vulcano La Fossa crater, by combining ground and ASTER data and constraining the thermal flux of the Vulcano La Fossa hydrothermal system between 2000 and 2019.
In [20], we analyzed the possibility to use satellite time series to identify thermal anomalies on Vulcano, observing 2000–2017 spaceborne remotely sensed time series data of surface temperature covering the whole island and detecting hot pixels as focal points.
In this work, we enlarged the time series up to February 2022, with the aim to support the operations of monitoring and detection of changes in volcanic activity occurring in the summer 2021.

2. Study Area

The Volcano Island is one of the seven Aeolian Islands, located in the north-eastern part of Sicily (Italy) (Figure 1a). It is characterized by two main thermal areas that can be easily detected and monitored by high-spatial-resolution satellite data (TIRS and ASTER): Fangaia, located near to the Levante harbor and La Fossa, in the central part of Vulcano Island [22] (Figure 1b).
These thermal areas result from the circulation of water vapor at high temperature coupled with other gases related to volcanic activities, such as CO2 and SO2 [3].
In this work, we focused on the La Fossa cone site, where the fumarolic activity is highly localized (Figure 2) and it was recently characterized by a significant increase in activity. For this reason, the Italian Civil Protection Department, in line with what is also expected at the international level, changed the alert level of Vulcano Island from green to yellow [24]. That means the volcano is exhibiting signs of elevated unrest above known background activity.
Before this current one, there were already periods of increased intensity in degassing activities, particularly in 1978–1980, 1988–1991, 1996, 2004–2007, and 2009–2010 [25]. These crises were related to an unrest phase, defined as variation from the standard activity [26] and were usually recognized by monitoring geophysical and geochemical parameters.
Starting from September 2021, the local seismicity, consisting of seismic events of low energy recorded in the area of the La Fossa crater and linked to the dynamics of the circulating fluids in the superficial hydrothermal system of Vulcano, showed a significant increase in daily frequency and a positive variation in the gradient of the cumulative number, with a maximum of 59 events observed on 27 September 2021 (Figure 3) [22].
In the same period, geochemical parameters in terms of temperature of fumaroles on the crater, CO2 and SO2 flux in the crater area also increased (Figure 4A,B) [22].

3. Materials and Methods

The spatial scale at which thermal phenomena are observed is given by the GSD and swath, while the temporal scale is linked to the revisit time on a given area, which in turn depends on orbit characteristics and swath dimension and steering capability in the sensor. In order to observe phenomena on a “regional to local” scale, GSD of 60–100 m is required as well as a short revisit time. As of today, ASTER [27] on Terra satellite and TIRS on L8 [19,28] offer such a capability with 90–100 m of spatial resolution (swath width of 60 km and 185 km, respectively, within the 8–12 µm atmospheric window) and a revisit time of 16 days. Table 1 reports the main features of both instruments.
Thermal anomalies were studied analyzing the Land Surface Temperature (LST) estimated by ASTER and TIRS thermal channels. For retrieving LST, the Temperature and Emissivity Separation (TES) methodology [29] was applied to ASTER thermal channels, while for TIRS thermal data, due to the presence of only two bands in TIR region and considering the USGS announced caution in the use of Band 11 of TIRS due to the calibration uncertainties [30], we applied the Single-Channel Algorithm (SCA) described and tested in [31,32,33]. To match the data in terms of spatial resolution, the LST retrieved by TIRS data was resampled to GSD of ASTER data (90 m) by using the nearest neighbor method.
Cloud-free and nighttime satellite data were freely downloaded by the EarthExplorer platform [34] managed by the USGS. The choice to use nighttime data is due to the necessity to minimize the effect of solar heating in temperature estimation and to magnify the differences in temperature between the anomalies and the background. Furthermore, during the nighttime, the topographic effect is minimized and the reflectance component is negligible. Another advantage of nighttime images is that surface radiant temperature is more constant than in the daytime. For these reasons, ASTER and TIRS nighttime image series were considered in this study. A final dataset consisting of more than 300 images was collected (Table 2).
The availability of a substantial number of these satellite data for the Island of Vulcano offered the possibility of obtaining LST time series over a long period, thus, allowing for an accurate analysis of thermal anomalies. Due to the different methodology to derive the LST, the results were sorted according to the type of satellites and for such reason, two different LST time series were generated for ASTER and TIRS, respectively.
A first investigation was carried out by analyzing the time distribution of the surface temperature value over a specific area, covered by a single satellite pixel, using for both sensor the 90 m GSD. In both TIRS and ASTER time series, the hottest pixel was chosen by performing Pixel Purity Index (PPI) analysis. PPI analysis allows to find the extreme pixel in multispectral and hyperspectral images, which represents the most spectrally pure pixel in the image. In this work, we apply, unconventionally, this analysis on LST time-series maps to discriminate which are the pixels most frequently marked as those hottest (Figure 5). By following this approach, we identified 4 pixels that are the hottest in 284 cases on 308 total equal to 92% of the occurrence. By considering these four pixels as a loci of the thermal anomaly we depicted a 10 × 10 pixels Region Of Interest (ROI), centered on the pixels detected by the PPI analysis; therefore, the statistical analysis is applied taking into account both the area affected from the fumarolic activity (red pixels in Figure 5) and a background area (green pixels in Figure 5) that is barely affected by the activity identified as Background Reference Pixel (BRP).
One important effect that is visible working with LST time series is seasonality. This effect illustrates annual insolation variations and is typically modeled as a sinusoidal function (Figure 6). To better discriminate the intensity of the thermal anomaly, the seasonality effect has to be defined analyzing an area far from those considered thermally active. We focused our attention on two main areas; the BRP far from La Fossa crater (Figure 5 and the four red pixels, derived from PPI analysis, in La Fossa crater rim, Figure 5). Both areas analyzed are affected by the same seasonality effects (Figure 6). One of these effects has yearly wavelength and it could be modeled as a sinusoidal function (Figure 6). In order to avoid the seasonality of the data and to highlight the hydrothermal activity of La Fossa, we considered a statistical approach based on standard deviation.
The statistical analysis consists of calculating the standard deviation (σmap) of temperatures for each LST map and studying the trend of this parameter over time. The standard deviation describes the spread of data around the mean value: low standard deviation means that temperature values are clustered around the mean value while high standard deviation means that temperature values are widely scattered around the mean value [35].
As reported in Table 2, the total dataset is composed of 308 samples covering the period from 2002 up to 2022; each sample represents the solution of the methods applied for the generation of LST map (see Section 3).
In our study, we computed the standard deviation for the EO data processed and the source of such variability was investigated.
From each LST map the parameter σmap is computed, within the same spatial extension of the ROI (10 × 10 pixel, Figure 5), in order to obtain a historical time series. The behavior of σmap over time is analyzed to detect extreme values, likely related to changes in thermal activity. With the aim to automatically find high values of σmap, mean (MASTER, MTIRS) and standard deviation values (σASTER, σTIRS) of the two satellite time series are calculated. In the algorithm presented here, a value of σmap is defined outlier if greater than MASTER + 2σASTER and MTIRS + 2σTIRS, respectively, for ASTER and TIRS datasets. Considering the Gaussian distribution of σmap samples (Figure 7), the choice of 2σASTER and 2σTIRS values as limits allows us to consider about 95% of the statistical population as regular and about 5% as outlier.
Figure 8 reports the scheme of the algorithm proposed in this paper.

4. Results and Discussion

In this section, the results will be shown and discussed. A first consideration will be carried out about the PPI surface temperature value trend over the time. Then, some consideration about the results derived from the statistical analysis will be pointed out, once specifying the size of the LST maps equal to the ROI.

4.1. Surface Temperature Variation vs. Time

Since ASTER and TIRS were co-registered and resized to the same pixel spatial resolution (90 m), a complete temperature time series (2002–2022) was obtained (Figure 9). In Figure 9, the plot representing the cumulative (ASTER + TIRS) LST time series, focused on the 2013–2022 period, is evidenced. The choice to set the lower time limit set on 2013 depends on the availability of TIRS data. The quasi-sinusoidal trend related to the seasonal behaviour is easily observable. Indeed, high values of temperature in summertime and low values of temperature in wintertime are evident. Therefore, concurrent with the increase in Vulcano thermal activity, a rise in temperature value is evident.

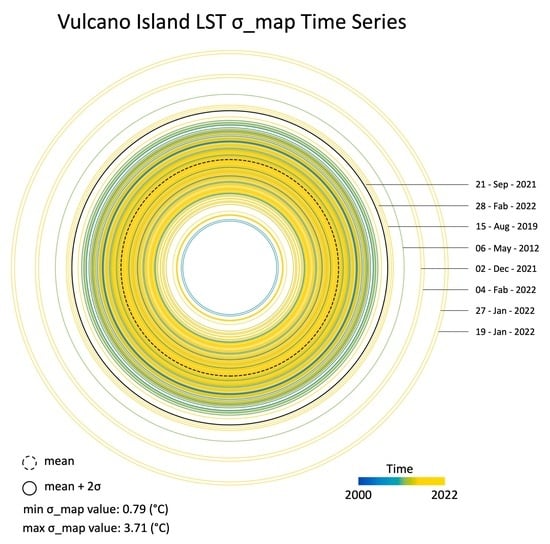
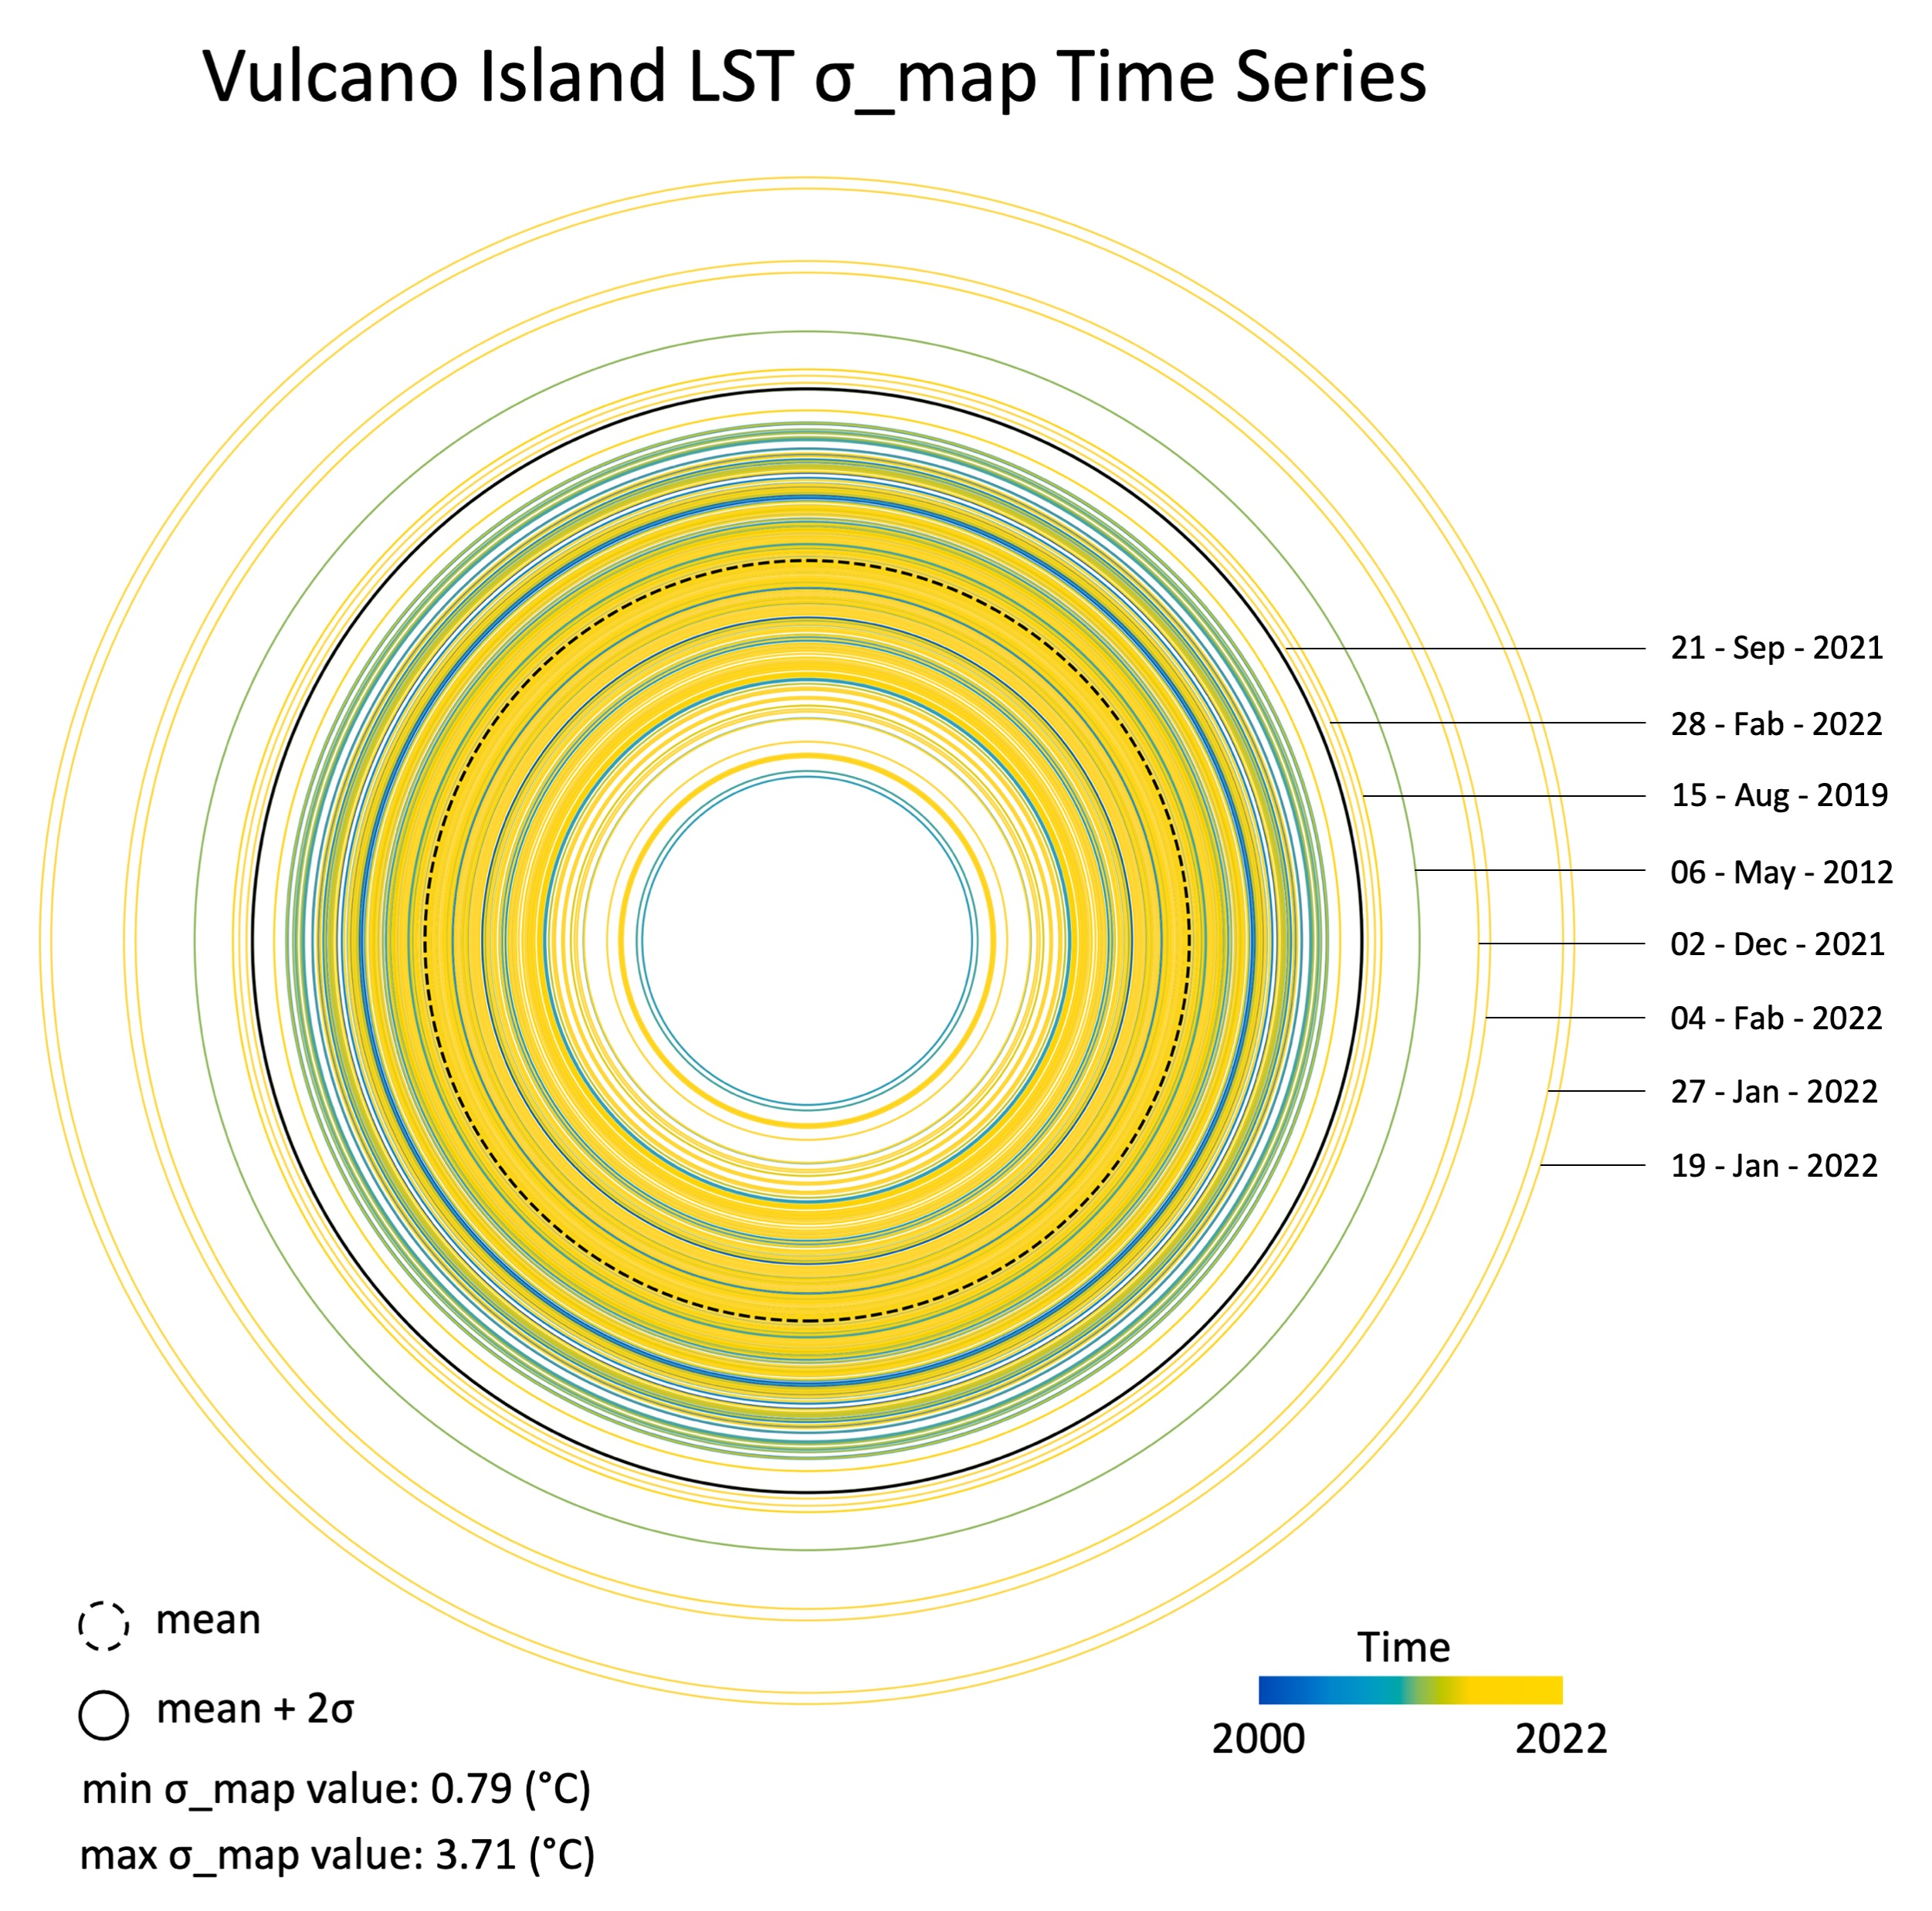
4.2. LST Map Standard Deviation over Time

The statistical approach considered in this paper allows us to neglect the seasonal effects and to highlight the role of the outliers. It is important to remark that TIRS and ASTER do not acquire on the same days. For this reason, the number and the date of the recognised outliers could be relevant to different sources.
Considering the TIRS series, in Figure 10, four outliers are pointed out.
The TIRS time series (Figure 10) shows that the 15 August 2019, 21 September 2021, 27 January, and 28 February 2022 are outliers. The first outlier (1 in Figure 10) exceeds the 2σ value and it depends on the presence of cloud coverage in the background area, which impacts the value of the standard deviation (Figure 10).
The other outliers (2, 3, and 4 in Figure 10) cover a quasi-continuous time period ranging from September 2021 up to the last data analyzed (4 February 2022) and their trend is in agreement with the INGV bulletins [21,22]. This permits these outliers to be assigned to the current crisis on Vulcano island. Whilst the TIRS data relevant to two and four outliers were acquired under optimal weather conditions, number 3 was characterized by cloud coverage of the same magnitude as number 1. However, the following considerations can be made: outlier number 1 is relative to data acquired during summer and, therefore, the low temperatures to the clouds correspond to a high environmental temperature due to the hot season. Outlier number 3 is relevant to EO data sensed during winter (27 January 2022) and its value depends on the presence of clouds that determines the lower temperature and to the hottest that cannot be referred to the environment (winter see Figure 9) but to the contemporary crisis.
By analyzing the ASTER time series (Figure 11) in the same TIRS time window (data from 2013), the three detected outliers match in time with the current crisis of Vulcano and they are consistent with the results derived from TIRS analysis, considering the good weather conditions present at the acquisition dates.
Considering the previous discussed results and joining the two datasets based on the temporal range with the available ASTER data, we obtain the largest dataset, which allows us to increase the temporal resolution in the time series and extend the thermal activity analysis of Vulcano, starting this back analysis from 2000 up to now and to recognize the anomalous events occurring in 2004–2007 and 2009–2010, as reported in [25,36] (Figure 12).
Comparing our results to 2004–2005, despite these points not being identified as outliers, they have high standard deviation value (about 2.5), as their value is close to +2σ, suggesting a relation with the occurred crises reported in [25]. For the 2009–2010 event, also described in [25,36], we obtain an increasing trend up over 2010 and also to the beginning 2012. The others match with the current crisis in Vulcano.
The application of standard deviation permits one to neglect the absolute value of the surface temperature obtained by the two different methods (TES and SCA, respectively, for ASTER and TIRS). Despite the differences between the used orbiting system, as already verified in [33], the procedures adopted led to a generation of comparable datasets where the application of standard deviation method further reduces the uncertainties due to the different datasets.

5. Conclusions

Thermal data can have an important role in the delineation of surface temperature anomalies associated with thermal activity and for the measurement of near-surface heat fluxes associated with thermal systems.
The studied case represents demonstrations of the potentiality of satellite observations in TIR for environmental applications and confirms the request to the remote sensing community for a continuous improvement in satellite sensors in the TIR, especially in terms of spatial resolution.
The use of two sensors (ASTER and TIRS), despite the differences in processing method applied for LST estimation and GSD, produced results with high correlation, offering the possibility to extend, in time, the LST time series. The use of two sensors proved to be a cost-effective technique for generating products that allow for not only the detection but also the monitoring of thermal anomalies, permitting one to analyze how the anomaly evolves over time and to highlight critical changes in thermal activities.
Despite the methodology used, this work is based on a very simple use of statistical tools and this approach permits one to highlight the outliers, which correspond to the evidence of the surface thermal state on Vulcano island.
With this work, a robust and easy-to-use procedure for the detection of thermal anomalies and their activity was applied. The proposed methodology can be easily replicated, ensuring the conceptual correctness and reproducibility of image processing.
This study will be updated by using data that will be provided by the new planned and orbiting mission with a GSD finer than what we already use (90 m), on which we could rely for the coming years.

Author Contributions

Conceptualization, F.R., M.S. and M.M.; methodology, F.R. and M.S.; validation, M.S.; investigation, V.R.; data curation, F.R.; writing—original draft preparation, F.R., M.M. and M.S.; writing—review and editing, V.R. and M.F.B.; supervision, M.F.B. All authors have read and agreed to the published version of the manuscript.

Funding

This research received no external funding.

Data Availability Statement

Satellite data are available from EarthExplorer website; other data used in this manuscript belong to INGV.

Acknowledgments

The authors thank their colleague Tullio Ricci for comments, suggestions, and encouraging the progress of this paper.

Conflicts of Interest

The authors declare no conflict of interest.

References

  1. Mercalli, G.; Silvestri, O. Le eruzioni dell’Isola di Vulcano incominciate il 3 agosto 1888 e terminate il 22 marzo 1890, relazione scientifica. Ann. Uff. Cent. Metereol. Geodin. Ital. 1891, 10, 1–213. [Google Scholar]
  2. Dellino, P.; De Astis, G.; La Volpe, L.; Mele, D.; Sulpizio, R. Quantitative hazard assessment of phreatomagmatic eruptions at Vulcano (Aeolian Islands, Southern Italy) as obtained by combining stratigraphy, event statistics and physical modelling. J. Volcanol. Geotherm. Res. 2011, 201, 364–384. [Google Scholar] [CrossRef]
  3. De Astis, G.; Lucchi, F.; Dellino, P.; La Volpe, L.; Tranne, C.A.; Frezzotti, M.L.; Peccerillo, A. Geology, volcanic history and petrology of Vulcano (central Aeolian archipelago). Geol. Soc. Lond. Mem. 2013, 37, 281–349. [Google Scholar] [CrossRef]
  4. De Astis, G.; Dellino, P.; La Volpe, L.; Lucchi, F.; Tranne, C.A. Geological map of the island of Vulcano, scale 1: 10,000 (Aeolian archipelago). The Aeolian Islands Volcanoes. Geol. Soc. Lond. Mem. 2013, 37. Available online: http://hdl.handle.net/11585/373543 (accessed on 11 July 2022).
  5. Di Traglia, F.; Pistolesi, M.; Rosi, M.; Bonadonna, C.; Fusillo, R.; Roverato, M. Growth and erosion: The volcanic geology and morphological evolution of La Fossa (Island of Vulcano, Southern Italy) in the last 1000 years. Geomorphology 2013, 194, 94–107. [Google Scholar] [CrossRef]
  6. Granieri, D.; Carapezza, M.L.; Barberi, F.; Ranaldi, M.; Ricci, T.; Tarchini, L. Atmospheric dispersion of natural carbon dioxide emissions on Vulcano Island, Italy. J. Geophys. Res. Solid Earth 2014, 119, 5398–5413. [Google Scholar] [CrossRef]
  7. Chiodini, G.; Granieri, D.; Avino, R.; Caliro, S.; Costa, A.; Werner, C. Carbon dioxide diffuse degassing and estimation of heat release from volcanic and hydrothermal systems. J. Geophys. Res. 2005, 110, B08204. [Google Scholar] [CrossRef]
  8. Piochi, M.; De Astis, G.; Petrelli, M.; Ventura, G.; Sulpizio, R.; Zanetti, A. Constraining the recent plumbing system of Vulcano (Aeolian Arc, Italy) by textural, petrological, and fractal analysis: The 1739 AD Pietre Cotte lava flow. Geochem. Geophys. Geosystems 2009, 10. [Google Scholar] [CrossRef]
  9. Gurioli, L.; Zanella, E.; Gioncada, A.; Sbrana, A. The historic magmatic-hydrothermal eruption of the Breccia di Commenda, Vulcano, Italy. Bull. Volcanol. 2012, 74, 1235–1254. [Google Scholar] [CrossRef]
  10. Doronzo, D.M.; Dellino, P.; Sulpizio, R.; Lucchi, F. Merging field mapping and numerical simulation to interpret the lithofacies variations from unsteady pyroclastic density currents on uneven terrain: The case of La Fossa di Vulcano (Aeolian Islands, Italy). J. Volcanol. Geotherm. Res. 2017, 330, 36–42. [Google Scholar] [CrossRef]
  11. Sobrino, J.A.; Del Frate, F.; Drusch, M.; Jiménez-Muñoz, J.C.; Manunta, P.; Regan, A. Review of thermal infrared applications and requirements for future high-resolution sensors. IEEE Trans. Geosci. Remote Sens. 2016, 54, 2963–2972. [Google Scholar] [CrossRef]
  12. Girona, T.; Realmuto, V.; Lundgren, P. Large-scale thermal unrest of volcanoes for years prior to eruption. Nat. Geosci. 2021, 14, 238–241. [Google Scholar] [CrossRef]
  13. Schmetz, J.; Pili, P.; Tjemkes, S.; Just, D.; Kerkmann, J.; Rota, S.; Ratier, A. An introduction to Meteosat second generation (MSG). Bull. Am. Meteorol. Soc. 2002, 83, 977–992. [Google Scholar] [CrossRef]
  14. Sun, D.; Pinker, R.T. Estimation of land surface temperature from a Geostationary Operational Environmental Satellite (GOES-8). J. Geophys. Res. Atmos. 2003, 108. [Google Scholar] [CrossRef]
  15. Wan, Z.; Snyder, W. MODIS Land-Surface Temperature Algorithm Theoretical Basis Document (LST ATBD), Version 3.2. In Institute for Computational Earth System Science; University of California: Santa Barbara, CA, USA, 1996. [Google Scholar]
  16. Li, Z.-L.; Becker, F. Feasibility of land surface temperature and emissivity determination from AVHRR data. Remote Sens. Environ. 1993, 85, 67–85. [Google Scholar] [CrossRef]
  17. Donlon, C.; Berruti, B.; Buongiorno, A.; Ferreira, M.H.; Féménias, P.; Frerick, J.; Goryl, P.; Klein, U.; Laur, H.; Mavrocordatos, C.; et al. The Global Monitoring for Environment and Security (GMES) Sentinel-3 mission. Remote Sens. Environ. 2012, 120, 37–57. [Google Scholar] [CrossRef]
  18. Buongiorno, M.F.; Pieri, D.; Silvestri, M. Thermal analysis of volcanoes based on 10 years of ASTER data on Mt. Etna. In Thermal Infrared Remote Sensing; Springer: Dordrecht, The Netherlands, 2013; pp. 409–428. [Google Scholar]
  19. Roy, D.P.; Wulder, M.A.; Loveland, T.R.; Woodcock, C.E.; Allen, R.G.; Anderson, M.C.; Helder, D.; Irons, J.R.; Johnson, D.M.; Kennedy, R. Landsat-8: Science and product vision for terrestrial global change research. Remote Sens. Environ. 2014, 145, 154–172. [Google Scholar] [CrossRef]
  20. Silvestri, M.; Rabuffi, F.; Pisciotta, A.; Musacchio, M.; Diliberto, I.S.; Spinetti, C.; Lombardo, V.; Colini, L.; Buongiorno, M.F. Analysis of Thermal Anomalies in Volcanic Areas Using Multiscale and Multitemporal Monitoring: Vulcano Island Test Case. Remote Sens. 2019, 11, 134. [Google Scholar] [CrossRef]
  21. Vulcano Online INGV Report. Available online: https://cme.ingv.it/statodi-attivita-dei-vulcani-eoliani/crisi-idrotermale-vulcano-2021 (accessed on 9 August 2022).
  22. Vulcano Online INGV Weekly Bulletin. Available online: https://cme.ingv.it/bollettini-e-comunicati/bollettini-settimanali-vulcano/850-bollettino-vulcano-12102021 (accessed on 19 April 2022).
  23. Mannini, S.; Harris, A.J.; Jessop, D.E.; Chevrel, M.O.; Ramsey, M.S. Combining Ground-and ASTER-Based Thermal Measurements to Constrain Fumarole Field Heat Budgets: The Case of Vulcano Fossa 2000–2019. Geophys. Res. Lett. 2019, 46, 11868–11877. [Google Scholar] [CrossRef]
  24. Volcanic Alert-Levels Characterize Conditions at U.S. Volcanoes. Available online: https://www.usgs.gov/programs/VHP/volcanic-alert-levels-characterize-conditions-us-volcanoes (accessed on 19 April 2022).
  25. Inguaggiato, S.; Vita, F.; Diliberto, I.S.; Mazot, A.; Calderone, L.; Mastrolia, A.; Corrao, M. The extensive parameters as a tool to monitoring the volcanic activity: The case study of Vulcano Island (Italy). Remote Sens. 2022, 14, 1283. [Google Scholar] [CrossRef]
  26. Phillipson, G.; Sobradelo, R.; Gottsmann, J. Global volcanic unrest in the 21st century: An analysis of the first decade. J. Volcanol. Geotherm. Res. 2013, 264, 183–196. [Google Scholar] [CrossRef]
  27. ASTER. Available online: https://terra.nasa.gov/about/terra-instruments/aster (accessed on 19 April 2022).
  28. Landsat 8. Available online: https://landsat.gsfc.nasa.gov/satellites/landsat-8/ (accessed on 19 April 2022).
  29. Gillespie, A.R.; Rokugawa, S.; Hook, S.J.; Matsunaga, T.; Kahle, A.B. Temperature/emissivity separation algorithm theoretical basis document, version 2.4. In ATBD Contract NAS5-31372; NASA: Washington, DC, USA, 1999. [Google Scholar]
  30. USGS. Landsat 8 OLI and TIRS Calibration Notices. Available online: https://www.usgs.gov/land-resources/nli/landsat/landsat-8-oli-and-tirs-calibration-notices (accessed on 19 April 2022).
  31. Silvestri, M.; Marotta, E.; Buongiorno, M.F.; Avvisati, G.; Belviso, P.; Sessa, E.B.; Caputo, T.; Longo, V.; De Leo, V.; Teggi, S. Monitoring of Surface Temperature on Parco delle Biancane (Italian Geothermal Area) Using Optical Satellite Data, UAV and Field Campaigns. Remote Sens. 2020, 12, 2018. [Google Scholar] [CrossRef]
  32. Silvestri, M.; Romaniello, V.; Hook, S.; Musacchio, M.; Teggi, S.; Buongiorno, M.F. First Comparisons of Surface Temperature Estimations between ECOSTRESS, ASTER and Landsat 8 over Italian Volcanic and Geothermal Areas. Remote Sens. 2020, 12, 184. [Google Scholar] [CrossRef]
  33. Caputo, T.; Sessa, E.B.; Silvestri, M.; Buongiorno, M.F.; Musacchio, M.; Sansivero, F.; Vilardo, G. Surface temperature multiscale monitoring by thermal infrared satellite and ground images at Campi Flegrei volcanic area (Italy). Remote Sens. 2019, 11, 1007. [Google Scholar] [CrossRef]
  34. Data Download. Available online: https://earthexplorer.usgs.gov (accessed on 19 April 2022).
  35. Davis, J.C.; Sampson, R.J. Statistics and Data Analysis in Geology; Wiley: New York, NY, USA, 1986; Volume 646. [Google Scholar]
  36. Gaudin, D.; Ricci, T.; Finizola, A.; Delcher, E.; Alparone, S.; Barde-Cabusson, S.; Brothelande, E.; Di Gangi, F.M.; Gambino, S.; Inguaggiato, S.; et al. Heat flux-based strategies for the thermal monitoring of sub-fumarolic areas: Examples from Vulcano and La Soufrière de Guadeloupe. J. Volcanol. Geotherm. Res. 2017, 343, 122–134. [Google Scholar] [CrossRef]
Figure 1. Location and 3D model of Vulcano Island (a); 3D view of Land Surface Temperature maps with two detectable thermal anomalies: “La Fossa” and “Fangaia” (b).
Remotesensing 14 03933 g001
Figure 2. Zoomed 3D view of La Fossa cone. The main fumarolic field on the northern rim is highlighted.
Remotesensing 14 03933 g002
Figure 3. Daily frequency of micro-shocks (peak frequency between 1 and 30 Hz) that characterizes the local seismicity of Vulcano in the last year. A significant increase in seismicity is evident in the right end of the graphic.
Remotesensing 14 03933 g003
Figure 4. Automatic recording of the CO2 flux (A) at the station located east of the fumarolic area; time variation in the SO2 flow (B) recorded by the automatic FLux Automatic MEasurement (FLAME) network managed by the INGV-OE.
Remotesensing 14 03933 g004
Figure 5. 10 × 10 pixels ROI centered on La Fossa cone. The area with the main fumarolic activity is marked in yellow. The PPI (hottest) pixel is in dark red included in the pale red 6 × 6 pixels which depict the hot area; in green the pixels of the ROI that belong to the background (considered as cold area). The two dark areas (red and green) are used to analyze the seasonality effect.
Remotesensing 14 03933 g005
Figure 6. Cumulative temperature time series estimated by integrating ASTER and TIRS. In red the mean value of the four hottest pixels derived from PPI analysis, in green the temperature of the background pixel.
Remotesensing 14 03933 g006
Figure 7. Gaussian distribution of σmap samples.
Remotesensing 14 03933 g007
Figure 8. Workflow and steps of the process adopted to individuate the outlier.
Remotesensing 14 03933 g008
Figure 9. Cumulative (ASTER+TIRS) LST related to the PPI pixels (red line). For the time period ranging from January 2020 up to January 2022, an increase in temperature value is evident. In the red dotted box are plotted both ASTER and TIRS. Before 2014 (gray box) only ASTER data were available.
Remotesensing 14 03933 g009
Figure 10. σTIRS and MTIRS value for the entire TIRS dataset (Up): Visual analysis for the 15 August 2019, 21 September 2021, 27 January, and 28 February 2022, outliers (down, 1; 2; 3; 4 respectively).
Remotesensing 14 03933 g010
Figure 11. σASTER and MASTER value for the entire ASTER dataset (Up): Visual analysis for the 2 December 2021, 19 January 2022, and 4 February 2022, outliers (down, 1; 2; 3, respectively).
Remotesensing 14 03933 g011
Figure 12. Cumulative analysis: ASTER and TIRS σmap, ±2σASTER&TIRS and MASTER&TIRS starting from 2000. The three windows highlight the main anomalous events occurred in 2004–2005, 2009–2010 and the last 2021.
Remotesensing 14 03933 g012
Table 1. ASTER and TIRS bands features; * TIRS bands are acquired at 100 m spatial resolution but are resampled to 30 m in delivered data product.
DescriptionASTERTIRSUnit
Number of thermal bands52-
Bands centers8.29, 8.63, 9.07, 10.66, 11.3210.9 (Band 10), 12.0 (Band 11)µm
FWHM of bands0.35, 0.35, 0.35, 0.7, 0.70.6, 1.0µm
Pixel size at nadir90100 *M
Revisit time1616Day
Swath width60185Km
Table 2. Satellite images considered for the analysis.
SensorTimeNumber of Processed Images
ASTER6 June 2000–4 February 2022232
TIRS4 December 2013–2 February 202276
Total6 June 2000–4 February 2022308
Publisher’s Note: MDPI stays neutral with regard to jurisdictional claims in published maps and institutional affiliations.

