Technical Note

Clustering of Handheld Thermal Camera Images in Volcanic Areas and Temperature Statistics

1
Istituto Nazionale di Geofisica e Vulcanologia sezione di Napoli, 80124 Napoli, Italy
2
Independent Researchers, 83021 Campania, Italy
*
Author to whom correspondence should be addressed.
Remote Sens. 2022, 14(15), 3789; https://doi.org/10.3390/rs14153789
Submission received: 27 May 2022 / Revised: 27 July 2022 / Accepted: 30 July 2022 / Published: 6 August 2022
(This article belongs to the Special Issue Remote Sensing of Geothermal and Volcanic Environments)

Abstract

:
Thermal camera use is becoming ever more widespread in volcanic and environmental research and monitoring activities. Depending on the scope of an investigation and on the type of thermal camera used, different software for thermal infrared (IR) images analysis is employed. The Osservatorio Vesuviano Sezione in Napoli of the Istituto Nazionale di Geofisica e Vulcanologia (INGV-OV) processes the images acquired during thermal monitoring activities acquired in the Neapolitan areas (Vesuvio, Ischia and Campi Flegrei) with different FLIR software that returns for each image, or for each selected area within the image, a series of parameters (maximum temperature, average temperature, standard deviation, etc.). An operator selects the area of interest and later “manually” inserts the relevant parameters in Excel sheets to generate graphs. Such a tedious, time- and resource-consuming procedure gave reason to implement a software able to automatically analyze sets of thermal images taken with a handheld thermal camera without any manual action. This paper describes the method and the software implemented to “automate” and refine the extrapolation process and the analysis of the relevant information. The employed method clusters thermal images by applying K-MEANS and DBSCAN techniques. After clustering a series of images, the software displays the necessary statistics to highlight possible fluctuations in temperature values. The software, “StaTistical Analysis clusteRed ThErmal Data” (STARTED), is already available. Although it has been developed mostly to support monitoring of the volcanoes in Campania, it is quite versatile and can be used for any activity that implies thermal data analysis. In this paper, we describe the workflow and the dataset used to develop the software, as well as the first result obtained from it.

1. Introduction

Permanent, handheld, unmanned aircraft system (UAS), plane-mounted, helicopter-mounted and satellite-sensor thermal cameras are increasingly employed in miscellaneous applications, amongst which are the study of active and quiescent volcanic areas, environmental monitoring, research and validation/calibration of satellite data [1,2,3,4,5,6,7,8,9,10,11,12,13,14,15,16,17,18,19,20,21,22,23,24,25,26,27,28,29].
The study of temperature changes, especially in volcanic context, allows one to gain knowledge about volcanic behavior ([14] and reference therein). Thermal data, combined with geophysical and geochemical observations, may contribute to the detection of eruption precursors such as the change in fumarole temperature, the opening of new fractures and the different geochemical composition of the gases that rise to the surface [24].
The Osservatorio Vesuviano Sezione di Napoli of the Istituto Nazionale di Geofisica e Vulcanologia (INGV-OV) has the task of monitoring the volcanic areas (Ischia, Vesuvio and Campi Flegrei) in the Campania region (in the south of Italy; Figure 1) [30,31,32,33]. Ground temperature has been monitored and recorded since 2008 using handheld thermal cameras and since 2019 with the aid of UAVs. Currently, the acquired images are processed using FLIR software [34], which returns for each image, or for each manually selected area within an image, a series of parameters (average temperature, standard deviation, etc.), which are then “manually” inserted by an operator into Excel sheets to be analyzed.
This procedure is very time and resource consuming: since 2008 thermal monitoring of the Neapolitan volcanoes has produced a very high number of images (thousands for each area investigated): therefore, the need to implement a software able to automatically analyze sets of thermal images on its own without any manual action. Although there is a large bibliography on the use of thermal data for monitoring purposes, the release of groundbreaking software for data storage and analysis has only recently started to increase [19,35,36] and it is leading toward the application of machine learning techniques [37,38]. It is also worth mentioning the unavailability of free/commercial software that can automatically perform the previously mentioned operations.
The aim of this work is to present the software StaTistical Analysis clusteRed ThErmal Data (STARTED) [39] that we developed to automatically extract the desired information from a set of thermal images by means of clustering them. It analyzes one or more directories containing CSV files converted from FLIR thermal images, organized by date and area, and then creates the necessary statistics to highlight possible fluctuations in mean temperature values. The program has been written in Python and makes use of existing libraries and algorithms contained in the standard scikit-learn package. In particular, it uses the K-MEANS [40,41,42,43] algorithm to extract a given number of segments from the image and the DBSCAN [40,44,45] algorithm to extract clusters of near temperatures from the segment with the highest temperature.
The program has been tested on a subset of the thermal dataset acquired on Neapolitan volcanoes. Images were taken in a period circa between 2008 and 2017. As it has been written in Python it can run on any platform where a recent interpreter is available with the required standard packages and libraries (above all, scikit and matplotlib).
The software STARTED (Supplementary Materials) and the images analyzed can be found on the open-access repository Zenodo [39].
Figure 1. This image shows where the investigated volcanic areas are located in Italy. It also shows in detail both the three monitored areas (Ischia, Campi Flegrei and Vesuvio) and the specific points (in green—discrete IR thermal) where the monitoring is carried out. Finally, the image shows in red (Piz, Pan, Sf3a, Ps1a and Sv2) some specific areas referenced in the following paragraphs. Modified by [46].
Remotesensing 14 03789 g001

2. Materials and Methods

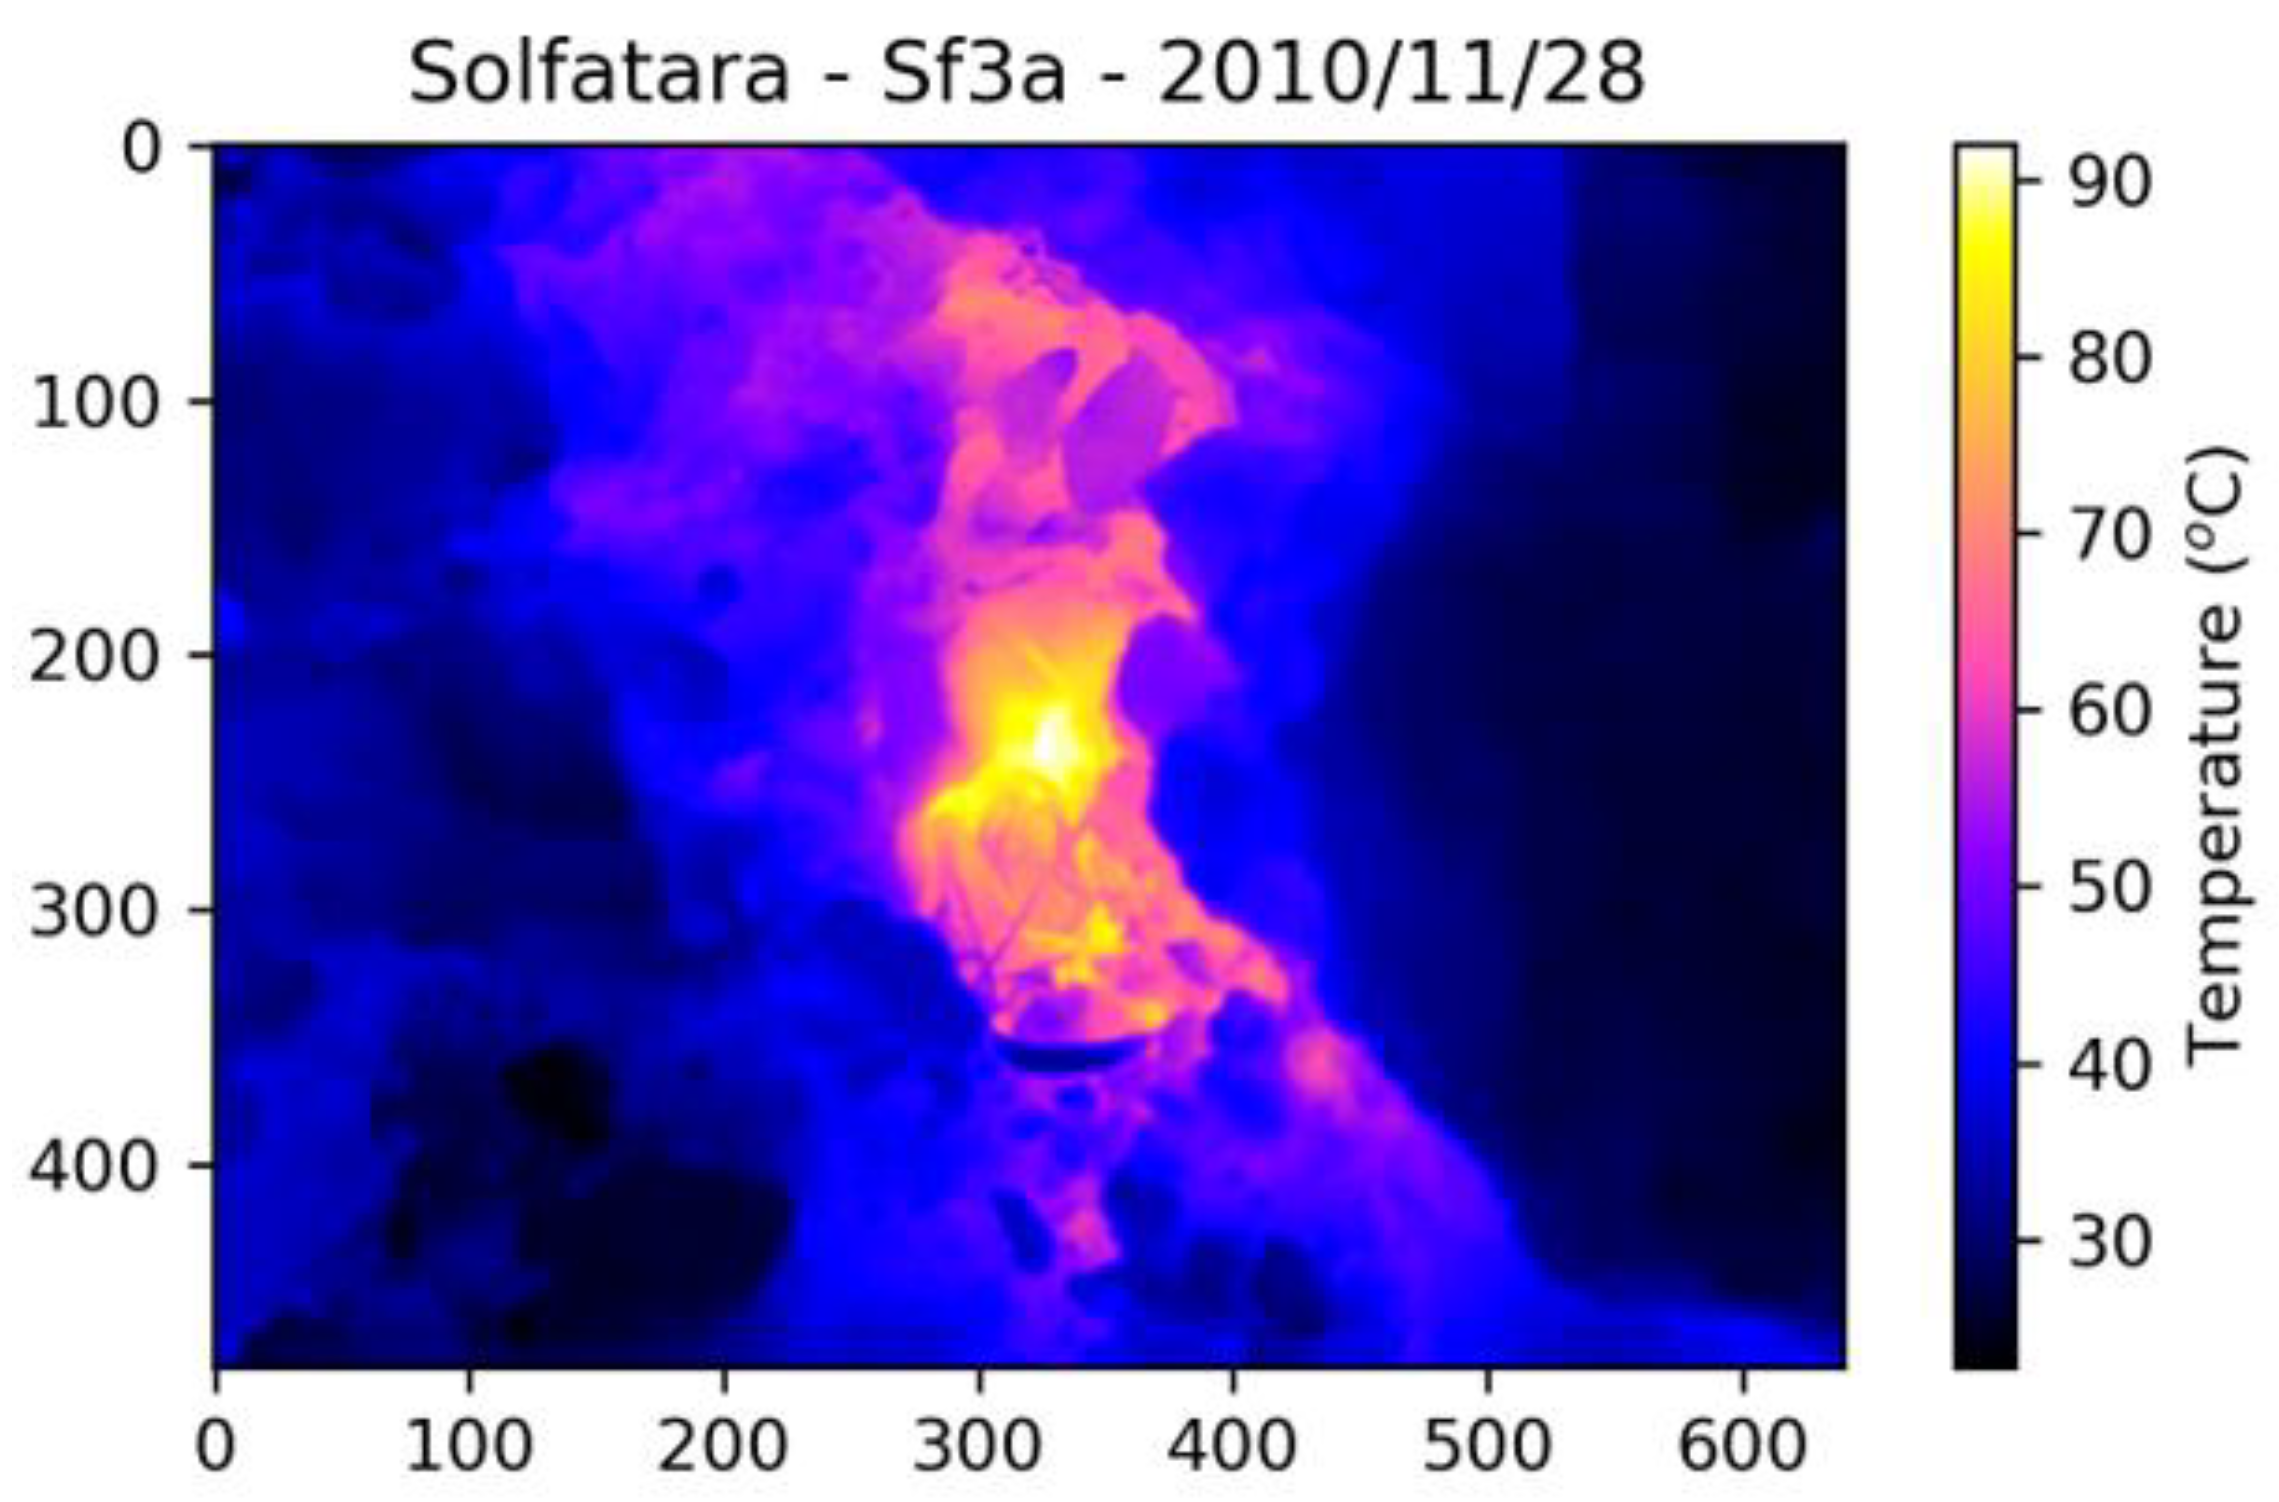
2.1. Handheld Thermal Images

Starting from 2008, the TTM group (Telecamere Termiche Mobili—Handheld Thermal Camera) at the Osservatorio Vesuviano performs monthly campaigns to acquire temperature data in a number of “stations” over the three Neapolitan volcanoes (Vesuvio, Campi Flegrei and Ischia); the map of these measurement stations is in Figure 1. Each station is in a different structural and volcanic context, but they are always linked to thermal anomalies related to the degassing structures of the three volcanoes: fumarolas, hot springs, resurgence of hot fluid, etc. The characteristic temperatures of the anomalies are therefore in a range under 100 °C, overlapping this value in a very few cases. This temperature range is mostly due to the interaction of hot fluid coming from the quiescent volcanoes with the upper water plant that acts as a temperature buffer on the hot fluid.
The relatively low value of the temperatures requires that data must be acquired during nightly hours to avoid the interference of solar irradiation. Thermal images are taken using a FLIR SC640 [21] camera with a resolution of 640 × 480 pixels and a temperature resolution of ±2 °C under 100 °C and ±2% over 100 °C. During each monthly campaign, for each station environmental data (air temperature and relative humidity) were first of all recorded with a thermo-hygrometer and then about 10 images of the thermal anomalies were shot. Most of the measures are taken at a distance ranging from 1 m to 5 m from the target; in some places (for example at Vesuvius and Ischia), such distances may also reach in the order of the kilometer. When possible, temperature was also recorded using a K thermocouple.
A typical example of an image shot during the campaigns is shown in Figure 2. Subsequently, an operator selected the best image of the shot set for each station: the one with a vision of the target not disturbed by gases or other external influences. For each of the selected images, a number of pieces of information were extracted through the use of the ThermaCam Research 2.10 software [34] (Figure 2): the maximum temperature, the average temperature with its standard deviation and, as the analysis requirement increased, the average temperature with the standard deviation of the hottest areas.
Selection of the hottest areas and recording of the extracted information is manually repeated for each of the acquisition stations and the results are inserted in an Excel sheet and then processed to deliver a graph of temperatures over time, as shown in Figure 3. Separating the hot zones in these images is an issue in itself: due to the nature and source of the thermal anomalies, their temperature is not so different from the environment (background) temperature. In case of hot lava, for example, the temperature difference between hot and cold areas is big enough to allow the use of a simple threshold at something around 100 °C to obtain a quite good separation. This is not the case of our thermal image as the hot zones are in the same temperature range of the surrounding environment and temperatures slowly decline and merge with cold ones, with the result that the use of a simple threshold is not effective at all. Moreover, the size and shape of thermal anomalies is heavily influenced by the external temperature, requiring a more sophisticated approach to the task.

2.2. Program Requirements and Operation
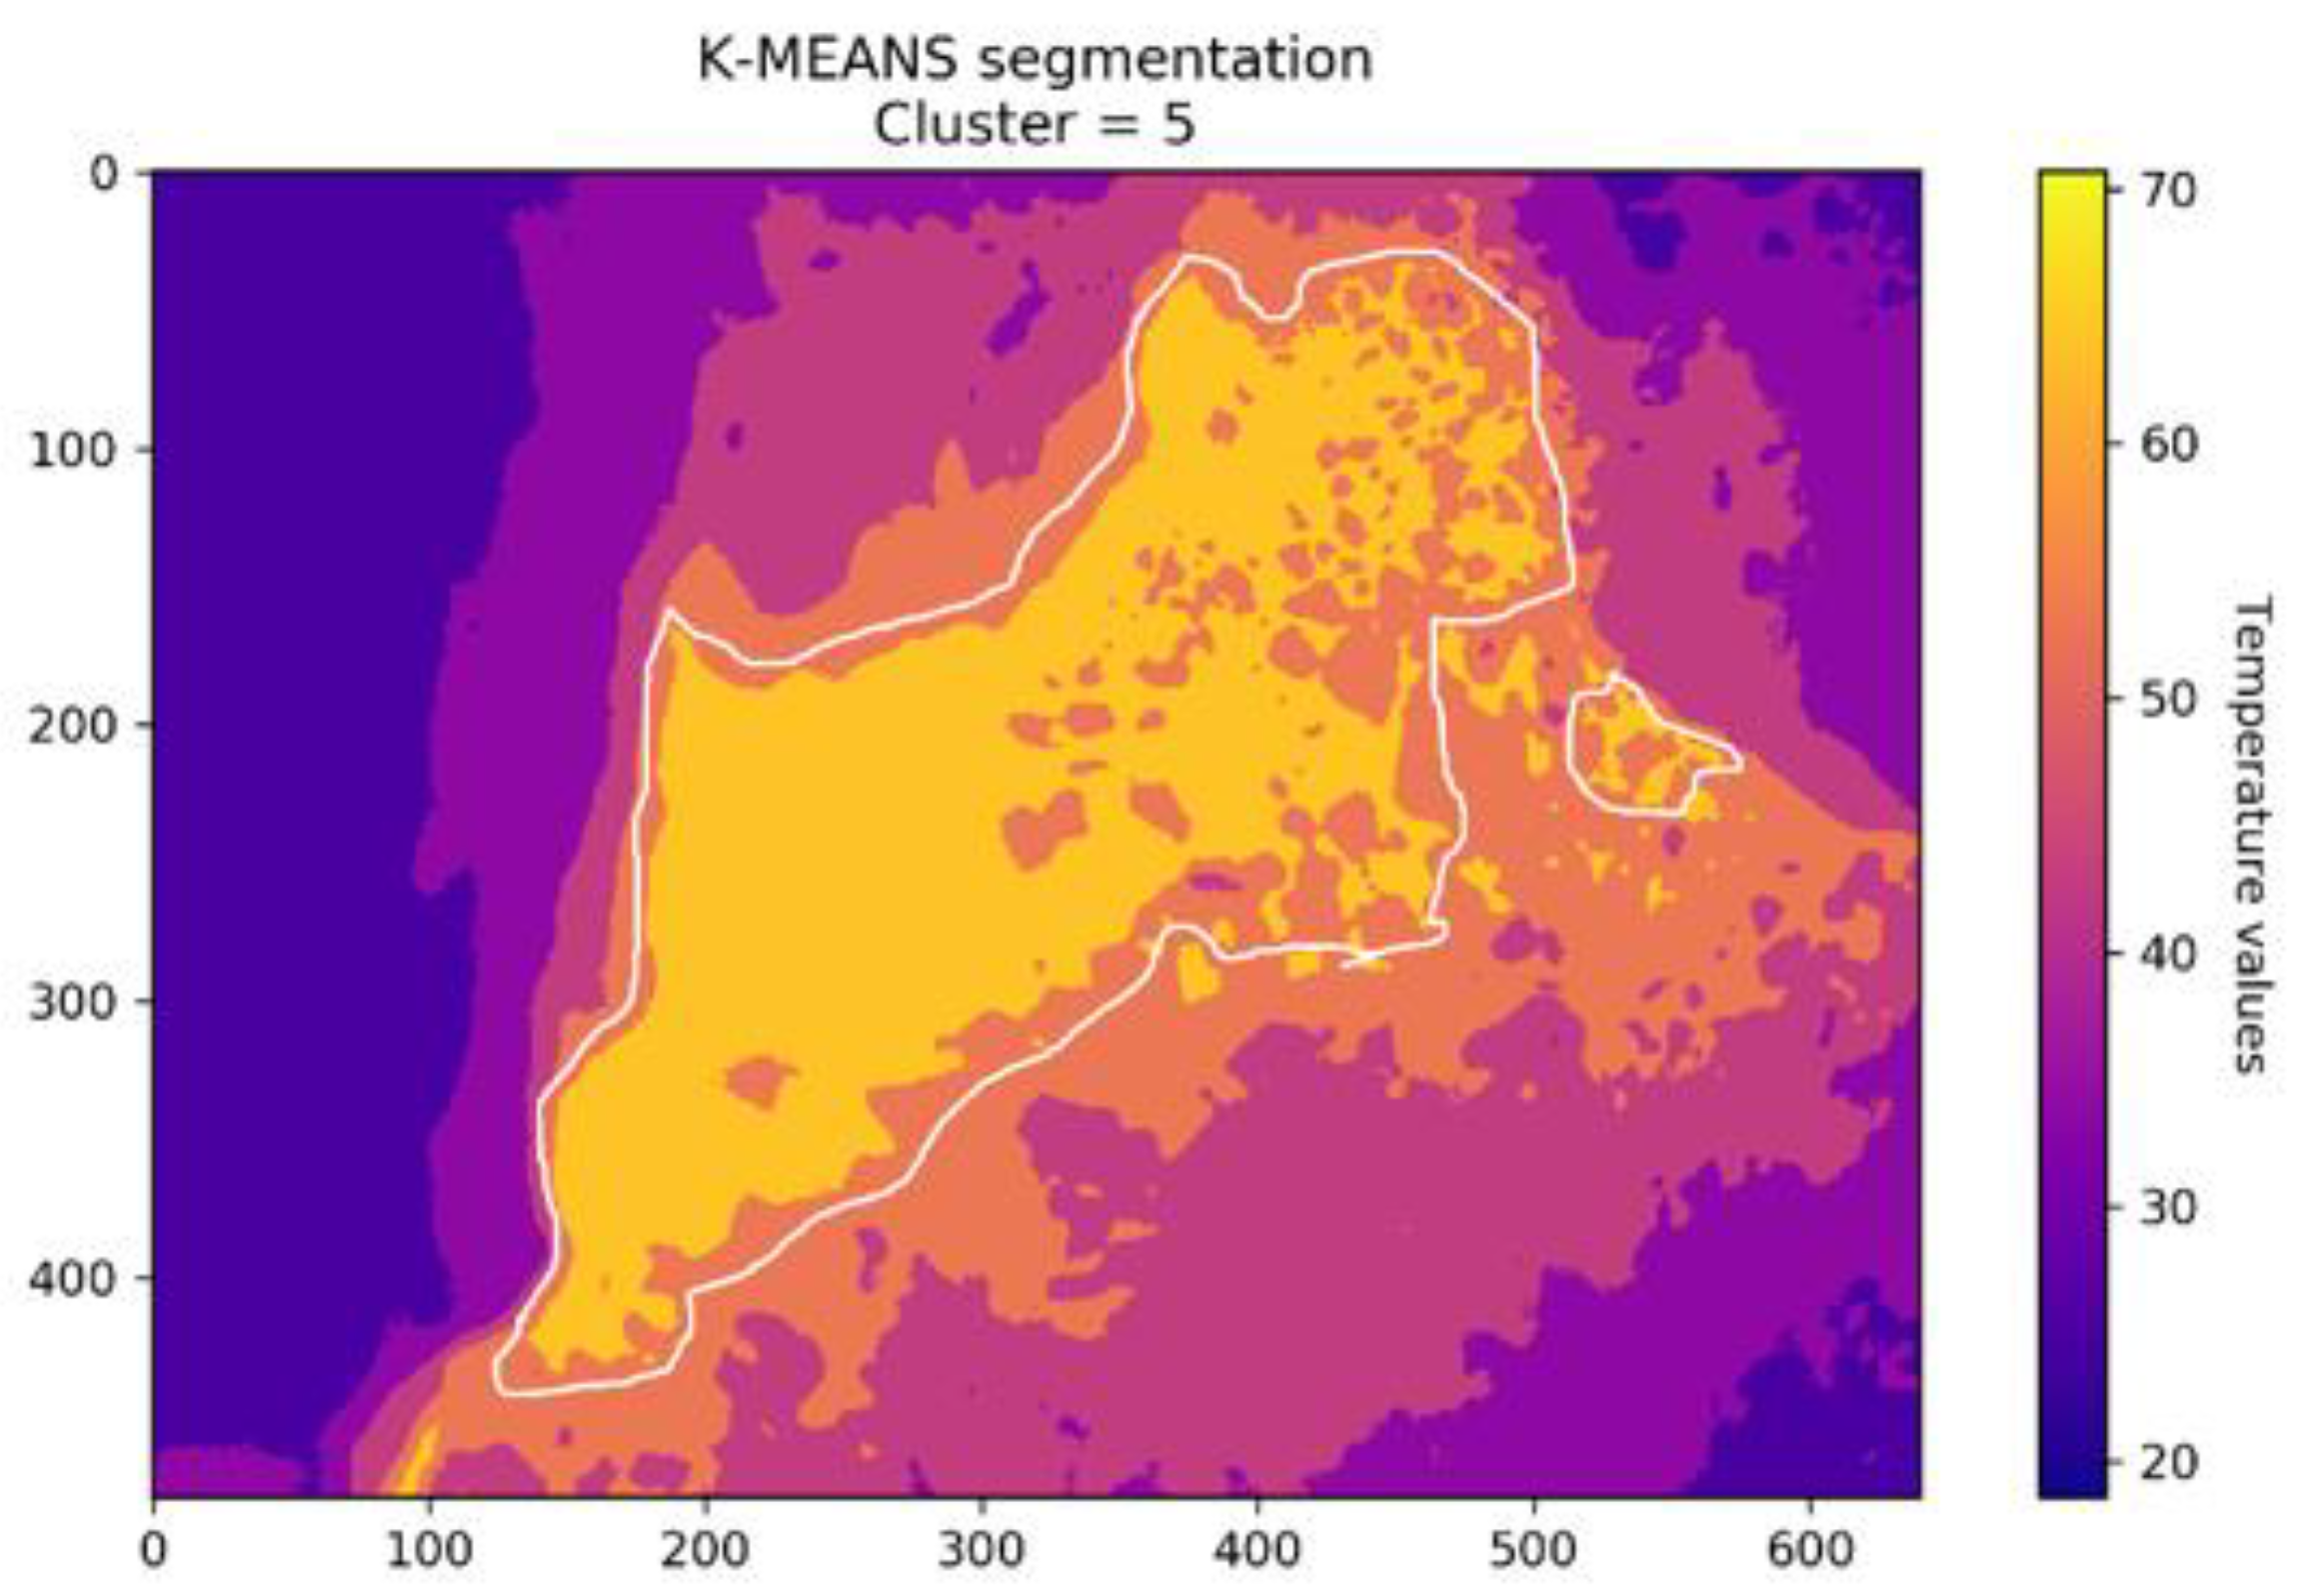
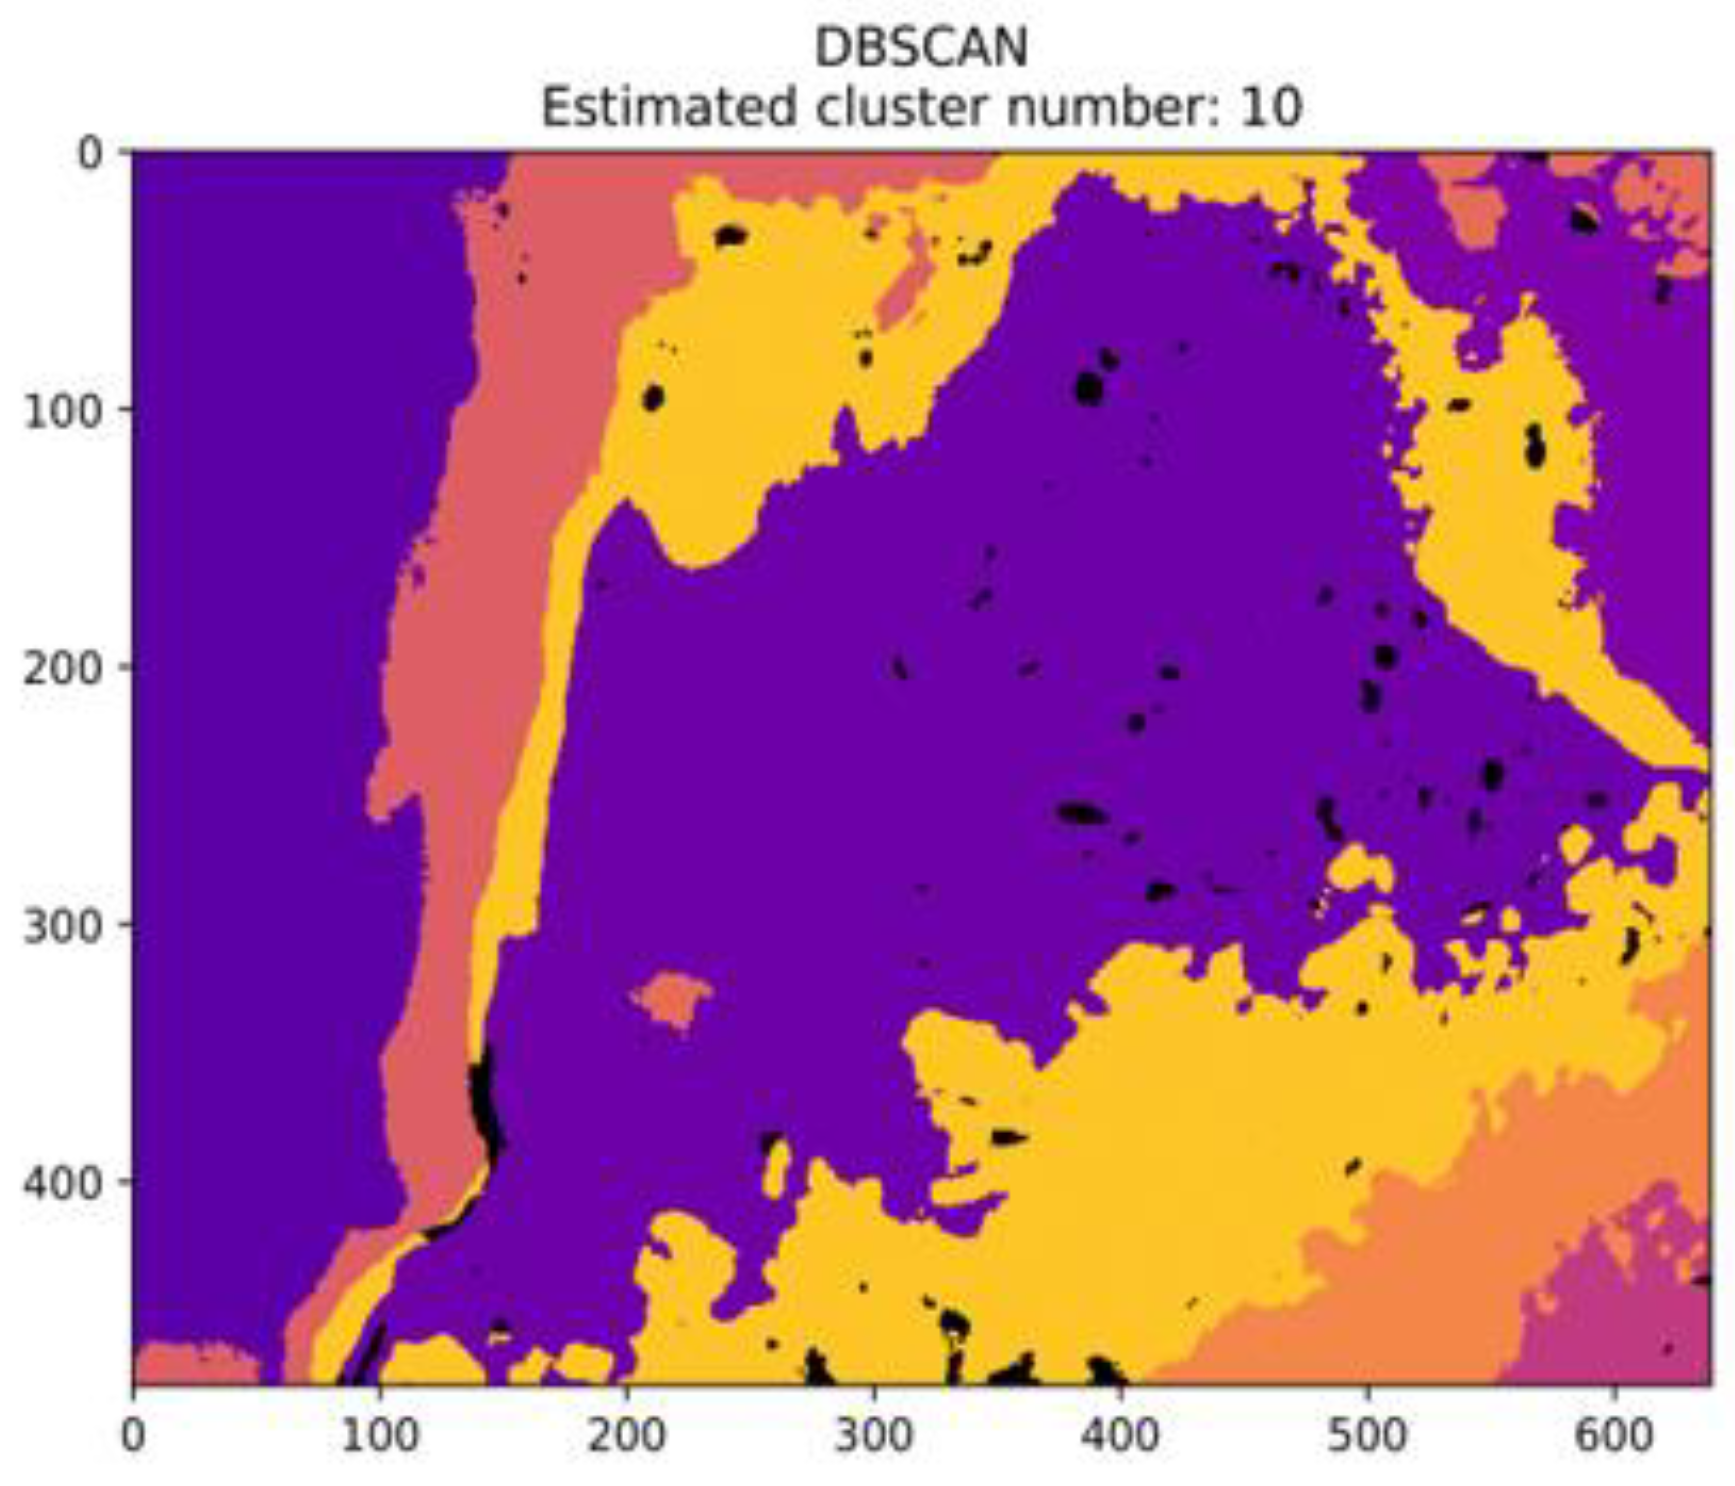
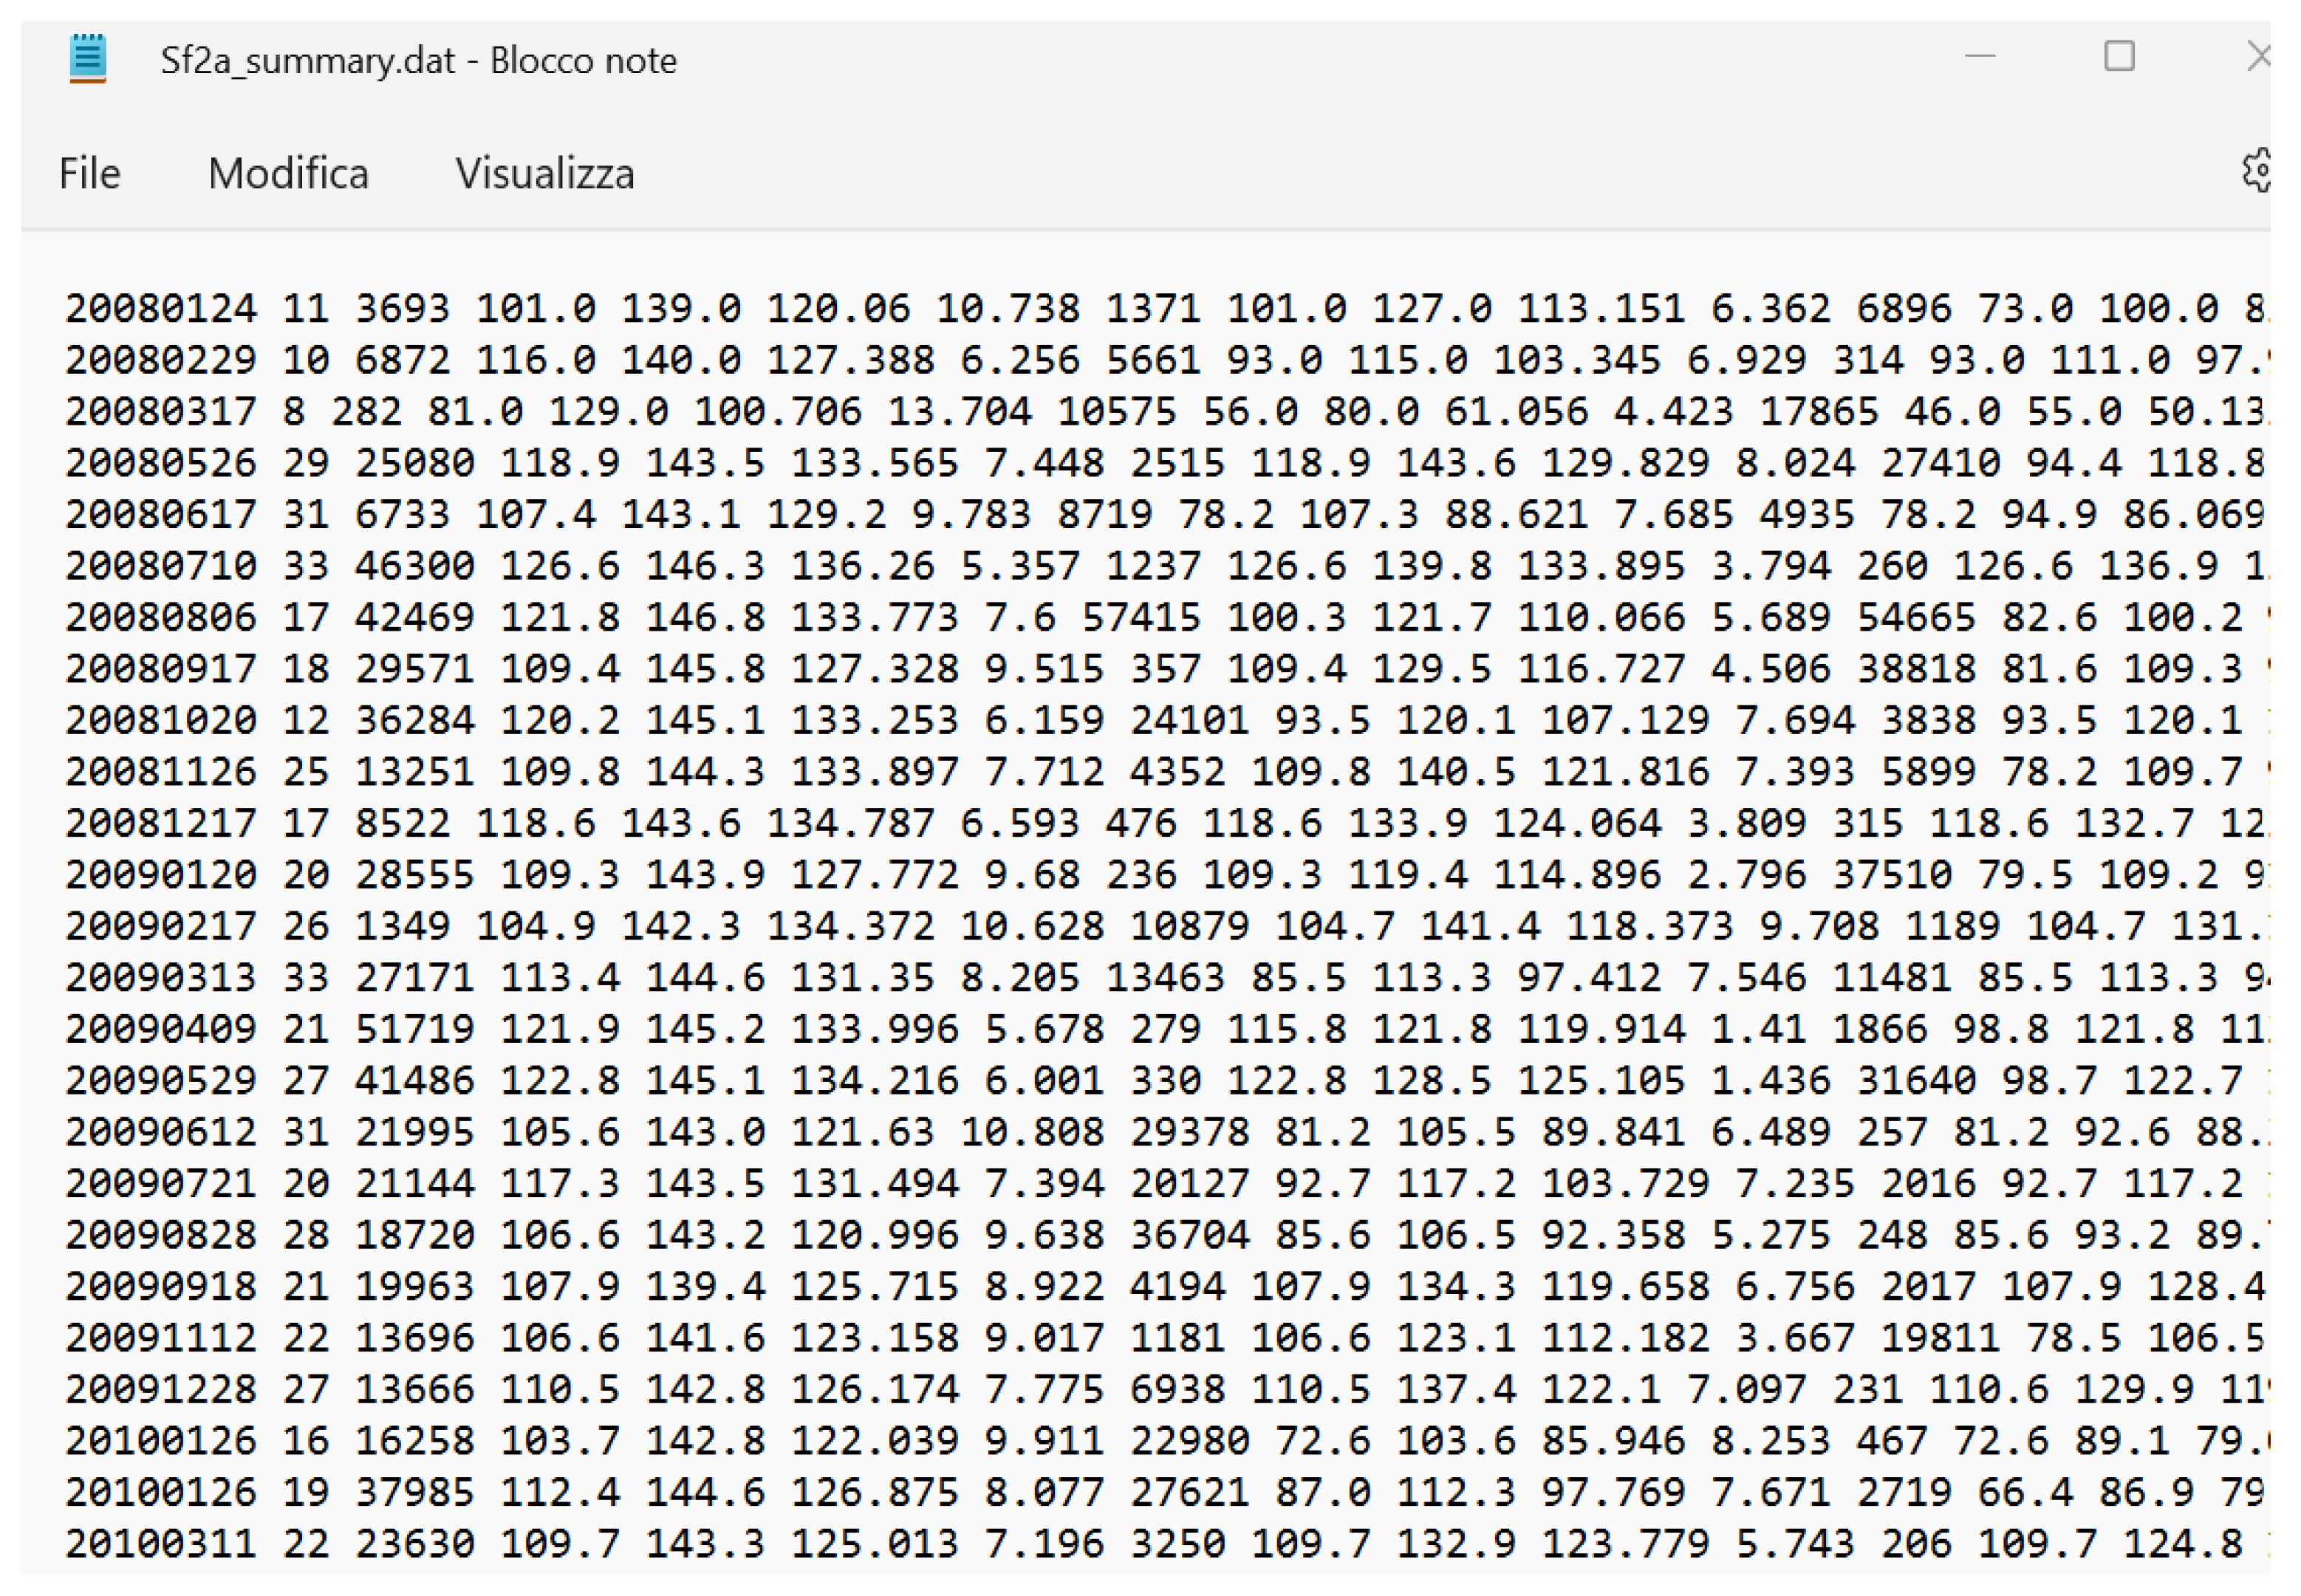
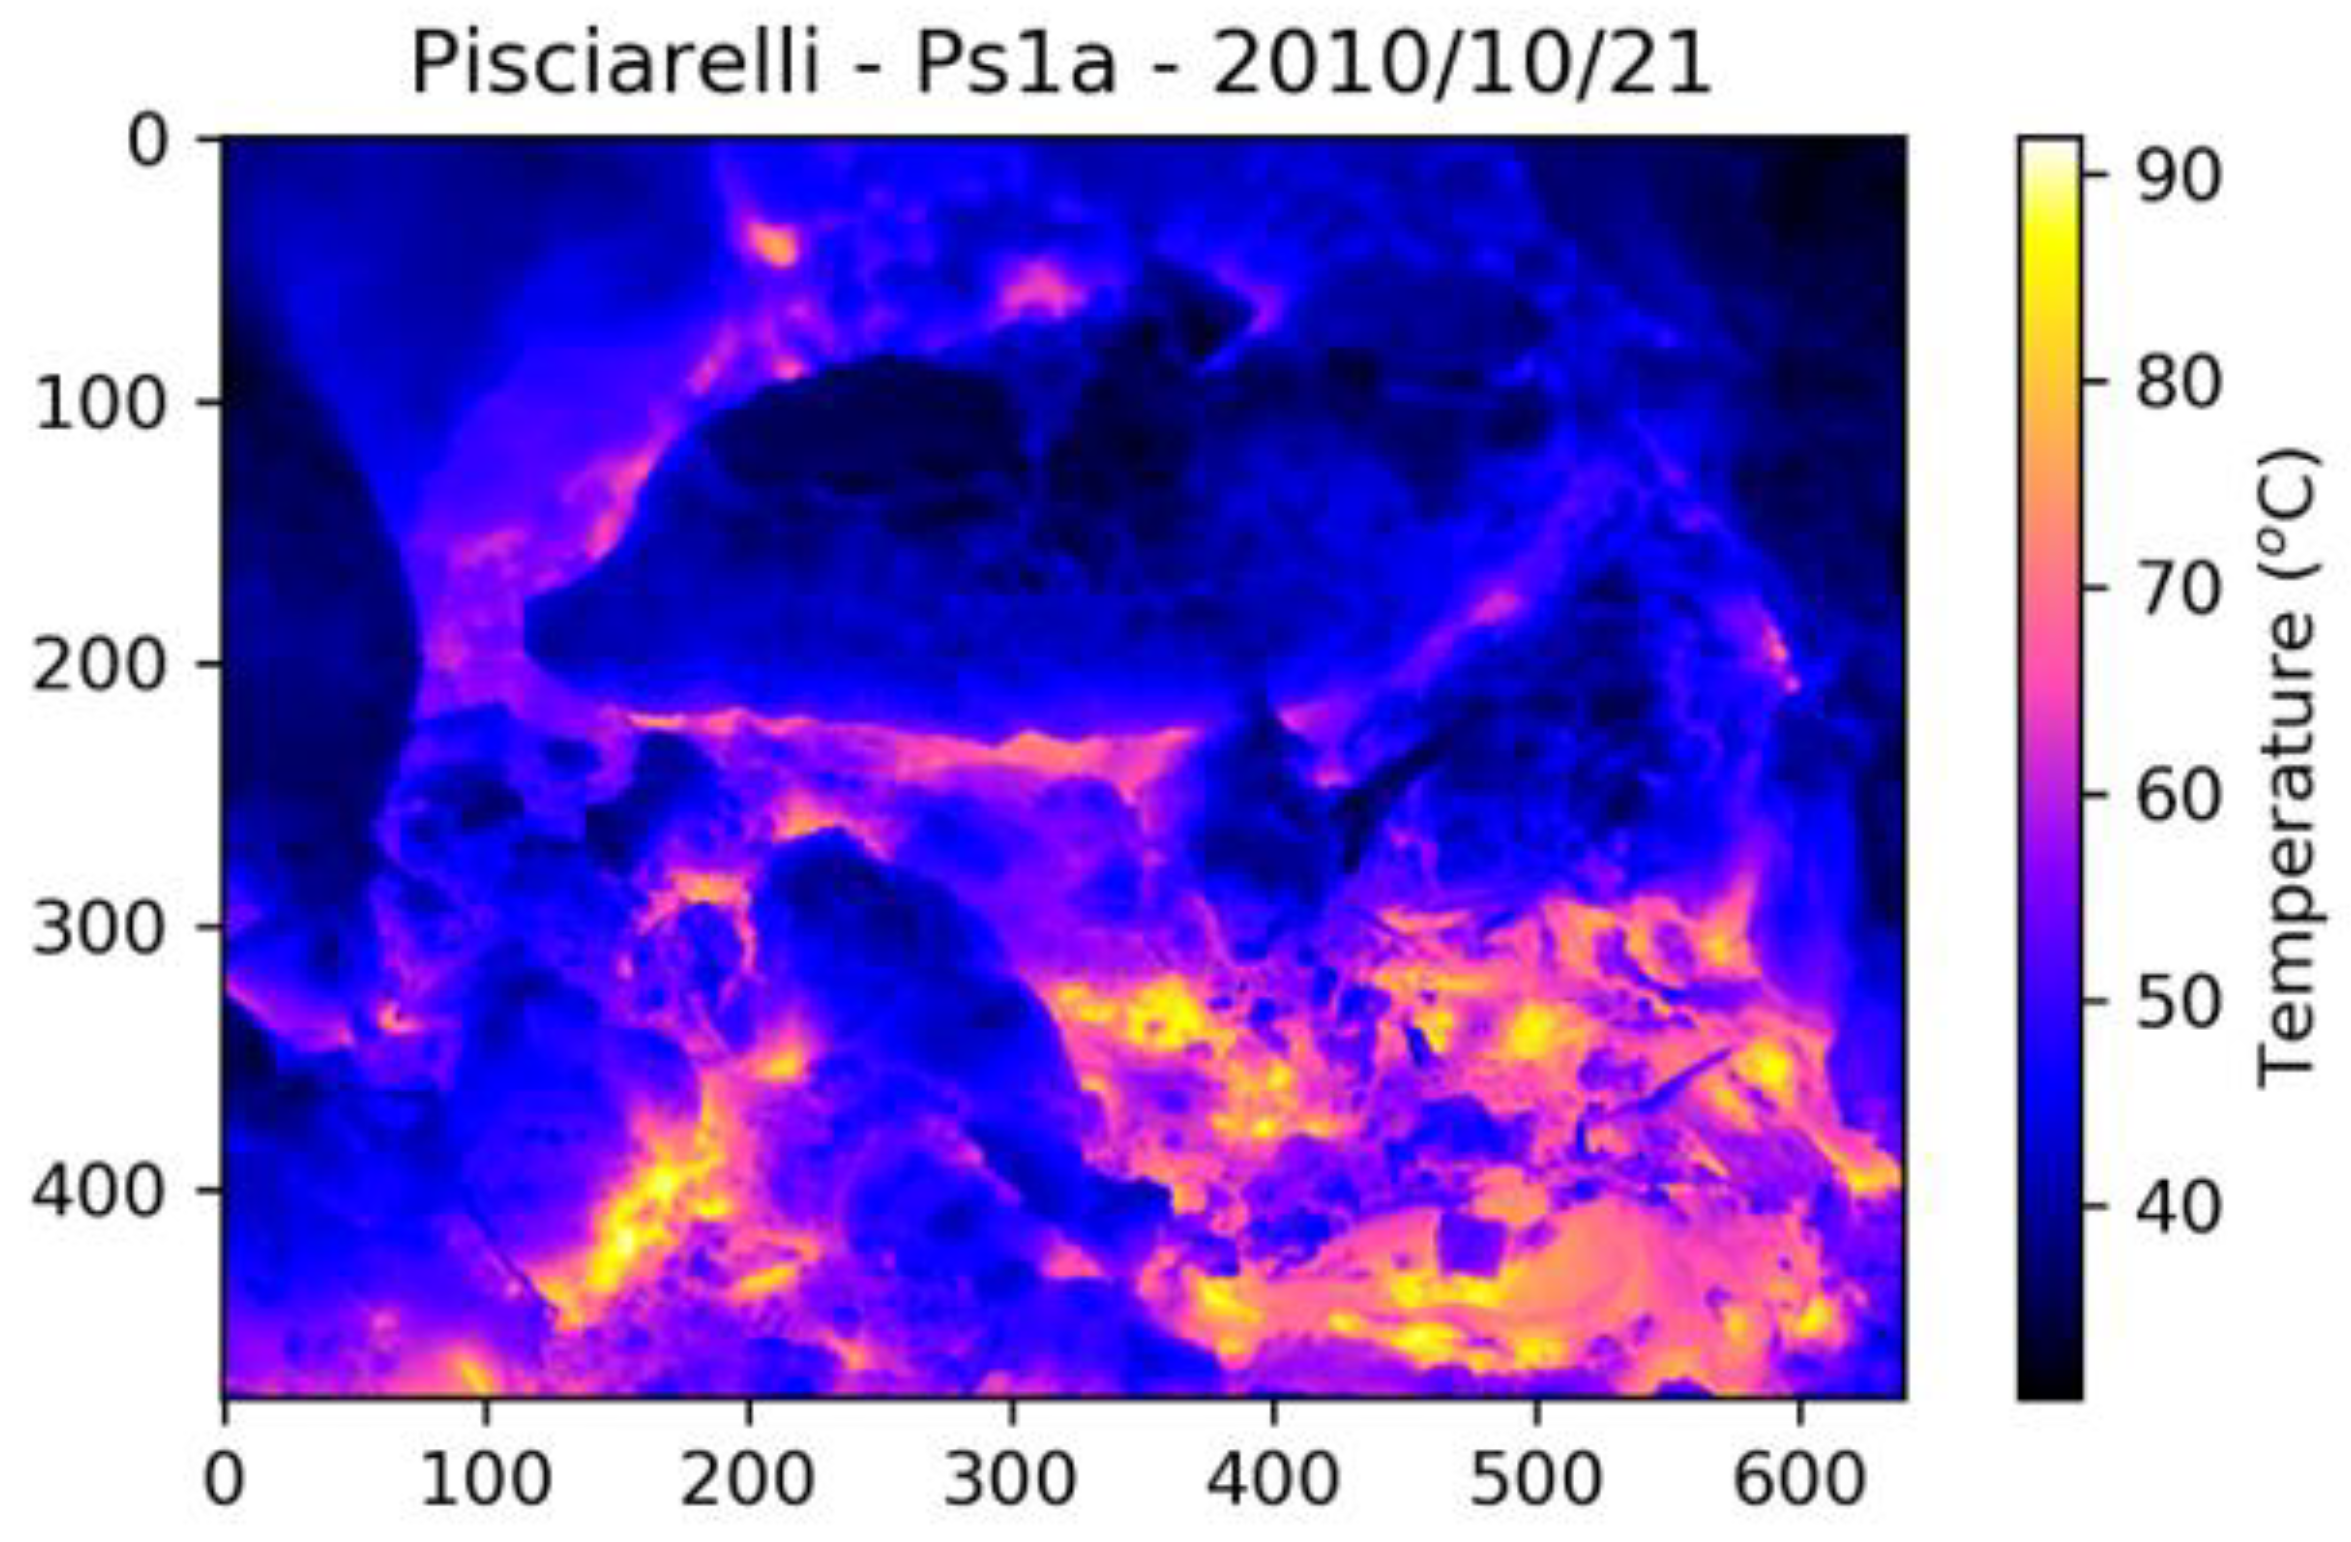
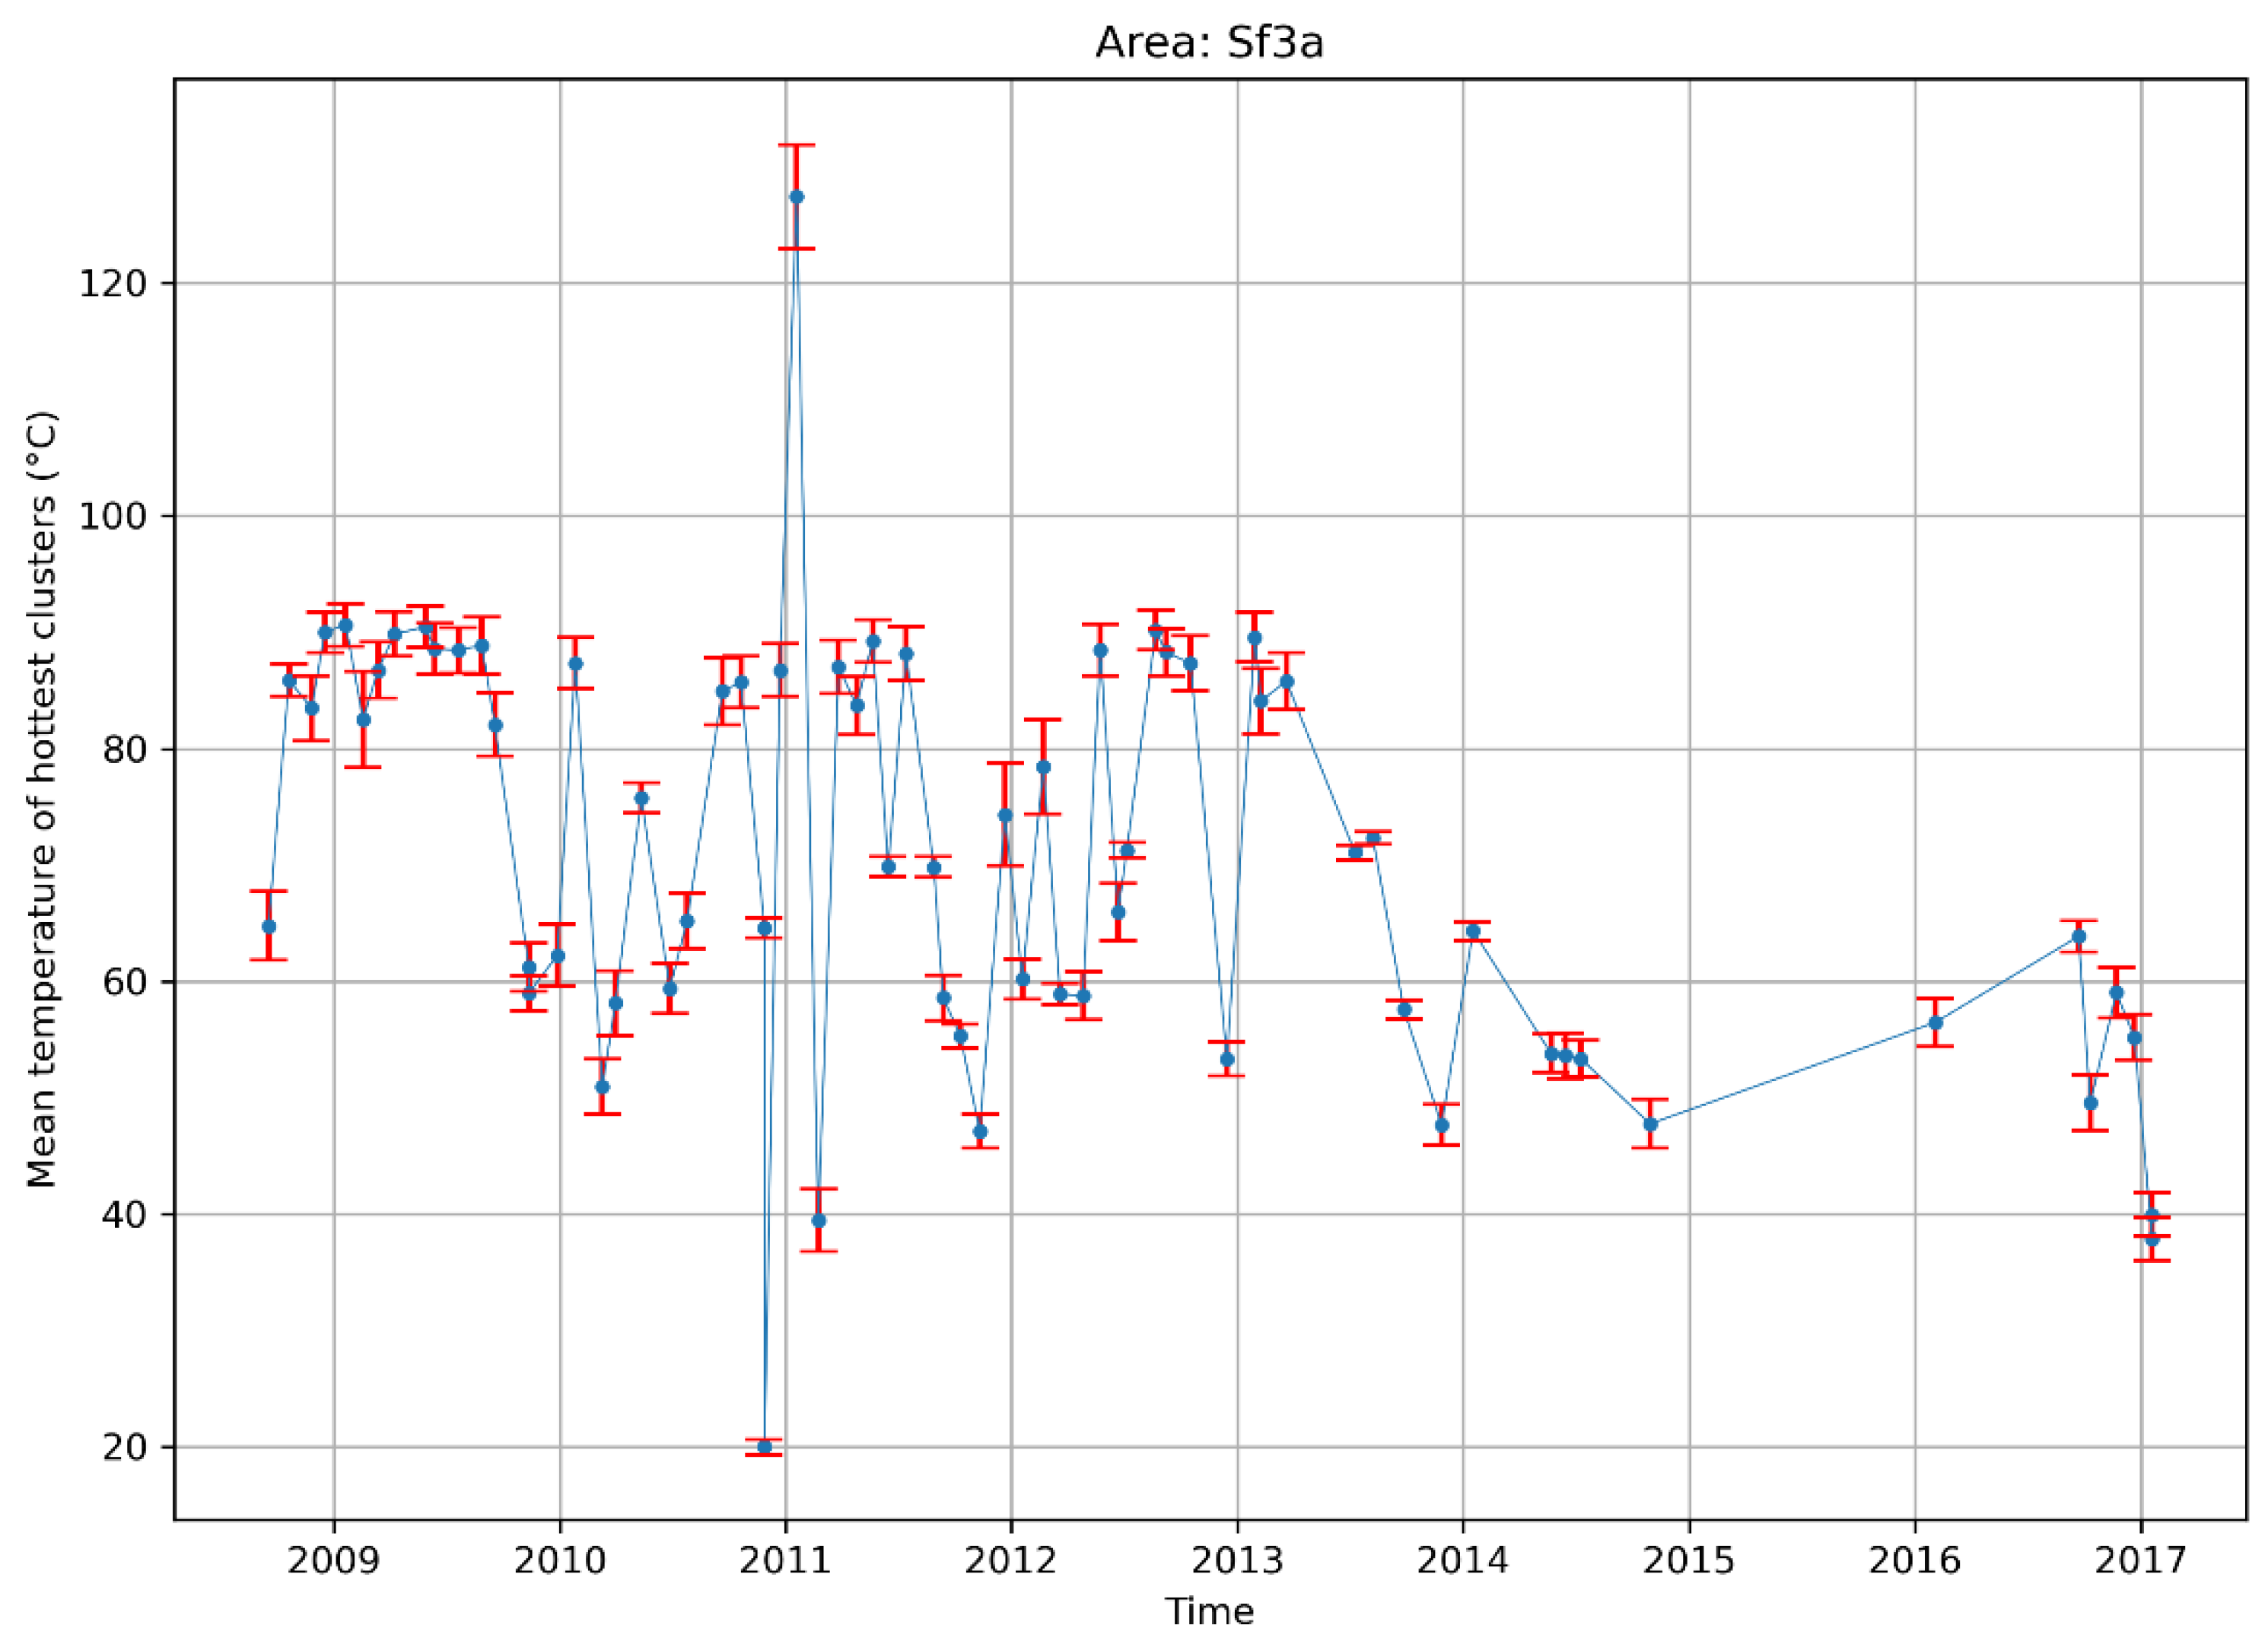
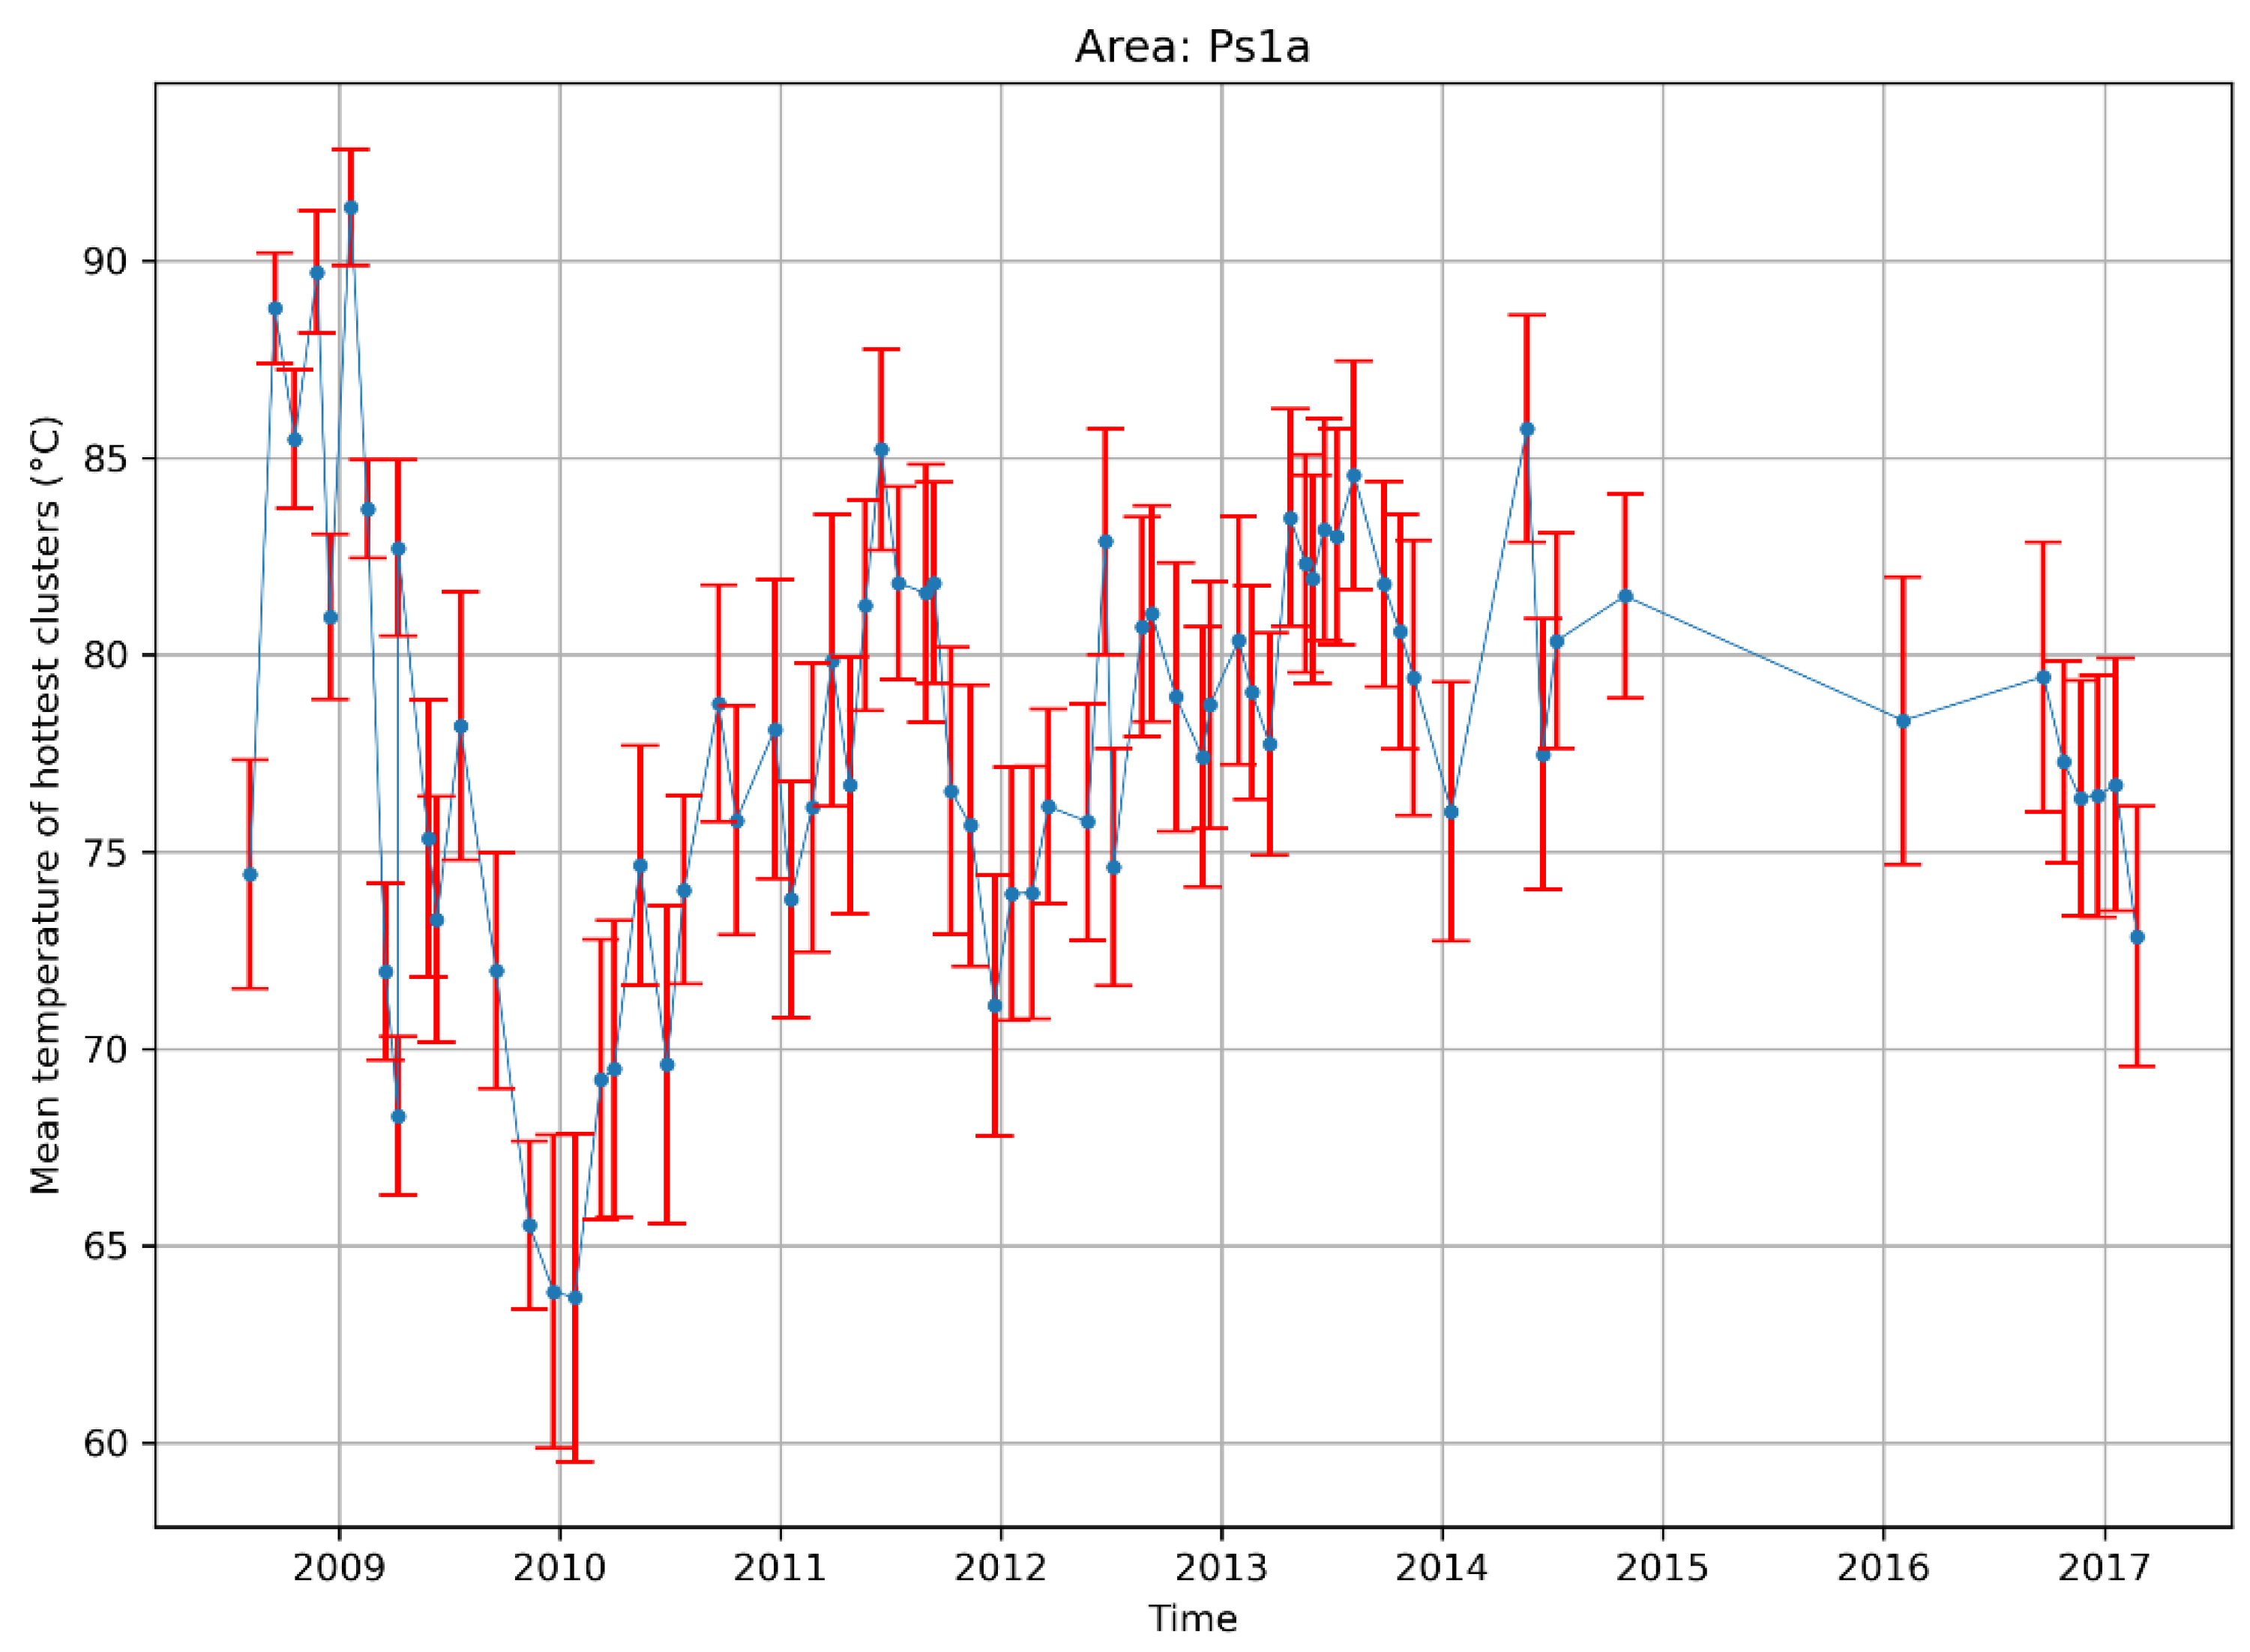
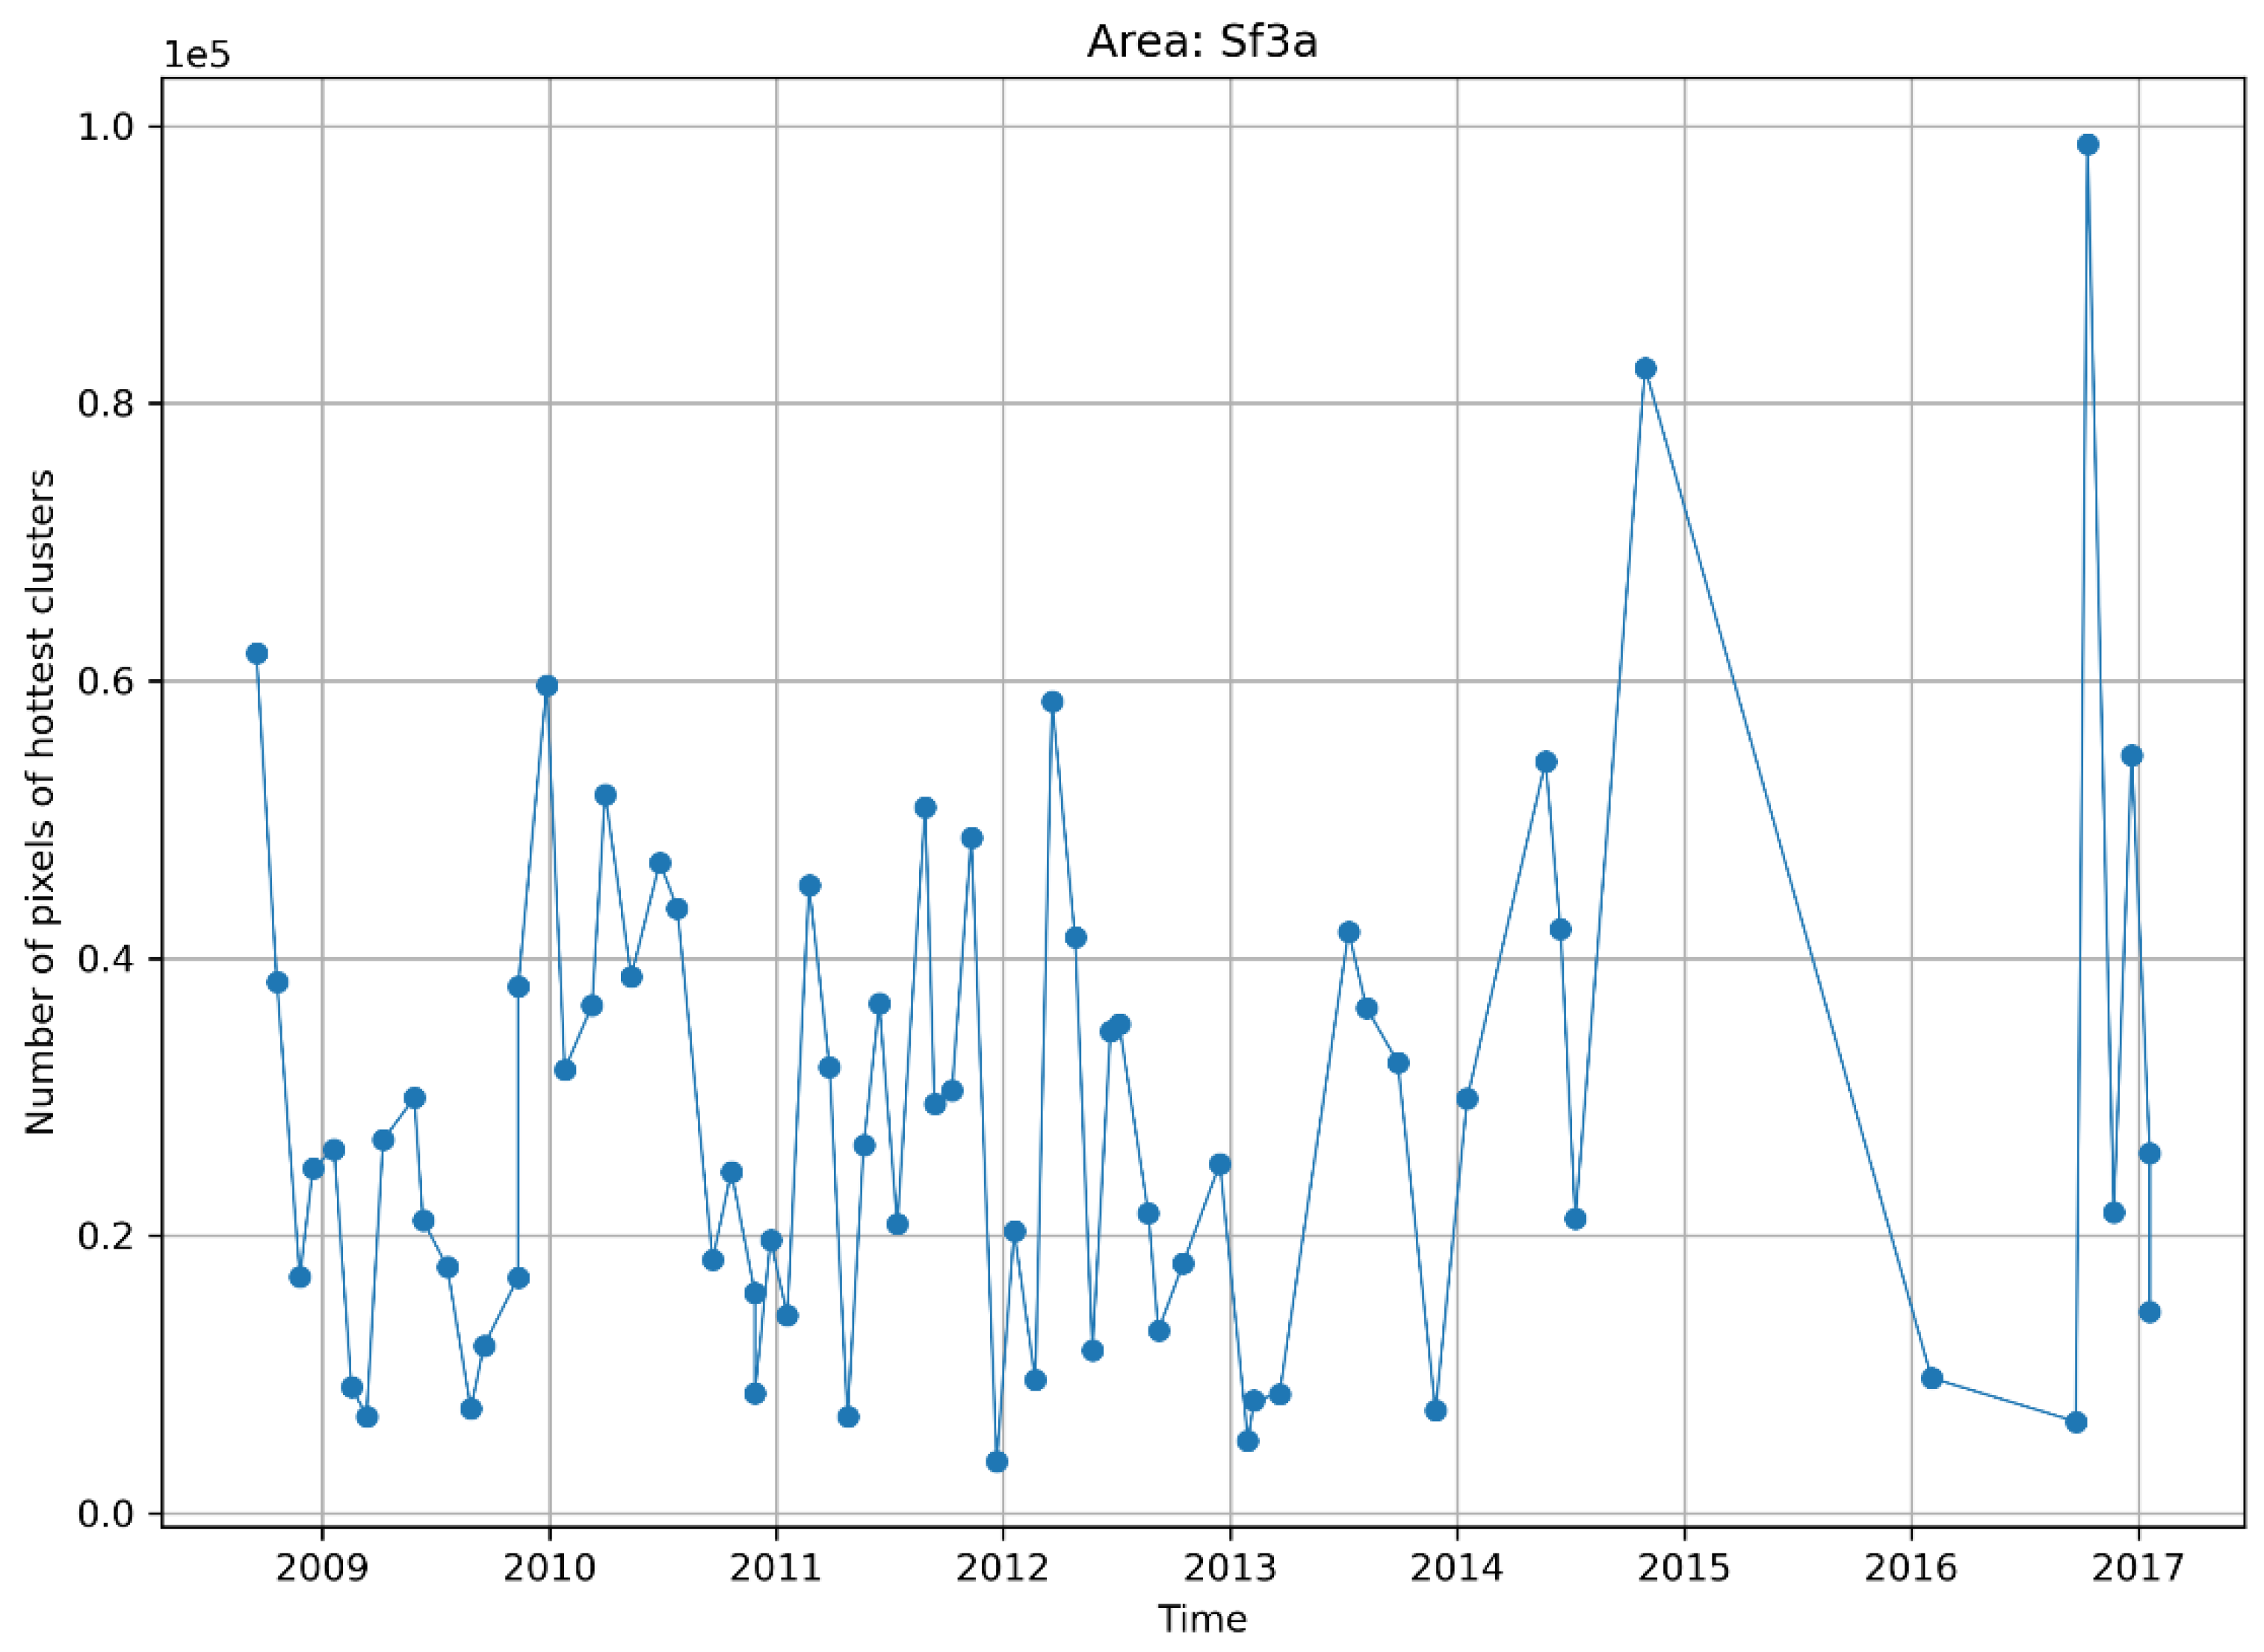
The described analysis method is, as said, very time consuming and, above all, lacks the possibility to analyze all the shot images as only one is selected for the task. We decided, then, to develop something to allow us to rapidly analyze the whole dataset of thermal images that has been accumulating over the years. As a starting point for the development, we selected a subset of the thermal images that had already been converted in the CSV format using the FLIR software and that were shot in the years between 2008 and 2017. In this way, we did not need to bother with the problem of converting the hideous FLIR thermal format into something readable.
Thermal images are made of many “pixels”, each containing an integrated temperature value. The described program has the ability to automate the identification and grouping processes of the pixels that have similar temperatures with subsequent extraction of their parameters. Segmentation and clustering were used as they are powerful methods of data analysis based on the idea of grouping similar elements in a set of data. The idea is then to apply clustering to the thermal images to split them into different regions (clusters) from which information is extracted and statistically analyzed.
The program performs a two-stage analysis of each image: during the first phase the K-MEANS [40,41,42,43] algorithm segments the thermal image in a given number of segments where each pixel has the minimum temperature distance to the center of the segment itself. The obtained segments are then used as the input for the DBSCAN [40,44,45] algorithm, which recognizes the elementary clusters and detects noise for each segment or only the hottest one. Afterward, the software stores all the cluster information in a text file. In this experimental implementation, once the clustering is done, the program processes the statistics and creates output images and graphics.
One or more directories holding a single or multiple CSV files serve as input to the software; the program supports both well-formed (using commas as field separators and dots as decimal separators) and hill-formed “Italian localized” CSV files using semicolons as field separators and commas as decimal separators. The names of the files must contain some extra metadata to identify the area of the image and the time of the shot. In Figure 4, there is shown how part of the temperature matrix that is contained in the CSV file appears (Figure 4).
Once the temperature matrix of the thermal image is loaded, the segmentation process takes place using a library within the OpenCV package (there is a similar routine in the scikit package that has proven to give the exact same result: its use has been implemented in a subsequent version of the program); a function of the mentioned library uses the K-MEANS [40,41,42,43] clustering technique that segments the image by executing an iterative algorithm until it reaches convergence: it separates the temperature distribution of the image in a given number of subintervals (segments) minimizing the difference between each point and the center of the interval itself. It is especially important to properly select the K parameter during this initial phase because it specifies the number of zones to return, or rather in how many regions the image has to be split (Figure 5).
The default setting is to separate the image into five segments, but the user can override the value of the parameter K. A higher value of K gives a greater precision in segment detection, requesting on the other hand a greater processing time while a lower value will give lower processing time and lower precision.
The segmentation phase splits the image into different areas, a sort of “macro-cluster” (segments) that needs yet another division process to find even multiple separated hot areas within the hot cluster: the final goal is to achieve clusters that are not linked between them. A second separation is then required to split eventual nonconnected areas that may be present in a segment (Figure 6).
The second step entails passing the hot segment detected via image segmentation to a function that applies DBSCAN clustering techniques (Figure 7). DBSCAN works by grouping together a number of “pieces” of a set when some “distance” between them is under a given threshold. In our case, the pieces of the set are the pixels of the thermal image (at least those contained in the hot segment) and, as distance, we used a simple Euclidean distance in the 3D space made by their Px and Py positions and their temperatures.
The DBSCAN algorithm is hence strongly dependent on a couple of parameters. ε is the most important one: it specifies the maximum distance between two pixels so that one can be considered close to the other (and belonging to the same cluster). If not set, the program will assume 20 as a default value. MinSamples specifies the number of pixels neighboring a point that will be considered a center point (if not specified the program will assume default value of 200).
When classifying the points inside a cluster, DBSCAN checks that a point has enough other adjacent points in a specified range. The points that do not satisfy the criteria to be included in a cluster (for example if a point does not have enough adjacent ones in a specified radius to be considered part of a cluster) are accounted as noise, hence ignored (it gets labeled as cluster −1).
The number and mean temperatures of the noise clusters may be reported in a separate file for each thermal image to avoid forgetting important features of the image that may get lost in the process. Anyway, we have developed a very simple algorithm to “recover” noise pixels as they occur. During the development of the STARTED (Supplementary Materials) program we also implemented another one focused on the analysis of larger thermal images obtained by drone flights. In such case, losing noise pixels may be a big issue as a single pixel may contain information for large areas. This algorithm simply calculates the “distance” (in the same Euclidean fashion seen before) between the noise pixels and all the identified clusters and then assigning them to the “nearest” cluster. This algorithm is not yet included in the current version of STARTED, but it can be very easily added to the workflow of the program. It is worth noting that, in any case, the occurrence of noise pixels can be completely avoided with a correct choice of the algorithm parameters.
An example of cluster identification is shown in Figure 7: here the segments identified in Figure 6 have been clusterized and each cluster is represented via a random color. Black dots represent noise pixels.
Once clusters are identified in the hot segment, four parameters are extracted or calculated for each of them: Tmin and Tmax (minimum and maximum temperature of the cluster) and Tmed with σTmed (average temperature with its standard deviation). This information is saved in a text file at the end of the process. The name of the file is created with an abbreviation of the name of the area where the images were taken: this abbreviation was in fact contained in the name of the input CSV files to easily identify them; each of these files contain a row for each clusterized image in the area (Figure 8). Cluster information are saved in the one row per input file with the following syntax:
YYYYMMDD NC [NP1 T1min T1max T1med σT1med] [NP2 T2min T2max T2med σT2med] [……]
where the format is as follows: YYYYMMDD is the date of the image acquisition (obtained from the input file name, by now) and NC is the number of clusters identified in the hot segment. For each of the clusters, the quintuplet NPn, Tnmin, Tnmax, Tnmed and σTnmed is stored in the following columns where NPn is the number of pixels of the nth cluster and the other are the four temperature parameters of said cluster described before. The clusters are listed in descending average temperature in each row.
The creation of these files may be considered the main output of the program: further statistical analysis may be deferred to more dedicated tools. In any case, as a bonus action, after detecting the clusters and saving the information of the hot clusters for each image, the software may process overall statistics to create some simple graphic showing the variation of some of the identified parameters over time.

3. Results

The program has been tested over a subset of 1103 CSV files extracted from the main thermal dataset of the TTM group. We have taken a single image for each campaign on the 31 stations in the period from July 2008 to December 2017. Here we present the results as time series of the weighted average temperatures of the first three hot clusters of two of the measurement stations: Sf3a at La Solfatara crater and Ps1a in the Pisciarelli area. An example of the thermal image appearance of these two stations has been provided in Figure 9 and Figure 10. Figure 11 and Figure 12 represent the time series of temperature averages of these two areas, while Figure 13 and Figure 14 represent the trend of the size in pixels of the three hottest clusters in the same measurement stations.
The program has been tested on a Dell workstation Precision 7820 with 32GB of RAM and a double Xeon Bronze 3106 CPU at 1.7GHz running Debian GNU/Linux 10.12 (codename “Buster”). The Python interpreter was the default 3.7.3 version shipped with Debian 10, and all the used libraries (Sklearn, OpenCV and Matplotlib) were the default ones installed with the operating system. Depending on the load of the machine, the program required from 2 to 4 h to load and analyze the 1103 CSV files of the test dataset and write the results. In all these tests, the program was instructed to also output images of the intermediate segmentation and clustering stages seen, for example, in Figure 4, Figure 6 and Figure 7. All the images and graphics were created using the standard matplotlib library of the Python interpreter.

4. Discussion and Conclusions

Portions having consistent temperatures are typical across thermal images of volcanic areas; out of these portions, parameters must be extracted and used for studying and characterizing thermally active volcanic features and detecting thermal changes in volcanic areas. These changes could be precursors of volcanic unrest and could be useful to forecast volcanic eruptions. FLIR “ThermaCAM Researcher Pro 2.10” software is usually used to extract data and it requires extensive manual analysis of the single images at great expense of time and work.
To solve this problem, a program has been developed to automate the identification and the grouping of pixels with similar temperatures values in a thermal image. It extracts parameters that speed up and ease the entire process of forecasting volcanic eruptions. In a nutshell, this program allows a user to automatically cluster large datasets of thermal images and, based on the information extracted, it processes statistics on the trends of temperatures and cluster sizes.
Open-source Python libraries have been used to develop the program. Specifically, K-MEANS is used to segment the image and, afterward, DBSCAN is used to recognize the elementary clusters and the noise pixels. Finally, the program saves the information of all the clusters (maximum and minimum temperature, average temperature of the cluster with its standard deviation) in a text file. Once the clustering is done, the desired statistics are processed.
The program has been developed mostly having in mind the specific task of the analysis of handheld thermal camera images. First runs over a subset of the image database has proven a nice identification of high temperature areas and their separation from the background “cool” pixels. It is quite simple to use and modify to address specific issues in other fields requiring thermal images analysis, as for example environmental pollution or building thermal check-ups.
Currently, its main limit is that it has to be fed with CSV matrices manually obtained from the FLIR thermal images. We are already planning, as the main improvement for the software, to implement the direct loading of thermal data from FLIR images using open-source libraries. Unfortunately, this may actually only be achieved using external Perl libraries (ExifTools, in particular) that are not yet available in Python. Once this improvement is implemented, it will be possible to analyze the whole thermal dataset in a single pass, gathering information directly from the data source, and to easily obtain statistically significant data when performing new thermal campaigns. We also plan to analyze all the images shot during a given campaign for a given station and not only the “best” one as done here. Another important modification to the current implementation will be borrowed by another program we are implementing for the analysis of larger thermal images obtained by drones: it will allow the program to “recover” possibly occurring noise pixels by stitching them to the “nearest” cluster (near in space and temperature).
Anyway, to make effective use of these enhancements we must rearrange the whole dataset in a way to easily access the correct metadata (shot area, above all: date and hour are contained inside the EXIF metadata of the FLIR image) of the raw thermal image. We are confident that we can obtain a modified version of the program with the dataset correctly metadated during the next year.

Supplementary Materials

The software STARTED (StaTistical Analysis clusteRed ThErmal Data) and the images analyzed can be found on open-access repository Zenodo. https://zenodo.org/record/5886707#.YuXahBxBzIU.

Author Contributions

Conceptualization, E.M. and G.A.; methodology and software, R.P and F.C.; validation, all authors; resources and data curation E.M., G.A., P.B.; writing—original draft preparation, F.C.; writing—review and editing, R.A.P., F.C.; supervision, R.P.; project coordination, E.M. All authors have read and agreed to the published version of the manuscript.

Funding

This research received no external funding.

Data Availability Statement

The software STARTED (StaTistical Analysis clusteRed ThErmal Data) and the images analyzed can be found on open-access repository Zenodo. https://zenodo.org/record/5886707#.YuXahBxBzIU (accessed on 3 August 2022).

Acknowledgments

Thanks to DIEM (Dipartimento di Ingegneria dell’Informazione ed Elettrica e Matematica Applicata) Università degli Studi di Salerno for their collaboration.

Conflicts of Interest

The authors declare no conflict of interest.

References

  1. Calvari, S.; Lodato, L.; Spampinato, L. Monitoring Active Volcanoes Using a Handheld Thermal Camera. In Thermosense XXVI: Proceedings of SPIE; Burleigh, D.D., Cramer, K.E., Peacock, G.R., Eds.; SPIE: Orlando, FL, USA, 2004; Volume 5405, pp. 199–209. [Google Scholar]
  2. Calvari, S.; Spampinato, L.; Lodato, L.; Harris, A.J.L.; Patrick, M.R.; Dehn, J.; Burton, M.R.; Andronico, D. Chronology and complex volcanic processes during the 2002–2003 flank eruption at Stromboli volcano (Italy) reconstructed from direct observations and surveys with a handheld thermal camera. J. Geophys. Res. Solid Earth. 2005, 110, B02201. [Google Scholar] [CrossRef] [Green Version]
  3. Calvari, S.; Spampinato, L.; Lodato, L. The 5 April 2003 vulcanian paroxysmal explosion at Stromboli volcano (Italy) from field observations and thermal data. J. Volcanol. Geotherm. Res. 2006, 149, 160–175. [Google Scholar] [CrossRef]
  4. Calvari, S.; Lodato, L.; Steffke, A.; Cristaldi, A.; Harris, A.J.L.; Spampinato, L.; Boschi, E. The 2007 Stromboli flank eruption: Chronology of the events, and effusion rate measurements from thermal images and satellite data. J. Geophys. Res. Solid Earth 2010, 115, B04201. [Google Scholar] [CrossRef] [Green Version]
  5. Caputo, T.; Bellucci Sessa, E.; Silvestri, M.; Buongiorno, M.F.; Musacchio, M.; Sansivero, F.; Vilardo, G. Surface Temperature Multiscale Monitoring by Thermal Infrared Satellite and Ground Images at Campi Flegrei Volcanic Area (Italy). Remote Sens. 2019, 11, 1007. [Google Scholar] [CrossRef] [Green Version]
  6. Caputo, T.; Cusano, P.; Petrosino, S.; Sansivero, F.; Vilardo, G. Spectral analysis of ground thermal image temperatures: What we are learning at Solfatara volcano (Italy). Adv. Geosci. 2020, 52, 55–65. [Google Scholar] [CrossRef]
  7. Chio, S.H.; Lin, C.H. Preliminary Study of UAS Equipped with Thermal Camera for Volcanic Geothermal Monitoring in Taiwan. Sensors 2017, 17, 1649. [Google Scholar] [CrossRef] [Green Version]
  8. Ganci, G.; Vicari, A.; Fortuna, L.; Del Negro, C. The HOTSAT volcano monitoring system based on a combined use of SEVIRI and MODIS multispectral data. Ann. Geophys. 2011, 54, 5. [Google Scholar] [CrossRef]
  9. Harris, A.J.L.; Maciejewski, A.J.H. Thermal surveys of the Vulcano Fossa fumarole field 1994–1999: Evidence for fumarole migration and sealing. J. Volcanol. Geotherm. Res. 2000, 102, 119–147. [Google Scholar] [CrossRef]
  10. Harris, A.; Pirie, D.; Horton, K.; Garbeil, H.; Pilger, E.; Ramm, H.; Hoblitt, R.; Thornber, C.; Ripepe, M.; Marchetti, E.; et al. DUCKS: Low cost thermal monitoring units for near-vent deployment. J. Volcanol. Geotherm. Res. 2005, 143, 335–360. [Google Scholar] [CrossRef]
  11. Harris, A.J.L.; Lodato, L.; Dehn, J.; Spampinato, L. Thermal characterization of the Vulcano fumarole field. Bull. Volcanol. 2009, 71, 441–458. [Google Scholar] [CrossRef]
  12. Lombardo, V.; Buongiorno, M.F. Lava flow thermal analysis using three infrared bands of remote-sensing imagery: A study case from Mount Etna 2001 eruption. Remote Sens. Environ. 2006, 101, 141–149. [Google Scholar] [CrossRef]
  13. Marotta, E.; Calvari, S.; Cristaldi, A.; D’Auria, L.; Di Vito, M.A.; Moretti, R.; Peluso, R.; Spampinato, L.; Boschi, E. Reactivation of Stromboli’s summit craters at the end of the 2007 effusive eruption detected by thermal surveys and seismicity. J. Geophys. Res. Solid Earth 2015, 120, 7376–7395. [Google Scholar] [CrossRef]
  14. Marotta, E.; Peluso, R.; Avino, R.; Belviso, P.; Caliro, S.; Carandente, A.; Chiodini, G.; Macedonio, G.; Avvisati, G.; Marfè, B. Thermal Energy Release Measurement with Thermal Camera: The Case of La Solfatara volcano (Italy). Remote Sens. 2019, 11, 167. [Google Scholar] [CrossRef] [Green Version]
  15. Oppenheimer, C. Lava flow cooling estimated from Landsat thematic mapper infrared data: The Lonquimay Eruption (Chile, 1989). J. Geophys. Res. Solid Earth 1991, 96, 21865–21878. [Google Scholar] [CrossRef]
  16. Oppenheimer, C.; Yirgu, G. Thermal imaging of an active lava lake: Erta ‘Ale volcano, Ethiopia. Int. J. Remote Sens. 2001, 23, 4777–4782. [Google Scholar] [CrossRef]
  17. Pinkerton, H.; James, M.; Jones, A. Surface temperature measurements of active lava flows on Kīlauea volcano, Hawaii. J. Volcanol. Geotherm. Res. 2002, 113, 159–176. [Google Scholar] [CrossRef] [Green Version]
  18. Sansivero, F.; Scarpato, G.; Vilardo, G. The automated infrared thermal imaging system for the continuous long-term monitoring of the surface temperature of the Vesuvius crater. Ann. Geophys. 2013, 56, 4. [Google Scholar] [CrossRef]
  19. Sansivero, F.; Vilardo, G. Processing Thermal Infrared Imagery Time-Series from Volcano Permanent Ground-Based Monitoring Network. Latest Methodological Improvements to Characterize Surface Temperatures Behavior of Thermal Anomaly Areas. Remote Sens. 2019, 11, 553. [Google Scholar] [CrossRef] [Green Version]
  20. Sawyer, G.M.; Burton, M.R. Effects of a volcanic plume on thermal imaging data. Geophys. Res. Lett. 2006, 33, L14311. [Google Scholar] [CrossRef]
  21. Silvestri, M.; Marotta, E.; Buongiorno, M.F.; Avvisati, G.; Belviso, P.; Bellucci Sessa, E.; Caputo, T.; Longo, V.; De Leo, V.; Teggi, S. Monitoring of Surface Temperature on Parco delle Biancane (Italian Geothermal Area) Using Optical Satellite Data, UAV and Field Campaigns. Remote Sens. 2020, 12, 2018. [Google Scholar] [CrossRef]
  22. Silvestri, M.; Romaniello, V.; Hook, S.; Musacchio, M.; Teggi, S.; Buongiorno, M.F. First Comparisons of Surface Temperature Estimations between ECOSTRESS, ASTER and Landsat 8 over Italian Volcanic and Geothermal Areas. Remote Sens. 2020, 12, 184. [Google Scholar] [CrossRef] [Green Version]
  23. Spampinato, L.; Calvari, S.; Oppenheimer, C.; Lodato, L. Shallow magma transport for the 2002–03 Mt. Etna eruption inferred from thermal infrared surveys. J. Volcanol. Geotherm. Res. 2008, 177, 301–312. [Google Scholar] [CrossRef]
  24. Spanpinato, L.; Calvari, S.; Oppenheimer, C.; Boschi, E. Volcano surveillance using infrared cameras. Earth-Sci. Rev. 2011, 106, 63–91. [Google Scholar] [CrossRef]
  25. Stevenson, J.A.; Varley, N. Fumarole monitoring with a handheld infrared camera: Volcàn de Colima, Mexico, 2006–2007. J. Volc. Geoth. Res. 2008, 177, 911–924. [Google Scholar] [CrossRef]
  26. Tibaldi, A.; Corti, N.; De Beni, E.; Luca Bonali, F.; Falsaperla, S.; Langer, H.; Neri, M.; Cantarero, M.; Reitane, D.; Fallati, L. Mapping and evaluating kinematics and the stress and strain field at active faults and fissures: A comparison between field and drone data at the NE rift, Mt Etna (Italy). Solid Earth 2021, 12, 801–816. [Google Scholar] [CrossRef]
  27. Vicari, A.; Ciraudo, A.; Del Negro, C.; Hérault, A.; For-tuna, L. Lava flow simulations using discharge ratesfrom thermal infrared satellite imagery during the 2006 Etna eruption. Nat. Hazards 2009, 50, 539–550. [Google Scholar] [CrossRef]
  28. Vilardo, G.; Sansivero, F.; Chiodini, G. Long-term TIR imagery processing for spatiotemporal monitoring of surface thermal features in volcanic environment: A case study in the Campi Flegrei (Southern Italy). J. Geophys. Res. Solid Earth 2015, 120, 812–826. [Google Scholar] [CrossRef]
  29. Zanon, V.; Neri, M.; Pecora, E. Interpretation of data from the monitoring thermal camera of Stromboli volcano (Aeolian Islands, Italy). Geol. Mag. 2009, 146, 591–601. [Google Scholar] [CrossRef]
  30. Aquino, I.; Augusti, V.; Avino, R.; Bagnato, E.; Bellomo, S.; Bellucci Sessa, E.; Belviso, P.; Benincasa, A.; Berrino, G.; Borgstrom, S.; et al. Il Monitoraggio dei Vulcani Campani—Primo Semestre 2019. Earth-Prints 2021. Available online: http://hdl.handle.net/2122/14589 (accessed on 3 August 2022).
  31. Aquino, I.; Augusti, V.; Avino, R.; Bagnato, E.; Bellomo, S.; Bellucci Sessa, E.; Belviso, P.; Benincasa, A.; Berrino, G.; Borgstrom, S.; et al. Il Monitoraggio dei Vulcani Campani—Secondo Semestre 2019. Earth-Prints 2021. Available online: http://hdl.handle.net/2122/14820 (accessed on 3 August 2022).
  32. Peluso, R.; Scarpato, G.; Augusti, V.; Benincasa, A.; Borriello, G.; Cirillo, F.; D’Alessandro, A.; De Cesare, W.; Di Filippo, A.; Martino, C.; et al. Il sistema di acquisizione dati e la sala di monitoraggio. In Il Monitoraggio dei Vulcani Campani—Primo semestre 2020; Castellano, F.B.eM., Ed.; Earth-Prints 2022; pp. 5–8. Available online: http://hdl.handle.net/2122/15424 (accessed on 3 August 2022).
  33. Marotta, E.; Belviso, P.; Carandente, A.; Nave, R.; Peluso, R. Monitoraggio Termico con Termocamera Mobile e Termocoppia. In Il Monitoraggio dei Vulcani Campani—Primo Semestre 2020; Castellano, F.B.eM., Ed.; Earth-Prints 2022; pp. 30–32, 73–77, 110–115. Available online: http://hdl.handle.net/2122/15424 (accessed on 3 August 2022).
  34. Thermal Camera. Available online: https://www.imveurope.com/press-releases/thermacam-researcher-v210 (accessed on 3 August 2022).
  35. Gaudin, D.; Taddeucci, J.; Scarlato, P.; Harris, A.J.L.; Bombrun, M.; Del Bello, E.; Ricci, T. Characteristics of puffing activity revealed by ground-based, thermal infrared imaging: The example of Stromboli Volcano (Italy). Bull. Volcanol. 2017, 79, 24. [Google Scholar] [CrossRef]
  36. Calusi, B.; Andronico, D.; Pecora, E.; Biale, E.; Cerminara, M. PyTirCam-1.0: A Python Model to Manage Thermal Infrared Camera Data. Remote Sens. 2020, 12, 4056. [Google Scholar] [CrossRef]
  37. Carniel, R.; Guzmán, S.R. Machine Learning in Volcanology: A Review. In Updates in Volcanology—Transdisciplinary Nature of Volcano Science; IntechOpen: London, UK, 2020. [Google Scholar] [CrossRef]
  38. Burzynski, A.M.; Anderson, S.W.; Morrison, K.; Patrick, M.R.; Orr, T.; Thelen, W. Lava lake thermal pattern classification using self-organizing maps and relationships to eruption processes at Kīlauea Volcano, Hawaii. In Field Volcanology: A Tribute to the Distinguished Career of Don Swanson; Special Papers of the Geological Society of America 538; Geological Society of America: Boulder, CO, USA, 2019. [Google Scholar] [CrossRef]
  39. Cirillo, F.; Avvisati, G.; Belviso, P.; Marotta, E.; Peluso, R.; Pescione, R. STARTED (StaTistical Analysis clusteRed ThErmal Data) (SW 1.0.1). Zenodo 2022. [Google Scholar] [CrossRef]
  40. Pedregosa, F.; Varoquaux, G.; Gramfort, A.; Michel, V.; Thirion, B.; Grisel, O.; Blondel, M.; Prettenhofer, P.; Weiss, R.; Dubourg, V.; et al. Scikit-learn: Machine Learning in Python. J. Mach. Learn. Res. 2011, 12, 2825–2830. [Google Scholar]
  41. Xu, J.; Lange, K. Power k-means clustering. In Proceedings of the 36th International Conference on Machine Learning, Long Beach, CA, USA, 9–15 June 2019; Volume 97, pp. 6921–6931. [Google Scholar]
  42. Sinaga, K.P.; Yang, M.-S. Unsupervised K-means clustering algorithm. IEEE Access 2020, 8, 80716–80727. [Google Scholar] [CrossRef]
  43. Peng, D.; Chen, Z.; Fu, J.; Xia, S.; Wen, Q. Fast k-means Clustering Based on the Neighbor Information. In Proceedings of the International Symposium on Electrical, Electronics and Information Engineering, Seoul, Korea, 19–21 February 2021; pp. 551–555. [Google Scholar]
  44. Khan, K.; Rehman, S.U.; Aziz, K.; Fong, S.; Sarasvady, S. DBSCAN: Past, present and future. In Proceedings of the The Fifth International Conference on the Applications of Digital Information and Web Technologies (ICADIWT 2014), Bangalore, India, 17–19 February 2014; pp. 232–238. [Google Scholar]
  45. Kurumalla, S.; Rao, P.S. K-nearest neighbor based dbscan clustering algorithm for image segmentation. J. Theor. Appl. Inf. Technol. 2016, 92, 395. [Google Scholar]
  46. Bellucci Sessa Eliana, Borriello Giuseppe, & Cirillo Francesca. NAPLES (moNitoring mAps of camPania voLcanoES) (1.0) [Data set]. Zenodo 2022. [Google Scholar] [CrossRef]
Figure 2. FLIR “ThermaCAM Researcher Pro 2.10” software [34]. Example of a thermal image and of the extraction of some image parameters. This image was taken from the Pizzone area (Ischia), indicated as “Piz” in Figure 1.
Remotesensing 14 03789 g002
Figure 3. Example of manual processing of thermal parameters at the Pantane (Pan) station of the Island of Ischia (Figure 1). Here the time trend of maximum temperature from thermal image (Ttp), temperature from K thermocouple (Ttc) and air temperature from the thermo-hygrometer (T aria) are shown.
Remotesensing 14 03789 g003
Figure 4. Example of temperature value matrix in a spreadsheet. Here, part of the temperature matrix of a thermal image is displayed: each cell represent the temperature in °C of a single pixel of the image.
Remotesensing 14 03789 g004
Figure 5. Example of a segmented image through K-MEANS (K = 5); the palette on the right side of the image shows the correlation between colors and temperature. Not all the temperature intervals are shown in the image as each segment is represented using its average temperature. The temperatures are in °C. This image was taken from the Vesuvio area indicated as “SV2” in Figure 1.
Remotesensing 14 03789 g005
Figure 6. Example of the previous segmented image where the hot segment is highlighted: it will then further break up using the DBSCAN algorithm. As for Figure 5, not all the intervals of temperature are shown on the image as each segment is represented with its average temperature. Temperatures are in °C.
Remotesensing 14 03789 g006
Figure 7. Clusters after running DBSCAN; each cluster is highlighted with a random color; the black clusters represent noise.
Remotesensing 14 03789 g007
Figure 8. Example of program output: cluster information of an analyzed area. Each row shows the information related to all the hot clusters of an image as described in the text.
Remotesensing 14 03789 g008
Figure 9. Example of thermal image of the station Ps1a at the Pisciarelli area (Campi Flegrei), indicated as “Ps1a” in Figure 1.
Remotesensing 14 03789 g009
Figure 10. Thermal image example taken in La Solfatara crater (Campi Flegrei), indicated as “Sf3a” in Figure 1.
Remotesensing 14 03789 g010
Figure 11. Weighted average temperature trend of the three hottest clusters with their related standard deviation of thermal images taken in La Solfatara crater (Campi Flegrei), indicated as “Sf3a” in Figure 1, acquired between 2008 and 2017.
Remotesensing 14 03789 g011
Figure 12. Weighted average temperature trend of the three hottest clusters with their related standard deviation of thermal images taken in the Pisciarelli area (Campi Flegrei), indicated as “Ps1a” in Figure 1, acquired between 2008 and 2017.
Remotesensing 14 03789 g012
Figure 13. Trend of the average number of pixels of the three hottest clusters of the thermal images taken in La Solfatara crater (Campi Flegrei), indicated as “Sf3a” in Figure 1, acquired between 2008 and 2017.
Remotesensing 14 03789 g013
Figure 14. Trend of the average number of pixels of the three hottest clusters of the thermal images taken in the Pisciarelli area (Campi Flegrei), indicated as “Ps1a” in Figure 1, acquired between 2008 and 2017.
Remotesensing 14 03789 g014
Publisher’s Note: MDPI stays neutral with regard to jurisdictional claims in published maps and institutional affiliations.

