Article

Snow Cover Phenology Change and Response to Climate in China during 2000–2020

1
Key Laboratory of Remote Sensing of Gansu Province, Northwest Institute of Eco-Environment and Resources, Chinese Academy of Sciences, Lanzhou 730000, China
2
University of Chinese Academy of Sciences, Beijing 100049, China
3
Heihe Remote Sensing Experimental Research Station, Northwest Institute of Eco-Environment and Resources, Chinese Academy of Sciences, Lanzhou 730000, China
4
Key Laboratory of Land Surface Process and Climate Change in Cold and Arid Regions, Northwest Institute of Eco-Environment and Resources, Chinese Academy of Sciences, Lanzhou 730000, China
5
State Key Laboratory of Earth Surface Processes and Resource Ecology, Beijing Normal University, Beijing 100875, China
*
Author to whom correspondence should be addressed.
Remote Sens. 2022, 14(16), 3936; https://doi.org/10.3390/rs14163936
Submission received: 1 July 2022 / Revised: 4 August 2022 / Accepted: 10 August 2022 / Published: 13 August 2022
(This article belongs to the Special Issue Remote Sensing for Mountain Vegetation and Snow Cover)

Abstract

:
Snow cover phenology (SCP) is critical to the climate system. China has the most comprehensive snow cover distribution in the middle and low latitudes and has shown dramatic changes over the past few decades. However, the spatiotemporal characteristics of SCP parameters and their sensitivity to meteorological factors (temperature and precipitation) under different conditions (altitude, snow cover classification, or season) in China are insufficiently studied. Therefore, using improved daily MODIS cloud-gap-filled (CGF) snow-cover-extent (SCE) products, the spatiotemporal characteristics (distribution and variation) and respond to climate of snow cover area (SCA), snow cover start (SCS), snow cover melt (SCM), and snow cover days (SCD) are explored from 2000 to 2020. The results show that in the past 20 years, snow cover in China has demonstrated a trend of decreasing SCA, decreasing SCD, advancing SCS, and advancing SCM, with SCM advancing faster than SCS. The greatest snowfall occurs in January, mainly in northeastern China, northern Xinjiang, and the Tibet Plateau. Spatially, the slope of SCP was mainly within ±0.5 day/year (d/y) Statistics indicated that the area proportion where SCD is significantly reduced is greater than increased; SCD, SCS, and SCM are shortened or advanced in three snow-covered area classifications. Moreover, compared with precipitation, the significantly correlated regions (6–47.2% more than precipitation) and correlation degree (1.23–8.33 times precipitation in significantly correlated snow cover classification) between temperature and SCP in different seasons are larger. For stable snow-covered areas (SSA), SCD are mainly affected by spring temperature below 1500 m and mainly by autumn temperature above 1500 m; the precipitation is more affected in autumn. The correlation of SCP with temperature and precipitation has obvious spatial and seasonal differences and shows characteristic variation with altitude. These results can provide important data support for climate prediction, hydrological research, and disaster warning.

Graphical Abstract

1. Introduction

As one of the essential components of the cryosphere [1,2,3], due to its high albedo and low thermal conductivity, snow cover has a substantial impact on the climate system via regulating the surface energy budget, the hydrological cycle, and atmospheric circulation [4,5]. The sixth report of the Intergovernmental Panel on Climate Change (IPCC_AR6) stated that the average temperature in the past 10 years is 1.09 °C more than in the late 19th century and further warming has led to seasonal snow cover reduction and earlier snowmelt date. Changes in the snow cover within a range have caused changes in the global climate system [6]. In addition, the reduction in snow cover may affect soil respiration [7], which in turn affects food production [8] and animal migration [9]. Earlier snowmelt will cause significant changes in the time and amount of snowmelt runoff in spring and may increase peak runoff, which will increase the incidence of disasters, such as floods or droughts [10]. Therefore, accurate estimation and information on snow cover are essential for evaluating the impacts of climate change and disaster prevention.
Snow cover phenology (SCP) parameters such as snow cover area (SCA), snow cover days (SCD), and snow cover start (SCS) and snow cover melt (SCM) dates can quantify this change in snow cover [11], and it has become an increasingly valuable indicator of climate change and an important input parameter for climate models [12]. China is located on Asian east and the Pacific Ocean’s west coast, with a vast territory and complex terrain, and it is the country with the largest snow cover in the middle and low latitudes [13]. Snowmelt water in China is the source of many large rivers in Asia and plays an important role in the Earth’s climate system [14,15]. Therefore, it is of great significance to explore the changes in and distribution of SCP in China [16]. The attribution of SCP change over the past few decades has also received extensive attention [17,18]. Several studies have shown that the distribution of and changes in SCP are susceptible to surface temperature and precipitation [19,20,21] and are greatly affected by topography [22]. However, in China, most snow cover studies are on small areas. Research on the spatiotemporal characteristics (distribution and variation) of SCP parameters and their sensitivity to meteorological factors (temperature and precipitation) under different conditions (altitude, snow-covered area types, and season) in China is relatively little.
Previous studies have shown that the acquisition of SCP parameters mainly includes two data sources: conventional ground stations and satellite remote sensing observations [23]. Many scholars have used ground station data to analyze the spatial distribution of snow cover [24], the trend of snow start and end dates [25], and the degree of influence of various variables on snow cover [26]. However, the ground station observation data have the disadvantage of poor spatial integrity, making it challenging to characterize the spatial distribution of snow in the whole region [27]. With the development of remote sensing technology, this shortcoming has been compensated [28]. Visible spectral remote sensing (such as Landsat, SPOT, AVHRR, and MODIS snow products) and microwave remote sensing (such as SMMR, SSM/I, AMSE-R, and MWRI snow products) are widely used to obtain snow information and analyze snow cover changes. Some scientists also use products fused from multiple snow cover datasets for analysis [29]. Although microwave and AVHRR products cover a long time period, their spatial resolution is relatively low. Landsat products have a high spatial resolution but low temporal resolution and are not spatially representative of a large area [23,30]. Currently available snow cover products with a high temporal and spatial resolution of long-term series used in the mesoscale are mainly MODIS-related snow products.
Compared with the newly released cloud-free MODIS NDSI dataset (mainly providing NDSI values) [31] and M*D10A1GL06 product (a snow-and-glaciers-combined product with significantly improved accuracy, mainly for high-mountain Asia,) [32,33], as a cloud-free binary snow product with high overall accuracy considering different underlying surfaces using reflectance data, the modified Chinese MODIS daily cloud-gap-filled (CGF) 500 m snow-cover-extent (SCE) dataset (NIEER CGF MODIS SCE) [34,35] is more suitable for this study. Furthermore, the validation against 362 China Meteorological Administration (CMA) stations shows that the modified product’s OA is 93.15%, which has increased compared with the MOD10A1F product and the MYD10A1F product by 4 and 9 percentage points, respectively. Both omission error (OE) and commission error (CE) were within 10%, and there was a significant improvement, especially in the forested area. The SCP parameters in MODIS China snow cover phenology data from 2000 to 2020 (NIEER MODIS SCP) [36,37] are also high precision, calculated based on the NIEER CGF MODIS SCE product. The validation against CMA stations shows that the root mean square error (RMSE) is within 20 days and the mean absolute error (MAE) is within 8 days for all three snow cover phenology datasets. These improved MODIS CGF snow cover products are beneficial for us to obtain more accurate snow cover information in China.
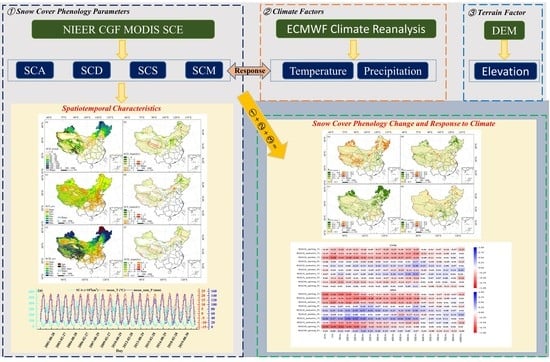
The objective of this study is to explore the latest terrestrial snow cover phenology changes and respond to the climate in China during 2000–2020. Firstly, the high-precision NIEER CGF MODIS SCE product and the NIEER MODIS SCP product were used to conduct a spatial and temporal analysis of SCP in China during 2000–2020. Secondly, we divided snow cover types according to SCP parameters to explore the characteristics of SCP under different snow types. Finally, using meteorological data (temperature and precipitation) and topographic data, this study discusses the relationship between SCP and climate at different altitudes, snow-covered area types, and seasons. In-depth research and accurate snow cover analysis are expected to provide basic data for climate prediction; agricultural water resources utilization; and information services for warnings about disasters, such as floods and snow disasters.

2. Data

Two satellite-observed snow cover products based on MODIS and a reanalysis dataset were employed to explore the distribution and attribution of SCP in China.

2.1. Improved MODIS CGF Snow Cover Products

Improved MODIS CGF snow cover products are used as the basic dataset for SCP analysis, mainly including the NIEER CGF MODIS SCE dataset and the NIEER MODIS SCP dataset. The NIEER CGF MODIS SCE dataset provides basic data of SCA, and the NIEER MODIS SCP dataset provides basic data of SCD, SCS, and SCM. They are all from the National Cryosphere Desert Data Center. (http://www.ncdc.ac.cn, accessed on 26 November 2020 and 16 November 2021 respectively).

2.1.1. The NIEER CGF MODIS SCE Product

We identified snow cover as the true value using the NIEER CGF MODIS SCE product. The product improved the snow cover extraction algorithm of the aggregated MODIS product (aggregate the Terra-MODIS SCE and Aqua-MODIS SCE under clear skies to exclude some cloud gaps preliminarily) using surface reflectance data standards in forest and non-forest areas in China, respectively, based on the high-spatial-resolution cloud-free Landsat-5 TM/Landsat8 OLI image. Then, clouds were removed in two steps using Hidden Markov spatiotemporal modeling and snow depth data interpolation (derived from passive microwave remote sensing). Finally, the cloud-free product combined temperature data and water data to obtain a daily cloud-free snow cover product. The product has a spatial resolution of 500 m, a temporal resolution of 1 day, and a time range from 27 February 2000 to 31 December 2020. Product details for this dataset are shown in Table 1, including data categories (snow cover, land, water, and vacancy values), values, and remarks [34].

2.1.2. The NIEER MODIS SCP Product

NIEER MODIS SCP products are calculated by hydrological year according to NIEER CGF MODIS SCE products. The dataset includes three SCP sub-datasets, which are the SCD, SCS, and SCM. Its time range is from 2000 to 2020, with a temporal resolution of 1 year and a spatial resolution of 500 m. The product details are shown in Table 2, including SCP parameters, value ranges, no data, water, and remarks.

2.2. Reanalysis Temperature and Precipitation Dataset

The ERA5-Land Monthly Averaged—ECMWF Climate Reanalysis dataset [38] provides a meteorological dataset to analyze snow cover distribution and change drivers. This dataset has been produced by replaying the land component of the ECMWF ERA5 climate reanalysis. Reanalysis combines model data with observations from across the world into a globally complete and consistent dataset using the laws of physics. This dataset includes 50 variables. Skin temperature and total precipitation are used as meteorological factors in this study. The spatial resolution is 0.1°, and the time range is from January 1981 to March 2022. The product has been resampled into 500 m to match MODIS products using nearest neighbor resampling.

2.3. DEM Dataset

The digital elevation model dataset (DEM) is the fourth version dataset of the Shuttle Radar Topography Mission (SRTM) DEM products and is directly accessible on the Google Earth Engine (GEE) platform. The dataset has a resolution of 90 m and covers more than 80% of the world. This product mainly provides elevation data, which have been aggregated to 500 m to match the MODIS product [39].

3. Method

3.1. Definition of Snow Cover Phenological Parameters

In the study, the hydrological year is defined as the 1st of September of one year to the 31st of August of the following year.
SCA is defined as the total area covered by snow in an area, as in Equation (1):
SCA = s × N
where s is the area of a single pixel, which in this paper is 0.25 km2, and N is the sum of the number of pixels with snow in a single day.
SCD is defined as the sum of snow days in a hydrological year, as in Equation (2):
SCD = i = 1 n ( t )
where t is the daily single-pixel information, which is 1 (snow) or 0 (no snow), and n is the total number of days in a hydrological year.
SCS is defined as the first 5 consecutive days when a pixel is classified as snow if the pixel satisfies Equation (3):
i = 1 i + 4 ( t ) = 5
then,
SCS = s
where i is day of year (DOY) i.
SCM is defined as the last 5 consecutive days when snow occurs during each hydrological year if the pixel satisfies Equation (5):
m 4 m ( t ) = 5
then,
SCM = n m
where m is DOY m.
This is the easiest way to calculate SCS and SCM and would avoid the impact of ephemeral snow. The SCD, SCS, and SCM datasets are directly obtained from the NIEER MODIS SCP product [40].

3.2. Analytical Method

3.2.1. Statistical Analyses

We calculated the average value and trend analysis of each pixel’s snow cover phenological parameters in the past 20 years to explore the spatial distribution of snow cover in China.
The Theil-Sen Median method, also known as Sen’s slope estimator, is a robust non-parametric statistical trend calculation method. This method is widely used in trend analysis of long time-series data to calculate the size of the trend, due to the advantages of high computational efficiency and insensitivity to outliers.
The Mann–Kendall (M–K) test, as a non-parametric trend test method, is widely used in the trend significance tests of long time series data. The M–K test does not require the measured values to obey the normal distribution and is not affected by missing values and outliers. In the M–K test, the positive Z value showed an upward trend, while the negative Z value showed a downward trend. We can also use the Z value to calculate the p value to describe the significance level accurately. The commonly used absolute value of z was equal to or greater than 1.28, 1.64, and 2.32, indicating that the values passed the 90%, 95%, and 99% significance tests, respectively. Generally, an evident trend is considered when the significance level is greater than 95% [41,42].

3.2.2. Snow-Covered Area Classification

Combining the average value and interannual variability (IV) of SCD [43], the regional scope and the spatiotemporal distribution of and variation in different snow-covered areas’ SCP are explored to better understand the characteristics of snow cover in China. The types of snow cover areas in China are classified. The division rules are as follows: (1) stable snow-covered areas (SSA): SCD > 60 and IV < 0.4; (2) annual periodic unstable snow-covered areas (APA): 10 < SCD ≤ 60 and IV < 1.0 or SCD > 10 and 0.4 ≤ IV < 1.0; (3) non-annual periodic unstable snow-covered areas (NPA): 0 < SCD ≤ 10 and IV <3.0 or SCD > 0 and 1.0 ≤ IV < 3.0; and (4) snow-free areas (SFA): SCD = 0, where I V = δ / X ¯ , δ is the standard deviation of SCD, X ¯ is the annual mean of SCD.

3.2.3. Correlation between SCP and Climatic Factors

The Pearson evaluation method is a statistical method to measure the closeness of the relationship between two variables accurately. In the Pearson evaluation method, the correlation coefficient r indicates the degree of correlation, ranging from −1 to 1. The formula for this index is as follows:
r = i = 1 m ( x i   x ¯ ) ( y i y ¯ ) i = 1 m ( x i   x ¯ ) 2 i = 1 m ( y i y ¯ ) 2
where x i is the SCP parameter of the DOY i; y i is the annual precipitation or average temperature of the DOY i year; x ¯ is the average value of the SCP for many years; y ¯ is the average value of the precipitation or temperature; and m is the number of years in the monitoring period. Positive values (r > 0) indicate facilitation, while negative values (r < 0) represent inhibition.
The statistical confidence level of correlation was evaluated by performing the significance test. Among them, P < 0.1, P < 0.05, and P < 0.01 indicate that they passed the significance test of 90%, 95%, and 99% confidence, respectively [44].
In this study, the Pearson correlation coefficient was used to analyze snow cover driving factors (temperature and precipitation) and perform the significance test. To further explore the influence of altitude on snow cover changes, we analyzed the correlation between SCP and meteorological factors (temperature and precipitation) in the past 20 years in the whole of China, especially SSA, at different altitudes at 500 m intervals.

4. Results

4.1. Spatiotemporal Distribution and Variation Characteristics of SCP in China

4.1.1. Temporal Variation Characteristics of SCP

The average SCA, temperature, and precipitation diurnal variation in China from 1 September 2000 to 31 August 2020 is shown in Figure 1a, which exhibits an annual periodic variation snow cover characteristic of “accumulation–ablation–accumulation” from 1 September 2000 to August 2020, but with temperature and precipitation trends opposite to snow cover. The SCA, SCD, temperature, and precipitation monthly variations are shown in Figure 1b. Snow began to increase in autumn (September–November) and entered the accumulation period and increased the fastest in October–November. In winter (December to February), the change was small and entered a stable period. The largest SCA (305.20 × 10⁴ km2) and the largest number of SCD (9.82 d) were reached in January. Autumn (March–May) entered the ablation period, and snow cover gradually decreased, with the fastest decrease in March–April. Compared with other seasons, there was only a small amount of snow in summer (June–August), and it was mainly distributed in some high-altitude areas. The temperature and precipitation trend are similar. They started to decrease from autumn. The temperature dropped the most from October to November, and it dropped below 0 °C in November. In winter, the precipitation maintained a relatively low state, with little change. The temperature reached 0 in January. In winter, temperature and precipitation were relatively low and less variable, with precipitation reaching its lowest in December and temperature in January. In spring, both temperature and precipitation began to rise, with the highest temperature rise from March to April, and it was higher than 0 °C in March. Summer temperatures and precipitation were high and peaked in July. Compared with precipitation, temperature and snow cover have completely opposite trends and have a greater impact. The changes in temperature and precipitation also better explain the reasons for the rapid increase and rapid melting of snow cover in China, which is also the reason why the snow cover period in China is mainly from November to March. However, the specific response of meteorological factors to snow cover needs more detailed analysis. From the interannual variation in SCA, SCD, SCS, and SCM (Figure 1c) during the hydrological years 2000/2001 to 2019/2020, the snow phenological parameters in China showed a fluctuating state of change, showing a decreasing trend in SCA (slop = −1.00 × 10⁴ km2/y) and SCD (slop = −0.12 day/year (d/y)) and an advancing trend in SCS (slop = −0.22 d/y) and SCM (slop = −0.73 d/y). However, these changes were not significant (P > 0.1). Although the definitions and slope of SCA and SCD are different, the changing trend is exactly the same and the advance rate of SCM is larger than that of SCS.

4.1.2. Spatial Variation Characteristics of SCP

The average value and trend analysis of SCP were performed at each pixel to explore the spatial distribution pattern and changes in SCP. SCP spatiotemporal distribution and variations in CHN from 2000/2001 to 2019/2020 are shown in Figure 2. We observed high spatial heterogeneity of SCP in China. Figure 3 shows the percentage of SCD, SCS, and SCM slope in China.
The spatial distribution of average SCD (Figure 2a) shows that 39.08% of the areas in China have more than 30 days, mainly in the three major snow cover regions of Northeast China–Inner Mongolia, northern Xinjiang, and the Qinghai–Tibet Plateau. The SCD in some high-altitude areas are even more than 180 days, accounting for about 3.09% of the country’s total area, mainly distributed in the Altai Mountains, the Tianshan Mountains, the western Himalayas, Nyainqentanglha Mountains, and Tarnianthawg Mountains. Nearly 40.93% of the area has little snow (SCD < 10 d), including most of southern China, the Tarim Basin, and the Tsaidam Basin. About 13.75% of China’s areas do not have snow for 5 consecutive days, so the SCS (Figure 2c) and melt dates (Figure 2e) of these areas are not discussed. In 71.38% of the areas, the SCS is mainly from September to December and the SCM is more scattered and distributed throughout the year. In general, the SCS and SCM are early in the areas with less snow cover and the snow cover in the areas with more snow cover mainly ends in spring.
In terms of the slope spatial distribution for SCD (Figure 2b), SCS (Figure 2d), and SCM (Figure 2f) and the percentage of different SCP parameters’ slope (Figure 3) in China, for 35.51% of the areas, the changes in the SCD were not analyzed, and for 54.48% of the areas, the changes in the SCS and SCM were not discussed. In the past two decades, the slope of SCP parameters in China was mainly within ±0.5 d/y. In the statistics of the percentage of SCD, SCS, and SCM changes in the total area of the country, the decreased area (slope < 0) was 17.88%, 6.22%, and 11.02% more than the increased area (slope > 0), respectively. The SCD decreases were significant (P < 0.05) in 6.97% of the total area, mainly located in the northern part of the Greater Khingan Range, the southern part of the Tianshan Mountains, the southern part of the Northeast Plain, most of Shanxi Province and other scattered areas; the area with a significant increase in SCD accounted for only 1.59%, mainly in Qinghai Province and the eastern part of the Himalayas. The regions with significant advancing SCS accounted for about 5.61% of China and were scattered at the junction of the Greater and Lesser Khingan Range, the Changbai Mountains, parts of the Sanjiang Plain, and other scattered areas. Only in the northern and central parts of Inner Mongolia was SCS significantly delayed, accounting for 2.32% of the country’s total area. China has a significant trend of early SCM in 5.15% of the regions, and only 1.39% of the regions have a significant trend of late SCM. These significant early trends were primarily distributed in the Greater Khingan Range, Altay, the northern part of the North China Plain, and the southern part of the Northeast Plain, and the significant late trends were distributed in the eastern part of the Himalayas and eastern Tarim Basin.

4.2. Temporal and Spatial Distribution and Variation Characteristics of Different Snow-Covered Types’ SCP in China

4.2.1. Snow-Covered Area Classification in China

According to the classification method of snow cover types in Section 3.2.2, snow-covered area types in China are classified by the interannual variability and average snow cover days (Figure 2a), as shown in Figure 4. Statistics results show that 22.60% of China’s areas are SSA and 29.62% of the areas are APA. These two types of snow are mainly distributed in the three major snow-covered areas of Northeast China–Inner Mongolia, northern Xinjiang, and the Qinghai–Tibet Plateau. NPA are the most extensive, accounting for 37.52% of the country’s total area, which are distributed in the southeast of central China, as well as in the Tarim Basin and the Turpan Basin. In addition, only the southern coastal area and the Sichuan Basin are snow-free areas (SFA), accounting for 10.26% of the country’s total area.

4.2.2. SCP in Different Snow-Covered Area Types

The changes in SCD, SCS, and SCM for snow cover types in China from 2000/2001 to 2019/2020 are shown in Table 3. All types of snow-covered areas in China have a trend of decreasing SCD and advancing SCS and SCM, and the changes are not significant, but there are slight differences between each type. In the stable snow-covered areas (SSA), the average number of SCD are 137.29 d, the average SCS is DOY 67.28 (7th November), and the average SCM is DOY 226.03 (13th April), decreasing or advancing at a rate of −0.16 d/y, −0.09 d/y, and −0.22 d/y, respectively. In the annual periodic unstable snow-covered areas (APA), the average number of SCD are 39.67 d/y, the slope is −0.17 d/y, the SCS is 85.99th (25th November), the change rate is −0.11 d/y, the average SCM is 148.91th (27th January), and the slope is −0.85 d/y. In the non-annual periodic unstable snow-covered areas (NPA), the average SCD, SCS, and SCM are 39.67 d/y, 85.99th (25th November), and 148.91th (27th January), respectively. Their slopes are −0.17 d/y, −0.11 d/y, and −0.85 d/y respectively.
Excluding the three types of snow cover outside the snow-free areas, the average value of snow cover phenological parameters shows that the SCD gradually decrease with SSA, APA, and NPA, but the snow cover of the SSA remains the longest; NPA have the earliest SCS and SCM, APA have the latest SCS, but SSA have the latest SCM. The slope of SCP shows that the change in SCD is similar among the three types of snow cover. SSA have the slightest slope of SCS and SCM, so the snow cover is relatively stable. The snow cover of APA has the most prominent change rate in SCM, and the snow cover of NPA has the most significant slope of SCS.

4.3. Response of SCP to Meteorological Factors

4.3.1. Response of SCP to Meteorological Factors in China

The correlation spatial distribution between SCD and autumn, winter, and spring meteorological factors (temperature and precipitation) is shown in Figure 5. The spatial distribution of the correlation between SCS and autumn meteorological factors (temperature and precipitation) and that between SCM and spring meteorological factors (temperature and precipitation) are shown in Figure 6. The correlation statistical area percentages of Figure 5 and Figure 6 are shown in Table 4.
  • Response of SCD to meteorological factors in China
Since the SCD are calculated for the entire hydrological year, but the actual snow cover is less affected by the summer climate, when investigating the responses of SCD to climate change, we only considered the relationship between SCD and meteorological factors (temperature and precipitation) in autumn (September–November), winter (December–February), and spring (March–May) at the pixel level using the Pearson correlation. The results of the correlation calculation and significance test are shown in Figure 5. The SCD are 0 in 6.77% of China’s regions, so the relationship between SCD and meteorological factors is not discussed in these regions.
In terms of the correlation of spatial distribution between SCD and temperature (Figure 5a,c,e) and the correlation statistical area percentage (Table 4), the response of SCD to temperature has obvious spatial differences and seasonality. The regions where SCD are negatively correlated with autumn temperature and spring temperature respectively account for 78.66% and 71.01% of the country’s total area, and the regions with a significant negative correlation account for 18.26% and 22.29% of the country’s total area, respectively. In spring and autumn, the significant negative correlation areas between temperature and SCD are similar, and they are mainly divided into Altay, the high-altitude mountains of the Qinghai–Tibet Plateau, the northern part of the North China Plain, the southern part of the Northeast Plain, and the northeastern part of the Inner Mongolia Plateau. In winter, the area with a negative correlation between SCD and temperature accounts for 89.07% of the country’s total area, basically covering the snow-covered regions of the country, and the area with significant negative correlation accounts for 51.22% of the country’s total area. We also observed a significant positive effect of temperature on the SCD, but these areas were less than 0.3% either in fall, winter, or spring, especially in winter (less than 0.1%).
The correlation also revealed that the precipitation might also control SCD in several areas (Figure 5b,d,f). Autumn precipitation has a significant positive effect on SCD in more regions (8.47%), mainly distributed in the Altai Mountains, the Tianshan Mountains, the southwest of the Northeast Plain, and some high-altitude mountains of the Qinghai–Tibet Plateau. Only 0.28% of the region’s autumn precipitation has a significant negative effect. In winter, 2.46% of the regional SCD are significantly positively correlated with precipitation, located in parts of the Greater Khingan Range, Shanxi Province, and northern Tarim Basin, and 3.93% of the regional SCD are significantly negatively correlated with precipitation, located in parts of the Qinghai–Tibet Plateau, northern Turpan Basin, and the Junggar Basin. There is a significant positive correlation between SCD and spring precipitation mainly in the Greater Khingan Range, Shanxi Province (1.07%), the A-erh-chin Mountains, the Altai Mountains, and western Himalayas, and a significant negative correlation in central China and central and southern Qinghai–Tibet Plateau (3.00%).
2.
Response of SCS and SCM to meteorological factors in China
Since SCS is mainly in autumn and SCM is mainly in spring in China, the relationship between SCS and autumn temperature and precipitation and between SCM and spring temperature and precipitation was calculated to explore the response of SCS and SCM to meteorological factors. As shown in Figure 6a,b, the negative correlation area between SCS and autumn temperature is 25.61% more than the positive correlation area, but the negative correlation area with autumn precipitation is 22.72% less than the positive correlation area. In particular, a significant positive correlation between the SCS and autumn temperature was found in 13.09% of China, mainly located in three snow-covered regions, and a significant negative correlation between the SCS and autumn temperature was found in 1.27% of China, mainly located in the east of the North China Plain and the middle and lower reaches of the Yangtze River Plain. About 1.25% of the regional SCS is significantly positively correlated with autumn precipitation, mainly in the three snow-covered regions, and 7.11% of the regions with a significant negative correlation between SCS and autumn precipitation are mainly distributed at the junction of Inner Mongolia and Gansu Province, the northwest of the Yunnan–Guizhou Plateau, and some sporadic areas.
SCM was also controlled by spring temperature (Figure 6c) and precipitation (Figure 6d). The negative correlation area between SCM and spring temperature is 43.94% more than the positive correlation area, but the positive correlation area with spring precipitation is 5.94% more than the negative correlation area. The SCM was significantly negatively correlated with spring temperature in about 19.63% of China, primarily in most of the three snow-covered regions. However, a significantly positive correlation was only in 0.40% of the area. The areas with a significantly positive correlation between SCM and precipitation are mainly scattered in three snow-covered regions, accounting for 2.90% of China. In comparison, a negative relationship between SCM and temperature was observed in a similar area (2.05%) in the Sichuan Basin.

4.3.2. Response of SCP to Meteorological Factors in Different Snow-Covered Area Alassification

To further examine the spatial pattern of impacts of climate factors on SCD, SCS, and SCM, we also analyzed their relationships in different snow types (Table 5). For the whole of China, SSA, APA, and NPA, in addition to the positive effects of autumn and spring precipitation on SCD, temperature, and precipitation, have negative effects in spring, autumn, and winter. The effect of temperature on CHN and SSA is greater in spring, with a high correlation coefficient (−0.48 and −0.66, respectively), but in APA and NPA, the greater effect is in winter (correlation coefficients are -0.48 and −0.55, respectively). Except for SSA (the correlation coefficient is −0.37), the precipitation has the greatest correlation in winter, and the correlation coefficients are −0.5 (CHN), −0.38 (APA), and −0.37 (NPA). The correlation between SCS and autumn temperature was greater in SSA (r = 0.69) and APA (0.51), which were positive correlations, but showed a negative correlation in NPA. However, SCS and autumn precipitation showed a positive correlation in APA and a negative correlation in other regions. The correlation degree was similar, and the absolute value of the correlation coefficient was above 0.38. SCM and spring temperature are both negatively correlated, and SSA have the largest correlation (r = −0.75), while precipitation is less correlated, and the absolute value of the correlation coefficient is less than 0.2. SSA show a positive correlation, and other types show a negative correlation.

4.3.3. Response of SCP to Meteorological Factors with the Elevation Variations

Areas with different elevations as a percentage (%) of the total area in China (CHN) or in the stable snow-covered areas (SSA) are shown in Table 6. The correlation between SCD and climate factors (average temperature and sum precipitation in autumn, winter, and spring), the correlation between SCS and climate factors in autumn, and the correlation between SCM and climate factors in spring at different altitudes in China (CHN) and in SSA are shown in Figure 7.
The DEM dataset indicating the Chinese area with an altitude below 0 m only accounts for 0.40% of the country (Table 6), mainly in the Junggar Basin and some southern coastal areas, where there is relatively little snow. The area of DEM above 6000 m only accounts for 0.11% of the total Chinese area and is mainly distributed in the Himalayas, the Kunlun Mountains, the Nyainqentanglha Mountains, etc., of the Qinghai–Tibet Plateau. These areas have little precipitation, low temperatures, a large number of SCD, early SCS, and late SCM. The overall average number of SCD in these areas can be as high as 310 days or more, and the changes are small, all of which are stable snow-covered areas, and some areas are even permanent snow-covered areas. Therefore, this study discusses the response of SCP to meteorological factors with the elevation variations mainly for DEM in the range of 0–6000 m.
Between 0 and 6000 m in elevation, the SCD and temperature in China are negatively correlated, mainly affected by winter temperature, followed by autumn temperature, and spring temperature has the smallest effect. Compared with temperature, SCD are relatively less affected by precipitation. The correlation between SCD and autumn precipitation is the largest, followed by winter precipitation, and the correlation is also the smallest in spring. At different altitudes, SCD are positively correlated with autumn precipitation, negatively correlated with winter temperature, and may have an opposite correlation (positive or negative correlation) with spring temperature at different altitudes. SCS was positively correlated with autumn temperature and negatively correlated with autumn precipitation and SCM was negatively correlated with spring temperature and had an opposite correlation with spring precipitation at different altitudes. Considering the large proportion of places with less snow cover in China, which may interfere with the results, we further studied the response of the SCP in the stable snow cover areas to the change in meteorological factors with altitude.
In SSA, SCD are basically negatively correlated with temperature and positively correlated with precipitation at different altitudes, but above 3000 m, SCD are negatively correlated with winter precipitation. SCD have a greater correlation with spring temperature below 1500 m in elevation and a greater correlation with autumn temperature above 1500 m. In terms of precipitation, SCD are more correlated with autumn precipitation than spring and autumn precipitation. The correlation between SCD and spring temperature gradually decreased with an increase in altitude, but it decreased slowly and tended to remain unchanged at 3000–6000 m. The correlation between SCD and the temperature in autumn increased gradually from 0 to 2500 m, then decreased gradually at 2500 m, and tended to remain stable until 4000 m. The correlation between SCD and winter temperature gradually decreased within 2500 m, then tended to remain unchanged, then increased slightly when greater than 3500 m, and then tended to remain unchanged. The correlation between SCD and spring precipitation is large between 2000 and 3000 m in elevation, and the correlation with autumn precipitation changes with altitude is similar to the correlation change trend between SCD and autumn temperature, but precipitation is positively correlated and temperature is negatively correlated. SCD are positively correlated with winter precipitation and negatively correlated above 4000 m in elevation. This is mainly because the winter temperature in high-altitude areas is too low and the precipitation temperature is higher than the surface, so the more the precipitation, the more the accumulation, and the fewer the snow days, showing a negative correlation. The SCD and winter precipitation are positively correlated between 1000 and 2000 m and negatively correlated after more than 4000 m. This is mainly because the winter temperature in high-altitude areas is too low and the precipitation temperature is higher than the surface, so the more the precipitation, the fewer the SCD, presenting a negative correlation.
There is a positive correlation between SCS and the temperature in autumn. The lower the temperature in autumn, the easier it is for water vapor to condense into ice crystals and reach the ground before it completely evaporates or melts, forming snowfall, and the earlier the SCS. SCS has a negative correlation with precipitation. The more correct the precipitation, the more water vapor in the air, so when encountering low temperature, it is easy for the water vapor to form snowfall. The correlation between SCS and temperature and that between SCS and precipitation both reach the maximum at 1000 m–1500 m and the minimum at 3500 m–4000 m. The snow cover is positively correlated with spring precipitation and negatively correlated with temperature. With the increase in altitude, the correlation between SCM and temperature gradually becomes smaller. The correlation between SCM and temperature changes little at altitudes less than 1000 m and greater than 3000 m but increases with altitude within 1000–3000 m; the correlation with precipitation shows a downward U shape, peaking at 2000–2500 m, with an inflection point at 1000–1500 m.

5. Discussion

5.1. Comparison with Previous Studies and Explanation of Phenomena

The results obtained in the study are compared with those of previous studies, and the potential reasons for their consistency and inconsistency are discussed. The results show that the snow cover in China is widely distributed and uneven, with seasonality and high spatiotemporal heterogeneity. The main snow cover season in China is from November to March, and snow is mainly distributed in the Greater Khingan Range, the Lesser Khingan Mountains, the Altay Prefecture, the Tianshan Mountains, and the high-altitude areas of the Qinghai–Tibet Plateau. The SSA and APA are mainly distributed in Northeast China, northern Xinjiang, and the Qinghai–Tibet Plateau. This is basically the same as the spatial distribution of snow days and snow-covered classification obtained by Li [45] through the site data in the 1970s and the 1980s. Still, according to the snow type division result, we can see that the SSA have decreased significantly, which is mainly due to the changes in environmental factors, such as temperature and precipitation, in the 21st century. In the context of global warming, late SCS, early SCM, and shortened SCD would occur [46], with a more significant reduction in SCA. Furthermore, many previous studies have confirmed that both SCA and SCD in the high latitudes of the Northern Hemisphere (NH) have decreased significantly in recent years [47,48]. The analysis of this study shows that the overall SCD in China have decreased and the SCM advance is the same as the general trend, but the SCS also shows an advanced trend as a whole, and different regions also show different trends. This is related to the undulating and changing topography of China and the large spatial heterogeneity.
SCP is sensitive to changes in meteorological variables, especially temperature and precipitation [49,50,51]. This is mainly because precipitation can be directly or indirectly transformed into snow under certain temperature conditions. The decreased temperature could increase the probability of snowfall. When the temperature is lower than the freezing point, precipitation often occurs in the form of a snowfall [52]. Therefore, the increase in precipitation under the condition of temperature freezing point is beneficial to increasing and maintaining snow cover, resulting in more SCD, early SCS in autumn, and delayed SCM in spring. However, higher temperatures or increased precipitation at higher temperatures can delay snow formation or induce snowmelt, reduce SCD, delay SCS, and advance SCM.
There are different effects of temperature and precipitation on snow cover in different seasons. In autumn, the SCD are negatively correlated with temperature and positively correlated with precipitation, while SCS shows a completely opposite correlation. Snowfall is the solid form of precipitation and a necessary condition for forming a snow cover. After evaporation or sublimation, precipitation mostly exists in the form of water vapor in the atmosphere. When it is condensed, it forms ice crystals, which are then deposited to form falling snow. Therefore, the more the autumn precipitation, the more the number of SCD and the earlier the SCS; higher temperatures make snow more difficult to form or melt the snow quickly, resulting in fewer SCD and later SCS. The SCD are less affected by the winter precipitation, mainly because there is less precipitation in winter, leading to fewer water vapor sources. In addition, the surface temperature in winter is lower and the temperature of precipitation may be higher than that of snow, which promotes snow melting and reduces SCD. Thus, SCD are negatively correlated with winter precipitation. The precipitation and temperature in spring are similar to those in autumn, but because the temperature in autumn is gradually decreasing, the temperature in spring is gradually increasing, and the condensation of water vapor is more in autumn than in spring, so the precipitation in autumn has a greater impact on the SCD. Moreover, SCM is mainly affected by temperature and precipitation in spring. The higher the temperature, the earlier the SCM, and the more the precipitation, the later the SCM.
Elevation is a major factor in determining the role of temperature and precipitation in snowpack variability [53,54]. Our results also show that the effects of temperature and precipitation on SCP differ at different altitudes. Especially in SSA, SCD have an opposite effect with winter temperatures around 3000 m, mainly due to the relationship between surface temperatures and precipitation temperature at high altitudes. The effects of temperature and precipitation on SCP parameters vary with altitude, with similar trends but different magnitudes compared to previous studies [50], which may be caused by the different product accuracy, statistical area, and year we use.

5.2. Uncertainty Analysis

Compared with SCE indicated by the standard MODIS snow products, the improved MODIS CGF snow cover product’s accuracies are obviously higher. However, because of the similarity of the optical properties of ice clouds to that of snow [29] and the inaccurate cloud mask provided by MOD09GA/MYD09GA products, the problem of cloud/snow confusion may contribute to the largest uncertainty in the new product [34]. Moreover, this product is a binary product. Although it has great advantages in large-scale snow cover spatial distribution and trend analysis and operation efficiency, the binary representation of single-pixel snow cover information will also bring certain uncertainty. Compared with other definitions of SCS and SCM, the definitions in this study have effectively solved the problem of regional instantaneous snow cover, but the regional snow cover in China is complex. Especially in some areas of the Qinghai–Tibet Plateau, the snow cover has a shorter existence time, less than 5 days, which will affect the accuracy of the snow cover. More appropriate definitions of SCS and SCM may be further explored in different regions.

6. Conclusions

This study analyzes the spatiotemporal characteristics of and change trends in SCP in China from 1 September 2000 to 31 August 2020, based on the NIEER CGF MODIS SCE product. The relationship between SCP, temperature, precipitation, and the influence of altitude are also investigated.
Snow cover distribution is extremely uneven and has apparent spatiotemporal heterogeneity in China. Snowfall mainly starts in autumn, reaches the maximum SCA and SCD in January, and gradually disappears at the end of spring and early summer, except for the perennial snow cover. In the past 20 years, the interannual variation in snow cover in China shows a trend of decreasing SCA, decreasing SCD, advancing SCS, and advancing SCM, and the advance slope of SCM is larger than that of SCS. The snow in China is mainly distributed in northeastern China (including Northeast China and west Inner Mongolia), northern Xinjiang, and the Tibet Plateau. The slope of SCP parameters in China was mainly within ±0.5 d/y. In the statistics of the percentage of SCD, SCS, and SCM changes in the total area of the country, the decreased area (slope < 0) is 17.88%, 6.22%, and 11.02% more than the increased area (slope > 0), respectively. All regions except SFA, SCD, SCS, and SCM are shortened or advanced.
Temperature should be of high concern in SCP analysis compared with precipitation. The correlation of SCP with temperature and precipitation has obvious spatial and seasonal differences. In the main snow cover area, SCD and temperature (spring, autumn, and winter) are negatively correlated in most areas and positively correlated with spring and autumn precipitation, and the areas are similar but opposite in winter. SCS was positively correlated with autumn temperature and negatively correlated with precipitation. SCM was negatively correlated with spring temperature and positively correlated with precipitation. The areas that pass the significance test are mainly in SSA and APA. For SSA, SCD are mainly affected by spring temperature below 1500 m in elevation and are mainly affected by autumn temperature above 1500 m. At different altitudes, SCD are greatly affected by autumn precipitation. At altitudes above and below 3000 m, SCD and winter precipitation show an opposite correlation.
This study explores SCP distribution, changes, and correlations with meteorological and topographic factors in China, providing better results and finer spatial resolution, which contributes to understanding the land surface warming over the past few decades of SCP changes and related climate prediction studies and provides primary support for mountain snow cover.

Author Contributions

Conceptualization, Q.Z. and X.H.; methodology, Q.Z. and X.H.; software, Q.Z. and H.Z.; formal analysis, Q.Z. and X.H.; resources, X.H. and J.W.; data curation, Q.Z. and X.H.; writing—original draft preparation, Q.Z.; writing—review and editing, X.H., J.W., H.L., S.L., D.S. and T.F.; supervision, J.W.; projection administration, X.H. and J.W.; funding acquisition, X.H. All authors have read and agreed to the published version of the manuscript.

Funding

This research was funded by the National Natural Science Foundation of China (Grant No. U20A2081, 41971325, 42171391, and 41975096) and the National Key Research and Development Program of China (Grant No. 2019YFC1510503).

Acknowledgments

The authors would like to thank the editor and anonymous reviewers for their valuable comments and suggestions on this article.

Conflicts of Interest

The authors declare no conflict of interest.

References

  1. Wu, X.; Naegeli, K.; Premier, V.; Marin, C.; Ma, D.; Wang, J.; Wunderle, S. Evaluation of snow extent time series derived from Advanced Very High Resolution Radiometer global area coverage data (1982–2018) in the Hindu Kush Himalayas. Cryosphere 2021, 15, 4261–4279. [Google Scholar] [CrossRef]
  2. Armstrong, R.L.; Brodzik, M.J. Recent northern hemisphere snow extent: A comparison of data derived from visible and microwave satellite sensors. Geophys. Res. Lett. 2001, 28, 3673–3676. [Google Scholar] [CrossRef]
  3. Hori, M.; Sugiura, K.; Kobayashi, K.; Aoki, T.; Tanikawa, T.; Kuchiki, K.; Niwano, M.; Enomoto, H. A 38-year (1978–2015) Northern Hemisphere daily snow cover extent product derived using consistent objective criteria from satellite-borne optical sensors. Remote Sens. Environ. 2017, 191, 402–418. [Google Scholar] [CrossRef]
  4. McGowan, H.; Callow, J.N.; Soderholm, J.; McGrath, G.; Campbell, M.; Zhao, J.X. Global warming in the context of 2000 years of Australian alpine temperature and snow cover. Sci. Rep. 2018, 8, 4394. [Google Scholar] [CrossRef] [PubMed]
  5. Batrak, Y.; Muller, M. On the warm bias in atmospheric reanalyses induced by the missing snow over Arctic sea-ice. Nat. Commun. 2019, 10, 4170. [Google Scholar] [CrossRef] [PubMed]
  6. Masson-Delmotte, V.; Zhai, P.; Pirani, A.; Connors, S.; Péan, C.; Berger, S.; Caud, N.; Chen, Y.; Goldfarb, L.; Gomis, M.; et al. Contribution of Working Group I to the Sixth Assessment Report of the Intergovernmental Panel on Climate Change. In IPCC, 2021: Climate Change 2021: The Physical Science Basis; Cambridge University Press: Cambridge, UK, 2021. [Google Scholar]
  7. Fu, Q.; Hou, R.; Li, T.; Jiang, R.; Yan, P.; Ma, Z.; Zhou, Z. Effects of soil water and heat relationship under various snow cover during freezing-thawing periods in Songnen Plain, China. Sci. Rep. 2018, 8, 1325. [Google Scholar] [CrossRef]
  8. Wang, E.; Fu, X.; Han, H. Analysis of Thermal Conductivity and Temperature Variation Characteristics of Seasonal Snow in Norteast China. Trans. Chin. Soc. Agric. Mach. 2021, 52, 275–285. [Google Scholar]
  9. Qiao, D.; Wang, N. Relationship between Winter Snow Cover Dynamics, Climate and Spring Grassland Vegetation Phenology in Inner Mongolia, China. ISPRS Int. J. Geo-Inf. 2019, 8, 42. [Google Scholar] [CrossRef]
  10. Fyfe, J.C.; Derksen, C.; Mudryk, L.; Flato, G.M.; Santer, B.D.; Swart, N.C.; Molotch, N.P.; Zhang, X.; Wan, H.; Arora, V.K. Large near-term projected snowpack loss over the western United States. Nat. Commun. 2017, 8, 14996. [Google Scholar] [CrossRef]
  11. Lin, Y.; Jiang, M. Maximum temperature drove snow cover expansion from the Arctic, 2000–2008. Sci. Rep. 2017, 7, 15090. [Google Scholar] [CrossRef]
  12. Li, W.; Guo, W.; Qiu, B.; Xue, Y.; Hsu, P.C.; Wei, J. Influence of Tibetan Plateau snow cover on East Asian atmospheric circulation at medium-range time scales. Nat. Commun. 2018, 9, 4243. [Google Scholar] [CrossRef] [PubMed]
  13. Qin, D.; Ding, Y. Research on Cryospheric Changes and Their Impacts: Current Status, Trends and Key Issues. Climate Change Research Progress; Nova Science Publishers: Hauppauge, NY, USA, 2009; pp. 187–195. [Google Scholar]
  14. Smith, T.; Bookhagen, B.; Rheinwalt, A. Spatiotemporal patterns of High Mountain Asia’s snowmelt season identified with an automated snowmelt detection algorithm, 1987–2016. Cryosphere 2017, 11, 2329–2343. [Google Scholar] [CrossRef]
  15. Immerzeel, W.W.; Droogers, P.; De Jong, S.M. Large-scale monitoring of snow cover and runoff simulation in Himalayan river basins using remote sensing. Remote Sens. Environ. 2009, 113, 40–49. [Google Scholar] [CrossRef]
  16. Yang, Q. Study on Spatio-Temporal Distribution of Snow Cover in Northeast China and Its Simulation on Snowmelt Runoff. Ph.D. Dissertation, Jilin University, Changchun, China, 2015. [Google Scholar]
  17. Ke, C.-Q.; Li, X.-C.; Xie, H.; Ma, D.-H.; Liu, X.; Kou, C. Variability in snow cover phenology in China from 1952 to 2010. Hydrol. Earth Syst. Sci. 2016, 20, 755–770. [Google Scholar] [CrossRef]
  18. Spandre, P.; Francois, H.; Verfaillie, D.; Lafaysse, M.; Deque, M.; Eckert, N.; George, E.; Morin, S. Climate controls on snow reliability in French Alps ski resorts. Sci. Rep. 2019, 9, 8043. [Google Scholar] [CrossRef]
  19. Zhao, Q.; Hao, X.; He, D. The Relationship between the Temporal and Spatial Changes of Snow Cover and Climate and Vegetation in Northern Xinjiang from 1980 to 2019. Remote Sens. Technol. Appl. 2021, 36, 1247–1258. [Google Scholar]
  20. Chen, X.; Yang, Y.; Ma, Y.; Li, H. Distribution and Attribution of Terrestrial Snow Cover Phenology Changes over the Northern Hemisphere during 2001–2020. Remote Sens. 2021, 13, 1843. [Google Scholar] [CrossRef]
  21. Peitzsch, E.H.; Pederson, G.T.; Birkeland, K.W.; Hendrikx, J.; Fagre, D.B. Climate drivers of large magnitude snow avalanche years in the U.S. northern Rocky Mountains. Sci. Rep. 2021, 11, 10032. [Google Scholar] [CrossRef]
  22. Beniston, M. Is snow in the Alps receding or disappearing? Wiley Interdiscip. Rev. Clim. Change 2012, 3, 349–358. [Google Scholar] [CrossRef]
  23. Wang, Y.; Zuo, H.; Liu, B. ResearchProgressonTemporalandSpatialDistributionofSnowCoverinChina. J. Inn. Mong. For. Sci. Technol. 2017, 43, 47–51. [Google Scholar]
  24. Yan, X.; Zha, C. Spatial distributions and variations of the snow cover in the forests of Northeast China. J. Arid. Land REsources Environ. 2015, 29, 154–162. [Google Scholar] [CrossRef]
  25. Yang, T.; Li, Q.; Ahmad, S.; Zhou, H.; Li, L. Changes in Snow Phenology from 1979 to 2016 over the Tianshan Mountains, Central Asia. Remote Sens. 2019, 11, 499. [Google Scholar] [CrossRef]
  26. Wang, H.; Huang, C.; Hao, X. Analyses of the spatiotemporal variations of snow cover in North Xinjiang. J. Glaciol. Geocryol. 2014, 36, 508–516. [Google Scholar]
  27. Zhao, Q. Research on the Characteristics of the Temporal and Spatial Changes of Snow Phenology in China and Its Response to Vegetation Phenology. M.A. Thesis, Taiyuan University of Technology, Taiyuan, China, 2021. [Google Scholar]
  28. Wang, X.; Hao, X.; Wang, J. Accuracy Evaluation of Long Time Series AVHRR Snow Cover Area Products in China. Remote Sens. Technol. Appl. 2018, 33, 994–1003. [Google Scholar]
  29. Huang, X.; Deng, J.; Ma, X. Spatiotemporal dynamics of snow cover based on multi-source remote sensing data in China. Cryosphere 2016, 10, 2453–2463. [Google Scholar] [CrossRef]
  30. Rees, W.G. Remote Sensing of Snow and Ice, 2nd ed.; CRC Press: Boca Raton, FL, USA, 2006. [Google Scholar]
  31. Jing, Y.; Li, X.; Shen, H. STAR NDSI collection: A cloud-free MODIS NDSI dataset (2001–2020) for China. Earth Syst. Sci. Data 2022, 14, 3137–3156. [Google Scholar] [CrossRef]
  32. Muhammad, S.; Thapa, A. Daily Terra—Aqua MODIS cloud-free snow and Randolph Glacier Inventory 6.0 combined product (M*D10A1GL06) for high-mountain Asia between 2002 and 2019. Earth Syst. Sci. Data 2021, 13, 767–776. [Google Scholar] [CrossRef]
  33. Thapa, A.; Muhammad, S. Contemporary snow changes in the karakoram region attributed to improved modis data between 2003 and 2018. Water 2020, 12, 2681. [Google Scholar] [CrossRef]
  34. Hao, X.; Huang, G.; Zheng, Z.; Sun, X.; Ji, W.; Zhao, H.; Wang, J.; Li, H.; Wang, X. Development and validation of a new MODIS snow-cover-extent product over China. Hydrol. Earth Syst. Sci. 2022, 26, 1937–1952. [Google Scholar] [CrossRef]
  35. Hao, X.; Sun, X.; Ji, W. MODIS-Based Daily Cloud-Free 500 m Snow Area Product Dataset in China. National Cryosphere Desert Data Center. 2020. Available online: www.ncdc.ac.cn (accessed on 26 November 2020). [CrossRef]
  36. Zhao, Q.; Hao, X.; Wang, J. A Dataset of Snow Phenology in China Based on MODIS from 2000 to 2019. National Cryosphere Desert Data Center. 2021. Available online: www.ncdc.ac.cn (accessed on 16 November 2020). [CrossRef]
  37. Zhao, Q.; Hao, X.; Wang, J. A dataset of snow phenology in China based on MODIS from 2000 to 2019. China Sci. Data 2022, 7. [Google Scholar] [CrossRef]
  38. Muñoz-Sabater, J. ERA5-land monthly averaged data from 1981 to present, Copernicus Climate Change Service (C3S) Climate Data Store (CDS). 2019. Available online: https://doi.org/10.24381/cds.68d2bb30 (accessed on 12 July 2019).
  39. Jarvis, A.; Reuter, H.I.; Nelson, A. Hole-filled SRTM for the globe Version 4, available from the CGIAR-CSI SRTM 90m Database. 2008. Available online: http://srtm.csi.cgiar.org/ (accessed on 1 September 2008).
  40. Chen, X.; Liang, S.; Cao, Y.; He, T.; Wang, D. Observed contrast changes in snow cover phenology in northern middle and high latitudes from 2001–2014. Sci. Rep. 2015, 5, 16820. [Google Scholar] [CrossRef] [PubMed]
  41. Mann, H.B. Nonparametric tests against trend. Econom. J. Econom. Soc. 1945, 245–259. [Google Scholar] [CrossRef]
  42. Kendall, M.G. Rank Correlation Methods; Griffin: Duxbury, MA, USA, 1948. [Google Scholar]
  43. He, L.; Li, D. On the classification of the snow cover in western China. Acta Meteorol. Sin. 2012, 70, 1292–1301. [Google Scholar]
  44. Benesty, J.; Chen, J.; Huang, Y.; Cohen, I. Pearson Correlation Coefficient. In Noise Reduction in Speech Processing; Springer: Berlin/Heidelberg, Germany, 2009. [Google Scholar]
  45. Li, P.; Mi, D. Distribution of snow cover in China. J. Glaciol. Geocryol. 1983, 5, 9–18. [Google Scholar]
  46. Peng, S.; Piao, S.; Ciais, P.; Friedlingstein, P.; Zhou, L.; Wang, T. Change in snow phenology and its potential feedback to temperature in the Northern Hemisphere over the last three decades. Environ. Res. Lett. 2013, 8, 014008. [Google Scholar] [CrossRef]
  47. Brown, R.D.; Robinson, D.A. Northern Hemisphere spring snow cover variability and change over 1922–2010 including an assessment of uncertainty. Cryosphere 2011, 5, 219–229. [Google Scholar] [CrossRef]
  48. Wang, A.; Xu, L.; Kong, X. Assessments of the Northern Hemisphere snow cover response to 1.5 and 2.0 °C warming. Earth Syst. Dyn. 2018, 9, 865–877. [Google Scholar] [CrossRef]
  49. Choi, G.; Robinson, D.A.; Kang, S. Changing Northern Hemisphere Snow Seasons. J. Clim. 2010, 23, 5305–5310. [Google Scholar] [CrossRef]
  50. Wang, X.; Wu, C.; Wang, H.; Gonsamo, A.; Liu, Z. No evidence of widespread decline of snow cover on the Tibetan Plateau over 2000–2015. Sci. Rep. 2017, 7, 14645. [Google Scholar] [CrossRef]
  51. Whetton, P.; Haylock, M.; Galloway, R. Climate change and snow-cover duration in the Australian Alps. Clim. Change 1996, 32, 447–479. [Google Scholar] [CrossRef]
  52. Morán-Tejeda, E.; López-Moreno, J.I.; Beniston, M. The changing roles of temperature and precipitation on snowpack variability in Switzerland as a function of altitude. Geophys. Res. Lett. 2013, 40, 2131–2136. [Google Scholar] [CrossRef]
  53. Bi, Y.; Xie, H.; Huang, C.; Ke, C. Snow Cover Variations and Controlling Factors at Upper Heihe River Basin, Northwestern China. Remote Sens. 2015, 7, 6741–6762. [Google Scholar] [CrossRef]
  54. Qin, S.; Xiao, P.; Zhang, X. How do snow cover fraction change and respond to climate in Altai Mountains of China? Int. J. Climatol. 2022. [Google Scholar] [CrossRef]
Figure 1. (a) Diurnal variation in average snow cover area (SCA), temperature, and total precipitation from 1 September 2000 to 31 August 2020, (b) monthly variations in average snow cover area (SCA), snow cover days (SCD), temperature, and total precipitation, (c) interannual variabilities of average snow cover area (SCA) and days (SCD), start (SCS), and melt (SCM) in China (CHN) from 2000/2001 to 2019/2020. The dotted line indicates parameters’ trend. Gray shade is snow season.
Remotesensing 14 03936 g001
Figure 2. Average of (a) days (SCD); (c) start (SCS); and (e) melt (SCM) of snow cover for 2000–2020. Trend of (b) days (SCD); (d) start (SCS); and (f) melt (SCM) of snow cover for 2000–2020; opaque pixels indicate trends significant at the 95% level.
Remotesensing 14 03936 g002
Figure 3. The percentage of different slopes for snow cover days (SCD), start (SCS), and melt (SCM) in China.
Remotesensing 14 03936 g003
Figure 4. On the classification of snow cover in China and the percentage of each area.
Remotesensing 14 03936 g004
Figure 5. Correlation between snow cover days (SCD) and (a) autumn; (c) winter; and (e) spring average temperature and correlation between SCD and (b) autumn; (d) winter; and (f) spring sum precipitation for 2000/2001–2019/2020. Opaque pixels indicate correlation significant at the 95% level.
Remotesensing 14 03936 g005
Figure 6. Correlation between snow cover start (SCS) and autumn (a) average temperature and (b) sum precipitation and correlation between snow cover melt (SCM) and (c) mean temperature and (d) sum precipitation for 2000/2001–2019/2020. Opaque pixels indicate correlation significant at the 95% level.
Remotesensing 14 03936 g006
Figure 7. Correlation between snow cover days (SCD) and climate factors (average temperature and sum precipitation in autumn, winter, and spring), correlation between snow cover start (SCS) and climate factors in autumn, and correlation between snow cover melt (SCM) and climate factors in spring at different altitudes in China (CHN), especially in the stable snow-covered areas (SSA).
Remotesensing 14 03936 g007
Table 1. NIEER CGF MODIS SCE dataset details.
Data CategoriesValueRemark
Land0No snow pixels inland
Snow1Snow identified by the snow identification algorithm
2Snow identified by Hidden Markov spatiotemporal model interpolation
3Snow identified by microwave snow depth interpolation
Water4Water
No data255No data
Table 2. NIEER MODIS SCP product details.
SCPValue RangeNo DataWaterRemark
SCD0–365/366−1−255The value represents the cumulative snow days per hydrological year.
SCS0–365/366−1−255The value represents the n-th day from the 1st of September of each year, and the area with a value of 0 is not discussed.
SCM0–365/366−1−255
Table 3. Statistical results of the average values and slopes of snow cover days (SCD), start (SCS), and melt (SCM) for different snow types.
Snow TypesAverageSlope (d/y)
SCD (d)SCS (DOY)SCM (DOY)SCDSCSSCM
SSA137.2967.28226.04−0.16−0.09−0.22
APA39.6785.99148.91−0.17−0.11−0.85
NPA6.7535.7042.33−0.14−0.44−0.59
SFA0.100.320.370.000.000.00
Table 4. Areas with different correlations as a percentage (%) of the total area in China (CHN).
SCPMeteorological FactorsNegative CorrelationSignificant Negative CorrelationNo Significant Negative CorrelationPositive CorrelationSignificant Positive CorrelationNo Significant Positive Correlation
SCDAutumn_T78.6618.2660.4014.560.2114.35
Winter_T89.0751.2237.854.150.054.10
Spring_T71.0122.2948.7322.210.3121.90
Autumn_P28.560.2928.2764.668.4856.18
Winter_P57.523.0054.5135.711.0734.64
Spring_P49.053.9345.1344.172.4741.70
SCSAutumn_T31.651.2730.3954.3813.0941.28
Autumn_P55.827.1148.7130.211.2528.96
SCMSpring_T65.0019.6345.3721.060.4020.66
Spring_P40.062.0538.0146.002.9043.10
Table 5. Correlation between snow cover days (SCD) and climate factors (average temperature and sum precipitation) in autumn, winter, and spring; correlation between snow cover start (SCS) and climate factors in autumn; and correlation between snow cover melt (SCM) and climate factors in spring in different snow-covered area classification.
SCPSnow TypesAutumn_TAutumn_PWinter_TWinter_PSpring_TSpring_P
SCDCHN−0.30−0.11−0.38−0.50−0.48−0.03
SSA−0.370.30−0.42−0.07−0.66−0.01
APA−0.23−0.13−0.48−0.38−0.22−0.02
NPA−0.34−0.21−0.55−0.37−0.210.06
SCSCHN0.27−0.42
SSA0.69−0.52
APA0.510.08
NPA−0.07−0.38
SCMCHN−0.33−0.08
SSA−0.750.09
APA−0.35−0.18
NPA−0.14−0.03
Table 6. Areas with different elevations as a percentage (%) of the total area in China (CHN) or in the stable snow-covered areas (SSA).
Elevation (m)CHNSSAElevation (m)
Percentage (%) 1Percentage (%) 2Percentage (%) 3
<00.400.010.00
0–50027.3527.376.19
500–100016.4925.305.72
1000–150018.298.361.89
1500–20006.633.140.71
2000–25003.031.770.40
2500–30002.971.650.37
3000–35002.751.950.44
3500–40003.073.230.73
4000–45004.515.321.20
4500–50008.239.282.10
5000–55005.229.122.06
5500–60000.953.050.69
>60000.110.470.11
1 In China, the area of each elevation as a percentage of the total area of China. 2 In SSA, the area of each elevation as a percentage of the total SSA. 3 In SSA, the area of each elevation as a percentage of the total area of China.
Publisher’s Note: MDPI stays neutral with regard to jurisdictional claims in published maps and institutional affiliations.

