Article

AUnet: A Deep Learning Framework for Surface Water Channel Mapping Using Large-Coverage Remote Sensing Images and Sparse Scribble Annotations from OSM Data

1
Faculty of Information Technology, Beijing University of Technology, Beijing 100124, China
2
Faculty of Engineering and Computer Science, National University of Modern Languages, Islamabad 44000, Pakistan
3
Key Laboratory of Beibu Gulf Offshore Engineering Equipment and Technology, Beibu Gulf University, Education Department of Guangxi Zhuang Autonomous Region, Qinzhou 535011, China
4
Khalifa University Center for Autonomous Robotic Systems (KUCARS), Khalifa University of Science and Technology, Abu Dhabi 127788, United Arab Emirates
5
Department of Electrical Engineering and Computer Science, Khalifa University of Science and Technology, Abu Dhabi 127788, United Arab Emirates
6
Department of Geography, University of Hong Kong, Hong Kong, China
7
College of Mathematics and Computer Science, Zhejiang Normal University, Jinhua 321004, China
8
Department of Biomedical Engineering, Khalifa University of Science and Technology, Abu Dhabi 127788, United Arab Emirates
*
Author to whom correspondence should be addressed.
Remote Sens. 2022, 14(14), 3283; https://doi.org/10.3390/rs14143283
Submission received: 7 June 2022 / Revised: 30 June 2022 / Accepted: 1 July 2022 / Published: 8 July 2022
(This article belongs to the Special Issue Earth Observation Using Satellite Global Images of Remote Sensing)

Abstract

:
Water is a vital component of life that exists in a variety of forms, including oceans, rivers, ponds, streams, and canals. The automated methods for detecting, segmenting, and mapping surface water have improved significantly with the advancements in satellite imagery and remote sensing. Many strategies and techniques to segment water resources have been presented in the past. However, due to the variant width and complex appearance, the segmentation of the water channel remains challenging. Moreover, traditional supervised deep learning frameworks have been restricted by the scarcity of water channel datasets that include precise water annotations. With this in mind, this research presents the following three main contributions. Firstly, we curated a new dataset for water channel mapping in the Pakistani region. Instead of employing pixel-level water channel annotations, we used a weakly trained method to extract water channels from VHR pictures, relying only on OpenStreetMap (OSM) waterways to create sparse scribbling annotations. Secondly, we benchmarked the dataset on state-of-the-art semantic segmentation frameworks. We also proposed AUnet, an atrous convolution inspired deep learning network for precise water channel segmentation. The experimental results demonstrate the superior performance of the proposed AUnet model for segmenting using weakly supervised labels, where it achieved a mean intersection over union score of 0.8791 and outperformed state-of-the-art approaches by 5.90% for the extraction of water channels.

1. Introduction

With the progressive advancement of remote sensing technology, imagery acquired via remote sensors (mounted on unmanned aerial vehicles (UAVs) or satellites) has significantly contributed towards disaster/emergency management, object detection, and urban/rural planning systems [1,2]. As a result, in order to effectively support various spatial applications, it is necessary to extract and segment the inland water and water channel canal network.
Surface water mapping has long been a popular use of remote sensing. Previously, researchers presented numerous automated and semiautomatic frameworks centered on rule-based solutions [3,4,5], machine learning algorithms [6,7], and a hybrid of these two techniques [8]. More recently, the work has been conducted through deep learning algorithms as well [9,10,11,12,13]. In general, rule-based solutions establish fixed thresholds about specific spectral channels or leverage multiband indices, while machine learning algorithms tweak learnable parameters on data to develop optimal class separations [9]. One issue with present water index-based methods is that the optimal threshold levels defined to differentiate water and nonwater classes vary greatly depending on the portion of the globe being scanned, limiting their worldwide applicability [9]. Other advanced rule-based solutions that generate superior water maps [4,5] require complicated rules and contextual information to tackle these issues, such as glacier inventory datasets, digital elevation models, and moderate-resolution imaging spectroradiometer (MODIS) data. However, despite employing an optimal threshold for a certain region, significant differentiation problems persist in rule-based solutions related to water, snow, and terrain shadows [5].
Moreover, several machine learning and deep learning methods have been investigated in the literature to develop algorithms capable of reliably classifying water bodies [7,8,9,10,11,12,13]. In addition, the multispectral water index (MuWI) and machine learning algorithms have been employed to determine accuracy rather than a threshold method, yielding comparable results in flood mapping [14]. Furthermore, many methods based on standard artificial neural networks (ANNs) learn the spectral properties of water pixels without considering geometry and surface texture. While such methods have been effective at regional and local scales, generalizing them to the global scale has been problematic, given that water and land features differ significantly among geographies [3,9].
Recent advancements in ANN research have demonstrated the efficacy of deep learning methods in handling various segmentation [15,16,17], detection [18,19,20,21], and classification [22,23] tasks. In particular, the use of convolutional neural networks (CNNs) has resulted in substantial progress in image recognition [24]. Recent approaches for training end-to-end CNNs have allowed per-pixel annotation of images [16], thus significantly improving the state-of-the-art (SOTA) methods to perform semantic image segmentation [25,26,27,28]. The success of CNNs can be attributed to the convergence of novel network architectures capable of learning hierarchies of features with excellent generalization potential, the accessibility of huge datasets, and fast hardware processing. Generally, large datasets comprising images of daily settings, such as Microsoft COCO [29] and ImageNet [24], have been used in numerous image recognition applications [30]. However, there is still room for improvement for CNN applications using large-scale remote sensing datasets, such as the Landsat archives [9]. Despite certain promising research on remote sensing using CNNs [31,32,33], including some denser deep learning models for interesting classification tasks [34,35], the possibility of employing very large-scale Landsat images, even on a global scale, has yet to be fully explored.
Landsat archives feature remotely sensed data with worldwide coverage for more than four decades and are freely accessible. Landsat 8 (L8), a present Landsat satellite, requires 16 days to complete a full trip around the Earth, including an 8-day relative offset. As a result, Landsat imagery can update the surface water maps every 8 days. However, the scarcity of accurately labeled Landsat data has limited the usefulness of CNNs for surface water mapping and related applications. The Global Land Cover Facility (GLCF) recently publicized a global inland water dataset [5], created by utilizing a variety of methodologies and data, including MODIS-based water mask, Landsat water, vegetation indices, and topography indices from digital elevation models.
In this paper, we adopt deep learning techniques that have previously been effectively employed for the semantic segmentation of daily images for the segmentation of water channels. For this purpose, we curated a local dataset using multispectral Landsat imagery and OpenStreetMap (OSM) to generate the ground-truth labels in the form of scribble annotations of the water channels, as shown in Figure 1c. OSM provides centerlines of the water channels, which are easy to obtain compared to pixel-level annotations (Figure 1b) that are time-consuming, labor-intensive, and expensive.
Moreover, we specifically treat water extraction as an image segmentation task and use similarities between daily-life photos and remotely sensed images while compensating for discrepancies in the proposed CNN topology. We demonstrate that water bodies can be reliably mapped and segmented at the global scale with an adequately trained end-to-end CNN on multispectral Landsat imagery and their corresponding annotations. The major contributions of the research are five-fold, which are as follows:
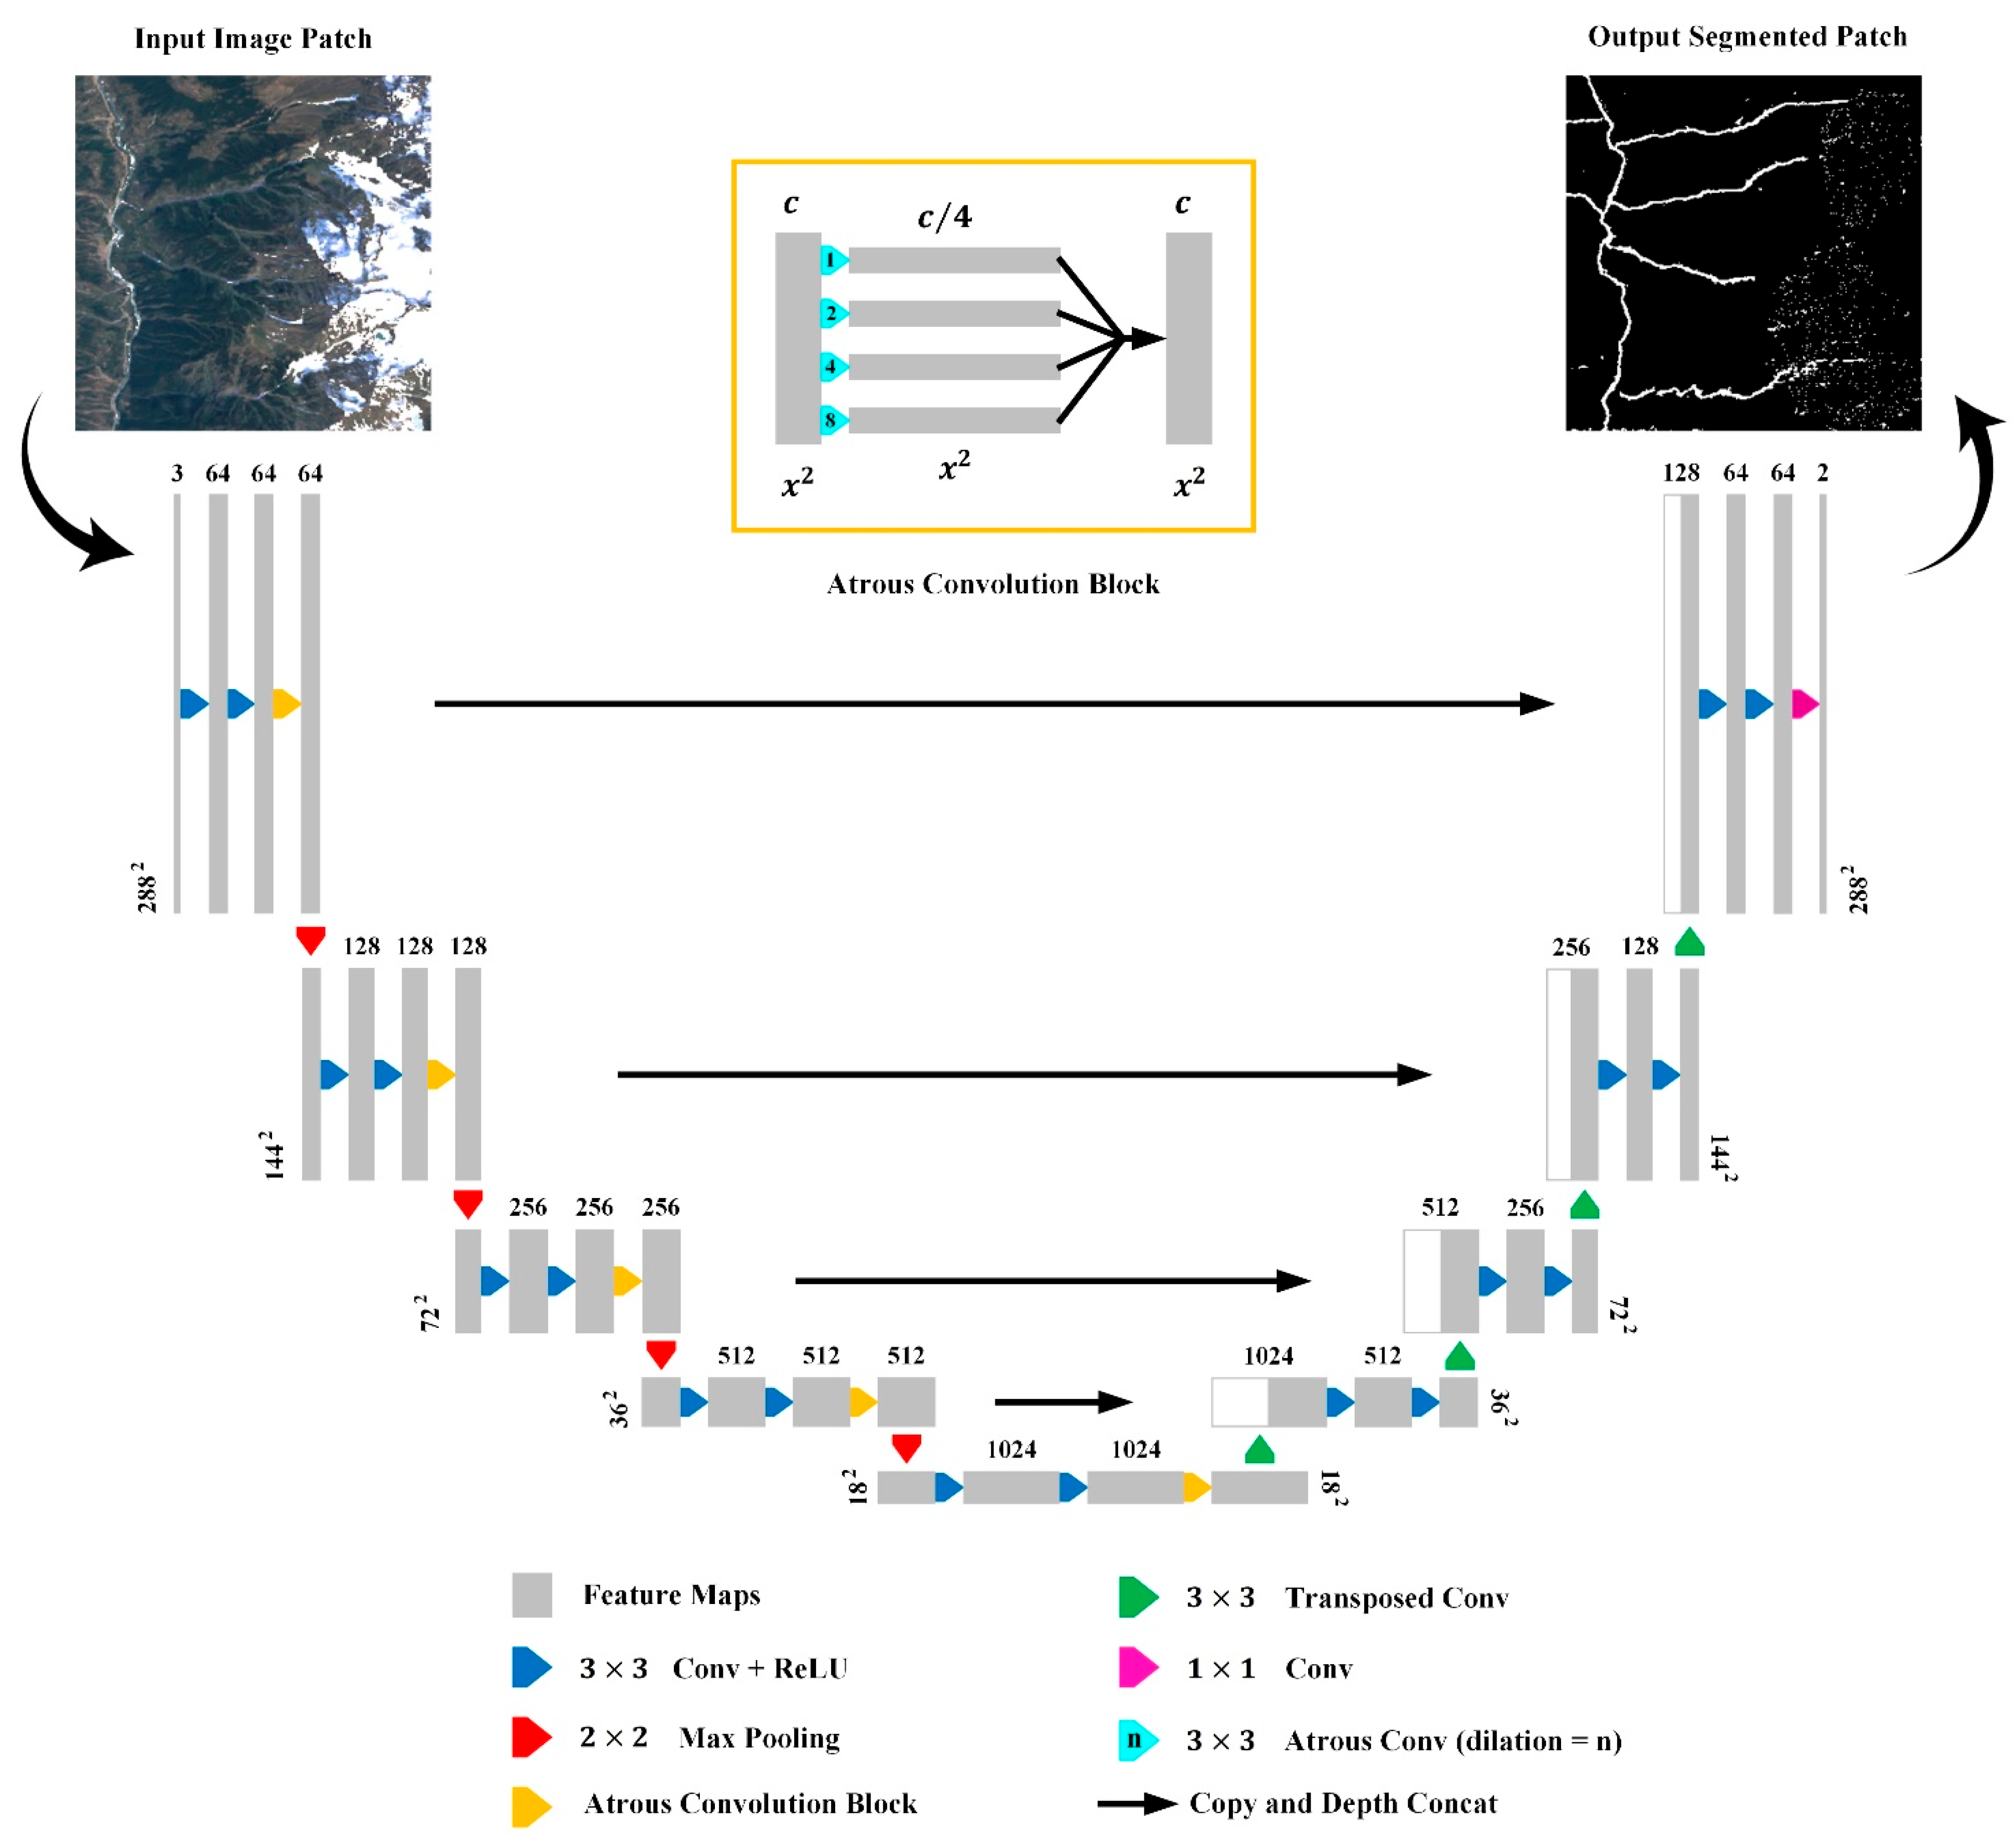
  • We present a novel CNN-based architecture termed AUnet to perform semantic segmentation and surface water mapping at multiple scales using very high-resolution (VHR) multispectral imagery. The proposed AUnet architecture is inspired by a well-known encoder–decoder model (U-net [25]), yet it contains critical variations that tailor our model to the intended application, including atrous convolution blocks at each encoder level, evaluation at a large range of scales, and the layer-to-layer connectivity.
  • The integrated atrous convolution blocks in the proposed AUnet model enable encoding the geometrical, textural, and spectral properties of water bodies in their global context. These properties aid in distinguishing water from the cloud, ice, snow, and landscape shadows, unlike the need for a local variable threshold in traditional rule-based systems.
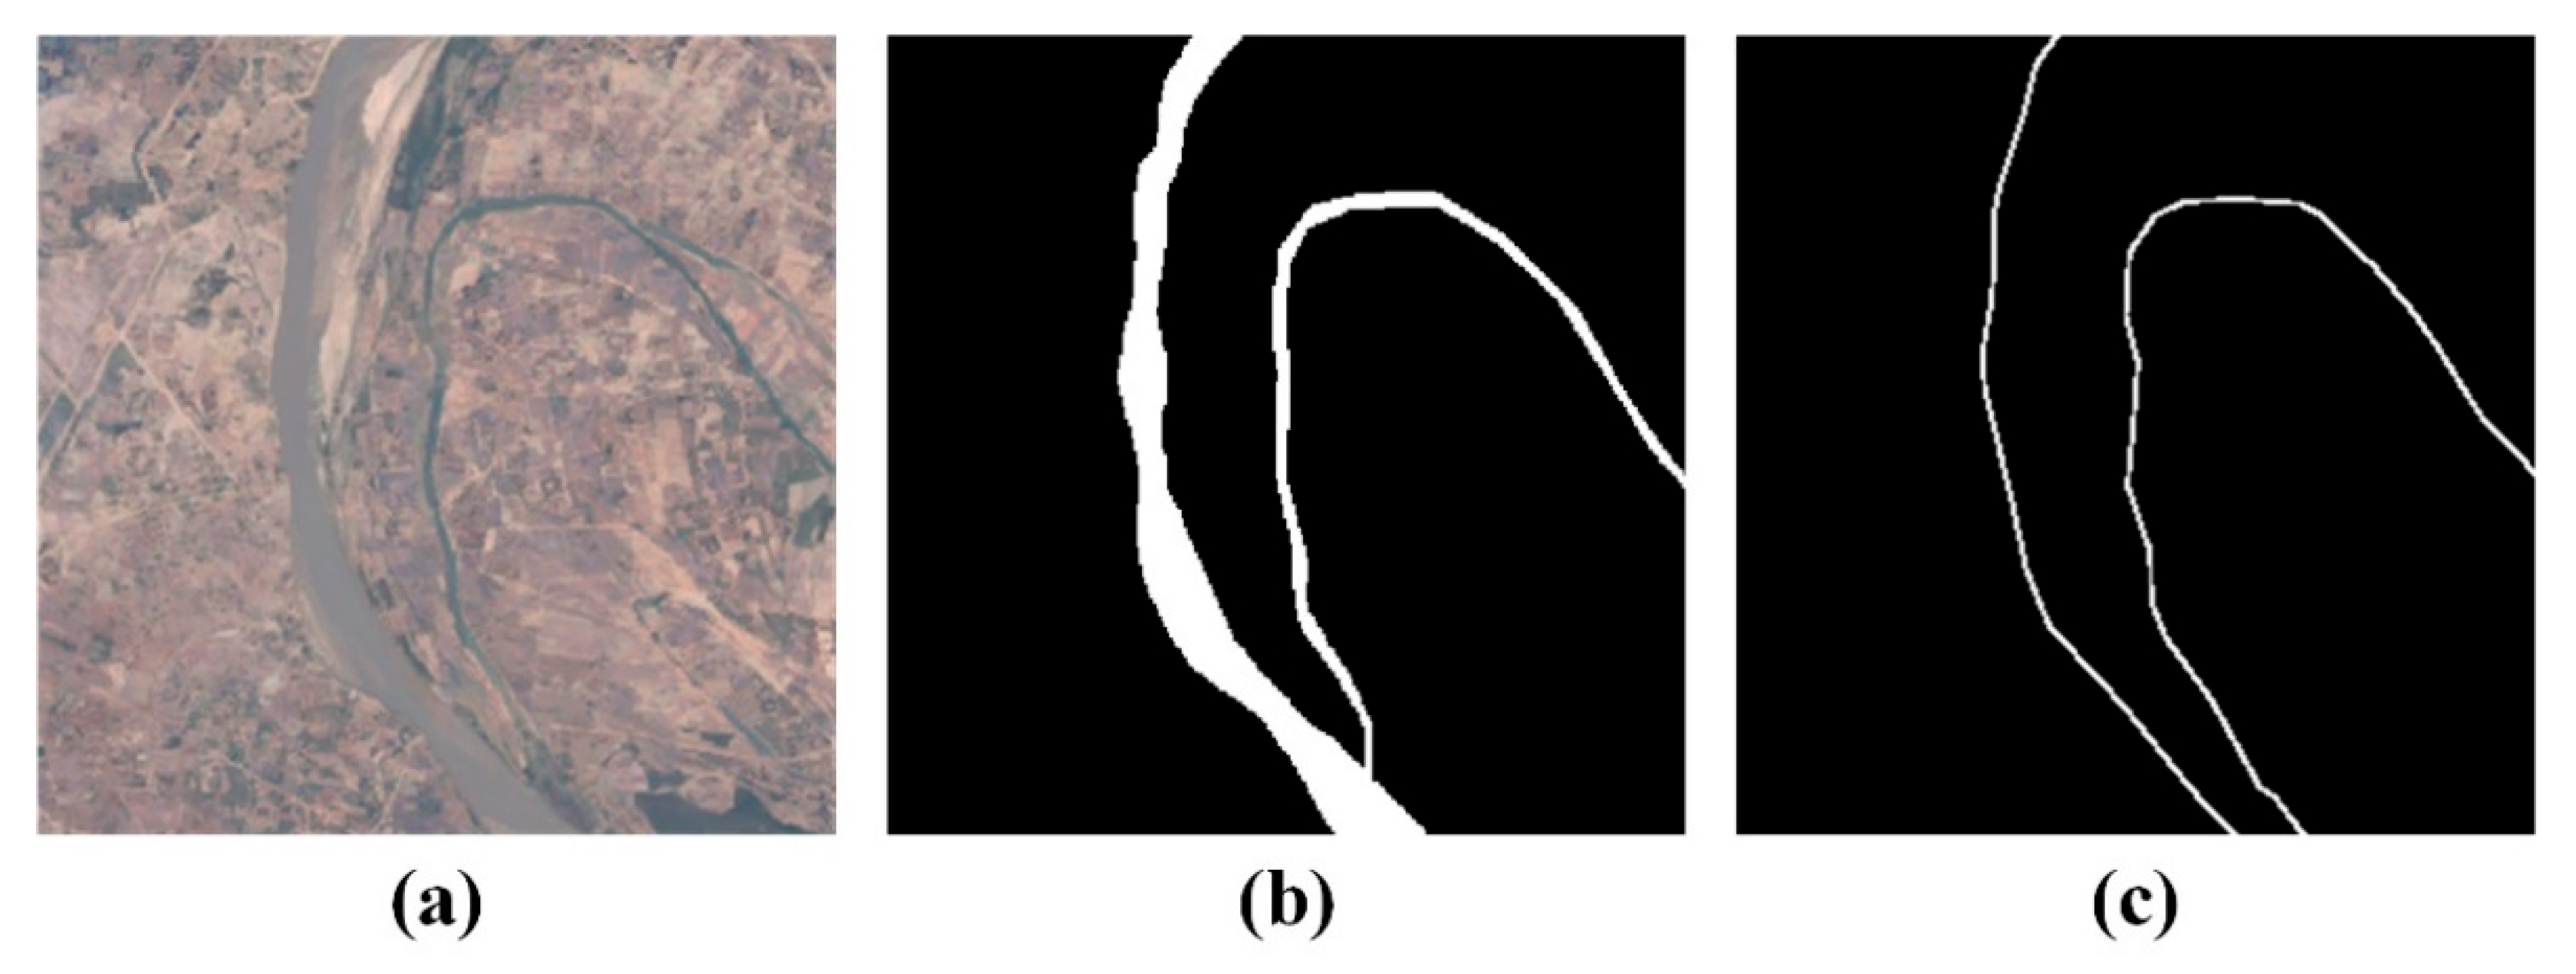
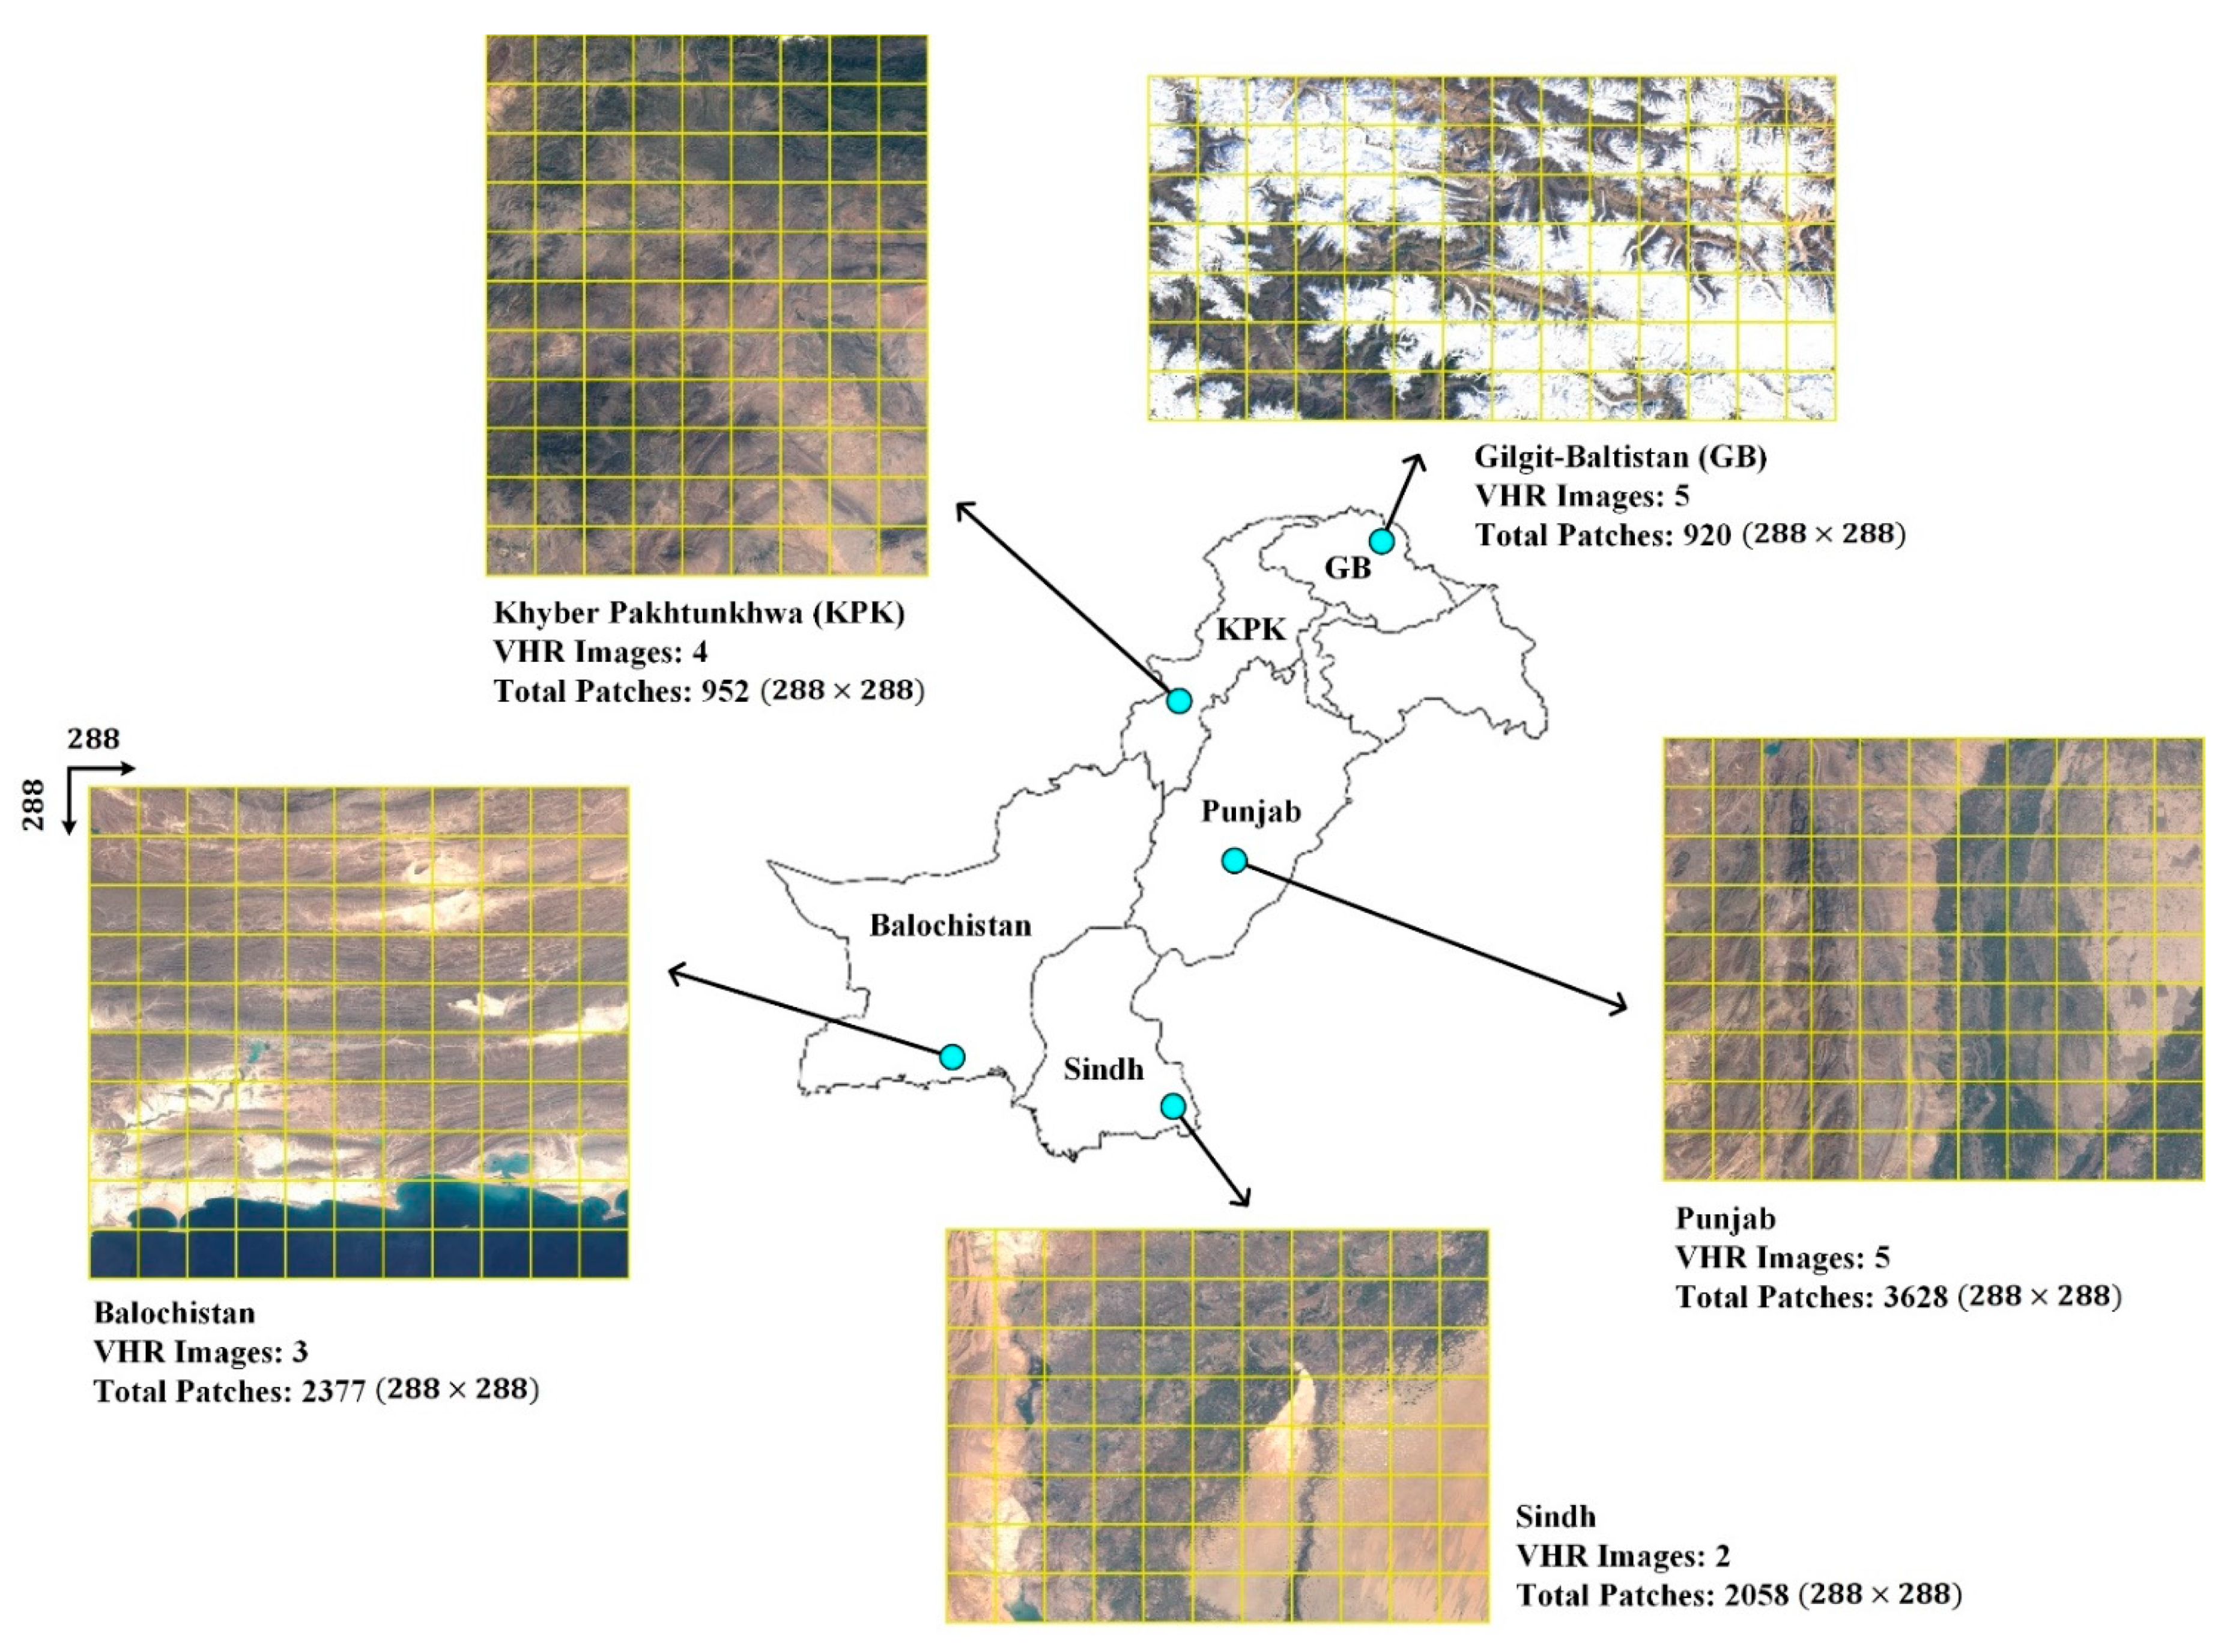
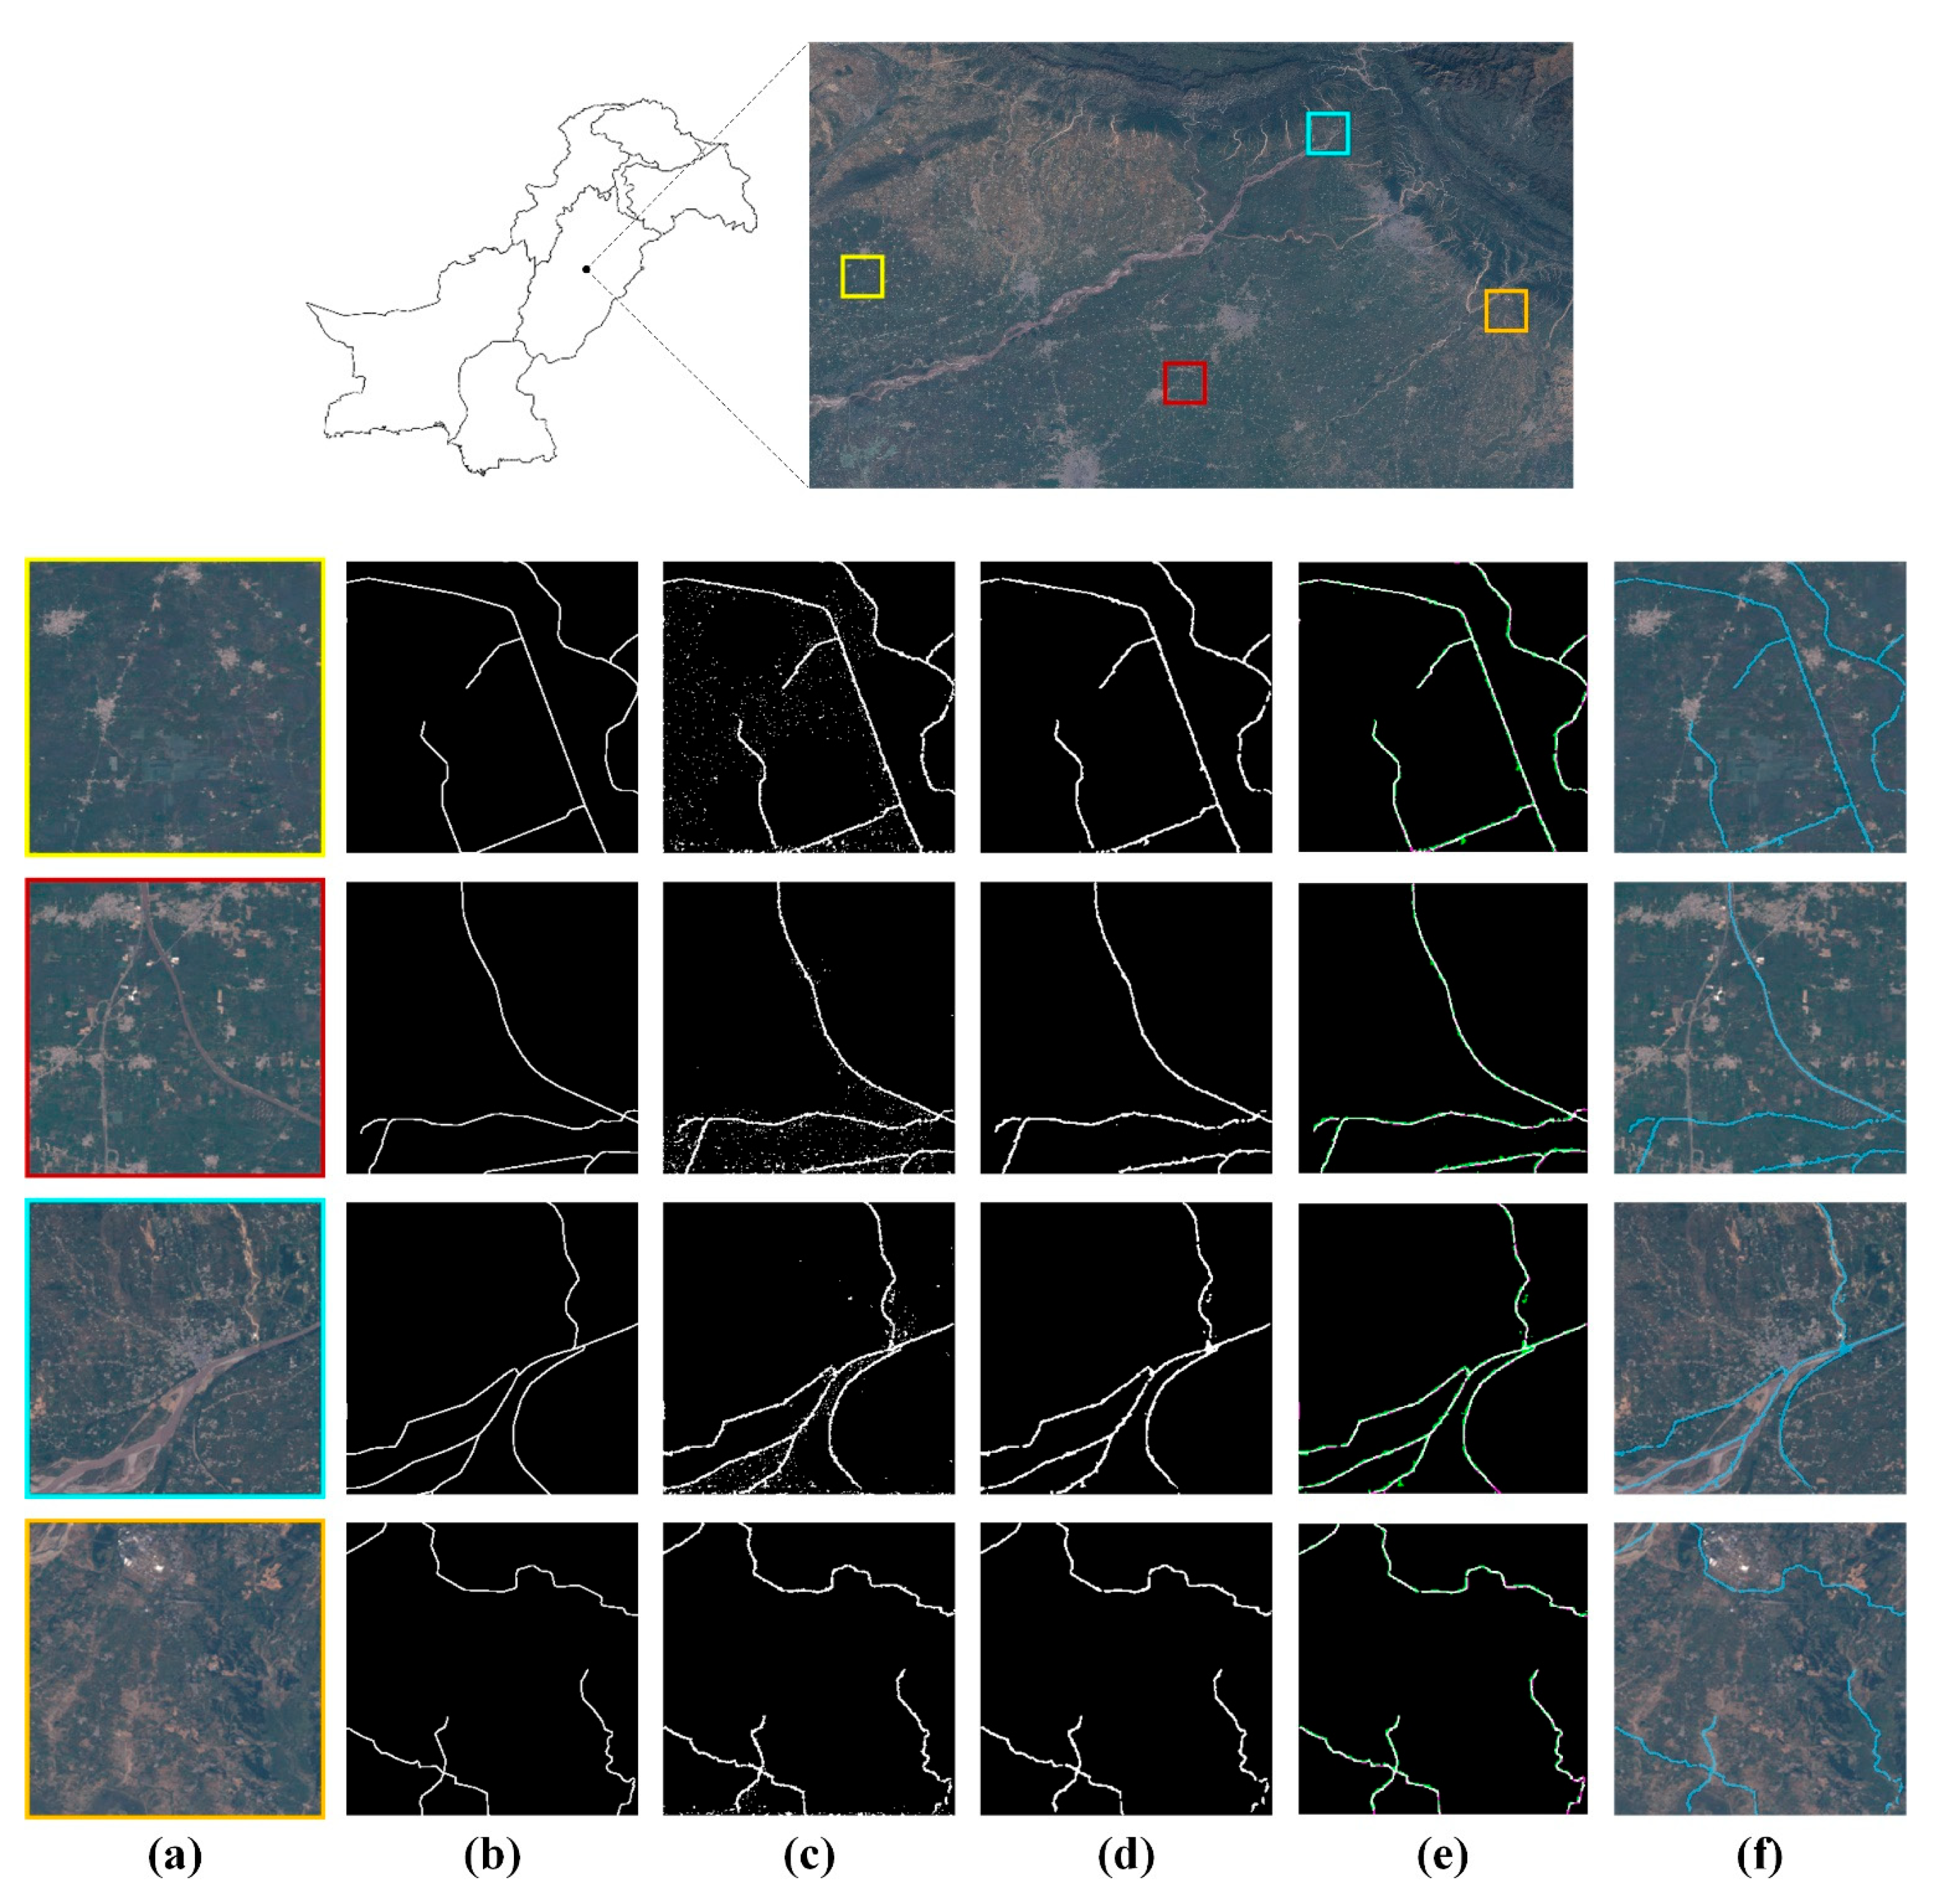
  • We introduce a novel water channel dataset derived from the Landsat imagery of the Pakistan region, which is used for training and validation purposes of the proposed model. Moreover, the corresponding water channel ground truths are arranged using the OSM mapping tool, which helps generate weakly supervised and scribble annotations (centerlines) of water channels. The newly curated dataset offers a diversified landscape and can serve as a basis for large-scale training, facilitating further works relevant to deep-learning-based water channel segmentation and mapping.
  • We introduce a simple yet effective postprocessing mechanism based on median filtering and convolutional blurring to remove the noisy and stray pixels and further improve the AUnet model’s segmentation performance by 2.48%.
  • The segmentation performance of AUnet is evaluated both qualitatively and quantitatively, where it produced outstanding water mapping results. The proposed framework outperformed other SOTA solutions with a 0.8791 mean intersection over union score, achieving 3.23% higher water channel segmentation accuracy.
The remaining paper is structured as follows: Section 2 presents the dataset details used in this study, Section 3 details the proposed methodology adopted in this research and AUnet architectural design. Section 4 explains the experimental setup and network training details. The simulation results are demonstrated in Section 5, and Section 6 concludes the paper.

2. Dataset Details

2.1. Dataset Curation and Preprocessing

In this study, we curated a local dataset of water channels in Pakistan. The choice of the study area is due to the scarcity of similar studies for training and validation across Pakistan. The dataset was prepared using the L8 satellite imagery from the Landsat program, which is a collaborative project between the United States Geological Survey (USGS) and the National Aeronautics and Space Administration (NASA) [36]. Since 1972, the Landsat program has been continually monitoring the Earth. The Landsat satellites provide thermal and hyperspectral data every two weeks by imaging the whole Earth’s surface at 30 m resolution [37,38].
The L8 satellite was launched in February 2013. It consists of the Operational Land Imager (OLI) camera and the Thermal Infrared Sensor (TIRS), which may be used to investigate the temperature of the Earth’s surface and observe global warming [36,37,38]. L8 works in the visible light and various infrared spectrum bands to provide decent-resolution imaging of the Earth’s terrestrial region and polar areas ranging between 15 and 100 m. It collects over 700 images per day, increasing from 250 images each day on Landsat 7. The signal-to-noise radiometric (SNR) performance of the OLI and TIRS sensors is also increased, allowing for 12-bit quantization of data and additional bits for effective land characterization [36,37,38]. It contributes to Copernicus land monitoring investigations, which include plant observation, soil and water cover, detection of land cover change, coastal regions, and local waterways [36,37,38].
The exact preprocessing approach is detailed in [39], which is based on the rapid combination of multitemporal data and pixel-wise detection of the cloud. Figure 2 shows the specific distribution of regions in the study area of Pakistan, along with their VHR samples and the total number of patches in each region.

2.2. Weakly Supervised Technique for Generating Ground-Truth Labels

The word weakly is used to deliberately claim that our work may be termed as weakly supervised since we used the OSM tool to generate the corresponding ground-truth labels of the water channels. The OSM is a free online mapping project [40] that is weakly defined in developing countries such as Pakistan compared to developed countries. Thus, the proposed dataset may better be referred to as a weakly labeled dataset. Moreover, the OSM-based ground-truth data only provides the centerline annotations instead of the entire water region. Hence, if the training dataset is weakly labeled, i.e., does not provide complete (pixel-wise) annotations, or lacks some information, the semantic segmentation task should also be referred to as weakly supervised.
The purpose of OSM is to produce a free-to-edit worldwide atlas with simple navigation tools for popular mobile devices. Users using portable navigation systems, aerial images, satellite data, and other free information may contribute to OSM maps. Users may even engage in the design if they have some knowledge of the subject matter. The map’s vector data are approved under open dataset authorization. In actuality, because of how OSM data are created, groundwater channel characteristics may be inconsistent with the OSM data. Demetriou’s study [41] has demonstrated the inconsistency of OSM data. However, these discrepancies are regarded as permissible in a massive water channel extraction task. Moreover, OSM is rasterized because it is a vector database.
In this study, we assumed that the overall length and size of the water canals remain the same between 1 January 2021 and 1 December 2021, and based upon this assumption, we took the median value of each water pixel to obtain full coverage hyperspectral data of the study area in 2021. Adopting this strategy of averaging pixel values may also help prevent oversaturation and poor vegetation levels with strong physiological and morphological variations [42]. Furthermore, considering the subpixel extraction accuracy and resolution of the L8 data pixels, a buffer with a radius of 20 m was created in 2021 using the OSM data, representing the water channel region pixels with one and the non-water channel area pixels with zero. Moreover, we employed the random forest approach [43] for land cover classification, which was performed using the Google Earth Engine (GEE) platform. Finally, in the study region, we layered all of the extracted and processed data and split them into equally sized blocks ( 288 × 288 size patches). The data were patched according to the VHR images. Table 1 contains information about the dataset utilized for training and validation in the proposed research.

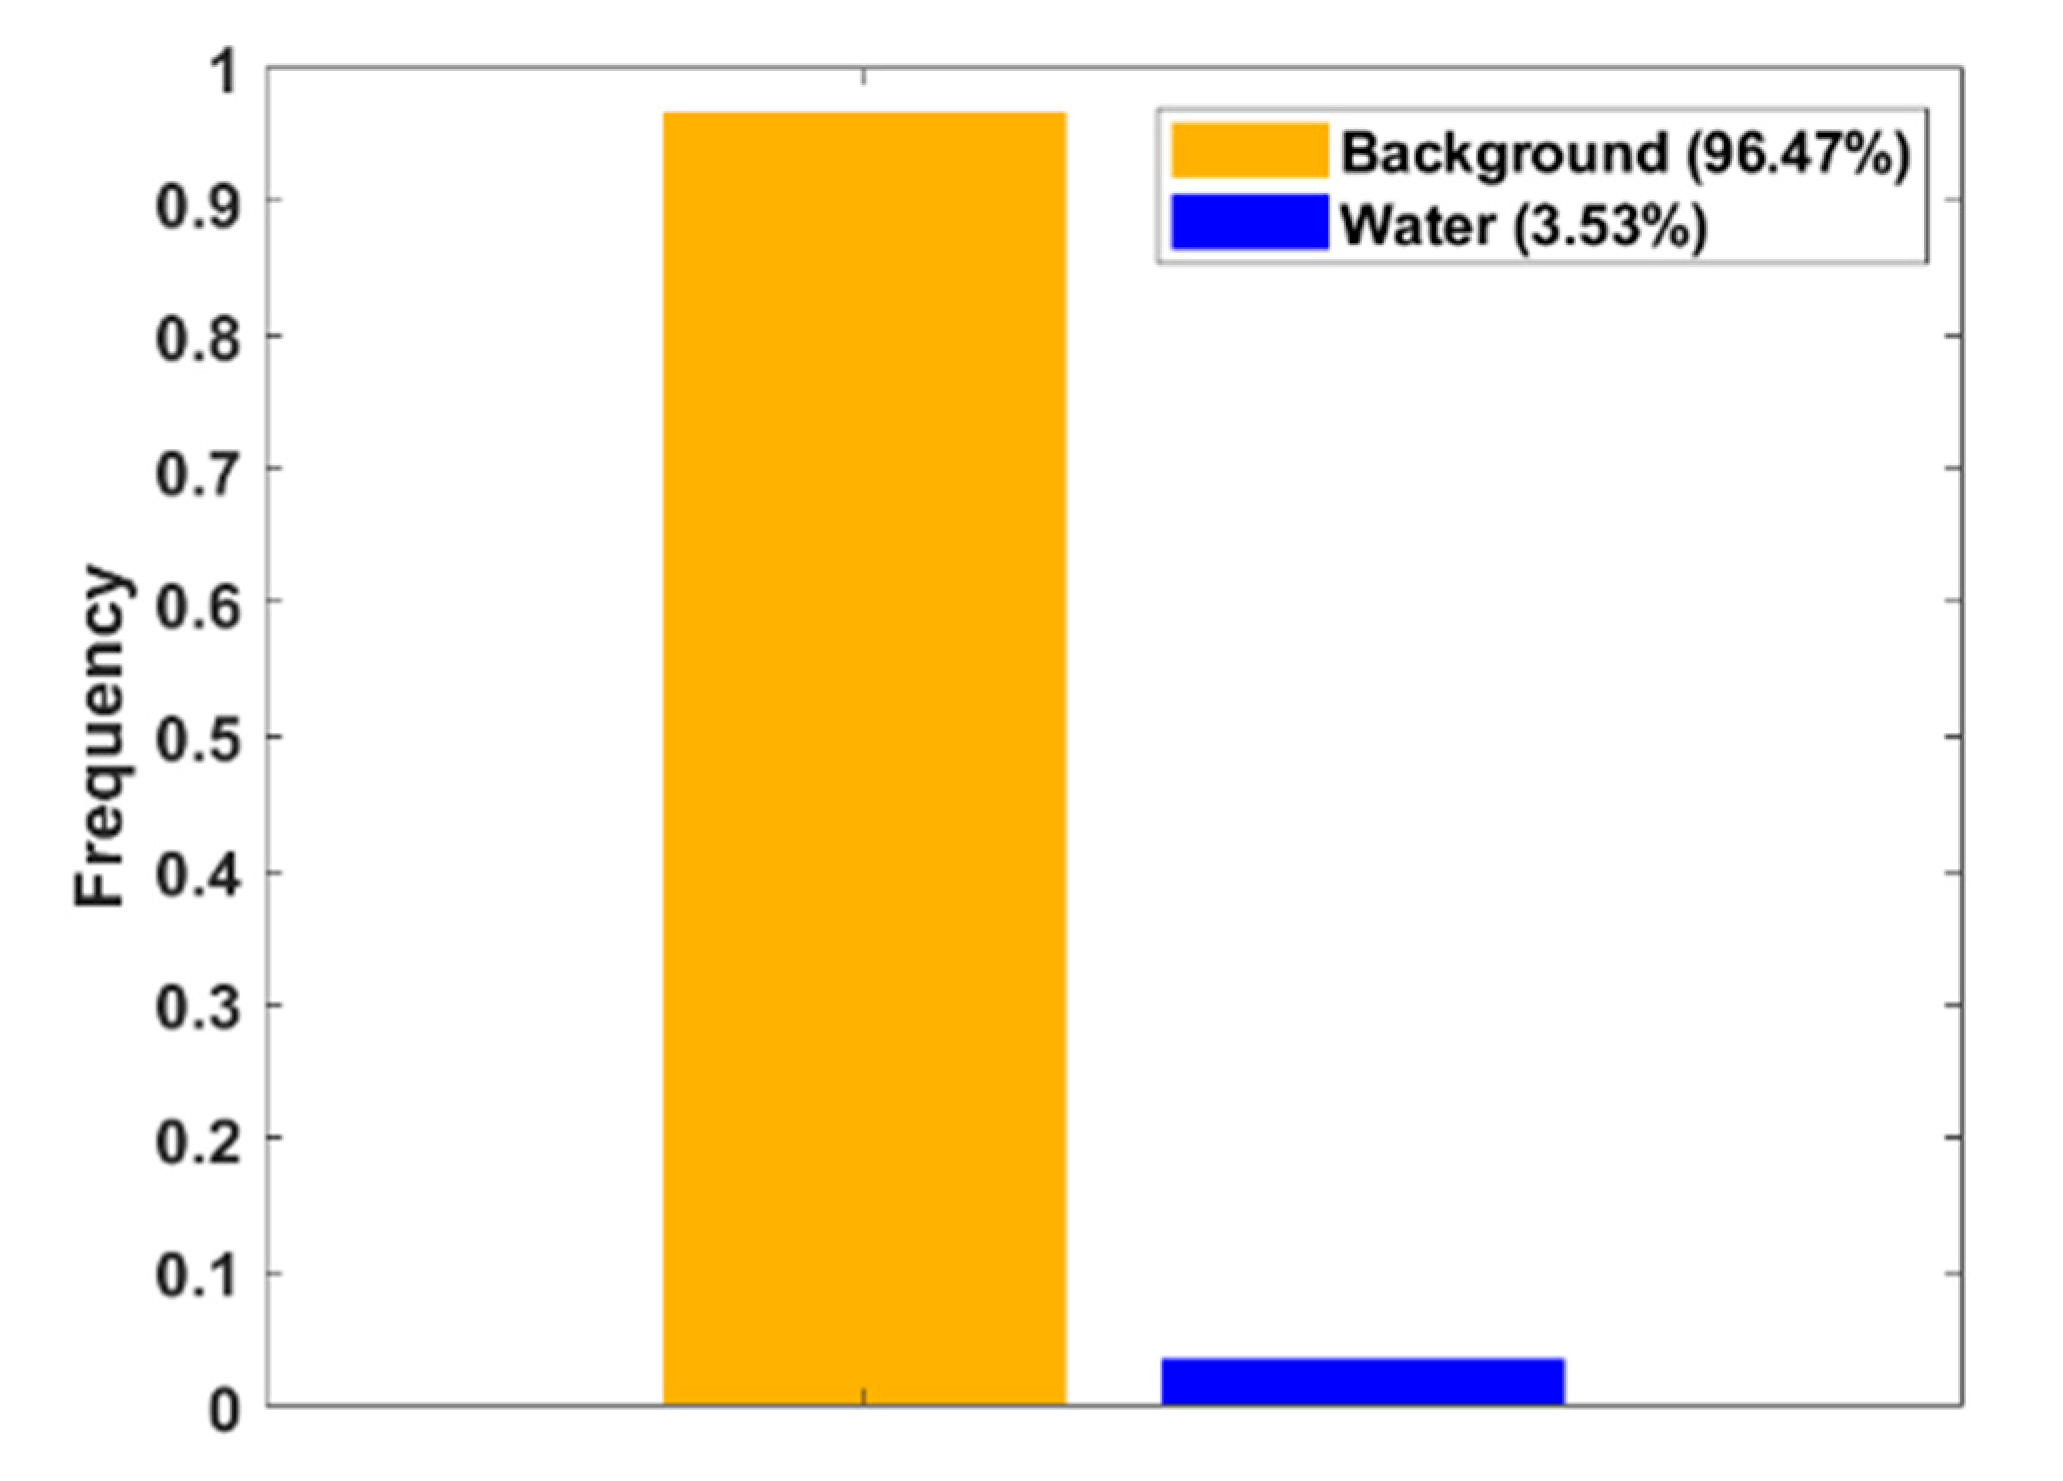
2.3. Pixel Label Balancing

After obtaining the training labels, we analyzed the frequency of water and background pixels. Ideally, there should be no difference in the frequency of pixels belonging to different classes in the training data. However, the training pixel frequencies in our dataset for both classes (background and water) are significantly imbalanced, as shown in Figure 3. This is due to the fact that the background region takes up the most space in the image patch as compared to water channel pixels.
As a result, there is a need to rectify the imbalance since the network learning process is skewed toward the dominant class, and this imbalance might severely affect the learning process. To overcome this and balance out the water class pixels, we used the inverse frequency weighting that computes each class weight by taking the inverse of the corresponding class frequency as expressed in Equations (1) and (2):
C w = 1 F r e q ,  
F r e q = P T p ,
where C w signifies the class weights given in the AUnet model’s final layer to compensate for the class imbalance, P denotes the number of pixels for an individual class, and T p represents the total pixels in the training dataset.

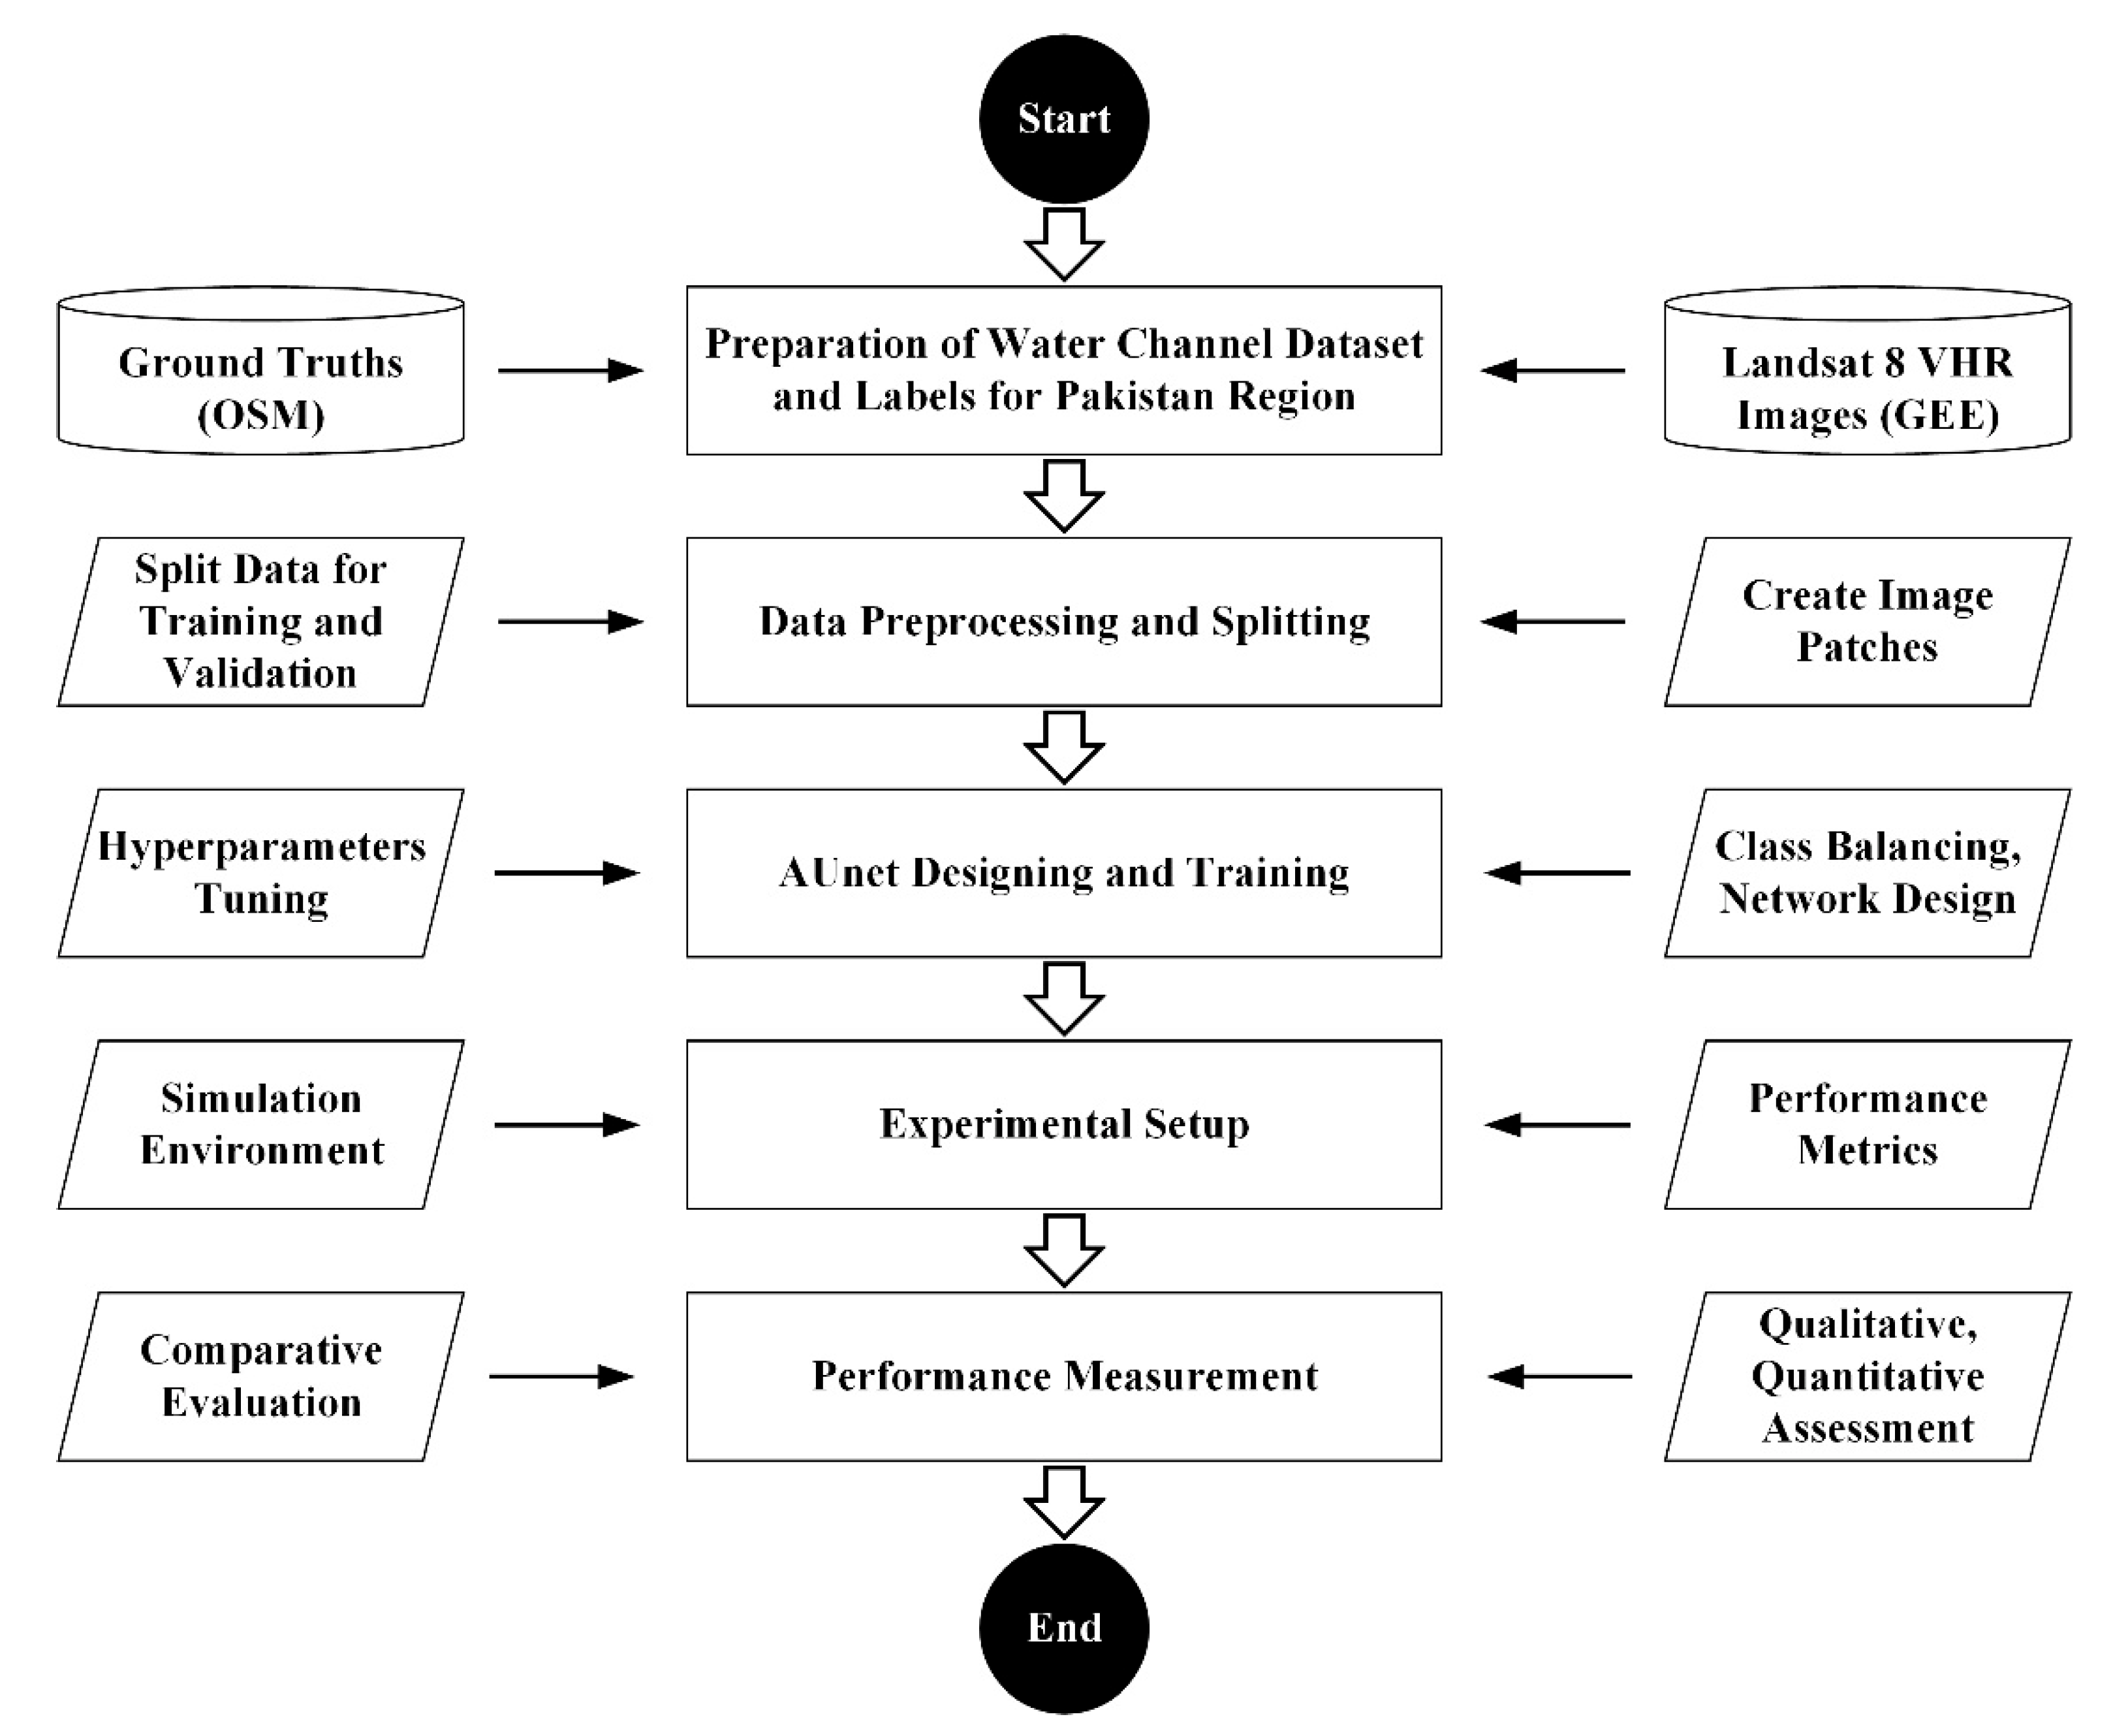
3. Proposed Methodology

In this work, we propose a deep-learning-based framework called AUnet for the extraction of water channels using the VHR satellite imagery. Moreover, we curated a local dataset in the study area of Pakistan for training and validation purposes. Figure 4 shows the high-level overview of the working flow of the proposed method. Further, the details on the dataset, preprocessing, and network architecture are presented in the subsequent subsections.

3.1. AUnet Network Architecture

In the proposed work, the original VHR satellite images are split into 288 × 288 size patches, which serve as the network training and validation data, as shown in Table 1. Moreover, the proposed AUnet is designed to preserve the detailed spatial information in the input data, considering the natural properties of the water channels, such as fine connectivity and complex patterns in the varying terrains of mountains, lands, forests, and plateaus. The AUnet architecture is illustrated in Figure 5. It is inspired by the SOTA semantic segmentation framework called U-net [25]. It comprises an encoder or contracting module (left side) and a decoder or expansive module (right side), which are explained in the following subsections.

3.1.1. AUnet Encoder

The AUnet encoder is based on the standard CNN architecture. To generate the subsequent feature maps of an input patch P , each encoder depth in the contracting path uses two 3 × 3 convolution operations, as expressed in Equations (3) and (4):
M x , y = P K x , y ,
M x , y = i j K i , j P x i , y j ,
where K is the kernel size, and M x ,   y is the resulting feature map with indices for rows and columns denoted by x and y . Following that, the weights of the water channels are adjusted using the ReLU activation ( R A ) to eliminate the negative values as expressed:
R A M = M ,   if   M > 1 0 , otherwise   M = i , j | i x , j y ,
Moreover, in contrast to the original U-net [25] architecture, the proposed AUnet model employs atrous convolution blocks to perform broader and context-aware processing while preserving the same spatial resolution of features. Given the slenderness, connectedness, diversity, and length of water channel canals, it is critical to expand the feature’s receptive field along the network’s contracting path while maintaining precise information. One solution to that is to use pooling layers, which may enhance the receptive field. However, pooling operations can also diminish the center features’ resolution and result in the loss of spatial information. As a result, atrous convolution blocks in AUnet use several dilated convolutions stacked in cascade mode and skip connections to traverse the high-level feature maps to the corresponding decoder depths. Each block is composed of four 3 × 3 atrous convolutions, where the dilation rate is increased from 1 to 4 in each succeeding convolution operation, as expressed in Equation (6):
M O x , y = i j K i , j M I x + d × i ,   y + d × j ,
where M I is the input feature maps, and M O is the output feature maps to the atrous convolution blocks of the AUnet model. d denotes the dilation factor for atrous convolutions, and K represents the convolutional kernel.
The outputs from the atrous convolution blocks at each encoder depth are also transferred to the corresponding decoder depth to provide high-level feature representation and facilitate the upsampling process. Afterward, a max-pooling operation is performed using a 2 × 2 kernel with stride 2 at each encoder depth to downsample the feature maps. Moreover, at every downsampling stage, the number of feature channels is doubled. Overall, the contracting path in AUnet has 4 downsampling layers, where a 288 × 288 input patch reduces to 18 × 18 feature maps at the output.

3.1.2. AUnet Decoder

The expansive or decoder path of AUnet is the same as the original U-net [25], which is computationally efficient. In the AUnet decoder, every step consists of two 3 × 3 convolutions, each followed by a ReLU, concatenated with the cropped feature map from the corresponding contracting path. Next, the feature maps are upsampled using a 2 × 2 transposed convolution [15,16] that halves the number of feature channels. The cropping operation is required since each convolution operation results in a loss of border pixels. The AUnet decoder restores the downsampled feature maps of size 18 × 18 to the original resolution of 288 × 288 . A 1 × 1 convolution is employed in the last layer to map every 64-component feature representation to two classes (Water Channels and Background).

3.2. Postprocessing

The segmented water channel pixels at the AUnet output are often noisy. As a result, we add a postprocessing phase to remove stray pixels and smooth the segmented labels. For this purpose, we first extracted the mask containing water channel pixels and then used disk-shaped structural components to perform the erosion operation. Following that, we used nonlinear median filtering to minimize noise while preserving water channel boundaries. Additionally, we performed 2D convolution to blur the water channel mask, which is then binarized using the thresholding technique to remove the noisy and stray pixels from the segmentation.

4. Experimental Setup

4.1. System Specifications

The experiment was conducted using the MATLAB R2021b platform, installed on a Windows 10 system with an Intel Core i7-10875H processor running at 2.30 GHz, 16 GB of RAM, and an NVIDIA GeForce 1080 graphics card.

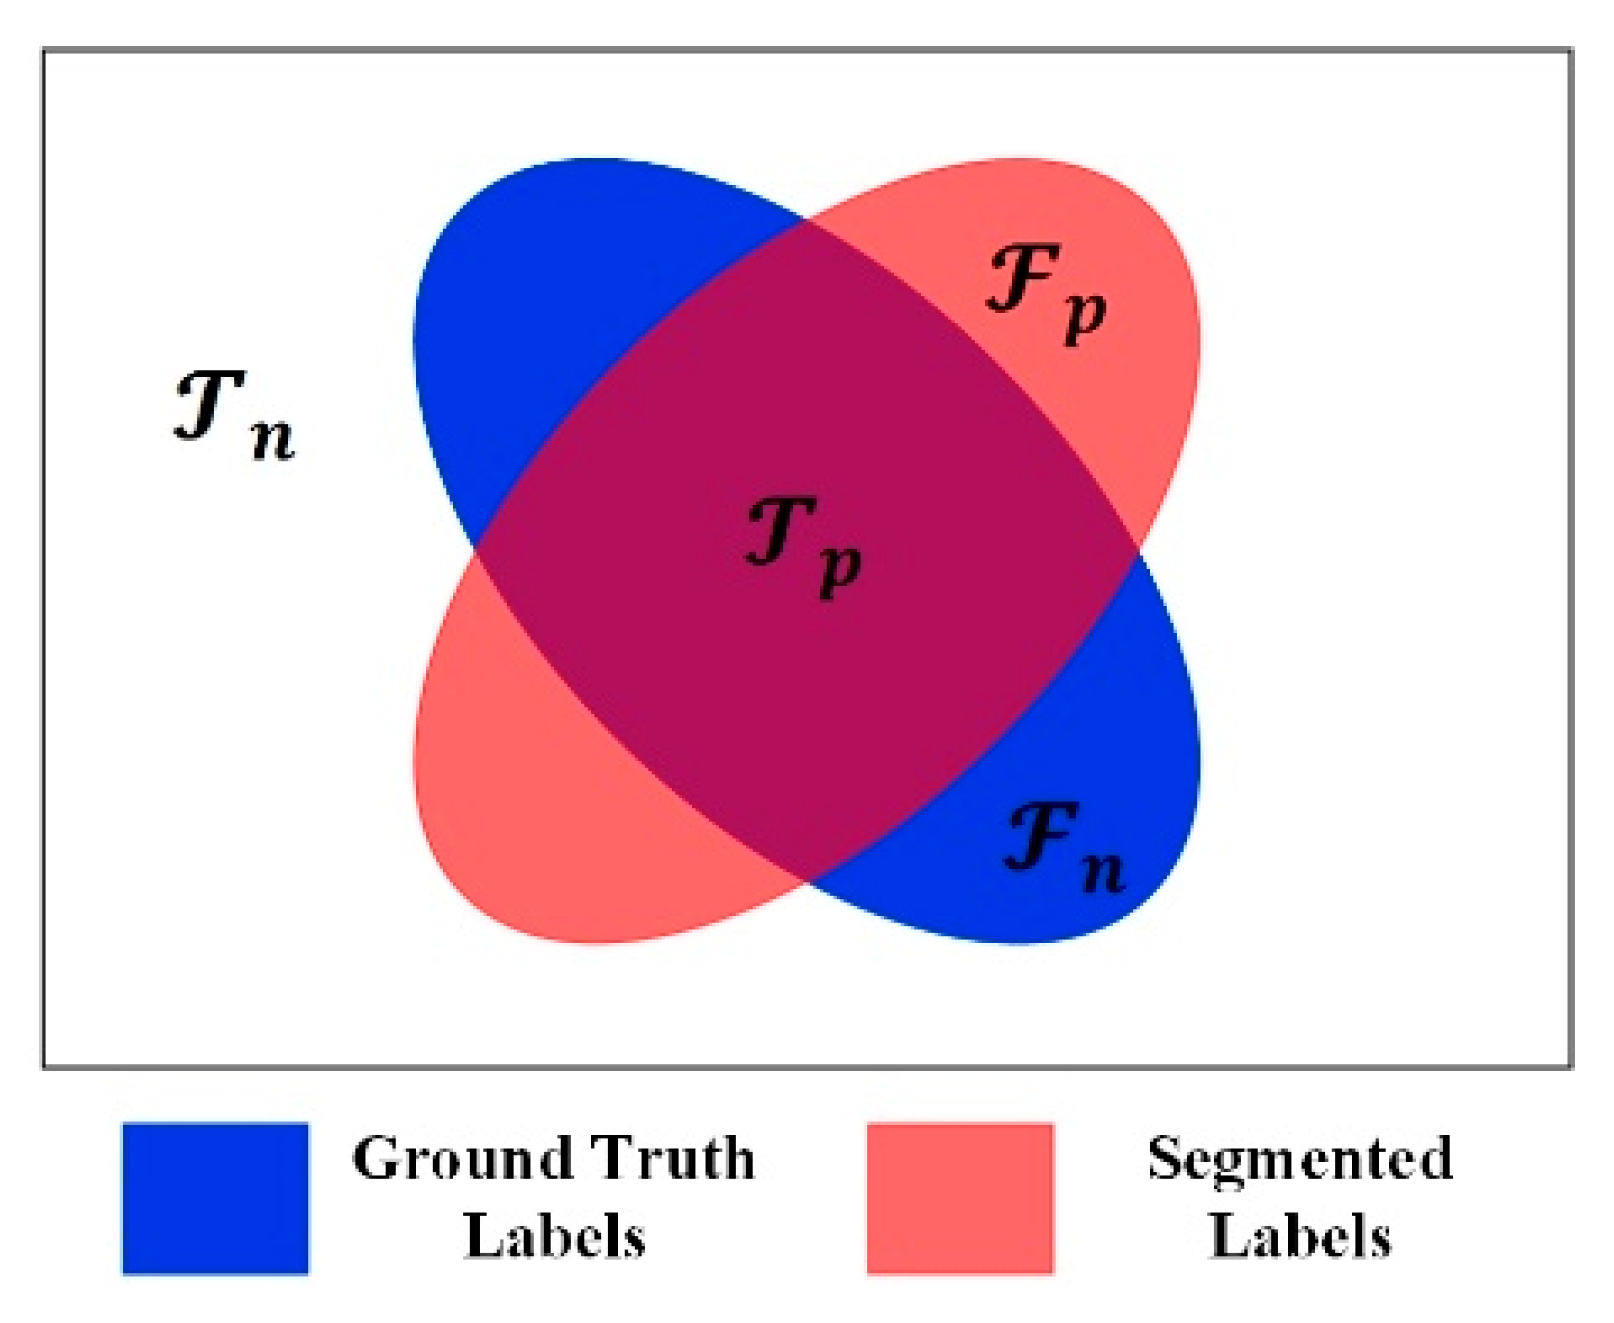
4.2. Evaluation Metrics

We assessed AUnet’s performance for accurate segmentation of water channels using VHR satellite images. The segmentation performance of AUnet in a single patch was measured through various performance metrics, defined through the predicted pixels convention, as shown in Figure 6. T p , F p , T n , and F n in Figure 6 represent the true-positive, false-positive, true-negative, and false-negative pixels, respectively. T p shows the precise segmentation of water channel pixels by the proposed AUnet model for a given input patch. T n represents the pixels when the AUnet correctly omits the non-water channel labels from a given input patch. F p and F n depict the inaccurate segmentation results. F p are the cases where the AUnet model incorrectly segments the pixels as water channels that are actually not the water channel pixels. On the contrary, F n depicts the cases when the AUnet model incorrectly predicts the water channel pixels as non-water channel pixels.
The proposed research deals with the water channel extraction problem, which actually presents the segmentation problem of binary image patches. In image segmentation, there are many criteria to measure segmentation accuracy. In this work, we considered the following evaluation metrics:

4.2.1. Mean Pixel Sensitivity

Mean pixel sensitivity is defined as the percentage of pixels in a patch that are accurately labeled. It is computed as expressed:
MPS = T P T P + F N

4.2.2. Mean Pixel Prediction

Mean pixels prediction shows the average percentage of each class of pixels in the patch that are accurately labeled. It is computed as:
MPP = T P T P + F P  

4.2.3. Mean Intersection over Union

Mean intersection over union is the average percentage of each class of pixels in image that are classified correctly. It is computed as:
MIoU = T P T P + F P + F N  

4.2.4. Mean Dice Similarity Coefficient

Mean Dice similarity coefficient is a standard similarity measuring function that is often applied to determine the correlation between two samples. It is computed as:
MDSC = 2 T P T P + F N + T P + F P  

4.3. AUnet Training Details

4.3.1. Loss Function

In this research, we used the dice loss function for training the AUnet model. It is computed as expressed in Equation (11):
L D i c e = 1 2 c = 1 C W c e = 1 E P c , e G c , e c = 1 C W c e = 1 E P c , e 2 + G c , e 2  
where P and G denote the pixel-labels of AUnet’s segmented patch and the corresponding ground truth, respectively. C = 2 are the two classes (water and nonwater), E represents the spatial dimensions of P . W c is the per class weighting factor, which governs the contribution of each class to the overall loss. W c is important because it counterbalances the influence of the dominant class on the segmentation performance. It is computed as expressed in Equation (12):
W c = 1 e = 1 E G c , e 2  

4.3.2. Network Training and Hyperparameter Selection

The AUnet model’s training phase was performed using 5960 patches, which were randomly selected from all five regions of the local dataset, as shown in Table 1. Moreover, we used the Adam optimizer [44] for updating AUnet’s parameters. The mini-batch size and total epochs were, respectively, set to 128 and 80, enabling the model to complete the training phase in 3680 iterations with 46 iterations in every epoch. Further, 1991 separate patches were utilized to validate AUnet’s training performance. We specified the validation frequency as ten epochs, allowing the AUnet model to validate eight times on the unseen data patches. It is worth noting that the hyperparameters to train the AUnet model were finalized using Bayesian optimization across 30 objective function evaluations in an effort to reduce the training error on the validation set. Table 2 shows the hyperparameter specifics of the AUnet model used for training and the relevant ranges for searching these using Bayesian optimization.

5. Experimental Results

The proposed AUnet was evaluated qualitatively and quantitatively for precise segmentation and extraction of water channels. The AUnet model was trained using the OSM mapping tool, which provides weakly supervised and scribbled annotations (centerlines) of water channels. Moreover, we compared the performance of the AUnet with other SOTA deep-learning-based semantic segmentation models, including FCN [24], U-net [25], SegNet [26], and DeepLabv3+ [27]. The training hyperparameters for all the models were determined and fine-tuned using the Bayesian optimization algorithm.

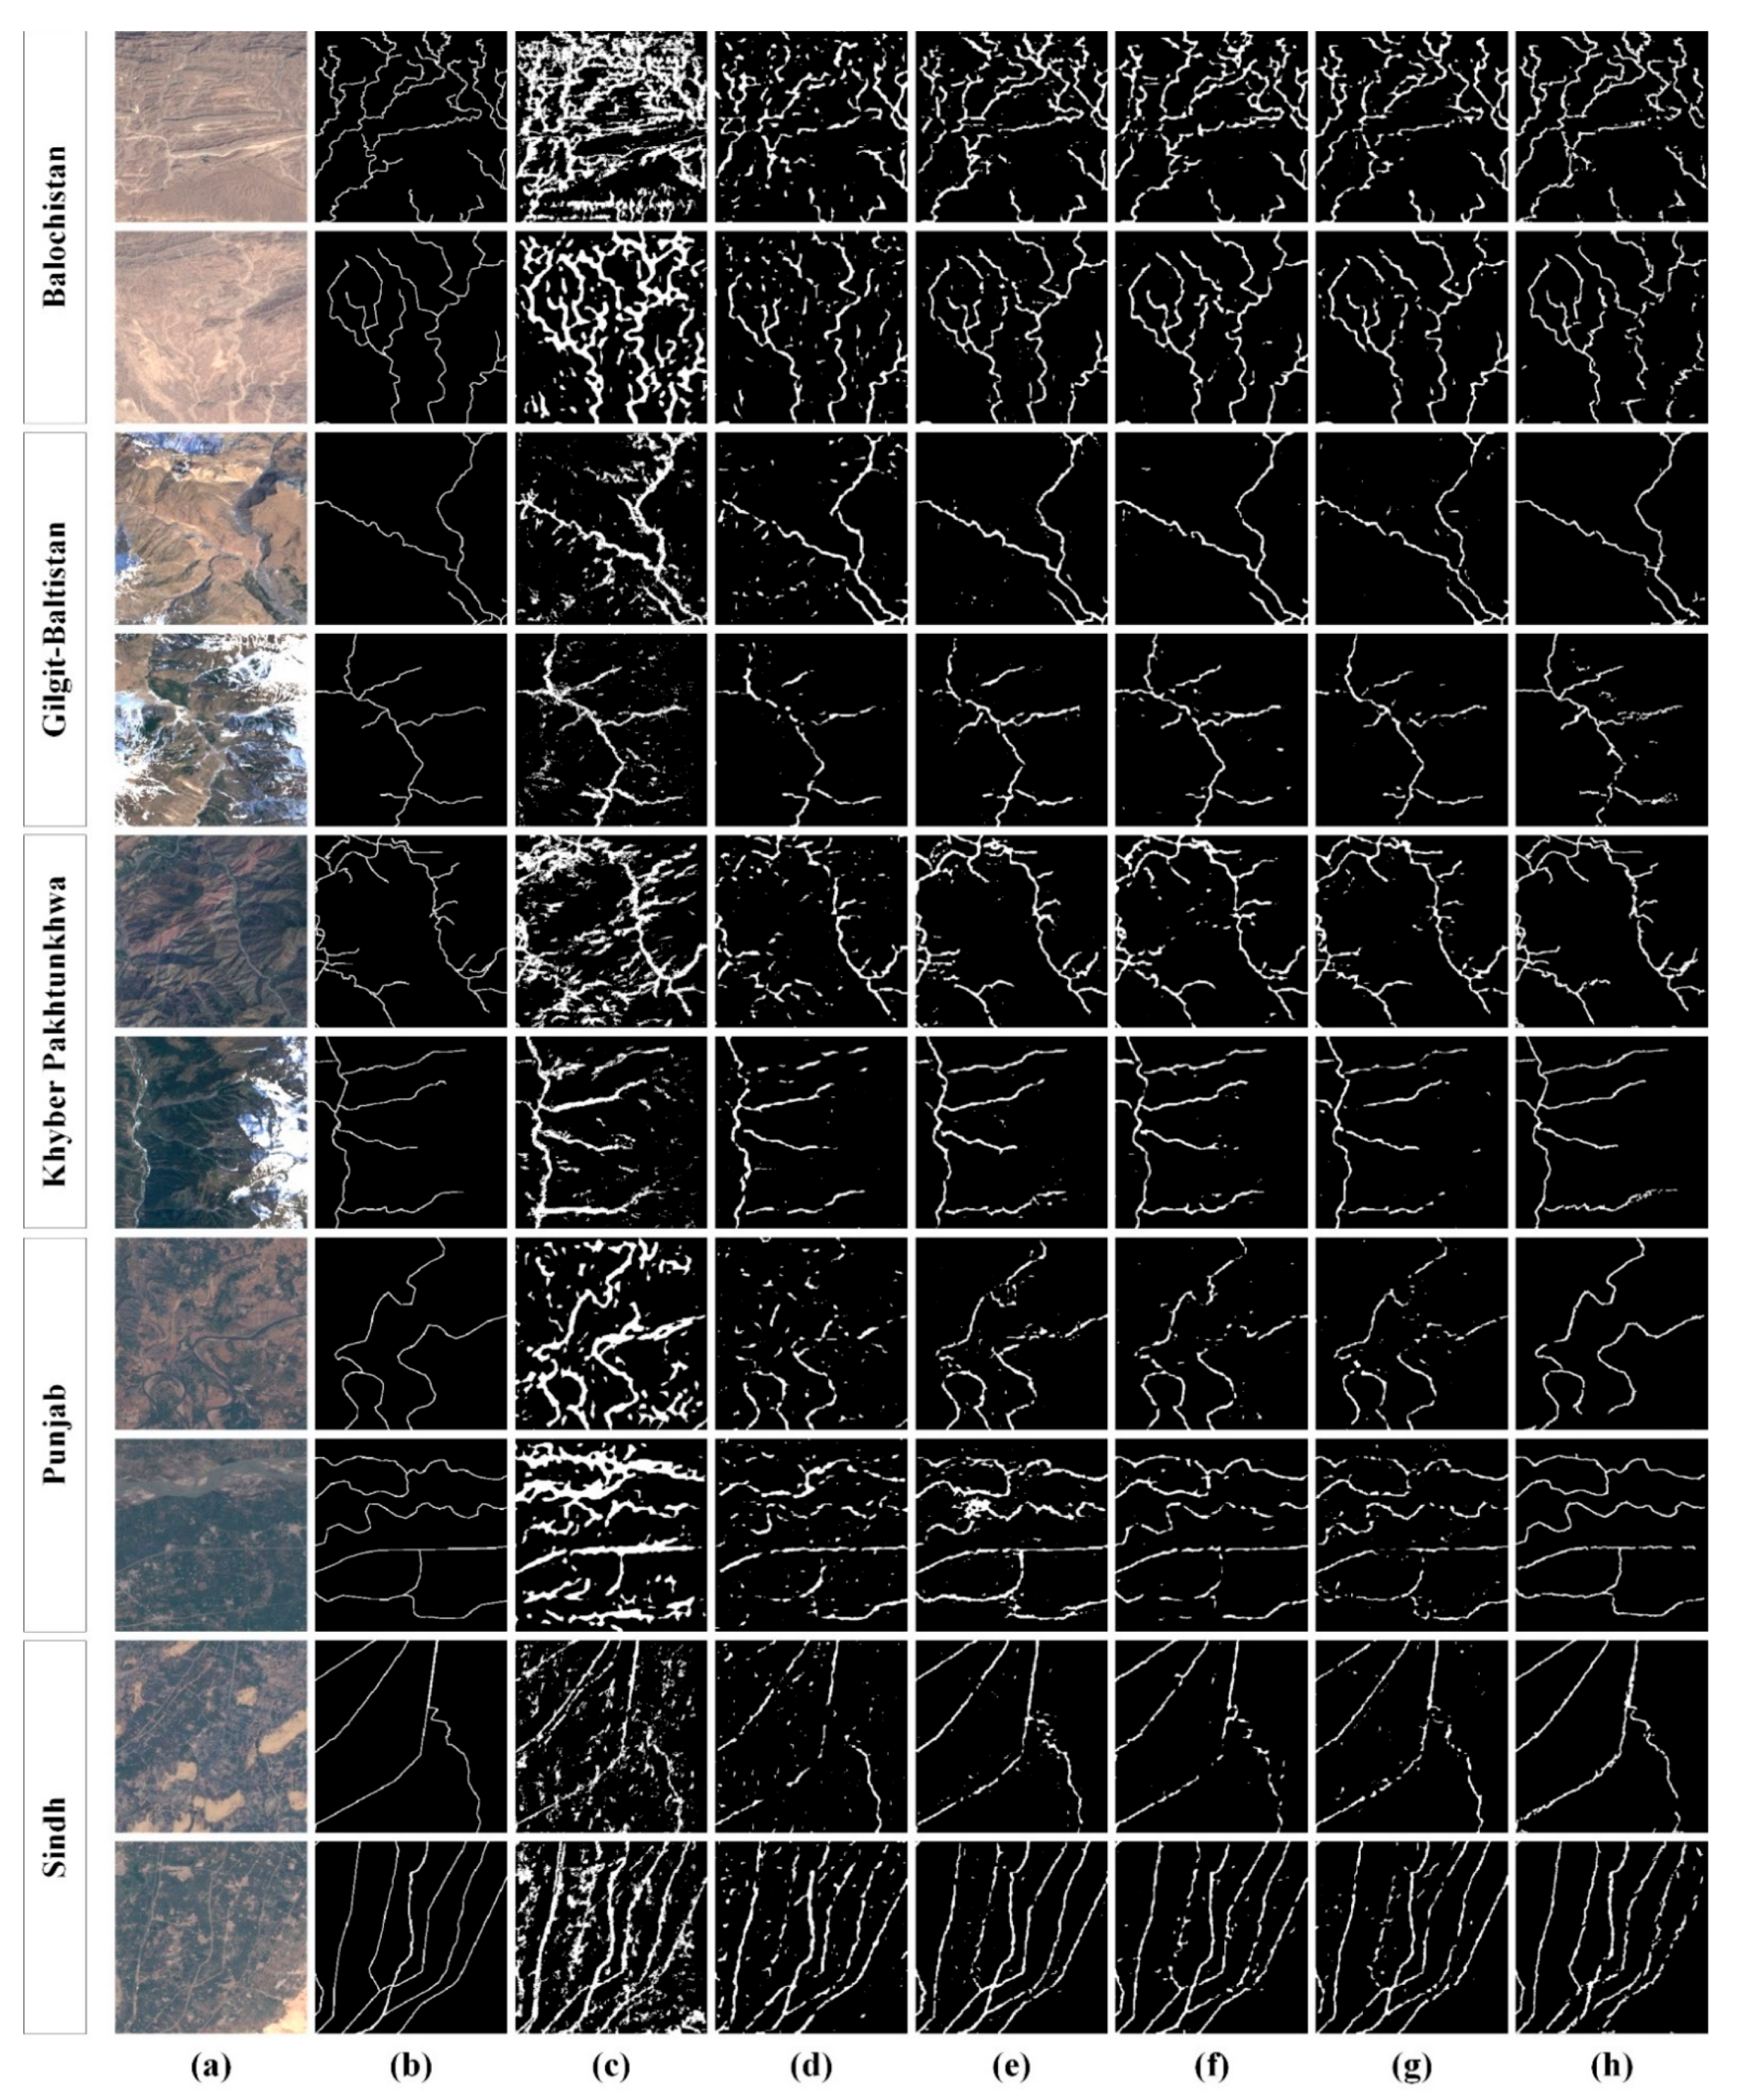
5.1. Qualitative Evaluation

We first analyzed the performance of the trained AUnet model qualitatively by randomly considering five patches of the VHR Punjab-5 image, as shown in Figure 7a. The five patches were selected from different regions of the image. Here, it can be observed that the segmented pixels by the proposed AUnet model (Figure 7c) in each case are nearly identical to the corresponding ground truths (Figure 7b), with some noisy and stray pixels belonging to the water channels class. These noisy pixels were then filtered using the adopted postprocessing scheme to obtain the smooth segmented regions, as shown in Figure 7d. The overlapped ground truth and segmented pixels are shown in Figure 7e, where the green color denotes the oversegmented pixels, and magenta shows the undersegmented pixels. Moreover, Figure 7f shows the overlaid extracted water channels on the original images using the proposed AUnet model.
Next, the segmentation performance of the proposed AUnet model was qualitatively compared with different SOTA models. The results are shown using randomly selected two patches from all five geographical regions in the local dataset, as shown in Figure 8. Here, the performance of the proposed AUnet model looks adjacent to the other SOTA models. Moreover, it can be observed that the proposed model better segmented the finer water channel details as shown in the 7th, 8th, and 12th rows of Figure 8. Qualitatively, the proposed AUnet model showcased comparable performance, where the water channels segmented regions by the AUnet model overlap well with the corresponding ground truths. The exact degree of overlap using different evaluation metrics is presented next.

5.2. Quantitative Evaluation

The performance of the proposed AUnet model was quantitatively assessed through various evaluation metrics. First, we presented the segmentation results over the complete test dataset containing a total of 1984 patches, as shown in Table 1. Here, the segmentation performance is shown separately for both Background (BG) and Water Channels (WC) classes using the four commonly used evaluation metrics for the semantic segmentation task. Moreover, we reported the segmentation performance with and without the postprocessing stage. It can be observed that the performance of the proposed framework improves by 2.48% with postprocessing, considering the MIoU metric.
Moreover, the value of each metric represents the mean score, averaged over the entire testing dataset (1984 patches). As observed from Table 3, the proposed AUnet achieved considerable results for both classes despite the huge class imbalance and disparity between the number of pixels for each class. Moreover, the performance of the proposed AUnet is particularly appreciable considering the challenging dataset as used in this study, which offers a variety of terrains and varying weather conditions. Specifically, the proposed model achieved the mean pixel specificity score of 0.9941, which shows AUnet’s efficient performance in correctly ruling out the nonexisting class pixels.
Next, we compared the segmentation performance of the proposed AUnet with other SOTA frameworks, as shown in Table 4. Here, we present the performance comparison separately with respect to each geographical region and segmentation class considering the MioU metric. It can be observed from Table 4 that the proposed AUnet model achieved better results as compared to the other models for four out of five geographical regions and outperforms the second-best method [27] by 12.14% in aggregate segmentation of Water Channels class pixels. In particular, the proposed AUnet model showcased the best performance for the Punjab region. It achieved an MioU score of 0.8540, outperforming the second-best results by 26.46% in segmenting the water channel regions. Whereas it showcased third-best performance for the Gilgit–Baltistan region, lagging behind the best results by 13.81% for segmenting Water Channels class pixels. The decline in segmentation performance for the Gilgit–Baltistan region is perhaps due to its different geographical landscape compared to other regions, which are relatively more similar. Moreover, the Gilgit–Baltistan region contains the least number of training patches and a much more diversified environment, such as snowy mountainous terrains. However, this could be improved in the future by incorporating a sufficient amount of such instances and a more balanced dataset. Nevertheless, considering the overall performance, the proposed model achieved an MIoU score of 0.8791, exceeding the second-best [27] performance by 5.90% for extracting the water channels.

6. Conclusions

The segmentation of surface water is critical because water serves to maintain aquatic and terrestrial environments as well as a variety of human needs. This study delivers a newly curated water channel dataset of the Pakistan region using Landsat 8 imagery and OSM data. We also introduce AUnet, a deep-learning-based network for surface water mapping and water channel segmentation based on the sparse scribbling annotations supplied by OSM data. Given the narrowness, connectedness, variety, and length of water channel canals, the suggested AUnet model includes atrous convolutions at each encoder level to increase the features receptive field throughout the network’s contracting course while retaining accurate information. The proposed AUnet model was thoroughly evaluated in a variety of terrestrial contexts, providing a mean intersection over union score of 0.8791 for exact water channel segmentation throughout the full testing dataset. However, our study has some limitations, such as it obtained relatively lower water channel segmentation accuracy for patches with clouds or haze. In the future, we plan to adopt a comprehensive preprocessing stage for removing clouds or dehazing of VHR satellite imagery prior to feeding the network for training and validation.

Author Contributions

Conceptualization, S.M.; methodology, S.M., B.H., A.K. and R.A.; project administration, G.S.; software, S.M., B.H.,L.A, A.K., R.A. and Y.L. (Yinyi Lin); supervision, G.S. and Y.L. (Yu Li); validation, S.M., T.H. and J.Z; visualization, G.S. and Y.L. (Yu Li); formal analysis, S.M., B.H., A.B., A.K., R.A., T.H. and Y.L. (Yinyi Lin); investigation, S.M.; resources, S.M. and Y.L. (Yu Li); data curation, S.M., A.K., R.A., A.B. and T.H.; writing—original draft preparation, S.M., B.H., A.K., J.Z., R.A. and T.H.; writing—review and editing, S.M., R.A., T.H. and Y.L. (Yu Li). All authors have read and agreed to the published version of the manuscript.

Funding

This work was supported in part by the National Key Research and Development Program of China, Grant Number 2021YFA075104; the Scientific Research Project of Beijing Educational Committee, Grant Number KM202110005024); and the Strategic Priority Program of the Chinese Academy of Sciences (XDB41000000).

Data Availability Statement

The new curated VHR dataset and labels, which support the findings of this study, are available from the corresponding author upon reasonable request.

Acknowledgments

We are grateful to the U.S. Geological Survey for making Landsat-8 imagery publicly accessible, which enabled us to prepare a dataset for this research.

Conflicts of Interest

The authors declare no conflict of interest.

References

  1. Xu, Y.; Wu, L.; Xie, Z.; Chen, Z. Building extraction in very high resolution remote sensing imagery using deep learning and guided filters. Remote Sens. 2018, 10, 144. [Google Scholar] [CrossRef] [Green Version]
  2. Wu, S.; Du, C.; Chen, H.; Xu, Y.; Guo, N.; Jing, N. Road extraction from very high resolution images using weakly labeled OpenStreetMap centerline. ISPRS Int. J. Geo-Inf. 2019, 8, 478. [Google Scholar] [CrossRef] [Green Version]
  3. Pekel, J.F.; Cottam, A.; Gorelick, N.; Belward, A.S. High-resolution mapping of global surface water and its long-term changes. Nature 2016, 540, 418–422. [Google Scholar] [CrossRef] [PubMed]
  4. Feng, M.; Sexton, J.O.; Channan, S.; Townshend, J.R. A global, high-resolution (30-m) inland water body dataset for 2000: First results of a topographic–spectral classification algorithm. Int. J. Digit. Earth 2016, 9, 113–133. [Google Scholar] [CrossRef] [Green Version]
  5. Yamazaki, D.; Trigg, M.A.; Ikeshima, D. Development of a global~ 90 m water body map using multi-temporal Landsat images. Remote Sens. Environ. 2015, 171, 337–351. [Google Scholar] [CrossRef]
  6. Bangira, T.; Alfieri, S.M.; Menenti, M.; Van Niekerk, A. Comparing thresholding with machine learning classifiers for mapping complex water. Remote Sens. 2019, 11, 1351. [Google Scholar] [CrossRef] [Green Version]
  7. Acharya, T.D.; Subedi, A.; Lee, D.H. Evaluation of machine learning algorithms for surface water extraction in a Landsat 8 scene of Nepal. Sensors 2019, 19, 2769. [Google Scholar] [CrossRef] [Green Version]
  8. Karpatne, A.; Khandelwal, A.; Chen, X.; Mithal, V.; Faghmous, J.; Kumar, V. Global monitoring of inland water dynamics: State-of-the-art, challenges, and opportunities. In Computational Sustainability; Springer: Cham, Switzerland, 2016; pp. 121–147. [Google Scholar]
  9. Isikdogan, F.; Bovik, A.C.; Passalacqua, P. Surface water mapping by deep learning. IEEE J. Sel. Top. Appl. Earth Obs. Remote Sens. 2017, 10, 4909–4918. [Google Scholar] [CrossRef]
  10. Wang, Y.; Li, Z.; Zeng, C.; Xia, G.S.; Shen, H. An urban water extraction method combining deep learning and Google Earth engine. IEEE J. Sel. Top. Appl. Earth Obs. Remote Sens. 2020, 13, 769–782. [Google Scholar] [CrossRef]
  11. Li, Z.; Wang, R.; Zhang, W.; Hu, F.; Meng, L. Multiscale features supported deeplabv3+ optimization scheme for accurate water semantic segmentation. IEEE Access 2019, 7, 155787–155804. [Google Scholar] [CrossRef]
  12. Wang, Z.; Gao, X.; Zhang, Y.; Zhao, G. MSLWENet: A novel deep learning network for lake water body extraction of Google remote sensing images. Remote Sens. 2020, 12, 4140. [Google Scholar] [CrossRef]
  13. Chen, Y.; Fan, R.; Yang, X.; Wang, J.; Latif, A. Extraction of urban water bodies from high-resolution remote-sensing imagery using deep learning. Water 2018, 10, 585. [Google Scholar] [CrossRef] [Green Version]
  14. Mazhar, S.; Sun, G.; Wang, Z.; Liang, H.; Zhang, H.; Li, Y. Flood Mapping and Classification Jointly Using MuWI and Machine Learning Techniques. In Proceedings of the 2021 International Conference on Control, Automation and Information Sciences (ICCAIS), Xi’an, China, 14–17 October 2021; pp. 662–667. [Google Scholar]
  15. Hassan, B.; Qin, S.; Ahmed, R.; Hassan, T.; Taguri, A.H.; Hashmi, S.; Werghi, N. Deep learning based joint segmentation and characterization of multi-class retinal fluid lesions on OCT scans for clinical use in anti-VEGF therapy. Comput. Biol. Med. 2021, 136, 104727. [Google Scholar] [CrossRef]
  16. Hassan, B.; Qin, S.; Hassan, T.; Ahmed, R.; Werghi, N. Joint segmentation and quantification of chorioretinal biomarkers in optical coherence tomography scans: A deep learning approach. IEEE Trans. Instrum. Meas. 2021, 70, 2508817. [Google Scholar] [CrossRef]
  17. Wang, Z.; Liu, J.; Li, J.; Meng, Y.; Pokhrel, Y.; Zhang, H.S. Basin-scale high-resolution extraction of drainage networks using 10-m Sentinel-2 imagery. Remote Sens. Environ. 2021, 255, 112281. [Google Scholar] [CrossRef]
  18. Ahmed, R.; Chen, Y.; Hassan, B.; Du, L. CR-IoTNet: Machine learning based joint spectrum sensing and allocation for cognitive radio enabled IoT cellular networks. Ad Hoc Networks 2021, 112, 102390. [Google Scholar] [CrossRef]
  19. Khan, A.; Khan, S.; Hassan, B.; Zheng, Z. CNN-Based Smoker Classification and Detection in Smart City Application. Sensors 2022, 22, 892. [Google Scholar] [CrossRef]
  20. Ahmed, R.; Chen, Y.; Hassan, B. Deep residual learning-based cognitive model for detection and classification of transmitted signal patterns in 5G smart city networks. Digit. Signal Processing 2022, 120, 103290. [Google Scholar] [CrossRef]
  21. Ahmed, R.; Chen, Y.; Hassan, B. Deep learning-driven opportunistic spectrum access (OSA) framework for cognitive 5G and beyond 5G (B5G) networks. Ad Hoc Netw. 2021, 123, 102632. [Google Scholar] [CrossRef]
  22. Hassan, T.; Hassan, B.; Akram, M.U.; Hashmi, S.; Taguri, A.H.; Werghi, N. Incremental Cross-Domain Adaptation for Robust Retinopathy Screening via Bayesian Deep Learning. IEEE Trans. Instrum. Meas. 2021, 70, 2516414. [Google Scholar] [CrossRef]
  23. Hassan, B.; Qin, S.; Hassan, T.; Akram, M.U.; Ahmed, R.; Werghi, N. CDC-Net: Cascaded decoupled convolutional network for lesion-assisted detection and grading of retinopathy using optical coherence tomography (OCT) scans. Biomed. Signal Processing Control. 2021, 70, 103030. [Google Scholar] [CrossRef]
  24. Krizhevsky, A.; Sutskever, I.; Hinton, G.E. Imagenet classification with deep convolutional neural networks. In Proceedings of the Advances in Neural Information Processing Systems 25 (NIPS 2012), Lake Tahoe, NV, USA, 3–8 December 2012. [Google Scholar]
  25. Long, J.; Shelhamer, E.; Darrell, T. Fully convolutional networks for semantic segmentation. In Proceedings of the IEEE Conference on Computer Vision and Pattern Recognition, Boston, MA, USA, 7–12 June 2015; pp. 3431–3440. [Google Scholar]
  26. Ronneberger, O.; Fischer, P.; Brox, T. U-net: Convolutional networks for biomedical image segmentation. In International Conference on Medical Image Computing and Computer-Assisted Intervention; Springer: Cham, Switzerland, 2015; pp. 234–241. [Google Scholar]
  27. Badrinarayanan, V.; Kendall, A.; Cipolla, R. Segnet: A deep convolutional encoder-decoder architecture for image segmentation. IEEE Trans. Pattern Anal. Mach. Intell. 2017, 39, 2481–2495. [Google Scholar] [CrossRef]
  28. Chen, L.C.; Zhu, Y.; Papandreou, G.; Schroff, F.; Adam, H. Encoder-decoder with atrous separable convolution for semantic image segmentation. In Proceedings of the European Conference on Computer Vision (ECCV), Munich, Germany, 8–14 September 2018; pp. 801–818. [Google Scholar]
  29. Lin, T.Y.; Maire, M.; Belongie, S.; Hays, J.; Perona, P.; Ramanan, D.; Dollar, P.; Zitnick, C.L. Microsoft coco: Common objects in context. In European Conference on Computer Vision; Springer: Cham, Switzerland, 2014; pp. 740–755. [Google Scholar]
  30. He, K.; Zhang, X.; Ren, S.; Sun, J. Deep residual learning for image recognition. In Proceedings of the IEEE Conference on Computer Vision and Pattern Recognition, Las Vegas, NV, USA, 27–30 June 2016; pp. 770–778. [Google Scholar]
  31. Hou, Y.; Liu, Z.; Zhang, T.; Li, Y. C-UNet: Complement UNet for remote sensing road extraction. Sensors 2021, 21, 2153. [Google Scholar] [CrossRef]
  32. Li, M.; Wu, P.; Wang, B.; Park, H.; Yang, H.; Wu, Y. A deep learning method of water body extraction from high resolution remote sensing images with multisensors. IEEE J. Sel. Top. Appl. Earth Obs. Remote Sens. 2021, 14, 3120–3132. [Google Scholar] [CrossRef]
  33. Ma, A.; Wan, Y.; Zhong, Y.; Wang, J.; Zhang, L. SceneNet: Remote sensing scene classification deep learning network using multi-objective neural evolution architecture search. ISPRS J. Photogramm. Remote Sens. 2021, 172, 171–188. [Google Scholar] [CrossRef]
  34. Prodhan, F.; Zhang, J.; Yao, F.; Shi, L.; Sharma, T.P.; Zhang, D.; Cao, D.; Zheng, M.; Ahmed, N.; Mohana, H. Deep learning for monitoring agricultural drought in South Asia using remote sensing data. Remote Sens. 2021, 13, 1715. [Google Scholar] [CrossRef]
  35. Uss, M.; Vozel, B.; Lukin, V.; Chehdi, K. Exhaustive Search of Correspondences between Multimodal Remote Sensing Images Using Convolutional Neural Network. Sensors 2022, 22, 1231. [Google Scholar] [CrossRef]
  36. Loveland, T.R.; Irons, J.R. Landsat 8: The plans, the reality, and the legacy. Remote Sens. Environ. 2016, 185, 1–6. [Google Scholar] [CrossRef] [Green Version]
  37. Knight, E.J.; Kvaran, G. Landsat-8 operational land imager design, characterization and performance. Remote Sens. 2014, 6, 10286–10305. [Google Scholar] [CrossRef] [Green Version]
  38. Roy, D.P.; Wulder, M.A.; Loveland, T.R.; Woodcock, C.E.; Allen, R.G.; Anderson, M.C.; Helder, D.; Irons, J.R.; Johnson, D.M.; Kennedy, R.; et al. Landsat-8: Science and product vision for terrestrial global change research. Remote Sens. Environ. 2014, 145, 154–172. [Google Scholar] [CrossRef] [Green Version]
  39. Ebel, P.; Meraner, A.; Schmitt, M.; Zhu, X.X. Multisensor data fusion for cloud removal in global and all-season sentinel-2 imagery. IEEE Trans. Geosci. Remote Sens. 2020, 59, 5866–5878. [Google Scholar] [CrossRef]
  40. Haklay, M.; Weber, P. Openstreetmap: User-generated street maps. IEEE Pervasive Comput. 2008, 7, 12–18. [Google Scholar] [CrossRef] [Green Version]
  41. Demetriou, D. Uncertainty of OpenStreetMap data for the road network in Cyprus. In Proceedings of the Fourth International Conference on Remote Sensing and Geoinformation of the Environment (RSCy2016), Paphos, Cyprus, 4–8 April 2016; pp. 43–52. [Google Scholar]
  42. Venkatappa, M.; Sasaki, N.; Shrestha, R.P.; Tripathi, N.K.; Ma, H.O. Determination of vegetation thresholds for assessing land use and land use changes in Cambodia using the Google Earth Engine cloud-computing platform. Remote Sens. 2019, 11, 1514. [Google Scholar] [CrossRef] [Green Version]
  43. Liaw, A.; Wiener, M. Classification and regression by randomForest. R News 2002, 2, 18–22. [Google Scholar]
  44. Kingma, D.P.; Ba, J. Adam: A method for stochastic optimization. arXiv 2014, arXiv:1412.6980. [Google Scholar]
Figure 1. (a) Sample patch from very high-resolution Landsat 8 image patch, (b) the pixel-level ground-truth labels, and (c) OSM-based sparse scribbled annotations.
Remotesensing 14 03283 g001
Figure 2. The specific distribution of regions in the study area of Pakistan.
Remotesensing 14 03283 g002
Figure 3. Frequency distribution of training classes pixel.
Remotesensing 14 03283 g003
Figure 4. Flowchart of the proposed research.
Remotesensing 14 03283 g004
Figure 5. Depth-wise network architecture of the proposed AUnet model.
Remotesensing 14 03283 g005
Figure 6. Illustration of predicted labels.
Remotesensing 14 03283 g006
Figure 7. Qualitative water channel segmentation results: (a) raw input patches, (b) ground-truth pixels, (c) AUnet segmented labels containing noisy and stray pixels, (d) postprocessed images to remove noisy pixels, and (e) overlapped ground-truth and postprocessed pixels. Magenta depicts the undersegmented (false negative) pixels, and green indicates the oversegmented (false positive) pixels, (f) extracted and overlaid water channels on (a).
Remotesensing 14 03283 g007
Figure 8. Comparison of water channel segmentation results by the AUnet and other SOTA solutions using different study areas of Pakistan in the local dataset: (a) raw input patches, (b) ground-truth pixel labels, (c) FCN-32s [24], (d) FCN-8s [24], (e) U-net [25], (f) SegNet [26], (g) DeepLabv3+ [27], and (h) AUnet.
Remotesensing 14 03283 g008
Table 1. Dataset details and specifications.
RegionImageResolutionPatchesTrainingValidationTesting
BalochistanVHR-110,600 × 90801116670223223
VHR-210,601 × 8036972583195194
VHR-35056 × 49092891735858
Gilgit–BaltistanVHR-12936 × 170750301010
VHR-27380 × 37783251956565
VHR-34403 × 151775451515
VHR-411,212 × 27923422056968
VHR-54811 × 2564128772625
Khyber PakhtunkhwaVHR-14261 × 2757126762525
VHR-23568 × 222884501717
VHR-37950 × 36443241946565
VHR-45546 × 65944182518483
PunjabVHR-19663 × 7106792475159158
VHR-29296 × 7468800480160160
VHR-39459 × 7469800480160160
VHR-411,823 × 6978984590197197
VHR-56116 × 35732521515150
SindhVHR-19459 × 7097768461154153
VHR-212,557 × 88541290774258258
Total19 VHR-9935596019911984
Table 2. AUnet training hyperparameter.
Tuned ParameterValue
Training Patches5960
Validation Patches 1991
Optimizer Adam
Initial Learning Rate 0.001 [1× 10⁻⁴ to 1× 10⁻¹]
Weight Decay0.0003 [3 × 10⁻⁶ to 3 × 10⁻²]
Mini-Batch Size 128 [16 to 256]
Total Epochs 80
Iterations per Epoch 46
Total Iterations 3680
Validation Frequency 10
Table 3. Water channel segmentation performance by the proposed AUnet.
ClassWithout PostprocessingWith Postprocessing
MPSMPPMioUMDSCMPSMPPMioUMDSC
BG0.98650.99980.98640.99320.98910.99990.98910.9945
WC0.99850.72990.72910.84210.99920.76970.76920.8696
Combined0.99250.86490.85780.91770.99410.88480.87910.9320
BG = Background class, WC = Water Channels class.
Table 4. Comparative evaluation of the proposed AUnet with other SOTA methods. Bold font shows the best results. The second-best performance is underlined.
ModelClassBalochistanGilgit–BaltistanKhyber PakhtunkhwaPunjabSindhOverall
FCN-32s
[24]
BG0.92900.97700.95900.95760.96090.7383
WC0.49320.53620.52180.47910.5691
FCN-8s
[24]
BG0.94740.98180.96800.97180.96980.7709
WC0.56230.58340.56330.55270.6089
U-net
[25]
BG0.94820.98000.96740.96300.97300.8035
WC0.63920.62770.63590.58870.7120
SegNet
[26]
BG0.94960.98320.96880.97410.97610.8159
WC0.63390.66050.63240.65260.7277
DeepLabv3+
[27]
BG0.95610.98580.97420.97750.97760.8301
WC0.65590.69080.67370.67530.7340
ProposedBG0.98310.98470.98910.99310.9953 0.8791
WC0.78090.60700.75600.85400.8479
BG = Background class, WC = Water Channels class.
Publisher’s Note: MDPI stays neutral with regard to jurisdictional claims in published maps and institutional affiliations.

