Article

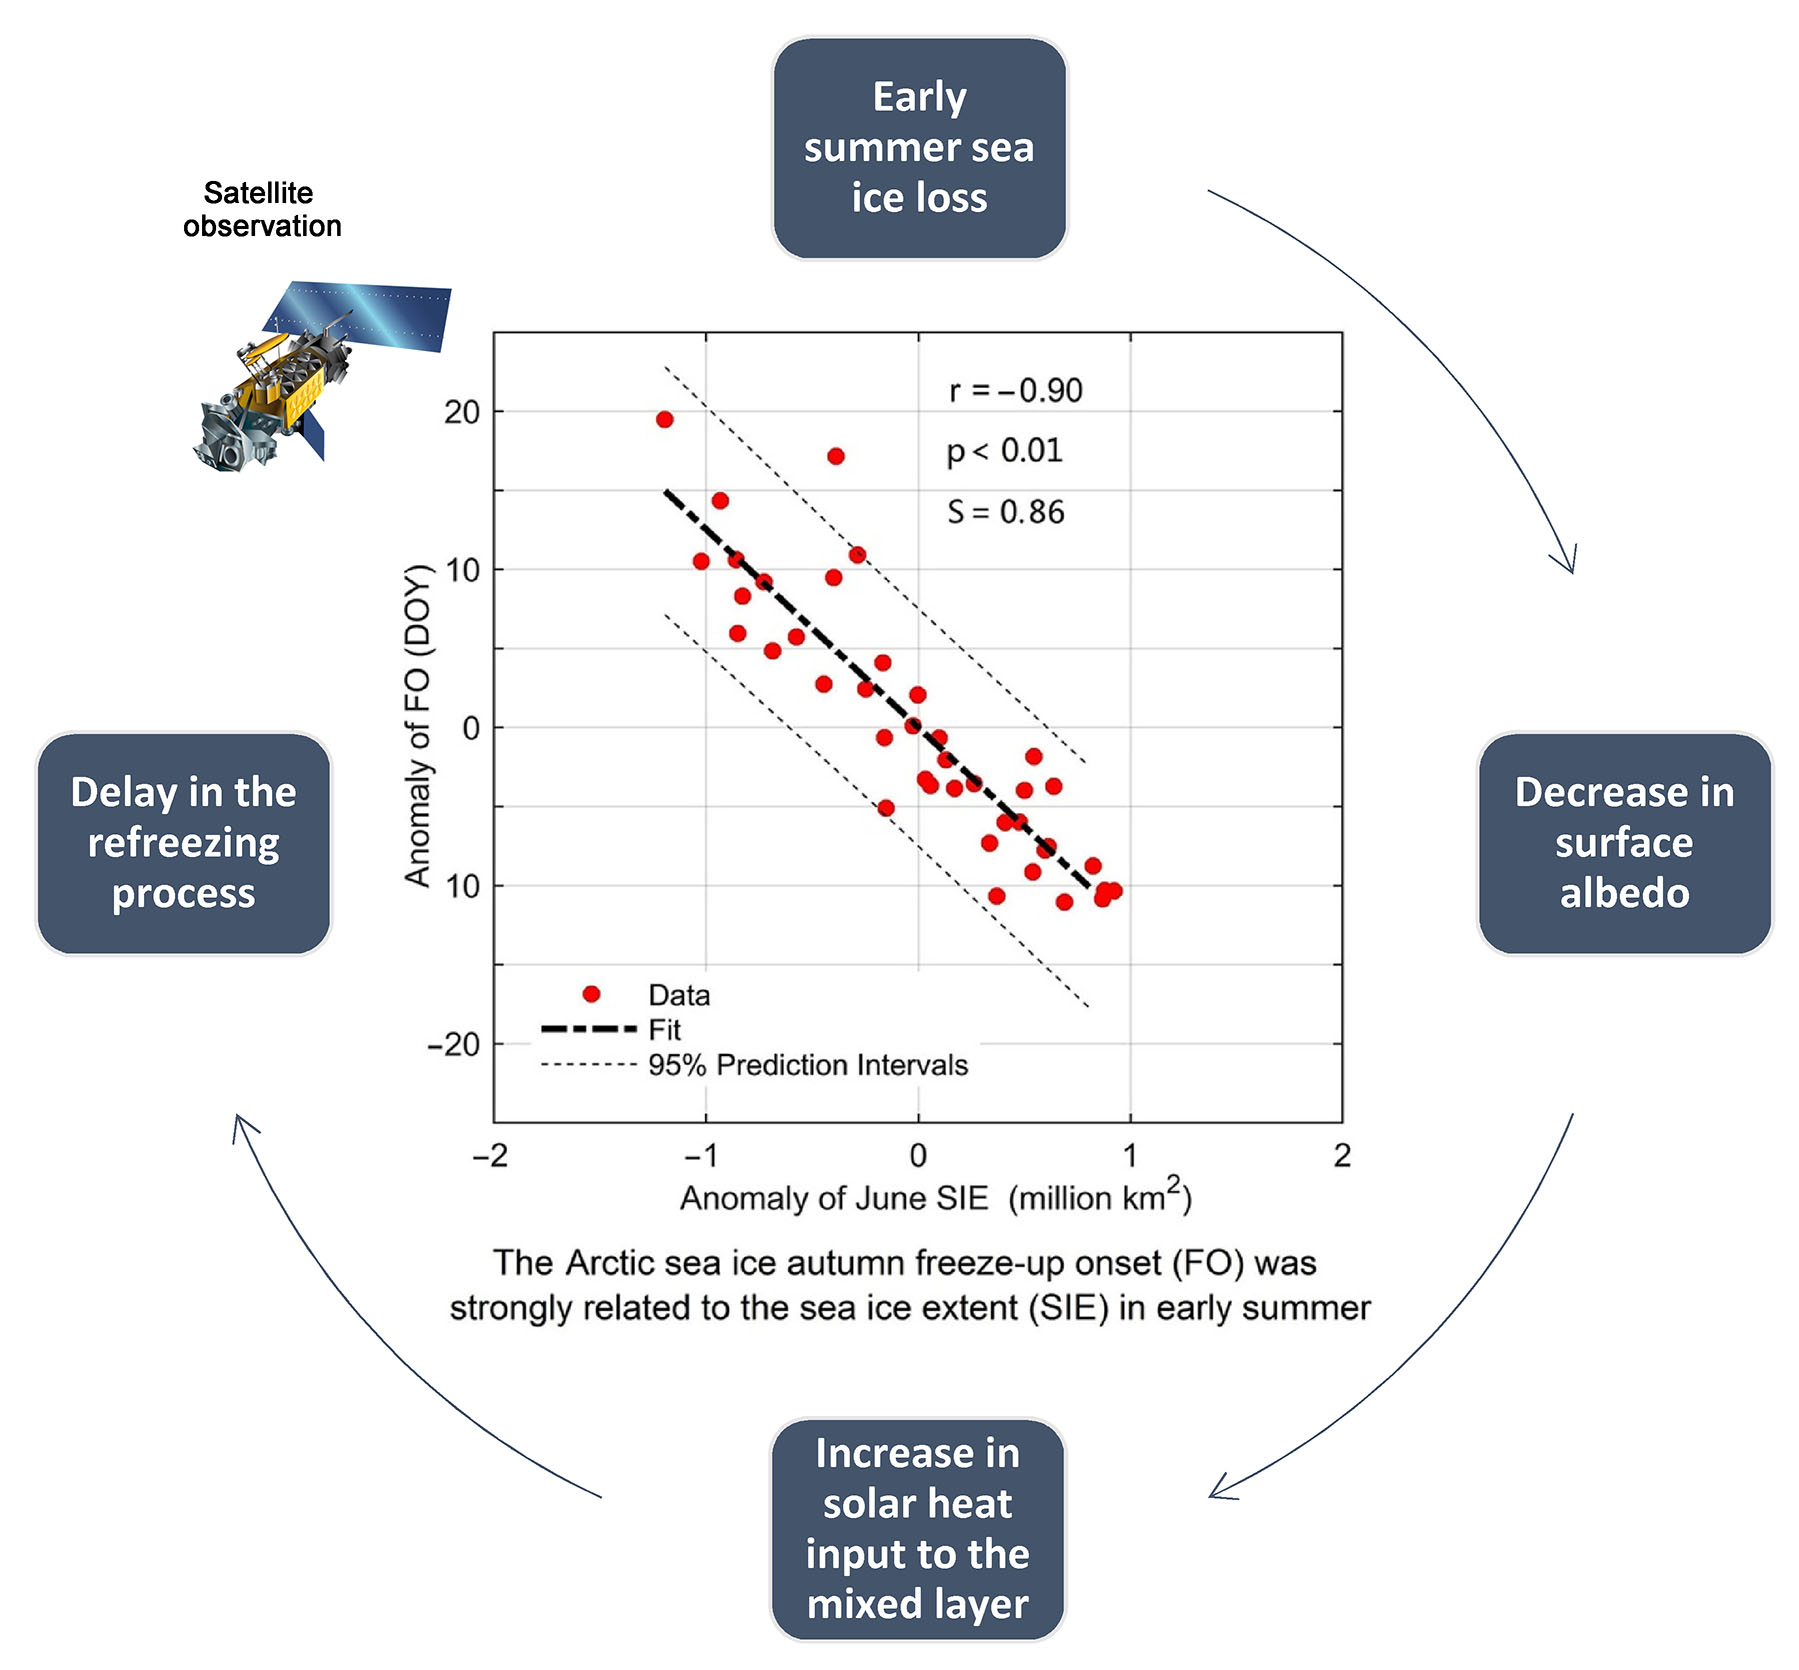
Delay in Arctic Sea Ice Freeze-Up Linked to Early Summer Sea Ice Loss: Evidence from Satellite Observations

1
School of Geospatial Engineering and Science, Sun Yat-sen University, and Southern Marine Science and Engineering Guangdong Laboratory (Zhuhai), Zhuhai 519082, China
2
University Corporation for Polar Research, Beijing 100875, China
*
Author to whom correspondence should be addressed.
Remote Sens. 2021, 13(11), 2162; https://doi.org/10.3390/rs13112162
Submission received: 3 April 2021 / Revised: 22 May 2021 / Accepted: 26 May 2021 / Published: 31 May 2021
(This article belongs to the Special Issue Polar Sea Ice: Detection, Monitoring and Modeling)

Abstract

:
The past decades have witnessed a rapid loss of the Arctic sea ice and a significant lengthening of the melt season. The years with the lowest summertime sea ice minimum were found to be accompanied by the latest freeze-up onset on record. Here, a synthetic approach is taken to examine the connections between sea ice melt timing and summer sea ice evolution from the remote sensing perspective. A 40-year (1979–2018) satellite-based time-series analysis shows that the date of autumn sea ice freeze-up is significantly correlated with the sea ice extent in early summer (r = −0.90, p < 0.01), while the spring melt onset is not a promising predictor of summer sea ice evolution. The delay in Arctic sea ice freeze-up (0.61 days year−1) in the Arctic was accompanied by a decline in surface albedo (absolute change of −0.13% year−1), an increase in net short-wave radiation (0.21 W m−2 year−1), and an increase in skin temperature (0.08 °C year−1) in summer. Sea ice loss would be the key reason for the delay in autumn freeze-up, especially in the Laptev, East-Siberian, Chukchi and Beaufort Seas, where sea ice has significantly declined throughout the summer, and strong correlations were found between the freeze-up onset and the solar radiation budget since early summer. This study highlights a connection between the summer sea ice melting and the autumn refreezing process through the ice-albedo feedback based on multisource satellite-based observations.

Graphical Abstract

1. Introduction

Recent changes in the Arctic sea ice have drawn intensive attention from research communities and government agencies, as the sea ice extent frequently reaches the record minimum [1,2]. The Arctic has warmed at rates about two times greater than the lower latitudes (i.e., Arctic amplification) [3], with a reduction in ice thickness and an increase in drift speed over the last several decades [4,5,6]. The Arctic ocean has shifted from an environment dominated by multi-year sea ice to one dominated by first-year sea ice [6,7]. The decrease of multi-year sea ice fraction resulted in more solar heat absorbed by the ice-ocean system [8]. Sea ice melt is strongly affected by the solar radiation absorbed by the ice-ocean system, which is largely influenced by the timing of the surface melt. The Arctic sea ice melt timing has presented significant changes, including a decrease in ice cover days in the seasonal sea ice zone and a lengthening of the melt season, dominated by a delay in the date of freeze-up since the late 1970s [9,10,11,12]. Local radiative effects induced by ice loss and the lengthened melt seasons have been considered as one of the key processes that contribute to the Arctic amplification through the ice-albedo feedback mechanism [13,14,15,16].
Forecasters and climate scientists have used statistical and dynamic models to examine the linkage between sea ice conditions in different stages. Coupled models are likely the most ideal tools to predict sea ice evolution. However, these models possess forecast uncertainties, mainly due to the poorly known initial conditions and model physics, and thus do not show a predictive skill that is superior to the simpler regression models [17,18,19]. On the basis of the ice-albedo feedback mechanism, recent studies have suggested the summer Arctic sea ice minimum can be predicted by surface albedo as well as the area of melt ponds and leads [20,21,22,23]. The timing of ice advance and ice retreat was found to be closely related in some polar regions [24,25,26,27].
The dates of sea ice melt timing are important indicators of polar climate that can affect the surface energy uptake in the melt season and the variations in sea ice extent [28,29]. Surface snowmelt plays an important role in the surface energy balance by lowering the sea ice surface albedo, thereby enhancing the absorption of solar radiation and accelerating the summer melting process [30]. These changes in turn can result in the delaying of the following ice growth in autumn [31]. Summer sea ice evolution is affected by the early melting conditions, which in turn, have a profound effect on the refreezing process [10].
Spaceborne earth observations and technologies are effective tools in the studying of polar climate, given the lack of in situ observations and the formidable weather conditions [32]. Compared with melt ponds and leads, sea ice melt timing (including the dates of sea ice surface melt onset and freeze-up onset) is more easily available from passive microwave measurements (also the source data for sea ice concentration products). The sea-ice albedo feedback mechanism has been documented based on plenty of numerical simulation studies [20,33,34]. Here, we show the observational evidence from the remote sensing perspective. The present study has two main aims: (1) to examine the performance of predicting the summer sea ice minimum from spring snowmelt onset and (2) to investigate the relationship between summer sea ice evolution and autumn freeze-up. These connections are investigated in the Arctic and its multiple sub-regions by examining correlations and predictive skills, with the assistance of satellite-based climate data records.

2. Materials and Methods

The Arctic melt timing product used in this study is retrieved from the brightness temperature (Tb) of multi-channel spaceborne radiometers, including the Nimbus-7 Scanning Multichannel Microwave Radiometer (SMMR) from 1979 to 1987 and the Defense Meteorological Satellite Program (DMSP) Special Sensor Microwave/Imager (SSM/I) and SSM/I Sounder (SSMIS) from 1987 to 2018 [28]. This product includes the early melt onset (EMO, the first day when melt is detected) and the continuous melt onset (MO, the day after which the sea ice stays under melt conditions), with valid value ranges from day of the year (DOY) 75 to DOY 210. Similarly, both the early freeze-up onset (EFO, the first day that freeze-up occurs) and continuous freeze-up onset (FO, the day after which the freezing conditions persist for the rest of the winter season) are calculated with valid value ranges from DOY 210 to DOY 410. The strength of the melt (or freeze) signal is calculated by summing up the changes in the temporal difference in vertically polarized 19 and 37 GHz Tb and the spectral gradient ratio between vertically polarized 19 and 37 GHz Tb. MO and EFO are determined by identifying the greatest values of the strength signal and EMO and FO are identified by secondary peaks before and after the MO and EFO. These measurements are provided over the Arctic and its sub-regions (Figure 1) and are available at the NASA Goddard Space Flight Center (https://earth.gsfc.nasa.gov/cryo/data/arctic-sea-ice-melt, accessed on 23 June 2020). Melt timing has been estimated based on other algorithms [35,36,37] or sensors (e.g., scatterometer and synthetic aperture radar) [38,39,40,41,42]. However, the product used in this study is the only one that includes the onsets of different melting stages over the whole Arctic, allowing a comprehensive examination of the connections between sea ice evolution and melt timing. See Markus et al. (2009) for more details about this product.
Markus et al. (2009) generated the sea ice melt timing product based on the NASA Team sea ice concentration (SIC) product developed by the Goddard Space Flight Center [43]. This product is also used in the investigation of sea ice variability for consistency. The SIC product is also derived from the SMMR, SSM/I, and SSMIS Tb. The Northern Hemisphere SIC product is archived at the National Snow and Ice Data Center (NSIDC), with the same spatial resolution (25 km) and projection as the melt timing product. The monthly Arctic sea ice area (SIA) and sea ice extent (SIE) are calculated based on the NASA-Team SIC product and are available from the NSIDC Sea Ice Index (http://nsidc.org/data/seaice_index, accessed on 25 June 2020). SIE is calculated by summing up the area with SIC above 15% [44]. SIA is defined as the total area covered by sea ice, corresponding to the sum of the area of each pixel multiplied by SIC. Spaceborne radiometers do not image a circular area over the North pole due to orbit inclination (referred to as the Arctic pole hole). The Arctic pole hole is considered to be ice-covered and is included in the SIE calculation, while it is not taken into account in the SIA calculation [45]. Therefore, the SIA value is generally less than the SIE value as well as the area in the real world.
The extended AVHRR Polar Pathfinder product (APP-x) is employed to assess changes in sea ice surface albedo, radiation, and skin temperature in the melt seasons (June to September). The APP-x data set has provided twice-daily satellite-based estimates of radiative fluxes, cloud properties, and surface characteristics in polar regions since 1982, allowing the examination of trends and interactions within the Arctic climate systems [46,47]. These climatic parameters are estimated based on the satellite-based reflectances, brightness temperatures, acquisition time, and sensor parameters as well as the atmospheric measurements from the NASA Modern Era Retrospective analysis for Research and Applications (MERRA) reanalysis. The APP-x measurements have been validated with extensive field experiment data; the variables used in this study are considered to be of climate data record (CDR) quality. Measurements at 14:00 local solar time used in this study are provided at a 25 km spatial resolution with the EASE-Grid projection and are available from the National Climatic Data Center (https://www.ncdc.noaa.gov/cdr/atmospheric/extended-avhrr-polar-pathfinder-app-x, accessed on 18 June 2020). Net short- and long-wave radiation is calculated as the incoming minus the outgoing fluxes.
To quantify the connections between sea ice melt timing and the sea ice evolution, we calculate the correlations between Arctic sea ice melt onset/freeze-up and monthly SIA/SIE in summer (from June to September) for the entire Arctic and its sub-regions during the satellite era (1979–2018). APP-x monthly and summer averages for each year are first calculated. A fair fraction of data discontinuity exists in the Arctic pole hole due to cross-platform and in the marginal sea ice zone because of the inter-annual variability of sea ice. In the regional statistics of sea ice melt timing, albedo, radiation, and skin temperature, only the pixels with continuous annual records are included in the area-averaged trend analyses. A linear regression model is used to examine the predictive skill between sea ice cover and melt timing:
Y ( y ) = a + b X ( y ) + ε ( y )
where y indicates time (year), a and b are determined based on a least-squares adjustment, and ε is the residual or error. The predictive skill (S) is measured as
S = 1 σ f 2 / σ r 2
where σ f 2 and σ r 2 are the variance of regression error and the predicted variable, respectively [20]. Regressions between different variables are obtained by using a least-squares regression. Significance levels of the correlations and regressions are determined using the Student’s t-test.

3. Results

In this section, we first examine the trends in different melting stages and monthly sea ice cover from June to September. The predictive skills between melt timing and SIA (SIE) are investigated afterward. To explore the connecting mechanism of the correlations, we look into the correlations between climate variables from APP-x and present cases in the regions that showed significant changes in both sea ice cover and melt timing.

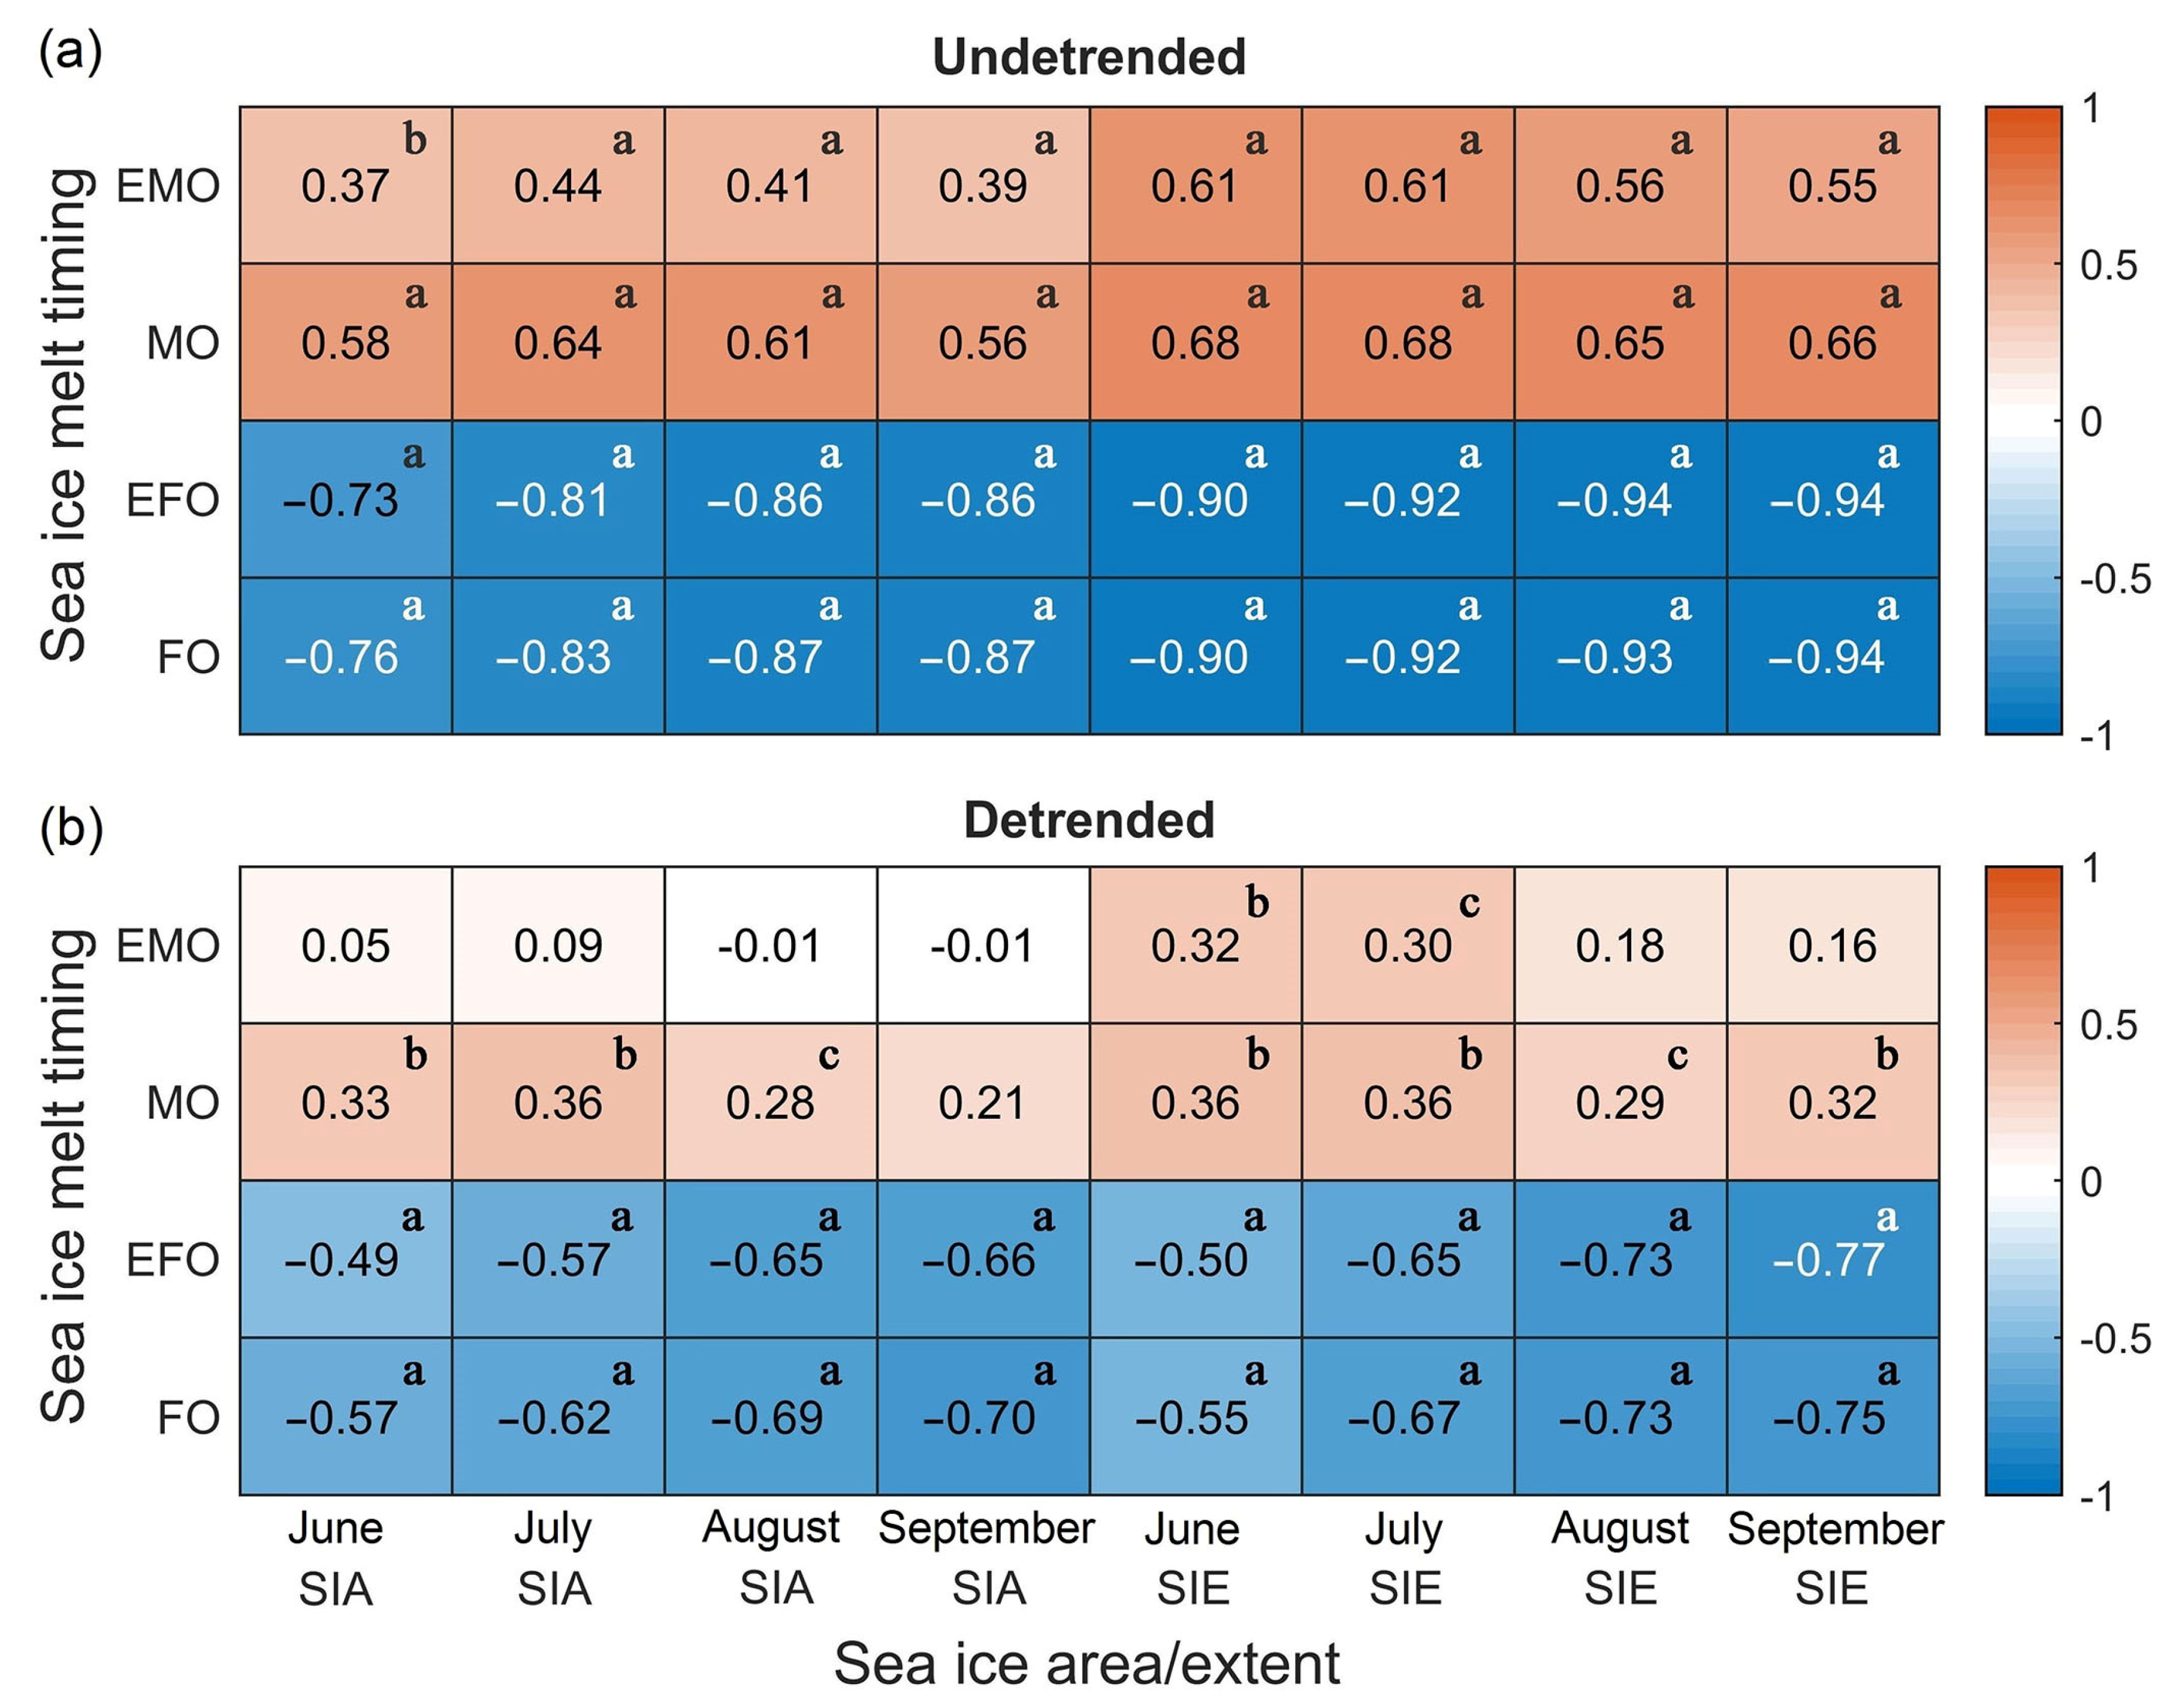
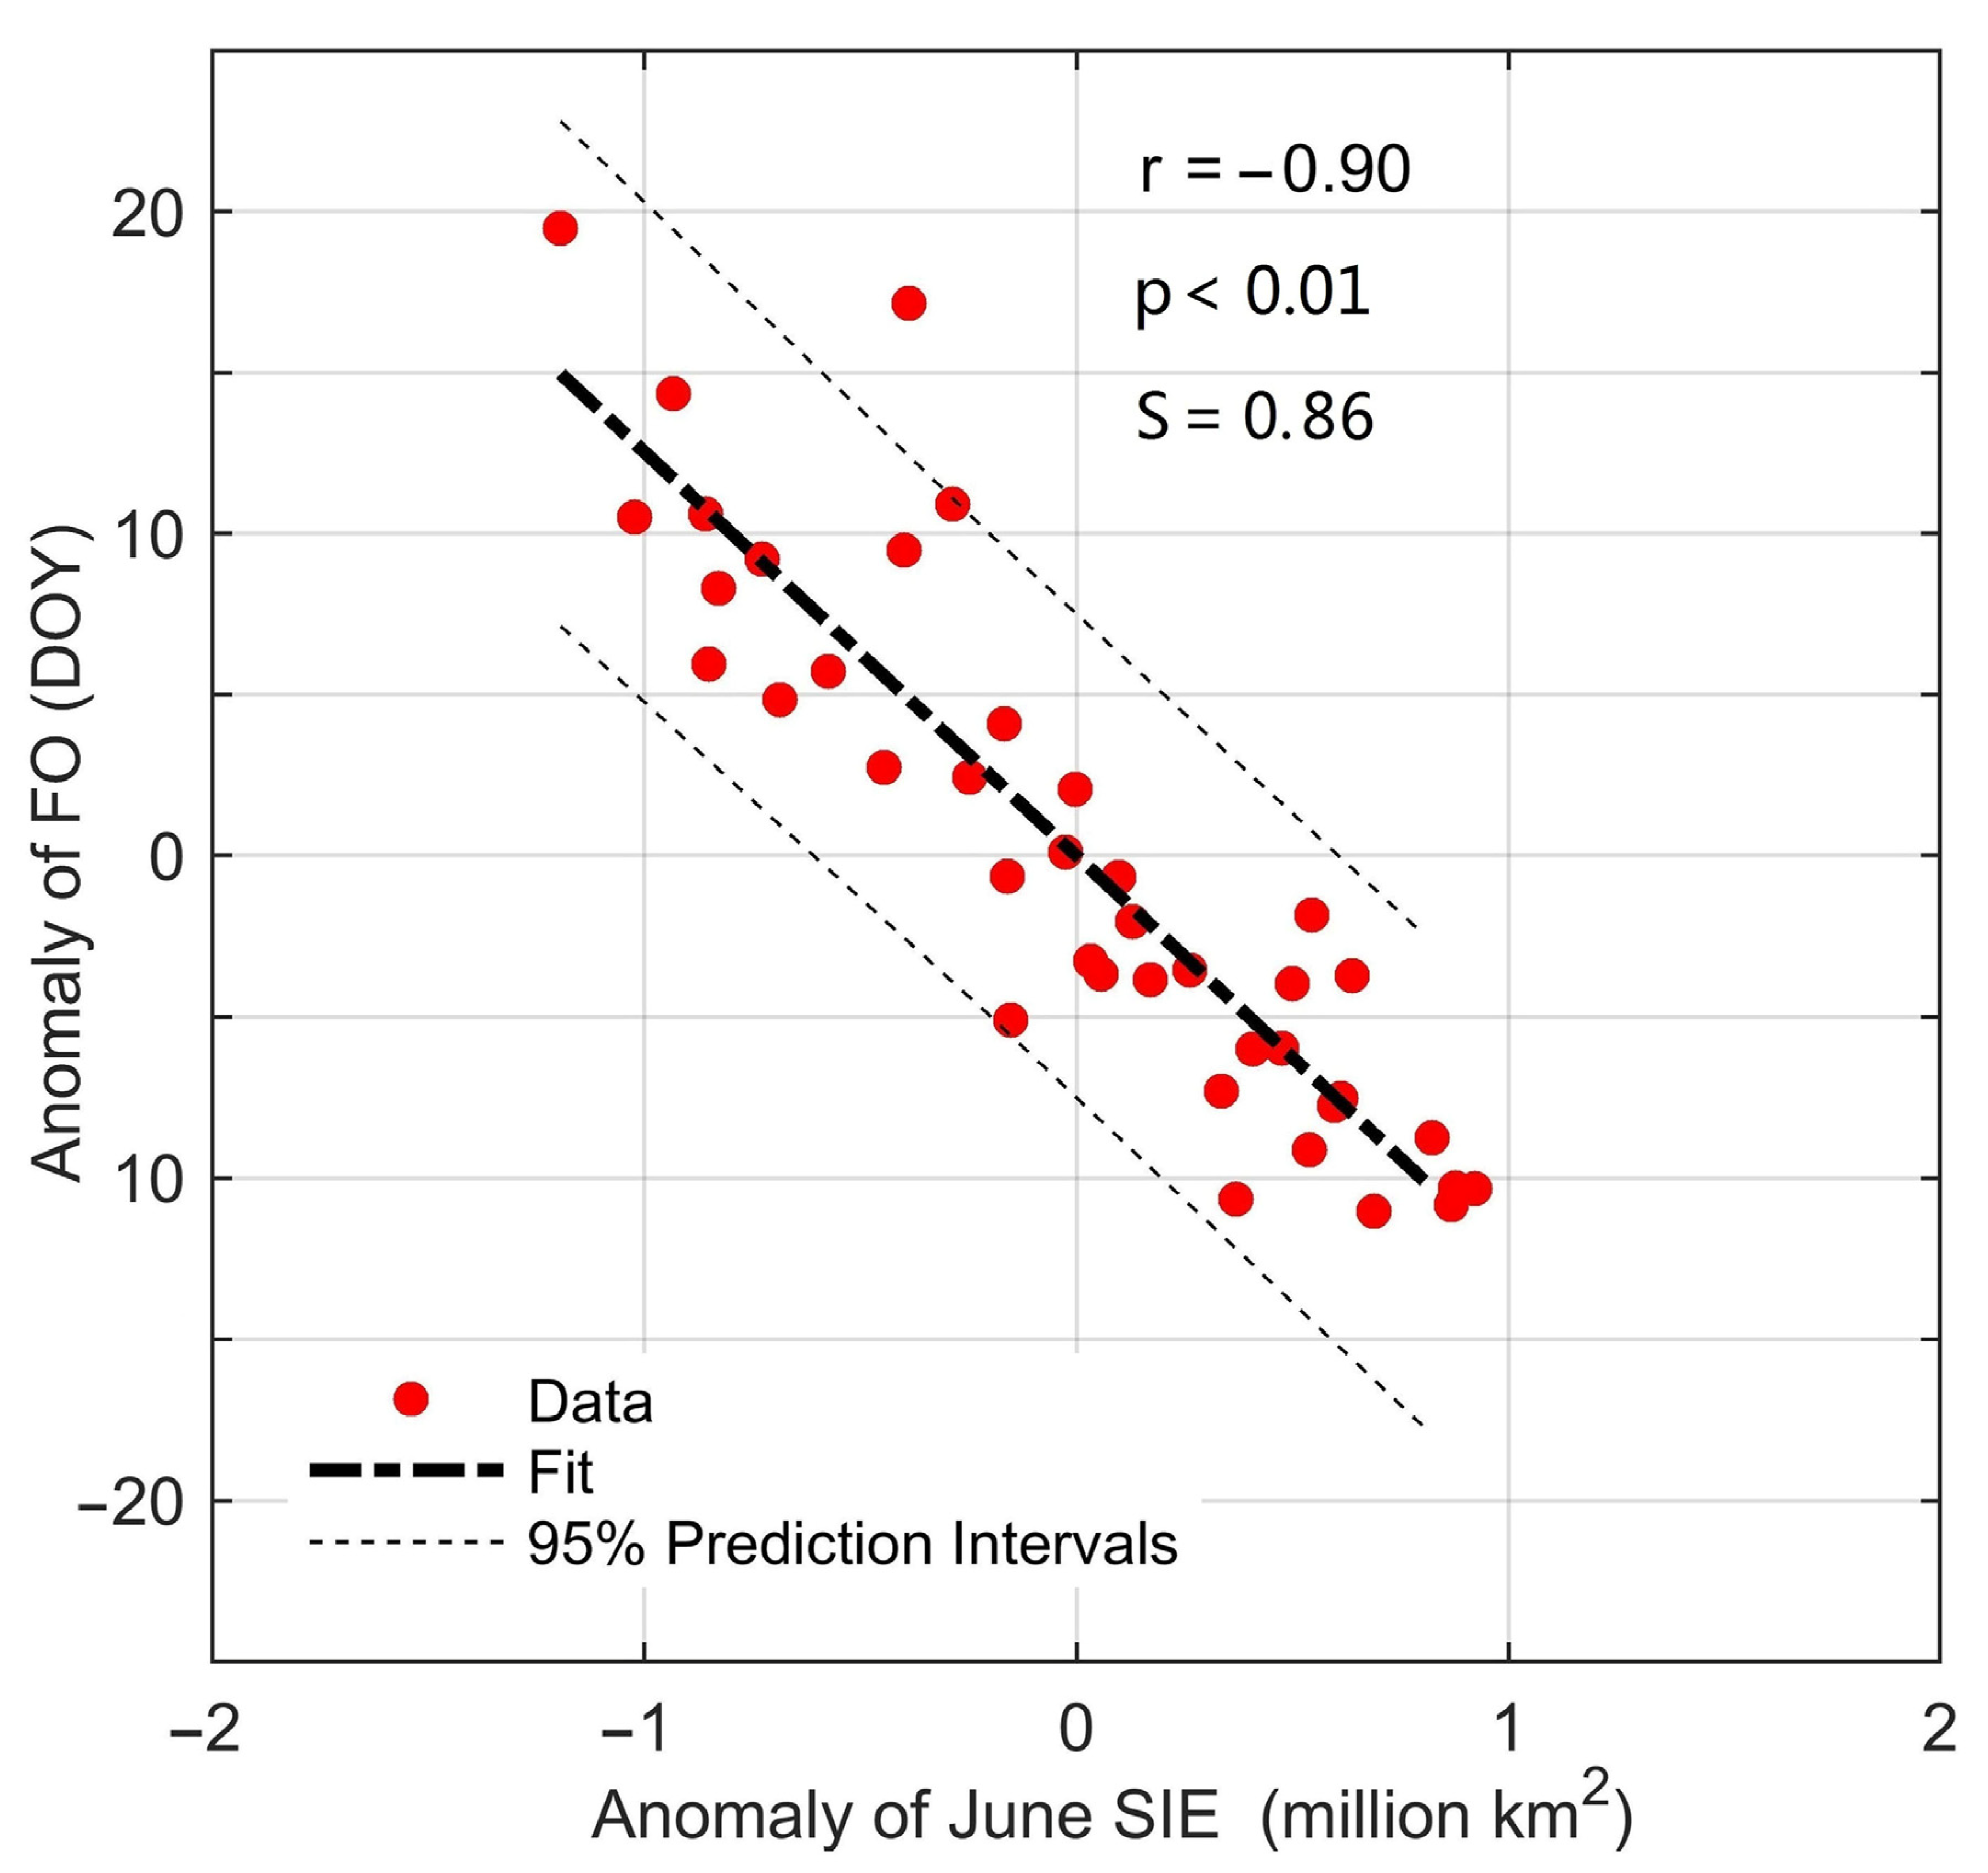
3.1. Correlations between Arctic Melt Timing and Sea Ice Cover

The spatial-averaged Arctic melt timing and monthly SIA (SIE) over the period 1979–2018 are plotted in Figure 2. The Arctic melt season has been significantly lengthened with earlier EMO (−0.20 days year−1) and MO (−0.23 days year−1) as well as later EFO (0.71 days year−1) and FO (0.61 days year−1). Downward trends in SIA and SIE, while present throughout June to September, are largest in September when sea ice cover reaches the minimum. Arctic September SIA and SIE have decreased, with a rate of 4.79 × 10⁴ km2 year−1 (1.09% year−1) and 8.21 × 10⁴ km2 year−1 (1.29% year−1), respectively. All the above trends are significant at the 99% confidence level. Autumn EFO and FO came much later in recent years, with the Arctic sea ice frequently reaching the minimum in summer. Remarkably, the years 2012, 2007 and 2016 have been documented as the three years with the lowest sea ice minimum (i.e., September SIE) and also the latest EFO and FO on record during the study period (gray shadows in Figure 2).
To quantify the relationship between sea ice melt timing and sea ice evolution, we calculate the correlation coefficient between EMO, MO, EFO, FO, and the monthly SIA (SIE) (Figure 3). Generally, SIE was more relevant to melt timing compared with SIA. The decreased sea ice cover in the melt season shows significant correlations with the earlier arrival of EMO and MO. Higher and more significant correlations are found between SIE and the autumn EFO and FO, with all the correlation coefficients higher than 0.90 and significant at the 99% confidence level from June to September. To subtract the long-term trend, additional correlation analyses were conducted based on the detrended time series. Correlations between the detrended freeze-up dates and summer sea ice cover were all still significant at the 99% confidence level from June to September, while the detrended spring melting dates and summer sea ice cover show much weaker correlations. Regionally, the correlations between EFO (FO) and SIA (SIE) vary greatly over the sub-regions. The correlations were all greater than 0.4 and significant at the 99% confidence level over the Laptev, Chukchi, Beaufort, and Kara Seas and Baffin Bay, both for the undetrended and detrended time series.
Furthermore, we examine the performance of predicting the sea ice minimum from the MO (occurs on June 11, on average), and the connection between the autumn FO (occurs on October 3, on average) and early summer sea ice condition (i.e., June SIE). The Arctic sea ice MO shows a fair predictive skill (S = 0.44, r = 0.66) to forecast the September sea ice minimum, while the predictive skill (S = 0.10, r = 0.32) is no longer robust based on the detrended observations. By contrast, we found a strong connection between the June SIE and autumn FO, based on both the original (S = 0.86, r = −0.90) (Figure 4) and detrended series (S = 0.30, r = −0.55). The connection is stronger when using the detrended SIE in July (S = 0.45, r = −0.67) but much weaker when using that before June (S = 0.06, r = −0.24 in May).

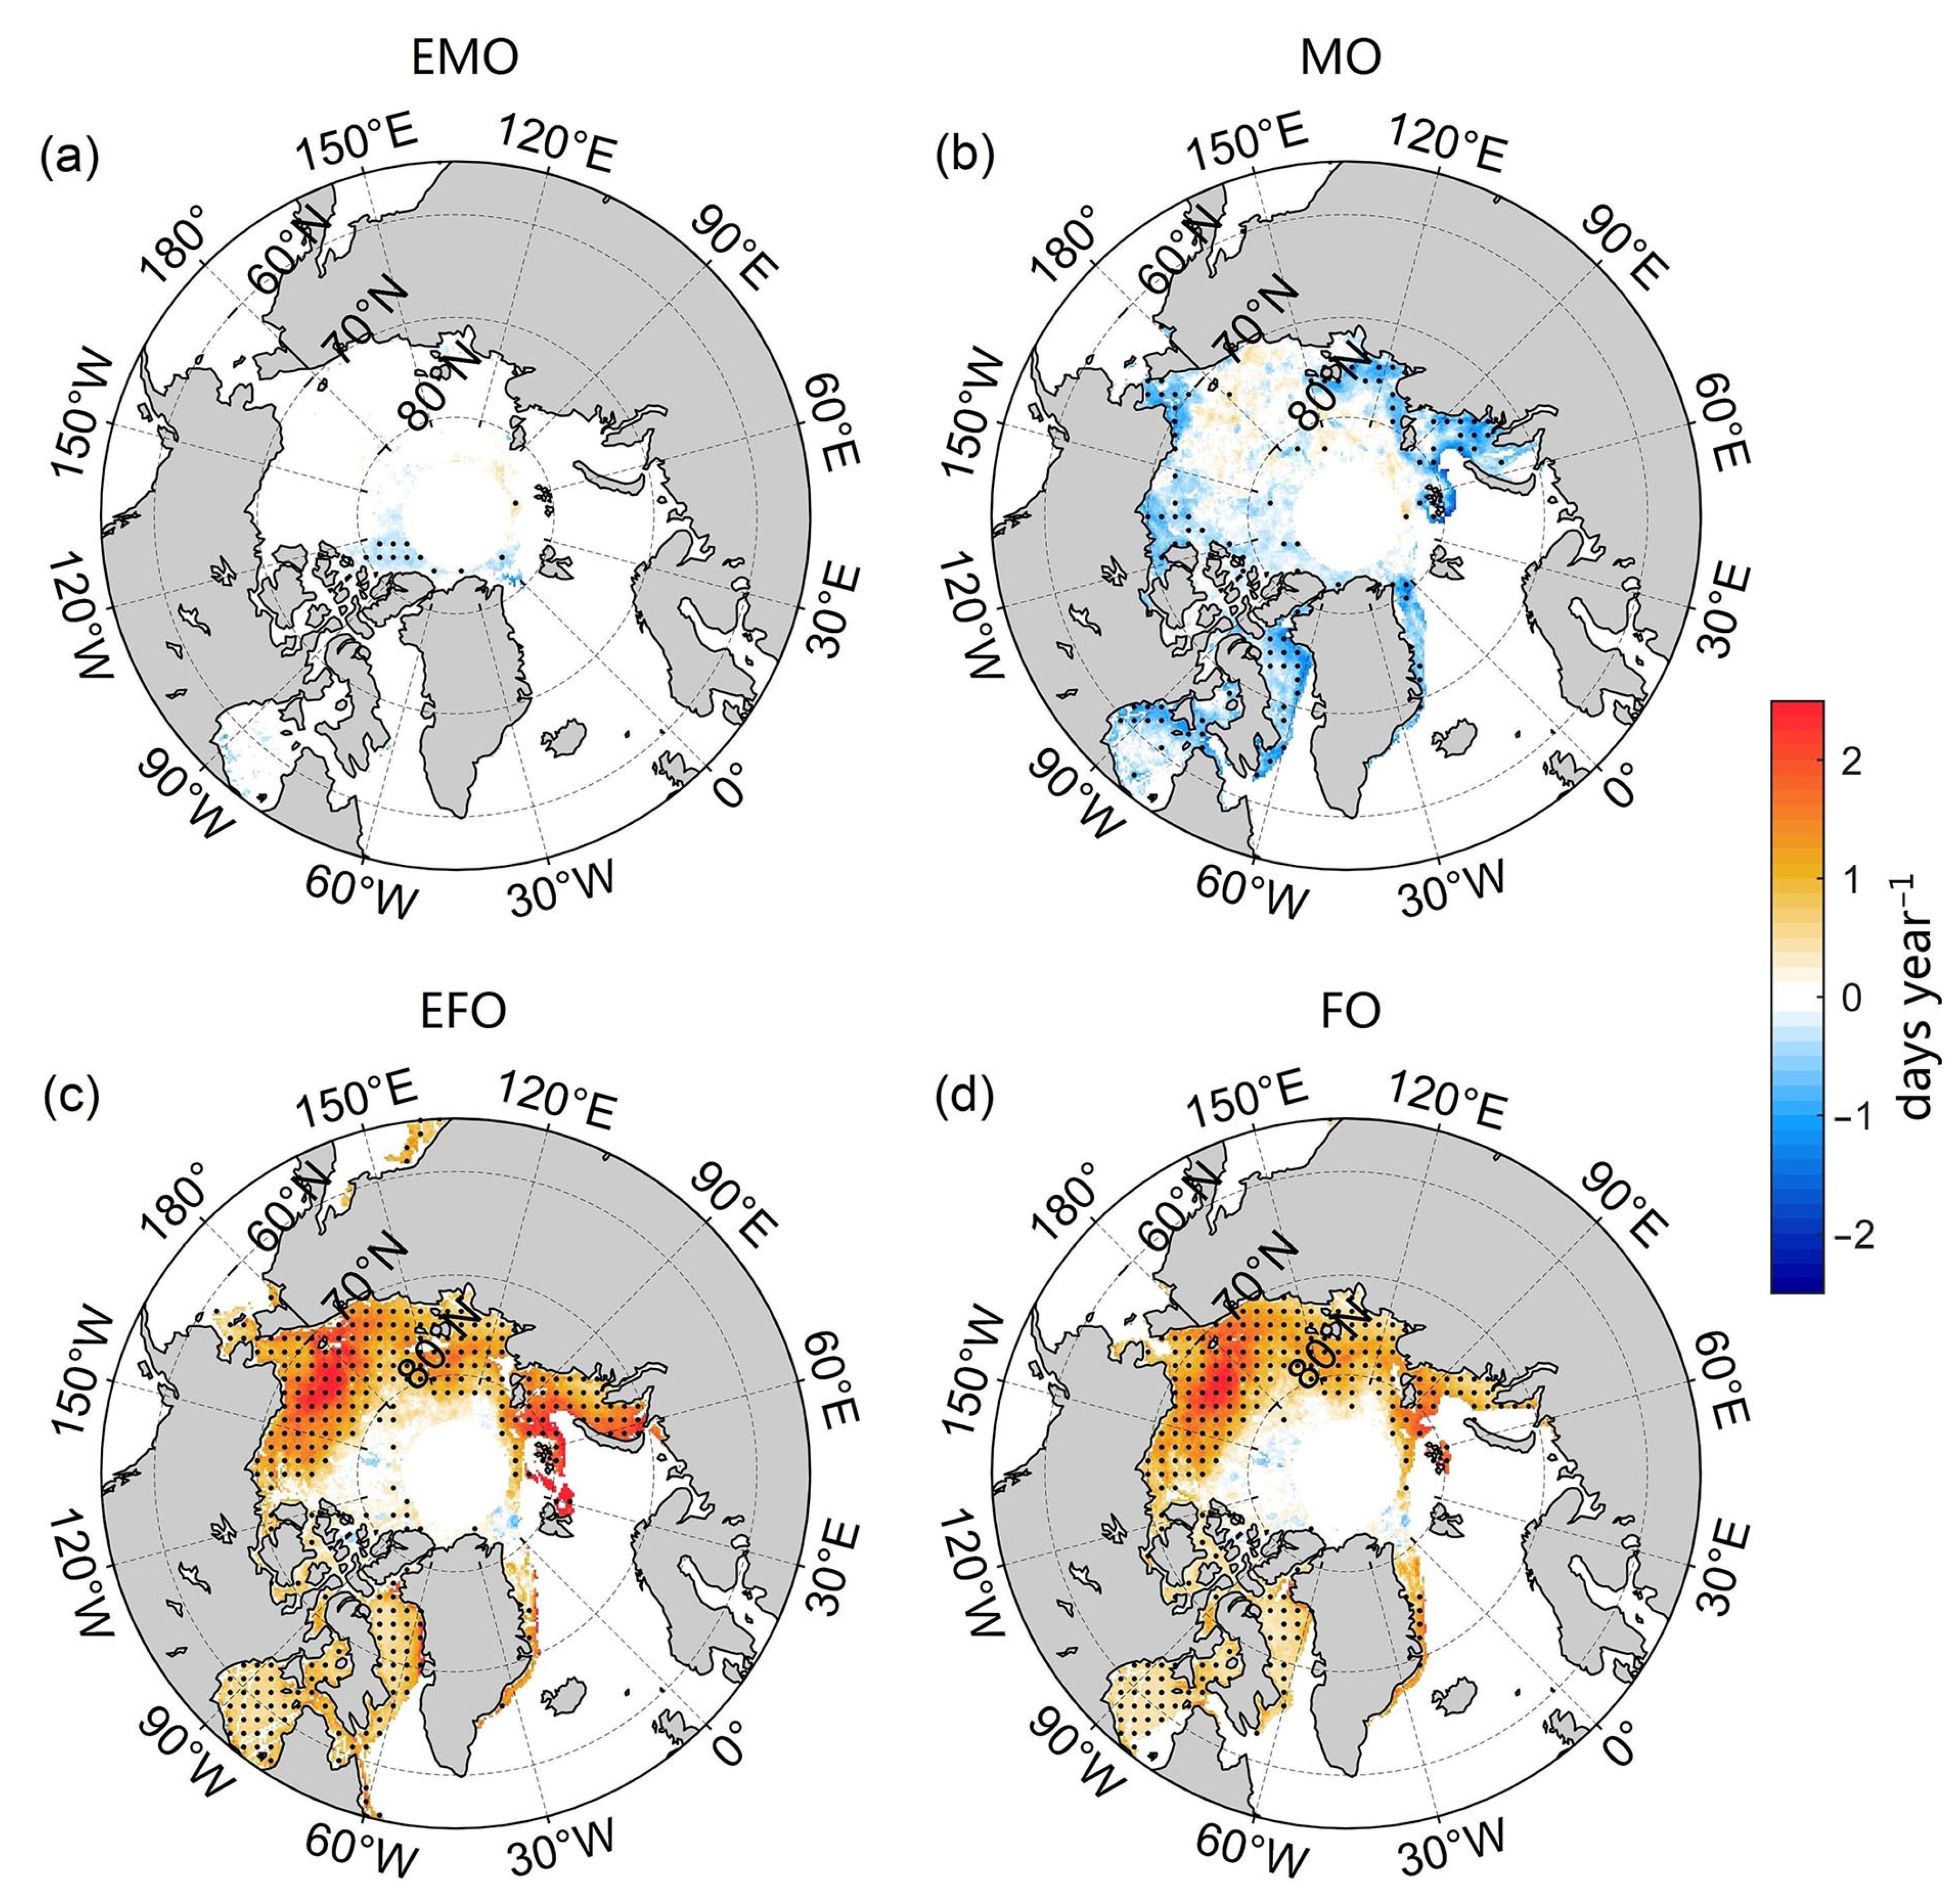
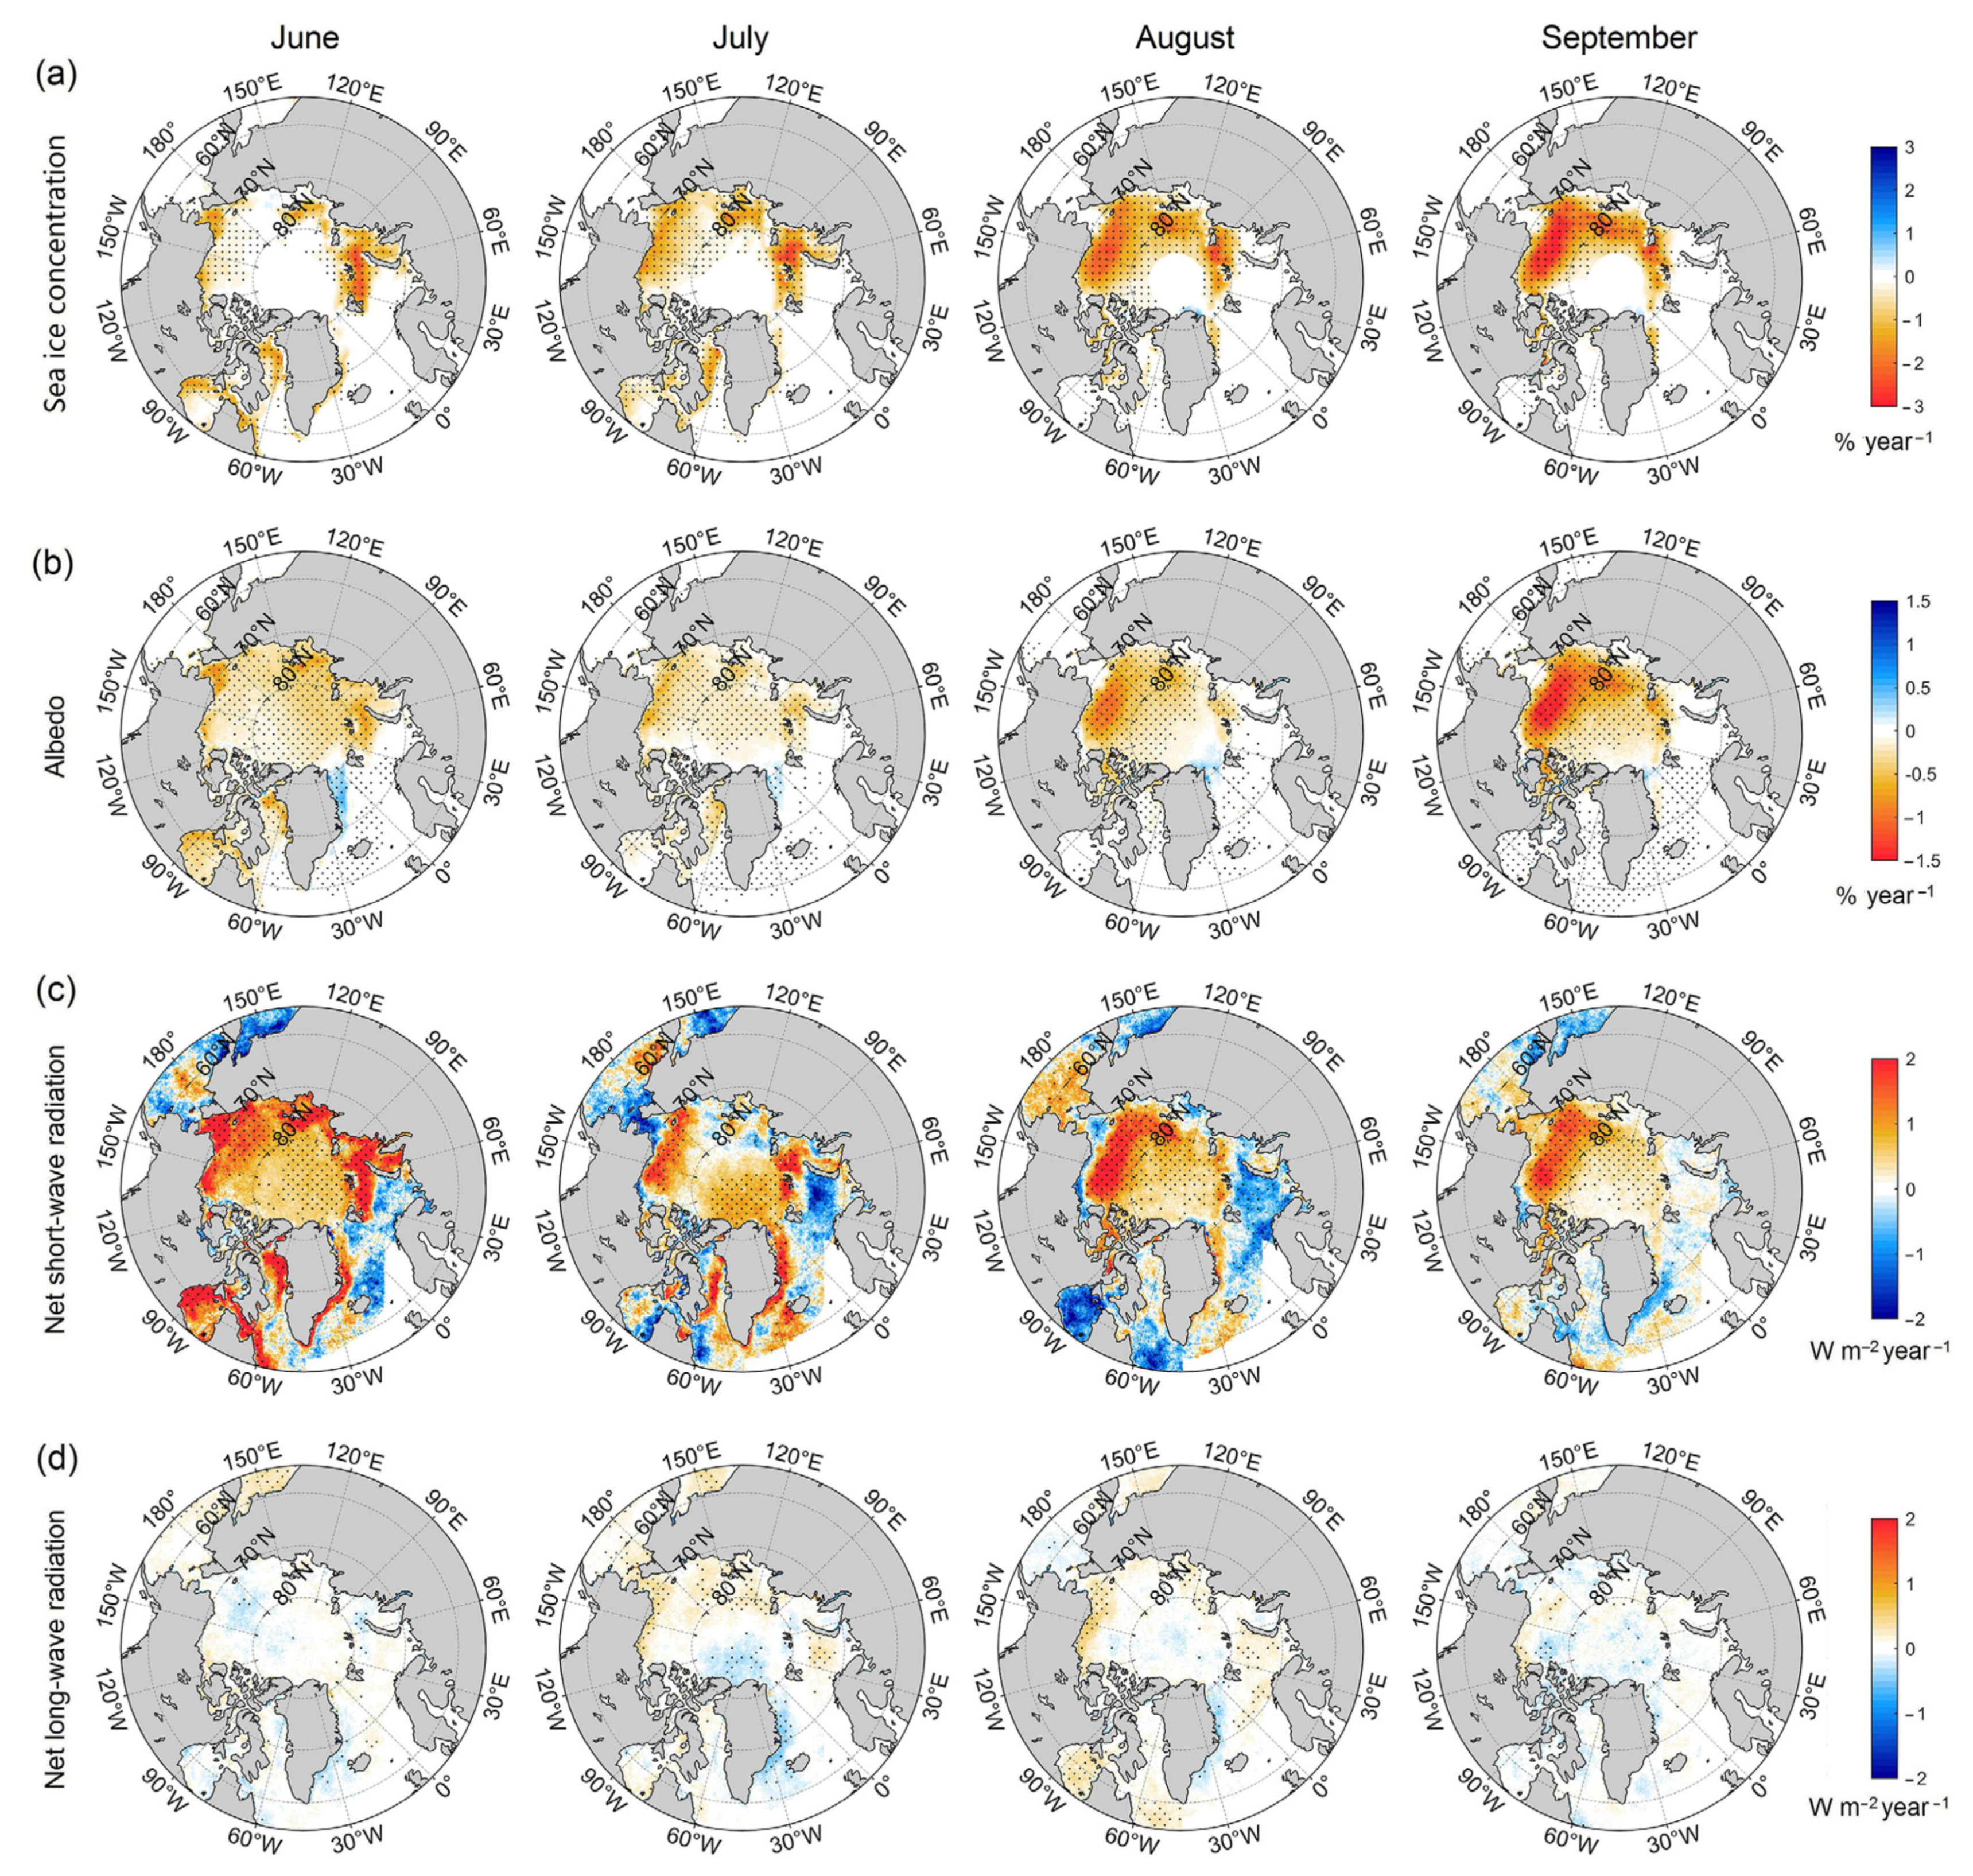
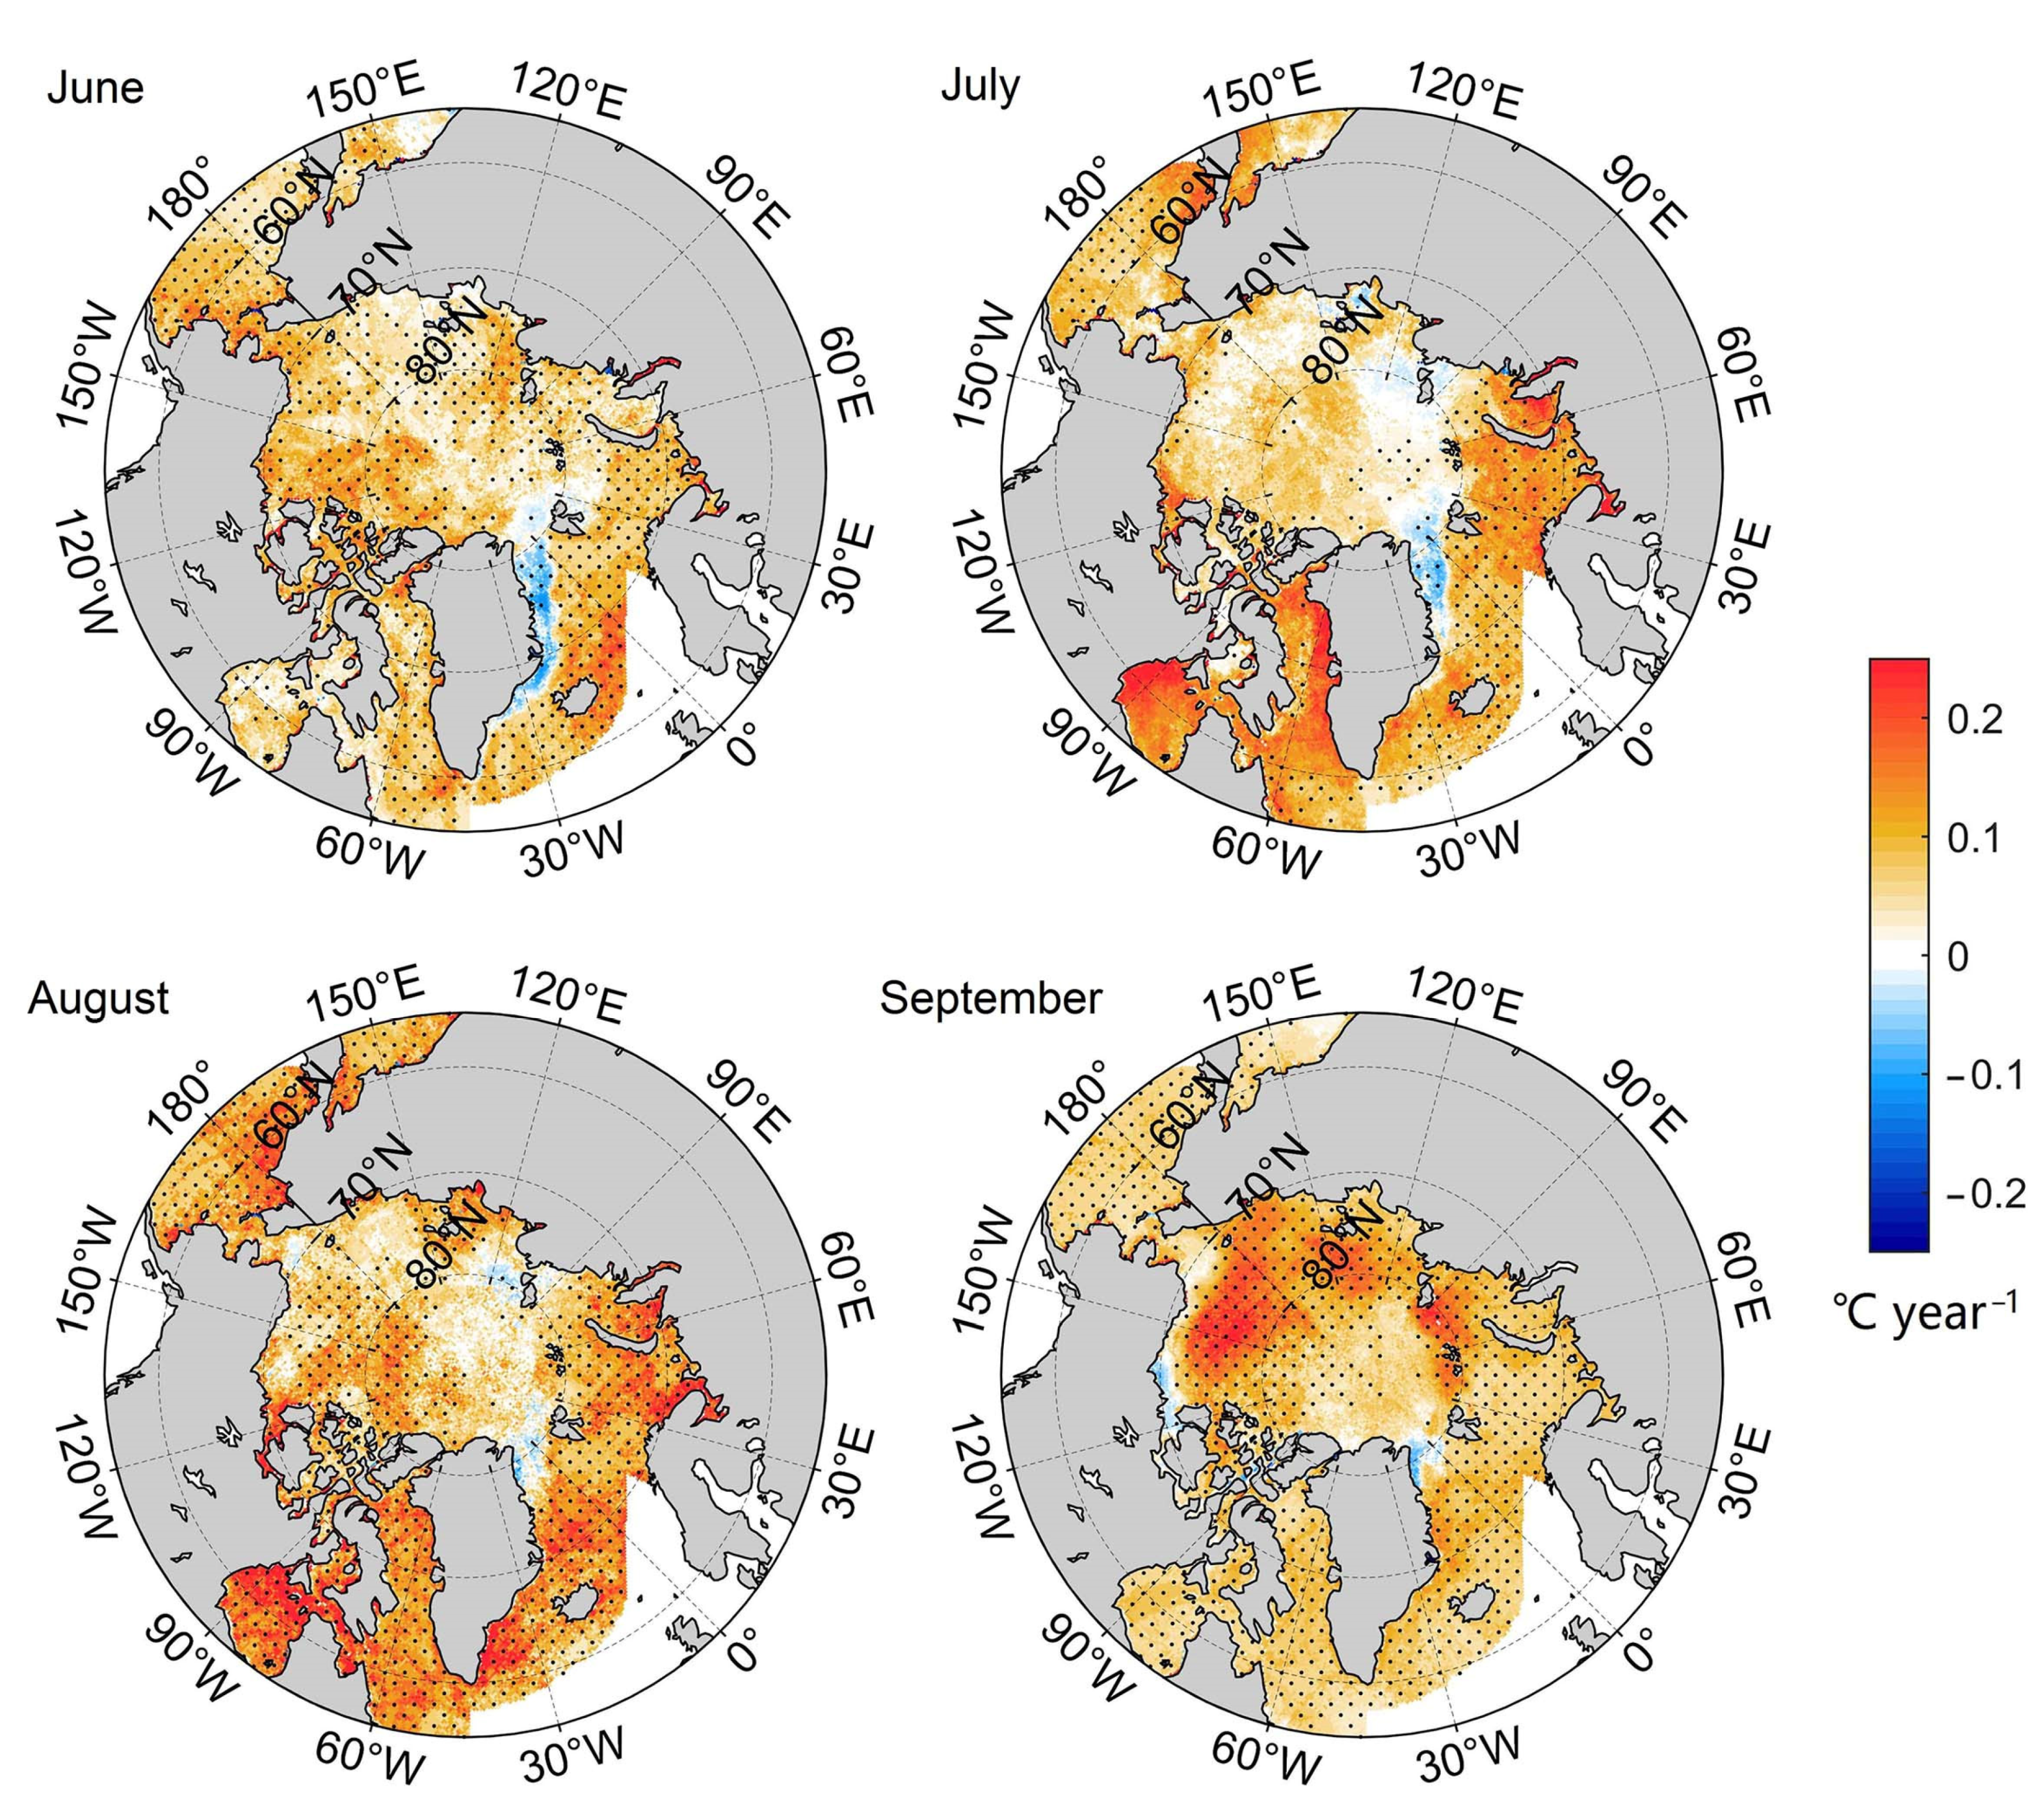
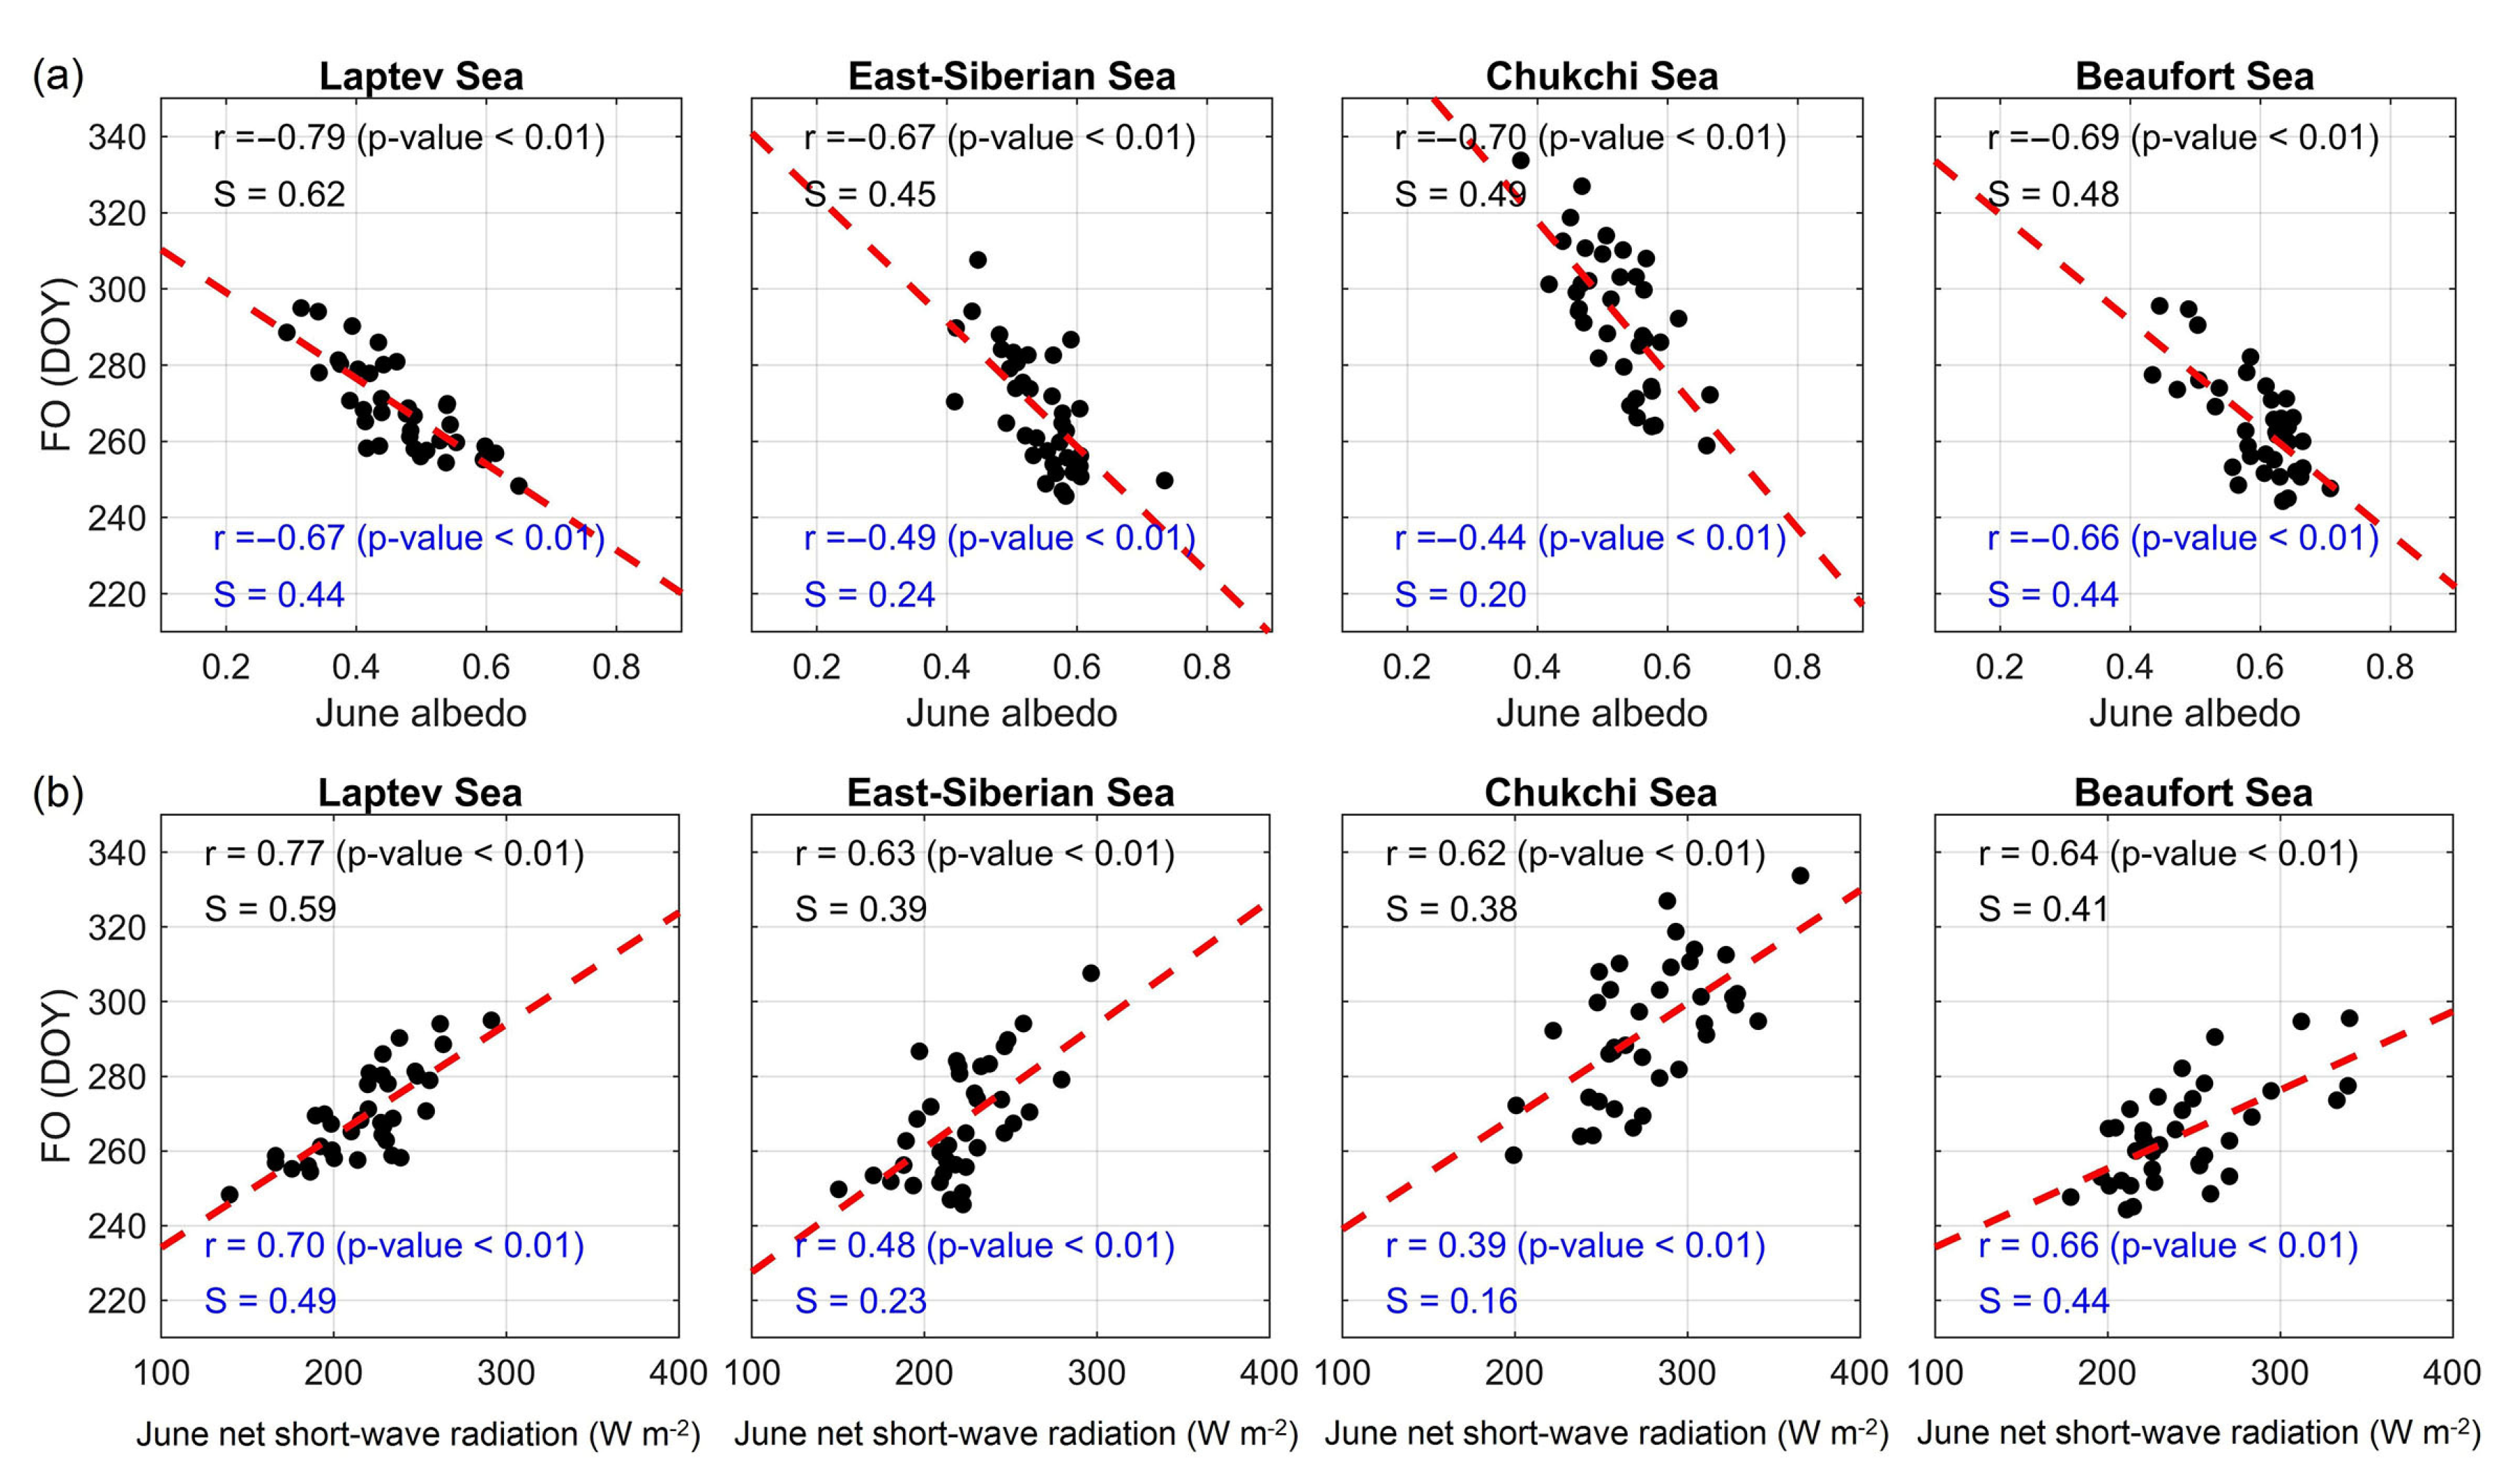
3.2. Changes in Arctic Sea Ice, Albedo, and Radiation

To explore the potential atmospheric forcings that contribute to the connections between melt timing and sea ice evolution, we examine the spatial variabilities of sea ice melt timing, SIC, albedo, and radiation during 1982–2018 (APP-x is only available after 1982) from June to September (Figure 5 and Figure 6 and Table 1). Change in the Arctic melt season was dominated by a delay in EFO and FO (Figure 5). Overall, EFO and FO in the Arctic occurred significantly later (99% confidence level), with a rate of 0.71 days year−1 and 0.61 days year−1, respectively (Table 1). Slightly earlier arrival of MO can be found in the marginal sea ice zone, corresponding to the regions with decreased SIC in June and July. Regions with a significant delay in EFO and FO as well as a decrease in sea ice cover and albedo are mainly distributed within 120° W–120° E, including the Laptev, East-Siberian, Chukchi, and Beaufort Seas (Figure 5 and Figure 6). In particular, part of the Chukchi Sea exhibited a statistically significant trend toward later EFO and FO, with a rate > 2 days year−1.
The Arctic SIC and surface albedo showed similar change patterns (Figure 6). In September, the decreases in SIC and albedo (absolute change of −0.17% year−1) were larger than that in the previous months. Net short-wave radiation in the Laptev, East-Siberian, Chukchi, and Beaufort Seas increased throughout the melt season, with a rate two to four times higher than the whole Arctic, while that in the Barents Sea slightly declined. Changes in net long-wave radiation were much smaller compared with those in net short-wave radiation in all months. The increase rate in summer net short-wave radiation was about ten times higher than that in net long-wave radiation, suggesting the variations in radiation budget during the melt season were dominated by the partitioning of solar radiation (Table 1).
As can be seen in Figure 4, the Arctic sea ice autumn FO was strongly related to the SIE in early summer. Additionally, we found strong correlations between the Arctic FO and monthly APP-x albedo and net short-wave radiation throughout the summer as well as the skin temperature in September (r = 0.74, p < 0.01). Skin temperature increased throughout the summer in most Arctic regions, with the largest changes mainly occurring at low-latitude regions before September. In September, however, the hotspots were distributed within 120° W–120° E, where the skin temperature increased with a rate > 0.1 °C year−1 (Table 1 and Figure 7), corresponding to the regions with significant loss of sea ice, decline in surface albedo, and delay in FO (Figure 5 and Figure 6).
Overall, the delay in FO in the Arctic was accompanied by a decline in surface albedo (−0.13% year−1), an enhanced net short-wave radiation (0.21 W m−2 year−1), and an increase in skin temperature (0.08 °C year−1) in summer (Table 1). It is useful to examine the regions with significant changes in sea ice cover, temperature, and FO (i.e., the Laptev, East-Siberian, Chukchi, and Beaufort Seas) in more detail. We compared the autumn FO with the APP-x albedo and net short-wave radiation in June to see how the early summer sea ice condition can affect the autumn freezing process (Figure 8). Over the period 1982–2018, FO was statistically anti-correlated with June albedo (Figure 8a) in these regions, especially in the Laptev Sea (r = −0.79, p < 0.01). As expected, FO was also strongly related to the June net short-wave radiation in these regions by absorbing more solar radiation with a decreasing albedo due to sea ice loss (Figure 8b). These correlations are still significant above the 99% confidence level, based on the detrended time series. Both surface albedo and net short-wave radiation in June showed good performance in the prediction of FO, especially for the Laptev and Beaufort Seas, where S was greater than 0.4 in all the statistics.

4. Discussion

Uncertainties in the correlation and trend analyses presented in this study stem from the errors in the satellite products due to cross-platform and the deficiencies in algorithms for melt timing and sea ice concentration. Though cross-calibration is conducted for different space-borne instruments, interannual melt timing series are biased by changes in overpass times since surface melting varies throughout the day in accordance with surface weather conditions [48]. The satellite-derived melt timing can be very different when using different melt detection algorithms. EMO derived from the advanced horizontal range algorithm (AHRA) is on average about 20 days earlier than that used in this study [28,36,49]. The advancing trend in EMO based on AHRA is much faster than that based on the latter one [50]. Trends in EMO are even opposite in some regions. Bliss et al. (2019) showed that the algorithm from Markus et al. (2009) is relatively insensitive to early melt events and needs future adjustment [49]. The NASA Team SIC product contains large uncertainties in summer because it is difficult to distinguish between meltwater and the water between ice floes based on radiometer observations [51]. Algorithms based on radiometer can underestimate the actual SIC by up to 40% [52,53]. This would influence the trend and correlation analyses because the earlier MO can result in an increase in summer melt pond fraction [54]. Other SIC products, such as the product from the Ocean and Sea Ice Satellite Application Facility (OSI-SAF), have been reported to show higher accuracy [55]. SIE and SIA computed from different algorithms vary by up to 1.5 million km2. Nevertheless, the linear trends agree reasonably well [8,55]. SIE is calculated based on a SIC threshold of 15% to achieve a well-represented ice extent [56]. As Arctic sea ice has significantly declined in recent decades, alternative thresholds (e.g., 30%, 50%) have been used to define the ice extent [25,57]. A recent study showed that changing the SIC threshold can greatly affect the timing of annual sea ice minimums as well as the trend in SIE [56].
The trends in EMO (−0.20 days year−1) and MO (−0.23 days year−1) based on an updated product remained nearly unchanged compared with those during 1979–2013 (−0.19 days year−1 for EMO and −0.21 days year−1 for MO) [10]. Significant decreasing trends (99% confidence level) in SIC and surface albedo were observed in all months during the summer. This is consistent with previous studies [58,59]. The observed trend in summer skin temperature (0.08 °C year−1) is comparable to earlier estimations [46,60]. A previous study showed that changes in sea ice and cloud cover played dominant roles in the magnitude of trends in recent Arctic skin temperature [60]. The observed decrease in sea ice extent and thickness has contributed to the increase in cloud amount [61]. A recent study showed that the increase of summertime low clouds favors more sea ice melt via emitting stronger longwave radiation [62]. The decreased surface albedo results in more solar radiation absorption (especially for the Beaufort and Chukchi Seas), which further enhances sea ice melt.
As has been documented by Stroeve et al. (2014) [10], the largest and most widespread increase in short-wave radiation occurred in June (Figure 6 and Table 1), suggesting that early summer melt has an important impact on the total amount of solar energy absorption in the ice-ocean system. However, the Arctic sea ice EMO and MO are not promising predictors to forecast the summer sea ice evolution. EMO and MO do not show better performances in the prediction of the summer sea ice minimum compared with melt ponds, as documented in previous studies (e.g., [20]). The lack of significant correlation between MO and summer sea ice extent has been previously reported in the first decade of the 21st century [40]. This is partly because the change in albedo from dry snow to wet snow is relatively small compared with that in the transition from sea ice into a water body. Besides, the melt season may start slowly, and sea ice melting conditions can be affected by other extreme weather conditions such as anomalous warm winds and unusual atmospheric circulation patterns. A previous study has shown that the short-term melt pond information integrated through late spring cannot provide a promising prediction of the summer sea ice minimum [21].
The evolution of sea ice in the early melt season plays an important role in the atmosphere-ice-ocean system because the incoming solar radiation at this time is large; thus, the effect of sea ice cover variations can propagate through the entire melt season. However, sea ice conditions integrated through a certain period, rather than a single point in time such as EMO and MO, can provide the prediction of the subsequent sea ice conditions. This also explains why the Arctic autumn FO was well connected with the sea ice extent in June. We found a close relationship between autumn FO and the June net short-wave radiation in the regions that experienced a rapid decline in sea ice concentration and an increase in late summer skin temperature. The impact of solar heating due to sea ice loss is at the core of the ice-albedo feedback [63]. Surprisingly, SIE showed a higher correlation with melt timing than SIA, which is a more quantitative way of describing sea ice coverage and might be more reasonable and appropriate for understanding the relationship with other climatic variables. FO is close to the day of advance, which has been predicted reasonably based on the day of retreat in some regions [25,26,29]. Compared with the retreat day, June SIE is much easier to measure. In addition, the retreat day shows greatly spatial and inter-annual variations, whereas the June SIE is quickly available after June and therefore is more appropriate for the prediction of the subsequent evolution of sea ice.
Sea ice in the Laptev, East-Siberian, Chukchi, and Beaufort Seas presented trends toward significant delay in FO and decline in sea ice cover throughout the summer. These regions have also been found to have early occurrence and wide distribution of melt ponds [21,64]. Together with the lengthening of the open water season, the increased water fraction can lead to enhanced solar heat input in the mixed layer during the summertime [31,65]. The significant decreases in surface albedo and increases in net short-wave radiation throughout the melt season (Figure 6) have likely resulted in the observed increases in skin temperatures (especially in late summer, Figure 7) and hence a delay in the subsequent refreezing process [10].

5. Conclusions

This paper examines the connections between the Arctic melt timing and summer sea ice condition using 40-year (1979–2018) time-series measurements generated by passive microwave remote sensing observations. Both the Arctic sea ice area and extent have rapidly declined throughout the melt season, accompanied by a significant lengthening of the melt season, which is dominated by a delay in the autumn freeze-up. The years with record lowest sea ice minimums are also characterized by the latest freeze-up onset. Correlation analyses show that the autumn freeze-up onset was well connected with the early summer sea ice extent, while melt onset is not promising in the prediction of summer sea ice evolution. The results suggest sea ice observation integrated through a certain period can provide the prediction of the subsequent sea ice condition. Sea ice in the Laptev, East-Siberian, Chukchi, and Beaufort Seas showed the most rapid decline of sea ice cover and also presented a trend toward significant delay in autumn freeze-up onset due to enhanced absorption of solar radiation as a consequence of sea ice loss since the early summer. This study presents evidence of sea ice-albedo feedback from the remote sensing perspective.

Author Contributions

Conceptualization, L.Z. and X.C.; methodology, L.Z.; writing—original draft preparation, L.Z.; writing—review and editing, X.C., Z.C. and Q.L.; visualization, L.Z.; supervision, X.C.; project administration, X.C. and Z.C. All authors have read and agreed to the published version of the manuscript.

Funding

This study was supported by the National Key Research and Development Program of China (Grant No. 2019YFC1509104), the National Natural Science Foundation of China (Grant No. 42006192) and the Innovation Group Project of Southern Marine Science and Engineering Guangdong Laboratory (Zhuhai) (No. 311021008).

Acknowledgments

We thank the NASA Goddard Earth Science Laboratories for providing the sea ice melt timing dataset (https://earth.gsfc.nasa.gov/cryo/data/arctic-sea-ice-melt, accessed on 23 June 2020), the NSIDC for providing the Northern Hemisphere NASA Team sea ice concentration dataset (https://n5eil01u.ecs.nsidc.org/PM/NSIDC-0051.001/, accessed on 11 May 2020), and the NOAA for providing the AVHRR Polar Pathfinder product (https://www.ncdc.noaa.gov/cdr/atmospheric/extended-avhrr-polar-pathfinder-app-x, accessed on 18 June 2020). We greatly appreciate Jiping Liu from State University of New York at Albany and Kang Wang from East China Normal University for insightful discussions of this study. The anonymous reviewers are thanked for their insightful comments and valuable suggestions.

Conflicts of Interest

The authors declare no conflict of interest.

References

  1. NSIDC Sea Ice Index Arctic- and Antarctic-Wide Changes in Sea Ice. Available online: https://nsidc.org/data/seaice_index (accessed on 25 June 2020).
  2. Grunseich, G.; Wang, B. Predictability of arctic annual minimum sea ice patterns. J. Clim. 2016, 29, 7065–7088. [Google Scholar] [CrossRef]
  3. Winton, M. Amplified Arctic climate change: What does surface albedo feedback have to do with it? Geophys. Res. Lett. 2006, 33, L03701. [Google Scholar] [CrossRef] [Green Version]
  4. Kwok, R.; Spreen, G.; Pang, S. Arctic sea ice circulation and drift speed: Decadal trends and ocean currents. J. Geophys. Res. Ocean. 2013, 118, 2408–2425. [Google Scholar] [CrossRef]
  5. Spreen, G.; Kwok, R.; Menemenlis, D. Trends in Arctic sea ice drift and role of wind forcing: 1992–2009. Geophys. Res. Lett. 2011, 38, L19501. [Google Scholar] [CrossRef] [Green Version]
  6. Kwok, R. Arctic sea ice thickness, volume, and multiyear ice coverage: Losses and coupled variability (1958–2018). Environ. Res. Lett. 2018, 13, 105005. [Google Scholar] [CrossRef]
  7. Maslanik, J.A.; Fowler, C.; Stroeve, J.; Drobot, S.; Zwally, J.; Yi, D.; Emery, W. A younger, thinner Arctic ice cover: Increased potential for rapid, extensive sea-ice loss. Geophys. Res. Lett. 2007, 34, L24501. [Google Scholar] [CrossRef] [Green Version]
  8. AMAP. Snow Ice and Permafrost in the Arctic (SWIPA); Arctic Monitoring and Assessment Programme: Oslo, Norway, 2017. [Google Scholar]
  9. Parkinson, C.L. Spatially mapped reductions in the length of the Arctic sea ice season. Geophys. Res. Lett. 2014, 41, 4316–4322. [Google Scholar] [CrossRef] [Green Version]
  10. Stroeve, J.; Markus, T.; Boisvert, L.; Miller, J.; Barrett, A. Changes in Arctic melt season and implifications for sea ice loss. Geophys. Res. Lett. 2014, 41, 1216–1225. [Google Scholar] [CrossRef]
  11. Peng, G.; Steele, M.; Bliss, A.; Meier, W.; Dickinson, S. Temporal Means and Variability of Arctic Sea Ice Melt and Freeze Season Climate Indicators Using a Satellite Climate Data Record. Remote Sens. 2018, 10, 1328. [Google Scholar] [CrossRef] [Green Version]
  12. Smith, A.; Jahn, A. Definition differences and internal variability affect the simulated Arctic sea ice melt season. Cryosphere 2019, 13, 1–20. [Google Scholar] [CrossRef] [Green Version]
  13. Serreze, M.C.; Barrett, A.P.; Stroeve, J.C.; Kindig, D.N.; Holland, M.M. The emergence of surface-based Arctic amplification. Cryosphere 2009, 3, 11–19. [Google Scholar] [CrossRef] [Green Version]
  14. Serreze, M.C.; Barry, R.G. Processes and impacts of Arctic amplification: A research synthesis. Glob. Planet. Chang. 2011, 77, 85–96. [Google Scholar] [CrossRef]
  15. Stroeve, J.; Markus, T.; Meier, W.N.; Miller, J. Recent changes in the Arctic melt season. Ann. Glaciol. 2006, 44, 367–374. [Google Scholar] [CrossRef] [Green Version]
  16. Lei, R.; Tian-Kunze, X.; Lepparanta, M.; Wang, J.; Kaleschke, L.; Zhang, Z. Changes in summer sea ice, albedo, and portioning of surface solar radiation in the Pacific sector of Arctic Ocean during 1982–2009. J. Geophys. Res. Ocean. 2016, 121, 5470–5486. [Google Scholar] [CrossRef]
  17. Stroeve, J.C.; Kattsov, V.; Barrett, A.; Serreze, M.; Pavlova, T.; Holland, M.; Meier, W.N. Trends in Arctic sea ice extent from CMIP5, CMIP3 and observations. Geophys. Res. Lett. 2012, 39, L16502. [Google Scholar] [CrossRef] [Green Version]
  18. Stroeve, J.; Hamilton, L.C.; Bitz, C.M.; Blanchard-Wrigglesworth, E. Predicting September sea ice: Ensemble skill of the SEARCH Sea Ice Outlook 2008–2013. Geophys. Res. Lett. 2014, 41, 2411–2418. [Google Scholar] [CrossRef] [Green Version]
  19. Blanchard-Wrigglesworth, E.; Cullather, R.I.; Wang, W.; Zhang, J.; Bitz, C.M. Model forecast skill and sensitivity to initial conditions in the seasonal Sea Ice Outlook. Geophys. Res. Lett. 2015, 42, 8042–8048. [Google Scholar] [CrossRef] [Green Version]
  20. Schröder, D.; Feltham, D.L.; Flocco, D.; Tsamados, M. September Arctic sea-ice minimum predicted by spring melt-pond fraction. Nat. Clim. Chang. 2014, 4, 353–357. [Google Scholar] [CrossRef]
  21. Liu, J.; Song, M.; Horton, R.M.; Hu, Y. Revisiting the potential of melt pond fraction as a predictor for the seasonal Arctic sea ice extent minimum. Environ. Res. Lett. 2015, 10, 054017. [Google Scholar] [CrossRef] [Green Version]
  22. Zhang, Y.; Cheng, X.; Liu, J.; Hui, F. The potential of sea ice leads as a predictor for summer Arctic sea ice extent. Cryosphere 2018, 12, 3747–3757. [Google Scholar] [CrossRef] [Green Version]
  23. Kwok, R.; Cunningham, G.F.; Armitage, T.W.K. Relationship between specular returns in CryoSat-2 data, surface albedo, and Arctic summer minimum ice extent. Elem. Sci. Anthr. 2018, 6, 53. [Google Scholar] [CrossRef]
  24. Stammerjohn, S.; Massom, R.; Rind, D.; Martinson, D. Regions of rapid sea ice change: An inter-hemispheric seasonal comparison. Geophys. Res. Lett. 2012, 39, L06501. [Google Scholar] [CrossRef] [Green Version]
  25. Stroeve, J.C.; Crawford, A.D.; Stammerjohn, S. Using timing of ice retreat to predict timing of fall freeze-up in the Arctic. Geophys. Res. Lett. 2016, 43, 6332–6340. [Google Scholar] [CrossRef]
  26. Serreze, M.C.; Crawford, A.D.; Stroeve, J.C.; Barrett, A.P.; Woodgate, R.A. Variability, trends, and predictability of seasonal sea ice retreat and advance in the Chukchi Sea. J. Geophys. Res. Ocean. 2016, 121, 7308–7325. [Google Scholar] [CrossRef]
  27. Lebrun, M.; Vancoppenolle, M.; Madec, G.; Massonnet, F. Arctic sea-ice-free season projected to extend into autumn. Cryosphere 2019, 13, 79–96. [Google Scholar] [CrossRef] [Green Version]
  28. Markus, T.; Stroeve, J.C.; Miller, J. Recent changes in Arctic sea ice melt onset, freezeup, and melt season length. J. Geophys. Res. 2009, 114, C12024. [Google Scholar] [CrossRef]
  29. Bliss, A.C.; Steele, M.; Peng, G.; Meier, W.N.; Dickinson, S. Regional variability of Arctic sea ice seasonal change climate indicators from a passive microwave climate data record. Environ. Res. Lett. 2019, 14, 045003. [Google Scholar] [CrossRef]
  30. Perovich, D.K.; Polashenski, C. Albedo evolution of seasonal Arctic sea ice. Geophys. Res. Lett. 2012, 39, L08501. [Google Scholar] [CrossRef]
  31. Steele, M.; Ermold, W.; Zhang, J. Arctic Ocean surface warming trends over the past 100 years. Geophys. Res. Lett. 2008, 35, L02614. [Google Scholar] [CrossRef] [Green Version]
  32. Guo, H.; Li, X.; Qiu, Y. Comparison of global change at the Earth’s three poles using spaceborne Earth observation. Sci. Bull. 2020, 65, 1320–1323. [Google Scholar] [CrossRef]
  33. Curry, J.A.; Schramm, J.L.; Ebert, E.E. Sea-Ice Albedo Climate Feedback Mechanism. J. Clim. 1995, 8, 240–247. [Google Scholar] [CrossRef]
  34. Cao, Y.; Liang, S.; Chen, X.; He, T. Assessment of sea ice albedo radiative forcing and feedback over the Northern Hemisphere from 1982 to 2009 using satellite and reanalysis data. J. Clim. 2015, 28, 1248–1259. [Google Scholar] [CrossRef]
  35. Smith, D.M. Observation of perennial Arctic sea ice melt and freeze-up using passive microwave data. J. Geophys. Res. Ocean. 1998, 103, 27753–27769. [Google Scholar] [CrossRef]
  36. Drobot, S.D.; Anderson, M.R. An improved method for determining snowmelt onset dates over Arctic sea ice using scanning multichannel microwave radiometer and Special Sensor Microwave/Imager data. J. Geophys. Res. Atmos. 2001, 106, 24033–24049. [Google Scholar] [CrossRef] [Green Version]
  37. Marshall, S.; Scott, K.A.; Scharien, R.K. Passive microwave melt onset retrieval based on a variable threshold: Assessment in the Canadian Arctic Archipelago. Remote Sens. 2019, 11, 1304. [Google Scholar] [CrossRef] [Green Version]
  38. Mahmud, M.S.; Howell, S.E.L.; Geldsetzer, T.; Yackel, J. Detection of melt onset over the northern Canadian Arctic Archipelago sea ice from RADARSAT, 1997-2014. Remote Sens. Environ. 2016, 178, 59–69. [Google Scholar] [CrossRef]
  39. Forster, R.R.; Long, D.G.; Jezek, K.C.; Drobot, S.D.; Anderson, M.R. The onset of Arctic sea-ice snowmelt as detected with passive- and active-microwave remote sensing. Ann. Glaciol. 2001, 33, 85–93. [Google Scholar] [CrossRef] [Green Version]
  40. Wang, L.; Wolken, G.J.; Sharp, M.J.; Howell, S.E.L.; Derksen, C.; Brown, R.D.; Markus, T.; Cole, J. Integrated pan-Arctic melt onset detection from satellite active and passive microwave measurements, 2000-2009. J. Geophys. Res. Atmos. 2011, 116, D22103. [Google Scholar] [CrossRef] [Green Version]
  41. Mortin, J.; Schrøder, T.M.; Walløe Hansen, A.; Holt, B.; McDonald, K.C. Mapping of seasonal freeze-thaw transitions across the pan-Arctic land and sea ice domains with satellite radar. J. Geophys. Res. 2012, 117, C08004. [Google Scholar] [CrossRef] [Green Version]
  42. Mortin, J.; Howell, S.E.L.; Wang, L.; Derksen, C.; Svensson, G.; Graversen, R.G.; Schrøder, T.M. Extending the QuikSCAT record of seasonal melt-freeze transitions over Arctic sea ice using ASCAT. Remote Sens. Environ. 2014, 141, 214–230. [Google Scholar] [CrossRef]
  43. Cavalieri, D.J.; Gloersen, P.; Campbell, W.J. Determination of sea ice parameters with the Nimbus 7 SMMR. J. Geophys. Res. 1984, 89, 5355–5369. [Google Scholar] [CrossRef]
  44. Meier, W.N.; Stroeve, J. Comparison of sea-ice extent and ice-edge location estimates from passive microwave and enhanced-resolution scatterometer data. Ann. Glaciol. 2008, 48, 65–70. [Google Scholar] [CrossRef] [Green Version]
  45. Fetterer, F.; Knowles, K.; Meier, W.N.; Savoie, M.; Windnagel, A.K. Sea Ice Index, Version 3; NSIDC (National Snow and Ice Data Center): Boulder, CO, USA, 2017. [Google Scholar] [CrossRef]
  46. Wang, X.; Key, J.R. Arctic Surface, Cloud, and Radiation Properties Based on the AVHRR Polar Pathfinder Dataset. Part II: Recent Trends. J. Clim. 2005, 18, 2575–2593. [Google Scholar] [CrossRef]
  47. Key, J.; Wang, X.; Liu, Y.; Dworak, R.; Letterly, A. The AVHRR Polar Pathfinder Climate Data Records. Remote Sens. 2016, 8, 167. [Google Scholar] [CrossRef] [Green Version]
  48. Picard, G.; Fily, M. Surface melting observations in Antarctica by microwave radiometers: Correcting 26-year time series from changes in acquisition hours. Remote Sens. Environ. 2006, 104, 325–336. [Google Scholar] [CrossRef]
  49. Bliss, A.; Miller, J.; Meier, W. Comparison of Passive Microwave-Derived Early Melt Onset Records on Arctic Sea Ice. Remote Sens. 2017, 9, 199. [Google Scholar] [CrossRef] [Green Version]
  50. Bliss, A.C.; Anderson, M.R. Snowmelt onset over Arctic sea ice from passive microwave satellite data: 1979–2012. Cryosph. 2014, 8, 2089–2100. [Google Scholar] [CrossRef] [Green Version]
  51. Cavalieri, D.J.; Burns, B.A.; Onstott, R.G. Investigation of the effects of summer melt on the calculation of sea ice concentration using active and passive microwave data. J. Geophys. Res. 1990, 95, 5359–5369. [Google Scholar] [CrossRef]
  52. Rösel, A.; Kaleschke, L.; Birnbaum, G. Melt ponds on Arctic sea ice determined from MODIS satellite data using an artificial neural network. Cryosphere 2012, 6, 431–446. [Google Scholar] [CrossRef] [Green Version]
  53. Kern, S.; Rösel, A.; Toudal Pedersen, L.; Ivanova, N.; Saldo, R.; Tage Tonboe, R. The impact of melt ponds on summertime microwave brightness temperatures and sea-ice concentrations. Cryosphere 2016, 10, 2217–2239. [Google Scholar] [CrossRef] [Green Version]
  54. Istomina, L.; Heygster, G.; Huntemann, M.; Marks, H.; Melsheimer, C.; Zege, E.; Malinka, A.; Prikhach, A.; Katsev, I. Melt pond fraction and spectral sea ice albedo retrieval from MERIS data—Part 2: Case studies and trends of sea ice albedo and melt ponds in the Arctic for years 2002-2011. Cryosphere 2015, 9, 1567–1578. [Google Scholar] [CrossRef] [Green Version]
  55. Ivanova, N.; Pedersen, L.T.; Tonboe, R.T.; Kern, S.; Heygster, G.; Lavergne, T.; Sørensen, A.; Saldo, R.; Dybkjær, G.; Brucker, L.; et al. Inter-comparison and evaluation of sea ice algorithms: Towards further identification of challenges and optimal approach using passive microwave observations. Cryosphere 2015, 9, 1797–1817. [Google Scholar] [CrossRef] [Green Version]
  56. Matthews, J.L.; Peng, G.; Meier, W.N.; Brown, O. Sensitivity of arctic sea ice extent to sea ice concentration threshold choice and its implication to ice coverage decadal trends and statistical projections. Remote Sens. 2020, 12, 807. [Google Scholar] [CrossRef] [Green Version]
  57. Ji, Q.; Li, F.; Pang, X.; Luo, C. Statistical analysis of SSMIS sea ice concentration threshold at the arctic sea ice edge during summer based on MODIS and ship-based observational data. Sensors 2018, 18, 1109. [Google Scholar] [CrossRef] [Green Version]
  58. Riihelä, A.; Manninen, T.; Laine, V. Observed changes in the albedo of the Arctic sea-ice zone for the period 1982-2009. Nat. Clim. Chang. 2013, 3, 895–898. [Google Scholar] [CrossRef]
  59. Wang, Y.; Bi, H.; Huang, H.; Liu, Y.; Liu, Y.; Liang, X.; Fu, M.; Zhang, Z. Satellite-observed trends in the Arctic sea ice concentration for the period 1979–2016. J. Oceanol. Limnol. 2019, 37, 18–37. [Google Scholar] [CrossRef]
  60. Liu, Y.; Key, J.R.; Wang, X. Influence of changes in sea ice concentration and cloud cover on recent Arctic surface temperature trends. Geophys. Res. Lett. 2009, 36, L20710. [Google Scholar] [CrossRef] [Green Version]
  61. Palm, S.P.; Strey, S.T.; Spinhirne, J.; Markus, T. Influence of Arctic sea ice extent on polar cloud fraction and vertical structure and implications for regional climate. J. Geophys. Res. Atmos. 2010, 115, 1–9. [Google Scholar] [CrossRef] [Green Version]
  62. Huang, Y.; Ding, Q.; Dong, X.; Xi, B.; Baxter, I. Summertime low clouds mediate the impact of the large-scale circulation on Arctic sea ice. Commun. Earth Environ. 2021, 2, 38. [Google Scholar] [CrossRef]
  63. Perovich, D.K.; Jones, K.F.; Light, B.; Eicken, H.; Markus, T.; Stroeve, J.; Lindsay, R. Solar partitioning in a changing Arctic sea-ice cover. Ann. Glaciol. 2011, 52, 192–196. [Google Scholar] [CrossRef] [Green Version]
  64. Zhang, J.; Schweiger, A.; Webster, M.; Light, B.; Steele, M.; Ashjian, C.; Campbell, R.; Spitz, Y. Melt Pond Conditions on Declining Arctic Sea Ice Over 1979–2016: Model Development, Validation, and Results. J. Geophys. Res. Ocean. 2018, 123, 7983–8003. [Google Scholar] [CrossRef] [Green Version]
  65. Perovich, D.K.; Light, B.; Eicken, H.; Jones, K.F.; Runciman, K.; Nghiem, S.V. Increasing solar heating of the Arctic Ocean and adjacent seas, 1979–2005: Attribution and role in the ice-albedo feedback. Geophys. Res. Lett. 2007, 34, L19505. [Google Scholar] [CrossRef] [Green Version]
Figure 1. The Arctic and its sub-regions.
Remotesensing 13 02162 g001
Figure 2. Variations in Arctic sea ice melt timing, monthly sea ice area (SIA), and sea ice extent (SIE) for 1979–2018. Gray shadows indicate the three years (e.g., 2012, 2007 and 2016) with the lowest SIEs and also the latest EFO and FO on record.
Remotesensing 13 02162 g002
Figure 3. Correlations between the Arctic melt timing and monthly SIA/SIE during the satellite era (1979–2018). (a) Correlation coefficient for the original time series. (b) Correlation coefficient for the detrended time series. A superscript with a, b, and c indicates the correlation is significant at the 99%, 95%, and 90% confidence level, respectively.
Remotesensing 13 02162 g003
Figure 4. Scatterplot shows the relationship between the Arctic sea ice FO and June SIE.
Remotesensing 13 02162 g004
Figure 5. Trend in the satellite-derived sea ice: (a) EMO, (b) MO, (c) EFO, and (d) FO for 1982–2018. Black points indicate the trends that are significantly above the 95% confidence level.
Remotesensing 13 02162 g005
Figure 6. Trend in the satellite-derived Arctic (a) monthly sea ice concentration, (b) monthly albedo, (c) monthly net short-wave radiation, and (d) monthly net long-wave radiation for 1982–2018. Black points indicate the trends that are significantly above the 95% confidence level.
Remotesensing 13 02162 g006
Figure 7. Trend in monthly Arctic APP-x skin temperature for 1982–2018. Black dots indicate the trends that are significantly above the 95% significance level.
Remotesensing 13 02162 g007
Figure 8. Scatterplots showing the relationships between autumn FO and (a) June albedo and (b) June net short-wave radiation in the Laptev, East-Siberian, Chukchi, and Beaufort Seas. Black and blue texts represent the statistics based on undetrended and detrended time series, respectively.
Remotesensing 13 02162 g008
Table 1. Trends in melt timing, albedo, net long-wave radiation, net short-wave radiation, and skin temperature over the Arctic and its sub-regions for 1982–2018. The italic, underlined, and bold values indicate the trends that are significant at the 90%, 95%, and 99% confidence levels. Uncertainties (in parentheses) of the trends were estimated at 95% confidence level.
TrendUnitsOkhotskBeringHudsonSt-
Lawrence
BaffinGreenlandBarentsKaraLaptevEast-
Siberian
ChukchiBeaufortCanadian ArchipelagoCentral
Arctic
The Arctic
EMOdays year−1−0.09 (0.24)−0.04 (0.30)−0.25 (0.21)\−0.46(0.33)−0.65(0.26)−0.86(0.36)−0.46(0.22)−0.18 (0.20)−0.07 (0.15)−0.13 (0.20)−0.22 (0.17)−0.12 (0.15)−0.15 (0.13)−0.20(0.10)
MOdays year−1−0.30 (0.30)−0.29 (0.28)−0.31(0.20)\−0.60(0.30)−0.69(0.24)−0.79(0.44)−0.47(0.16)−0.25 (0.19)−0.04 (0.13)−0.15(0.17)−0.23(0.15)−0.18 (0.14)−0.12(0.14)−0.23(0.09)
EFOdays year−10.83(0.24)0.58(0.27)0.71(0.18)\0.71(0.20)0.56(0.31)1.46(0.45)1.06(0.27)0.87(0.26)1.17(0.28)1.42(0.32)0.84(0.29)0.36(0.22)0.27(0.14)0.71(0.13)
FOdays year−10.56(0.21)0.47(0.30)0.55(0.17)\0.62(0.19)0.69(0.32)1.39(0.44)0.96(0.27)0.73(0.24)1.05(0.27)1.29(0.31)0.75(0.27)0.35(0.21)0.19(0.13)0.61(0.12)
June SIC% year−1−0.01 (0.02)−0.01 (0.01)−0.43 (0.20)−0.01 (0.00)−0.16 (0.05)−0.08 (0.04)−0.50 (0.13)−0.82 (0.26)−0.36 (0.17)−0.15 (0.14)−0.43 (0.15)−0.33 (0.19)−0.15 (0.06)0.82 (0.20)−0.07 (0.04)
July SIC% year−10.00 (0.00)0.00 (0.00)−0.27 (0.14)0.00 (0.00)−0.14 (0.04)−0.07 (0.03)−0.18 (0.06)−1.03 (0.26)−0.62 (0.28)−0.59 (0.25)−0.75 (0.19)−0.62 (0.29)−0.15 (0.06)0.67 (0.21)−0.12 (0.04)
August SIC% year−10.00 (0.00)0.00 (0.00)−0.07 (0.02)0.00 (0.00)−0.03 (0.02)−0.06 (0.03)−0.03 (0.02)−0.60 (0.20)−0.68 (0.28)−1.14 (0.34)−1.08 (0.21)−1.15 (0.36)−0.25 (0.14)0.46 (0.24)−0.16 (0.05)
September SIC% year−10.00 (0.00)0.00 (0.00)−0.03 (0.01)0.00 (0.00)−0.01 (0.01)−0.05 (0.04)−0.02 (0.02)−0.39 (0.19)−0.80 (0.31)−1.44 (0.36)−1.33 (0.26)−1.29 (0.37)−0.25 (0.15)0.40 (0.26)−0.18 (0.06)
Summer SIC% year−10.00 (0.00)0.00 (0.00)−0.20 (0.09)0.00 (0.00)−0.09 (0.03)−0.06 (0.03)−0.18 (0.05)−0.71 (0.20)−0.62 (0.24)−0.83 (0.25)−0.90 (0.18)−0.85 (0.28)−0.20 (0.09)0.59 (0.21)−0.13 (0.04)
June albedo% year−1−0.01 (0.01)−0.02 (0.02)−0.30(0.16)−0.00 (0.01)−0.09(0.05)0.03(0.03)−0.14(0.07)−0.31 (0.25)−0.44(0.22)−0.31(0.17)−0.36(0.16)−0.20 (0.20)−0.16 (0.14)−0.22(0.08)−0.14(0.05)
July albedo% year−1−0.01 (0.01)−0.01 (0.02)−0.09 (0.07)−0.00 (0.01)−0.07(0.03)−0.00 (0.02)−0.05(0.03)−0.17(0.10)−0.16(0.11)−0.23(0.12)−0.29(0.10)−0.23 (0.18)−0.12 (0.10)−0.14(0.09)−0.09(0.03)
August albedo% year−1−0.00 (0.01)−0.01 (0.02)0.01(0.01)−0.00 (0.00)−0.03(0.01)−0.00 (0.02)−0.02(0.02)−0.08(0.06)−0.19(0.11)−0.42(0.15)−0.46(0.13)−0.56(0.20)−0.17(0.12)−0.17(0.11)−0.10(0.03)
September albedo% year−1−0.01 (0.01)−0.02 (0.02)−0.02 (0.00)−0.01(0.01)−0.04(0.01)−0.04 (0.03)−0.03 (0.03)−0.13(0.08)−0.34(0.16)−0.75(0.21)−0.71(0.15)−0.78(0.22)−0.19 (0.14)−0.30(0.13)−0.17(0.04)
Summer albedo% year−1−0.01(0.01)−0.02(0.01)−0.11(0.00)−0.01 (0.00)−0.06(0.02)−0.01 (0.02)−0.06(0.03)−0.18(0.10)−0.29(0.13)−0.43(0.14)−0.47(0.11)−0.45(0.18)−0.17(0.11)−0.21(0.08)−0.13(0.03)
June long-waveW m−2 year−10.17 (0.14)0.11 (0.10)−0.05 (0.14)0.04 (0.13)0.01 (0.07)−0.00 (0.09)0.02 (0.10)−0.06 (0.11)0.04 (0.12)−0.02 (0.18)−0.11 (0.18)0.03 (0.23)0.12(0.13)−0.00 (0.14)0.03 (0.05)
July long-waveW m−2 year−10.12 (0.11)0.10 (0.09)0.06 (0.17)0.03 (0.14)0.01 (0.09)−0.10 (0.08)0.07 (0.09)−0.02 (0.13)0.18(0.10)0.17(0.12)0.23(0.16)0.14 (0.17)0.02 (0.14)−0.06 (0.12)0.04 (0.04)
August long-waveW m−2 year−1−0.06 (0.11)−0.04 (0.12)0.18(0.14)−0.08 (0.16)0.12 (0.08)−0.02 (0.11)0.13 (0.11)−0.01 (0.12)0.14(0.09)0.06 (0.11)0.19 (0.16)0.16(0.19)0.01 (0.13)−0.01 (0.11)0.04(0.04)
September long-waveW m−2 year−1−0.04 (0.16)−0.01 (0.15)−0.05 (0.12)−0.08 (0.12)−0.03 (0.07)−0.00 (0.11)0.00 (0.12)0.01 (0.08)−0.00 (0.09)−0.06 (0.09)0.03 (0.09)−0.01 (0.12)−0.10(0.11)−0.05 (0.11)−0.03 (0.05)
Summer long-waveW m−2 year−10.05 (0.07)0.04 (0.07)0.03 (0.07)−0.03 (0.08)0.02 (0.05)−0.03 (0.06)0.05(0.06)−0.02 (0.07)0.09 (0.08)0.04 (0.08)0.09 (0.09)0.08 (0.11)0.01 (0.08)−0.03 (0.09)0.02 (0.03)
June short-waveW m−2 year−1−0.37 (0.91)−0.17 (0.66)1.54(1.08)0.05 (1.07)0.54(0.54)0.09 (0.52)0.25 (0.61)1.57(0.90)1.35(0.87)1.24(0.82)1.80(1.02)0.84 (1.24)0.16 (0.76)0.59(0.37)0.48 (0.29)
July short-waveW m−2 year−1−0.47 (0.74)−0.14 (0.62)−0.12 (1.04)−0.08 (0.98)0.36 (0.62)0.46 (0.41)−0.35 (0.75)0.61(0.71)−0.02 (0.70)0.28 (0.67)0.37 (0.74)0.68 (1.00)0.04 (0.77)0.61(0.41)0.16 (0.31)
August short-waveW m−2 year−1−0.10 (0.64)0.40 (0.60)−0.86(0.57)0.35 (0.80)−0.38 (0.36)0.09 (0.42)−0.62(0.43)0.10 (0.42)0.16 (0.47)1.03(0.55)0.77 (0.67)1.22(0.75)0.44 (0.66)0.50(0.27)0.13 (0.18)
September short-waveW m−2 year−1−0.05 (0.54)−0.01 (0.44)0.03 (0.61)0.68 (0.67)0.14 (0.39)−0.03 (0.37)−0.01 (0.43)0.05 (0.32)0.29(0.34)0.96(0.37)0.97(0.36)0.96(0.39)0.25 (0.45)0.28(0.12)0.21 (0.22)
Summer short-waveW m−2 year−1−0.32 (0.42)−0.03 (0.35)0.11 (0.52)0.19 (0.55)0.14 (0.36)0.12 (0.32)−0.23 (0.37)0.58 (0.43)0.44(0.45)0.84(0.41)0.92(0.47)0.88 (0.69)0.20 (0.54)0.51(0.26)0.21 (0.21)
June skin temperature°C year−10.07(0.04)0.08(0.03)0.06(0.04)0.07(0.05)0.08(0.04)0.07(0.02)0.07(0.02)0.07(0.04)0.07(0.04)0.04(0.02)0.08(0.05)0.10(0.07)0.12(0.07)0.06(0.04)0.07(0.03)
July skin temperature°C year−10.08 (0.11)0.09(0.09)0.15 (0.21)0.16 (0.21)0.13(0.15)0.07(0.13)0.13 (0.13)0.10(0.10)0.03 (0.09)0.04 (0.08)0.06 (0.09)0.07 (0.10)0.12 (0.09)0.04 (0.05)0.09(0.11)
August skin temperature°C year−10.11(0.06)0.12(0.06)0.19(0.11)0.20(0.11)0.13(0.05)0.12(0.05)0.13(0.05)0.10(0.06)0.07 (0.05)0.06(0.04)0.07(0.05)0.09 (0.07)0.14(0.08)0.07(0.05)0.11(0.06)
September skin temperature°C year−10.04(0.03)0.07(0.02)0.07(0.03)0.08(0.04)0.07(0.03)0.07(0.03)0.08(0.03)0.11(0.05)0.11(0.06)0.14(0.06)0.13(0.04)0.12(0.04)0.06(0.04)0.08(0.05)0.08(0.03)
Summer skin temperature°C year−10.07(0.03)0.09(0.02)0.11(0.05)0.12(0.05)0.10(0.04)0.08(0.03)0.10(0.03)0.09(0.04)0.06(0.03)0.07(0.03)0.08(0.03)0.09(0.03)0.11(0.03)0.05(0.02)0.08(0.03)
Publisher’s Note: MDPI stays neutral with regard to jurisdictional claims in published maps and institutional affiliations.

