Review

Semantic-Guided Attention Refinement Network for Salient Object Detection in Optical Remote Sensing Images

1
School of Resources and Environment, University of Electronic Science and Technology of China, Chengdu 611731, China
2
Novel Product R & D Department, Truly Opto-Electronics Co., Ltd., Shanwei 516600, China
*
Author to whom correspondence should be addressed.
Remote Sens. 2021, 13(11), 2163; https://doi.org/10.3390/rs13112163
Submission received: 19 April 2021 / Revised: 26 May 2021 / Accepted: 28 May 2021 / Published: 31 May 2021

Abstract

:
Although remarkable progress has been made in salient object detection (SOD) in natural scene images (NSI), the SOD of optical remote sensing images (RSI) still faces significant challenges due to various spatial resolutions, cluttered backgrounds, and complex imaging conditions, mainly for two reasons: (1) accurate location of salient objects; and (2) subtle boundaries of salient objects. This paper explores the inherent properties of multi-level features to develop a novel semantic-guided attention refinement network (SARNet) for SOD of NSI. Specifically, the proposed semantic guided decoder (SGD) roughly but accurately locates the multi-scale object by aggregating multiple high-level features, and then this global semantic information guides the integration of subsequent features in a step-by-step feedback manner to make full use of deep multi-level features. Simultaneously, the proposed parallel attention fusion (PAF) module combines cross-level features and semantic-guided information to refine the object’s boundary and highlight the entire object area gradually. Finally, the proposed network architecture is trained through an end-to-end fully supervised model. Quantitative and qualitative evaluations on two public RSI datasets and additional NSI datasets across five metrics show that our SARNet is superior to 14 state-of-the-art (SOTA) methods without any post-processing.

Graphical Abstract

1. Introduction

In recent years, with the continuous improvement of aerial remote sensing and sensor technology, it becomes more and more convenient to obtain very high resolution (VHR) optical remote sensing images (RSI), which, to a certain extent, meets the urgent needs of scene analysis and object detection in airborne earth observation tasks. Naturally, various applications of RSI in the military and civilian fields have received a high degree of attention from all walks of life, such as scene monitoring [1], ship detection [2], oil tank detection [3], and military object discovery [4]. However, how to effectively improve the efficiency and accuracy of scene analysis and rapid object detection of massive optical remote sensing data with cluttered backgrounds is crucial for further exploration and application of RSI.
The goal of object-level salient object detection (SOD) is to locate and separate the most attractive regions from the scene, which is a simulated representation of visual attention mechanism [5]. Unlike visual fixation prediction, SOD focuses on segmenting images to generate pixel-wise saliency maps [6]. Because of its low computational cost and excellent scalability, SOD has aroused interest in many fields, including image retrieval [7], object tracking [8], semantic segmentation [9], medical image segmentation [10], camouflage object detection [11], etc. In general, in the large-scale optical RSI with cluttered background and intricate noise, only a small number of regions with great color, shape, or texture differences can attract people’s attention. Therefore, the SOD for RSI aims to segment these regions or objects of interest. As a fast and beneficial tool for massive information processing, the SOD method has been widely applied to various visual tasks of RSI analysis, such as human-made object detection [3,12], change detection [13,14] and ROI extraction [15,16]. Unlike NSI photographed on the ground, optical RSI is usually directly captured by satellites, aircraft, or drones equipped with sensors, so the difference in data acquisition methods makes it a big challenge for SOD from NSI to RSI: (1) RSI coverage is broader, which leads to large changes in the spatial resolution and number of salient objects in the RSI (or scenes without salient objects, such as the ocean, snow, and forest). (2) The shooting angle of the overlooking makes the salient object in RSI have a considerable difference in appearance compared with NSI, and the object also has various directions. (3) Affected by different imaging conditions, RSI usually contains interference information such as shadows, clouds, and fog, making the object’s background area more cluttered and complicated.
To alleviate the above situation, in the previous SOD methods for RSI [17,18], a bottom-up dense link method is usually used to integrate multi-level depth features to locate the object area and filter the background noise. However, this non-discrimination treatment of different features may introduce local noise so that the object area’s edge details can not be restored. For example, the saliency prediction maps of LVNet [18] and MINet [19] in the first and second rows of Figure 1 lose the edge information of the target (cars and buildings). Besides, with the continuous downsampling of the input features by the backbone network in feature extraction, the depth feature patterns of different levels will change, ignoring the relationship between different attention maps and only splices from multi-level feature maps is considered suboptimal.
Further, compared with the NSI scene, the salient areas in RSI have more scale changes, similar ambiguous appearance, and tedious topology information [20]. As shown in Figure 1, in the prediction results of various SOD methods, most SOD methods will have encounter unsatisfactory conditions, such as missed detection, error detection, and overall inconsistency of the object. On the one hand, the result is that the saliency feature of the local area (or attention activation patterns) suppresses the natural global saliency feature. On the other hand, it is due to the difference of representation features in the same salient area due to spatial distribution. Previous work has shown that the convolution operation components that make up the network inevitably cause a local receptive field [23]. In response to this limitation, feature pyramid [24,25], intermediate feature integration [22,26], and atrous convolution [27] are the mainstream strategies. However, these methods usually do not consider the semantic features of long-distance, which may lead to salient objects’ incompleteness.
Inspired by the above challenges, we propose a semantic-guided attention refinement network (SARNet) for SOD of optical RSI. The motivation of the method comes from the empirical fact that for the object search of large scene RSI, we usually scan the whole image and locate the ROI roughly and quickly through the visual attention mechanism, and then accurately infer and identify the boundary details according to the location guidance and combined with the local information around the region. Therefore, we regard the object’s accurate positioning and the boundary details as the two keys of SOD in the RSI scene. The proposed method first uses the semantic guidance decoder (SGD) to integrate multiple high-level side-out features to locate the object and guide low-level information refinement. The parallel attention fusion (PAF) module combines cross-level and global semantic guidance features to refine the object boundary gradually. Overall, our main contributions are summarized as follows:
(1)
We design a novel semantic-guided attention refinement network (SARNet) for SOD in optical RSI. The network has better robustness and generalization through the high-level semantic information guidance and top-down boundary refinement strategy to improve scale-varying objects’ saliency detection performance;
(2)
The proposed semantic guided decoding (SGD) module combines several high-level feature representations to improve the semantic feature differences in long-distance space. Simultaneously, the accurate salient area location information is used to guide the subsequent multi-level feature fusion;
(3)
The proposed parallel perception fusion (PAF) module models global semantic information and cross-level features to fill the differences between different visual representation levels and gradually restore salient objects’ edge details;
(4)
We compare the proposed methods with 14 SOTA approaches on two challenging optical RSI datasets and additional NSI datasets. Without bells and whistles, our method achieves the best performance under five evaluation metrics. Besides, the model has a real-time inference speed of 47.3 FPS on a single GPU. The code will be available at https://github.com/laoyezi/SARNet (accessed on 29 May 2021).
The rest of this article is organized as follows. Section 2 discusses the work related to the saliency detection of NSI and RSI, as well as the attention mechanism in SOD. Section 3 describes in detail our proposed network architecture, including SGD and PAF modules. Section 4 introduces the experimental settings, including datasets, evaluation metrics, and implementation details. The proposed method was compared with the 14 SOTA method qualitatively and quantitatively, and then the ablation of the key components was studied. Finally, Section 5 summarizes the research work and points out our future research direction.

2. Related Works

In this section, we first introduce some representative SOD models designed for NSI in Section 2.1, then examine the SOD model specifically for optical RSI in Section 2.2, and, finally, describe some related attention mechanisms for SOD in Section 2.3.

2.1. Saliency Detection for NSI

In the past two decades, we have witnessed the diversified development of the theoretical system of SOD and the rapid improvement of detection performance under the heatwave of deep learning. Early works were mainly devoted to studying hand-made features, such as color transform-based model [28], sparse representation [29,30], low-rank decomposition [31], and graph-based model [32] and so on, their effectiveness and efficiency limit these methods. In the past five years, the SOD method based on convolution neural network (CNN) has been widely and deeply explored [5,33]. Initially, Li et al. [34] used the multi-level context features of CNN to infer the saliency of image segments. Zhao et al. [35] combined local and global context information to rank the superpixels. Compared with traditional models, these methods significantly improve performance, but are still limited by low-resolution prediction results. Consequently, to overcome the above deficiency, most current methods use full convolution network (FCN) to predict pixel-level saliency. Deng et al. [36] proposed a recursive residual refinement network (R3Net), which uses the cross-level features of the integrated FCN with alternating residual refinement blocks. In order to highlight the complementarity of object features and edge features, Zhao et al. [22] proposed an edge guidance network for SOD. Pang et al. [19] proposed to use aggregation interaction module in the decoder to integrate adjacent-level features to avoid a large amount of noise caused by sampling operations.

2.2. Saliency Detection for RSI

Compared with many SOD methods for NSI, only a few works are devoted to the SOD of optical RSI. Usually, SOD is used as an auxiliary tool for RSI image analysis, such as airport detection [12,37], oil tank detection [3], region change detection [13], and ROI extraction [16]. With the in-depth research on SOD, some SOD works on optical RSI have appeared in recent years. Considering the internal relationship of multiple saliency cues, zhang et al. [16] developed an adaptive multi-feature fusion method for saliency detection of RSI. Huang et al. [29] proposed a novel SOD method by exploring sparse representation based on contrast weighted atoms. In the CNN-based method, Li et al. [18] used the SOD of optical RSI by constructing a tow-stream pyramid module and a nested structure with encoding-decoding. In another related work, Li et al. [17] designed a parallel processing structure network for optical RSI by using intra-path, cross-path information, and multi-scale features. Recently, Zhang et al. [20] merged low-level attention cues into high-level attention maps and combined the global upper and lower attention mechanism to propose a SOD framework for optical RSI. Although these methods effectively improve optical RSI’s saliency detection performance, they do not treat different levels of feature information separately, ignore the complementarity between cross-level features, and lack filtering and attention to practical features.

2.3. Attention Mechanism in SOD

In recent years, attention mechanism (AM) has gradually become an essential factor in network structure design and has been deeply studied in many fields [38]. AM simulates the human visual system, which only pays attention to a part of the scene’s prominent area rather than the whole region. This mechanism improves the efficiency of data processing and the pertinence of the target. In other words, AM is a resource allocation mechanism that reallocates fixed resources according to the importance of the object of concern. In the network, AM needs to allocate the resources that can be understood as the weight scores of different dimensional features, such as channel domain attention [39], spatial domain attention [40], mixed domain attention [41], and position-wise attention [42].
This suitable mechanism is also widely used in the field of SOD. Kuen et al. [43] proposed a recurrent attentional convolution-deconvolution network for SOD, in which a spatial converter based on sub-differentiable sampling is used to transform the input features to achieve spatial attention spatially. Considering that most of the previous SOD methods are fine-tuned from image classification networks that only respond to small and sparse differentiated objects, Chen et al. [44] proposed a residual learning method based on reverse attention, which is used to expand the object area gradually. Wang et al. [45] proposed a pyramid attention module with an enlarged receptive field that can effectively enhance the corresponding network layer’s expression ability. Zhang et al. explored a global context-aware AM that captures long-term semantic dependencies between all spatial locations in an attentive manner. Some works directly embed the existing attention module into the network architecture to focus on the salient region’s features and reduce the feature redundancy [26,46].

3. Approach

This section begins with an overview of the proposed semantic-directed attention refinement of the network’s entire architecture in Section 3.1. Then, the proposed semantic guided decoding (SGD) module is introduced in detail in Section 3.2. The proposed parallel attention fusion (PAF) module is described in Section 3.3. Finally, the loss function for SARNet supervision training is given in Section 3.4.

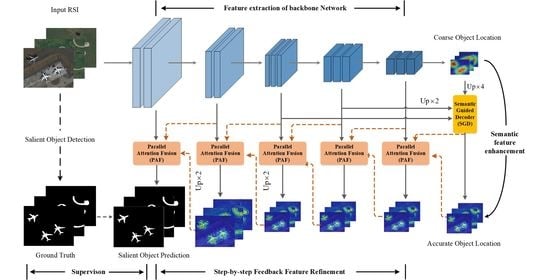
3.1. Overall Network Architecture

As shown in Figure 2, in order to specifically solve the challenges of SOD in RSI, the proposed SARNet is mainly composed of a backbone network (such as VGG [47] and ResNet series [48] and Res2Net [49], etc.), an SGD module for integrating high-level semantic information and guiding top-down feature refinement, and a PAF module for merging cross-level features and global semantic information in a parallel manner. Specifically, take ResNet-50 as an example, the backbone network extracts the features of the input RSI at five different resolutions, which can be expressed as F i | i = 1 , 2 , , 5 . First of all, we compare the side-out features of the last three layers of the network, i.e., F i | i = 3 , 4 , 5 . As the input of the GSD module to obtain the global semantic features that can roughly locate the object. Then high-level features and global semantic features are input into the PAF module as supplements and guides of low-level features to enhance the object’s edge details. The entire SARNet adopts a coarse-to-fine feedback strategy to integrate multiple features and refine salient objects’ details gradually. All side-outputs and global semantic pseudo saliency maps are supervised, and the final saliency map is obtained by mapping output after F 1 feature integration.

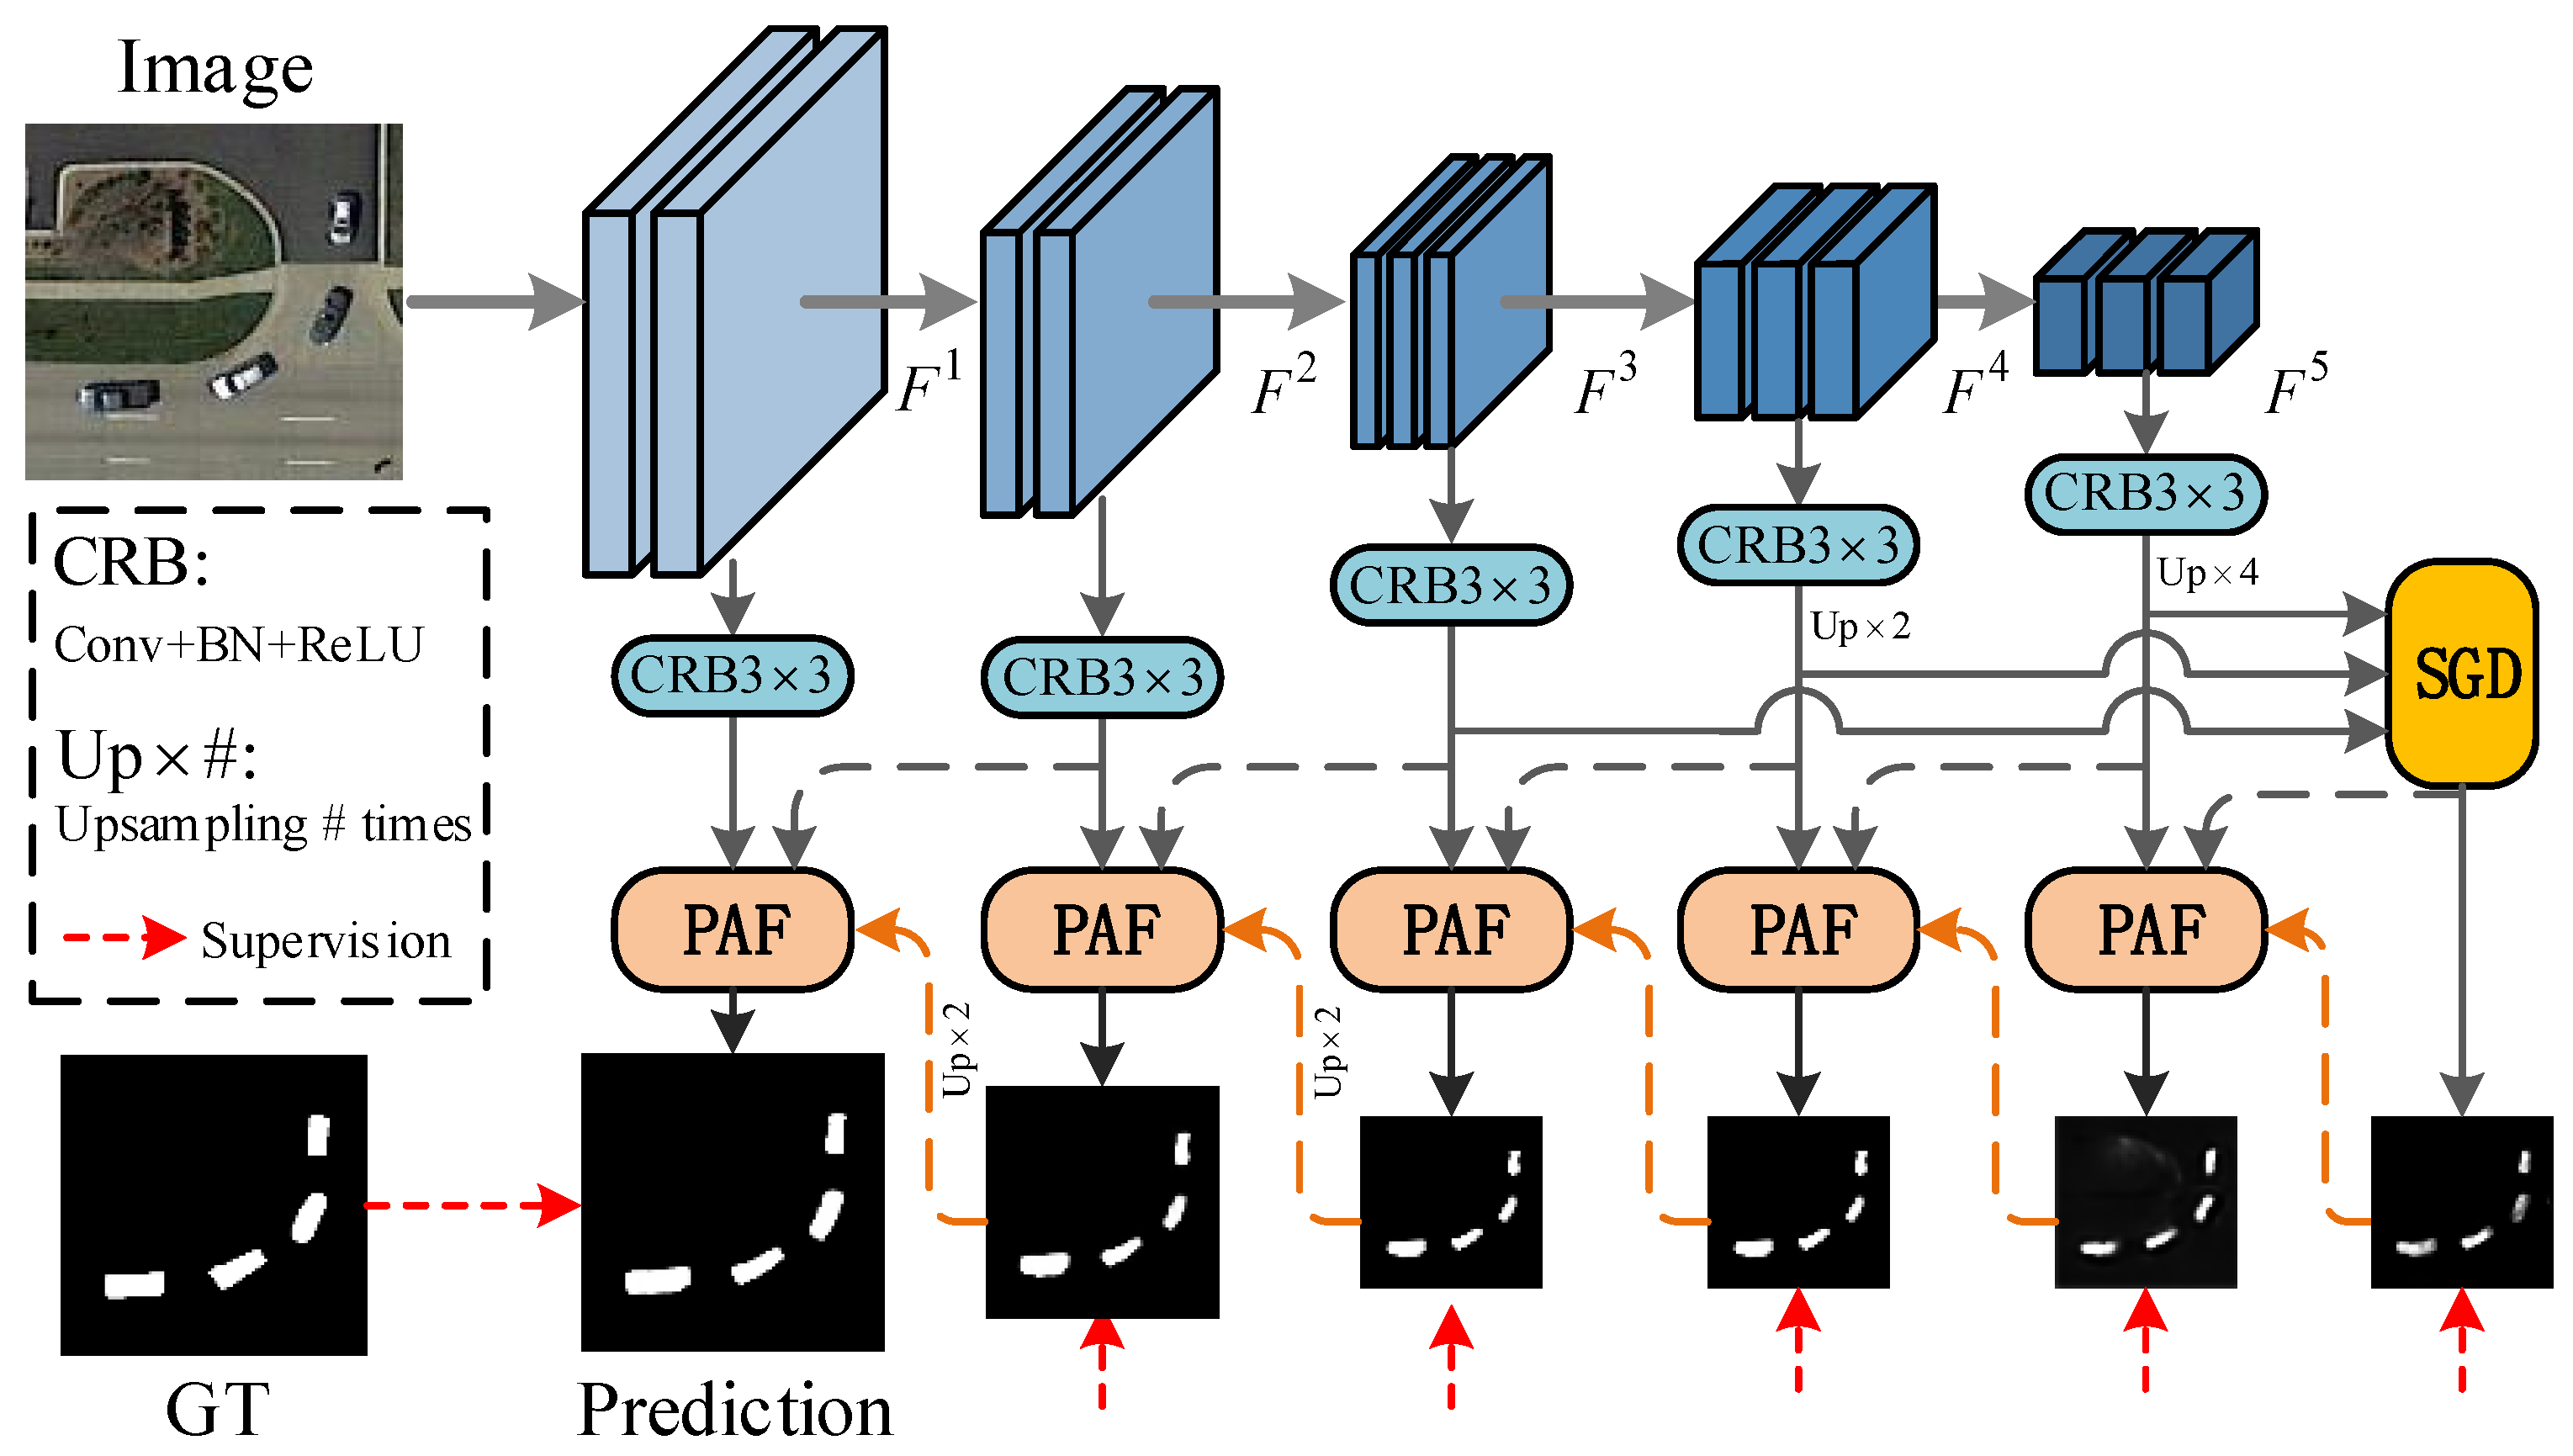
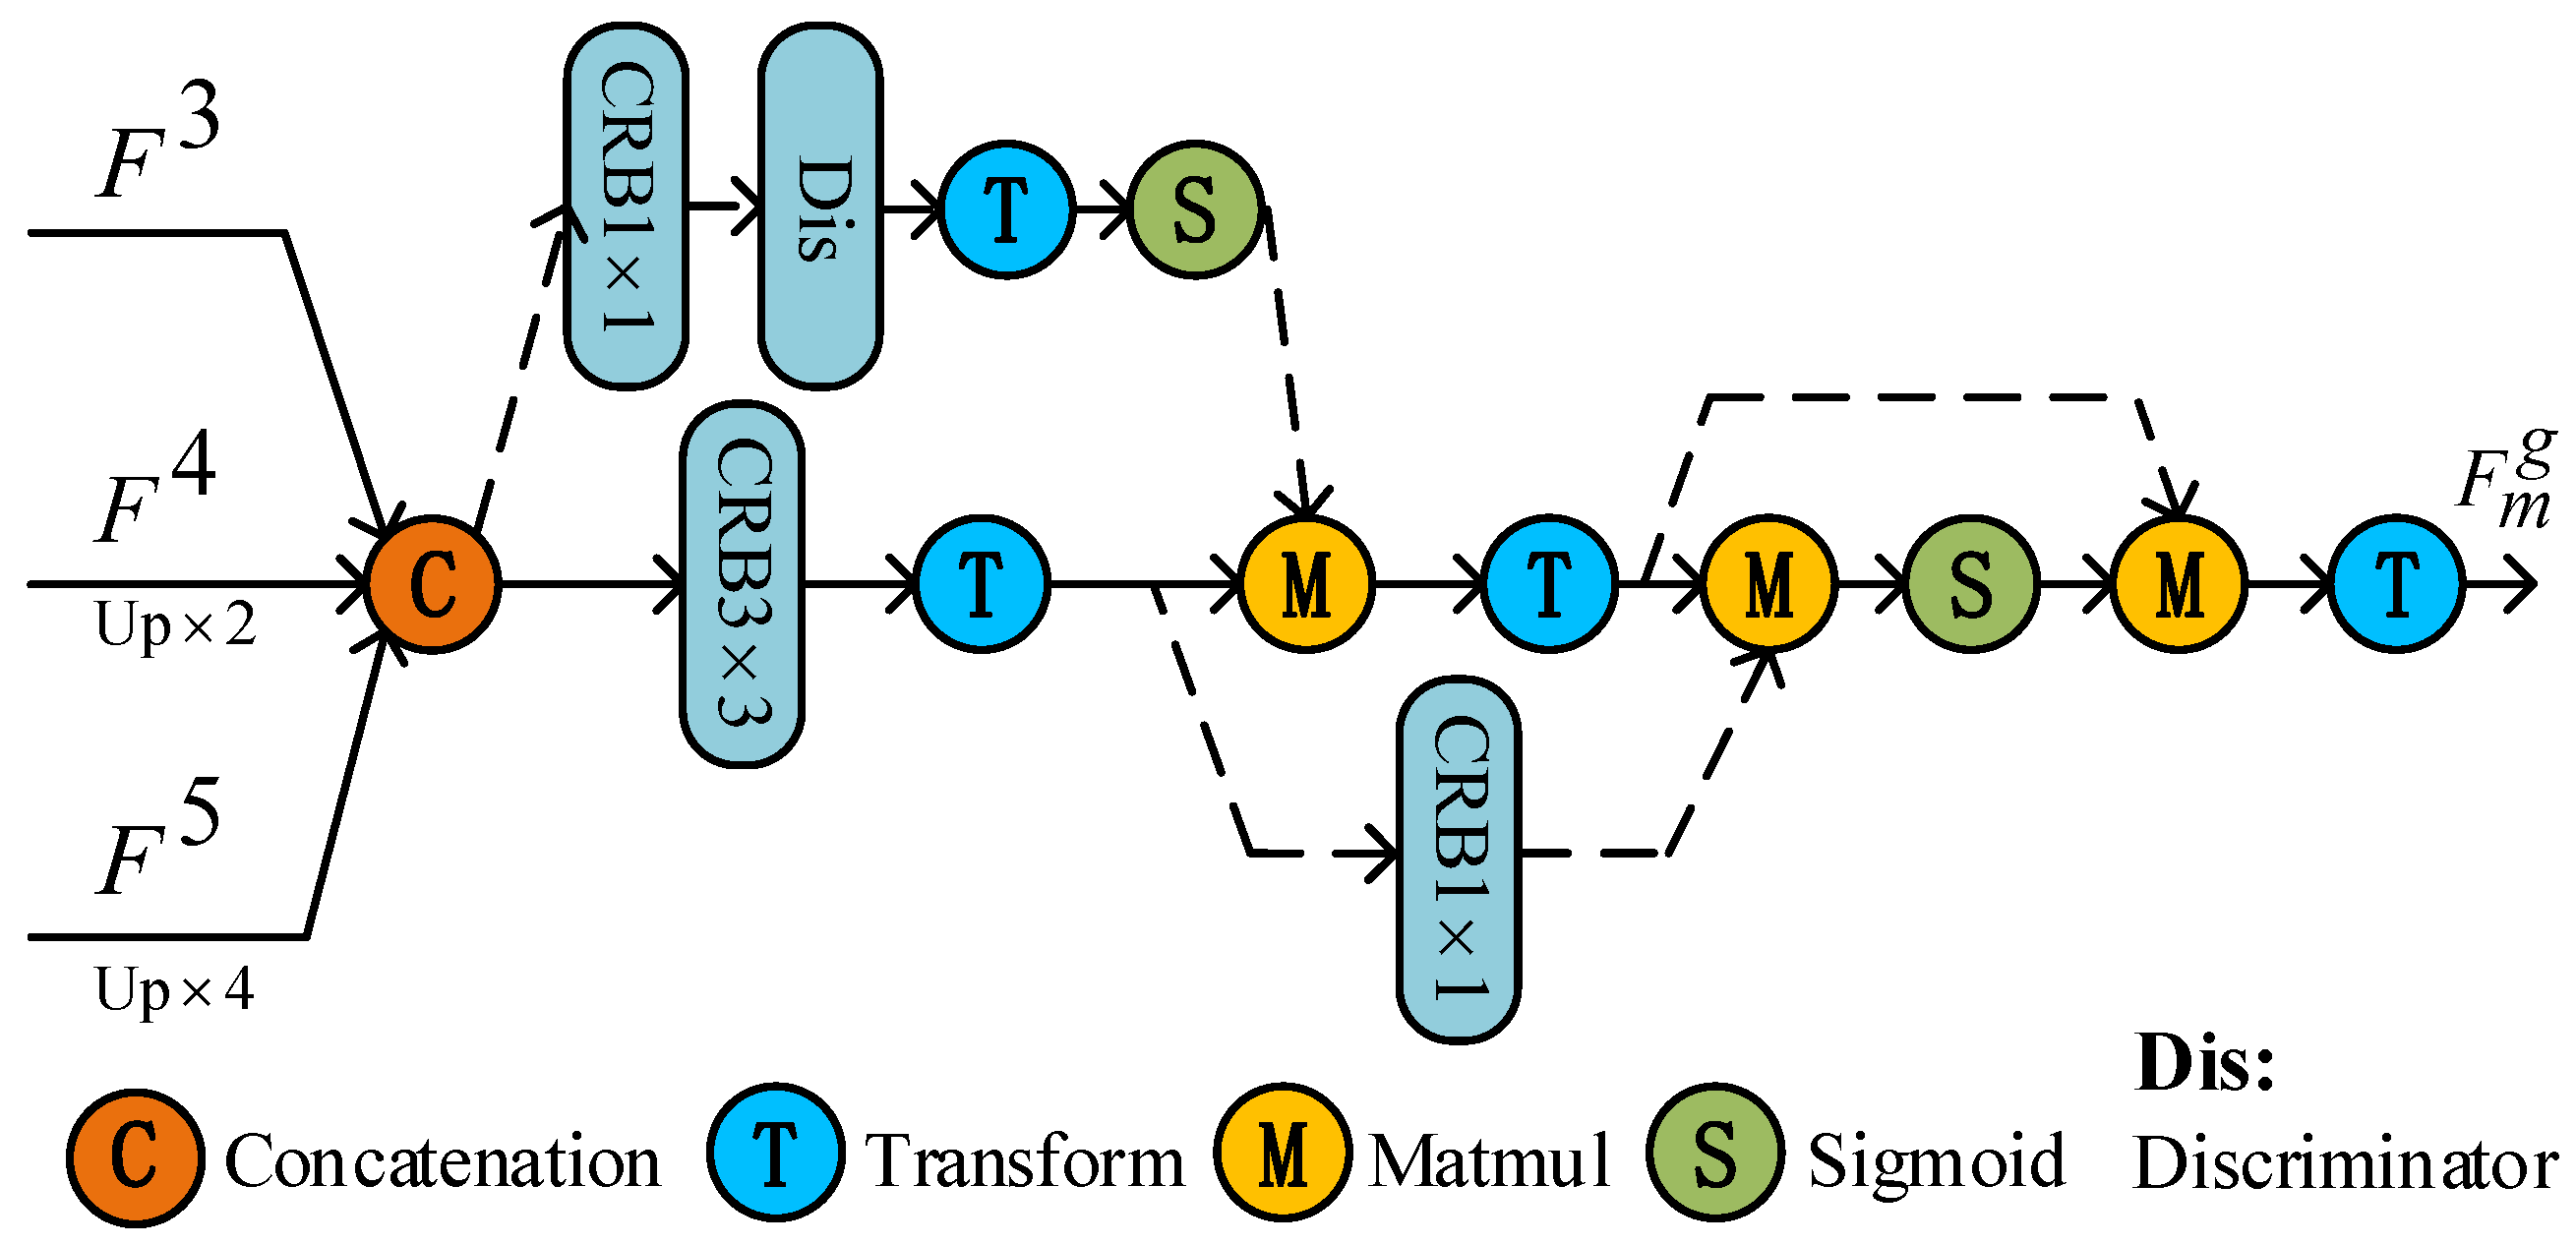
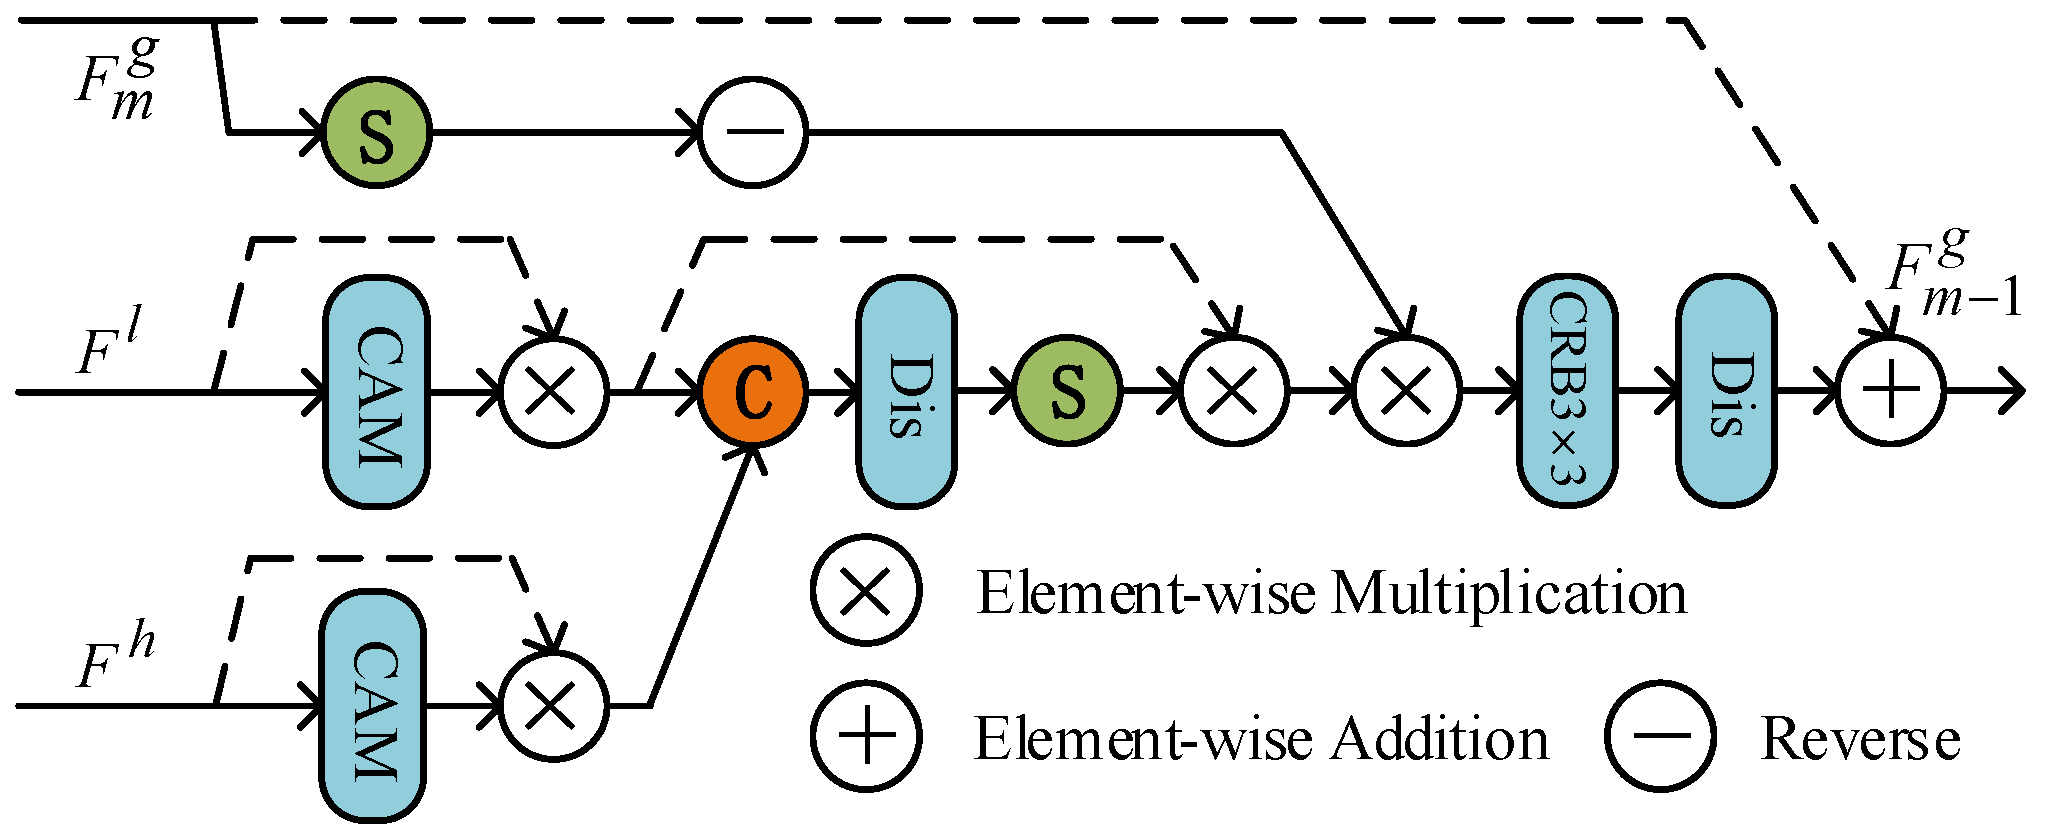
3.2. Semantic Guided Decoder (SGD)

The current popular SOD deep network model usually aggregates all side-out features without discrimination [17,18,24,36,50], but this strategy will lead to confusion and redundancy of cross-level feature fusion. On the other hand, considering that the backbone network obtains multi-scale representation by continuous downsampling, the feature resolution after the first three feature extraction stages (i.e., three × 2 downsampling) is low enough. We presume that the features extracted in the later stages are high-level representations with rich semantic information. Therefore, we propose an SGD that aggregates the last three layers’ output features F i | i = 3 , 4 , 5 to obtain more accurate contextual semantic information from the global scope.
Specifically, as shown in Figure 3, in order to provide sufficient semantic information required for the location of salient objects with scale-changeable RSI, when a plurality of high-level features are given, F 4 and F 5 are first upsampled to the same size as F 3 and then concatenated to obtain the initial global semantic feature F 1 g , can be expressed as:
F 1 g = C a t F 3 , U p × 2 F 4 , U p × 4 F 5 ,
where C a t is concatenating operation, and then the salient object’s position is roughly located, and the probability of existence is calculated by the discriminator D i s and Sigmoid function S , respectively. Meanwhile, after feature channel compression and vectorization processing, the initial F 1 g is combined with the position probability of salient objects by matrix multiplication M , so as to weight each layer of feature map in space and aggregate global information, and then the weight C 1 g of salient objects on each channel is obtained. The process is defined as:
F 2 g = T C R B F 1 g , C 1 g = M S T D i s C R B F 1 g , F 2 g ,
where D i s represents the discriminant operation of mapping high-dimensional features to 1-dimensional features with a kernel size of 1 × 1 . Further, we perform weighted aggregation on the F 2 g of the previous stage in the channel dimension to obtain the channel feature representation F 3 g of each pixel. This process is expressed as:
C 2 g = T C 1 g , F 3 g = M C R B F 2 g , C 2 g .
Finally, the channel feature F 3 g of each pixel is normalized and matrix multiplied with the weight C 2 g of the feature map on each channel to reconstruct the feature representation of each pixel. The process is defined as:
F m g = T M S F 3 g , C 2 g .
It is worth noting that F m g is a global guide feature with rich semantic information. After the above series of operations, we comprehensively integrate multiple high-level features with semantic information. As shown in Figure 4, compared with the output feature visualization results of the last layer of the backbone (here taking ResNet50 as an example), after the above transformation and calculation in the feature channel and space of the SGD module are adopted, the network enhances the feature representation of pixels and the perception of the object region, and can locate salient objects more accurately.

3.3. Parallel Attention Fusion (PAF) Module

Although the output of SGD can approximately locate salient objects, it seriously lacks detailed features (mostly tiny objects). Therefore, to make full use of this improved semantic feature, we use the output of SGD as a global guiding feature to guide the aggregation of low-level information. At the same time, as a supplement to low-level features, we use the previous layer’s side-out feature as an additional feature to participate in the recovery of salient object details. This strategy is widely used in SOD to reconstruct the object’s edge [20,24,25,26]. On the other hand, the features usually obtained by the encoder are redundant for the SOD task [51], and indistinguishable integrated multi-level features may activate non-salient areas. Therefore, it is necessary to filter and retain these features stream information.
Taken together, we propose the PAF module, as shown in Figure 5. First, the reverse attention weight [44] is applied to the global semantic guide feature F i g to explore the details of complementary regions and boundaries by erasing existing salient object regions. For high-level auxiliary features F h and low-level refinement features F l , channel attention mechanism (CAM) is used to filter to obtain more representative and essential features. Then, to further enhance the discrimination of features, we feed the concatenated features into a feature weighted structure with skip connections. Next, the output weighted feature and the reverse attention weight are combined and fed into the discriminator. Finally, the output of the discriminator and F m g are combined in the manner of residual connection to obtain the global semantic guidance feature F m 1 g of the next stage.
Precisely, the reverse attention weight w g for F m g can be calculated as:
w g = E S F m g ,
where E represents a unit matrix with the same size as F m g . Simultaneously, the F c a m l and F c a m h features processed by CAM are concatenated and then fed into the feature weighted structure with skip connection to obtain the enhanced feature representation F e of the object. This process is defined as:
F e = F c a m l S D i s C a t F c a m l , F c a m h .
Further, element-wise multiplication is used to reduce F e and w g ’s gap and then fed into the discriminator. Finally, the residual connection method is combined to obtain the global semantic guidance feature F m 1 g of the next stage. The process can be expressed as:
F m 1 g = F m g D i s C R B w g F e .
The entire PAF integrates distinctive feature representations in parallel. The PAF module’s output visualization in Figure 6 shows that the step-by-step feedback strategy generates more recognizable and precise object discriminating features in the decoding network.

3.4. Loss Function

In the supervision phase, to avoid the loss function treating all pixels equally, and to guide it to pay more attention to the details of hard pixels and object boundaries, our loss function consists of weighted IoU and binary cross-entropy loss (BCE), i.e., L = L w I o U + L w B C E . The loss here is the same as in [50], and its validity has been verified in SOD. Therefore, our total loss is expressed as:
L t o t a l = L G , S 1 + i = 2 6 1 2 i 2 L G , S i ,
where G is GT map and S i represents the side-output map at stage i.

4. Experiments

In Section 4.1, we introduce in detail the RSI datasets and the extended NSI datasets, the evaluation metrics of the experimental results, and the implementation details of the network model. In Section 4.2, we compare the model’s performance in multiple scenarios from both quantitative and quantitative aspects. In Section 4.3, we conducted a series of ablation experiments to demonstrate the compatibility of the model and the necessity of model components. In Section 4.4 and Section 4.5, we analyze the complexity and failure cases of the proposed method, respectively.

4.1. Experimental Settings

4.1.1. Datasets

Experiments were performed on two optical RSI datasets dedicated to SOD, namely ORSSD [18] and EORSSD [20]. The ORSSD dataset contains most of the 800 images collected and pixel-wise annotated from Google Earth and some conventional RSI datasets for classification or object detection (such as NWPU VHR-10 [52], AID [53], Levir [54], etc.), of which 600 are for training, and 200 are for testing. To get closer to the actual scene, EORSSD expands the ORSSD to 2000 images, including 1400 for training and 600 for testing. These images summarize more complex real-world scene types and more challenging object attributes. In these two RSI datasets, accurate and robust SOD is very challenging because of the cluttered and complex background, multiple spatial resolutions, type, size, number of salient objects, etc.
Besides, in order to further demonstrate the robustness and stability of the SARNet. We tested the proposed model on three popular natural scene image (NSI) datasets for SOD, including DUTS [55], DUT-OMRON [56], and HKU-IS [34]. DUTS is a large SOD dataset with two subsets, of which 10,553 images in DUT-TR are used for training, and 5019 images in DUT-TE are used for testing. DUT-OMRON consists of 5168 images, of which objects are usually structurally complex. The HKU-IS includes 4447 images, which contain a plurality of foreground objects. Like other SOD methods [22,57,58,59], we use DUT-TR to retrain our SARNet, and the experimental results are as shown in Section 4.2.3.

4.1.2. Evaluation Metrics

We adopt five widely used evaluation metrics in SOD to comprehensively demonstrate the proposed model’s effectiveness, including mean absolute error M A E , M , mean F-measure m F β , weighted F-measure w F β [60], mean E-measure m E ϕ [61], and S-measure S ξ [62]. Besides, the precision-recall (PR) curves and F-measure curves are also used to compare with the SOTA models. The details of these evaluation metrics are as follows:
(1)
MAE M evaluates the average difference between all the corresponding pixels of the predicted saliency map P and GT map G after normalization processing. We compute the M score by:
M = 1 W × H i = 1 W i = 1 H S i , j G i , j ,
where W and H are the width and height of the evaluate map.
(2)
Mean F-measure m F β and weighted F-measure w F β can improve interpolation, dependency, and equality problems, leading to inaccurate estimates of M A E and original F-measure values [60]. This metric is calculated as follows:
F β = 1 + β 2 P r e c i s i o n × R e c a l l β 2 × P r e c i s i o n + R e c a l l ,
where different weight β 2 values are set to emphasize the importance of recall or precision. It is customary to set 0.5 (i.e., m F β ) to treat equally or 0.3 (i.e., w F β ) to emphasize precision over recall in previous works [29,46,51,59].
(3)
Mean E-measure m E ϕ combines the image-level average’s local value with the image-level average to obtain global statistical information and local pixel matching information, an evaluation metric based on cognitive vision. It is computed as:
E ϕ = 1 W × H i = 1 W i = 1 H θ ϕ ,
where ϕ is the alignment matrix and θ ϕ denotes the enhanced alignment matrix [61]. To make a fair comparison, we took the mean score of the evaluation index in the experiment.
(4)
S-measure S ξ takes the structural similarity of region-aware S r and object-aware S o as the evaluation of structural information to consider the structural information of the image. S ξ is calculated as follows:
S α = α × S o + 1 α × S r ,
where α 0 , 1 is a trade-off parameter, usually set to 0.5.

4.1.3. Implementation Details

As in [20], we use the divided data in EORSSD for training and testing, respectively, and combine rotation, flipping and random cropping strategies to augment all training data. The model is implemented using PyTorch and deployed on a NVIDIA GeForce RTX 3090. For model training, the Adam algorithm is used to optimize model parameters with a learning rate of 1 × 10 4 . When the mini-batch size is 16, it takes about 4.5 h to train the model for 80 epochs. In the inference stage, the average processing speed is about 47.3 FPS.

4.2. Comparison with SOTAs

Our results were evaluated with 14 SOTA SOD competitors, including three unsupervised methods (i.e., HDCT [28], SMD [31] and DSG [32]), seven deep learning-based methods (i.e., R3Net [36], DSS [21], PFA [24], EGNet [22], MINet [19], GateNet [59], and F3Net [50]), and four methods developed for RSI (i.e., SMFF [16], CMC [3], LVNet [18], and DAFNet [20]). To make a fair comparison, the results of all non-deep learning methods are provided by the authors or calculated directly by their released codes. The deep learning-based methods use the same training data as the proposed model to retrain and infer the test sets under the default parameter setting (if there are multiple backbone results, the best one is taken).

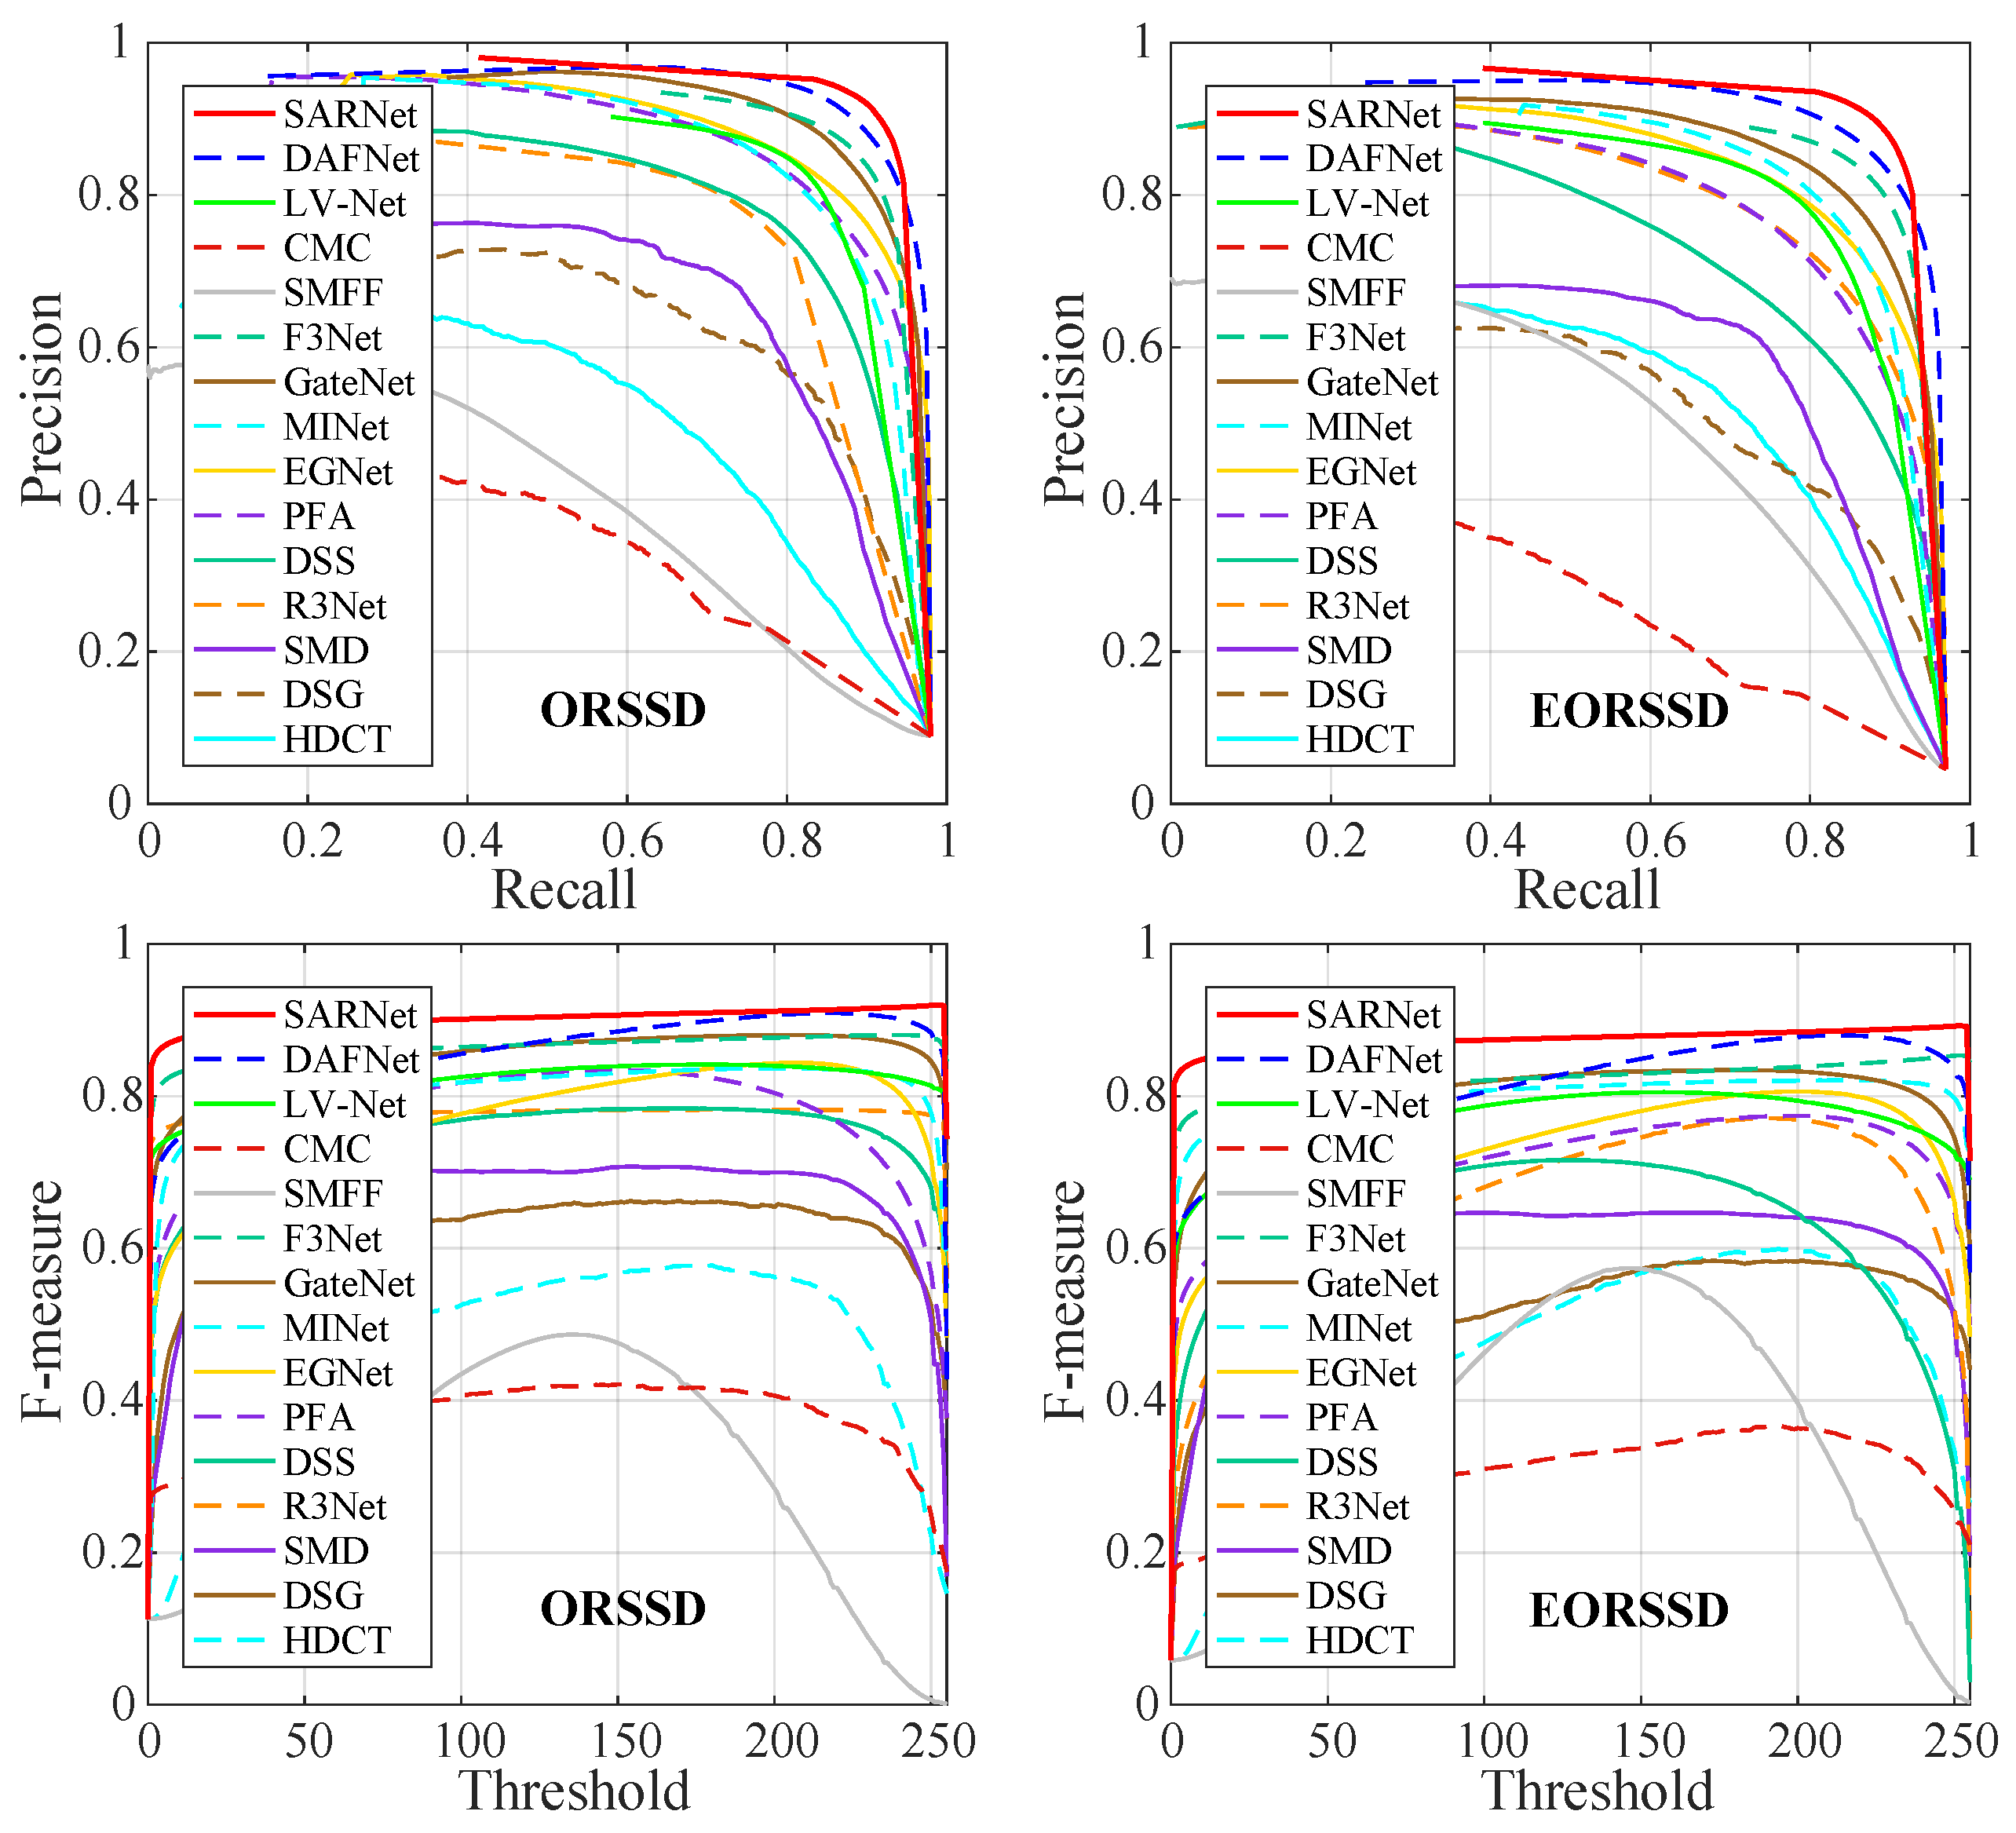
4.2.1. Quantitative Comparison

Due to the use of different backbone networks, feature extraction performance is affected in varying degrees. To make a comprehensive comparison, we use VGG16 [47], ResNet-50 [48], and Res2Net-50 [49] as feature extractors at the same time. Table 1 summarizes the evaluation scores across five metrics on two RSI datasets. It can be seen that the results of our method on different backbones are almost better than those of other methods (especially with Res2Net), which verifies the robustness of the proposed method. Figure 7 shows the PR curves and the F-measure curves on two datasets (our result is solid lines marked in red), further demonstrating the proposed model’s superiority.
Compared with other unsupervised learning algorithms for SOD, SMD [31] achieves the best performance under all the two RSI datasets’ evaluation metrics. On the other hand, among the deep learning-based SOD algorithms for NSI retrained with RSI data, F3Net achieves the best performance, with S ξ reaching 0.908 and 0.907 on the ORSSD and the RORSSD datasets, respectively. LVNet [18] and DAFNet [20], as deep learning-based algorithms for RSI saliency detection, performance is significantly better than other algorithms, especially DAFNet. This further demonstrates the necessity of specially designing the detection model for the SOD of optical RSI. For the first two best methods (LVNet [18] and DAPNet [20]) dedicated to optical RSI, our performance gains on the four metrics ( S ξ , w F β , m E ϕ , m F β ) are 1.7%∼7.5%, 1.2%∼8.8%, 5.0%∼16.4% and 15.3%∼30.5%, respectively.

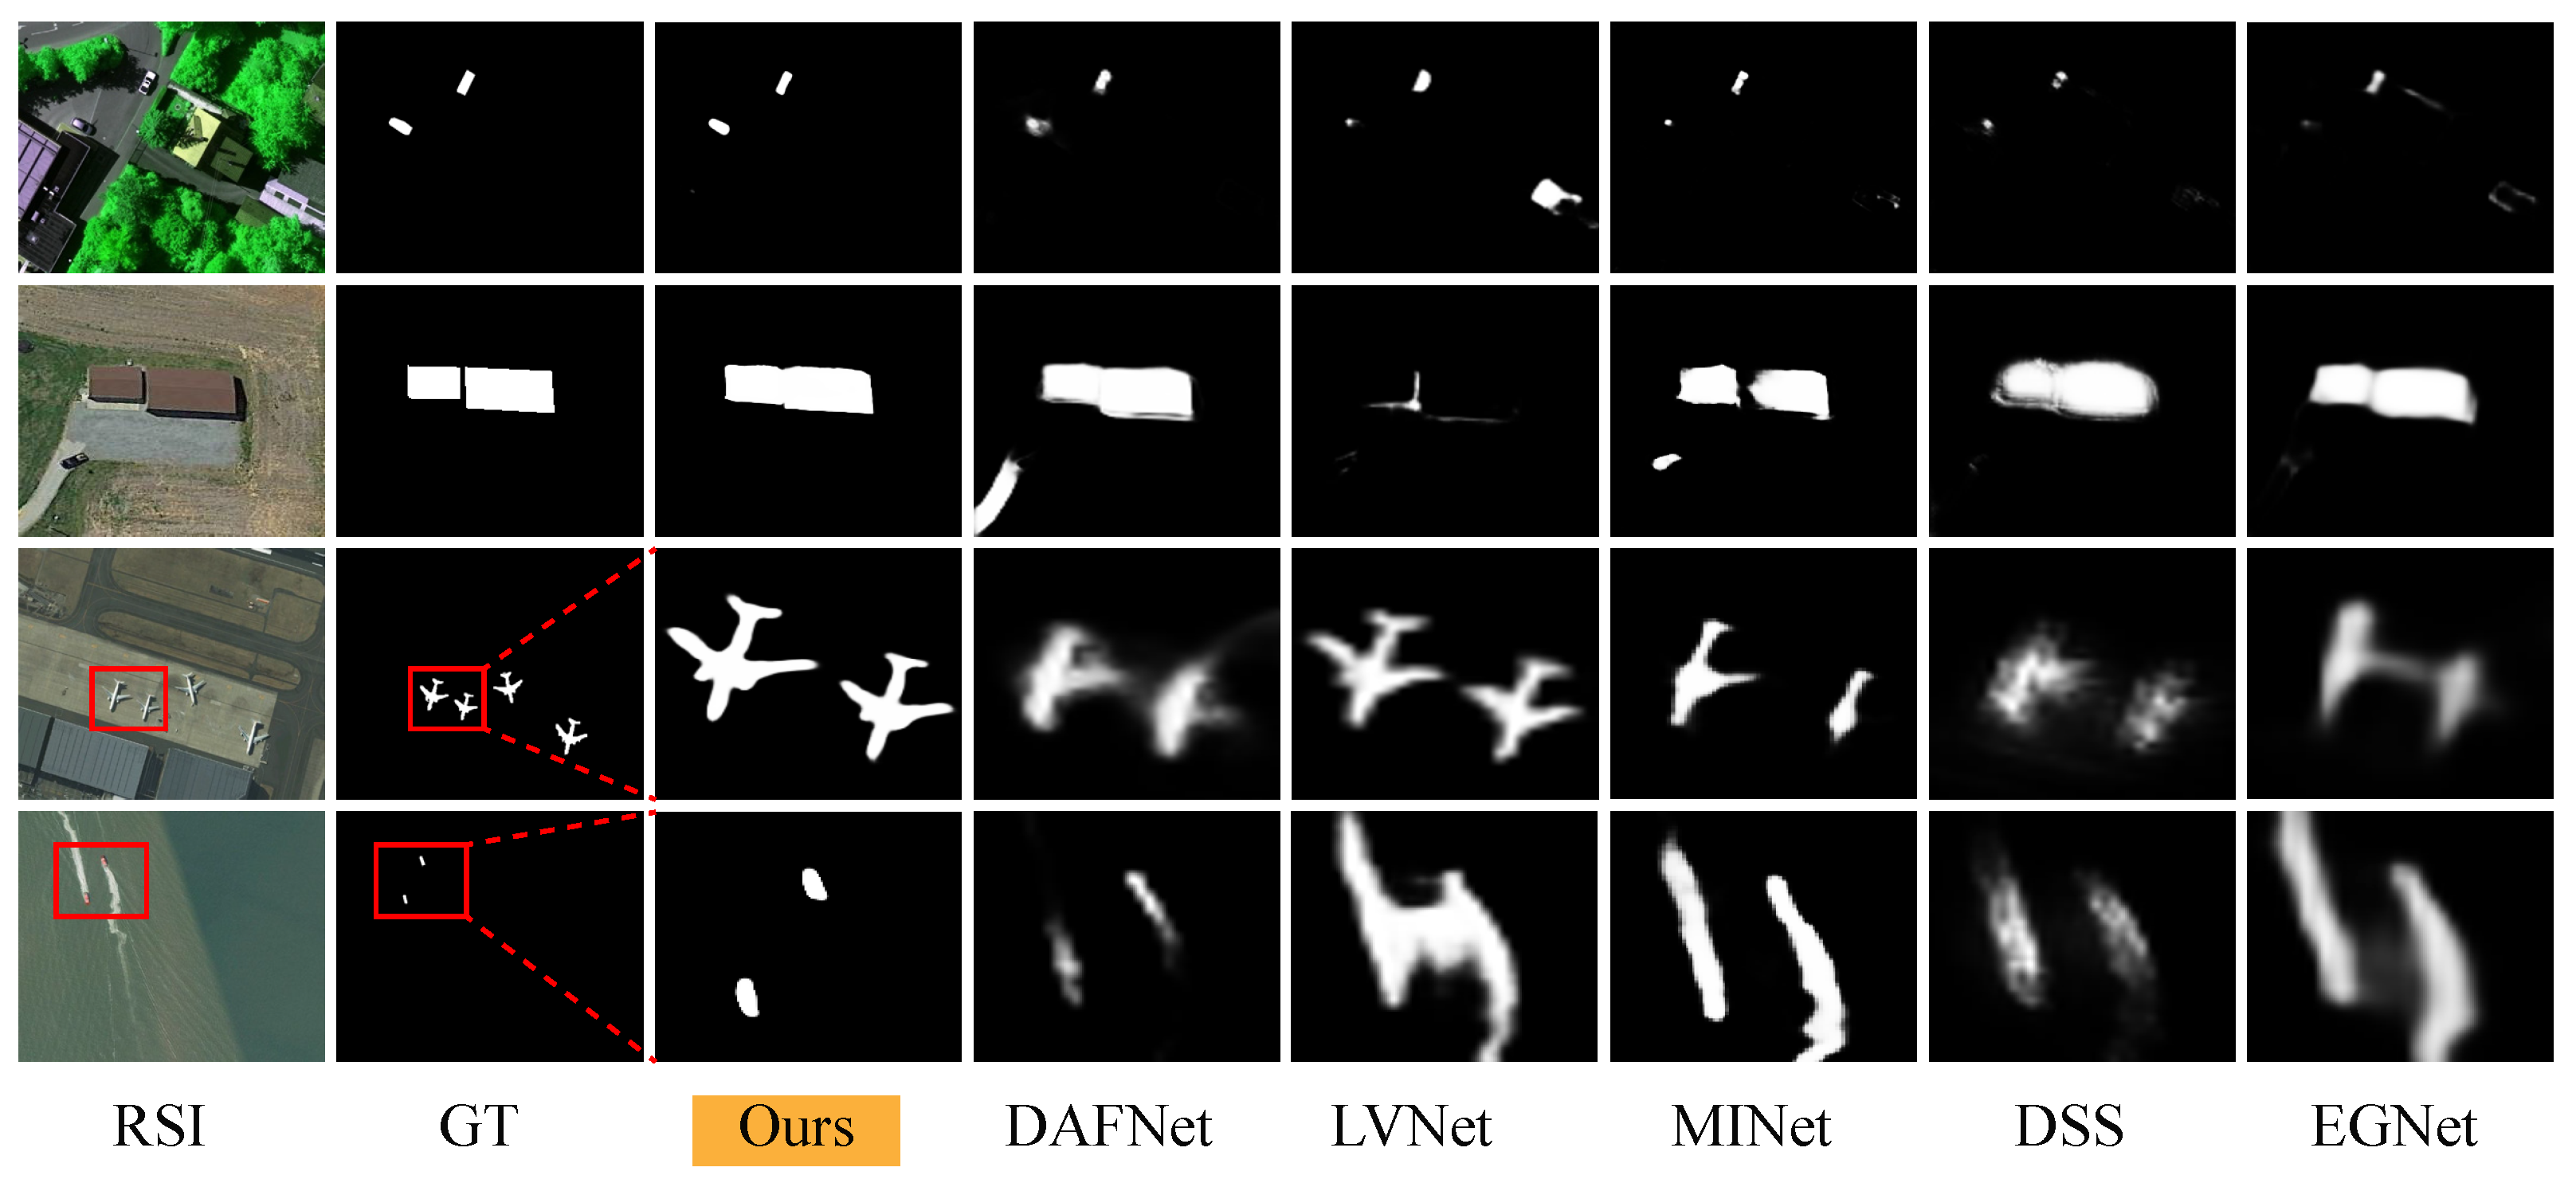
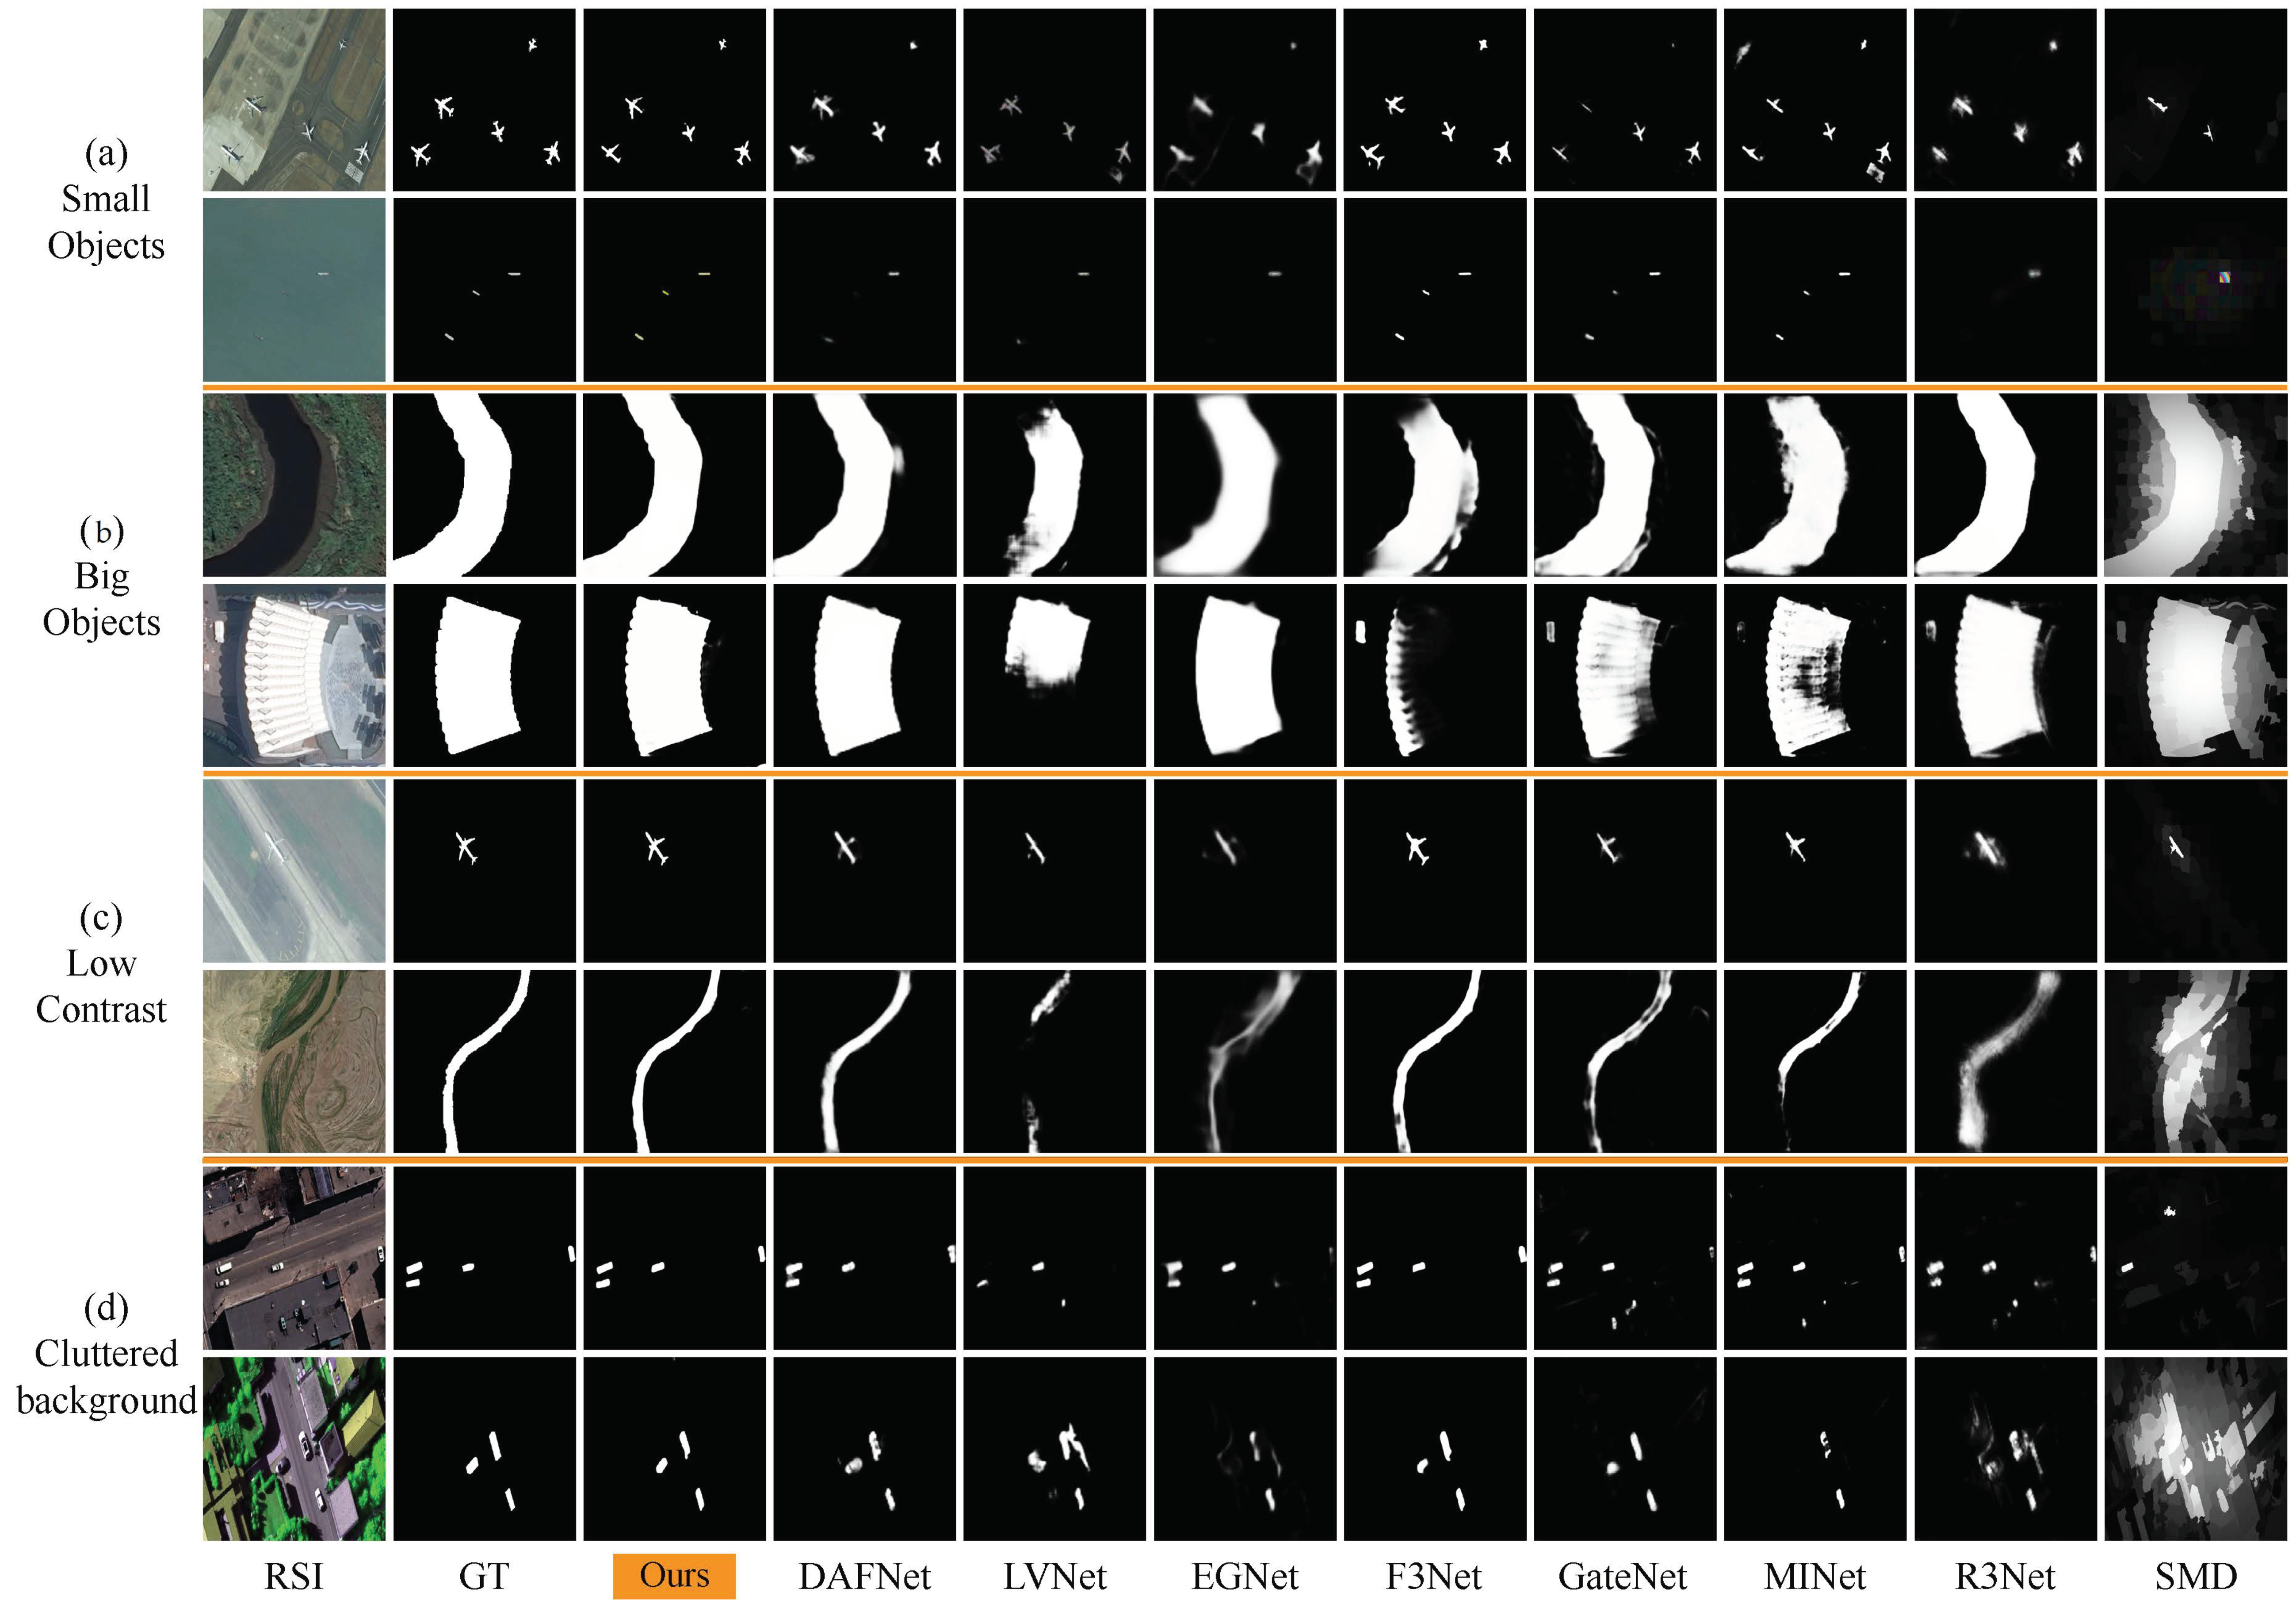
4.2.2. Visual Comparison
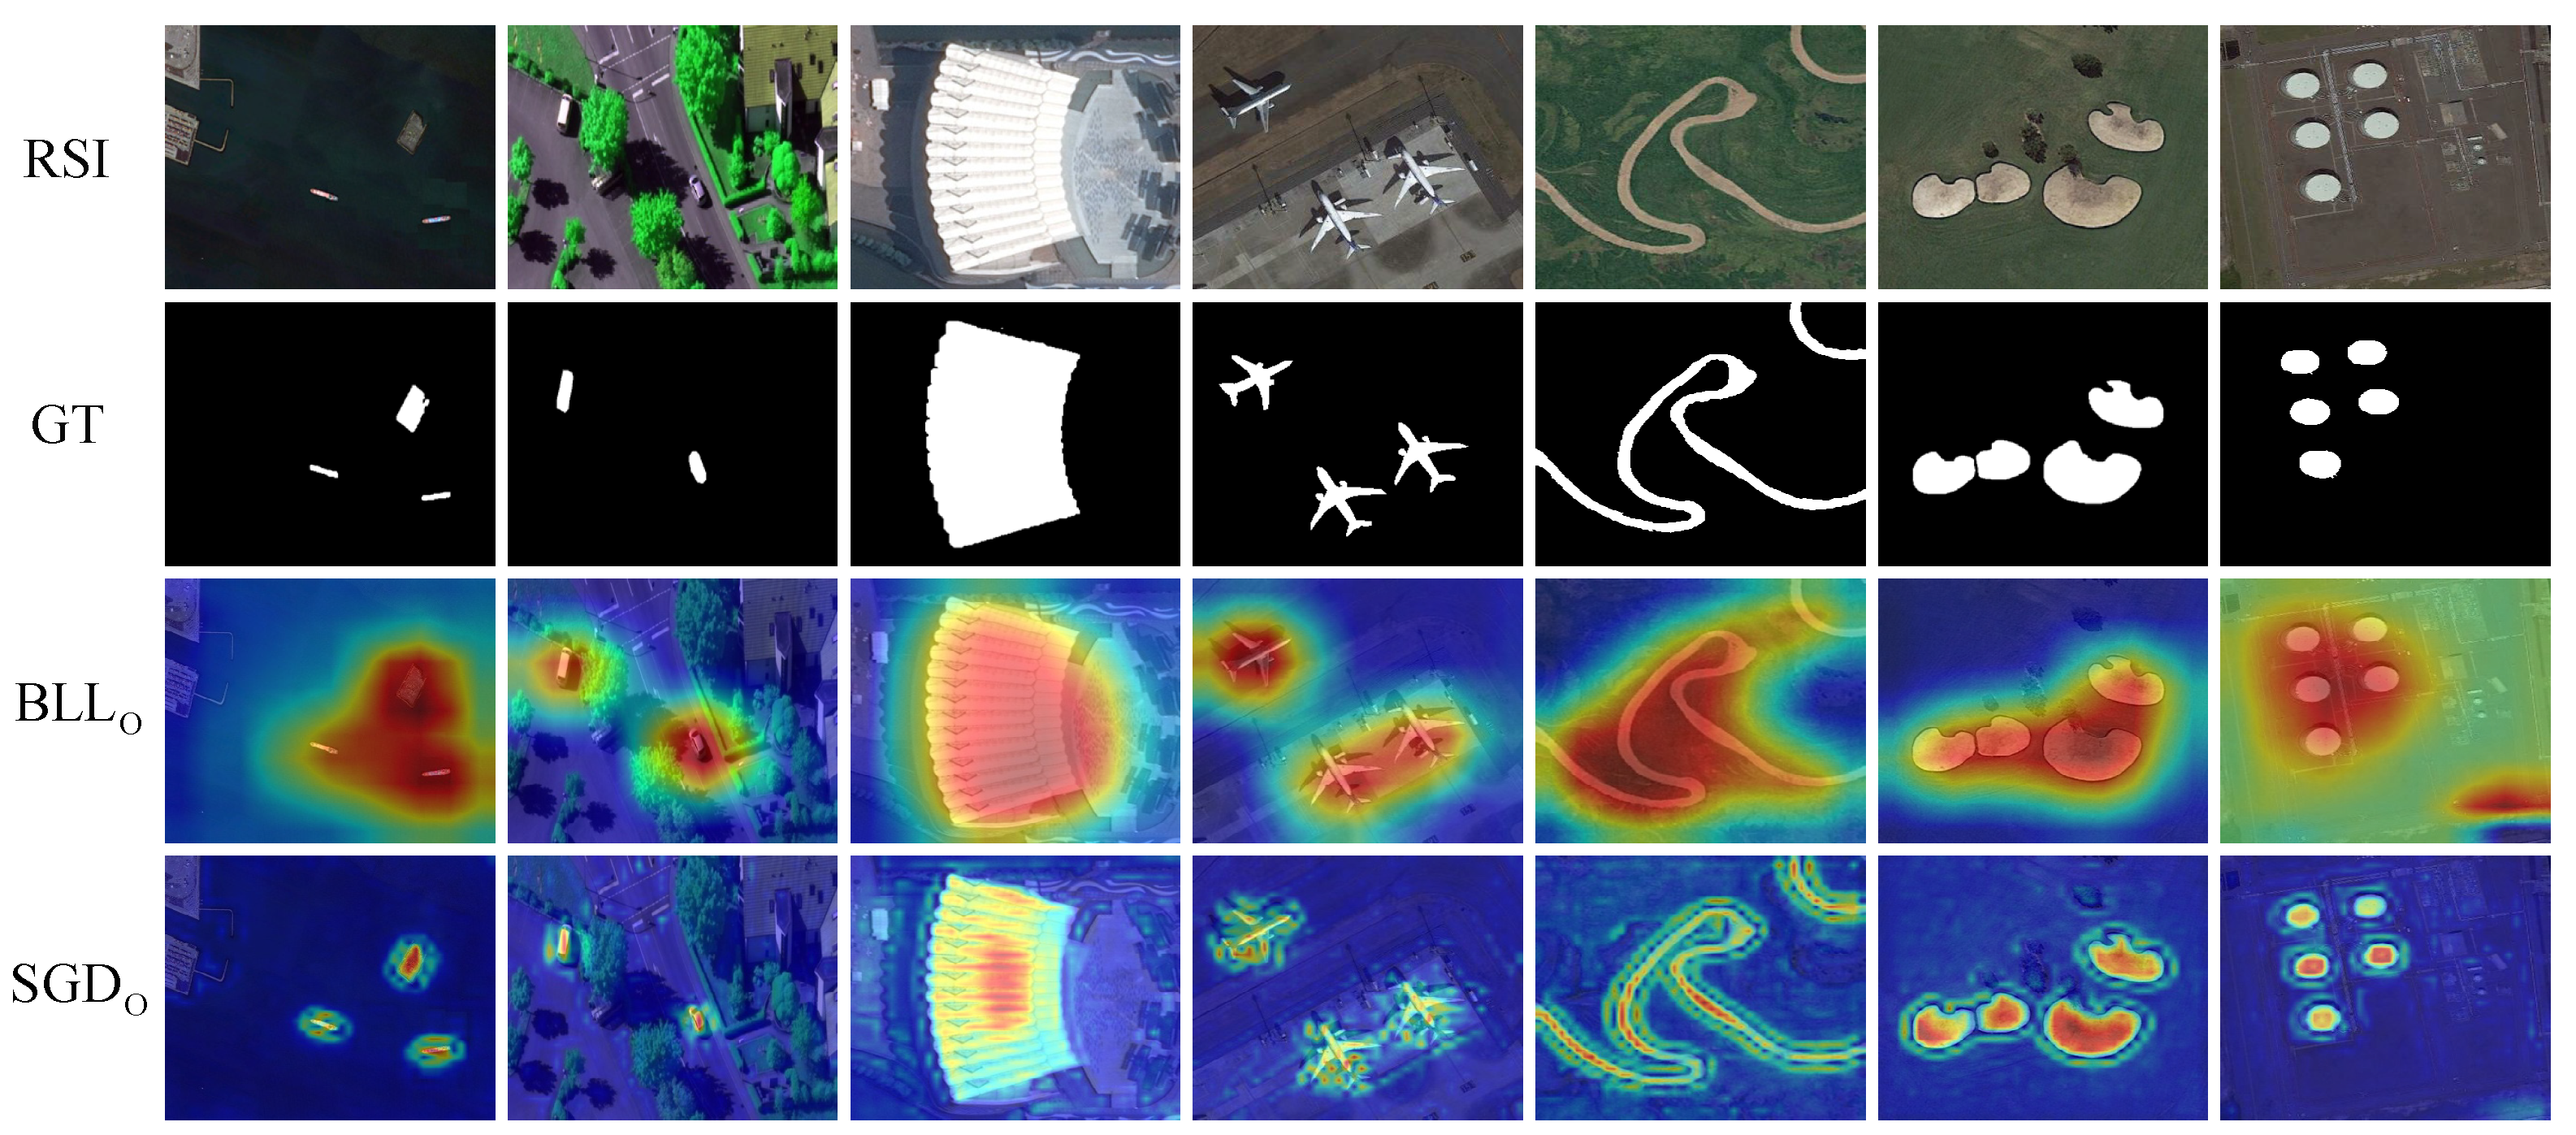
The visual comparison of some representative scenes is shown in Figure 1 and Figure 8, where the results are obtained by training or retraining on the EROSOD dataset through SARNet with ResNet50 backbone and other deep learning-based models. In Figure 1, although other methods are disturbed by object resolution and scene contrast, our method can accurately identify the whole object and obtain a clear boundary. A variety of challenging scenarios are covered in Figure 8, including small objects (a), large objects (b), low-contrast environments (c), and cluttered backgrounds (d). We observe that the proposed method can consistently generate more complete salient maps with sharp boundaries and meticulous details, as reflected in the following aspects:
(1)
Accurately locate the object. The proposed model perceives and accurately locates salient objects with varied scales and shapes in various scenes and has excellent background suppression ability. In detecting the scene with small objects in Figure 8a, most of the methods will miss aircraft and ships’ detection. For the river area (i.e., the second row of (b) and the first row of (d) in Figure 8), LVNet [18], EGNet [22], and SMD [31] can only roughly discover the potential location of the object.
(2)
The sharp edge of the object. How to get a clear object edge has always been a hot issue in the field of SOD. For all the specific challenging scenarios in Figure 8, the competitors can hardly get a saliency map with sharp edges. On the contrary, the proposed method can obtain precise and reliable object edges, especially in small objects and low contrast scenes.
(3)
The internal integrity of the object. From the second image of (b) and two images of (d) in Figure 8, it can be seen that most models cannot maintain the integrity of the object for the saliency detection of scenes containing slender and large targets, such as LVNet [18], F3Net [50], GateNet [59], and MINet [19]. In comparison, our SARNet can obtain internally consistent saliency maps.

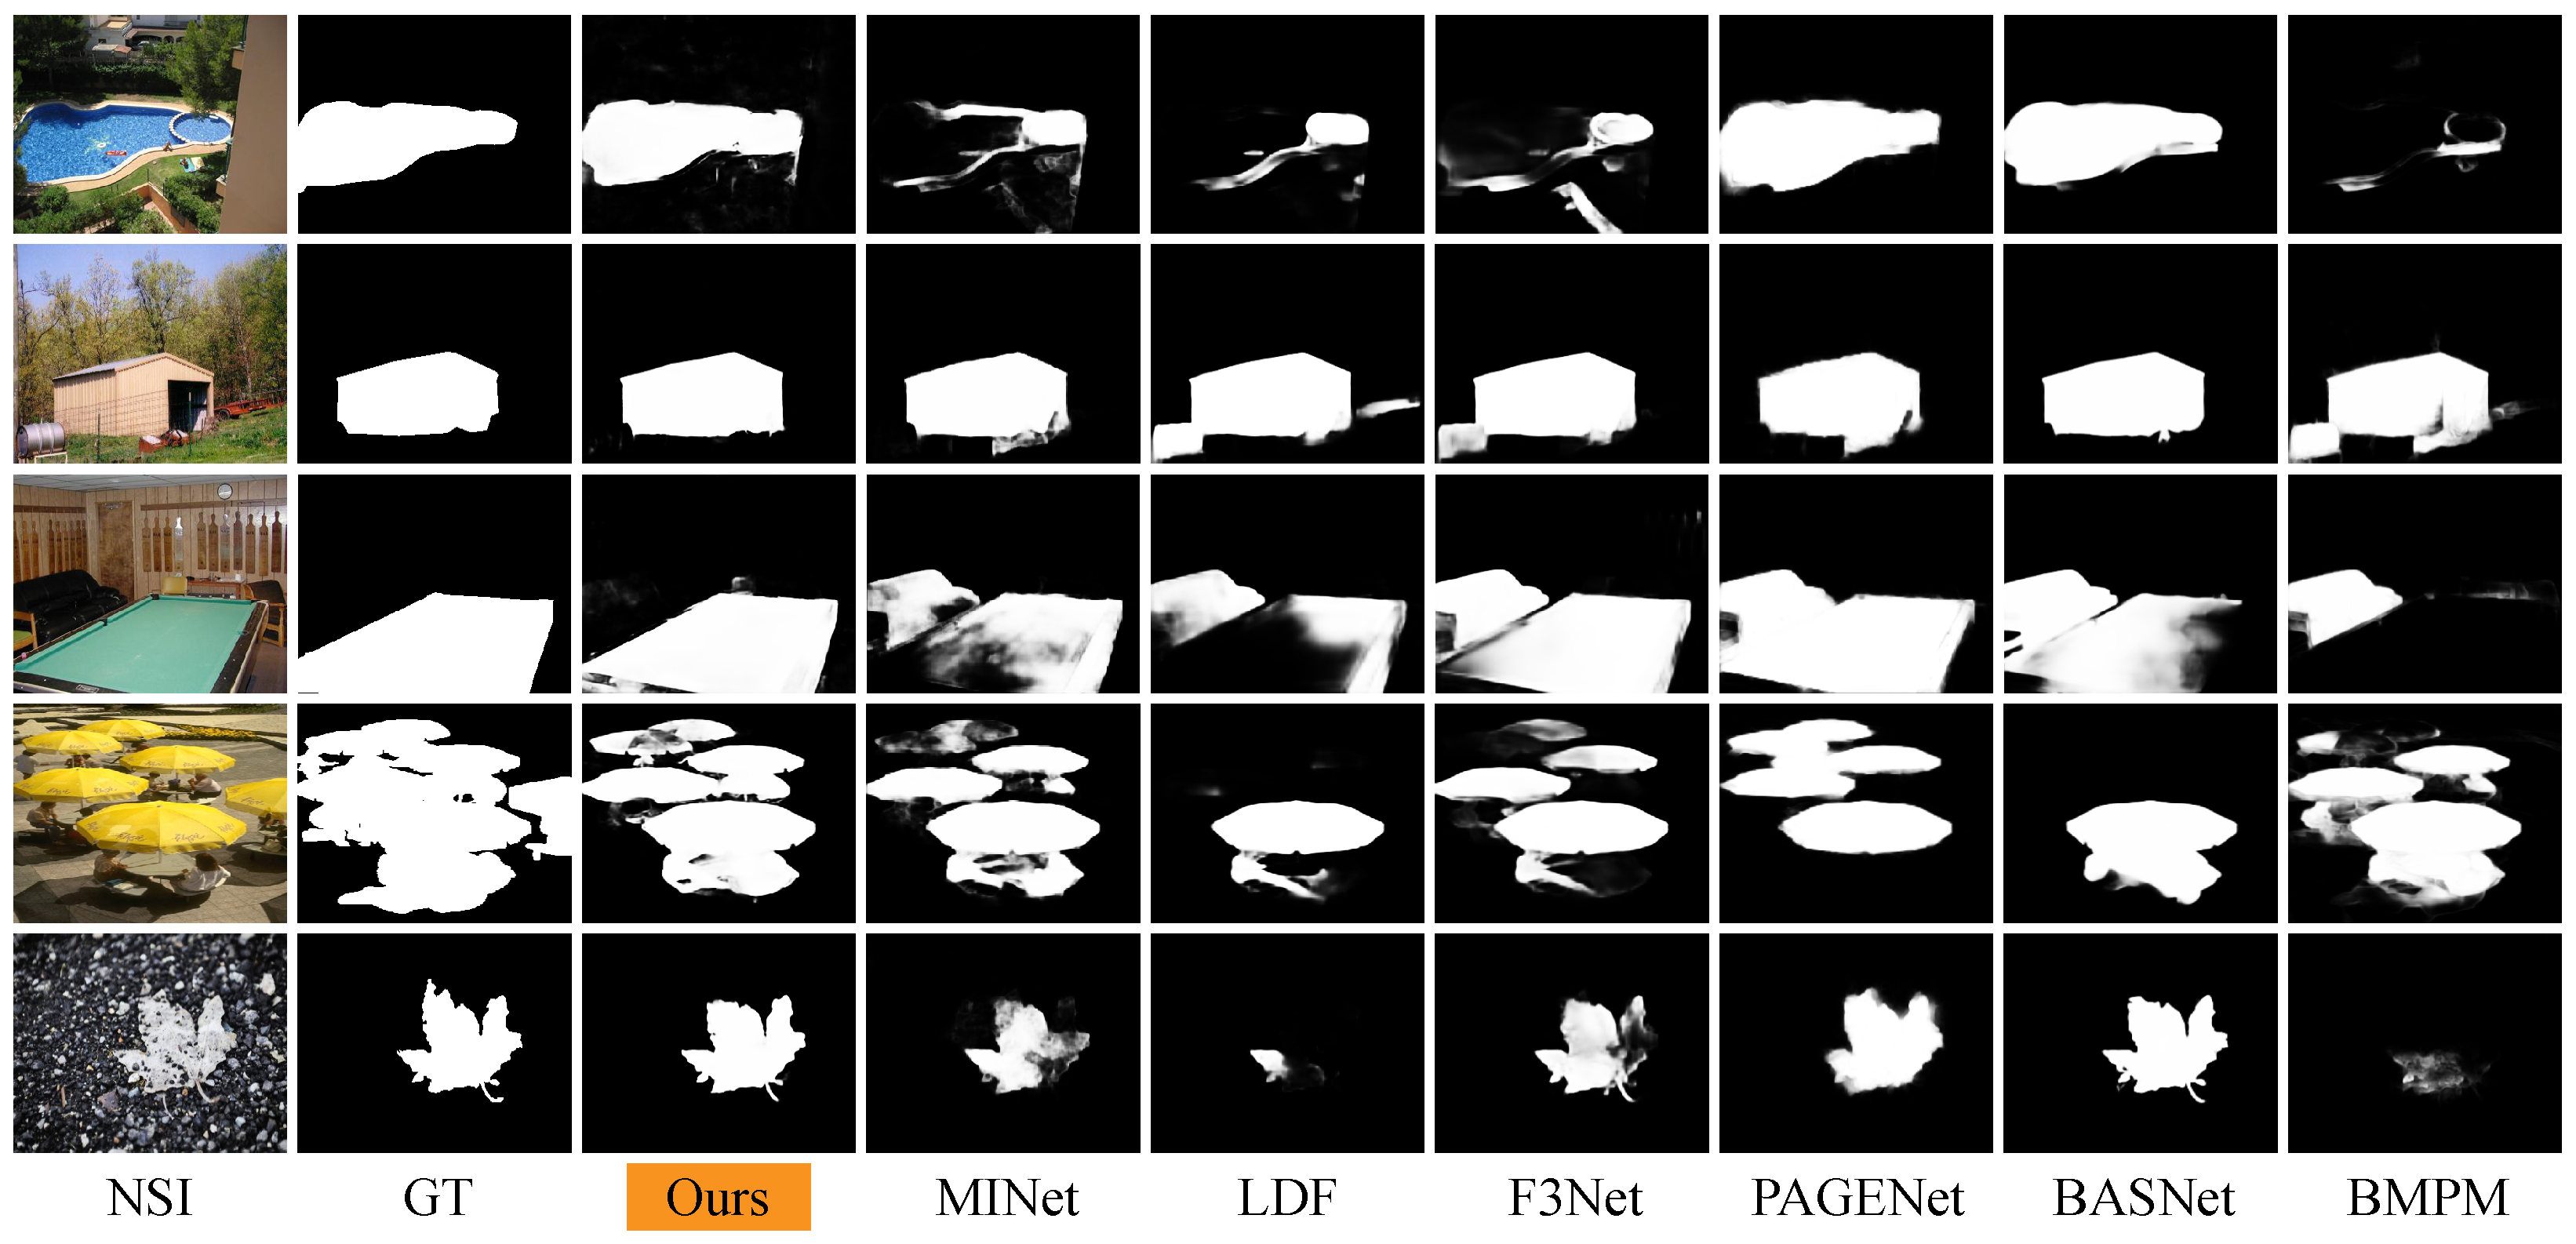
4.2.3. Extension Experiment on NSI Datasets

To further discuss the proposed model’s compatibility and scalability, we compare it with nine SOTA saliency detection models, including BMPM [63], PiCA [64], RAS [44], PAGE [45], AFNet [65], BASNet [66], F3Net [50], GateNet [59], and MINet [19], on three NSI datasets that are widely used in SOD. Judging from the four evaluation metrics’ scores in Table 2 (marked in red is the best), our SARNet can be highly competitive with these SOTA models, even better than most SOD models. In addition, some visual comparison results in NSI are shown in Figure 9, our results have sharp boundaries while maintaining the integrity of salient objects.

4.3. Ablation Study

Section 3 describes and explains the details of the proposed architecture in detail, from which we can see that our SARNet is composed of three key components, i.e., the backbone network for feature extraction, the integration strategy of side-out features, and the proposed semantic guidance decoding (SGD) module and parallel attention fusion (PAF) module. Therefore, this section conducts ablation experiments in the following three aspects to evaluate the necessity and contribution of each key component:
  • Scalability. Table 1 shows that the performance of SARNet can be effectively improved by using better backbones, and it also demonstrates the scalability of the proposed architecture. As shown in Table 1, the benchmark results on two RSI datasets show that the performance of SARNet can be effectively improved through a better backbone, which demonstrates the scalability of the proposed network architecture. As shown by the expansion experiments on NSI datasets in Table 2, the proposed model has exceptional competitive detection performance on multiple natural scene datasets, which further shows the compatibility and robustness of our SARNet.
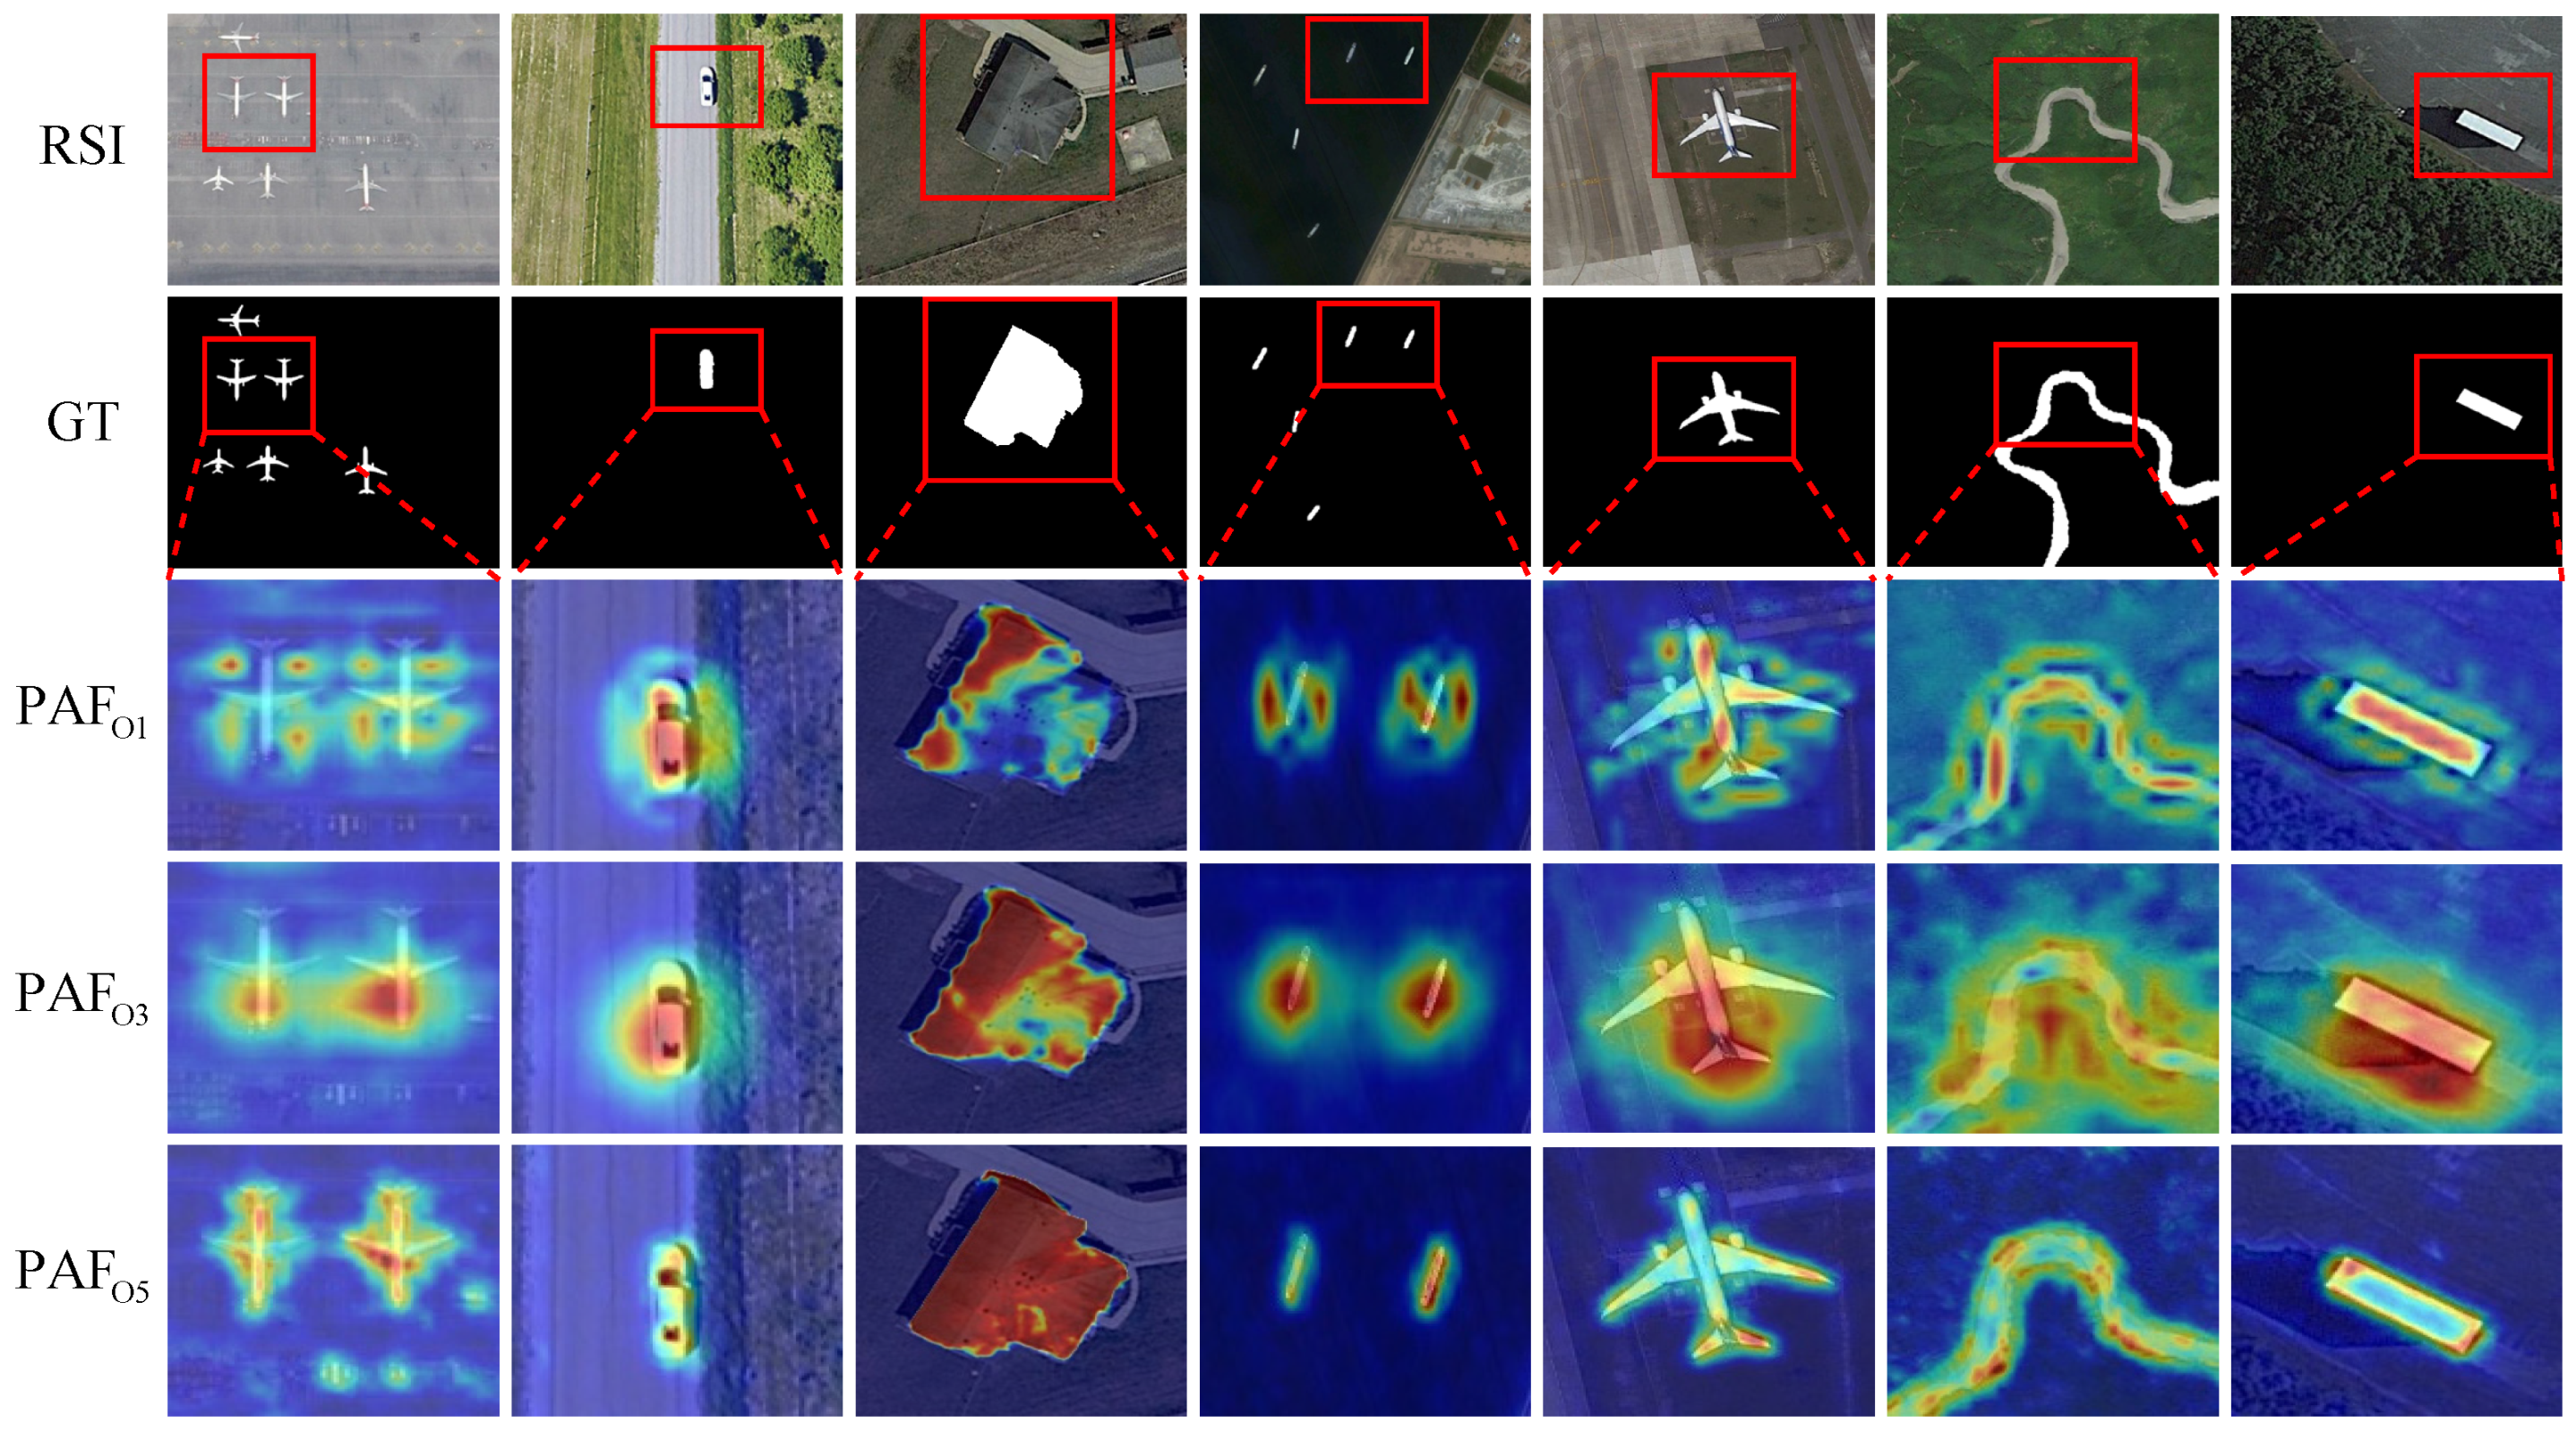
  • Aggregation strategy. Table 3 quantitatively shows the interaction and contribution of the proposed semantic guidance and cascade refinement mechanism on two RSI datasets. “ L F 3 ” and “ H F 3 ” respectively involve only three low-level features ( F 1 F 3 ) and three high-level features ( F 3 F 5 ). “ S G D 1 ” and “ S G D 2 ”, respectively, refer to only the combination of F 5 and F 5 + F 4 in the semantic guidance stage. “ P A F g ” and “ P A F h ”, respectively, use the combination of F l + F g and F l + F h in the parallel feature fusion stage. It can be seen from the metric scores in Table 3 that the proposed model benefits from the additional global semantic features and the feature aggregation strategy adopted.
  • Module. We conducted some evaluations on the effectiveness of the proposed modules. The baseline model (BM) used is a network with FPN structure. We assembled the SGD and PAF modules on the BM during the experiment, and the scores are shown in Table 4. Note that multi-level features are integrated by simple concatenate or addition operations to replace the proposed feature aggregation modules in the experiment. From the experimental results of the two datasets, we can see that both SGD and PAF modules can improve the model’s performance in varying degrees. The PAF module contributes more to the network than the SGD module. With the combination of the two modules, the proposed model can achieve the best performance.

4.4. Complexity Analysis
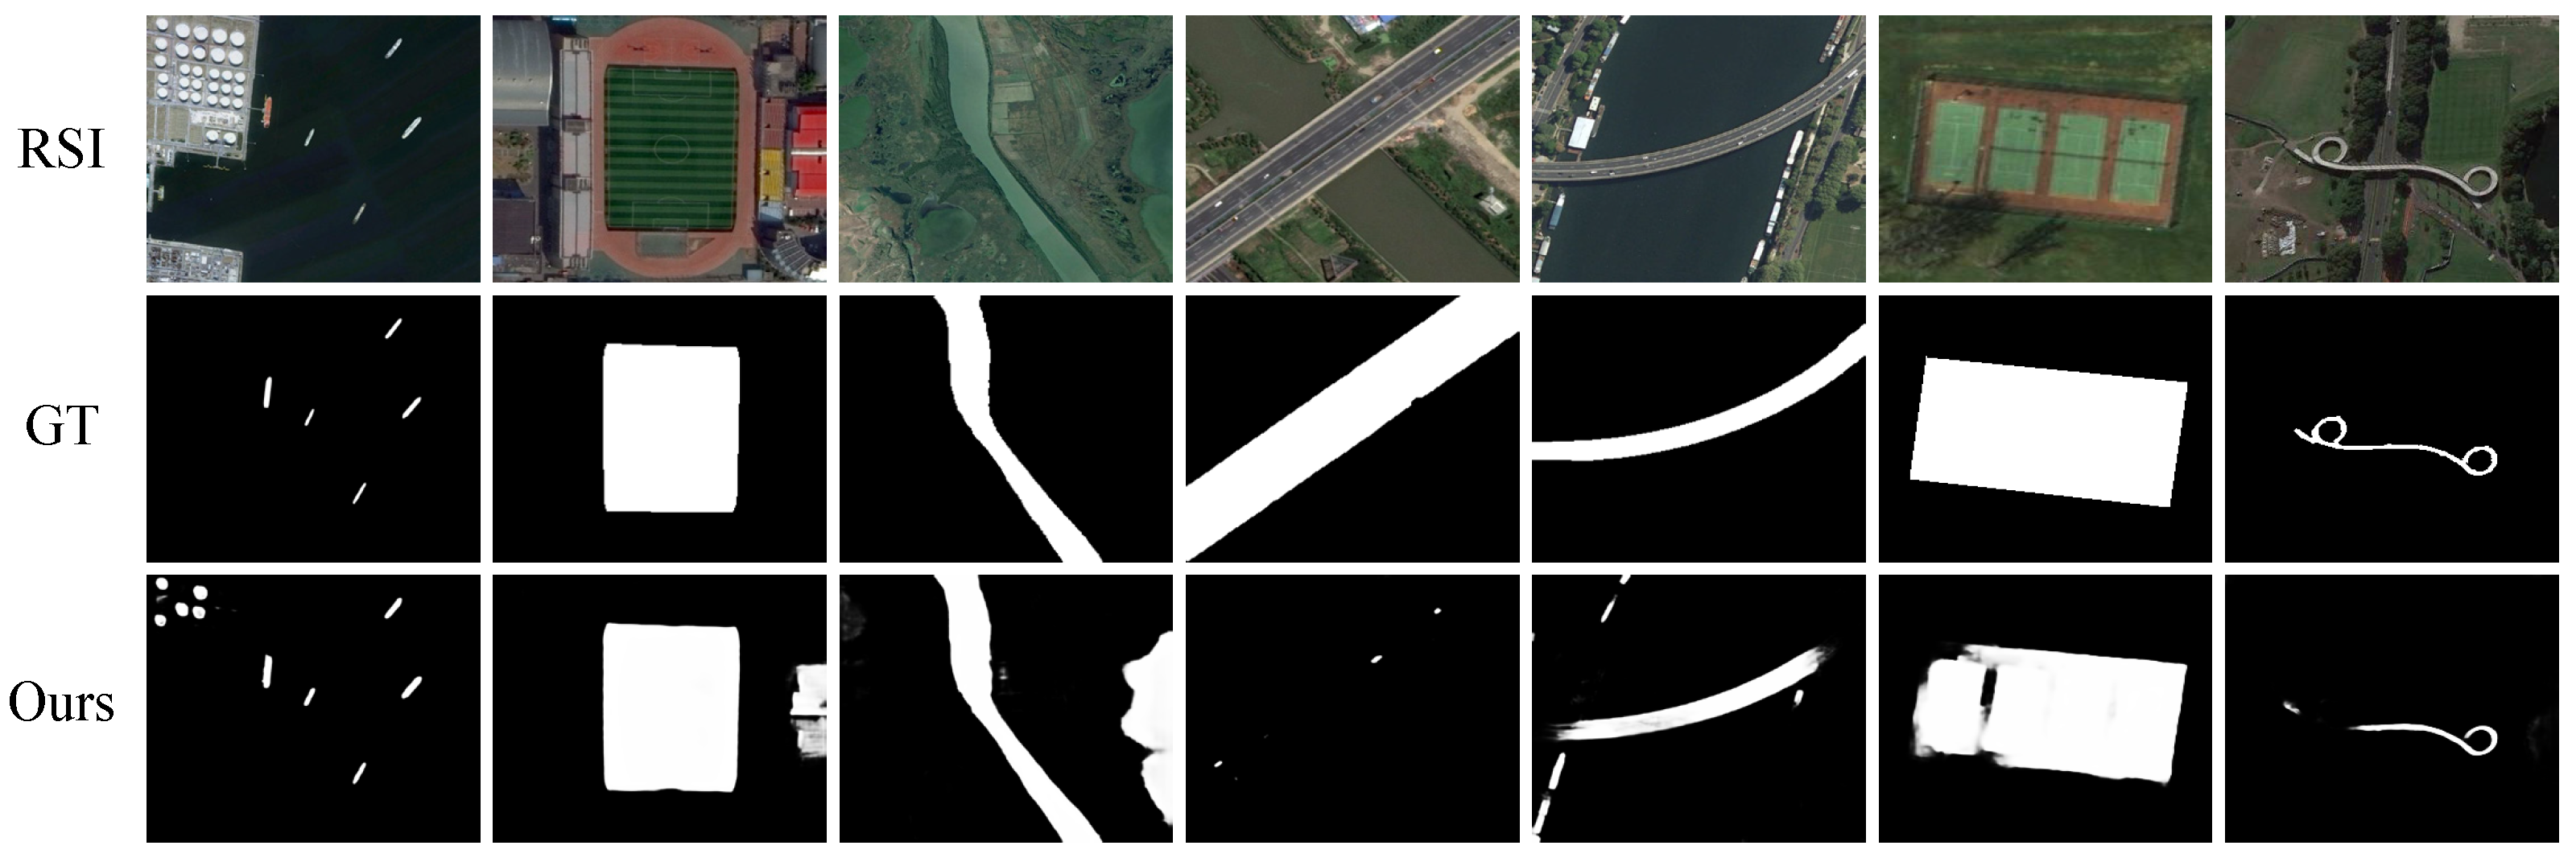
We provide some comparisons of the complexity of CNN-based SOD algorithms, including model parameters (#Param), GPU memory usage, and the number of floating-point operations (FLOP), as shown in Table 5. For SOD detectors, memory usage and FLOPs tested using a 336 × 336 input image except that a method specifies its input dimensions. Here, #Param and GPU memory usage are measured in millions (M), and the number of FLOPs is measured in Giga (G). From these criteria for evaluating the complexity of the model, we can see that our method is at a lower-middle level.

4.5. Failure Case

Although our model is more advanced than SOTAs in qualitative and quantitative experiments, a few cases in which the detection results are not satisfactory are shown in Figure 10. As shown in the first three columns in Figure 10, when the scene contains salient objects other than GT objects (that is, oil tanks, roofs, and water in the first to third columns), the detector can find all potential objects, which may require further contextual constraints to mitigate the situation. Our model detects small objects (cars and ships) in the fourth and fifth columns rather than bridges in the scene, which may be due to the lack of image data with salient objects on bridges in the training data (only four in EORSSD). In the sixth and seventh columns, we show examples of incomplete target detection, which can be improved by fine-tuning or training optimization.

5. Conclusions

This paper explores salient object detection in complex optical remote sensing scenes and tries to solve the challenging problems of inaccurate location and the unclear edge of salient objects. We propose a novel semantic-guided attention refinement network for SOD of optical RSI, which is an end-to-end encoding-decoding network architecture. The proposed SGD module focuses on the aggregation of high-level features to roughly but accurately locate the objects in the scene and guides the aggregation of low-level features through top-down feedback to refine the boundaries. The PAF module further integrates high-level and low-level side-out features and semantic guidance features through corresponding attention mechanisms. The comprehensive comparison between two RSI datasets and three extended NSI datasets and various ablation experimental results show that our SARNet shows the most advanced performance and strong robustness and compatibility on multi-scene datasets.
In future works, we will further study the following two directions: (1) to make more and larger optical RSI data sets for SOD. At present, the largest optical RSI dataset, i.e., EORSSD [20], contains 2000 images, which is higher than the number of the ORSSD [18] images. However, compared with the number of NSI for SOD or other datasets for object detection and semantic segmentation, the number of images is insufficient to support large-scale deep learning. Besides, remote sensing data usually cover a wide range of land, so it is necessary to expand the scale of the image to cover more. (2) Explore the multi-modal SOD method for RSI. In the last two years, the SOD method for RGB-D has been widely studied in NSI [33,46,67]. A variety of sensors can capture remote sensing images; naturally, the idea of multi-modal SOD can be extended to the SOD of multi-source remote sensing scenes.

Author Contributions

Z.H. designed and implemented the whole model architecture and manuscript writing. H.C., B.L., and Z.W. provided suggestions and reviewed the manuscript. All authors have read and agreed to the published version of the manuscript.

Funding

This research was supported by a grant from the Sichuan Major Science and Technology Special Foundation (No.2018GZDZX0017), the Key Research and Development Project of Sichuan Province of China (No.2020YFG0193), and the YangFan Project of Guangdong Province of China (No.2020-05).

Informed Consent Statement

Not applicable.

Data Availability Statement

The datasets used in this experiment can be accessed at the following address: ORSSD: https://li-chongyi.github.io/proj_optical_saliency.html (accessed on 29 May 2021). EORSSD: https://github.com/rmcong/EORSSD-dataset (accessed on 29 May 2021). The DUT-OMRON, DUTS, and HKU-IS datasets are available on http://dpfan.net/socbenchmark/ (accessed on 29 May 2021).

Acknowledgments

The authors would like to thank Dengping Fan for his guidance and help in this work.

Conflicts of Interest

The authors declare no conflict of interest.

References

  1. Chen, Z.; Zhang, T.; Ouyang, C. End-to-end airplane detection using transfer learning in remote sensing images. Remote Sens. 2018, 10, 139. [Google Scholar] [CrossRef] [Green Version]
  2. Nie, T.; Han, X.; He, B.; Li, X.; Liu, H.; Bi, G. Ship detection in panchromatic optical remote sensing images based on visual saliency and multi-dimensional feature description. Remote Sens. 2020, 12, 152. [Google Scholar] [CrossRef] [Green Version]
  3. Liu, Z.; Zhao, D.; Shi, Z.; Jiang, Z. Unsupervised Saliency Model with Color Markov Chain for Oil Tank Detection. Remote Sens. 2019, 11, 1089. [Google Scholar] [CrossRef] [Green Version]
  4. Li, C.; Luo, B.; Hong, H.; Su, X.; Wang, Y.; Liu, J.; Wang, C.; Zhang, J.; Wei, L. Object detection based on global-local saliency constraint in aerial images. Remote Sens. 2020, 12, 1435. [Google Scholar] [CrossRef]
  5. Wang, W.; Lai, Q.; Fu, H.; Shen, J.; Ling, H.; Yang, R. Salient object detection in the deep learning era: An in-depth survey. IEEE Trans. Pattern Anal. Mach. Intell. 2021. [Google Scholar] [CrossRef]
  6. Cong, R.; Lei, J.; Fu, H.; Cheng, M.M.; Lin, W.; Huang, Q. Review of visual saliency detection with comprehensive information. IEEE Trans. Circuits Syst. Video Technol. 2018, 29, 2941–2959. [Google Scholar] [CrossRef] [Green Version]
  7. Gao, Y.; Shi, M.; Tao, D.; Xu, C. Database saliency for fast image retrieval. IEEE Trans. Multimed. 2015, 17, 359–369. [Google Scholar] [CrossRef]
  8. Ma, C.; Miao, Z.; Zhang, X.P.; Li, M. A saliency prior context model for real-time object tracking. IEEE Trans. Multimed. 2017, 19, 2415–2424. [Google Scholar] [CrossRef]
  9. Zeng, Y.; Zhuge, Y.; Lu, H.; Zhang, L. Joint learning of saliency detection and weakly supervised semantic segmentation. In Proceedings of the IEEE International Conference on Computer Vision, Seoul, Korea, 27–28 October 2019; IEEE: Piscataway, NJ, USA, 2019; pp. 7223–7233. [Google Scholar]
  10. Fan, D.P.; Ji, G.P.; Zhou, T.; Chen, G.; Fu, H.; Shen, J.; Shao, L. Pranet: Parallel reverse attention network for polyp segmentation. In Proceedings of the 23rd International Conference on Medical Image Computing and Computer-Assisted Intervention, Lima, Peru, 4–8 October 2020; Springer: Berlin/Heidelberg, Germany, 2020; pp. 263–273. [Google Scholar]
  11. Fan, D.P.; Ji, G.P.; Sun, G.; Cheng, M.M.; Shen, J.; Shao, L. Camouflaged object detection. In Proceedings of the IEEE/CVF Conference on Computer Vision and Pattern Recognition, Seattle, WA, USA, 14–19 June 2020; IEEE: Piscataway, NJ, USA, 2020; pp. 2777–2787. [Google Scholar]
  12. Zhao, D.; Ma, Y.; Jiang, Z.; Shi, Z. Multiresolution airport detection via hierarchical reinforcement learning saliency model. IEEE J. Sel. Top. Appl. Earth Observ. Remote Sens. 2017, 10, 2855–2866. [Google Scholar] [CrossRef]
  13. Hou, B.; Wang, Y.; Liu, Q. A saliency guided semi-supervised building change detection method for high resolution remote sensing images. Sensors 2016, 16, 1377. [Google Scholar] [CrossRef] [PubMed] [Green Version]
  14. Feng, W.; Sui, H.; Tu, J.; Huang, W.; Sun, K. A novel change detection approach based on visual saliency and random forest from multi-temporal high-resolution remote-sensing images. Int. J. Remote Sens. 2018, 39, 7998–8021. [Google Scholar] [CrossRef]
  15. Peng, Y.; Zhang, Z.; He, G.; Wei, M. An improved grabcut method based on a visual attention model for rare-earth ore mining area recognition with high-resolution remote sensing images. Remote Sens. 2019, 11, 987. [Google Scholar] [CrossRef] [Green Version]
  16. Zhang, L.; Liu, Y.; Zhang, J. Saliency detection based on self-adaptive multiple feature fusion for remote sensing images. Int. J. Remote Sens. 2019, 40, 8270–8297. [Google Scholar] [CrossRef]
  17. Li, C.; Cong, R.; Guo, C.; Li, H.; Zhang, C.; Zheng, F.; Zhao, Y. A parallel down-up fusion network for salient object detection in optical remote sensing images. Neurocomputing 2020, 415, 411–420. [Google Scholar] [CrossRef]
  18. Li, C.; Cong, R.; Hou, J.; Zhang, S.; Qian, Y.; Kwong, S. Nested network with two-stream pyramid for salient object detection in optical remote sensing images. IEEE Trans. Geosci. Remote Sens. 2019, 57, 9156–9166. [Google Scholar] [CrossRef] [Green Version]
  19. Pang, Y.; Zhao, X.; Zhang, L.; Lu, H. Multi-Scale Interactive Network for Salient Object Detection. In Proceedings of the IEEE/CVF Conference on Computer Vision and Pattern Recognition (CVPR), Seattle, WA, USA, 14–19 June 2020; pp. 9413–9422. [Google Scholar]
  20. Zhang, Q.; Cong, R.; Li, C.; Cheng, M.M.; Fang, Y.; Cao, X.; Zhao, Y.; Kwong, S. Dense Attention Fluid Network for Salient Object Detection in Optical Remote Sensing Images. IEEE Trans. Image Process. 2020, 30, 1305–1317. [Google Scholar] [CrossRef] [PubMed]
  21. Hou, Q.; Cheng, M.; Hu, X.; Borji, A.; Tu, Z.; Torr, P. Deeply Supervised Salient Object Detection with Short Connections. IEEE Trans. Pattern Anal. Mach. Intell. 2019, 41, 815. [Google Scholar] [CrossRef] [PubMed] [Green Version]
  22. Zhao, J.X.; Liu, J.J.; Fan, D.P.; Cao, Y.; Yang, J.; Cheng, M.M. EGNet: Edge guidance network for salient object detection. In Proceedings of the IEEE/CVF International Conference on Computer Vision, Seoul, Korea, 27–28 October 2019; IEEE: Piscataway, NJ, USA, 2019; pp. 8779–8788. [Google Scholar]
  23. Liu, S.; Huang, D. Receptive field block net for accurate and fast object detection. In Proceedings of the European Conference on Computer Vision, Munich, Germany, 8–14 September 2018; Springer: Berlin/Heidelberg, Germany, 2018; pp. 385–400. [Google Scholar]
  24. Zhao, T.; Wu, X. Pyramid feature attention network for saliency detection. In Proceedings of the IEEE Conference on Computer Vision and Pattern Recognition, Long Beach, CA, USA, 15–20 June 2019; IEEE: Piscataway, NJ, USA; pp. 3085–3094. [Google Scholar]
  25. Zhao, J.X.; Cao, Y.; Fan, D.P.; Cheng, M.M.; Li, X.Y.; Zhang, L. Contrast prior and fluid pyramid integration for RGBD salient object detection. In Proceedings of the IEEE Conference on Computer Vision and Pattern Recognition, Long Beach, CA, USA, 18–22 June 2018; IEEE: Piscataway, NJ, USA, 2019; pp. 3927–3936. [Google Scholar]
  26. Fan, D.P.; Zhai, Y.; Borji, A.; Yang, J.; Shao, L. BBS-Net: RGB-D salient object detection with a bifurcated backbone strategy network. In Proceedings of the European Conference on Computer Vision, Glasgow, UK, 23–28 August 2020; Springer International Publishing: Cham, Switzerland, 2020; pp. 275–292. [Google Scholar]
  27. Yang, M.; Yu, K.; Zhang, C.; Li, Z.; Yang, K. Denseaspp for semantic segmentation in street scenes. In Proceedings of the IEEE Conference on Computer Vision and Pattern Recognition, Salt Lake City, UT, USA, 18–22 June 2018; IEEE: Piscataway, NJ, USA, 2018; pp. 3684–3692. [Google Scholar]
  28. Kim, J.; Han, D.; Tai, Y.W.; Kim, J. Salient region detection via high-dimensional color transform. In Proceedings of the IEEE Conference on Computer Vision and Pattern Recognition, Columbus, OH, USA, 23–28 June 2014; IEEE: Piscataway, NJ, USA, 2014; pp. 883–890. [Google Scholar]
  29. Huang, Z.; Chen, H.X.; Zhou, T.; Yang, Y.Z.; Wang, C.Y.; Liu, B.Y. Contrast-weighted dictionary learning based saliency detection for VHR optical remote sensing images. Pattern Recognit. 2020, 113, 107757. [Google Scholar] [CrossRef]
  30. Huang, Z.; Chen, H.; Liu, B. Deep Convolutional Sparse Coding Network for Salient Object Detection in VHR Remote Sensing Images. In Proceedings of the 17th International Computer Conference on Wavelet Active Media Technology and Information Processing, Chengdu, China, 18–20 December 2020; IEEE: Piscataway, NJ, USA, 2020; pp. 361–365. [Google Scholar]
  31. Peng, H.; Li, B.; Ling, H.; Hu, W.; Xiong, W.; Maybank, S.J. Salient object detection via structured matrix decomposition. IEEE Trans. Pattern Anal. Mach. Intell. 2016, 39, 818–832. [Google Scholar] [CrossRef] [Green Version]
  32. Zhou, L.; Yang, Z.; Zhou, Z.; Hu, D. Salient region detection using diffusion process on a two-layer sparse graph. IEEE Trans. Image Process. 2017, 26, 5882–5894. [Google Scholar] [CrossRef]
  33. Huang, Z.; Chen, H.X.; Zhou, T.; Yang, Y.Z.; Wang, C.Y. Multi-level Cross-modal Interaction Network for RGB-D Salient Object Detection. Neurocomputing 2021, 452, 200–211. [Google Scholar] [CrossRef]
  34. Li, G.; Yu, Y. Visual saliency based on multiscale deep features. In Proceedings of the IEEE Conference on Computer Vision and Pattern Recognition, Boston, MA, USA, 7–12 June 2015; IEEE: Piscataway, NJ, USA, 2015; pp. 5455–5463. [Google Scholar]
  35. Zhao, R.; Ouyang, W.; Li, H.; Wang, X. Saliency detection by multi-context deep learning. In Proceedings of the IEEE Conference on Computer Vision and Pattern Recognition, Boston, MA, USA, 7–12 June 2015; IEEE: Piscataway, NJ, USA, 2015; pp. 1265–1274. [Google Scholar]
  36. Deng, Z.; Hu, X.; Zhu, L.; Xu, X.; Qin, J.; Han, G.; Heng, P.A. R3net: Recurrent residual refinement network for saliency detection. In Proceedings of the 27th International Joint Conference on Artificial Intelligence, Stockholm, Sweden, 13–19 July 2018; AAAI Press: Menlo Park, CA, USA, 2018; pp. 684–690. [Google Scholar]
  37. Yao, X.; Han, J.; Guo, L.; Bu, S.; Liu, Z. A coarse-to-fine model for airport detection from remote sensing images using target-oriented visual saliency and CRF. Neurocomputing 2015, 164, 162–172. [Google Scholar] [CrossRef]
  38. Chaudhari, S.; Polatkan, G.; Ramanath, R.; Mithal, V. An attentive survey of attention models. arXiv 2019, arXiv:1904.02874. [Google Scholar]
  39. Hu, J.; Shen, L.; Sun, G. Squeeze-and-excitation networks. In Proceedings of the IEEE Conference on Computer Vision and Pattern Recognition, Salt Lake City, UT, USA, 18–22 June 2018; IEEE: Piscataway, NJ, USA, 2018; pp. 7132–7141. [Google Scholar]
  40. Jaderberg, M.; Simonyan, K.; Zisserman, A.; Kavukcuoglu, K. Spatial transformer networks. arXiv 2015, arXiv:1506.02025. [Google Scholar]
  41. Wang, F.; Jiang, M.; Qian, C.; Yang, S.; Li, C.; Zhang, H.; Wang, X.; Tang, X. Residual attention network for image classification. In Proceedings of the IEEE Conference on Computer Vision and Pattern Recognition, Honolulu, HI, USA, 21–26 July 2017; IEEE: Piscataway, NJ, USA, 2017; pp. 3156–3164. [Google Scholar]
  42. Huang, Z.; Wang, X.; Huang, L.; Huang, C.; Wei, Y.; Liu, W. Ccnet: Criss-cross attention for semantic segmentation. In Proceedings of the IEEE/CVF International Conference on Computer Vision, Long Beach, CA, USA, 15–20 June 2019; IEEE: Piscataway, NJ, USA, 2019; pp. 603–612. [Google Scholar]
  43. Kuen, J.; Wang, Z.; Wang, G. Recurrent attentional networks for saliency detection. In Proceedings of the IEEE Conference on computer Vision and Pattern Recognition, Las Vegas, NV, USA, 27–30 June 2016; IEEE: Piscataway, NJ, USA, 2016; pp. 3668–3677. [Google Scholar]
  44. Chen, S.; Tan, X.; Wang, B.; Hu, X. Reverse attention for salient object detection. In Proceedings of the European Conference on Computer Vision, Munich, Germany, 8–4 September 2018; Springer: Berlin/Heidelberg, Germany, 2018; pp. 234–250. [Google Scholar]
  45. Wang, W.; Zhao, S.; Shen, J.; Hoi, S.C.; Borji, A. Salient object detection with pyramid attention and salient edges. In Proceedings of the IEEE/CVF Conference on Computer Vision and Pattern Recognition, Long Beach, CA, USA, 15–20 June 2019; IEEE: Piscataway, NJ, USA, 2019; pp. 1448–1457. [Google Scholar]
  46. Fan, D.P.; Lin, Z.; Zhang, Z.; Zhu, M.; Cheng, M.M. Rethinking RGB-D Salient Object Detection: Models, Data Sets, and Large-Scale Benchmarks. IEEE Trans. Neural Netw. Learn. Syst. 2020, 32, 2075–2089. [Google Scholar] [CrossRef]
  47. Simonyan, K.; Zisserman, A. Very deep convolutional networks for large-scale image recognition. arXiv 2014, arXiv:1409.1556. [Google Scholar]
  48. He, K.; Zhang, X.; Ren, S.; Sun, J. Deep residual learning for image recognition. In Proceedings of the IEEE conference on computer vision and pattern recognition, Las Vegas, NV, USA, 27–30 June 2016; IEEE: Piscataway, NJ, USA, 2016; pp. 770–778. [Google Scholar]
  49. Gao, S.; Cheng, M.M.; Zhao, K.; Zhang, X.Y.; Yang, M.H.; Torr, P.H. Res2net: A new multi-scale backbone architecture. IEEE Trans. Pattern Anal. Mach. Intell. 2019, 43, 652–662. [Google Scholar] [CrossRef] [PubMed] [Green Version]
  50. Wei, J.; Wang, S.; Huang, Q. F3Net: Fusion, Feedback and Focus for Salient Object Detection. In Proceedings of the AAAI Conference on Artificial Intelligence, New York, NY, USA, 7–12 February 2020; AAAI Press: Menlo Park, CA, USA, 2020; pp. 12321–12328. [Google Scholar]
  51. Chen, Z.; Xu, Q.; Cong, R.; Huang, Q. Global context-aware progressive aggregation network for salient object detection. arXiv 2020, arXiv:2003.00651. [Google Scholar] [CrossRef]
  52. Cheng, G.; Zhou, P.; Han, J. Learning rotation-invariant convolutional neural networks for object detection in VHR optical remote sensing images. IEEE Trans. Geosci. Remote Sens. 2016, 54, 7405–7415. [Google Scholar] [CrossRef]
  53. Xia, G.S.; Hu, J.; Hu, F.; Shi, B.; Bai, X.; Zhong, Y.; Zhang, L.; Lu, X. AID: A benchmark data set for performance evaluation of aerial scene classification. IEEE Trans. Geosci. Remote Sens. 2017, 55, 3965–3981. [Google Scholar] [CrossRef] [Green Version]
  54. Cheng, G.; Han, J.; Lu, X. Remote sensing image scene classification: Benchmark and state of the art. Proc. IEEE 2017, 105, 1865–1883. [Google Scholar] [CrossRef] [Green Version]
  55. Wang, L.; Lu, H.; Wang, Y.; Feng, M.; Wang, D.; Yin, B.; Ruan, X. Learning to detect salient objects with image-level supervision. In Proceedings of the IEEE Conference on Computer Vision and Pattern Recognition, Honolulu, HI, USA, 21–26 July 2017; IEEE: Piscataway, NJ, USA, 2017; pp. 136–145. [Google Scholar]
  56. Yang, C.; Zhang, L.; Lu, H.; Ruan, X.; Yang, M.H. Saliency detection via graph-based manifold ranking. In Proceedings of the IEEE Conference on Computer Vision and Pattern Recognition, Portland, OR, USA, 23–28 June 2013; IEEE: Piscataway, NJ, USA, 2013; pp. 3166–3173. [Google Scholar]
  57. Chen, Z.; Xu, Q.; Cong, R.; Huang, Q. Global Context-Aware Progressive Aggregation Network for Salient Object Detection. In Proceedings of the AAAI Conference on Artificial Intelligence, New York, NY, USA, 7–12 February 2020; AAAI Press: Menlo Park, CA, USA, 2020; pp. 10599–10606. [Google Scholar]
  58. Liu, J.J.; Hou, Q.; Cheng, M.M.; Feng, J.; Jiang, J. A simple pooling-based design for real-time salient object detection. In Proceedings of the IEEE Conference on Computer Vision and Pattern Recognition, Long Beach, CA, USA, 15–20 June 2019; IEEE: Piscataway, NJ, USA, 2019; pp. 3917–3926. [Google Scholar]
  59. Zhao, X.; Pang, Y.; Zhang, L.; Lu, H.; Zhang, L. Suppress and balance: A simple gated network for salient object detection. In Proceedings of the European Conference on Computer Vision, Glasgow, UK, 23–28 August 2020; Springer International Publishing: Cham, Switzerland, 2020; pp. 35–51. [Google Scholar]
  60. Margolin, R.; Zelnik-Manor, L.; Tal, A. How to evaluate foreground maps? In Proceedings of the IEEE Conference on Computer Vision and Pattern Recognition, Columbus, OH, USA, 23–28 June 2014; IEEE: Piscataway, NJ, USA, 2014; pp. 248–255. [Google Scholar]
  61. Fan, D.P.; Gong, C.; Cao, Y.; Ren, B.; Cheng, M.M.; Borji, A. Enhanced-alignment measure for binary foreground map evaluation. In Proceedings of the 27th International Joint Conference on Artificial Intelligence, Stockholm, Sweden, 13–19 July 2018; AAAI Press: Menlo Park, CA, USA, 2018; pp. 698–704. [Google Scholar]
  62. Fan, D.P.; Cheng, M.M.; Liu, Y.; Li, T.; Borji, A. Structure-measure: A new way to evaluate foreground maps. In Proceedings of the IEEE/CVF International Conference on Computer Vision, Venice, Italy, 22–29 October 2017; IEEE: Piscataway, NJ, USA, 2017; pp. 4548–4557. [Google Scholar]
  63. Zhang, L.; Dai, J.; Lu, H.; He, Y.; Wang, G. A bi-directional message passing model for salient object detection. In Proceedings of the IEEE Conference on Computer Vision and Pattern Recognition, Salt Lake City, UT, USA, 18–22 June 2018; IEEE: Piscataway, NJ, USA, 2018; pp. 1741–1750. [Google Scholar]
  64. Liu, N.; Han, J.; Yang, M.H. Picanet: Learning pixel-wise contextual attention for saliency detection. In Proceedings of the IEEE Conference on Computer Vision and Pattern Recognition, Salt Lake City, UT, USA, 18–22 June 2018; IEEE: Piscataway, NJ, USA, 2018; pp. 3089–3098. [Google Scholar]
  65. Feng, M.; Lu, H.; Ding, E. Attentive feedback network for boundary-aware salient object detection. In Proceedings of the IEEE/CVF Conference on Computer Vision and Pattern Recognition, Long Beach, CA, USA, 15–20 June 2019; IEEE: Piscataway, NJ, USA, 2019; pp. 1623–1632. [Google Scholar]
  66. Qin, X.; Zhang, Z.; Huang, C.; Gao, C.; Dehghan, M.; Jagersand, M. Basnet: Boundary-aware salient object detection. In Proceedings of the IEEE/CVF Conference on Computer Vision and Pattern Recognition, Long Beach, CA, USA, 15–20 June 2019; IEEE: Piscataway, NJ, USA, 2019; pp. 7479–7489. [Google Scholar]
  67. Zhou, T.; Fan, D.P.; Cheng, M.M.; Shen, J.; Shao, L. RGB-D salient object detection: A survey. Comput. Vis. Media 2021, 7, 37–69. [Google Scholar] [CrossRef] [PubMed]
Figure 1. Visual examples of our model and DAFNet [20], LVNet [18], MINet [19], DSS [21] and EGNet DSS [22]. GT refers to the ground-truth map.
Remotesensing 13 02163 g001
Figure 2. The pipeline of the proposed SARNet. Our model takes the RGB image (352 × 352 × 3) as input and uses the public backbone networks to extract multi-level features. These features are guided and integrated by SGD and PAF modules to gradually generate predictions supervised by GT.
Remotesensing 13 02163 g002
Figure 3. Illustration of semantic guided decoder (SGD).
Remotesensing 13 02163 g003
Figure 4. Visualization comparison between the output features of the last layer of the backbone network B L L o and the output of the SGD module S G D o .
Remotesensing 13 02163 g004
Figure 5. Illustration of parallel attention fusion (PAF) Module.
Remotesensing 13 02163 g005
Figure 6. Feature visualization comparison of top-down PAF modules output P A F o i (i means a particular step) with multi-step feedback strategy.
Remotesensing 13 02163 g006
Figure 7. Comparison of PR curves and F-measure curves of 15 SOTA methods over two optical RSI datasets. Best viewed on screen.
Remotesensing 13 02163 g007
Figure 8. Visual comparison between our results and SOTA methods in various challenging RSI scenes, including scenes with small (a) and big (b) objects, scenes with low contrast (c), and cluttered backgrounds (d), better for zooming in. Our SARNet under the ResNet50 backbone and deep learning based methods are trained or retrained on the EORSSD dataset.
Remotesensing 13 02163 g008
Figure 9. Visual comparison with some SOTAs on NSI datasets.
Remotesensing 13 02163 g009
Figure 10. Some failure cases in RSI.
Remotesensing 13 02163 g010
Table 1. Comparison with the SOTAs. The top three of our one and the other methods are highlighted in red, blue, and green. ↑ and ↓ denote larger and smaller scores are better, respectively. † and ‡ denote CNN-based and RSI-based SOD methods, respectively.
ModelsORSSD [18]EORSSD [20]
SξmEϕmFβwFβ M SξmEϕmFβwFβ M
HDCT [28]0.6200.6500.4240.3720.1310.5970.6390.4030.2660.109
DSG [32]0.7190.7340.5750.5660.1040.6430.6610.4620.4020.125
SMD [31]0.7640.7750.6210.5570.0720.7110.7310.5500.4090.077
R3Net  [36]0.8140.8680.7380.7380.0400.8190.8310.6320.4180.017
DSS  [21]0.8260.8360.6960.6210.0360.7870.7640.5820.4610.019
PFA  [24]0.8610.8550.7310.6720.0240.8360.8660.6790.5490.016
EGNet  [22]0.8720.9010.7500.6450.0220.8600.8770.6970.5380.011
MINet  [19]0.8490.8940.7790.7090.0280.8580.9150.7720.6940.013
GateNet  [59]0.8930.9270.8270.7630.0150.8800.9040.7700.6430.011
F3Net  [50]0.9080.9470.8270.7630.0150.9070.9440.8100.7690.010
SMFF  [16]0.5310.5680.2680.2500.1850.5400.5210.3010.2090.143
CMC  [3]0.6030.6420.3450.3110.1270.5800.5900.2700.2010.106
LVNet †‡ [18]0.8820.9260.8000.7510.0210.8640.8830.7360.6310.015
DAFNet †‡ [20]0.9190.9540.8440.7560.0110.9180.9380.7980.6520.005
SARNet-VGG160.9130.9480.8620.8510.0190.9240.9550.8540.8300.010
SARNet-ResNet500.9210.9520.8670.8530.0140.9260.9550.8490.8320.008
SARNet-Res2Net500.9350.9660.8870.8720.0100.9290.9610.8570.8240.008
Table 2. The extended experimental results on three NSI datasets for saliency detection. The best three results are highlighted in red, blue and green. ↑ and ↓ denote larger and smaller is better, respectively.
ModelsDUT-OMRON [56]DUTS-TE [55]HKU-IS [34]
SξmEϕwFβ M SξmEϕwFβ M SξmEϕwFβ M
2018BMPM [63]0.8090.8370.6810.0640.8620.8600.7610.0490.9070.9370.8590.039
PiCA [64]0.8320.8410.6950.0650.8690.8620.7540.0430.9040.9360.8400.042
RAS [44]0.8140.8460.6950.0620.8390.8610.7400.0590.8870.9290.8430.045
2019PAGE [45]0.8240.8530.7220.0620.8540.8690.7690.0520.9030.9400.8660.037
AFNet [65]0.8260.8530.7170.0570.8670.8790.7850.0460.9050.9420.8690.036
BASNet [66]0.8360.8690.7510.0560.8660.8840.8030.0480.9090.9460.8890.032
2020F3Net [50]0.8380.8700.7470.0530.8880.9020.8350.0350.9170.9530.9000.028
GateNet [59]0.8380.8620.7290.0550.8850.8890.8090.0400.9150.9490.8800.033
MINet [19]0.8330.8650.7380.0550.8840.8980.8250.0370.9190.9530.8970.029
SARNet0.8430.8730.7730.0580.8900.9040.8270.0370.9200.9560.9140.028
Table 3. Ablation study of different aggregation strategies on the ORSSD and EORSSD datasets.
SettingsORSSD [18]EORSSD [20]
SξmEϕmFβwFβ M SξmEϕmFβwFβ M
L F 3 0.8750.8310.7420.6820.0320.8430.8250.7320.6880.031
H F 3 0.8890.8620.7780.6910.0220.8810.8460.7550.6810.026
S G D 1 0.9040.9180.8330.7920.0190.8940.9010.8120.7730.023
S G D 2 0.9180.9310.8660.8490.0140.9020.9280.8380.7920.017
P A F g 0.9240.9380.8730.8640.0120.9200.9460.8450.8160.011
P A F h 0.9170.9270.8680.8530.0140.9160.9370.8410.8100.013
SARNet0.9350.9660.8870.8720.0100.9290.9610.8570.8240.008
Table 4. Ablation study with different components combinations on the ORSSD and EORSSD datasets.
SettingsORSSD [18]EORSSD [20]
BMSGDPAF S ξ mE ϕ mF β wF β M S ξ mE ϕ mF β wF β M
0.8070.8550.7270.7420.0470.7960.8320.7110.7240.045
0.8680.8960.8120.8000.0280.8570.8940.8110.7930.024
0.8760.9230.8340.8150.0180.8670.9270.8350.8070.017
0.9350.9660.8870.8720.0100.9290.9610.8570.8240.008
Table 5. Model complexity comparison of some CNN-based methods.
ComplexityDSSEGNetPiCAAFNetBASNetF3NetGateNetMINetSARNet
[21][22][64][65][66][50][59][19]Ours
#Param(M)621083337872610027040
Memory(M)32091177154111231103652205823551126
FLOPs(G)115271373612715849338
Publisher’s Note: MDPI stays neutral with regard to jurisdictional claims in published maps and institutional affiliations.

