Article

Evaluation of FORMOSAT-2 and PlanetScope Imagery for Aboveground Oil Palm Biomass Estimation in a Mature Plantation in the Congo Basin

Centre d’applications et de Recherches en Télédétection (CARTEL), Département de Géomatique Appliquée, Université de Sherbrooke, Sherbrooke, QC J1K 2R1, Canada
*
Author to whom correspondence should be addressed.
Remote Sens. 2020, 12(18), 2926; https://doi.org/10.3390/rs12182926
Submission received: 23 August 2020 / Revised: 4 September 2020 / Accepted: 7 September 2020 / Published: 9 September 2020
(This article belongs to the Special Issue Forest Biomass and Carbon Observation with Remote Sensing)

Abstract

:
The present study developed methods using remote sensing for estimation of total dry aboveground biomass (AGB) of oil palm in the Congo Basin. To achieve this, stem diameters at breast height (DBH, 1.3 m) and stem heights were measured in an oil palm plantation located in Gabon (Congo Basin, Central Africa). These measurements were used to determine AGB in situ. The remote sensing approach that was used to estimate AGB was textural ordination (FOTO) based upon Fourier transforms that were applied, respectively, to PlanetScope and FORMOSAT-2 satellite images taken from the area. The FOTO method is based on the combined use of two-dimensional (2D) Fast Fourier Transform (FFT) and Principal Component Analysis (PCA). In the context of the present study, it was used to characterize the variation in canopy structure and to estimate the aboveground biomass of mature oil palms. Two types of equations linking FOTO indices to in situ biomass were developed: multiple linear regressions (MLR); and multivariate adaptive spline regressions (MARS). All best models developed yielded significant results, regardless of whether they were derived from PlanetScope or from FORMOSAT-2 images. Coefficients of determination (R2) varied between 0.80 and 0.92 (p ≤ 0.0005); and relative root mean-square-errors (%RMSE) were less than 10.12% in all cases. The best model was obtained using MARS approach with FOTO indices from FORMOSAT-2 (%RMSE = 6.09%).

Graphical Abstract

1. Introduction

The amassing information on the total dry aboveground biomass (AGB) of plants is essential for understanding and monitoring their contributions to the global carbon cycle, together with their responses to climate change [1,2]. On small parcels of land, AGB can be estimated without too much difficulty from the complete biomass harvest of field sample plots and, subsequently, extrapolated to the unit area [3]. Another more common approach develops functional allometric relationships between field measurements of aboveground tree dry masses and structural parameters, such as DBH (diameter at breast height), stem height, basal area, wood density or crown area [3,4,5]. Over large areas, the financial constraints that are imposed by high costs of data collection, together with the large quantities of data that must necessarily be collected, have always limited the estimation of AGB.
Several studies have demonstrated the potential for using remote sensing as a complementary alternative for overcoming these limitations [5,6,7]. Predictive relationships can be established between structural variables and remotely sensed data [1,3,6,8,9]. These relationships are generally empirical, often have local or regional scopes, and are frequently difficult to transfer in space and time. In the tropics, optical and radar images are often affected by saturation due to high biomass values [3,6,10,11,12]. LiDAR (Light Detection And Ranging) permits characterization of different biomass levels in tropical forests, but data acquisition remains expensive, thereby limiting their use over large areas [3,6,12,13].
Studies focusing upon the estimation of oil palm biomass are relatively limited. Most approaches that are used in this context are based upon analyses of radiometric intensity or vegetation indices from medium- or high-spatial resolution optical images [4,10,11]. Some research works have recommended contextual analysis to exploit textural and structural elements within images for estimating aboveground forest biomass [6,14,15,16,17]. This recommendation was motivated by the complex nature of canopy structures, and the saturation observed in the high biomass values estimated with non-textural remote sensing approaches [14].
Satellite images provide useful information describing the texture of vegetation in various landscapes (forests, oil palms, etc.). This information also contributes to the estimation of AGB. Several authors recommend the use of FOTO (Fourier transform based on textural ordination) to exploit the information provided by the images [6,8,14,15]. FOTO is a spectral approach, which could be used to characterize the structure of the canopy in terms of coarse/fine texture, and open/ closed canopy. Two techniques are used to implement the FOTO approach, i.e., the two-dimensional fast Fourier transform (FFT 2D) and principal component analysis (PCA). FFT 2D converts spatial information into the frequency domain, and PCA performs the ordination of the r-spectrum values of FFT 2D [6,8,14]. These values could be used to classify the texture of the canopy and characterize landscapes (mature, young, degraded vegetation, etc.). These same values are also considered as FOTO indices that can predict the AGB. The FOTO method is based on the hypothesis that frequency signatures are strongly correlated with the grain size of the canopy [8,14].
The repetitive canopy structure of vegetation has been regularly analyzed with the FOTO approach, by converting the intensity signal into different spatial frequencies. This conversion is carried out using very high spatial resolution images [8,17]. The FOTO method has often been applied with aerial photographs and satellite images from different platforms, including Google Earth, SPOT 5, or Ikonos [6,8,14,16]. Several studies have shown its efficiency in analyzing the canopy texture, and predicting AGB [6,14,16,17,18,19]. The FOTO method is not affected by the saturation of the estimated aboveground biomass values, and is also able to estimate various stand variables, such as basal area, tree density, diameter, or height [6]. For example, the FOTO approach has been exploited to estimate the biomass of mangroves in French Guiana [6]. Singh et al. [14] also established AGB models of mixed landscapes (forest and oil palms of varying ages of 5–8 years) in Malaysia using FOTO indices. The approach was also used to map relief and landscape spatial entities of a border area between French Guiana and Brazil [20]. The forest containing the arctic tree line in Russia has also been classified using the FOTO method [19]. In these different studies, the FOTO indices show interesting correlations with various characteristics of vegetation, including AGB.
Prediction models that have been generally used are multiple linear regressions (MLR), which link vegetation structural parameters to FOTO indices that are derived from satellite images [6,8,14,18,21]. The major disadvantage of MLR methods is that they do not account for non-linearities, which are frequent when ecological variables are considered [7,22,23]. Several studies that are based upon MLRs have reported significant results in estimating AGB of forests [6,16,24] and oil palm plantations [14].
Approaches beyond MLRs are being used increasingly to estimate AGB. These include, for example, machine learning methods or multivariate techniques that are capable of dealing with non-linearities in the relationships between variables [23,25,26]. For example, Multivariate Adaptive Regression Splines (MARS) offers some promise. MARS is a non-parametric, recursive modelling algorithm that was introduced by [27]. Yet, its use has not been widely explored in the field of remote sensing, particularly in regard to estimating AGB [23]. MARS models the interactions and non-linearity of the data by establishing non-linear regression models, based upon a product of functions that are referred to as “smoothed basis functions” [23,28,29]. MARS has been successfully used in other fields, including ecology [30], medicine [31], pedology [32], hydrology [33] and biomass energy [34].
Despite the diversity of remote sensing data available, the FOTO approach has not been used extensively. In particular, it has not been evaluated in combination with MARS or MLR approaches using various images, such as FORMOSAT-2 and PlanetScope, to describe canopy texture and estimate AGB. Studies on oil palms are rather limited or inexistent. The relationships between FOTO indices and structural parameters of oil palms have not been established yet in the tropical zones, except for young oil palms (≤9 years old) AGB [14].
In this paper, we applied the FOTO method on the near infrared bands of FORMOSAT-2 and PlanetScope to describe the textural structure of the canopy and assess AGB of mature oil palms (≥30 years) in the Congo Basin. Several oil palms AGB models were developed with MARS and MLR using the FOTO indices derived from each image in the study area. The models were compared to select those predicting the best results. This study was the first attempt to produce AGB map of mature oil palms in the Congo Basin using the combination of MARS or MLR and FOTO indices.

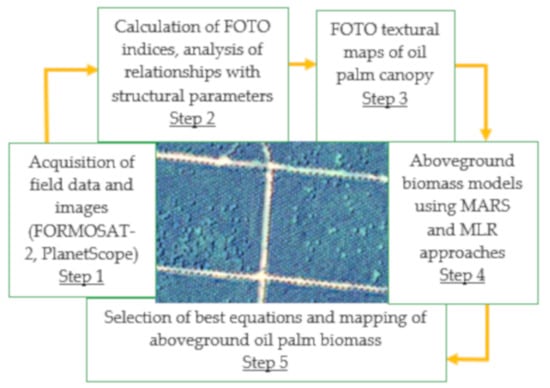
2. Materials and Methods

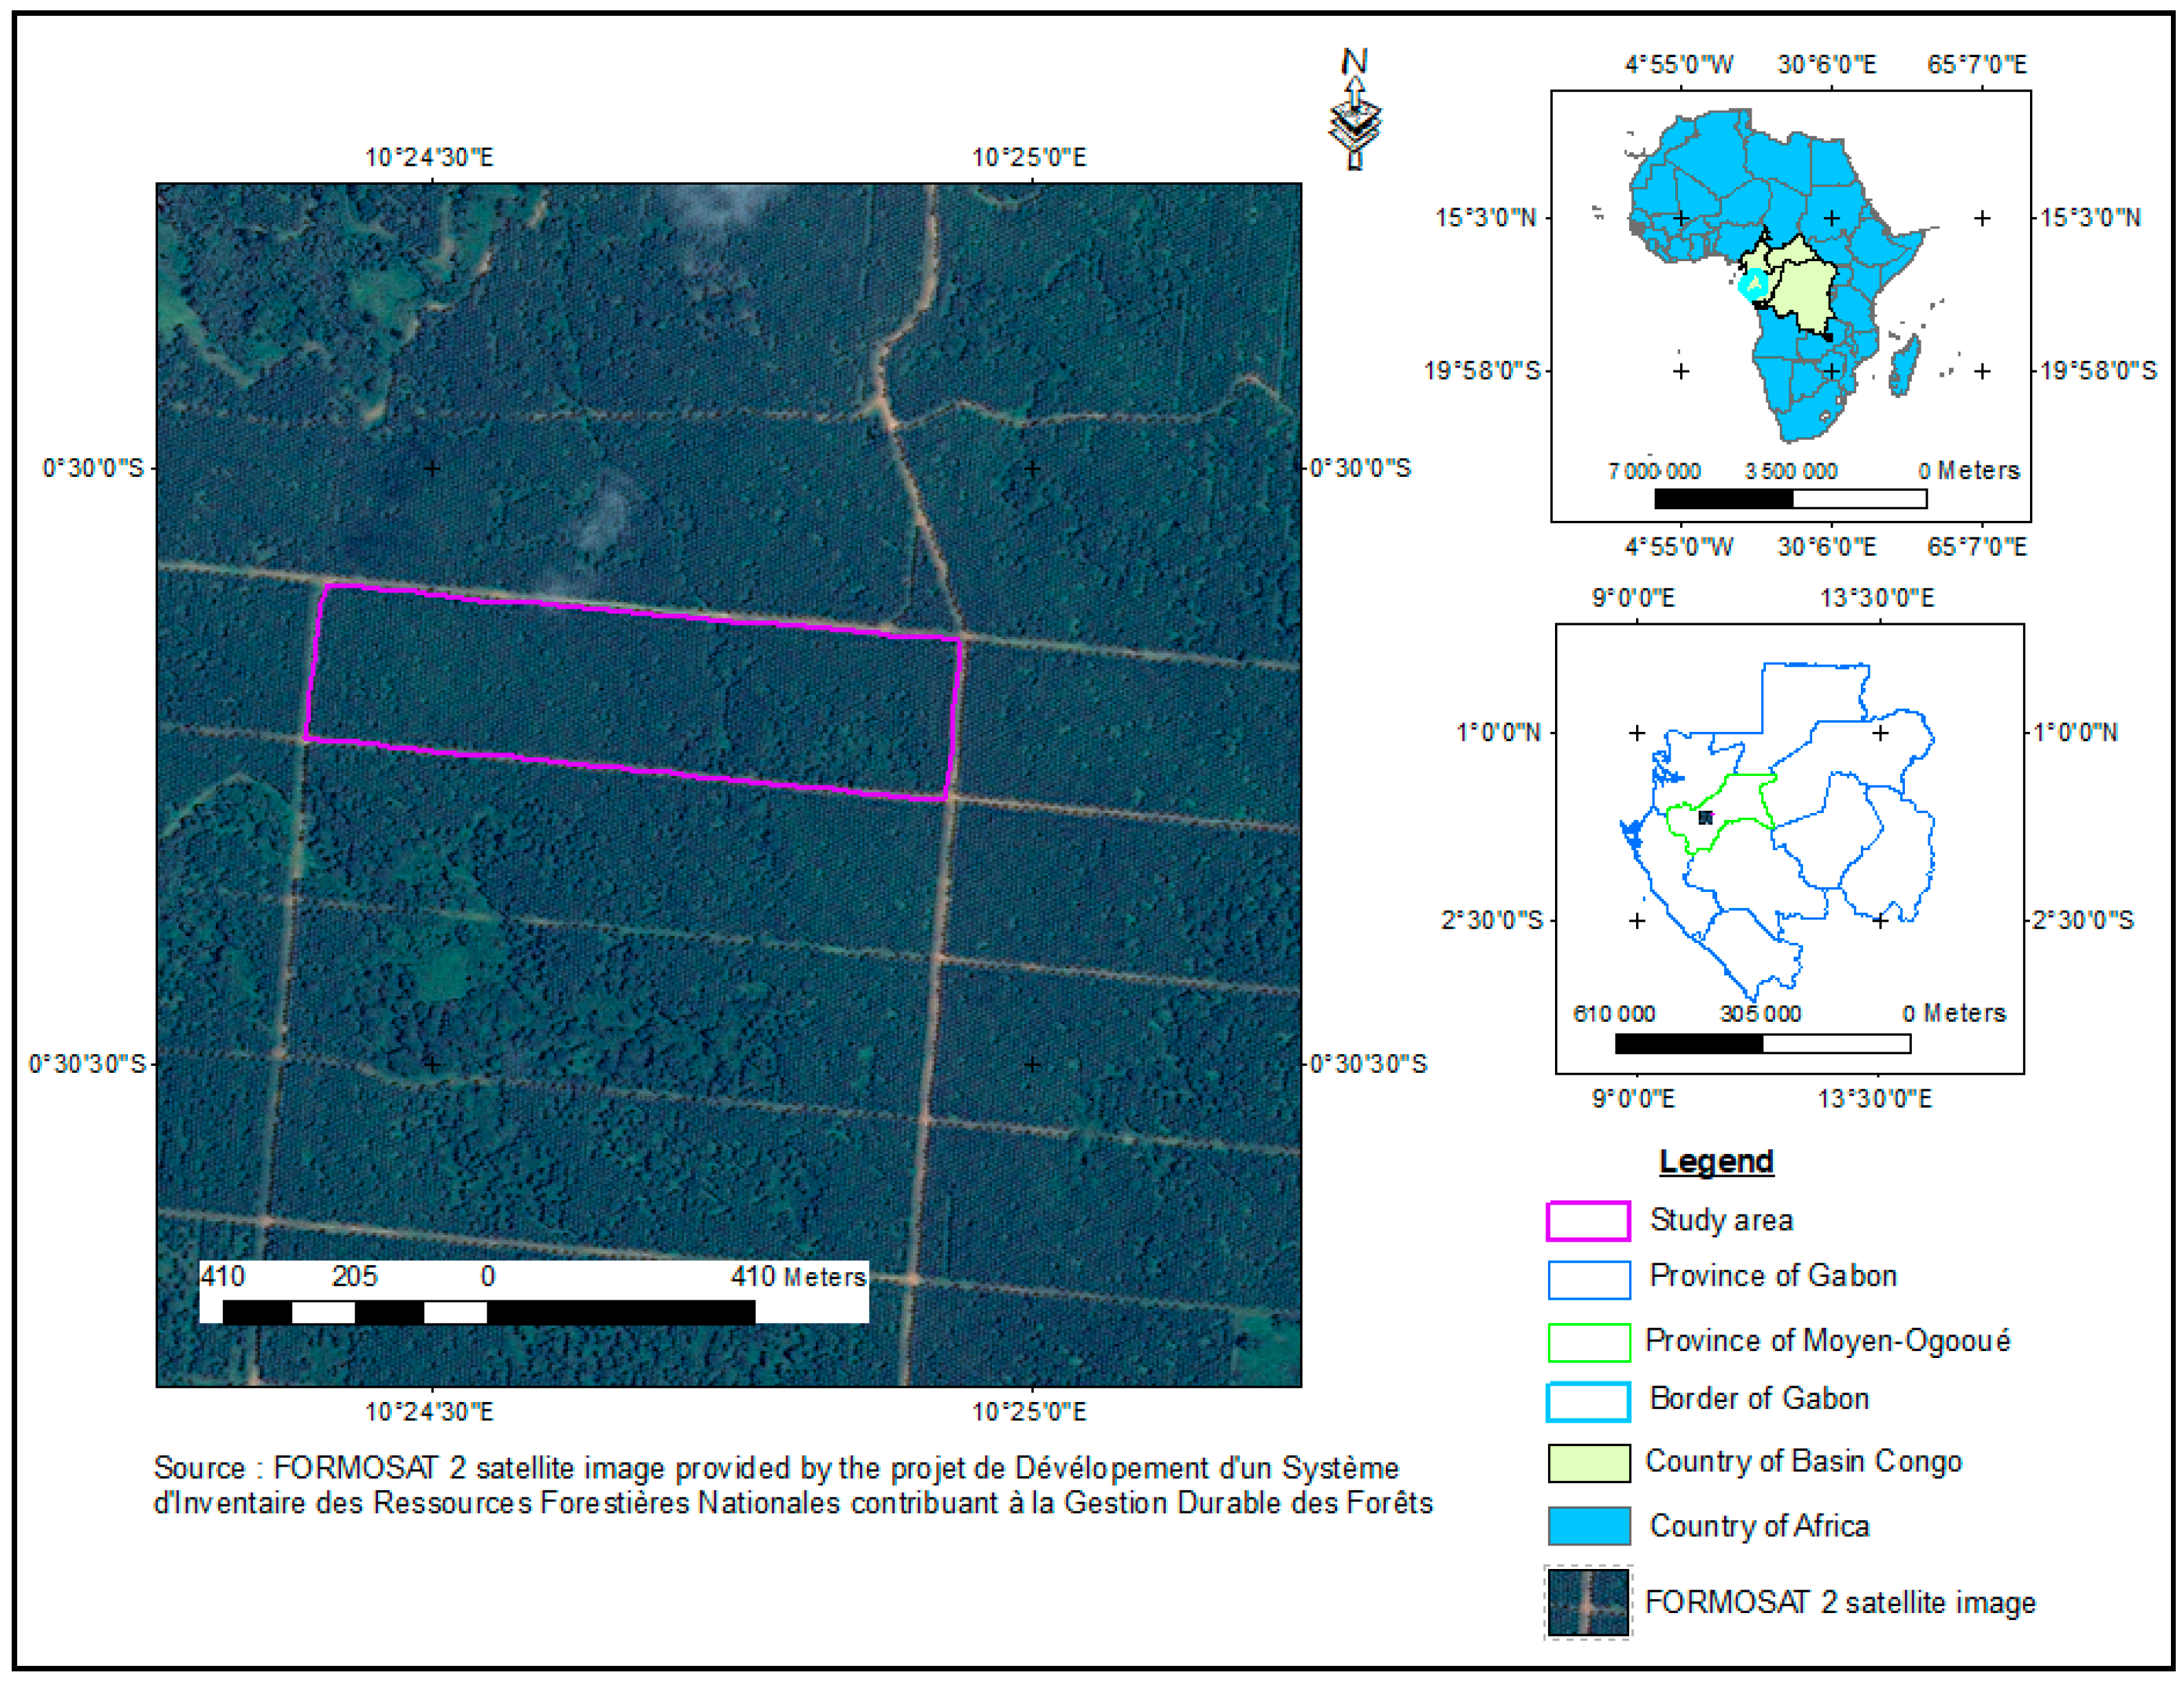
2.1. Description of the Study Area

The study site was located in Makouké, Moyen-Ogooué Province, Gabon. Gabon is a Central African country covered by moist tropical forest typical of the Congo Basin. Its boundaries extend from about 2° N to 4° S (Equatorial Guinea and Cameroon in the north, Republic of the Congo in the south) and from 9° E to 15° E (Atlantic Ocean in the west, Republic of the Congo in the east). The site is an oil palm plantation block that was located between 10°24′27″ E and 10°24′57″ E, and 0°30′6″ S and 0°30′16″ S (Figure 1). The property is owned by Olam Palm Gabon (OPG), which is a company that has several agro-industrial oil palm plantations. This is the oldest plantation in the country, having been in production for 39 years. It covers 5700 ha, with mature oil palms occupying an area of 1500 ha. A watercourse crosses the site (North-South) in its eastern half (Figure 2). Individual trees in the study consisted of mature palms, which are mainly in drier uplands, but some of them are found in the poorly drained shallows along the watercourse. Regional climate is warm-humid equatorial, with temperatures ranging from 27 to 38 °C, and annual rainfall ranging from 1800 to 2000 mm.

2.2. Data

2.2.1. Satellite Data

Satellite images for this study come from PlanetScope (L3Harris Geospatial, Broomfield, CO, USA) and FORMOSAT-2 (Decommissioned, National Space Organization, Taiwan). PlanetScope images were acquired in April 2017 as an Analytic Ortho Tile Product (spatial resolution: 3.125 m × 3.125 m). The data were radiances at the top of the atmosphere and did not undergo further correction during the study. FORMOSAT-2 images are pansharpening products at 2 m × 2 m resolution (i.e., merging of high-resolution panchromatic and lower resolution multispectral images) from February 2011. Geometric corrections were applied to both types of images. Acquisitions were made in four similar spectral bands: 455–515 nm, 500–590 nm, 590–670 nm and 780–860 nm for PlanetScope; and 450–520 nm, 520–600 nm, 630–690 nm and 760–900 nm for FORMOSAT-2.

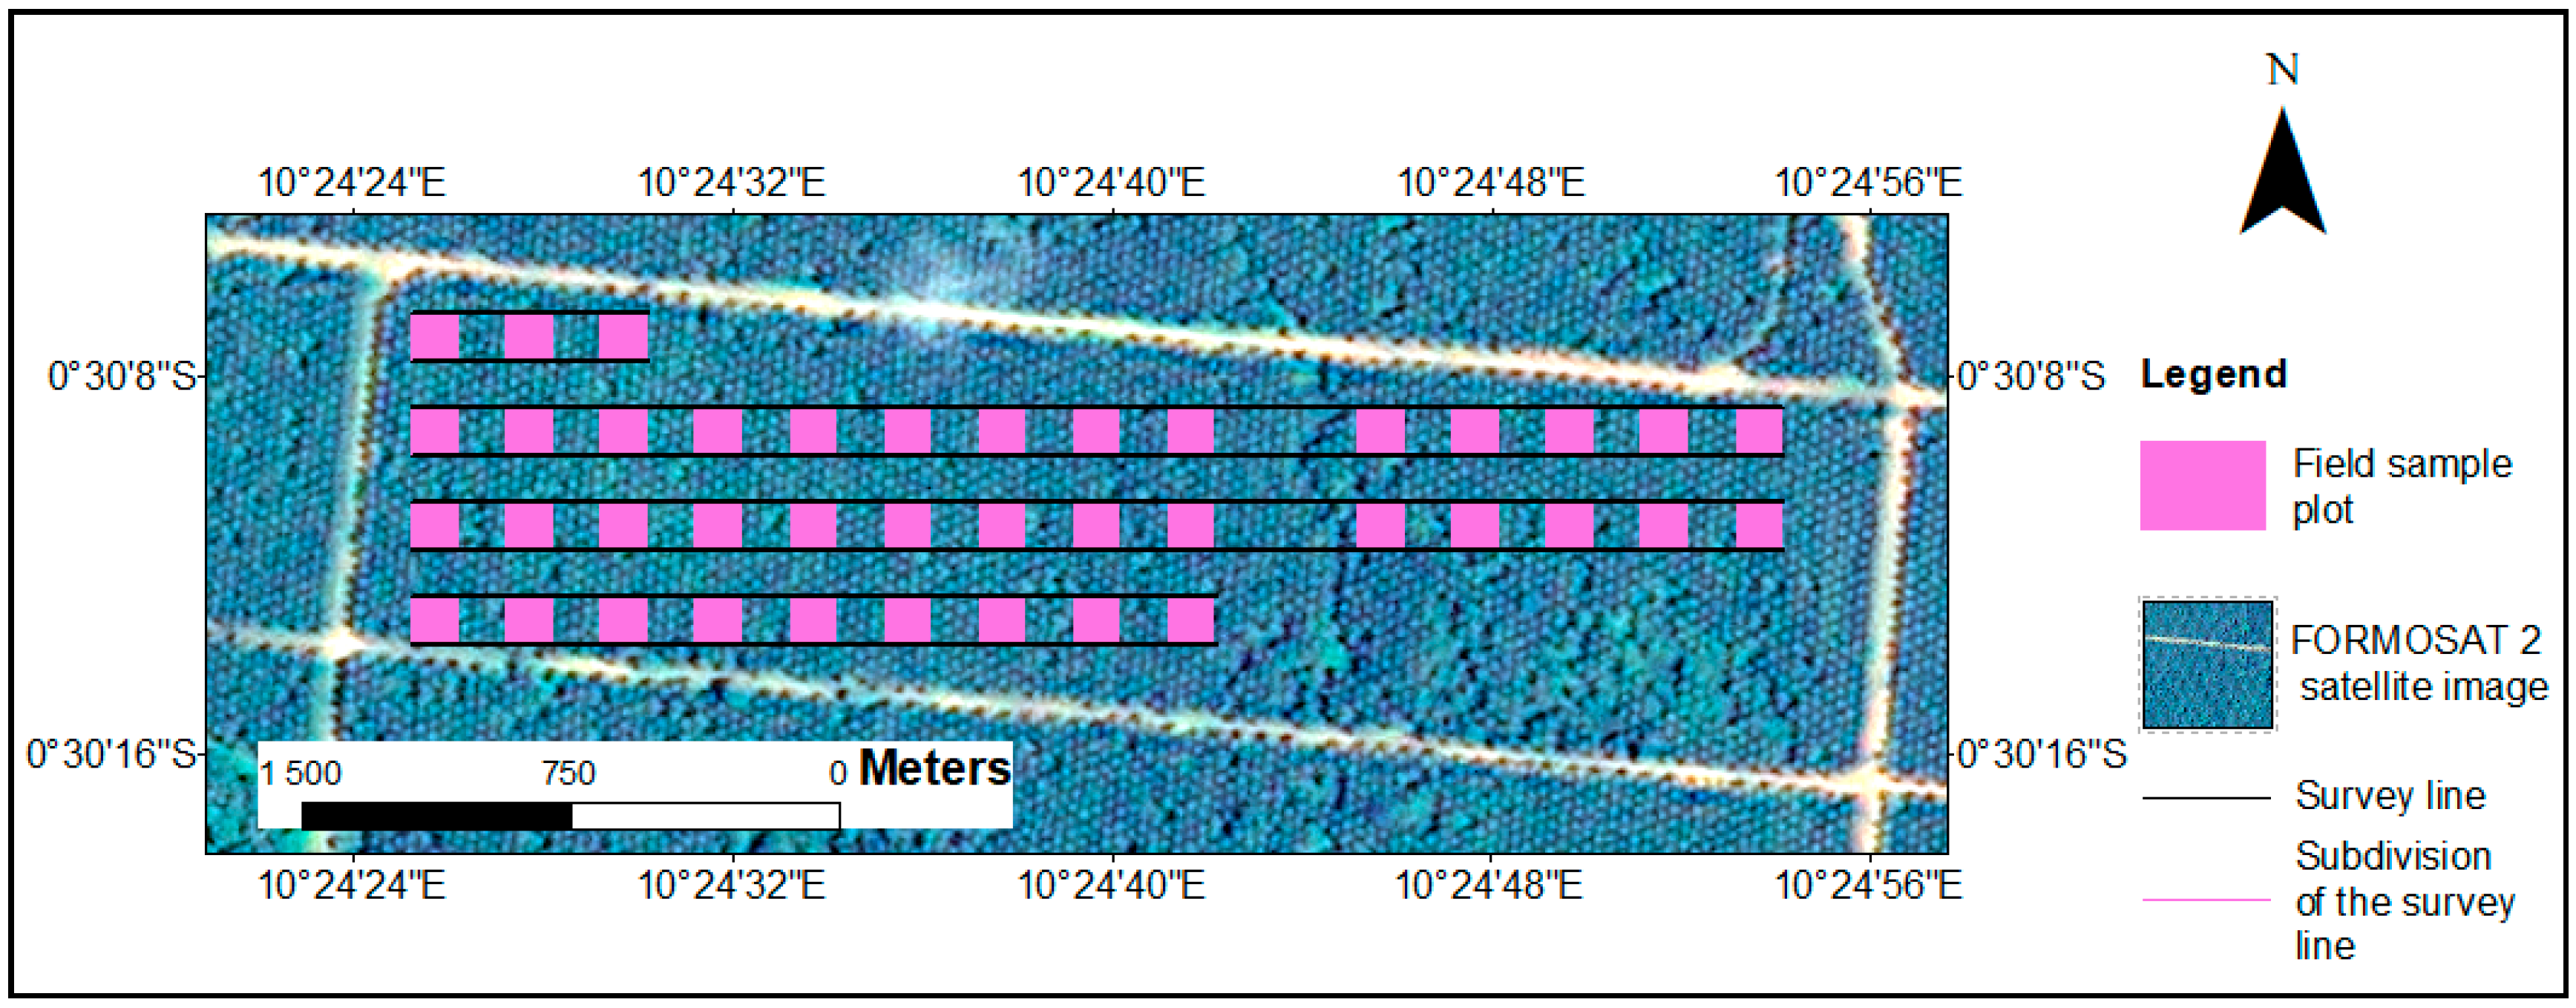
2.2.2. In Situ Measurements

Several field measurements were carried out during the study. Different structural parameters of oil palms that could be used for AGB calculations were measured. Given that the plantation was considered mature, all measurements were made on palm trees that were >30 years old. Instruments that were used in the field included a global positioning system (Garmin GPSMAP 64SC), compass (TOPOCHAIX), DBH tape and a vertex IV associated with a transponder 3. The GPS was used to position the sample plots in the field. The compass helped to materialize the directions of the transects. DBH were measured with a tape. The vertex coupled to the transponder allowed us to measure the stem height at two different positions at a distance of 10 m from the considered oil palm tree. Fieldwork was conducted in October 2017 on 40 sample plots that were established in the plantation, based upon systematic sampling. Plots (0.1 ha) were aligned East-West on four belt transects, each of which was 30.8 m wide and about 900 m long. The total area that was sampled was 25 ha. Natural obstacles, such as watercourses or tall grasses, limited accessibility and constrained sampling that was proposed along all survey lines. Figure 2 shows the sampling scheme for the sample plots.
Stem height (HT) and diameter at breast height (DBH, 1.3 m) were recorded for all oil palms within each plot, as was their total number (NP). The density (D) values were determined from ratios between NP and individual plot areas. Basal area (BA, m2 ha−1) was calculated [35] as the cross-sectional area of each stem measured at 1.3 m above the ground, i.e., (π × DBH2)/4. Mean BA was estimated as the sum of all oil palms that were contained in each sample plot. Mean values for these variables are summarized in Table 1.
Mean in situ AGB (kg) was evaluated in each sample plot using the following ln-transformed allometric equation:
ln ( A G B ) = 2.335 + 0.832 ln ( D B H 2 ( 1 ) × H T )
This equation was derived from a previous study that had been conducted in the same area [36], which proposed different allometric models that were based upon in situ measurements that were collected during destructive sampling. For the rest of the present study, in situ AGB is expressed in tons ha−1 (Table 1).

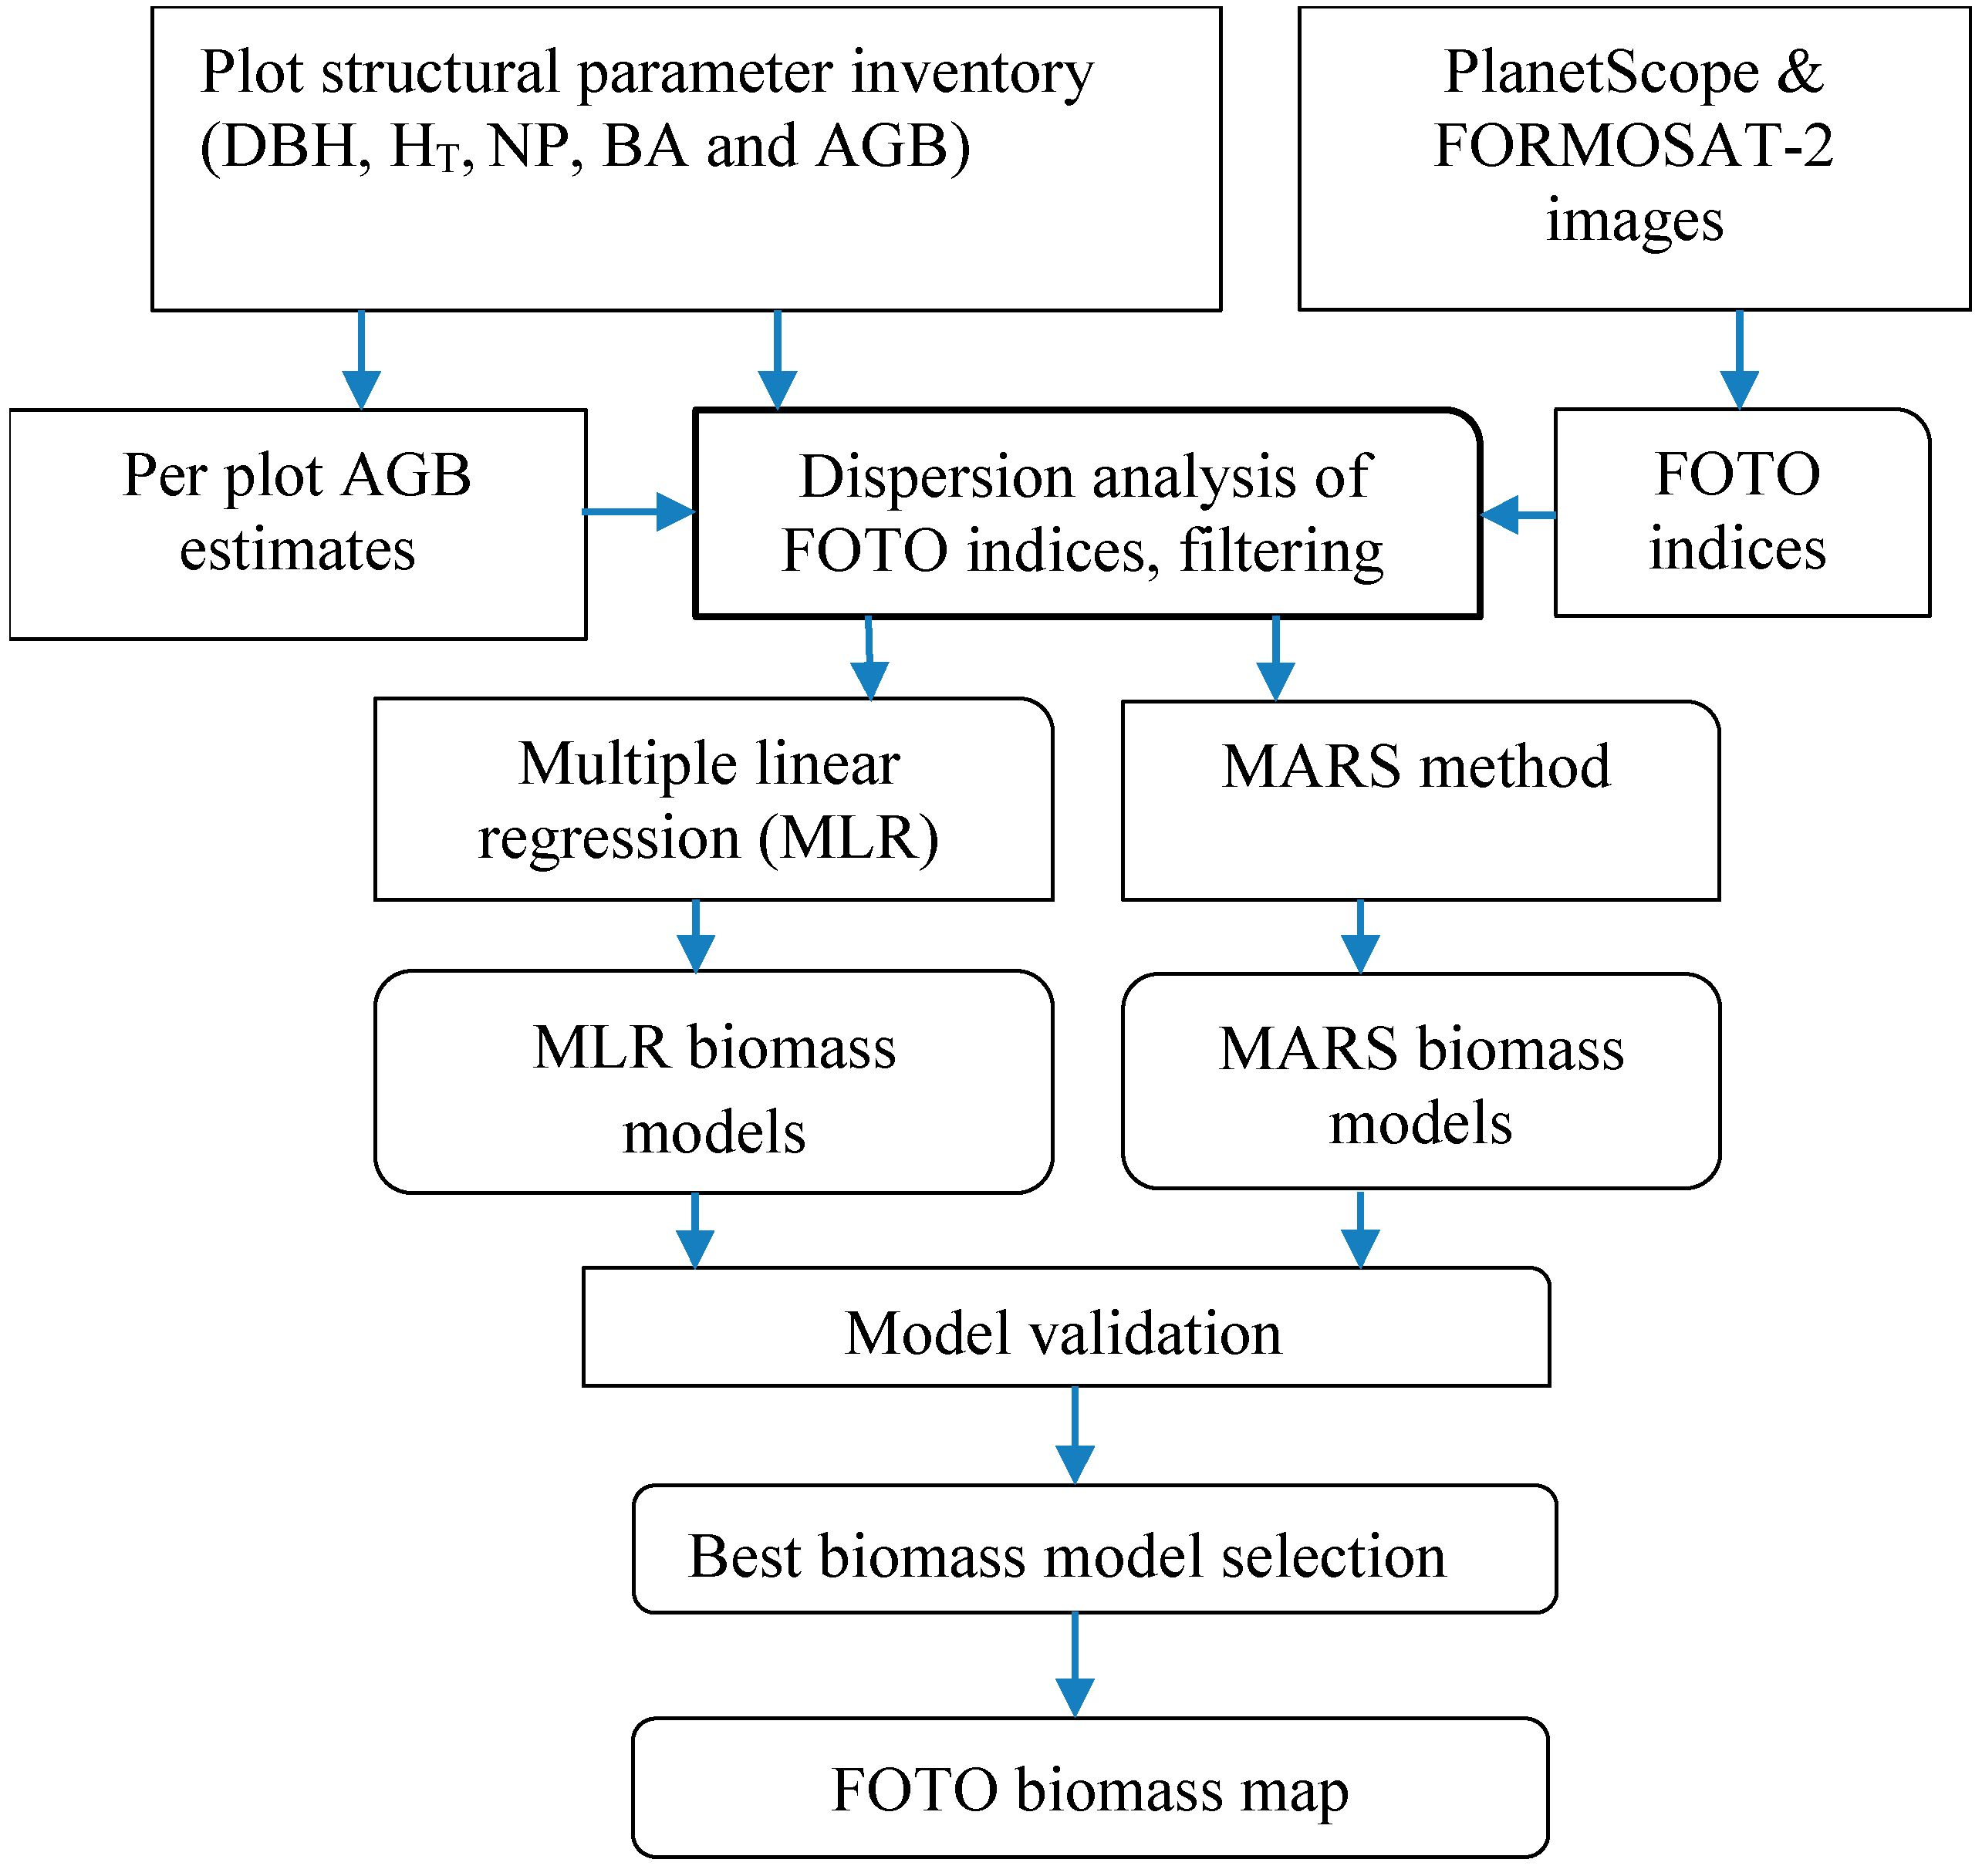
2.3. Use of the FOTO Method and Estimation of Aboveground Biomass

Our methodological approach consisted of four parts: (i) the use of Fourier transformations in textural ordination (FOTO) to generate texture indices from the PlanetScope and FORMOSAT-2 images; (ii) development of MLR-type models for estimating AGB; (iii) development of MARS-type models for estimating AGB; and (iv) validation of the different models. The flowchart in Figure 3 summarizes the research approach.

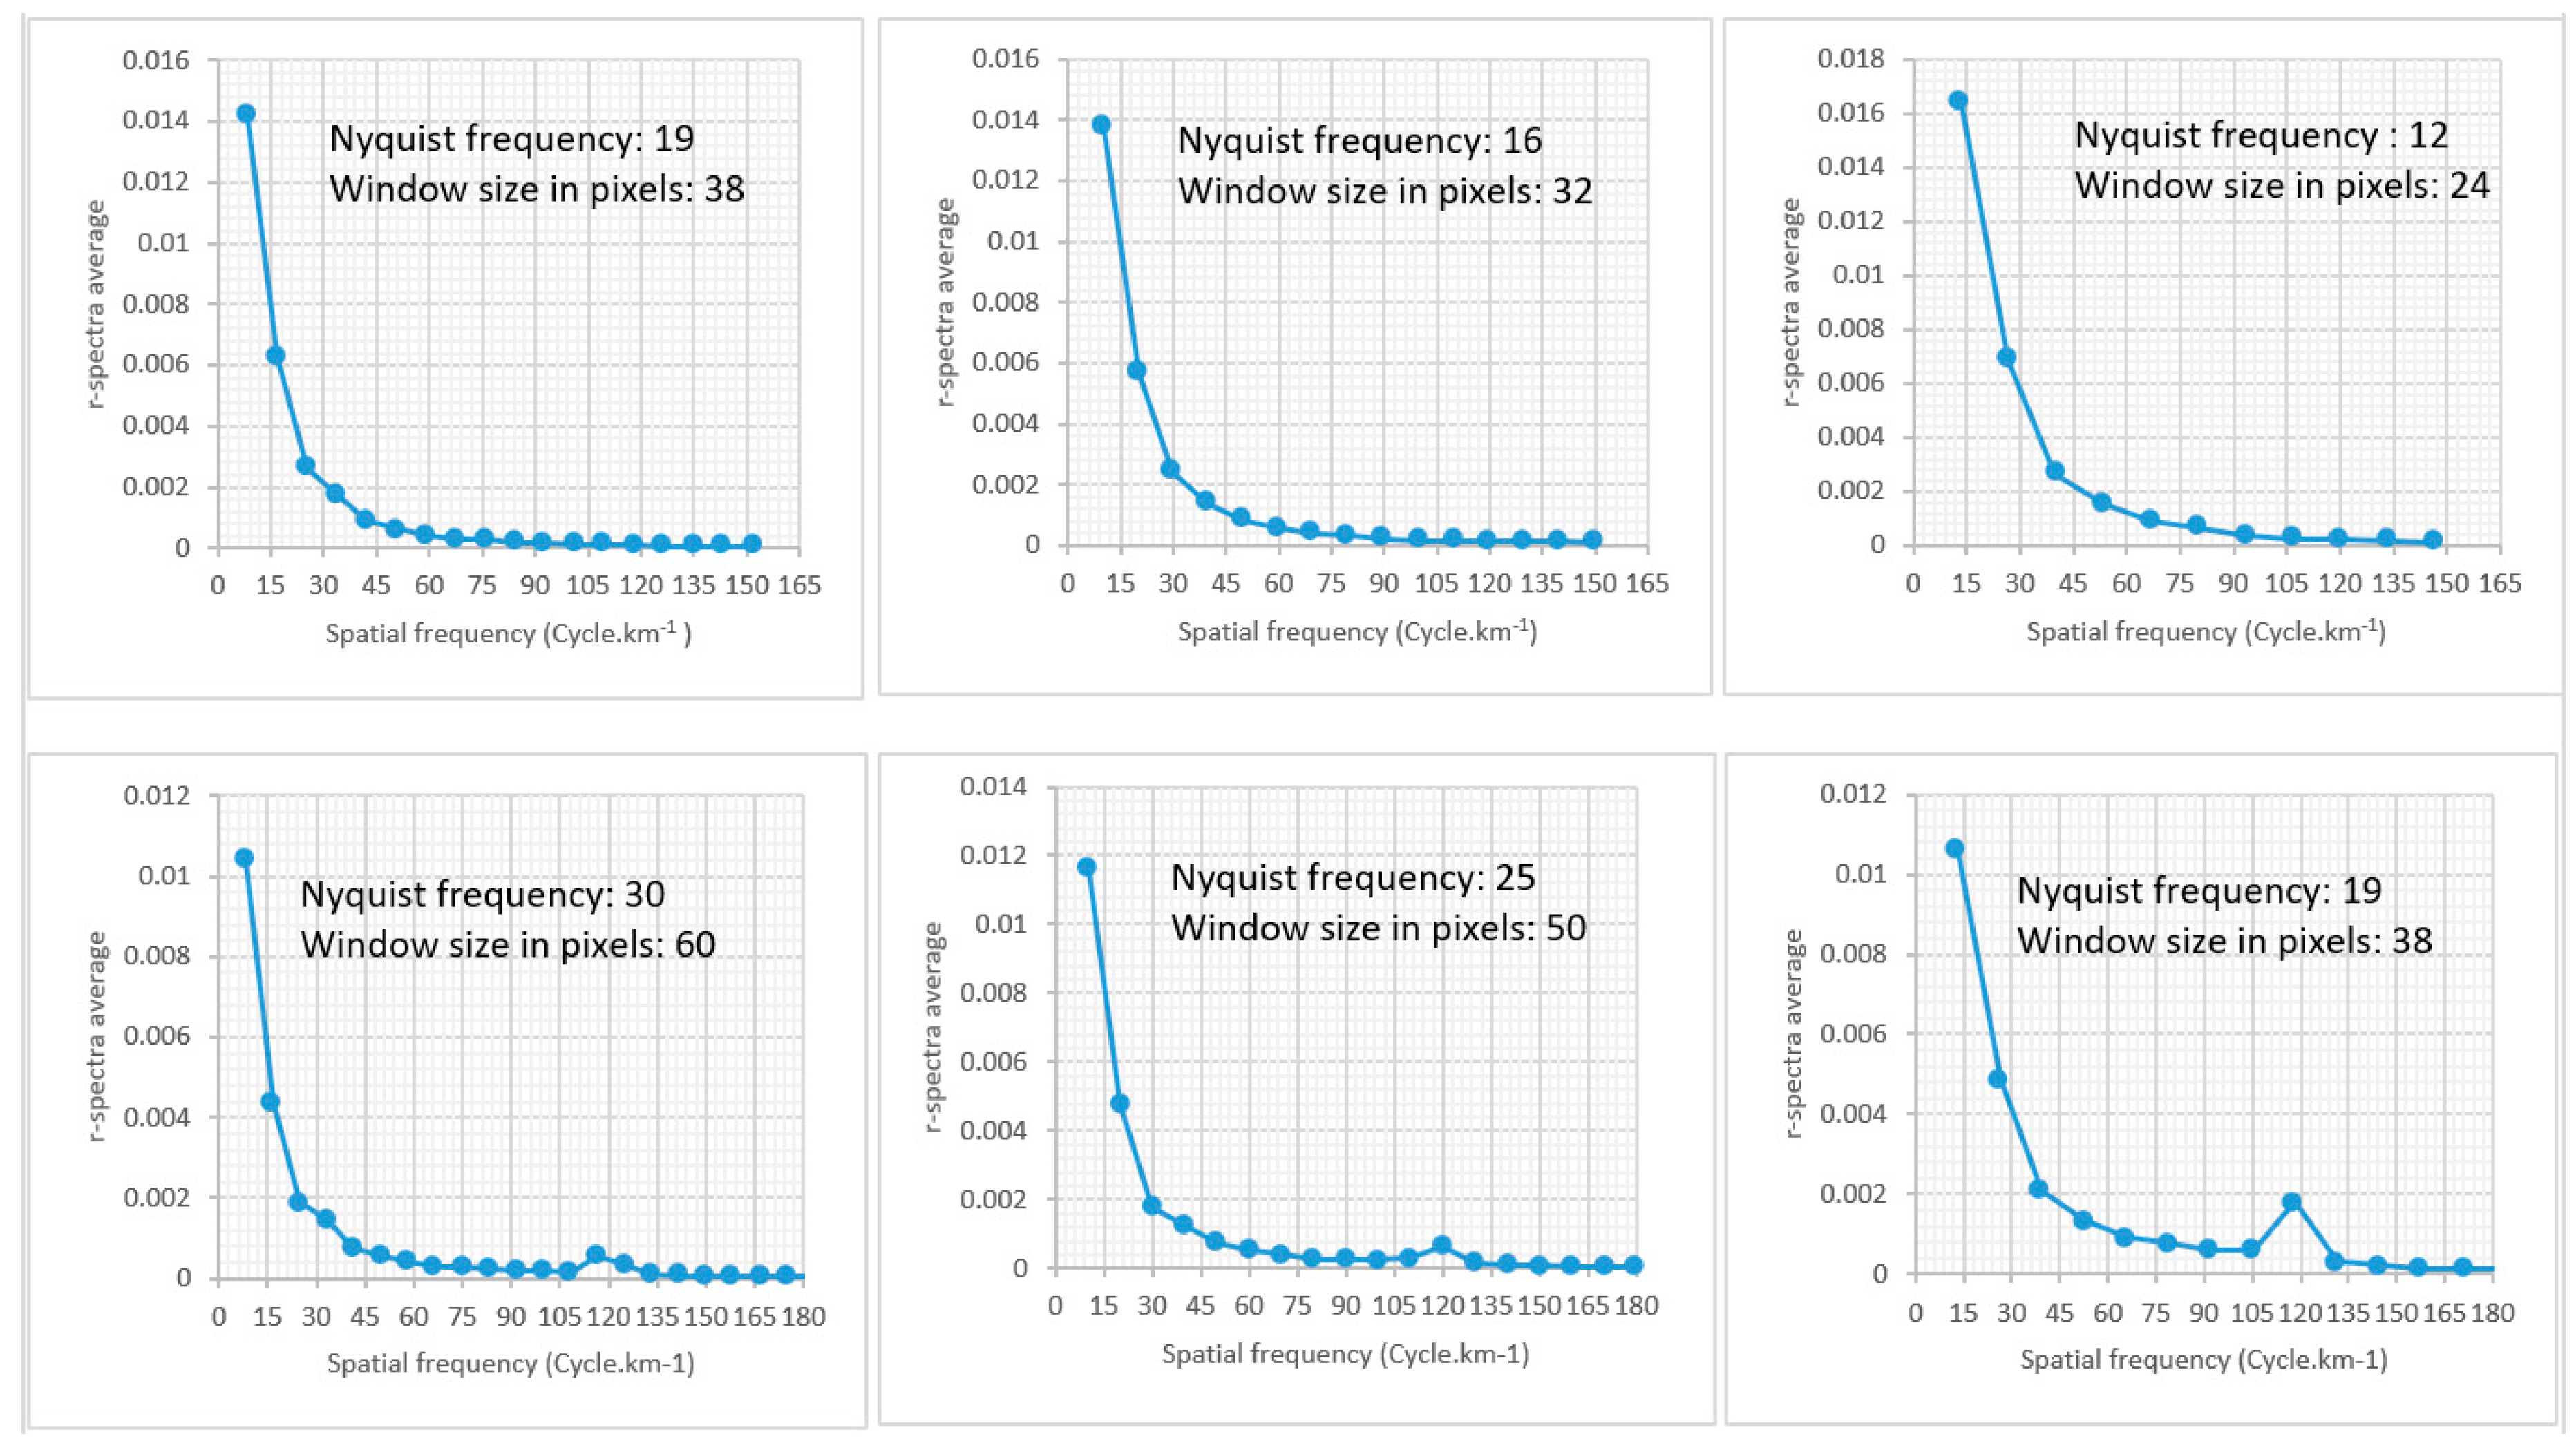
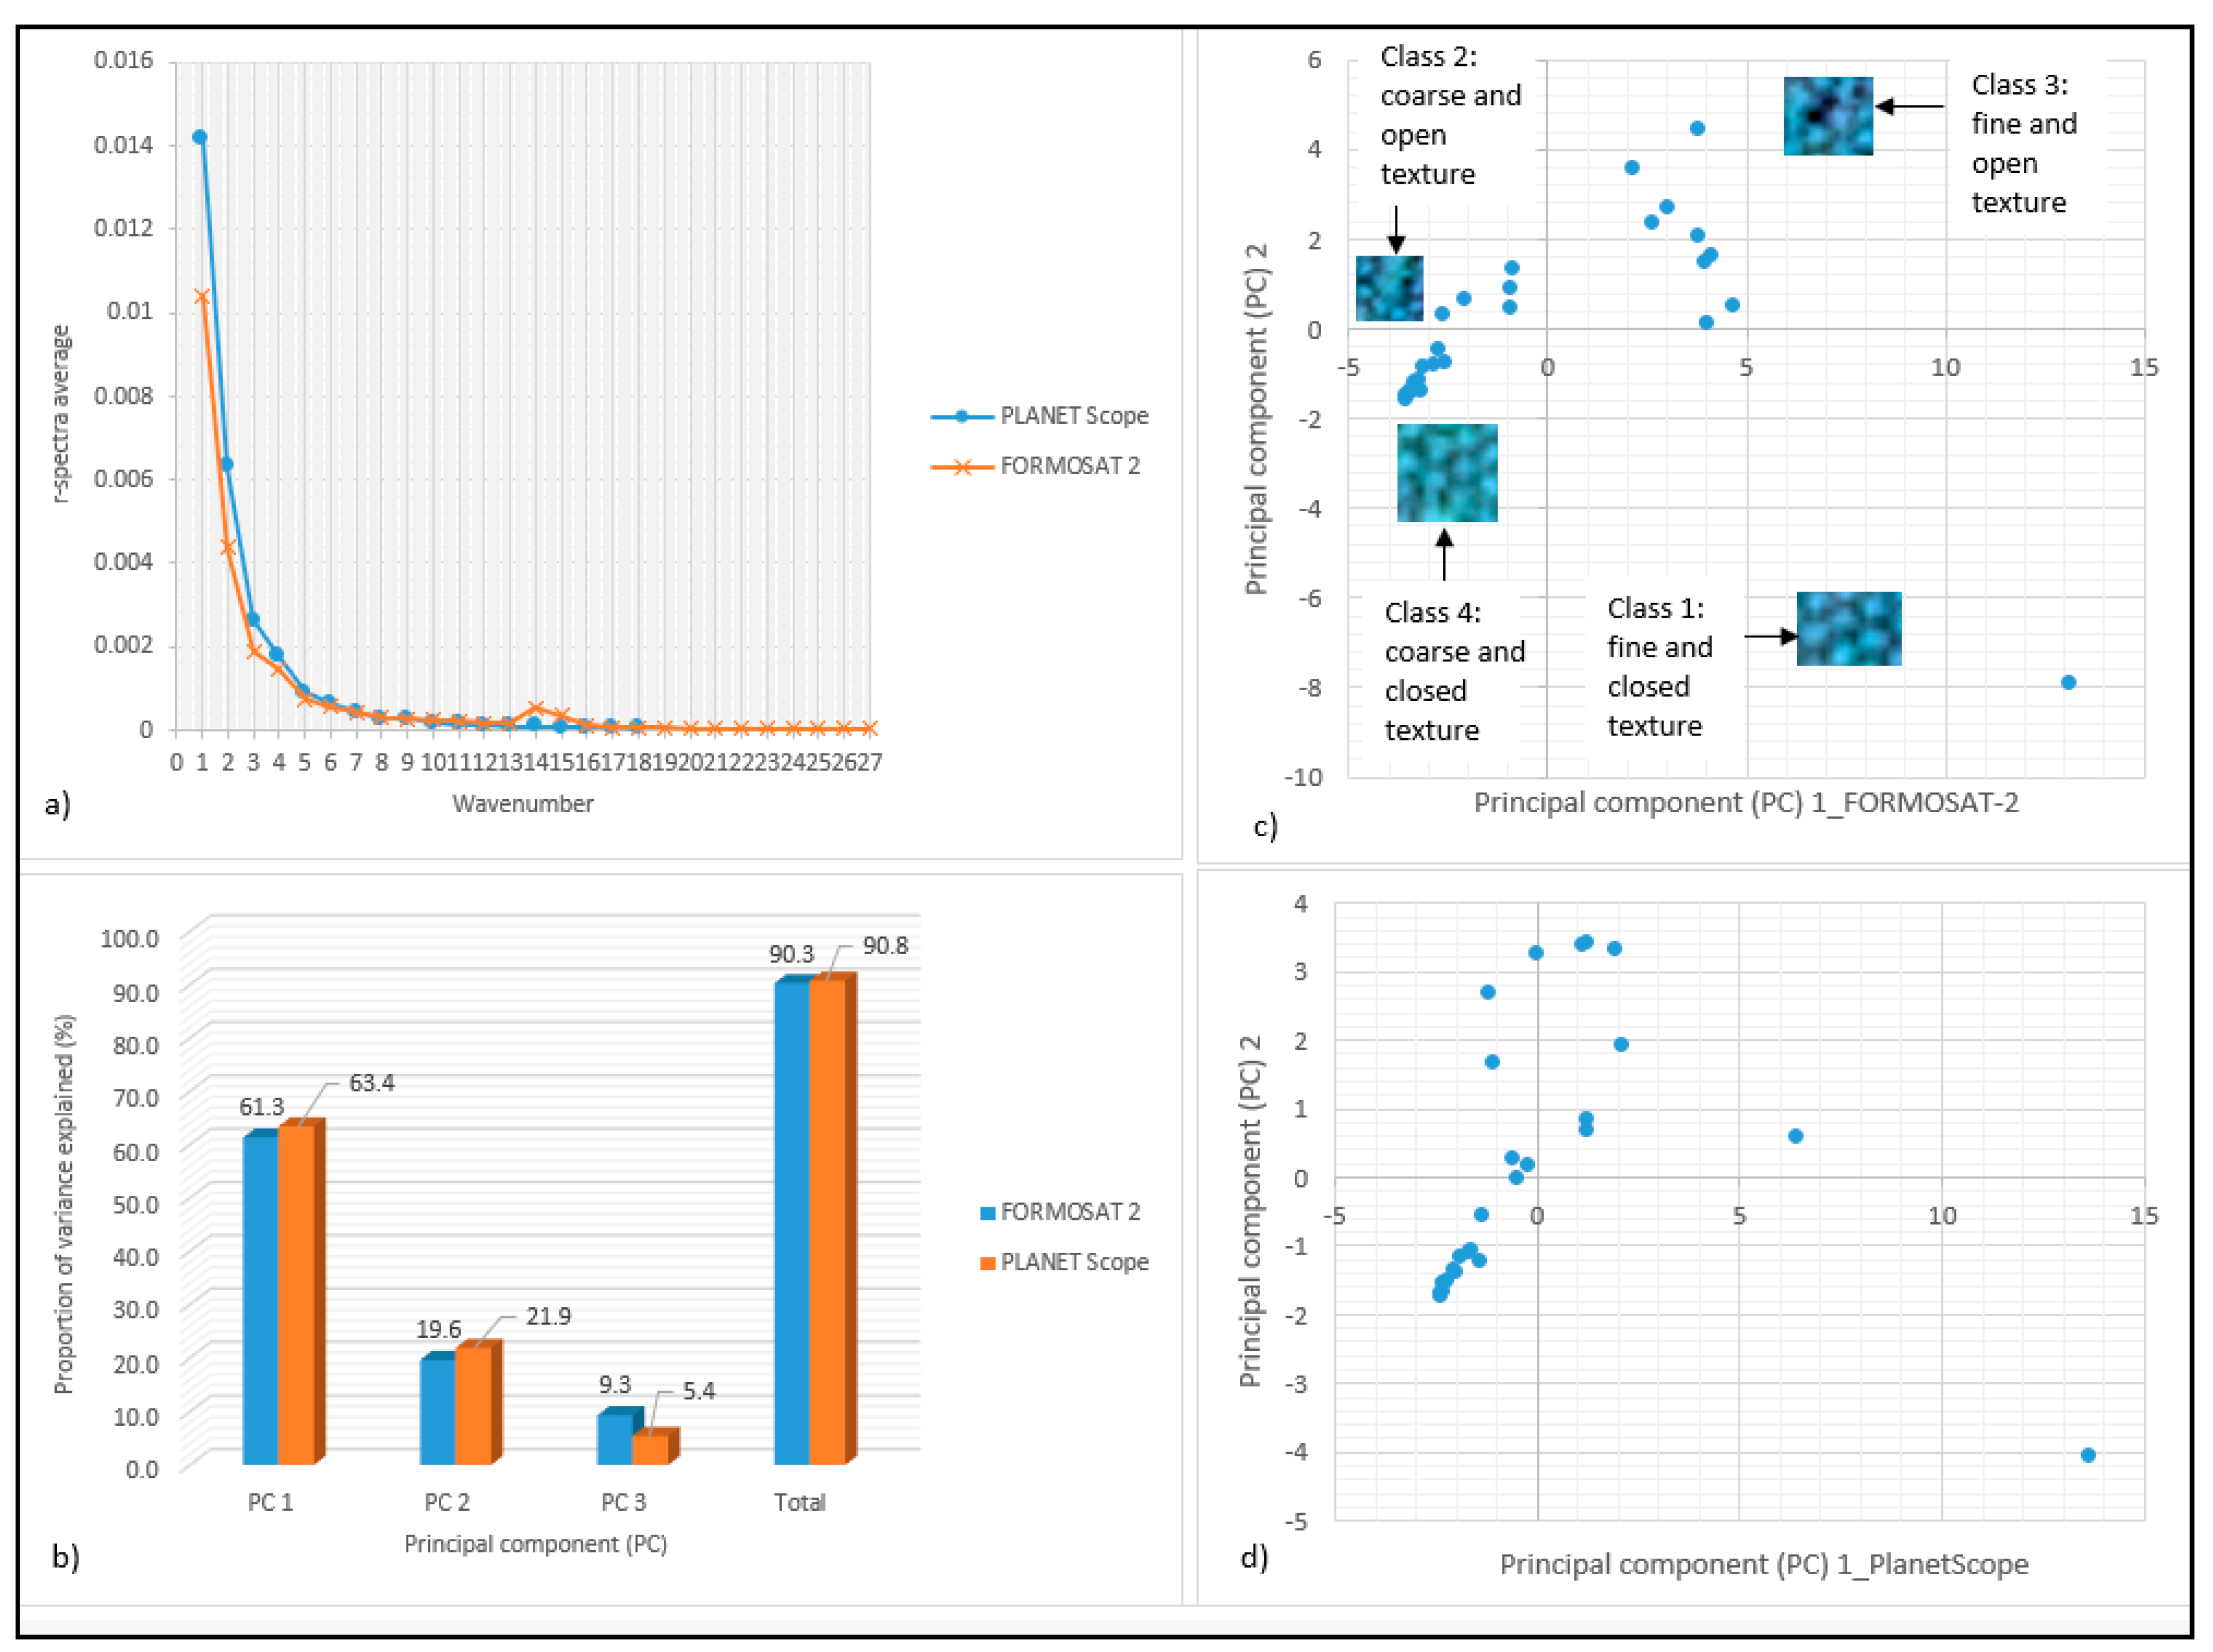
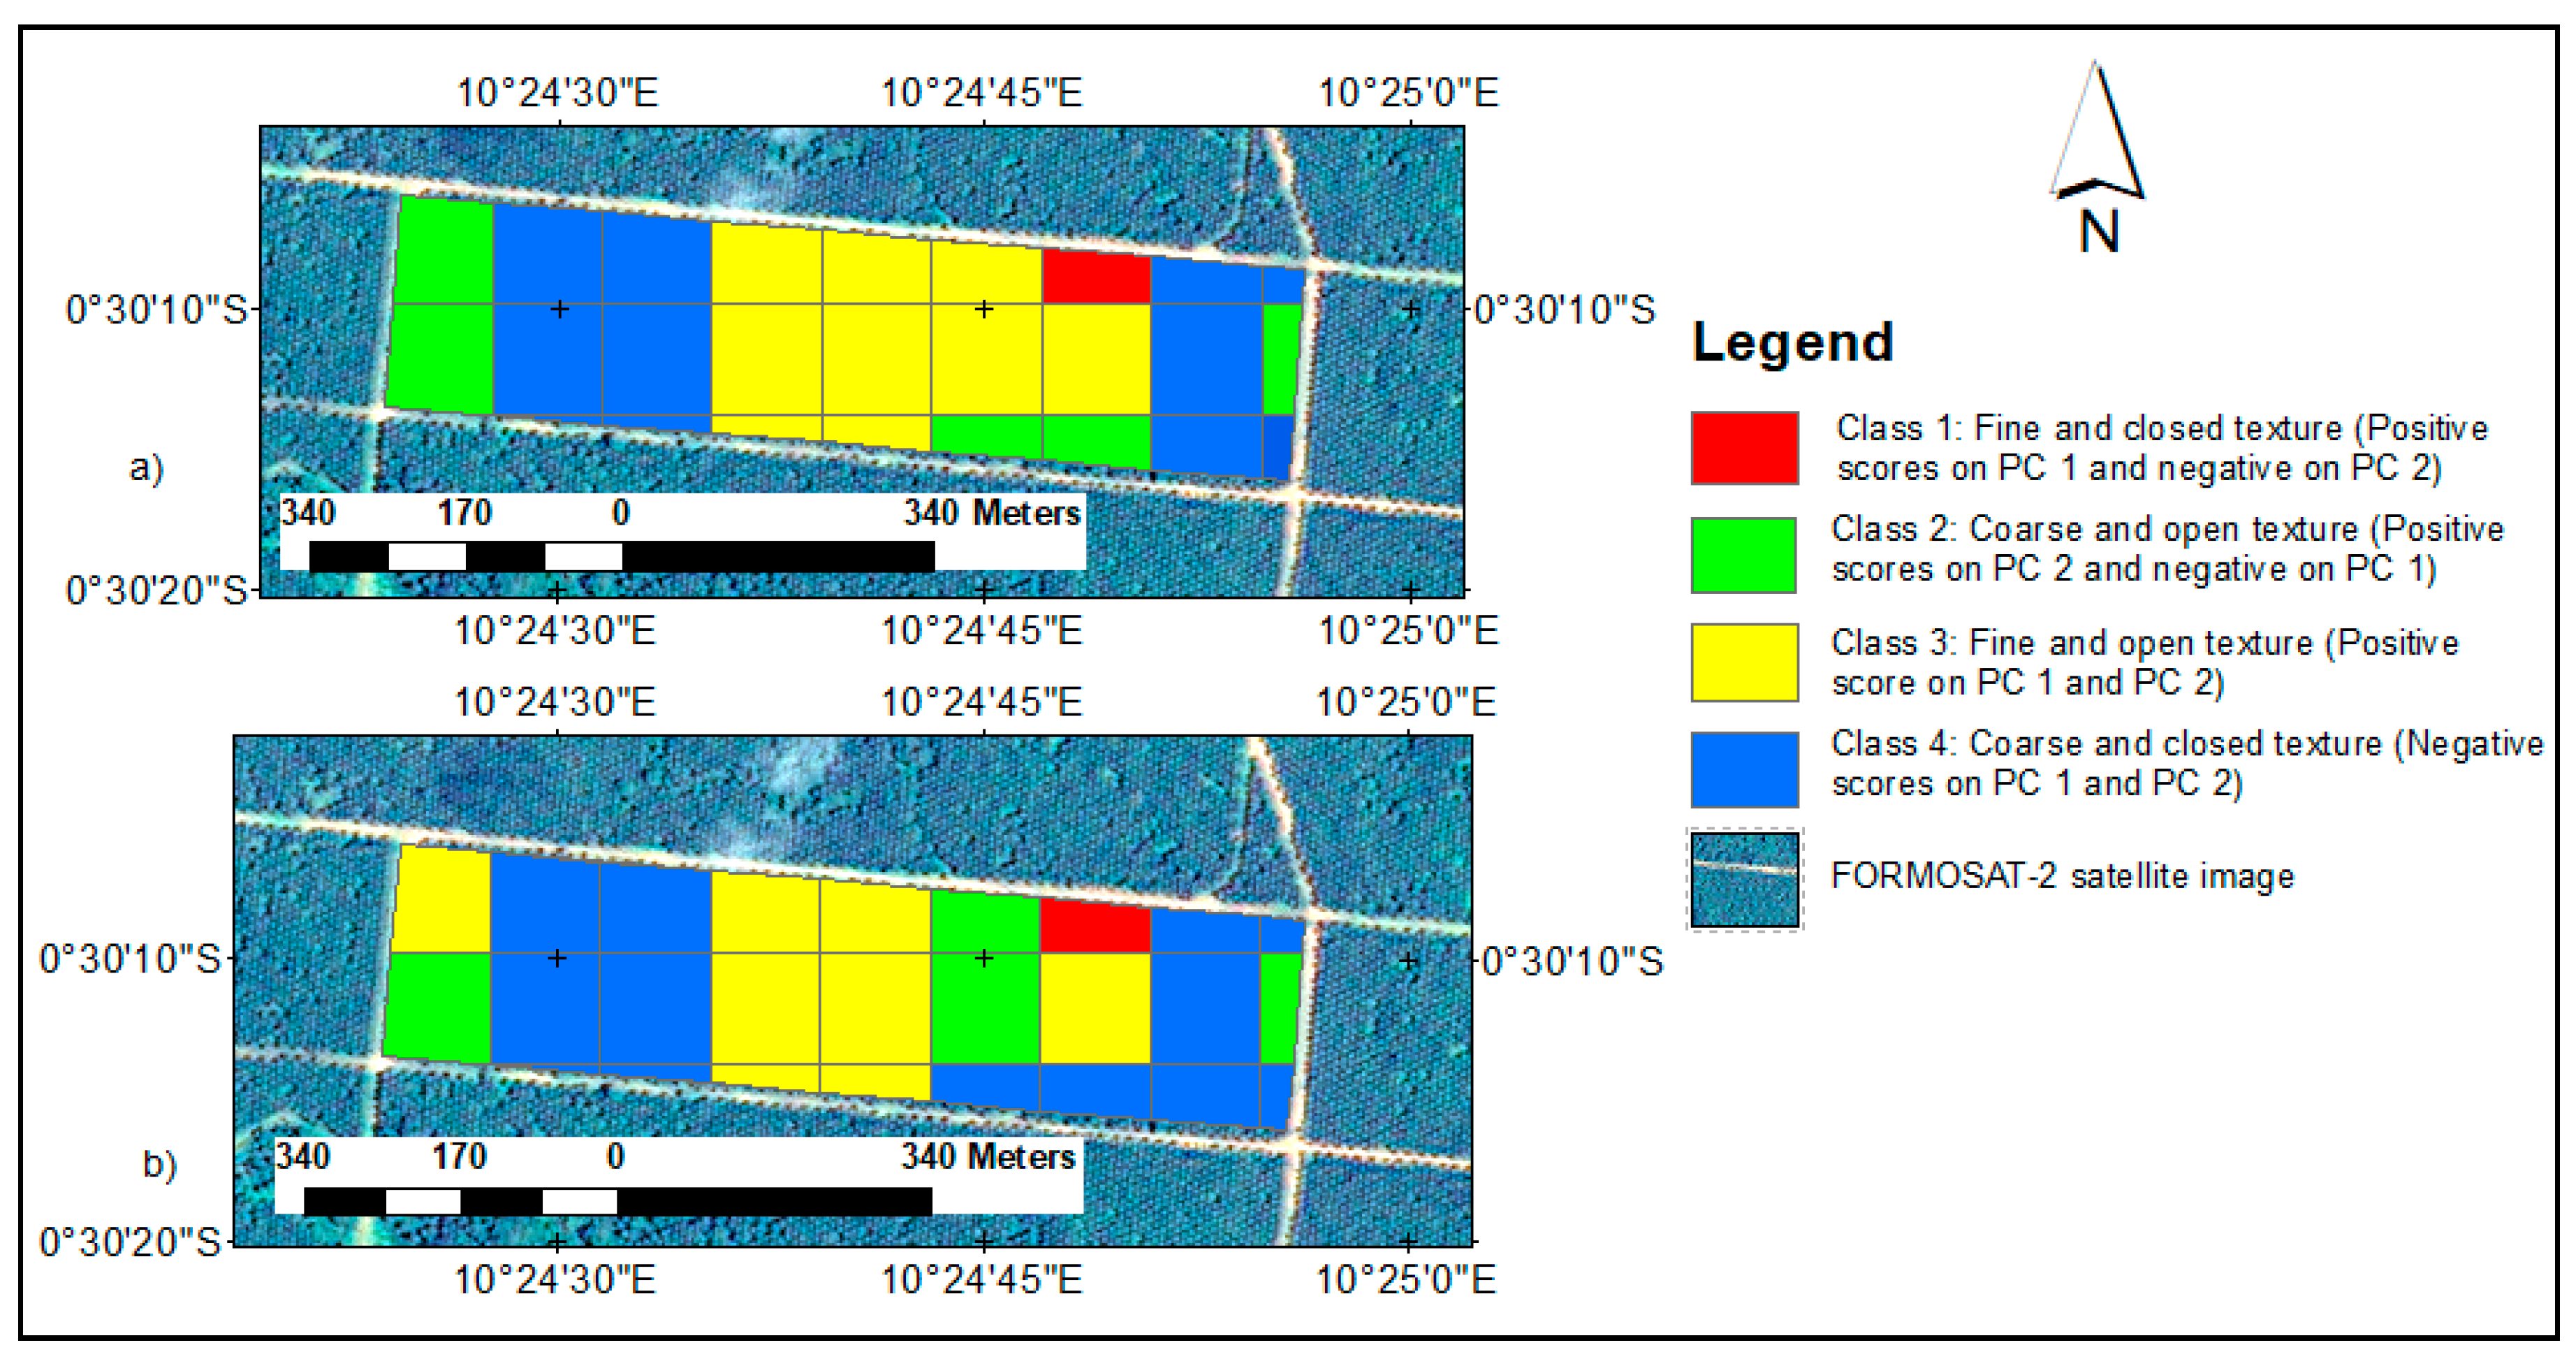
2.3.1. Textural Index Generation Using the FOTO Approach

FOTO was implemented in this study following steps that are described in [37] and [8]. These steps allow gradients of variation in image texture to be characterized by coupling two-dimensional discrete fast-Fourier transformation (FFT-2D) with principal component analysis [8,14,18,20]. On one hand, the approach permits textural characterization of very high-resolution PlanetScope and FORMOSAT-2 images that were acquired over oil palm plantations; on the other hand, we assume textural indices that we generated are related to aboveground biomass of these plants [6,8,11]. In this study, FOTO was performed in MatLab R2016a (MathWorks, Natick, MA, USA). Near-infrared spectral bands of the two images were selected and analyzed for their sensitivity to vegetation [8]. The main steps are explained below.
The first step consisted of masking aspects of the images that were not related to the vegetation cover, i.e., bare ground, clouds and their shadows, among others. Images of the palm trees were then masked. We accomplished this masking using a combination of unsupervised classification with the k-means algorithm on the near infrared spectral band of each of the images in the study and visual examination to isolate unwanted features. Oil palm plantations were distinguished from natural forests and non-forest areas in the classification process. Following this operation, a mask was applied to the infrared band of each original image to retain only areas that were occupied by oil palms, thereby defining the area of application of FOTO in each case.
The second step consisted of defining window sizes that were needed to calculate the 2D Fourier spectra on the different images. Following most previous work (e.g., [6,14]), we estimate these square window (WS) sizes in this study, such that WS = N*ΔS (N = number of pixels in the X or Y direction; ΔS = pixel size in meters). In a forest context, window sizes of 50 to 150 m are usually selected for applying FFT-2D [6,8,37]. Yet, Proisy et al. [8] demonstrated that window sizes between 75 and 120 m were best suited for characterizing near-infrared data in the IKONOS images that they examined. These sizes improved the results of principal component analysis (i.e., PCA), especially between 75 and 100 m. When choosing window sizes, the best possible compromises should be sought. Smaller sizes may not capture characteristics of the mature canopy, while sizes that are too large tend to represent landscapes more than canopy granularity, thereby reducing the spatial resolution of the FOTO maps [8,37]. Based upon these findings, we adopted three window sizes, i.e., 75 m, 100 m and 120 m. The WS report on ΔS provides the corresponding numbers of pixels N in the X and Y directions for these windows. The respective window sizes that were selected for the PlanetScope image are 24 × 24, 32 × 32 and 38 × 38 pixels. Window sizes (in pixels) for the FORMOSAT-2 image were respectively 38 × 38, 50 × 50 and 60 × 60 pixels.
The third step applied FFT-2D using the selected different sizes of square windows. FFT-2D yielded the radial spectra (or r-spectra), thereby converting the spectral radiance from the space domain to the frequency domain. Hence, a spectral radiance that is expressed in the space domain by I(x,y) of the x-column and y-row image is converted in the frequency domain into a function F(p,q), where p and q are spatial frequencies (or wavenumbers) along both Cartesian directions. These frequencies indicate the number of repetitions of an object within a given radial distance. They are expressed in cycles km−1, making it easier to compare results that are obtained from different window sizes. For any given window size WS, the Fourier transform is applied over a set of discrete wavelengths, defined as the ratios of WS to wavenumbers [19]. The highest wavenumber corresponds to the Nyquist frequency of WS/2. Wavenumbers p and q are thus constrained to the following intervals: 1 ≤ pWS/2 and 1 ≤ qWS/2. Phase information is not very relevant to the texture and, therefore, can be neglected. Thus, periodograms (Ipq) can be calculated for each pair of spatial frequencies (p,q) using Fourier coefficients (apq and bpq), such that:
Ipq = WS−2 (apq2 + bpq2)
The periodogram provides information on the variance of the image, according to the relative contributions of textural categories at various spatial scales. Based on its polar form, it is possible to conveniently characterize and recognize the distribution of surface patterns within the window considered, both in terms of scale and direction. The value of the periodogram in its polar form (I) reflects the portion of the variance of the image that can be explained by waveforms having a given wavenumber r and direction of motion θ, such that r = p 2 + q 2 and θ = tan−1(p/q). The r-wavenumber corresponds to the number of times the same waveform, i.e., the same reference pattern, is repeated within the window in the θ direction.
Additional simplifications can be applied to periodograms when the objective is textural analysis. They consist of calculating the average value of periodograms in all possible directions of motion θ to generate an averaged radial spectrum I(r). This spectrum is commonly referred to as the “r-spectrum”:
I ( r ) = ( k σ 2 ) 1 θ I r θ
where k is the number of periodogram values at spatial frequency r and σ2 is the variance of the image. The r-spectrum thus makes it possible to summarize the characteristics of textural variation in terms of the state of grain size and fineness, which is very useful for vegetation studies such as oil palm plantations. More details regarding the calculation of r-spectra can be found in Renshaw and Ford [38], Mugglestone and Renshaw [39], Couteron et al. [37], Proisy et al. [8], and Guo and Rees [19].
As previously noted, the current study considers three increasing window sizes for each image and determines which one is the best. The optimal WS (window size) that was used to generate the FOTO textural indices corresponds to the one that exhibits the highest Nyquist frequency among the three. The Nyquist frequency is the maximum frequency that the signal can display without containing errors, i.e., one-half of the sampling frequency. It often takes a wavenumber between 1 and 3. The r-spectra and Nyquist frequencies were obtained for the different windows and summarized in Figure 4. The best window size is 38 × 38 pixels for the PlanetScope image, while 60 × 60 pixels is the best size for the FORMOSAT-2 image. WS is almost the same for the two images, i.e., 119 m for PlanetScope and 120 m for FORMOSAT-2.
The fourth step involves textural ordination. The r-spectra that are produced were incorporated into a two-dimensional table, the rows of which represent the r-spectrum of the given window and the columns are the amplitude I(r) values. Normalization was performed on the columns of the table, after which the normalized spectra were subjected to principal component analysis (PCA). PCA characterizes the variability and measures the dispersion between r-spectra, reducing the dimensionality of the data to a few components (three in the current study). Principal component axis 1 contrasts coarse (negative scores) and fine (positive scores) textures of canopy grain. Coarse textures generally represent large canopy sizes, while fine textures are more consistent with small- to medium-sized tree canopies. Principal component (PC) axis 2 could be interpreted as a gradient of canopy openness, from closed canopy (negative scores) to open canopy (positive scores) conditions, as has been indicated in various studies [6,37,40,41,42]. By definition, the first three PCs that were extracted explain most of the variation in the data; factor scores for these components were used as textural indices (FOTO indices). Their values were mapped as Red-Green-Blue (RGB) texture images to produce FOTO maps, with a spatial resolution equal to the window size (WS).

2.3.2. Estimation of AGB by Multiple Regression

Oil palm structural parameters from the 40 field sample plots were first averaged before proceeding to the AGB model step. To achieve this, field sample plots that were contained in the WS window sizes (120 m × 120 m) of both image types were identified for FOTO analysis. Parameter averages for these plots were then calculated for each window. Depending upon position, the window could contain one or a maximum of three plots. Mean values of oil palm structural parameters that were estimated were examined using scatter plots. Field data and calculations were checked for possible outliers.
Mean values of the principal component (PC) scores for the normalized r-spectra (corresponding to the FOTO indices) were calculated for each window and then combined with the plot averages of the structural parameters. ArcGIS V10.7.1 (ESRI, Redlands, CA) was used for the overlay and spatial processing of the data. The values of the structural parameters and the FOTO indices for the study are presented by sample plots in Appendix A.
Before developing biomass models using MLR, we examined the relationships between FOTO indices and each palm structural parameter (DBH, HT, BA, D) estimated from field sample plots data in the study. This analysis identified parameters that best explained variations in the textural index, which would be the most influential in the MLR models. Finally, an MLR model was developed to estimate BA from the PlanetScope and FORMOSAT-2 images, respectively. The general form of the equation is as follows [8]:
A G B   =   a 0 + C = 1 3 a C . F I C
where a0 and aC are the MLR coefficients, and FI represents FOTO indices that were obtained from scores for the first three axes of PCA. To develop MLR models for estimating AGB, 75% of the total 40 samples available were used. These data were randomly selected. The remaining 10 samples were held back for the independent validation of the results.
Evaluation of various relationships that were developed (FOTO indices vs. structural parameters; AGB vs. FOTO indices) was performed using several statistical metrics. Relationships were deemed satisfactory when coefficients of determination (R2) were greater than 0.5, with p < 0.05. (P-values were calculated at a significance level of 5%). RMSE (Root-Mean-Square Error) and %RMSE (Relative RMSE) were further used to evaluate AGB models with MLR. The lowest values were sought. Ultimately, the choice of the best model in the present study was based more upon RMSE than upon R2, following recommendations from previous studies (e.g., [43]).

2.3.3. Estimation of AGB Using MARS

According to various studies that were mentioned in the introduction (Section 1), the MARS approach seems well suited to accounting for non-linearities in the data. It models relationships through summation of a series of so-called “basis functions” [27], which in fact constitute a set of stepwise adaptive linear regressions. We applied this method for the first time in the estimation of oil palm AGB. The generic expression of the MARS model that is based upon the dependent variable (y) and explanatory variable (x) is written as follows [28,32,44]:
y = f ( x ) + ε
where ε is the error and f(x) is the unknown regression function, which can be written as:
f ( x ) = β 0 + m = 1 M β m K m ( x )
where β0 is the constant in the model, Km(x) is the mth basis function, βm is the coefficient associated with the function Km(x), and M is the number of basis functions in the model. Each basis function Km(x) consists of a hinge function of the form max(0, x–k) or max (0, k–x), where k is a constant value. This formulation takes into account individual effects of the independent variables plus those resulting from interactions between two or more predictors (x). MARS eliminates less significant and redundant basis functions to create the final model [25]. To do this, basis functions are compared using the Generalized Cross-Validation Criterion (GCV). GCV is the residual Root-Mean-Square Error divided by a penalty determined by the complexity of the model [28]:
G C V ( M ) = i = 1 n ( y i f M ( x i ) ) 2 n ( 1 P M n ) 2
where yi are the observed values of the dependent variable, n is the number of observations, fM(xi) is the MARS model with basis functions M, xi are the observed values of the explanatory variables that are included in the MARS model, and PM is the number of parameters in the MARS model. The lowest GCV value corresponds to the appropriate model. In this study, MARS equations for AGB were developed from the FOTO indices using Statistica (TIBCO, Palto Alto, CA, USA).

2.3.4. Validation of the Estimates

Validation of the different models that were developed for estimating AGB used 25% of the samples (10 samples), independent of the development or training phase. The different metrics that were considered in performance analysis included R2, p-values, RMSE and %RMSE [25,45]. The best model was subsequently used to produce a FOTO map of AGB. The best model was subsequently used to produce a FOTO map of AGB [28,46,47] using ArcGIS software.

3. Results

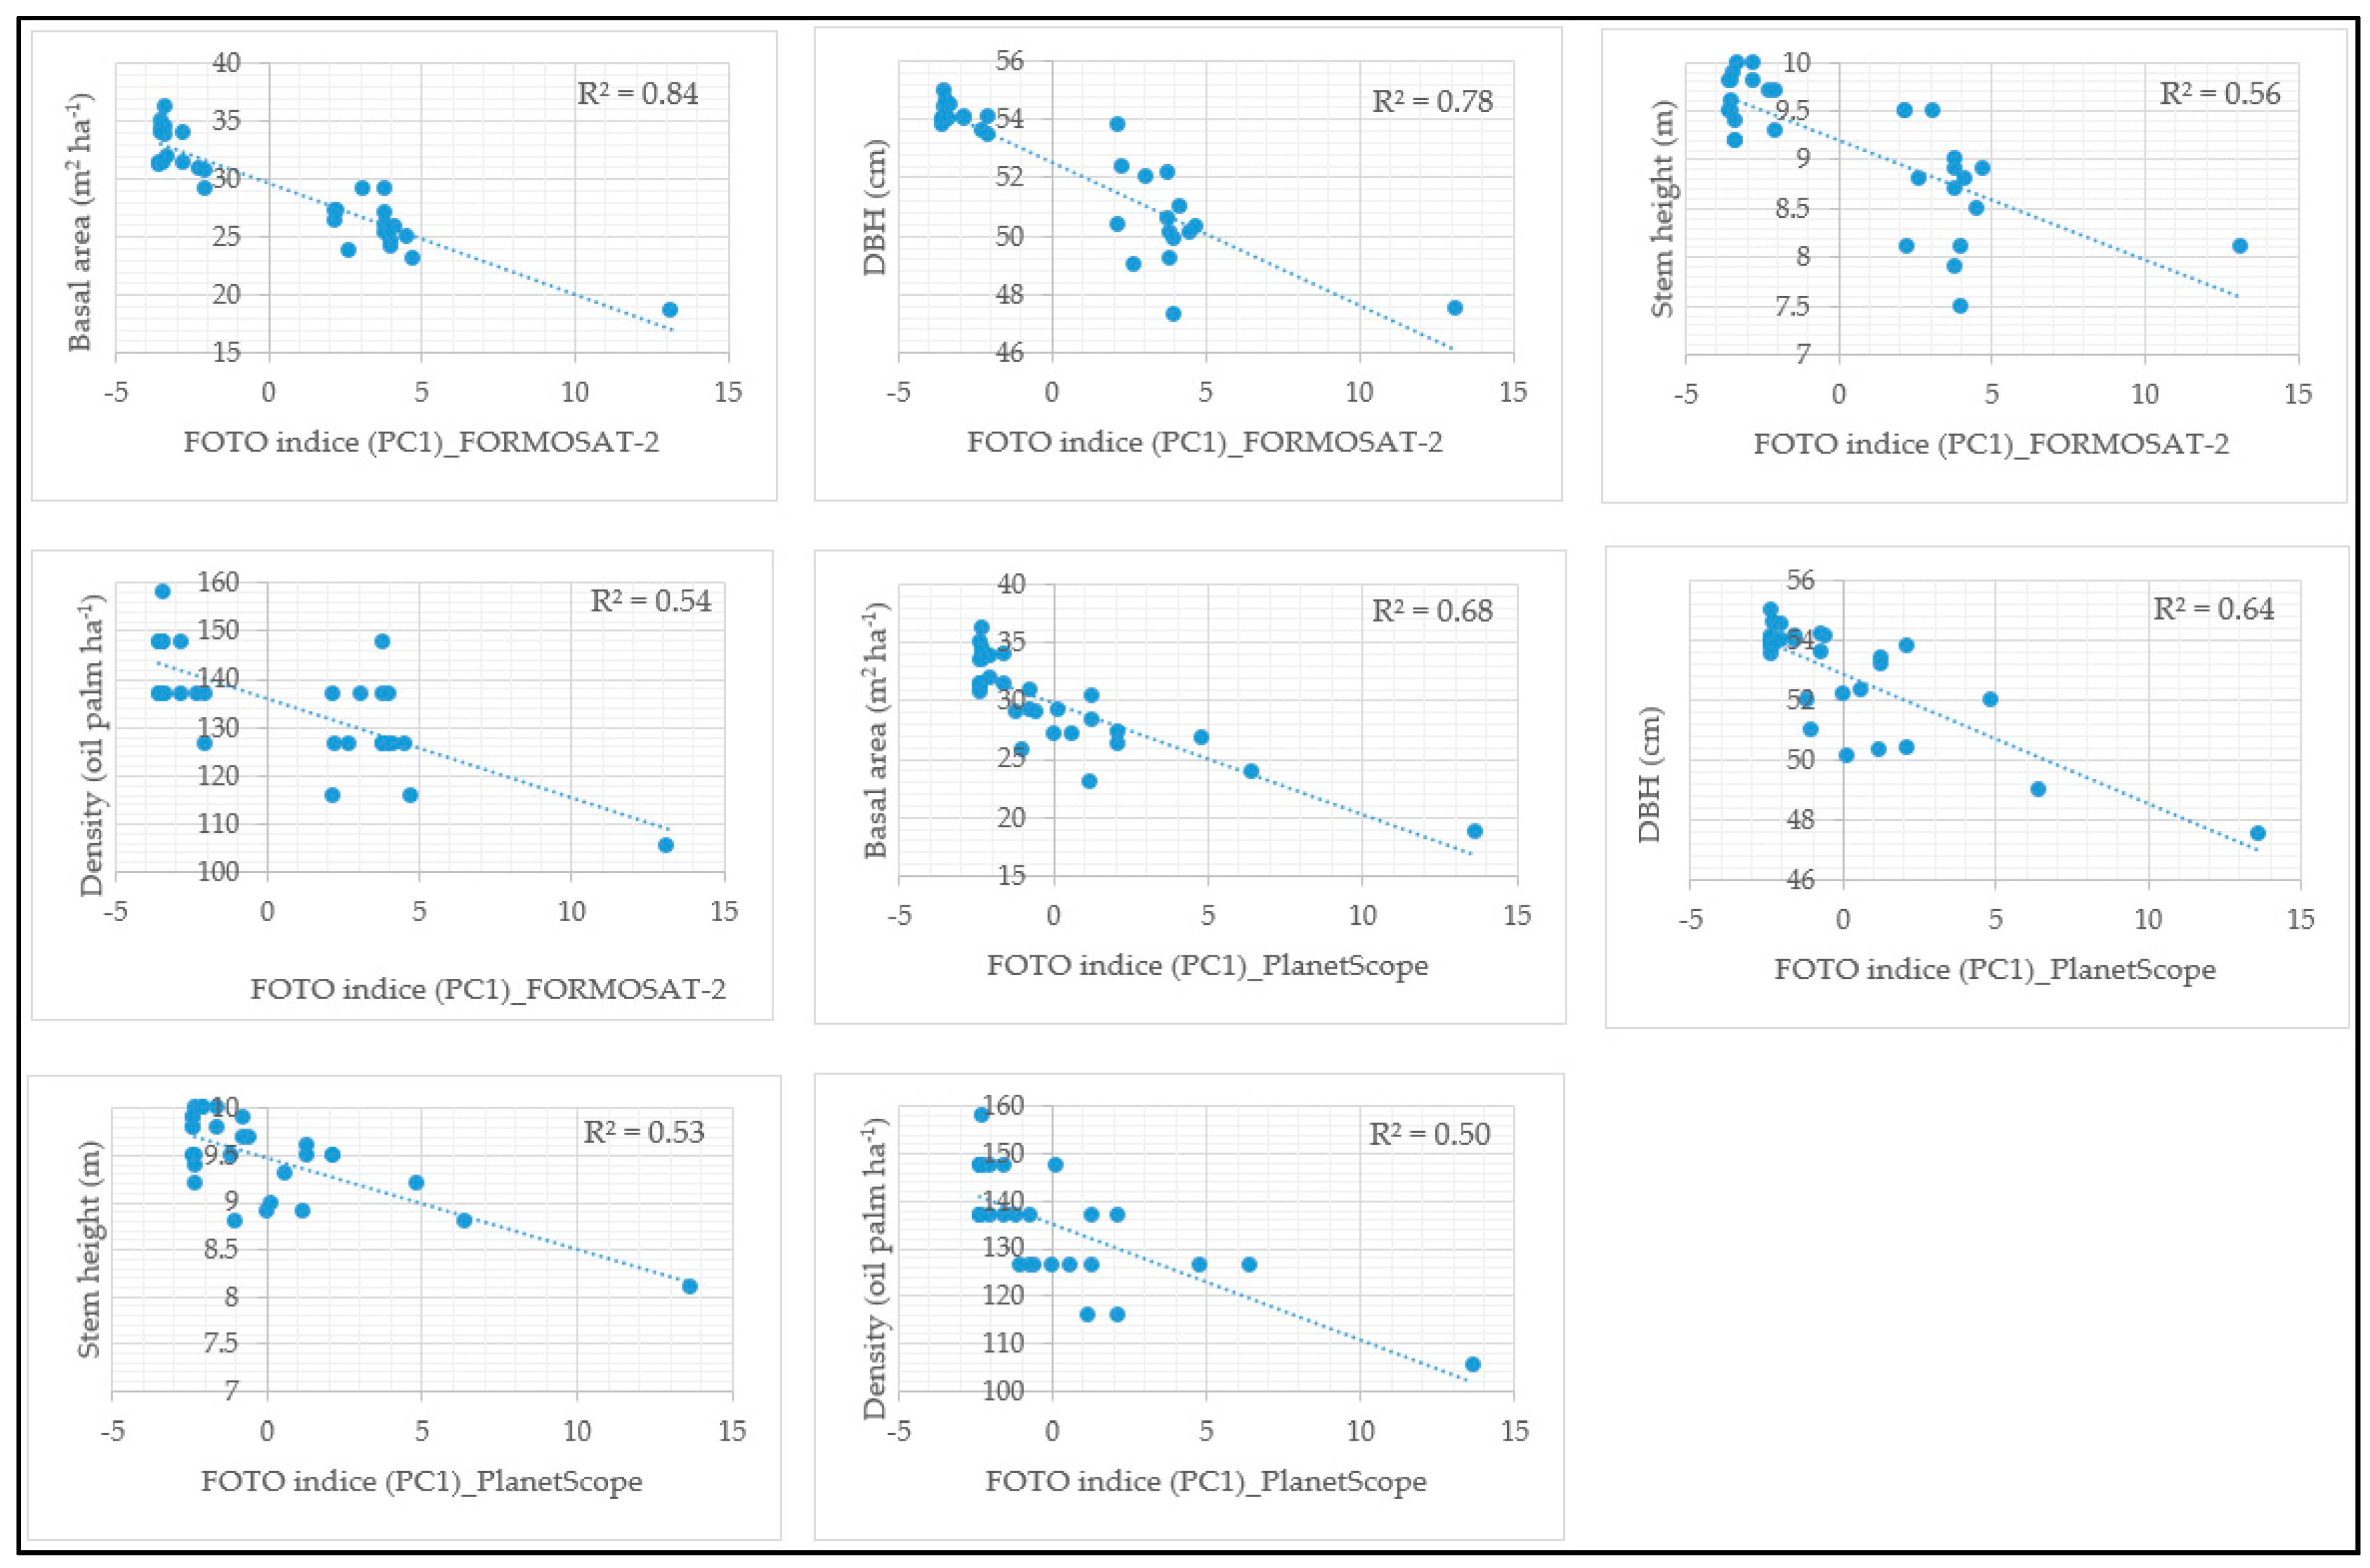
3.1. Textural Indices Using the FOTO Approach

FOTO was applied to infrared bands of PlanetScope and FORMOSAT-2 images to extract r-spectra for the oil palms. Figure 5a shows the variations in these spectra as a function of the r-wave number. The r-spectra for both images capture the entire gradient of the oil palm canopy cover. Maximum values are reached at r-wavenumber = 1, with low spatial frequencies of 8.4 cycles km−1 and 8.3 cycles km−1 for PlanetScope and FORMOSAT-2, respectively (Figure 4). These values characterize canopy texture of the oil palm plantation. Beyond these estimates, mean r-spectrum values remain observable at wave numbers 2 and 3 (Figure 5a). The latter appear at spatial frequencies greater than the maxima for both images, as shown in Figure 4. These values further characterize the texture of oil palms for FORMOSAT-2 with a 60-pixel window size, but did not fully characterize the texture for PlanetScope with a 38-pixel window size (Figure 4). Minimum r-spectrum values were obtained at r-wavenumber ≥ 4, with high spatial frequencies (≥33 cycles km−1) for both images (Figure 4). These values are more consistent with spatial patterns that do not represent the texture of oil palms.
PCA of PlanetScope and FORMOSAT-2 r-spectra demonstrates that factor scores derived from the first three axes are sufficient to explain most variations in oil palm canopy textures in the images (Figure 5b). For PlanetScope, the three components account, respectively, for 61.3%, 21.9% and 5.4% of the variance (90.8% of total variation). For FORMOSAT-2, they account, respectively, for 63.4%, 19.6% and 9.3% of the variance (90.3% of total variation). Ordinations of the first two axes (PC1 and PC2) are presented in Figure 5c,d for FORMOSAT-2 and PlanetScope, respectively. PC1 and PC2 account for just over 80% of total explained variance. The observed dispersions indicate the lack of correlation (orthogonality) between the two components in each case, consistent with expectation. In the case of FORMOSAT-2, four distinct clusters or texture classes emerge in the ordination (Figure 5c), i.e., open coarse texture, closed coarse texture, open fine texture and closed fine texture. These classes are encountered in the PlanetScope image, although distinctions among clusters are much less clear-cut than in FORMOSAT-2. The coarse or fine texture is related to the size of the canopies of oil palm trees. Coarse textures represent wider tops. Opening or closing refers to spacing between the crowns. Wide-open spaces indicate open canopies, while the tops of closed canopy textures are more compact.
Using factor scores for the first two principal component axes (PC1 and PC2), red-green-blue representations of FOTO canopy texture maps were produced for each of the images (Figure 6). The colors are indicative not only of PC factor scores for both axes, but also textural classes. Yellow denotes the open fine-textured oil palm class. Here, scores are positive on both PC1 and PC2 (Figure 5). This class occupies the entire central portion of the plantation and extends eastwards. It is dominated by with palms with lower-stature crowns, with an average stem height of around 8.8 m and DBH of 50.8 cm. Oil palms in the coarse-closed class are shown in blue (Figure 6). This class is characterized by negative scores on both PC axes (Figure 5). It is found in the western and eastern regions of the plantation. In these areas, palms have high average stem heights (about 9.7 m), larger average diameters (about 54.1 cm) and dominant broad crowns. Areas featuring the coarse-textured, open oil palm class are depicted in light green (Figure 6). Here, scores on PC1 are negative and positive on PC2 (Figure 5). This class of oil palms have dimensions similar to those of the previously mentioned class, with an average height of around 9.5 m, average DBH of 53.5 cm and dominant broad crowns, but open this time. Closed and open coarse texture classes are found on drier uplands, in contrast to open-fine texture, much of which is found in low-lying areas around the watercourse running through the plantation. This last class (in red) is characterized by fine, closed texture and appears in the northeastern part of the plantation (Figure 6). Scores defining this class are positive on PC1 and negative on PC2. Average palm height is identical to that of the open-fine texture class (8.8 m), but average stem diameter is smaller (48.8 cm compared to 50.8 cm). This class is localized in lowlands near the watercourse and, thus, potentially subject to growing conditions that are indicative of poorly drained soils.

3.2. Estimation of AGB by Multiple Regression

Correlations between FOTO indices and the various structural parameters of the oil palms were first analyzed. Table 2 summarizes correlations (as R2 values) with factor scores for the three principal components in both image types. For illustrative purposes, Figure 7 displays the results with PC1. The negative relationships that are obtained between PC1 from FORMOSAT-2 and plant structural parameters are the most significant overall (p < 0.0001). In particular, variation in PC1 not only strongly explains BA (R2 = 0.84), but also that of stem diameter (R2 = 0.78). Despite being significant, the weakest correlations are obtained with stem height (R2 = 0.56) and canopy density (R2 = 0.54). With PlanetScope, the results follow the same trends, but with weaker correlations in general. Basal area and DBH are the parameters that are best explained by PC1 in this case, with R2 values of 0.68 and 0.64, respectively (p ≤ 0.0001). Stem height and density are the least explained with PC1 from PlanetScope (R2 < 0.55). Other than PC1, the other components (PC2, PC3) generally show insignificant relationships with the structural parameters of oil palms, regardless of the satellite data considered (Table 2).
Structural parameters of oil palms are explanatory variables of the aboveground biomass. A relationship between these parameters and FOTO indices that are from FORMOSAT-2 and PlanetScope, in particular PC1 (Table 2), suggests links between these indices and AGB. Based upon this preliminary analysis, MLR models of AGB were developed by considering the three components (PC1, PC2 and PC3) for each of the two image types. In the case of FORMOSAT-2, the best relationship that was obtained (Model 1) integrates all three indices (Table 3). It is a strong and significant relationship (R2 = 0.86, p < 0.0001). The associated RMSE was estimated to be 4.03 tons ha−1. The best MLR model constructed considering PlanetScope FOTO indices (Model 2) uses also the three components (PC1, PC2 and PC3). This model offers comparable metrics to that of FORMOSAT-2 (R2 = 0.83; p < 0.0001, RMSE = 3.77 tons ha−1, as indicated in Table 3.

3.3. Biomass Estimation Using MARS

AGB models were developed with the MARS approach using FOTO indices of the FORMOSAT-2 and PlanetScope images, according to methods that are detailed in Section IV. Several combinations of indices PC1 to PC3 could be used to generate interesting equations. Table 4 summarizes the models that we have developed, and retained for validation purposes and to select the best model for each image type. All three models that were produced from FORMOSAT-2 data have very satisfactory performance criteria (R2 ≥ 0.89, p < 0.0001; RMSE < 3.6 tons ha−1; %RMSE < 5.9%). Among them, Models 3 and 4 incorporate interactions between PC1 and PC3, thereby making additional adjustments compared to Model 5, which rely solely upon basic linear functions. The integration of interaction terms reduces slightly the estimation errors (less than 1%), but increases the degrees-of-freedom that are associated with the equations.
Three models were also developed using FOTO indices derived from PlanetScope. Models 6 and 7 incorporate interaction terms, while Model 8 sums piecewise linear functions of the form βi(PCi − ki), where PCi corresponds to FOTO indices PC1, PC2 or PC3, and βi and ki are constants. As was the case with FORMOSAT-2, models taking interactions into account yield slightly smaller errors, but the differences are non-significant. Overall, the three models developed for PlanetScope appear as strong as those developed with FORMOSAT-2 data, with errors of the same order of magnitude (R2 ≥ 0.84, p < 0.0001; RMSE < 3.8 tons ha−1; %RMSE < 6%).

3.4. Validation of Estimates

AGB models that were developed using MLR and MARS approaches, based on the FOTO indices, were validated from independent samples that were not considered during the training or development phase (see Section 4.1). Table 5 summarizes results that were obtained. The validation exercise confirms strong relationships between biomass and FOTO indices for both PlanetScope and FORMOSAT-2, as demonstrated by the summary statistics (R2 ≥ 0.80; p ≤ 0.0005; RMSE < 5.5 t ha−1; %RMSE < 10.2%), regardless of the approach (MLR or MARS) used. In this study, MLR appears to be just as effective as the MARS method, especially when FORMOSAT-2 data are used. Overall, the best validation results are obtained with FORMOSAT-2 data (R2 ≥ 0.89; p < 0.0001), especially for Models 3, 4 and 5, which yield lowest errors (%RMSE ≤ 6.40%). Model 1 (based on MLR) gives quite similar validation results. Slight elevated errors were obtained with PlanetScope MARS models at the validation stage (on average about 3% above FORMOSAT-2 models in terms of %RMSE).
Examination of the various results obtained shows that proposed approaches, when combined with the use of FOTO texture indices, are effective in estimating oil palm aboveground biomass. The use of PlanetScope or FORMOSAT-2 images does not introduce important differences. Of all proposed models that were based upon MARS, Model 3 for FORMOSAT-2 and Model 6 for PlanetScope appear to be the best models. These two models have errors of 6.09% and 8.51%, respectively, on the estimated AGB (Table 5). Model 1 that is based upon the MLR approach with FORMOSAT-2 is just as efficient, with a similar error level of 6.56%.
Following validation, an AGB map was generated with Model 3 using FORMOSAT-2 data for illustrative purposes (Figure 8). Observable spatial variability in the map (Figure 8b) reflects variations in oil palm structure that were observed in the field during sampling. It is also similar to variability in oil palm texture (Figure 6a). Thus, highest AGB (>59.00 t ha−1) is found in dry land areas (dark green and medium dark green, Figure 8b). These areas benefit from regular maintenance of the oil palms by OPG. On one hand, they are characterized by an open or closed coarse texture (Classes 2 and 4, Figure 6b), i.e., they are dominated by mature oil palms with large tops. On the other hand, lowest AGB (<59.00 t ha−1) is in the poorly drained lowland area surrounding the stream crossing the eastern section of the plantation (Figure 8b, light green and medium light green). Pockets of continuous stagnant water are found here; palms do not benefit from the same silvicultural maintenance. Consequently, these oil palms exhibit lower growth and appear less mature. They are characterized by smaller crowns, as observed during fieldwork. The corresponding textures in the images are rather thin open or closed in these areas (classes 1 and 3, Figure 6b).

4. Discussion

4.1. Potential of FOTO Indices for Oil Palms

FOTO indices that were obtained using factor scores for the first three axes of the principal component analysis allowed us to capture coarse and fine textures of oil palm crowns. They also made it possible to characterize the degree of canopy openness and closure. Various studies have also shown the ability of FOTO indices to describe the textures of the canopy of forests and oil palms [6,8,14]. The homogeneity and the simple structures of the mature oil palm stand in an agro-industrial plantation context certainly favored the performance of FOTO indices. According to its original applications, the FOTO method is best suited for treating homogeneous stands [18,48]. Overall, the palms that were considered were mature (>30-years-old) and the differences that were observed between them could be mainly attributed to their location, i.e., either in uplands or in low-lying areas, which conferred greater homogeneity to the images. Yet, FORMOSAT-2 data captured texture information better than PlanetScope did. These data resulted from a pansharpening process and showed greater contrast with a fine spatial resolution (2 m × 2 m), thereby favoring a sharper delineation of palm crowns. In addition, radiometric uncertainty of FORMOSAT-2 was less than 5% [49], which helped to reduce noise in the data. To minimize information losses and noise, no radiometric correction was applied to the FORMOSAT-2 image, as recommended in previous work employing the FOTO method [8]. A low noise level favors full coverage of the Nyquist frequency by the spatial frequencies of the r-spectrum over the very first wavenumbers, as was the case in this study with the FORMOSAT-2 image (Figure 5).
FOTO indices that were derived from PlanetScope also captured variation in the texture of oil palms, but in a less clear-cut manner. By comparing the Nyquist frequencies that were obtained, we observe that spatial frequencies of the PlanetScope r-spectrum contain more noise than those of FORMOSAT-2, especially for the first three wavenumbers. Several factors could explain these differences. The spatial resolution of PlanetScope (3.125 m × 3.125 m), although very good, is lower than that of the FORMOSAT-2 product used here. This may possibly affect the discrimination of palm crowns. The PlanetScope image had already undergone radiometric corrections, changing from grey levels to radiances at the top of the atmosphere. Further, radiometric uncertainty of PlanetScope is on the order of 5–6% [50], which is higher than that of FORMOSAT-2. The combination of these different factors can promote loss of information and limit the performance of PlanetScope [50].
Nevertheless, we found that FOTO indices that were derived independently from the two types of images are significantly correlated, except for the third component. Indeed, the correlation between FORMOSAT-2 PC1 and PlanetScope PC1 is r = 0.80, while the correlation between the two PC2 is r = 0.81. PC3, which consisted primarily of noise, is uncorrelated (r = −0.36). These significant correlations indicated that FORMOSAT-2 and PlanetScope captured very similar information in their first two FOTO indices, even though the images were acquired on very different dates (2011 for FORMOSAT-2; 2017 for PlanetScope). This difference in years could initially be viewed as a handicap. However, several studies agree that the growth rate of oil palm in agro-industrial plantations stabilizes after 25 years, and that its height growth gradually slows down towards 30 years [51,52,53]. The stabilization of the growth rate affects several structural parameters (diameter, crown size), which may be important for estimating AGB using FOTO indices [42]. As the study was carried out on a mature plantation, the effect of different dates of image acquisition was not noticed.
Choosing the best window size is a very important step in implementing FOTO. To determine this size in this study, the window size that produced the highest Nyquist frequency was selected for each image. This choice also took into account the decomposition or separation of the principal component scores. This separation was observed in the ordination of factor scores for the two principal components of the r-spectra for each of the images in the study. With this choice, the number of scores that were available in each principal component with each window was also considered sufficient for establishing relationships between the FOTO indices and AGB [8]. These different choices made it possible to facilitate the application of FFT-2D analysis and production of the r-spectra. Some scores in the present study appear very high (Figure 6). However, as also observed and reported in Couteron et al. [37,40], these high values closely match the fine textured grain, and are not outliers.

4.2. Estimation of Aboveground Biomass

The study established different models for estimating AGB based on the MLR approach and the MARS method. Equations that were developed with MLR were very significant overall. The validation process confirmed the robustness of these relationships, especially with FORMOSAT-2 (Model 1, R2 = 0.85, p = 0.0001, RMSE = 4.18 t ha−1, %RMSE = 6.56%). With MARS, we developed three models for each type of image. Some of these models used only basic piecewise functions, while others integrated the interactions that occurred between FOTO indices (PC1, PC2 and PC3). Integration of these terms provided additional adjustments that slightly improved model performance. Yet, this improvement frequently was not significant considering the RMSE differences. For the best two models with FORMOSAT-2 data, the difference is <0.2%, while it is less than 0.8% for PlanetScope. With MARS, it is possible to consider several combinations of basic functions. Models 3 to 5 that were developed for FORMOSAT-2 and Models 6 to 8 for PlanetScope were apparently the best compromises in this study. Of these, Model 3 stands out as the most efficient following the validation process, with R2 = 0.92, p < 0.0001, and %RMSE = 6.09%. For comparison, larger errors, ranging from 28 to 36% were reported in [4] for AGB prediction uncertainties of young oil palms (1 to 5 years), based on models using spectral indices and Normalized Difference Vegetation Index (NDVI). The FOTO PC1 index plays a crucial role in each of the models developed in the present study. This was not very surprising, since PC1 already explains several important structural parameters of the oil palm stand, including basal area (R2 = 0.68 to 0.84), DBH (R2 = 0.64 to 0.78), stem height (R2 = 0.53 to 0.56) and density (R2 = 0.50 to 0.54) (see Figure 7). These different parameters are critical for biomass estimation. PC2 (and, to a lesser extent, PC3) provided additional information that favors more accurate biomass estimation.
The relatively homogeneous structure of the oil palm plantation is well captured by the FOTO indices, particularly at the FORMOSAT-2 scale, thereby favoring a more accurate estimate of aboveground biomass. In a study in Malaysian Borneo, Singh et al. [14] similarly reported very significant results (R2 = 0.83) between AGB of young oil palms (<9-year) and FOTO indices that were derived from SPOT 5 imagery acquired at a fine spatial resolution similar to that of FORMOSAT-2 (2.5 m × 2.5 m). The results found in this study are comparable to those reported in several other studies for different vegetation types. Indeed, strong relationships (R2 = 0.92) have been shown between AGB of mangroves in French Guiana and the FOTO indices (PC1, PC2 and PC3) derived from panchromatic Ikonos image at a spatial resolution of 1 m [8]. In several studies, the FOTO index (PC1) was well correlated to structural parameters of tropical forests [6,14,40,42], as was the case here for oil palms. For example, the study in [40] on tropical forest reported R2 = 0.57 between FOTO PC1 and stem height, which is similar to the values we found here for oil palms (R2 = 0.56 with FORMOSAT-2, and 0.53 with PlanetScope). In addition, based on simulations, Barbier et al. [42] reported good relationships between PC1 and forest canopy DBH (R2 = 0.75), crown size (R2 = 0.62), but the correlation with density was relatively weak (R2 = 0.35). Singh et al. [14] found strong relationships between FOTO indices and structural parameters of a mixed forest landscape. The biomass models that were developed in our study with FORMOSAT-2 FOTO indices apparently performed slightly better than those of PlanetScope, as shown during the validation phase (Table 5). The average difference in terms of %RMSE is in the order of about 3%. Radiometric noise in PlanetScope images (5 to 6%; [50]) was higher than in FORMOSAT-2 (<5%; [49]), as were differences in spatial resolution and the influence of image processing on calculation of the FOTO indices. Aside from the characteristics and the quality inherent to the different types of images, potential measurement errors of oil palm variables in the field may also affect the results found.
Models that were based on the MARS approach are more dependent on the range of data values and their degree of autocorrelation than on pre-processing applied to satellite images [54]. This result underscores the importance of principal component analysis, which reduces correlations in FOTO indices. In all of the results that we obtained, the MARS approach was well suited to estimating AGB in oil palm plantations, both with PlanetScope and FORMOSAT-2 imagery. The performance of MARS is attributable to the method’s ability to transform and select important variables, and then to identify non-linear and multidimensional interactions between them [25,33,55]. Therefore, it was not surprising that various previous studies have reported favorable results for the MARS method compared to other statistical methods (logistic regression, MLR, among others) in a range of fields, such as medicine, pedology, hydrology and forestry [23,31,32,33]. The MARS approach deserves further investigation in remote sensing for AGB estimation, not only of plantations but also of natural forests. Other advanced methods that are based on the concept should also be introduced, including Multivariate Adaptive Regression Spline Differential Evolution (MARS-DE), which has been recently proposed by Al-Sudani et al. [56].
Despite the very significant results that were obtained, the study had some limitations that should be mentioned. The number of sample plots that were considered is relatively small. The use of a sufficient number of sample plots randomly distributed on plantations at various growth stages would improve the robustness of AGB models that are based upon FOTO indices. In this sense, PlanetScope images and other types of fine-resolution optical images (SPOT, PLEADES, SkySat, among others) could be analyzed to better understand the effects of spatial resolution, radiometric noise and pre-processing. The very encouraging results that were obtained here with FOTO indices also permit the use of other texture indices that are derived, for example, from a grey-scale co-occurrence matrix, wavelet decomposition or multiband texture analysis. The addition of auxiliary information, such as topographic, climatic or geomorphological data, could also be considered for improving estimates of AGB [13,57].

5. Conclusions

This study estimated oil palm AGB with MARS and MLR using PCA scores (components 1, 2 and 3) performed on FORMOSAT-2 and PlanetScope r-spectra. These scores were considered as FOTO textural indices for each image type. The results that were obtained with both approaches are very good overall, especially when FORMOSAT-2 data are considered. Slightly higher errors were obtained with PlanetScope compared to FORMOSAT-2, according to the validation performed. The different models that were developed with MARS, particularly those integrating interaction terms between the FOTO indices (explanatory variables), proved to be more efficient in the study for both type of satellite data. They all integrate the basis functions of the FOTO indices of the three PCA axes and contain their interaction terms. The best model in the study is based on FORMOSAT-2 FOTO indices. It was chosen to produce an AGB map of the study area. Upon further studies, such a model could be used to map AGB of oil palms in the Congo Basin using remote sensing data. Then corresponding sequestrated carbon could be evaluated, with linkage to climate change. The present study focused mainly on a mature oil palm plantation. Subsequent work would have to extend it to larger plantation areas with different stages of palm growth and development, and use a larger number of sample plots. The MARS approach should be further investigated not only with different types of very high-resolution commercial images, but also with free medium-resolution images (e.g., Landsat, Sentinel) for mapping plantation biomass at larger scales.

Author Contributions

Conceptualization, P.M. and K.G.; methodology, P.M. and K.G.; software, P.M.; validation, P.M. and K.G.; formal analysis, P.M.; investigation, P.M.; resources, P.M.; data curation, P.M.; writing—original draft preparation, P.M.; writing—review and editing, P.M and K.G.; visualization, P.M.; supervision, K.G.; project administration, P.M.; funding acquisition, P.M. and K.G. All authors have read and agreed to the published version of the manuscript.

Funding

This study was funded by the Programme Canadien de Bourses de la Francophonie (Government of Canada, Department of Foreign Affairs, Trade and Development, Canadian Partnership Branch) and by the Natural Sciences and Engineering Research Council of Canada (NSERC).

Acknowledgments

This study was funded by Programme Canadien de Bourses de la Francophonie (Government of Canada, Canadian Partnership Branch, Department of Foreign Affairs, Trade and Development) and by NSERC (Natural Sciences and Engineering Research Council of Canada). We thank Gabonese companies and government institutions that contributed substantially to the field data measurement campaign and satellite images that were used in this study: Olam Palm Gabon, the Institut de Recherche en Ecologie Tropicale (IRET), and the Project for the Development of a National Forest Resources Inventory System Contributing to Sustainable Forest Management (PDSIRFN), Ministère en charge des Eaux et Forêts au Gabon. We thank the many people who contributed to various aspects of the study, including the experimental design and fieldwork in Makouké (Pr. Alfred Ngomanda, Andréana P.M. Biyogo, Quentin B. Meunier, Simplice Ntem, Cynel G. Moundounga, Quentin M. Mavouroulo, Lucien Ligna, Davy N. Ikapi and Landry A.C. Ndjella, Fatoumata A. Eba and Herman Kombo), and W.F.J. Parsons for English translation.

Conflicts of Interest

The authors declare no conflict of interest.

Appendix A

Table A1. Mean measurements of structural attributes of oil palms and FOTO indices of FORMOSAT-2 and PlanetScope from 40 sample plots.
Sample PlotDBH (cm)HT (m)NPSample Plot
Size (ha)
Density
(D, Stems ha−1)
Basal area (BA, m2 ha−1)AGB
(t ha−1)
FOTO FORMOSAT-2 Index PC 1FOTO FORMOSAT-2 Index PC 2FOTO FORMOSAT-2 Index PC 3Sample
Plot
FOTO PlanetScope Index PC 1FOTO PlanetScope Index PC 2FOTO PlanetScope Index PC 3
150.19.0140.0949147.5829.1259.983.82501.98411.326933−2.0411−1.36960.8058
249.28.7130.0949137.0426.0552.503.82501.98411.326928−1.04271.64280.4886
352.09.5130.0949137.0429.1061.943.06352.68530.57056−2.3456−1.7279−1.1479
449.98.1120.0949126.5024.7446.753.97681.46882.0267351.27300.65430.5863
552.28.9120.0949126.5027.0754.503.80102.03561.256937−2.3456−1.7279−1.1479
655.09.8140.0949147.5835.0675.15−3.5172−1.55320.756539−2.3484−1.7393−1.0638
747.58.1100.0949105.4118.6835.8913.1415−7.9270−2.476115−2.2906−1.6971−1.1064
853.69.7130.0949137.0430.9266.28−2.2736−0.3779−0.3589201.15683.3801−0.4313
954.09.2140.0949147.5833.8069.16−3.3880−1.42900.7084713.6523−4.08520.2206
1050.67.9120.0949126.5025.4446.873.80102.03561.256923−1.5804−0.8723−0.0309
1152.48.1120.0949126.5027.2850.712.26510.77271.8012404.82700.1599−0.8179
1250.18.5120.0949126.5024.9448.994.52900.75733.103729−2.2852−1.56130.2094
1349.08.8120.0949126.5023.8548.602.66222.3338−1.713725−2.3446−1.7236−1.1794
1453.89.5130.0949137.0431.1565.55−3.5548−1.59420.7865136.41760.5759−0.6511
1554.09.2150.0949158.1236.2174.10−3.3880−1.42900.7084172.11851.9107−0.1541
1654.19.5140.0949147.5833.9471.27−3.5198−1.53160.792531−0.7382−0.59800.3733
1753.89.5110.0949115.9626.3655.462.15183.5466−2.6997340.59182.4826−2.2313
1847.37.5130.0949137.0424.0843.463.97681.46882.026722−2.3484−1.7393−1.0638
1954.49.6140.0949147.5834.3072.53−3.4823−1.49110.680421−2.0411−1.36960.8058
2050.38.9110.0949115.9623.0446.974.71570.50843.333150.01753.24840.3644
2154.510.0130.0949137.0431.9769.89−3.3296−1.2211−0.1283272.11851.9107−0.1541
2254.09.9130.0949137.0431.3868.26−3.4365−1.46520.676630−0.58190.25481.3118
2354.110.0140.0949147.5833.9274.35−2.8117−0.5214−0.173538−2.2852−1.56130.2094
2453.49.3130.0949137.0430.7463.68−2.06190.6111−1.49608−0.7382−0.59800.3733
2554.09.8130.0949137.0431.3867.68−3.5548−1.59420.786514−2.3446−1.7236−1.1794
2654.09.8130.0949137.0431.3867.68−2.8117−0.5214−0.173510.12903.26380.2358
2750.49.5130.0949137.0427.3458.802.15183.5466−2.6997321.27300.65430.5863
2851.08.8120.0949126.5025.8451.944.14361.58512.16613−1.18202.68690.6168
2954.69.4140.0949147.5834.5571.71−3.4018−1.40430.381416−2.3308−1.7119−1.5686
3054.19.7120.0949126.5029.0862.14−2.06190.6111−1.496026−1.5804−0.8723−0.0309
3154.29.9120.0949126.5029.1663.35−2.2736−0.3779−0.35893613.6523−4.08520.2206
3253.29.6130.0949137.0430.4664.90−0.91980.8538−1.5104100.01753.24840.3644
3354.010.0140.0949147.5833.8074.12−3.3296−1.2211−0.128341.24433.4173−2.4650
3452.39.3120.0949126.5027.1856.712.26510.77271.801220.12903.26380.2358
3553.49.5120.0949126.5028.3359.76−0.91980.8538−1.510424−0.58190.25481.3118
3650.09.5100.0949105.4120.7044.6413.1415−7.9270−2.4761181.24433.4173−2.4650
3753.89.5140.0949147.5833.5570.59−3.5172−1.55320.7565121.63513.2526−0.4513
3853.810.0140.0949147.5833.5573.67−3.4018−1.40430.38149−2.2906−1.6971−1.1064
3953.59.9130.0949137.0430.8167.21−3.4365−1.46520.6766110.59182.4826−2.2313
4052.09.2120.0949126.5026.8655.671.25721.4553−1.144119−2.3184−1.6708−1.0029

References

  1. Kumar, L.; Mutanga, O. Remote Sensing of Above-Ground Biomass. Remote Sens. 2017, 9, 935. [Google Scholar] [CrossRef] [Green Version]
  2. Forkuor, G.; Benewinde Zoungrana, J.B.; Dimobe, K.; Ouattara, B.; Vadrevu, K.P.; Tondoh, J.E. Above-ground biomass mapping in West African dryland forest using Sentinel-1 and 2 datasets—A case study. Remote Sens. Environ. 2020, 236, 111496. [Google Scholar] [CrossRef]
  3. Kumar, L.; Sinha, P.; Taylor, S.; Alqurashi, A.F. Review of the use of remote sensing for biomass estimation to support renewable energy generation. J. Appl. Remote Sens. 2015, 9, 097696. [Google Scholar] [CrossRef]
  4. Thenkabail, P.S.; Stucky, N.; Griscom, B.W.; Ashton, M.S.; Diels, J.; Van der Meer, B.; Enclona, E. Biomass estimations and carbon stock calculations in the oil palm plantations of African derived savannas using IKONOS data. Int. J. Remote Sens. 2004, 25, 5447–5472. [Google Scholar] [CrossRef]
  5. Ningthoujam, R.K.; Joshi, P.K.; Roy, P.S. Retrieval of forest biomass for tropical deciduous mixed forest using ALOS PALSAR mosaic imagery and field plot data. Int. J. Appl. Earth Obs. Geoinf. 2018, 69, 206–216. [Google Scholar] [CrossRef]
  6. Ploton, P.; Pélissier, R.; Proisy, C.; Flavenot, T.; Barbier, N.; Rai, S.N.; Couteron, P. Assessing aboveground tropical forest biomass using Google Earth canopy images. Ecol. Appl. 2012, 22, 993–1003. [Google Scholar] [CrossRef] [PubMed] [Green Version]
  7. Lu, J.; Wang, H.; Qin, S.; Cao, L.; Pu, R.; Li, G.; Sun, J. Estimation of aboveground biomass of Robinia pseudoacacia forest in the Yellow River Delta based on UAV and Backpack LiDAR point clouds. Int. J. Appl. Earth Obs. Geoinf. 2020, 86, 102014. [Google Scholar] [CrossRef]
  8. Proisy, C.; Couteron, P.; Fromard, F. Predicting and mapping mangrove biomass from canopy grain analysis using Fourier-based textural ordination of IKONOS images. Remote Sens. Environ. 2007, 109, 379–392. [Google Scholar] [CrossRef]
  9. Puliti, S.; Hauglin, M.; Breidenbach, J.; Montesano, P.; Neigh, C.S.R.; Rahlf, J.; Solberg, S.; Klingenberg, T.F.; Astrup, R. Modelling above-ground biomass stock over Norway using national forest inventory data with ArcticDEM and Sentinel-2 data. Remote Sens. Environ. 2020, 236, 111501. [Google Scholar] [CrossRef]
  10. Morel, A.C.; Fisher, J.B.; Malhi, Y. Evaluating the potential to monitor aboveground biomass in forest and oil palm in Sabah, Malaysia, for 2000–2008 with Landsat ETM+ and ALOS-PALSAR. Int. J. Remote Sens. 2012, 33, 3614–3639. [Google Scholar] [CrossRef]
  11. Singh, M.; Malhi, Y.; Bhagwat, S. Evaluating land use and aboveground biomass dynamics in an oil palm–dominated landscape in Borneo using optical remote sensing. J. Appl. Remote Sens. 2014, 8, 083695. [Google Scholar] [CrossRef] [Green Version]
  12. García, M.; Saatchi, S.; Ustin, S.; Balzter, H. Modelling forest canopy height by integrating airborne LiDAR samples with satellite Radar and multispectral imagery. Int. J. Appl. Earth Obs. Geoinf. 2018, 66, 159–173. [Google Scholar] [CrossRef]
  13. Wang, G.; Guan, D.; Xiao, L.; Peart, M.R. Forest biomass-carbon variation affected by the climatic and topographic factors in Pearl River Delta, South China. J. Environ. Manag. 2019, 232, 781–788. [Google Scholar] [CrossRef] [PubMed]
  14. Singh, M.; Malhi, Y.; Bhagwat, S. Biomass estimation of mixed forest landscape using a Fourier transform texture-based approach on very-high-resolution optical satellite imagery. Int. J. Remote Sens. 2014, 35, 3331–3349. [Google Scholar] [CrossRef]
  15. Ganivet, E.; Bloomberg, M. Towards rapid assessments of tree species diversity and structure in fragmented tropical forests: A review of perspectives offered by remotely-sensed and field-based data. For. Ecol. Manag. 2019, 432, 40–53. [Google Scholar] [CrossRef]
  16. Singh, M.; Evans, D.; Friess, D.; Tan, B.; Nin, C. Mapping Above-Ground Biomass in a Tropical Forest in Cambodia Using Canopy Textures Derived from Google Earth. Remote Sens. 2015, 7, 5057–5076. [Google Scholar] [CrossRef] [Green Version]
  17. Barbier, N.; Couteron, P. Attenuating the bidirectional texture variation of satellite images of tropical forest canopies. Remote Sens. Environ. 2015, 171, 245–260. [Google Scholar] [CrossRef]
  18. Ploton, P.; Barbier, N.; Couteron, P.; Antin, C.M.; Ayyappan, N.; Balachandran, N.; Barathan, N.; Bastin, J.F.; Chuyong, G.; Dauby, G.; et al. Toward a general tropical forest biomass prediction model from very high resolution optical satellite images. Remote Sens. Environ. 2017, 200, 140–153. [Google Scholar] [CrossRef]
  19. Guo, W.; Rees, W.G. Altitudinal forest-tundra ecotone categorization using texture-based classification. Remote Sens. Environ. 2019, 232, 111312. [Google Scholar] [CrossRef]
  20. Bugnicourt, P.; Guitet, S.; Santos, V.F.; Blanc, L.; Sotta, E.D.; Barbier, N.; Couteron, P. Using textural analysis for regional landform and landscape mapping, Eastern Guiana Shield. Geomorphology 2018, 317, 23–44. [Google Scholar] [CrossRef]
  21. Chong, K.L.; Kanniah, K.D.; Pohl, C.; Tan, K.P. A review of remote sensing applications for oil palm studies. Geo-Spat. Inf. Sci. 2017, 20, 184–200. [Google Scholar] [CrossRef] [Green Version]
  22. Liang, L.; Di, L.; Zhang, L.; Deng, M.; Qin, Z.; Zhao, S.; Lin, H. Estimation of crop LAI using hyperspectral vegetation indices and a hybrid inversion method. Remote Sens. Environ. 2015, 165, 123–134. [Google Scholar] [CrossRef]
  23. Vaglio Laurin, G.; Puletti, N.; Chen, Q.; Corona, P.; Papale, D.; Valentini, R. Above ground biomass and tree species richness estimation with airborne lidar in tropical Ghana forests. Int. J. Appl. Earth Obs. Geoinf. 2016, 52, 371–379. [Google Scholar] [CrossRef] [Green Version]
  24. Navarro, J.A.; Algeet, N.; Fernández-Landa, A.; Esteban, J.; Rodríguez-Noriega, P.; Guillén-Climent, M.L. Integration of UAV, Sentinel-1, and Sentinel-2 Data for Mangrove Plantation Aboveground Biomass Monitoring in Senegal. Remote Sens. 2019, 11, 77. [Google Scholar] [CrossRef] [Green Version]
  25. Zhang, W.; Goh, A.T.C. Multivariate adaptive regression splines and neural network models for prediction of pile drivability. Geosci. Front. 2016, 7, 45–52. [Google Scholar] [CrossRef] [Green Version]
  26. Chen, L.; Wang, Y.; Ren, C.; Zhang, B.; Wang, Z. Optimal Combination of Predictors and Algorithms for Forest Above-Ground Biomass Mapping from Sentinel and SRTM Data. Remote Sens. 2019, 11, 414. [Google Scholar] [CrossRef] [Green Version]
  27. Friedman, J.H. Multivariate Adaptive Regression Splines. Ann. Stat. 1991, 19, 1–67. [Google Scholar] [CrossRef]
  28. López Serrano, P.; Corral-Rivas, J.J.; Díaz Varela, R.; Álvarez González, J.G.; López-Sánchez, C. Evaluation of Radiometric and Atmospheric Correction Algorithms for Aboveground Forest Biomass Estimation Using Landsat 5 TM Data. Remote Sens. 2016, 8, 369. [Google Scholar] [CrossRef] [Green Version]
  29. Piikki, K.; Söderström, M. Digital soil mapping of arable land in Sweden—Validation of performance at multiple scales. Geoderma 2019, 352, 342–350. [Google Scholar] [CrossRef]
  30. Leathwick, J.R.; Elith, J.; Hastie, T. Comparative performance of generalized additive models and multivariate adaptive regression splines for statistical modelling of species distributions. Ecol. Model. 2006, 199, 188–196. [Google Scholar] [CrossRef]
  31. Pramila, P.V.; Mahesh, V. Comparison of Multivariate Adaptive Regression Splines and Random Forest Regression in Predicting Forced Expiratory Volume in One Second. Int. J. Bioeng. Life Sci. 2015, 9, 338–342. [Google Scholar] [CrossRef]
  32. Wang, L.J.; Guo, M.; Sawada, K.; Lin, J.; Zhang, J. Landslide susceptibility mapping in Mizunami City, Japan: A comparison between logistic regression, bivariate statistical analysis and multivariate adaptive regression spline models. CATENA 2015, 135, 271–282. [Google Scholar] [CrossRef]
  33. Park, S.; Hamm, S.Y.; Jeon, H.T.; Kim, J. Evaluation of Logistic Regression and Multivariate Adaptive Regression Spline Models for Groundwater Potential Mapping Using R and GIS. Sustainability 2017, 9, 1157. [Google Scholar] [CrossRef] [Green Version]
  34. García Nieto, P.J.; García–Gonzalo, E.; Sánchez Lasheras, F.; Paredes–Sánchez, J.P.; Riesgo Fernández, P. Forecast of the higher heating value in biomass torrefaction by means of machine learning techniques. J. Comput. Appl. Math. 2019, 357, 284–301. [Google Scholar] [CrossRef]
  35. Pardé, J.; Bouchon, J. Dendrométrie, 2nd ed.; Ecole Nationale du génie rural, des Eaux et Forêts: Nancy, France, 1988; p. 328. ISBN 2-85710-025-6. [Google Scholar]
  36. Migolet, P.; Goïta, K.; Ngomanda, A.; Mekui Biyogo, A.P. Estimation of Aboveground Oil Palm Biomass in a Mature Plantation in the Congo Basin. Forests 2020, 11, 544. [Google Scholar] [CrossRef]
  37. Couteron, P.; Barbier, N.; Gautier, D. Textural Ordination Based on Fourier Spectral Decomposition: A Method to Analyze and Compare Landscape Patterns. Landsc. Ecol. 2006, 21, 555–567. [Google Scholar] [CrossRef]
  38. Renshaw, E.; Ford, E.D. The Interpretation of Process from Pattern Using Two-Dimensional Spectral Analysis: Methods and Problems of Interpretation. J. R. Stat. Soc. Ser. C 1983, 32, 51–63. [Google Scholar] [CrossRef]
  39. Mugglestone, M.A.; Renshaw, E. Detection of geological lineations on aerial photographs using two-dimensional spectral analysis. Comput. Geosci. 1998, 24, 771–784. [Google Scholar] [CrossRef]
  40. Couteron, P.; Pelissier, R.; Nicolini, E.A.; Paget, D. Predicting tropical forest stand structure parameters from Fourier transform of very high-resolution remotely sensed canopy images. J. Appl. Ecol. 2005, 42, 1121–1128. [Google Scholar] [CrossRef] [Green Version]
  41. Barbier, N.; Couteron, P.; Proisy, C.; Malhi, Y.; Gastellu-Etchegorry, J.P. The variation of apparent crown size and canopy heterogeneity across lowland Amazonian forests. Glob. Ecol. Biogeogr. 2010, 19, 72–84. [Google Scholar] [CrossRef]
  42. Barbier, N.; Couteron, P.; Gastelly-Etchegorry, J.P.; Proisy, C. Linking canopy images to forest structural parameters: Potential of a modeling framework. Ann. For. Sci. 2012, 69, 305–311. [Google Scholar] [CrossRef] [Green Version]
  43. Kuyah, S.; Dietz, J.; Muthuri, C.; Jamnadass, R.; Mwangi, P.; Coe, R.; Neufeldt, H. Allometric equations for estimating biomass in agricultural landscapes: I. Aboveground biomass. Agric. Ecosyst. Environ. 2012, 158, 216–224. [Google Scholar] [CrossRef]
  44. Nisbet, R.; Miner, G.; Yale, K.; Nisbet, R. Advanced Algorithms for Data Mining. In Handbook of Statistical Analysis and Data Mining Applications, 2nd ed.; Elsevier: London, UK, 2018; pp. 149–167. ISBN 978-0-12-416632-5. [Google Scholar] [CrossRef]
  45. Nguyen, T.H.; Jones, S.D.; Soto-Berelov, M.; Haywood, A.; Hislop, S. Monitoring aboveground forest biomass dynamics over three decades using Landsat time-series and single-date inventory data. Int. J. Appl. Earth Obs. Geoinf. 2020, 84, 101952. [Google Scholar] [CrossRef]
  46. Xiong, Y.; Cakir, R.; Phan, S.M.; Ola, A.; Krauss, K.W.; Lovelock, C.E. Global patterns of tree stem growth and stand aboveground wood production in mangrove forests. For. Ecol. Manag. 2019, 444, 382–392. [Google Scholar] [CrossRef]
  47. Chen, W.; Zhao, H.; Li, J.; Zhu, L.; Wang, Z.; Zeng, J. Land use transitions and the associated impacts on ecosystem services in the Middle Reaches of the Yangtze River Economic Belt in China based on the geo-informatic Tupu method. Sci. Total Environ. 2020, 701, 134690. [Google Scholar] [CrossRef] [PubMed]
  48. Bastin, J.F.; Barbier, N.; Couteron, P.; Adams, B.; Shapiro, A.; Bogaert, J.; De Cannière, C. Aboveground biomass mapping of African forest mosaics using canopy texture analysis: Toward a regional approach. Ecol. Appl. 2014, 24, 1984–2001. [Google Scholar] [CrossRef] [PubMed]
  49. Liu, C.C.; Kamei, A.; Hsu, K.H.; Tsuchida, S.; Huang, H.M.; Kato, S.; Nakamura, R.; Wu, A.M. Vicarious calibration of the Formosat-2 remote sensing instrument. IEEE Trans. Geosci. Remote Sens. 2010, 48, 2162–2169. [Google Scholar] [CrossRef]
  50. Cooley, S.; Smith, L.; Stepan, L.; Mascaro, J. Tracking Dynamic Northern Surface Water Changes with High-Frequency Planet CubeSat Imagery. Remote Sens. 2017, 9, 1306. [Google Scholar] [CrossRef] [Green Version]
  51. De Berchoux, C.; Quencez, P. Etude de la croissance en hauteur’ huile en Côte-d’ Ivoire du palmier a Application pratique au problème de la replantation. Oléagineux 1980, 35, 431–438. [Google Scholar]
  52. Jacquemard, J.C.; Baudouin, L. Contribution à l’étude de la croissance du palmier à huile. Présentation d’un modèle descriptif. Oléagineux 1987, 42, 343–351. [Google Scholar]
  53. Masani, M.Y.A.; Izawati, A.M.D.; Rasid, O.A.; Parveez, G.K.A. Biotechnology of oil palm: Current status of oil palm genetic transformation. Biocatal. Agric. Biotechnol. 2018, 15, 335–347. [Google Scholar] [CrossRef]
  54. Volkan Bilgili, A.; van Es, H.M.; Akbas, F.; Durak, A.; Hively, W.D. Visible-near infrared reflectance spectroscopy for assessment of soil properties in a semi-arid area of Turkey. J. Arid Environ. 2010, 74, 229–238. [Google Scholar] [CrossRef]
  55. García Nieto, P.J.; Martínez Torres, J.; De Cos Juez, F.J.; Sánchez Lasheras, F. Using multivariate adaptive regression splines and multilayer perceptron networks to evaluate paper manufactured using Eucalyptus globulus. Appl. Math. Comput. 2012, 219, 755–763. [Google Scholar] [CrossRef]
  56. Al-Sudani, Z.A.; Salih, S.Q.; Sharafati, A.; Yaseen, Z.M. Development of multivariate adaptive regression spline integrated with differential evolution model for streamflow simulation. J. Hydrol. 2019, 573, 1–12. [Google Scholar] [CrossRef]
  57. Xu, M.; Zhang, S.; Wen, J.; Yang, X. Multiscale spatial patterns of species diversity and biomass together with their correlations along geographical gradients in subalpine meadows. PLoS ONE 2019, 14, e0211560. [Google Scholar] [CrossRef] [PubMed] [Green Version]
Figure 1. Study site location.
Remotesensing 12 02926 g001
Figure 2. Plot sampling scheme.
Remotesensing 12 02926 g002
Figure 3. Organizational flowchart for the study.
Remotesensing 12 02926 g003
Figure 4. Nyquist and spatial frequencies as a function of mean r-spectra for window sizes ranging from 24 to 38 pixels for PlanetScope (top row) and 38 to 60 pixels for FORMOSAT-2 (bottom row).
Remotesensing 12 02926 g004
Figure 5. Spatial frequencies as a function of mean r-spectra from Fourier transformations in textural ordination (FOTO) analysis of the near infrared spectral bands of PlanetScope and FORMOSAT-2 (a); variance proportions explained by the 3 principal components (PCs) (b); ordination of plot scores on PCs 1 and 2 for FORMOSAT-2 (c) and PlanetScope (d).
Remotesensing 12 02926 g005
Figure 6. FOTO maps of oil palm canopy texture derived from actual RGB values of the FOTO indices of FORMOSAT-2 (a) and PlanetScope (b).
Remotesensing 12 02926 g006
Figure 7. Relationships between oil palm structural parameters obtained from the field plots and PC1 derived from PlanetScope and FORMOSAT-2 images.
Remotesensing 12 02926 g007
Figure 8. Multispectral satellite image of the study area (a) and aboveground oil palm biomass map derived with MARS (Model 3) from FORMOSAT-2 FOTO indices (b).
Remotesensing 12 02926 g008
Table 1. Descriptive statistics for measurements taken from 510 oil palms distributed across 40 sample plots. DBH is diameter at breast height, HT is stem height, NP is the number of stems per plot, D is the density of palm trees per hectare, BA is basal area and AGB is total dry aboveground biomass calculated from in situ measurements using Equation (1).
ParameterDBH (cm)HT
(m)
NPD
(stem ha−1)
BA
(m2 ha−1)
AGB
(t ha−1)
Mean52.49.31313429.260.8
Minimum47.37.51010518.735.9
Maximum55.010.01515836.275.1
Standard deviation2.10.61124.210.4
Table 2. Correlations between FOTO FORMOSAT-2 and PlanetScope indices versus structural parameters of oil palm. The table summarizes coefficients of determination (R2), and their associated P-values (P). PC1, PC2 and PC3 are, respectively, the principal component scores of axes 1, 2 and 3 of the principal component analysis (PCA) of the r-spectra of the 2D Fourier transform analysis.
ParameterFORMOSAT-2PlanetScope
PC1PC2PC3PC1PC2PC3
R2PR2PR2PR2PR2PR2P
Basal area (m2 ha−1)0.84<0.00010.0400.2914.10−40.9150.68<0.00010.1630.0270.0220.430
DBH (cm)0.78<0.00010.0420.2800.0220.4380.64<0.00010.1250.0550.0050.724
HT (m)0.56<0.00010.0200.4600.1290.0510.53<0.00010.0750.1440.0010.840
Density (oil palm ha−1)0.54<0.00010.0030.7720.0160.5070.50<0.00010.0830.1220.0290.369
Table 3. Multiple linear regression models developed for estimating aboveground oil palm biomass using indices estimated by textural ordinations on Fourier transforms (FOTO), which were produced from PlanetScope and FORMOSAT-2 images. The constants a, b1, b2, and b3 are coefficients of the respective multiple linear regressions (MLR) equations. RMSE (tons ha−1) is the Root-Mean-Square-Error and %RMSE is its percentage. p-values are calculated at a significance level of 5%.
Modelab1b2b3R2p-ValueRMSE%RMSE
M o d e l   1   ( M L R   F O R M O S A T 2 ) :
A G B = a + b 1 × P C 1 + b 2 × P C 2 + b 3 × P C 3
61.548−2.369−0.450−0.4090.86<0.00014.036.70
M o d e l   2   ( M L R   P l a n e t S c o p e ) : A G B = a + b 1 × P C 1 + b 2 × P C 2 + b 3 + P C 3 62.923−2.271−1.8890.5340.83<0.00013.775.98
Table 4. Aboveground biomass models estimated using multivariate adaptive spline regressions (MARS).
MODELEquationR2p-ValueRMSE
(t.ha−1)
%RMSE
MARS models using FOTO indices of FORMOSAT-2
Model 3 A G B = 70.415 3.287 × m a x ( 0 ;   P C 1 + 3.555 ) + 4.871 × m a x ( 0 ;   P C 2 0.508 ) 0.531 × m a x ( 0 ;   P C 1 + 3.555 ) × m a x ( 0 ;   0.708 P C 3 ) + 1.807 × m a x ( 0 ;   0.508 P C 2 ) × m a x ( 0 ;   0.708 P C 3 )   0.90<0.00013.335.47
Model 4 A G B = 70.933 3.354 × m a x ( 0 ;   P C 1 + 3.555 ) + 4.873 × m a x ( 0 ;   P C 2 0.508 ) 0.541 × m a x ( 0 ;   P C 1 + 3.555 ) × m a x ( 0 ;   0.708 P C 3 ) + 0.353 × m a x ( 0 ;   P C 1 + 3 , 555 ) × m a x ( 0 ;   0.508 P C 2 )     0.90<0.00013.365.52
Model 5 A G B = 68.913 2 , 436 × m a x ( 0 ;   P C 1 + 3.555 ) + 1.848 × m a x ( 0 ;   P C 2 0.508 ) + 1 , 304 × m a x ( 0 ;   0.508 P C 2 ) 1.515 × m a x ( 0 ;   P C 3 0.708 ) 1.187 × m a x ( 0 ;   0.7084 P C 3 )   0.89<0.00013.575.87
MARS models using FOTO indices of PlanetScope
Model 6 A G B = 98.714 2.764 × m a x ( 0 ;   P C 1 + 1.182 ) + 1.311 × m a x ( 0 ; 1.182 P C 1 ) 3.154 × m a x ( 0 ;   P C 2 + 4.085 ) + 0.189 × m a x ( 0 ;   P C 1 + 1.182 ) × m a x ( 0 ;   P C 2 + 4.085 ) + 5.299 × m a x ( 0 ; 1.182 P C 1 ) × m a x ( 0 ;   P C 3 + 0.031 ) 7 , 189 × m a x ( 0 ; 1.182 P C 1 ) × m a x ( 0 ; 0.031 P C 3 ) + 1.786 × m a x ( 0 ;   P C 2 + 4.085 ) × m a x ( 0 ;   P C 3 + 0.031 ) 1.386 × m a x ( 0 ;   P C 2 + 4.085 ) × m a x ( 0 ; 0.031 P C 3 ) 8 , 953 × m a x ( 0 ;   P C 3 + 2.231 )   0.87<0.00013.335.31
Model 7 A G B = 76.574 2 , 727 × m a x ( 0 ;   P C 1 + 1.182 ) + 3.191 × m a x ( 0 ; 1.182 P C 1 ) 2.808 × m a x ( 0 ;   P C 2 + 4 , 085 ) + 0.071 × m a x ( 0 ;   P C 1 + 1.182 ) × m a x ( 0 ;   P C 2 + 4.085 ) + 0.245 × m a x ( 0 ; 1 , 182 P C 1 ) × m a x ( 0 ;   P C 3 + 0.031 ) 2 , 678 × m a x ( 0 ; 1 , 182 P C 1 ) × m a x ( 0 ; 0.031 P C 3 ) + 0.096 × m a x ( 0 ;   P C 1 + 1.182 ) × m a x ( 0 ;   P C 2 + 4.085 ) × m a x ( 0 ;   P C 3 + 2.231 )   0.87<0.00013.365.37
Model 8 A G B = 74.739 2.346 × m a x ( 0 ;   P C 1 + 1.182 ) + 1.867 × m a x ( 0 ; 1.182 P C 1 ) 1.981 × m a x ( 0 ;   P C 2 + 4.085 ) 1.170 × m a x ( 0 ;   P C 3 + 0.031 ) 1.262 × m a x ( 0 ; 0.031 P C 3 )   0.84<0.00013.745.97
Table 5. Validation of aboveground biomass models.
ModelR2p-ValueRMSE
(t ha−1)
%RMSE
Model 1 (MLR FORMOSAT-2)0.850.00014.186.56
Model 2 (MLR PlanetScope)0.810.00045.4510.11
MARS model validation for FORMOSAT-2
Model 30.92<0.00013.886.09
Model 40.91< 0.00013.976.24
Model 50.89<0.00014.086.40
MARS model validation for PlanetScope
Model 60.820.00034.598.51
Model 70.800.00054.989.24
Model 80.820.00035.119.47

