1. Introduction
1.1. Public Transport Networks
Public transportation is essential for the daily operation of society and is also considered a viable way to address the environmental issues that are caused by the increasing number of private vehicles. Due to its significance for sustainable development, public transport (PT) is being advocated by many countries, regions, and organisations, such as the UN-Habitat [
1]. A PT network is a network formed by various types of PT, such as buses and trains, and an optimised PT network can not only provide residents easy access to PT but also help better address environmental issues and contribute to the sustainability of society. However, optimising a PT network is associated with uncertainty and risk, which can have great impacts on optimising outcomes.
The amount of recent research on PT decision making under uncertain conditions is increasing, with a focus on identifying the level of uncertainty that is associated with system input variables [
2,
3]. Additionally, in the PT multicriteria optimisation decision making problem, current research only considers one or two processes in terms of evaluation, optimisation, and uncertainty [
3,
4,
5,
6]. Studies about combining these three processes are limited. Therefore, this study’s integration of evaluation, optimisation, and uncertainty processes in PT performance within a novel framework provides improved performance.
1.2. Uncertainty and Risks in Public Transport Networks
The delivery of optimised results is, in practice, impacted by the uncertainty of events. Uncertainty and variation are problematic when trying to optimise PT networks’ performance. According to Altieri et al. (2017), PT is a complex system, whose quality analysis is challenging because it must consider the risks and uncertainties that are associated with human reasoning [
7]. Additionally, there are numerous risks and uncertainties associated with user demand, operations, and traffic conditions that must be considered when PT performance improvement is being considered [
8]. Therefore, whenever a PT optimisation model is developed to replicate a complex system, its output will always be uncertain.
Uncertainty is usually related to risk, which is defined as the influence of uncertainty on objectives or criteria [
9,
10,
11]. Appropriate identification of major sources of risk can eliminate or at least reduce the probability of discovering new sources of uncertainty during the modelling process [
4]. Thus, the uncertainty or risk identification process of the criteria is required to deliver the project results. Risk management is the tool that provides methods for mitigating project risk.
Risk management employs both qualitative and quantitative techniques. Dalmau (2022) used risk management to forecast the likelihood of airspace user rerouting, which aids the flow manager in air traffic flow management [
12]. Similarly, Budzynski et al. (2021) examined PT’s response to hazards using a qualitative method, risk registers [
13]. To model the likelihood of project objectives, this study employs a quantitative risk management tool.
In the PT sector, risk management models have already been used to model input and uncertainty [
14,
15], and recent optimisation under uncertainty problems in PT frequently employs quantitative risk management methods, which assist DMs in determining the probability of the optimal solution [
16,
17].
1.3. Monte Carlo Simulation for Managing Uncertainty
Uncertainty cannot be fully investigated due to limited knowledge or the randomness of some model components. Monte Carlo simulation (MCS) is a quantitative risk analysis method based on a probabilistic model that employs probability distributions to model uncertainty [
18,
19]. The results assist DMs in managing risk and uncertainty to complete the project.
MCS is a risk management tool that is widely used in many fields, including medicine and project management. For example, MCS is used in medicine to assess the likelihood of viral transmission [
20]. Yang et al. (2020) employed MCS to model uncertainty in a project to assess the health of land ecosystems [
21]. Kannan et al. (2021) used MCS to analyse the sensitivity of VIKOR and grey relational analysis in a sustainable location of a solar site selection project [
22]. MCS is also used to improve the reliability of assessment results in a lake eutrophication level evaluation project [
23]. In most cases, MCS is used to assess the likelihood of project outcomes.
MCS has attracted the interest of PT researchers in recent years. For instance, Manzo et al. (2015) used MCS to analyse uncertainty in a four-stage transport model [
4]. This study focused on investigating how the uncertainty of model parameters and inputs influences the model outputs. Conway et al. (2018) utilised MCS to account for variation and uncertainty in accessibility metrics when planning PT sketches [
24]. Furthermore, Pencheva et al. (2021) applied MCS to determine the waiting time of passenger vehicles in PT areas [
25]. Research shows that despite the increased optimisation and uncertainty analysis of PT, the existing studies focus more on single aspects of PT. Consequently, an effective framework for optimising a PT network’s performance under uncertain conditions in multiple aspects is increasingly necessary to propose optimal plans and strategies while considering uncertainty.
1.4. Research Contribution
Probabilistic analysis is a commonly used technique for addressing evaluation-based issues in project management. MCS is also used in mitigating uncertainty that is related to model inputs and outputs in various application areas. Despite its effectiveness in addressing project management issues, little research has used MCS to address the problem of optimising PT network performance. This study only examines one aspect of physical performance. In PT network performance optimisation problems, the probability of a scenario (scenario analysis) is thus required.
Multiple-criteria decision making (MCDM) and goal programming (GP) methods provide a variety of frameworks, and a few MCDM and GP methods have been used to optimise PT performance to meet the goals and requirements of DMs [
5,
26,
27]. To solve multicriteria optimisation problems, the analytic hierarchy process (AHP) is an MCDM method that is frequently combined with the GP approach [
5,
27].
Previous research proposed the public transport criteria matrix (PTCM)-AHP-Multi-Aspiration-Level Goal Programming (MALGP) model for optimising PT networks’ performance [
27,
28]. The model considers the basic PT infrastructure level, sustainable development level, PT service level, and economic benefit level for optimisation. In some cases, due to uncertainty occurring during the optimisation process, it is difficult for DMs to deliver an optimal solution. Previous research lacks an analysis of uncertainty that is related to criteria uncertainty.
Despite the current literature, a multicriteria optimisation method that combines these three processes in PT optimisation under uncertain conditions is still lacking. In the pursuit of creating a comprehensive tool to optimise PT performance under ambiguous circumstances at various levels of aspiration, several important aspects of enhancing PT performance have been overlooked [
5,
16]. To bridge this gap, this study proposes a three-stage approach for optimising PT networks’ performance under uncertain conditions. The models optimise four levels of criteria with uncertainty to achieve the DMs’ PT network optimisation goals. The primary goal of this study is to determine the level of criteria uncertainty, and a sensitivity analysis is performed to guide the optimisation process. MCS results can be used to assist DMs in making PT network optimisation decisions, as well as to precisely indicate the probability of the uncertainty rate when delivering criteria outcomes.
Compared with the current research, this study introduces the following novel contributions: 1. The three-stage model framework considers multiple aspects of PT network criteria. 2. The three-stage model framework is developed to evaluate and optimise PT networks’ performance under uncertain conditions. 3. The validity of optimal solutions is examined in the case study areas.
The remainder of this paper is organised as follows:
Section 2 explains the framework of the proposed three-stage PT network performance optimisation under uncertain conditions.
Section 3 presents the input data of the three case study areas.
Section 4 discusses the analysis results of the three case study areas, and the conclusions and future directions of the research are presented in
Section 5.
2. Materials and Methods
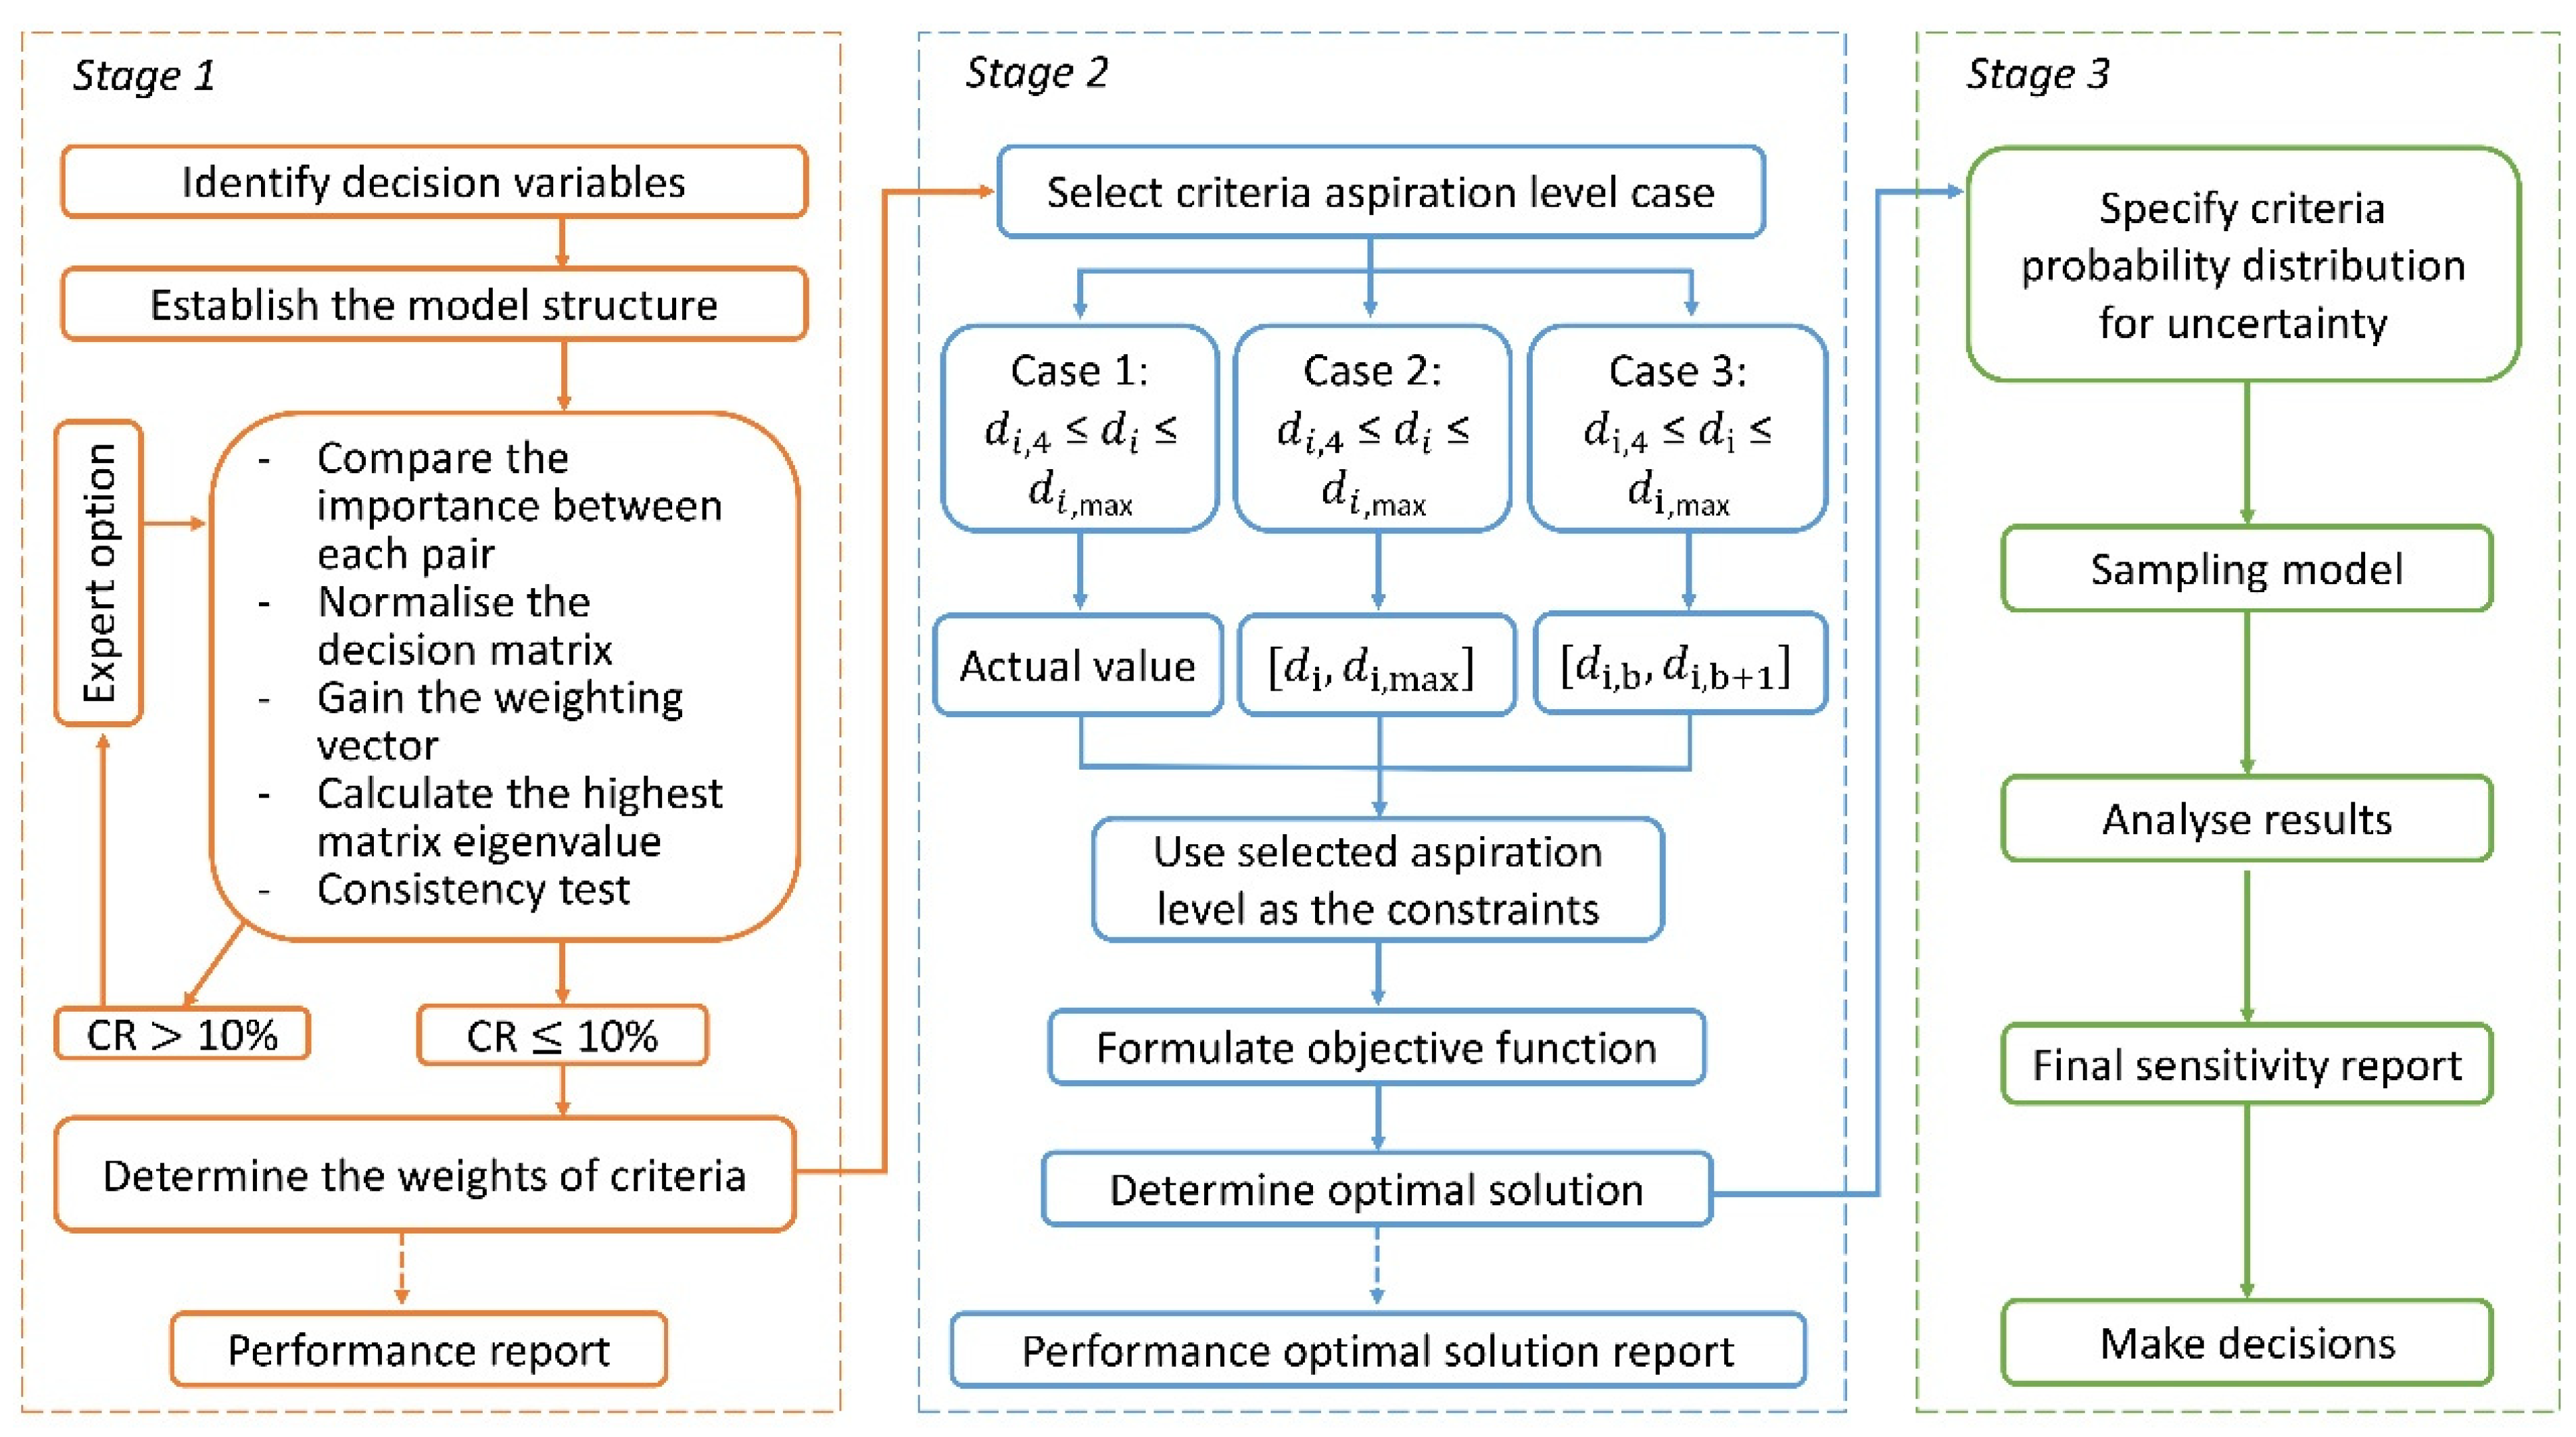
In this study, we combine the PTCM-AHP, MALGP, and MCS models into a three-stage framework to optimise PT networks’ performance under uncertain conditions. PT networks face significant challenges in achieving optimal outcomes due to the presence of risk and uncertainty. Despite the importance of optimising PT networks’ performance, there has been limited research that applies risk management tools to tackle this issue. In response, this research presents a three-stage framework to optimise PT networks’ performance under uncertain conditions. First, we use the established PT network criteria matrix. Second, we propose a MALGP approach to optimise PT networks’ performance based on the weighted results. To manage uncertainty, we use MCS to analyse the probability of the optimal solution. The results of this research offer significant insights into identifying the likelihood of criteria optimisation scenarios, thereby assisting DMs in allocating resources for optimising the delivery of PT network performance solutions in accordance with government requirements.
Figure 1 depicts the three-stage approach for optimising the uncertain PT network performance, which includes an AHP process, a MALGP process, and an MCS process. The following sections review the specifics of each stage.
2.1. AHP Process
AHP is a structured model for analysing and solving complex decision issues [
29,
30]. To implement AHP to solve problems, there are three steps: criteria priority weight calculation, issue decomposition, and criteria comparison analysis [
31]. In this study, first, the model decomposes the PT network performance evaluation problem into numerous levels. Second, to obtain the weight of each criterion, the model uses pairwise comparisons that assign the relative importance between two criteria [
29,
30,
32]. Based on the AHP process, the PTCM-AHP model was proposed to evaluate a PT network’s performance [
28]. The following subsections review the specifics of the AHP process.
2.1.1. PTCM-AHP Model Structure
The decision variables of the AHP model have been described by Lin et al. (2021) [
28]. Additional details of the PT network performance criteria can be found in Lin et al. (2021) [
28]. The criteria were selected from existing PT evaluation assessments and indices [
33,
34,
35,
36,
37]. These criteria are used to determine the PTCM-AHP model structure.
The PTCM-AHP model is based on four levels: the basic PT infrastructure level, the PT service level, the economic benefit level, and the sustainable development level [
28].
Figure 2 presents the hierarchy of the PT network performance criteria of the PTCM-AHP model. The model includes 4 levels of criteria and 15 subcriteria.
The PT infrastructure level includes the harbour-type bus stop setting ratio, PT coverage ratio, PT priority lane setting ratio, and PT network ratio.
The PT service level contains four subcriteria: passenger freight rate, PT on-time ratio, PT driving accident rate, and peak hours intersection blocking rate.
The economic benefit level contains the intact car rate, coverage ratio, and bus ownership rate.
The level of sustainable development considers the PT utilisation rate, PT energy intensity, PT land area per capita, and green PT vehicle rate.
Once the PTCM-AHP model structure was established, the process of determining criteria weights was undertaken to test and calculate the results of the weightings. The details of the weighting process are shown in the following section.
2.1.2. Criteria Weight Determination
The major steps for determining the weights of criteria are described below [
28].
- (1)
Construct the problem in a hierarchical structure and determine the criteria and subcriteria.
- (2)
Create the decision matrix and perform pairwise comparison between criteria and subcriteria. indicates the importance values for criteria and , which are between 1 and 9, provided by experts.
- (3)
Normalise the decision matrix
to be matrix
:
- (4)
Calculate the arithmetic mean of matrix
rows to obtain the prioritisation vector (
):
- (5)
Fulfil the calculation result of the highest matrix eigenvalue
:
- (6)
Verify the consistency of the results. Hence, the consistency ratio (
CR) must be calculated. RI is the random index. The formulations of the consistency index (
CI) and CR for each matrix
are shown below:
- (7)
Repeat steps 2–6 until . When , the model result is deemed internally coherent.
Hence, we can eventually identify the weight of the PTCM-AHP model criteria and subcriteria, which are used as coefficient values in the MALGP process. The case study area’s performance report is also created to identify the city’s PT network’s performance score and show each criterion’s performance score, which are calculated based on the case study areas’ criteria actual value. The results of the city performance report will be used to determine the criteria aspiration level used in the calculation of criteria goal values in the MALGP process. The criteria weights and performance results of the case study areas’ PTCM-AHP model results can be found in Lin et al. (2021) [
28].
2.2. Multi-Aspiration-Level Goal Programming (MALGP) Process
GP is often combined with AHP to assist DMs, which can address MCDM problems and identify optimal solutions [
38,
39]. The outputs of the AHP process are used to define the objective function criteria priority of GP [
5]. The model minimises the objective function by selecting the criteria aspiration level from numerous criterion input values [
5]. Based on GP, MCGP further develops a model that allows DMs to address multiple goals or aspiration levels per criterion [
40,
41,
42,
43]. However, MCGP does not consider the selection of a criterion goal level among various aspiration-level cases. Hence, the establishment of MALGP helps DMs choose different aspiration levels to solve the PT network performance optimisation problem [
27]. The model takes the selection of the criteria aspiration level into consideration to help DMs in performance optimisation. The MALGP process is shown below.
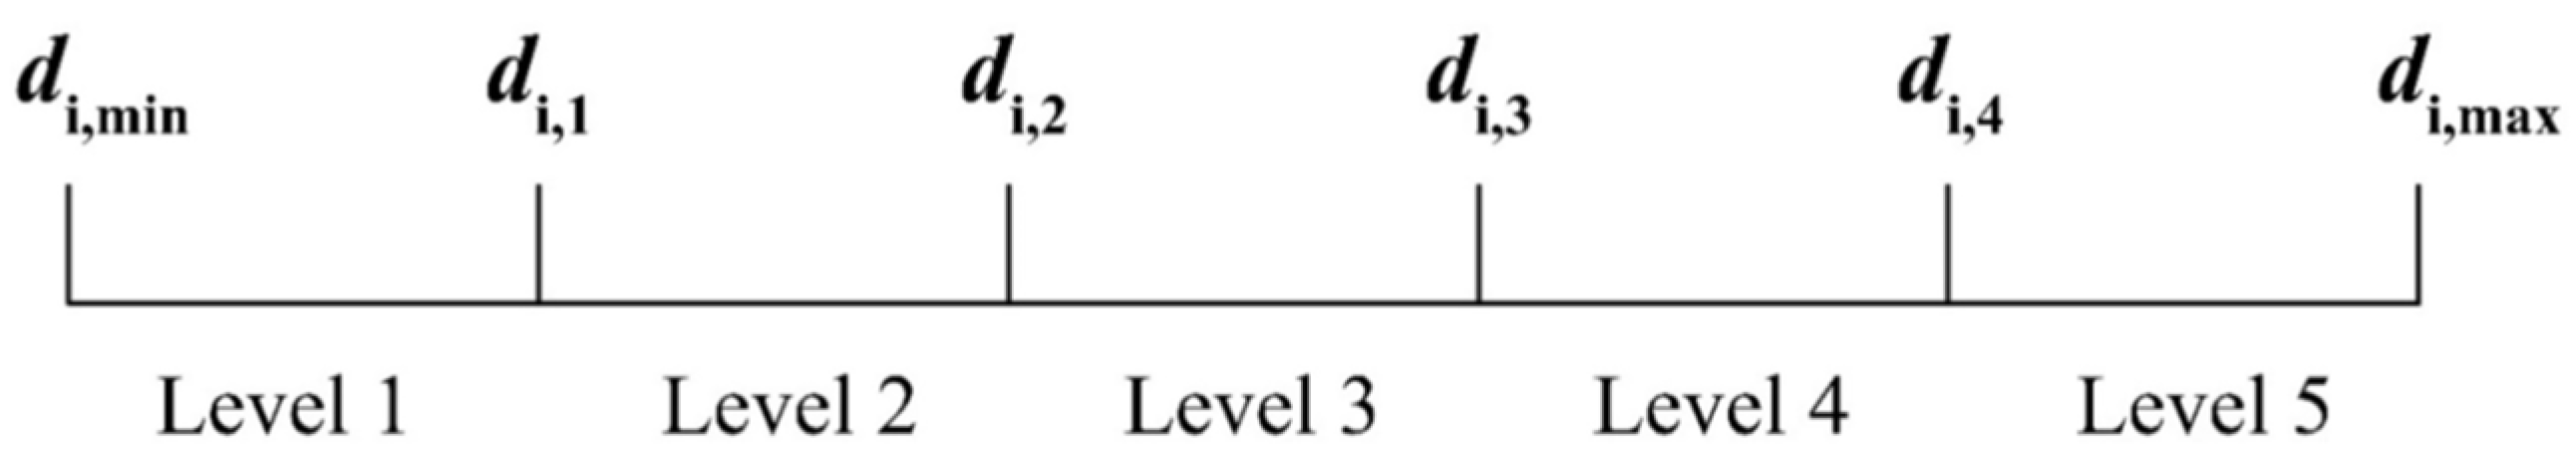
2.2.1. Criteria Aspiration Level Case Selection
The MALGP model includes the criterion case selection process. The aspiration level criterion is selected based on the actual value of the criteria. The details of the criteria-level grades can be found in Lin et al. (2021) [
28]. According to
Figure 3, the process contains three cases [
27].
Case 1: The actual value is the aspiration value for the ith criterion when the
ith criterion’s actual value is greater than ,max.
Case 2: The aspiration value of the th criterion is less than ,max but greater than the actual value when the actual value for the th criterion is less than ,max but greater than .
Case 3: The aspiration value of the th criterion is the th aspiration level when the actual value level for the th criterion is level 1, 2, 3, or 4.
Then, the criteria aspiration-level case of the model can be identified. In the calculation step, the conditions of the objective function formulation are based on the criteria aspiration-level selection results.
2.2.2. Objective Function Formulation
After the case selection process for the criteria aspiration level, we establish the objective function formulation for the PT network performance optimisation process. The MALGP model uses criteria weights as coefficients in the model’s objective function [
5]. The notations and formulation for the MALGP objective function are shown as follows [
27]:
Notations:
: criteria number, ;
: goal number, ;
: weight assigned for th priority;
: th decision variable;
: coefficient of the th criteria for the th goal;
: positive deviation;
: negative deviation;
: aspiration grade level for goal
,
.
subject to
Case 1: If the constraint of
is the actual value of the criterion,
Case 2: If the constraint of
is chosen between the criterion’s actual value and
,max,
Case 3: If the criterion’s actual value is less than
and the criterion’s goal value is less than
,max,
During the MALGP model process, the constraint functions are based on the selected grade for the criteria aspiration level and considering the relation of the criteria. The details of the case study areas’ objective functions and constraints can be found in Lin et al. (2022) [
27].
2.3. Monte Carlo Simulation (MCS) Process
In this process, we used MCS to model the probability of optimal scenario delivery. The proposed method was used to calculate the possibility of an optimal solution. MCS performs calculations, allowing for multiple simulations of a project. The process was used to quantitatively analyse project risk and identify the probability of the best solution by randomly selecting criteria values [
44,
45]. MCS analyses risk and uncertainty using a probability distribution. This study assumed that the DMs must control each criterion’s performance and that the criteria probability was within a range of −5%/+10%. The model outcomes were analysed to identify the probability of and confidence level for achieving the goals. The results are obtained using @risk software Version 8.3. The details of the MCS process are shown below.
2.3.1. Criteria Probability Distribution Identification
Before we begin simulating the optimisation results, we must first determine the probability of the criteria. The types of criteria probability distributions must be chosen during the identification process. According to
Figure 4, the criteria sampling process uses a triangular probability distribution because the minimum, most likely, and maximum values can be estimated. The MALGP process outputs are used as the most likely value of criteria in the MCS process.
Table 1 shows the criteria ratings for the uncertainty level, which can be used to calculate the minimum and maximum values of the criteria. The level of uncertainty is divided into five categories: very high, high, medium, low, and very low.
Thus, the criteria’s risk and uncertainty levels need to be identified. To determine the input of the criteria, the uncertainty and risk level of a criterion are selected based on the risk rating recommendation and existing risk ratings for the criteria. The current PT risk assessment shows that the risk level of PT driving accident rates is high [
47]. Based on existing risk ratings, the uncertainty level of the intersection blocking rate during peak hours, coverage rate, PT land area per capita, and PT utilisation rate are medium [
48]. Other criteria’s uncertainty levels are very low, since the optimisation process can be controlled under the government implementation plan. After the criteria uncertainty levels have been identified, the results are utilised in the sampling process. During the criteria sampling, the sampling model needs to be selected. The details of the sampling model selection are shown in the following subsection.
2.3.2. Sample Selection
MCS uses a random sampling process. Monte Carlo (MC) sampling can recreate the full input distribution by making random selections across the entire probability distribution with large iterations [
49]. With high iteration, the model results are closer to the actual situation. Hence, this study used MCS performed by means of MC sampling. The details of the model input for the criteria are described in
Section 3.
3. Case Study
The analysis was implemented in three study areas in Australia, including the City of Bayswater, the City of Cockburn, and the City of Stonnington. Stonnington and Bayswater are suburbs close to Melbourne and Perth Central Business District, respectively. Cockburn is a suburb in the south of Perth. In these cities, trains and buses are the major means of public transport, and the main land use type is residential. The details of the case studies can be found in Lin et al. (2021) [
28]. The locations and areas of these three cities are shown in
Figure 5.
The MCS was conducted to analyse the likelihood of achieving PT network performance optimisation goals. The input data for the three case study areas were derived from AHP and MALGP outputs. As demonstrated in
Section 2.1, the PTCM-AHP model calculates the criteria weights that are later utilised in MALGP for the optimisation process [
27,
28]. The criteria weights are presented in Lin et al. (2021) [
27]. The mean value of the criteria for MCS was extracted from the MALGP criteria optimising results, and the details can be found in Lin et al. (2022) [
28].
The sources of uncertainty for the optimisation process of public transport networks’ performance have not been fully investigated. Thus, the degree of uncertainty for each criterion is defined based on the existing risk rating, which is discussed in
Section 2.3.1. This analysis focuses on the uncertainty of the implementation criteria of the optimisation results. The risk level of criteria is defined based on an existing risk assessment of the uncertainty level.
According to the risk rating description, the uncertainty level is medium for the intersection blocking rate during peak hours, coverage rate, PT land area per capita, and PT utilisation rate. Based on existing PT risk assessments, the uncertainty level of the PT driving accident rate is high. The criteria’s mean values are each criterion’s optimal value. The remaining criteria have very low uncertainty levels. Thus, the minimum and maximum values for the criteria were calculated.
The type of probability distribution for all criteria sampling was assumed to be triangularly distributed, since the minimum, most likely, and maximum values can be estimated. The model input list of the three cities for MCS is shown in
Table A1,
Table A2 and
Table A3. The sampling result is more likely to display the distribution accurately with a high number of draws. Thus, the criteria used 5000 draws by applying MC sampling.
Sensitivity analyses on the three case study areas were implemented. Each PT criteria performance was calculated on 5000 model runs. To explore the criteria model outputs’ uncertainty, criteria uncertainty was investigated via the criteria coefficient value, criteria optimising value’s impacts on the model output, and the criteria’s probability of reaching the DMs’ optimisation goals. The details of the model’s results and sensitivity analyses are shown in the next section.
4. Results and Discussion
Sensitivity analyses were implemented in the three case study areas. The most likely values for the criteria during the optimisation process were also determined. Finally, the results reveal the critical sensitive criteria that governments must take into account to manage uncertainty for future optimisation plans and strategies for the case study areas.
Section 4.1 identifies the most sensitive criteria and the criteria’s most likely values during the optimisation process.
Section 4.2 shows the most important criteria of the MCS model’s output for the study areas.
Section 4.3 determines the probability of sensitive criteria to achieve the government requirements.
4.1. Sensitivity Analysis
According to
Table A4,
Table A5 and
Table A6, all cities’ outputs are influenced by the on-time rate. Based on the output of the probability distribution for the case study areas, three cities have a 50th percentile chance of achieving the performance optimisation goals for each criterion. Except for the on-time rate, other criteria have at least a 60% likelihood of achieving the optimal solution.
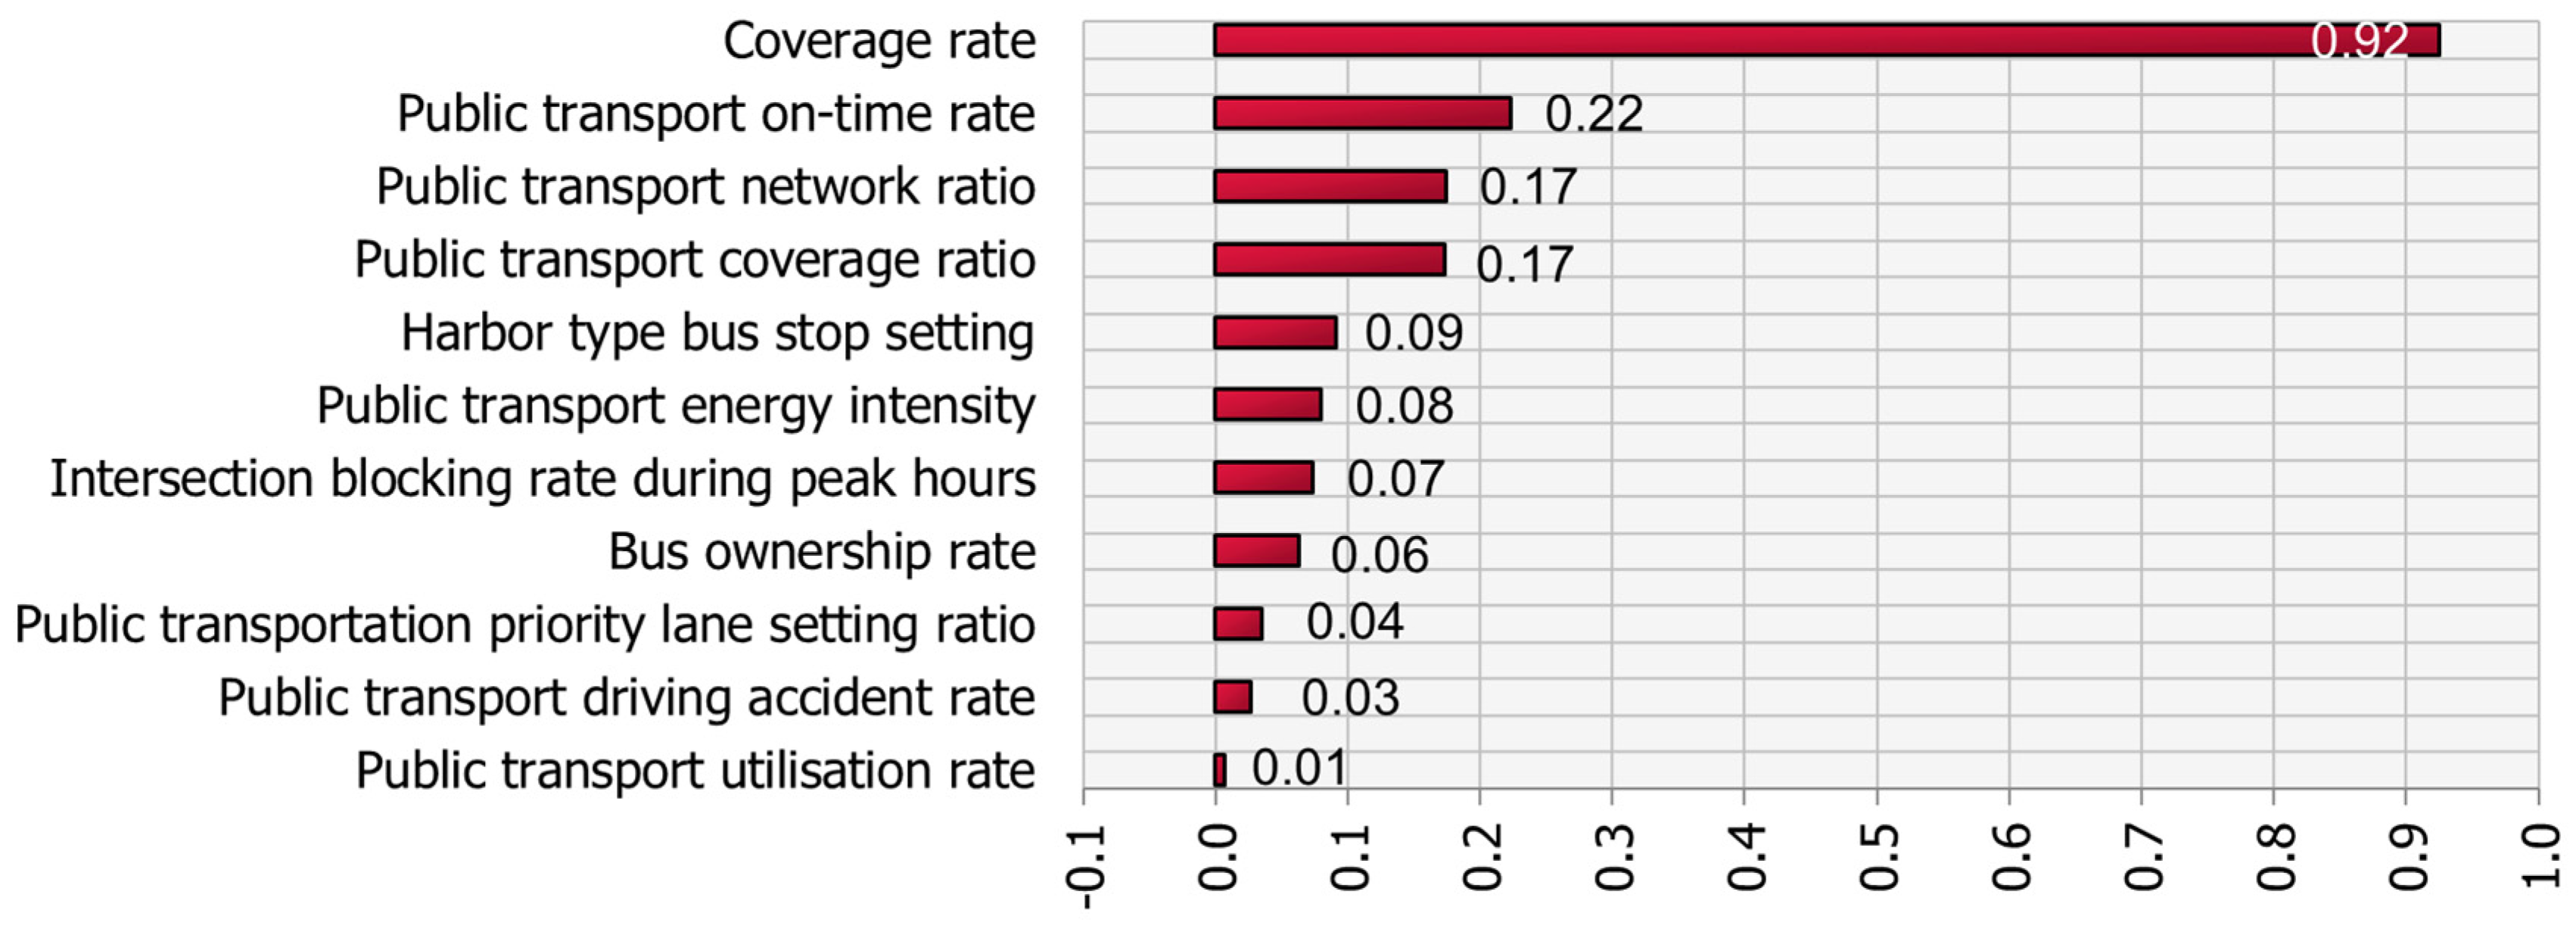
Figure 6,
Figure 7 and
Figure 8 show the coefficient values of the criteria for the three case study areas. The y-axis displays the names of the criteria from top to bottom in an order of sensitive influence to the criteria. The x-axis indicates the coefficient values of the associated criteria.
According to the results, the most sensitive criterion for all cities is the coverage rate. This criterion’s coefficient value is over 0.9 for the three cities. According to
Table A7, Bayswater and Cockburn’s most likely values are both 103.33%. The two cities’ minimum and maximum values are 85.08% and 124.5%, respectively.
Table A7 suggests that the most likely value for Stonnington is 155%. The Stonnington minimum and maximum values are 127.76% and 186.52%, respectively. To control and minimise the uncertainty of this most sensitive criterion’s optimisation process, the DMs should consider improving the PT service’s commercial revenue and reducing the operating expenses for all cities’ optimisation scenarios.
Figure 6,
Figure 7 and
Figure 8 effectively offer an overall interpretation of the model based on each criterion. However, the relative importance of the criteria on the model output has not been discovered. For this reason,
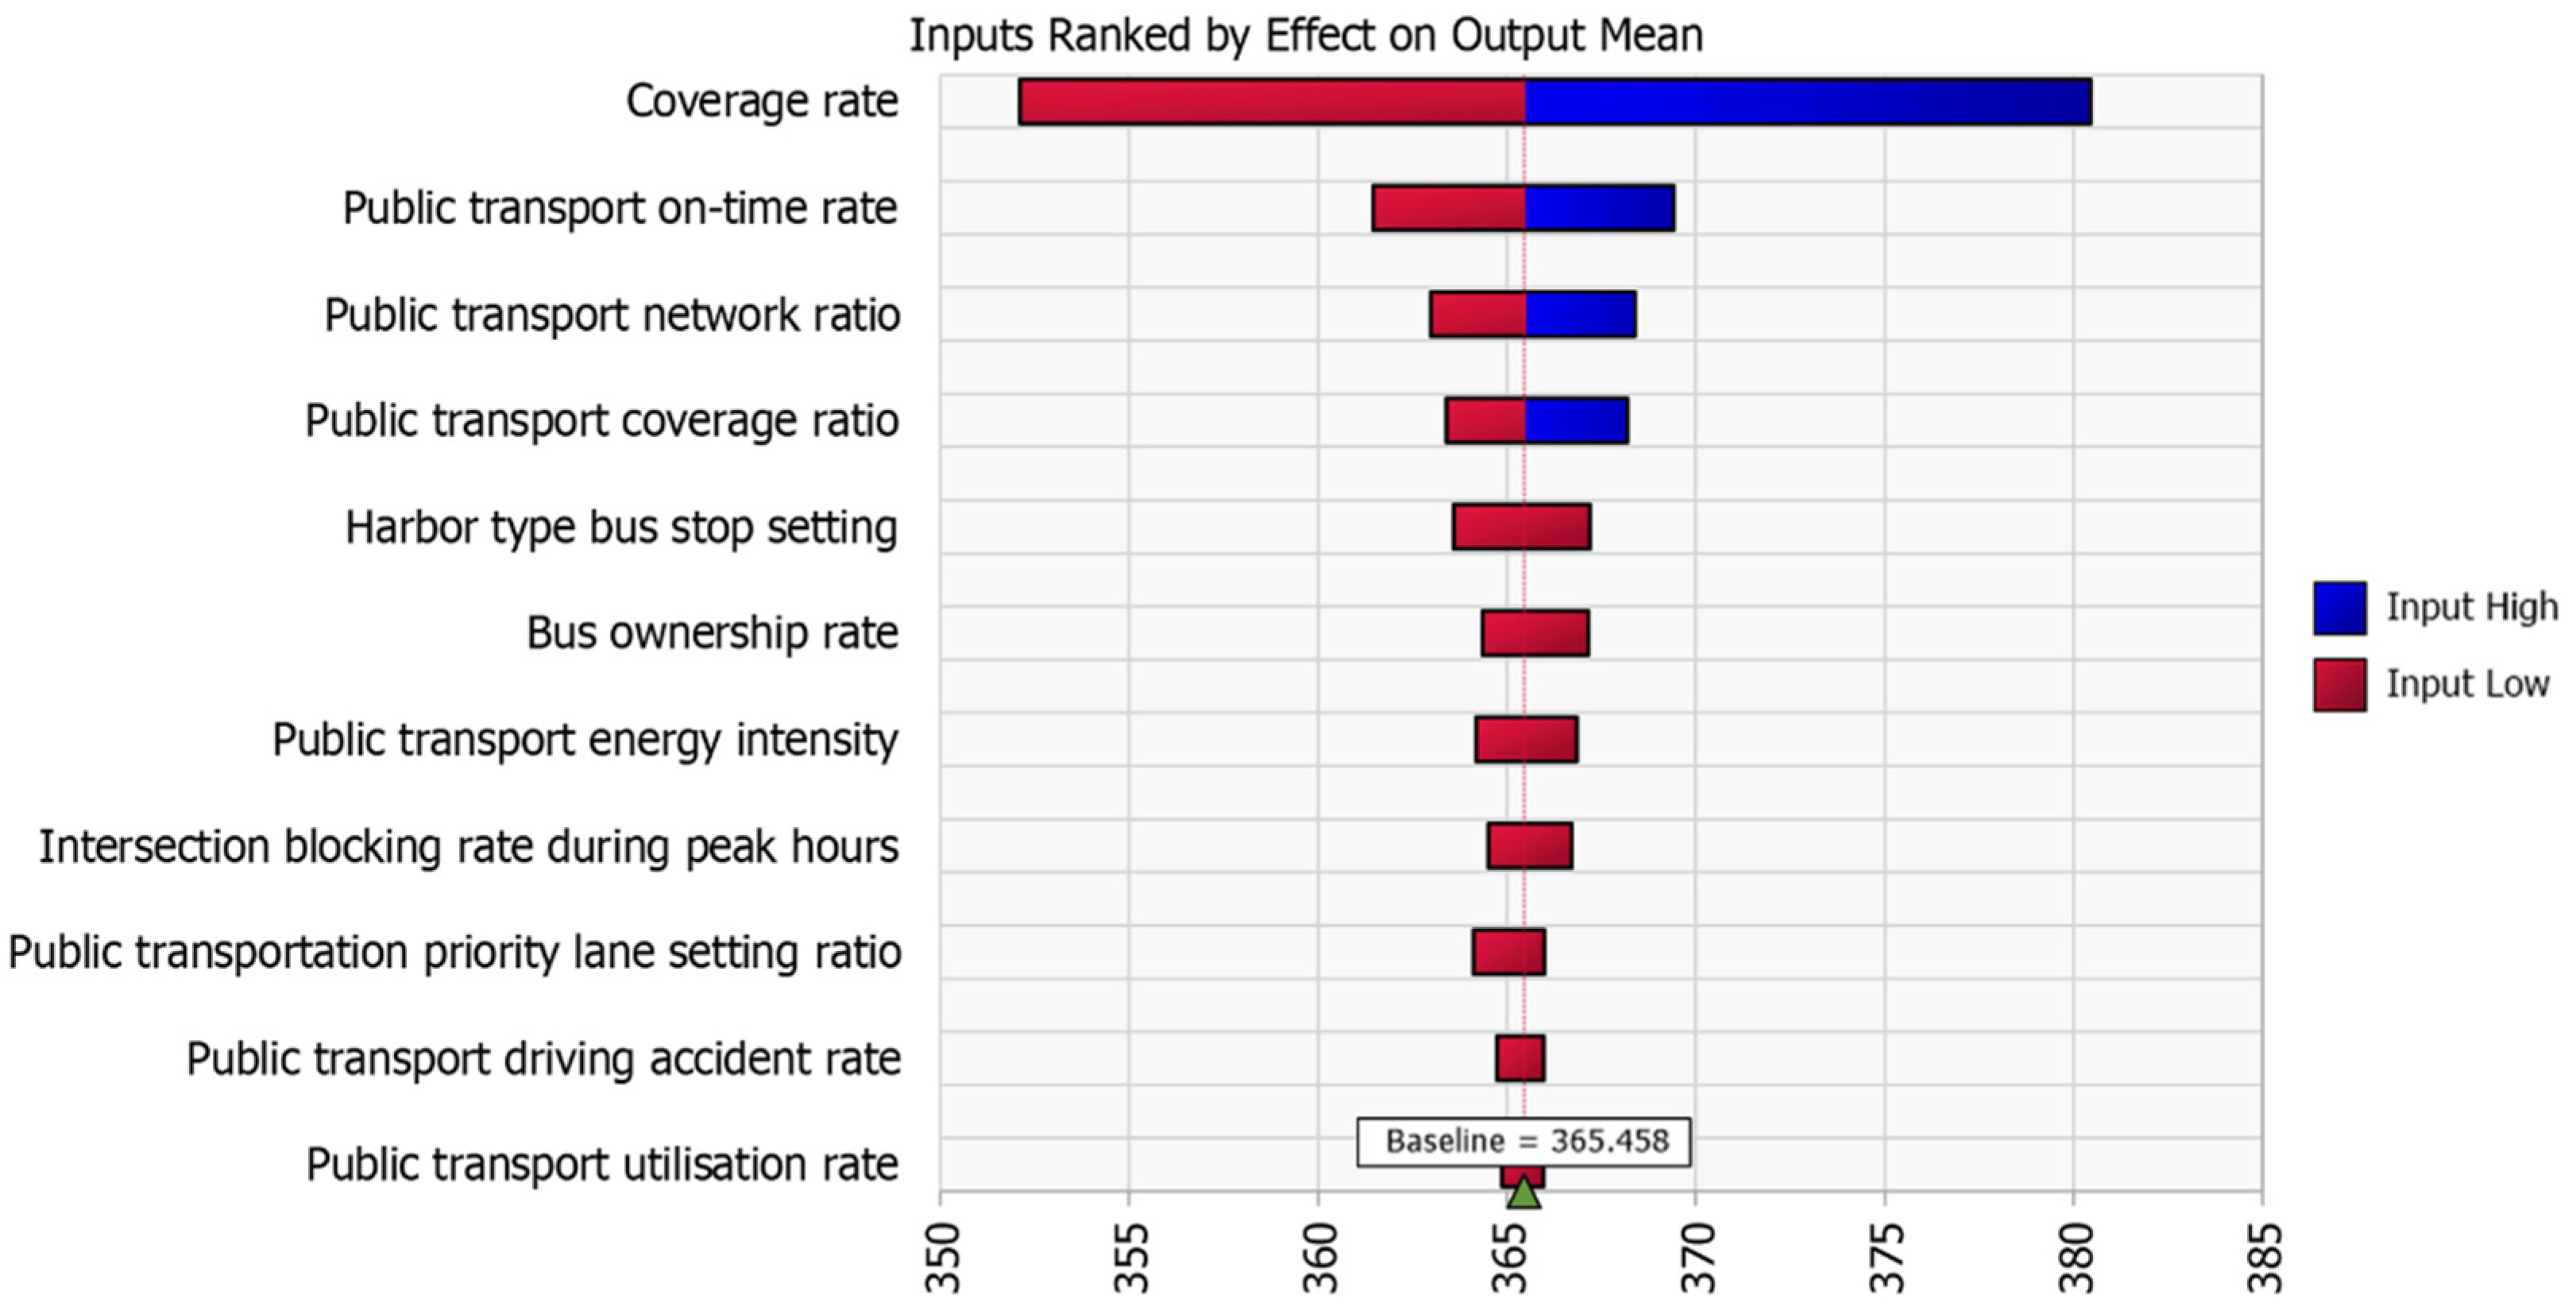
Figure 9,
Figure 10 and
Figure 11 show the criteria for optimising the impacts of the input on MCS output.
4.2. Permutation Feature Importance
Figure 9,
Figure 10 and
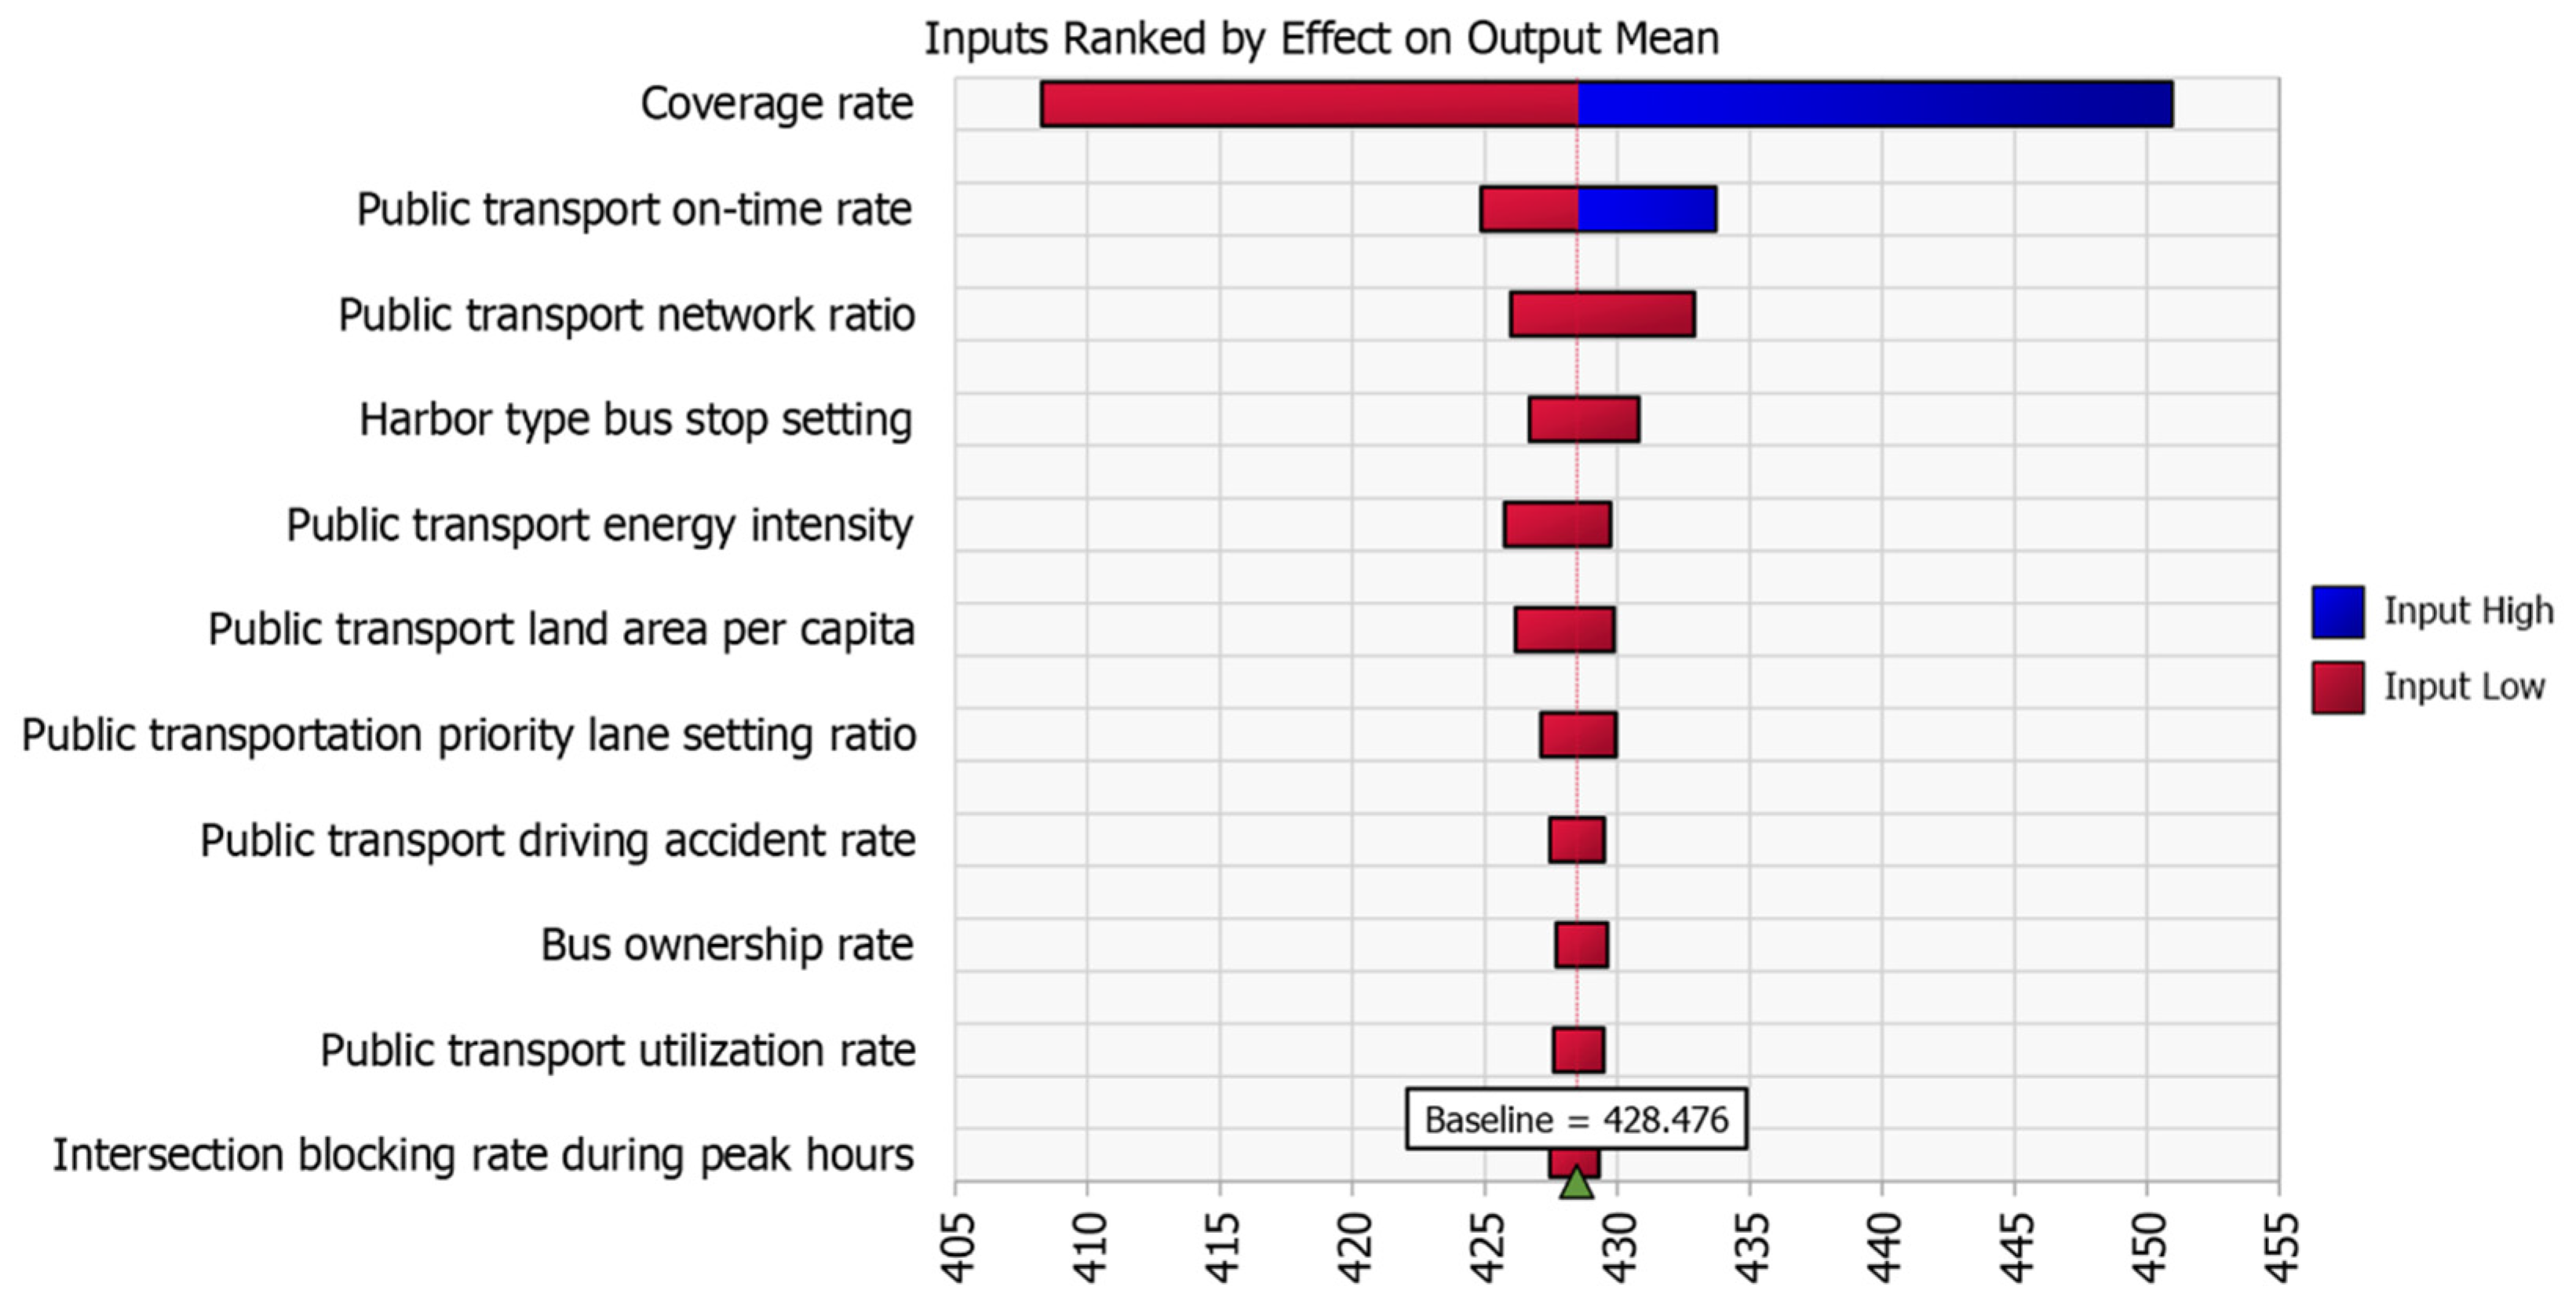
Figure 11 show the impacts of the three cities’ criteria for optimising the value on the model results. The y-axis demonstrates the name of the criteria, based on importance magnitude, from top to bottom. The x-axis indicates the criteria’s impact on the model output. The line colour shows the impact of the criteria on the model output, which supports the DMs in analysing the criteria’s impact on the city optimisation solution.
The figures show that the coverage rate has the highest impact on the model output of the three case study areas. Furthermore, the higher the coverage rate value is, the greater the influence on the model output is. However, this criterion suggests a baseline result when the coverage rate input is low.
For Bayswater, other criteria, such as the PT on-time rate, the PT network ratio, and the PT coverage ratio, also have a high impact on the output (as shown in
Figure 9).
Similarly,
Figure 10 demonstrates that these three criteria have a high influence on the model output for Cockburn. The results of the coverage rate also apply to these three criteria.
Finally,
Figure 11 suggests that the higher the PT on-time rate requirement is, the higher the impact on the model optimisation results for Stonnington is. Except for the criteria mentioned above, a higher other criteria requirement has a low influence on the model optimisation output for the three cities. The figure results also validate the criteria weighting results of the PTCM-AHP model. The PT network ratio and PT coverage ratio, PT on-time rate, and coverage rate are the most important variables for the basic PT infrastructure level, PT service level, and economic benefit level, respectively [
28].
Figure 9,
Figure 10 and
Figure 11 provide a method to analyse the effect of each criterion on the model outputs. However, DMs are often subject to government requirements to control the optimisation process. Therefore, it is necessary to identify the probability of criteria that meet the government requirements.
4.3. Test Accuracy
Finally, we determined the criteria’s probability distribution in the PT network performance optimisation process. The following section identifies the probability of the criterion that meets the DMs’ requirements. DMs require the criteria probability to be within a range of −5%/+10%.
Figure 12 and
Figure 13 show the probability of the criteria reaching the requirements for the three cities. The y-axis displays the probability of achieving the criterion-optimising values. The x-axis indicates the input values of the associated criteria.
Since the uncertainty levels of most criteria are very low, most criteria have a 100% probability of meeting the government requirements. For Bayswater and Cockburn, there are four criteria uncertainty levels that are higher than very low, including the coverage rate, intersection blocking rate during peak hours, PT utilisation rate, and PT driving accident rate. The details of the criteria’s probability distribution for Bayswater and Cockburn are shown in
Figure 12. Five criteria for Stonnington have an uncertainty level that is higher than the ‘very low’ level.
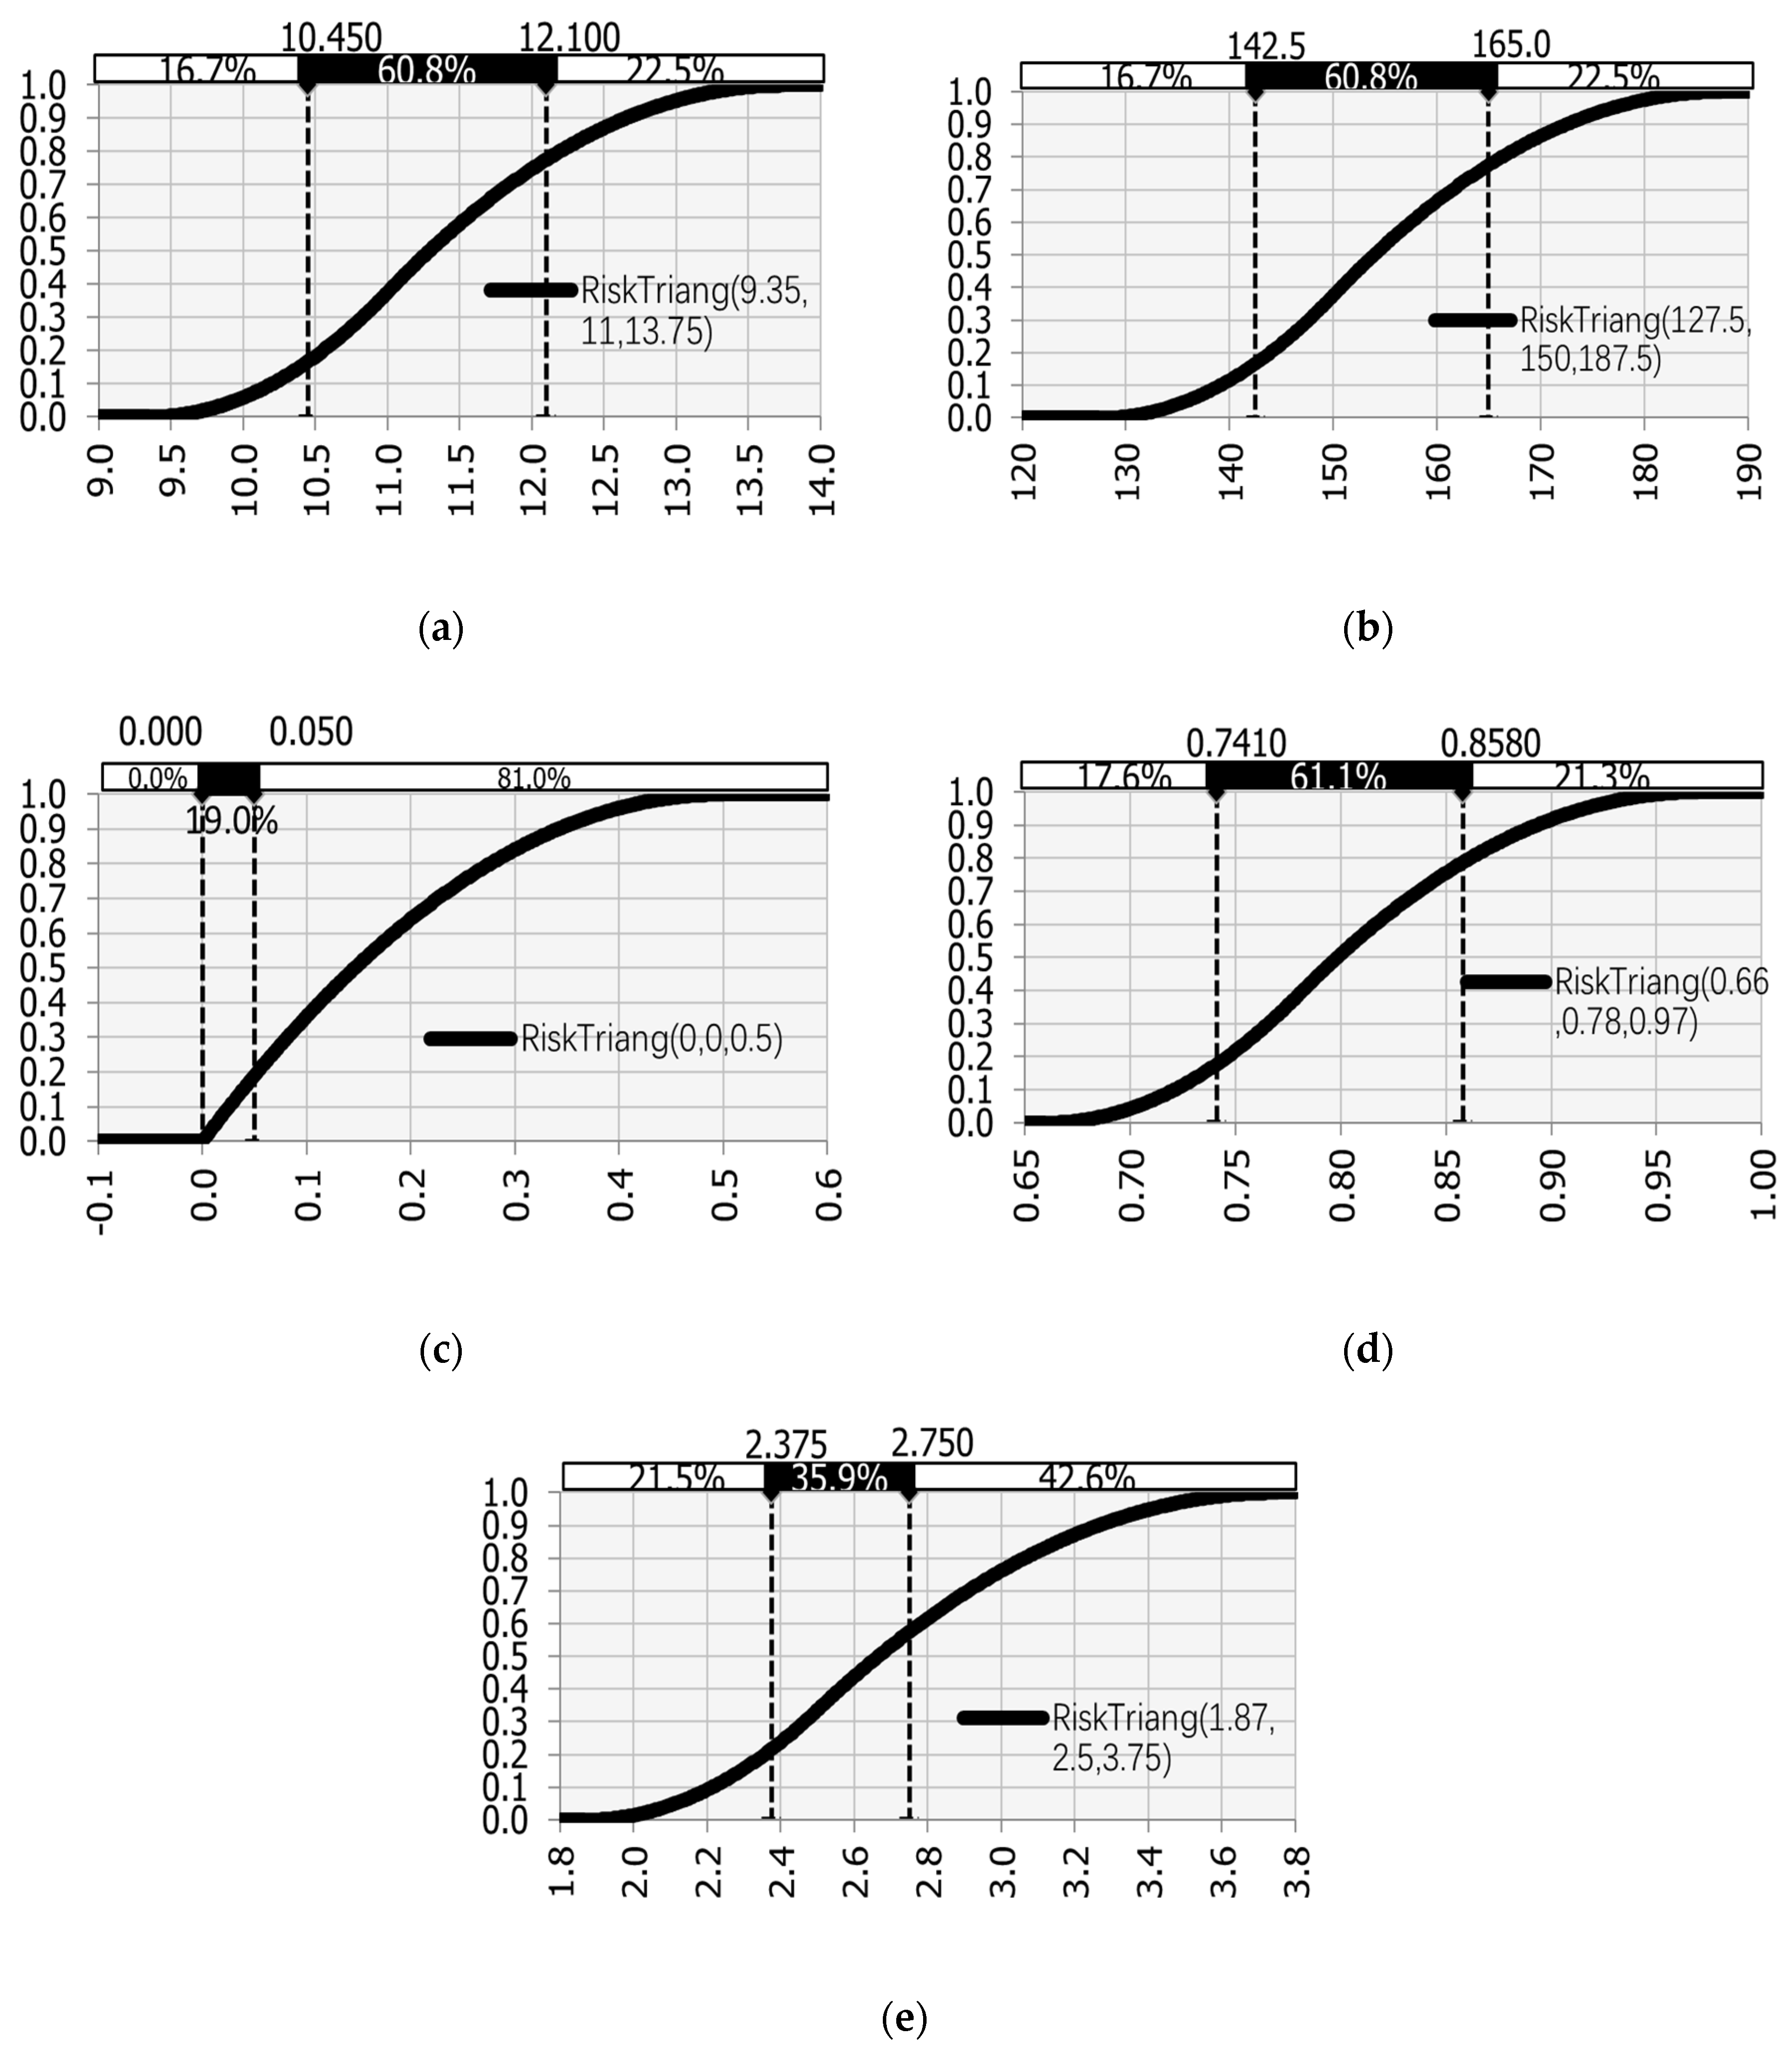
Figure 13 shows the probability distribution of these five criteria, namely, the PT land area per capita, coverage rate, intersection blocking rate during peak hours, PT utilisation rate, and PT driving accident rate.
For Bayswater and Cockburn,
Figure 12a shows that a coverage rate of 60.8% reaches the government goal. According to Lin et al. (2021), this criterion has the highest weight in the economic benefit level [
28]. Hence, when cities implement the optimisation scenario for economic benefit level, DMs are advised to plan ahead, which requires the implementation of a management plan during the optimisation process to mitigate the uncertainty.
Figure 12b,c demonstrate that both cities have a probability of 60.8% of achieving the requirement for intersection blocking rate during peak hours and PT utilisation rate. Lin et al. (2021) show that these two criteria have low priority to achieve the optimal goal [
28]. Hence, DMs just need to effectively monitor and control the process to deliver optimisation scenarios.
Figure 12d shows that the PT driving accident rate has a low probability, i.e., 36%, of achieving the government requirement. According to
Table A1, although the priority of this criterion is low, the government still requires a management plan for the optimisation scenario. Since this criterion has a high uncertainty level, the delivery of the optimal solution will be influenced.
For Stonnington,
Figure 13a,b show that both criteria have a probability of 60.8% of fulfilling the government’s requirements. The criterion of PT land area per capita is not of the highest importance at the sustainable development level, but its weight is higher than that of the coverage rate. The coverage rate is the most important criterion in the economic benefit level, for which the government needs to apply management plans to optimise PT network performance. Hence, DMs are also advised to implement management action to achieve an optimal solution.
According to
Figure 13c, although Stonnington has only a probability of 19% of achieving the DMs’ requirements for the criterion of the intersection blocking rate during peak hours, the evaluation results show that the actual value achieved the highest level, which is level A in Lin et al. (2021) [
28]. Since it is difficult to further improve and achieve optimising results in the criterion performance, the DMs can instead focus on maintaining the current performance while controlling and optimising the criterion performance.
Figure 13d shows that there is a probability of 61.1% of achieving the government requirement for the PT utilisation rate. Since the weight of this criterion is low, the DMs are advised to implement monitoring and control during the optimisation process.
According to
Figure 13e, the probability of Stonnington’s PT driving accident rate is similar to the other two case study areas, which is 35.9%. The criterion uncertainty level is high. Thus, Stonnington also suggests implementing actions to mitigate the risks during the optimisation process.
Figure 12 and
Figure 13 are useful for analysing the probability distribution of each criterion to fulfil the governments’ requirements. This approach helps governments allocate resources for delivering case study area optimisation solutions.
This research establishes a solid framework for optimising PT networks’ performance in the face of uncertainty. The combination of the PTCM-AHP model, the MALGP model, and MCS enables DMs to make informed decisions based on criteria weights while optimising the PT network and accounting for uncertainty. The findings of this study help advance PT network optimisation methodologies and provide practical advice for improving urban transportation systems. DMs gain insights into the relative importance of criteria, propose optimal solutions, and assess the probability of criteria optimisation in uncertain environments by integrating the PTCM-AHP model, the MALGP model, and MCS.
5. Conclusions
To mitigate the criteria uncertainty involved in the process of optimising PT networks’ performance, this paper proposes a three-stage optimisation model for optimising public transport networks’ performance under uncertain conditions. First, the PTCM-AHP model was used to identify the weights of the model criteria and evaluate the case study areas’ PT networks’ performance. The obtained weights were then used by the second model, MALGP, to propose the three cases’ PT network performance optimisation solutions. Finally, MCS was implemented to analyse the sensitive criteria, discover the optimal solution under criteria uncertainty, and identify the likelihood of criteria optimisation based on DMs’ requirements for the three case study areas. The research results indicate that the coverage rate is the most sensitive criterion for these three cities. Furthermore, a higher coverage rate and PT on-time rate requirement will lead to a higher impact on the model optimising result for all cities. Last, although the PT driving accident rate has a low priority and probability of achieving the DMs’ requirements, this criterion has a high level of risk. Governments still need to implement management plans to achieve optimised solutions.
The model proposed in this paper can be used in the following areas: First, the DMs can use the model to evaluate the performance of a PT network. The model also provides the weights of criteria for the optimisation process. Second, the model is based on criteria weights and the governments’ goal for the criteria performance to propose an optimisation solution for the case study areas. Third, the model results identify the sensitive criteria and the criteria’s optimising value’s impact on the delivery of a PT network’s performance optimisation solution. Fourth, the outcome of this research can be used to identify the likelihood of a criteria optimisation scenario. Based on government requirements, the MCS results were combined with weighted results, which provide a reference for DMs to allocate resources for optimising the delivery of PT network performance solutions.
Despite innovations in the three-stage optimisation framework design, the models and theories used in this study still have scope for improvement. Future research should consider overcoming the relevant limitations. In terms of calculating city performance scores and the optimisation processes, the processes of conducting results necessitate collaboration with statistical programming software to enhance efficiency.
This model, however, did not consider the actual risk events and their corresponding risk treatments. Hence, the framework can provide qualitative risk management methods for the proposed associated risk treatments. Further work should go beyond the risk analysis to achieve performance optimisation. Moreover, future research should consider risk information that is received from other subject sources.
Author Contributions
G.L.: conceptualisation, methodology, software, validation, formal analysis, investigation, and writing—original draft preparation. H.X.: conceptualisation, writing—review and editing, supervision, and funding acquisition. S.W.: conceptualisation and writing—review and editing, supervision. C.L.: conceptualisation, writing—review and editing, supervision. F.Z.: writing—review and editing. J.Z.: writing—review and editing. All authors have read and agreed to the published version of the manuscript.
Funding
This research was funded in part by the Australian Research Council (DP160102819) and the 2022 Science and Engineering Faculty Small Grant, Curtin University.
Institutional Review Board Statement
Not applicable.
Informed Consent Statement
Not applicable.
Data Availability Statement
The data presented in this study are available upon request from the corresponding author.
Conflicts of Interest
The authors declare no conflicts of interest.
Appendix A
Table A1.
Bayswater model inputs.
Table A1.
Bayswater model inputs.
| Variable | Risk Level | Min | Mean Value | Max | Shape |
|---|
| PT network ratio | Very low | 47.5 | 50 | 55 | Triangular |
| PT coverage ratio | Very low | 47.5 | 50 | 55 | Triangular |
| Harbour-type bus stop setting ratio | Very low | 23.75 | 25 | 27.5 | Triangular |
| Public transportation priority lane setting ratio | Very low | 9.5 | 10 | 11 | Triangular |
| PT on-time rate | Very low | 90.25 | 95 | 100 | Triangular |
| Intersection blocking rate during peak hours | Medium | 6.8 | 8 | 10 | Triangular |
| Passenger freight rate | | | 1.75 | | |
| PT driving accident rate | High | 1.125 | 1.5 | 2.25 | Triangular |
| Coverage rate | Medium | 85 | 100 | 125 | Triangular |
| Bus ownership rate | Very low | 17.1 | 18 | 19.8 | Triangular |
| Intact car rate | | | 100 | | |
| PT land area per capita | | | 20.47 | | |
| PT utilisation rate | Medium | 0.68 | 0.8 | 1 | Triangular |
| Green public transport vehicle rate | | | 100 | | |
| PT energy intensity | Very low | 0 | 0 | 3 | Triangular |
Table A2.
Cockburn model inputs.
Table A2.
Cockburn model inputs.
| Variable | Risk Level | Min | Mean Value | Max | Shape |
|---|
| PT network ratio | Very low | 47.5 | 50 | 55 | Triangular |
| PT coverage ratio | Very low | 47.5 | 55 | 55 | Triangular |
| Harbour-type bus stop setting ratio | Very low | 14.25 | 15 | 16.5 | Triangular |
| Public transportation priority lane setting ratio | Very low | 9.5 | 10 | 11 | Triangular |
| PT on-time rate | Very low | 90.25 | 95 | 100 | Triangular |
| Intersection blocking rate during peak hours | Medium | 6.8 | 8 | 10 | Triangular |
| Passenger freight rate | | | 1.75 | | |
| PT driving accident rate | High | 1.125 | 1.5 | 2.25 | Triangular |
| Coverage rate | Medium | 85 | 100 | 125 | Triangular |
| Bus ownership rate | Very low | 17.1 | 18 | 19.8 | Triangular |
| Intact car rate | | | 100 | | |
| PT land area per capita | | | 26.23 | | |
| PT utilisation rate | Medium | 0.68 | 0.8 | 1 | Triangular |
| Green public transport vehicle rate | | | 100 | | |
| PT energy intensity | Very low | 0 | 0 | 3 | Triangular |
Table A3.
Stonnington model inputs.
Table A3.
Stonnington model inputs.
| Variable | Risk Level | Min | Mean Value | Max | Shape |
|---|
| PT network ratio | Very low | 57.74 | 60.78 | 66.86 | Triangular |
| PT coverage ratio | | | 83.72 | | |
| Harbour-type bus stop setting ratio | Very low | 33.25 | 35 | 38.5 | Triangular |
| Public transportation priority lane setting ratio | Very low | 24.11 | 25.38 | 27.92 | Triangular |
| PT on-time rate | Very low | 80.75 | 85 | 93.5 | Triangular |
| Intersection blocking rate during peak hours | Medium | 0 | 0 | 0.5 | Triangular |
| Passenger freight rate | | | 2.33 | | |
| PT driving accident rate | High | 1.87 | 2.5 | 3.75 | Triangular |
| Coverage rate | Medium | 127.5 | 150 | 187.5 | Triangular |
| Bus ownership rate | Very low | 17.1 | 18 | 19.8 | Triangular |
| Intact car rate | | | 100 | | |
| PT land area per capita | Medium | 9.35 | 11 | 13.75 | Triangular |
| PT utilisation rate | Medium | 0.66 | 0.78 | 0.97 | Triangular |
| Green public transport vehicle rate | | | 100 | | |
| PT energy intensity | Very low | 28.5 | 30 | 33 | Triangular |
Table A4.
Bayswater summary statistics in total.
Table A4.
Bayswater summary statistics in total.
Name
Description Cell Function | Public Transport Network Ratio Input B1 | Public Transport
Coverage Ratio Input B2 | Harbour-Type Bus Stop Setting Input B3 | Public
Transportation Priority Lane Setting Ratio Input B4 | Public Transport on-Time Rate Input B5 | Intersection Blocking Rate during Peak Hours Input B6 | Public Transport Driving
Accident Rate Input B7 | Coverage Rate Input B8 | Bus
Ownership Rate Input B9 | Public Transport
Utilisation Rate Input B10 | Public Transport
Energy
Intensity Input B11 |
|---|
| Percentiles | |
| 1% | 47.9423 | 52.6870 | 14.3888 | 9.5849 | 90.8506 | 6.9989 | 1.18211 | 87.248 | 17.2467 | 0.70310 | 0.0160 |
| 10% | 48.8639 | 53.7908 | 14.6576 | 9.7764 | 92.3835 | 7.4063 | 1.32963 | 92.678 | 17.5913 | 0.74373 | 0.1488 |
| 20% | 49.3899 | 54.3977 | 14.8250 | 9.8893 | 93.2820 | 7.6744 | 1.41561 | 95.884 | 17.7949 | 0.76918 | 0.3182 |
| 25% | 49.6484 | 54.6520 | 14.8904 | 9.9343 | 93.6105 | 7.7776 | 1.44542 | 97.148 | 17.8787 | 0.77872 | 0.4051 |
| 30% | 49.8488 | 54.8737 | 14.9565 | 9.9764 | 93.8986 | 7.8663 | 1.47927 | 98.335 | 17.9534 | 0.78834 | 0.4959 |
| 35% | 50.0314 | 55.0881 | 15.0156 | 10.0128 | 94.2359 | 7.9576 | 1.50881 | 99.338 | 18.0208 | 0.79696 | 0.5847 |
| 40% | 50.2108 | 55.3207 | 15.0798 | 10.0493 | 94.5160 | 8.0470 | 1.54068 | 100.347 | 18.0893 | 0.80540 | 0.6768 |
| 45% | 50.4319 | 55.5341 | 15.1414 | 10.0921 | 94.7778 | 8.1328 | 1.57329 | 101.406 | 18.1637 | 0.81324 | 0.7787 |
| 50% | 50.6512 | 55.7906 | 15.2022 | 10.1350 | 95.0402 | 8.2244 | 1.60420 | 102.528 | 18.2412 | 0.82232 | 0.8829 |
| 55% | 50.8657 | 56.0201 | 15.2677 | 10.1778 | 95.3043 | 8.3087 | 1.63717 | 103.779 | 18.3266 | 0.83136 | 0.9869 |
| 60% | 51.0791 | 56.2985 | 15.3355 | 10.2232 | 95.5614 | 8.4048 | 1.67112 | 104.954 | 18.3989 | 0.84100 | 1.0974 |
| 65% | 51.3197 | 56.5476 | 15.4093 | 10.2753 | 95.8875 | 8.5046 | 1.70788 | 106.238 | 18.4950 | 0.85092 | 1.2179 |
| 70% | 51.5816 | 56.8067 | 15.4895 | 10.3302 | 96.1834 | 8.6281 | 1.75044 | 107.614 | 18.5947 | 0.86190 | 1.3509 |
| 75% | 51.9094 | 57.1131 | 15.5744 | 10.3941 | 96.5048 | 8.7509 | 1.79612 | 109.069 | 18.6995 | 0.87317 | 1.4920 |
| 80% | 52.2371 | 57.4395 | 15.6634 | 10.4586 | 96.8769 | 8.8751 | 1.83853 | 110.589 | 18.8310 | 0.88616 | 1.6728 |
| 90% | 53.0088 | 58.3971 | 15.9010 | 10.6244 | 97.7727 | 9.1921 | 1.96308 | 114.884 | 19.1074 | 0.91765 | 2.0782 |
| 99% | 54.4025 | 59.7433 | 16.3227 | 10.8925 | 99.2561 | 9.7271 | 2.14651 | 121.810 | 19.5711 | 0.97468 | 2.6878 |
Table A5.
Cockburn summary statistics in total.
Table A5.
Cockburn summary statistics in total.
Name
Description Cell
Function | Public Transport Network
Ratio Input B1 | Public Transport
Coverage Ratio Input B2 | Harbour-Type Bus Stop Setting Input B3 | Public
Transportation Priority Lane Setting Ratio Input B4 | Public Transport on-Time Rate Input B5 | Intersection Blocking Rate during Peak Hours Input B6 | Public Transport Driving
Accident Rate Input B7 | Coverage Rate Input B8 | Bus
Ownership Rate Input B9 | Public Transport
Utilisation Rate Input B10 | Public Transport
Energy
Intensity Input B11 |
|---|
| Percentiles | |
| 1% | 47.9423 | 47.8973 | 23.7617 | 9.5849 | 90.8506 | 6.9989 | 1.18211 | 87.248 | 17.2467 | 0.70310 | 0.0160 |
| 10% | 48.8639 | 48.9007 | 24.2686 | 9.7764 | 92.3835 | 7.4063 | 1.32963 | 92.678 | 17.5913 | 0.74373 | 0.1488 |
| 20% | 49.3899 | 49.4525 | 24.5842 | 9.8893 | 93.2820 | 7.6744 | 1.41561 | 95.884 | 17.7949 | 0.76918 | 0.3182 |
| 25% | 49.6484 | 49.6836 | 24.7076 | 9.9343 | 93.6105 | 7.7776 | 1.44542 | 97.148 | 17.8787 | 0.77872 | 0.4051 |
| 30% | 49.8488 | 49.8851 | 24.8322 | 9.9764 | 93.8986 | 7.8663 | 1.47927 | 98.335 | 17.9534 | 0.78834 | 0.4959 |
| 35% | 50.0314 | 50.0801 | 24.9431 | 10.0128 | 94.2359 | 7.9576 | 1.50881 | 99.338 | 18.0208 | 0.79696 | 0.5847 |
| 40% | 50.2108 | 50.2916 | 25.0554 | 10.0493 | 94.5160 | 8.0470 | 1.54068 | 100.347 | 18.0893 | 0.80540 | 0.6768 |
| 45% | 50.4319 | 50.4856 | 25.1615 | 10.0921 | 94.7778 | 8.1328 | 1.57329 | 101.406 | 18.1637 | 0.81324 | 0.7787 |
| 50% | 50.6512 | 50.7187 | 25.2660 | 10.1350 | 95.0402 | 8.2244 | 1.60420 | 102.528 | 18.2412 | 0.82232 | 0.8829 |
| 55% | 50.8657 | 50.9273 | 25.3788 | 10.1778 | 95.3043 | 8.3087 | 1.63717 | 103.779 | 18.3266 | 0.83136 | 0.9869 |
| 60% | 51.0791 | 51.1805 | 25.4955 | 10.2232 | 95.5614 | 8.4048 | 1.67112 | 104.954 | 18.3989 | 0.84100 | 1.0974 |
| 65% | 51.3197 | 51.4069 | 25.6226 | 10.2753 | 95.8875 | 8.5046 | 1.70788 | 106.238 | 18.4950 | 0.85092 | 1.2179 |
| 70% | 51.5816 | 51.6424 | 25.7606 | 10.3302 | 96.1834 | 8.6281 | 1.75044 | 107.614 | 18.5947 | 0.86190 | 1.3509 |
| 75% | 51.9094 | 51.9210 | 25.9067 | 10.3941 | 96.5048 | 8.7509 | 1.79612 | 109.069 | 18.6995 | 0.87317 | 1.4920 |
| 80% | 52.2371 | 52.2177 | 26.0600 | 10.4586 | 96.8769 | 8.8751 | 1.83853 | 110.589 | 18.8310 | 0.88616 | 1.6728 |
| 90% | 53.0088 | 53.0883 | 26.4690 | 10.6244 | 97.7727 | 9.1921 | 1.96308 | 114.884 | 19.1074 | 0.91765 | 2.0782 |
| 99% | 54.4025 | 54.3121 | 27.1947 | 10.8925 | 99.2561 | 9.7271 | 2.14651 | 121.810 | 19.5711 | 0.97468 | 2.6878 |
Table A6.
Stonnington summary statistics in total.
Table A6.
Stonnington summary statistics in total.
Name
Description Cell
Function | Public Transport Network
Ratio Input B1 | Harbour-Type Bus Stop Setting Input B2 | Public
Transportation Priority Lane Setting Ratio Input B3 | Public Transport on-Time Rate Input B4 | Intersection Blocking Rate during Peak Hours Input B5 | Public Transport Driving
Accident Rate Input B6 | Coverage Rate Input B7 | Bus
Ownership Rate Input B8 | Public Transport Land Area per Capita Input B9 | Public Transport
Utilisation Rate Input B10 | Public Transport
Energy
Intensity Input B11 |
|---|
| Percentiles | |
| 1% | 58.2778 | 33.5281 | 24.3450 | 81.471 | 0.00195 | 1.9805 | 130.731 | 17.2430 | 9.6035 | 0.68273 | 28.7683 |
| 10% | 59.3986 | 34.2305 | 24.8002 | 83.100 | 0.02521 | 2.2067 | 139.076 | 17.5887 | 10.1992 | 0.72272 | 29.3080 |
| 20% | 60.0381 | 34.6167 | 25.0836 | 84.059 | 0.05237 | 2.3556 | 143.939 | 17.7927 | 10.5512 | 0.74777 | 29.6645 |
| 25% | 60.3525 | 34.7785 | 25.1945 | 84.441 | 0.06522 | 2.4130 | 145.626 | 17.8731 | 10.6959 | 0.75717 | 29.8038 |
| 30% | 60.5962 | 34.9196 | 25.3064 | 84.800 | 0.07794 | 2.4622 | 147.540 | 17.9486 | 10.8251 | 0.76664 | 29.9308 |
| 35% | 60.8182 | 35.0561 | 25.4064 | 85.108 | 0.09474 | 2.5131 | 149.203 | 18.0126 | 10.9410 | 0.77512 | 30.0418 |
| 40% | 61.0363 | 35.2041 | 25.5152 | 85.419 | 0.11044 | 2.5666 | 150.871 | 18.0813 | 11.0507 | 0.78331 | 30.1546 |
| 45% | 61.3052 | 35.3399 | 25.6195 | 85.783 | 0.12673 | 2.6185 | 152.555 | 18.1552 | 11.1681 | 0.79084 | 30.2794 |
| 50% | 61.5718 | 35.5031 | 25.7224 | 86.148 | 0.14482 | 2.6740 | 154.151 | 18.2334 | 11.2904 | 0.79954 | 30.4072 |
| 55% | 61.8327 | 35.6491 | 25.8333 | 86.511 | 0.16374 | 2.7251 | 155.854 | 18.3206 | 11.4251 | 0.80822 | 30.5345 |
| 60% | 62.0922 | 35.8263 | 25.9481 | 86.898 | 0.18214 | 2.7834 | 157.607 | 18.4025 | 11.5393 | 0.81747 | 30.6699 |
| 65% | 62.3847 | 35.9849 | 26.0731 | 87.340 | 0.20550 | 2.8438 | 159.505 | 18.4920 | 11.6908 | 0.82698 | 30.8174 |
| 70% | 62.7032 | 36.1497 | 26.2089 | 87.807 | 0.22669 | 2.9187 | 161.703 | 18.5880 | 11.8482 | 0.83752 | 30.9803 |
| 75% | 63.1019 | 36.3447 | 26.3526 | 88.350 | 0.24970 | 2.9931 | 164.062 | 18.6894 | 12.0135 | 0.84833 | 31.1531 |
| 80% | 63.5003 | 36.5524 | 26.5034 | 88.898 | 0.27635 | 3.0683 | 166.252 | 18.7954 | 12.2210 | 0.86079 | 31.3745 |
| 90% | 64.4387 | 37.1618 | 26.9058 | 90.308 | 0.34050 | 3.2604 | 172.684 | 19.0948 | 12.6572 | 0.89100 | 31.8711 |
| 99% | 66.1334 | 38.0184 | 27.6197 | 92.586 | 0.44673 | 3.5847 | 182.156 | 19.5776 | 13.3888 | 0.94571 | 32.6177 |
Table A7.
Case study areas’ MCS model results.
Table A7.
Case study areas’ MCS model results.
| Criteria | Most Likely Value |
|---|
| Bayswater | Cockburn | Stonnington |
|---|
| PT network ratio | 50.83 | 50.83 | 61.79 |
| PT coverage ratio | 50.83 | 55.91 | - |
| Harbour-type bus stop setting ratio | 25.33 | 25.33 | 35.58 |
| Public transportation priority lane setting ratio | 10.16 | 10.16 | 25.8 |
| PT on-time rate | 95.08 | 95.08 | 86.41 |
| Intersection blocking rate during peak hours | 8.26 | 8.26 | 0.16 |
| PT driving accident rate | 1.62 | 1.62 | 2.7 |
| Coverage rate | 103.33 | 103.33 | 155 |
| Bus ownership rate | 18.3 | 18.3 | 18.3 |
| PT land area per capita | - | - | 11.36 |
| PT utilisation rate | 0.83 | 0.83 | 0.8 |
| PT energy intensity | 1 | 1 | 30.5 |
References
- United Nations Human Settlements Programme. International Guidelines on Urban and Territorial Planning. Available online: https://unhabitat.org/international-guidelines-on-urban-and-territorial-planning (accessed on 31 December 2023).
- Marchau, V.A.; Walker, W.E.; Bloemen, P.J.; Popper, S.W. Decision Making under Deep Uncertainty: From Theory to Practice, 1st ed.; Springer Nature: Cham, Switzerland, 2019. [Google Scholar]
- Cartenì, A.; Marzano, V.; Henke, I.; Cascetta, E. A cognitive and participative decision-making model for transportation planning under different uncertainty levels. Transp. Policy 2022, 116, 386–398. [Google Scholar] [CrossRef]
- Manzo, S.; Nielsen, O.A.; Prato, C.G. How uncertainty in input and parameters influences transport model: Output A four-stage model case-study. Transp. Policy 2015, 38, 64–72. [Google Scholar] [CrossRef]
- Cyril, A.; Mulangi, R.H.; George, V. Performance optimization of public transport using integrated AHP–GP methodology. Urban Rail Transit 2019, 5, 133–144. [Google Scholar] [CrossRef]
- Tuan, V.A.; Van Truong, N.; Tetsuo, S.; An, N.N. Public transport service quality: Policy prioritization strategy in the importance-performance analysis and the three-factor theory frameworks. Transp. Res. A-POL 2022, 166, 118–134. [Google Scholar] [CrossRef]
- Altieri, M.G.; Dell’Orco, M.; Marinelli, M.; Sinesi, S. Evidence (Dempster–Shafer) Theory-Based evaluation of different Transport Modes under Uncertainty.: Theoretical basis and first findings. Transp. Res. Proc. 2017, 27, 508–515. [Google Scholar] [CrossRef]
- Cats, O.; Gkioulou, Z. Modeling the impacts of public transport reliability and travel information on passengers’ waiting-time uncertainty. EURO J. Transp. Logist. 2017, 6, 247–270. [Google Scholar] [CrossRef]
- Project Management Institute (PMI). A Guide to the Project Management Body of Knowledge (PMBOK Guide), 2nd ed.; Project Management Institute: Newtown Square, PA, USA, 2000. [Google Scholar]
- Aven, T. Risk assessment and risk management: Review of recent advances on their foundation. Eur. J. Oper. Res. 2016, 253, 1–13. [Google Scholar] [CrossRef]
- Hopkin, P. Fundamentals of Risk Management: Understanding, Evaluating and Implementing Effective Risk Management, 5th ed.; Kogan Page Publishers: New York, NY, USA, 2018. [Google Scholar]
- Dalmau, R. Predicting the likelihood of airspace user rerouting to mitigate air traffic flow management delay. Transp. Res. C-EMER 2022, 144, 103869. [Google Scholar] [CrossRef]
- Budzynski, M.; Luczkiewicz, A.; Szmaglinski, J. Assessing the Risk in Urban Public Transport for Epidemiologic Factors. Energies 2021, 14, 4513. [Google Scholar] [CrossRef]
- Fowkes, T. The influence of modelling error on the shapes of estimated demand functions. In Proceedings of the Seminar e Held at the 23rd European Transport Forum, University of Warwick, Coventry, UK, 11 September 1995; Available online: https://trid.trb.org/view/462365 (accessed on 1 January 2024).
- De Jong, G.; Daly, A.; Pieters, M.; Miller, S.; Plasmeijer, R.; Hofman, F. Uncertainty in traffic forecasts: Literature review and new results for The Netherlands. Transportation 2007, 34, 375–395. [Google Scholar] [CrossRef]
- Schmidt, M.; Kroon, L.; Schöbel, A.; Bouman, P. The travelers route choice problem under uncertainty: Dominance relations between strategies. Oper. Res. 2017, 65, 184–199. [Google Scholar] [CrossRef]
- Liang, J.; Wu, J.; Gao, Z.; Sun, H.; Yang, X.; Lo, H.K. Bus transit network design with uncertainties on the basis of a metro network: A two-step model framework. Transp. Res. B-METH 2019, 126, 115–138. [Google Scholar] [CrossRef]
- Fishman, G. Monte Carlo: Concepts, Algorithms, and Applications, 1st ed.; Springer: New York, NY, USA, 1995. [Google Scholar]
- Zito, P.; Amato, G.; Amoroso, S.; Berrittella, M. The effect of Advanced Traveller Information Systems on public transport demand and its uncertainty. Transportmetrica 2011, 7, 31–43. [Google Scholar] [CrossRef]
- Liu, F.; Luo, Z.; Li, Y.; Zheng, X.; Zhang, C.; Qian, H. Revisiting physical distancing threshold in indoor environment using infection-risk-based modeling. Environ. Int. 2021, 153, 106542. [Google Scholar] [CrossRef] [PubMed]
- Yang, Y.; Song, G.; Lu, S. Assessment of land ecosystem health with Monte Carlo simulation: A case study in Qiqihaer, China. J. Clean. Prod. 2020, 250, 119522. [Google Scholar] [CrossRef]
- Kannan, D.; Moazzeni, S.; mostafayi Darmian, S.; Afrasiabi, A. A hybrid approach based on MCDM methods and Monte Carlo simulation for sustainable evaluation of potential solar sites in east of Iran. J. Clean. Prod. 2021, 279, 122368. [Google Scholar] [CrossRef]
- Lin, S.S.; Shen, S.L.; Zhou, A.; Xu, Y.S. Approach based on TOPSIS and Monte Carlo simulation methods to evaluate lake eutrophication levels. Water Res. 2020, 187, 116437. [Google Scholar] [CrossRef] [PubMed]
- Conway, M.W.; Byrd, A.; van Eggermond, M. Accounting for uncertainty and variation in accessibility metrics for public transport sketch planning. J. Transp. Land Use 2018, 11, 541–558. [Google Scholar] [CrossRef]
- Pencheva, V.; Georgiev, I.; Asenov, A. Evaluation of passenger waiting time in public transport by using the Monte Carlo method. AIP Conf. Proc. 2021, 2321, 030028. [Google Scholar] [CrossRef]
- Ngossaha, J.M.; Ngouna, R.H.; Archimède, B.; Nlong, J.M. Sustainability assessment of a transportation system under uncertainty: An integrated multicriteria approach. IFAC Pap. 2017, 50, 7481–7486. [Google Scholar] [CrossRef]
- Lin, G.; Xu, H.; Wang, S.; Lin, C.; Huang, C. Performance Optimisation of Public Transport Networks Using AHP-Dependent Multi-Aspiration-Level Goal Programming. Energies 2022, 15, 6479. [Google Scholar] [CrossRef]
- Lin, G.; Wang, S.; Lin, C.; Bu, L.; Xu, H. Evaluating performance of public transport networks by using public transport criteria matrix analytic hierarchy process models—Case study of Stonnington, Bayswater, and Cockburn public transport network. Sustainability 2021, 13, 6949. [Google Scholar] [CrossRef]
- Jain, S.; Aggarwal, P.; Kumar, P.; Singhal, S.; Sharma, P. Identifying public preferences using multi-criteria decision making for assessing the shift of urban commuters from private to public transport: A case study of Delhi. Transp. Res. F 2014, 24, 60–70. [Google Scholar] [CrossRef]
- Boujelbene, Y.; Derbel, A. The performance analysis of public transport operators in Tunisia using AHP method. Procedia Comput. Sci. 2015, 73, 498–508. [Google Scholar] [CrossRef]
- Sadeghi, M.; Ameli, A. An AHP decision making model for optimal allocation of energy subsidy among socio-economic subsectors in Iran. Energy Policy 2012, 45, 24–32. [Google Scholar] [CrossRef]
- Nassereddine, M.; Eskandari, H. An integrated MCDM approach to evaluate public transportation systems in Tehran. Transp. Res. A 2017, 106, 427–439. [Google Scholar] [CrossRef]
- GB50220-1995; Code for Transport Planning on Urban Road. Available online: https://wenku.baidu.com/view/fa103f6b0b4c2e3f57276369.html (accessed on 1 January 2024).
- Evaluation Index System of Public Transportation City Assessment. Available online: https://wenku.baidu.com/view/1015f28a360cba1aa811dac1.html (accessed on 1 January 2024).
- GBT 22484-2016; Passenger Transport Services Specifications for Urban Bus/Trolleybus. Available online: https://pan.baidu.com/s/1eSeT2N4 (accessed on 1 January 2024).
- GB/T22484-2008; Passenger Transport Services for Bus/Trolleybus. Available online: https://wenku.baidu.com/view/3852176eccc789eb172ded630b1c59eef8c79ac6.html?fr=income1-doc-search&_wkts_=1706860887306&wkQuery=GBT+22484-2008+%E5%9F%8E%E5%B8%82%E5%85%AC%E5%85%B1%E6%B1%BD%E7%94%B5%E8%BD%A6%E5%AE%A2%E8%BF%90%E6%9C%8D%E5%8A%A1&needWelcomeRecommand=1 (accessed on 1 January 2024).
- Urban Road Traffic Management Evaluation Index System 2012 Edition. Available online: https://wenku.baidu.com/view/20e4368f84868762caaed5a1.html (accessed on 1 January 2024).
- Larbani, M.; Aouni, B. A new approach for generating efficient solutions within the goal programming model. J. Oper. Res. Soc. 2011, 62, 175–182. [Google Scholar] [CrossRef]
- Hamurcu, M.; Eren, T. Transportation planning with analytic hierarchy process and goal programming. Int. Adv. Res. Eng. J. 2018, 2, 92–97. Available online: https://dergipark.org.tr/en/download/article-file/522658 (accessed on 1 January 2024).
- Chang, C.T. Multi-choice goal programming. Omega 2007, 35, 389–396. [Google Scholar] [CrossRef]
- Chang, C.T. Revised multi-choice goal programming. Appl. Math. Model. 2008, 32, 2587–2595. [Google Scholar] [CrossRef]
- Chang, C.T. Multi-choice goal programming with utility functions. Eur. J. Oper. Res. 2011, 215, 439–445. [Google Scholar] [CrossRef]
- Jadidi, O.; Cavalieri, S.; Zolfaghari, S. An improved multi-choice goal programming approach for supplier selection problems. Appl. Math. Model. 2015, 39, 4213–4222. [Google Scholar] [CrossRef]
- Zhou, J.; Aghili, N.; Ghaleini, E.N.; Bui, D.T.; Tahir, M.M.; Koopialipoor, M. A Monte Carlo simulation approach for effective assessment of flyrock based on intelligent system of neural network. Eng. Comput. 2020, 36, 713–723. [Google Scholar] [CrossRef]
- Landau, D.; Binder, K. A Guide to Monte Carlo Simulations in Statistical Physics, 5th ed.; Cambridge University Press: New York, NY, USA, 2021. [Google Scholar]
- Managing Risks in Primavera Risk Analysis Rel. 8.6—Student Guide. Available online: https://education.oracle.com/en/managing-risk-in-primavera-risk-analysis-rel-86/courP_1090 (accessed on 1 January 2024).
- Regular Transportation Risk Assessment. Available online: https://www.weldon.com.au/wp-content/uploads/2021/01/2021-Regular-transporation-Risk-Assessment.pdf (accessed on 1 January 2024).
- Risk Assessment. Available online: https://www.ccohs.ca/oshanswers/hsprograms/risk_assessment.html (accessed on 1 January 2024).
- Montemanni, R.; D’ignazio, F.; Chou, X.; Gambardella, L.M. Machine learning and monte carlo sampling for the probabilistic orienteering problem. In Proceedings of the 2018 Joint 10th International Conference on Soft Computing and Intelligent Systems (SCIS) and 19th International Symposium on Advanced Intelligent Systems (ISIS), Toyama, Japan, 5 December 2018. [Google Scholar] [CrossRef]
| Disclaimer/Publisher’s Note: The statements, opinions and data contained in all publications are solely those of the individual author(s) and contributor(s) and not of MDPI and/or the editor(s). MDPI and/or the editor(s) disclaim responsibility for any injury to people or property resulting from any ideas, methods, instructions or products referred to in the content. |
© 2024 by the authors. Licensee MDPI, Basel, Switzerland. This article is an open access article distributed under the terms and conditions of the Creative Commons Attribution (CC BY) license (https://creativecommons.org/licenses/by/4.0/).


