1. Introduction
Even though government objectives might fluctuate over time, sustainable development frequently remains at the top of the list. All growth and development have energy as their primary component and active ingredient. Ensuring the security of this energy supply and minimizing its influence on climate change are the energy sector’s two primary challenges on the road to a sustainable future [
1]. Regrettably, the majority of energy consumed globally is conventional, unsustainable, and environmentally harmful. Such conventional energy does not allow for sustainable growth, since sustainable development is focused largely on environmental conservation, optimal utilization, and equal distribution of resources between the present and succeeding generations [
2].
Electricity is seen as a necessary component of modern life, is important for productivity, affects the economic status of most nations, and generally helps to advance and improve social welfare [
3]. Nevertheless, as conventional and non-renewable fuels like coal, oil, and natural gas [
4] are responsible for over one-third of global greenhouse gas emissions, suitable electrical alternatives must be created in their place. Therefore, raising living standards and providing a dependable, clean energy source become crucial [
5].
One of the main causes of climate change is greenhouse gas emissions from the production and use of energy. Climate change will also result in a concomitant rise in the demand for electricity, mostly for summer cooling needs [
6], as well as economic growth, which is considered to be the primary driver behind the raised electricity demand [
7].
Significant energy transformations are being implemented globally to address this issue; these transformations include upgrading the current energy mix, increasing the proportion of non-fossil energy in the energy mix, accelerating the development of non-fossil energy sources, and improving energy efficiency [
8]. Through these changes, the current reliance on fossil fuels is to be eliminated, and a clean, low-carbon, secure, and highly efficient contemporary energy system with a major role for non-fossil energy is to be achieved. From an economic point of view, the kingdom’s investment in renewable energy development offers many important benefits. First, promoting the diversification of energy sources by eliminating reliance on limited fossil fuels can increase long-term energy security through the use of renewable energy sources. Second, reducing domestic fossil fuel consumption will increase potential revenues from oil and gas exports. Third, supporting this industry will create opportunities for capital investment. Finally, economic development in the kingdom can create high-quality jobs that can contribute to the entire value chain of renewable energy sources, including national and international research and development. Saudi Arabia has the potential to further exploit its wind, solar, and geothermal potential. The peak demand for energy resources corresponds exactly to the highest level of global solar radiation (GSR) in the kingdom, as the kingdom is between 2000 and 2500 kWh/m
2 of solar potential. Increasing the share of renewable energy reduces domestic demand for fossil fuels and allows surplus oil and natural gas to be exported abroad for financial gain [
9]. The use and development of renewable energies, especially solar energy, can significantly improve the protection of the environment and ensure a sustainable supply of oil in stable and safe conditions. Thus, the Saudi government should reform its energy efficiency and consumption technologies to reduce energy waste and achieve the goals of sustainable development.
As a result, international organizations have been urging governments to commit to implementing their promises to achieve fair and sustainable development since the Earth Summit in Rio de Janeiro in 1992, and subsequent summits, due to mounting socioeconomic and environmental pressures. Since then, there has been a clear search for new and renewable energy sources that will meet the growing demand for energy while also preserving the environment and ensuring its sustainability, achieving justice between generations, creating new job opportunities, and fostering sustainable development. Using renewable energy will have a beneficial and substantial influence on attaining sustainable development in the Kingdom of Saudi Arabia, according to the main hypothesis of this study. To evaluate this hypothesis, this study relies on the inductive approach in surveying previous studies related to the subject of the study to identify the concepts related to renewable energy, sustainable development, and their most important indicators. This study also relies on the econometric approach to test the relationship between the use of renewable energy and sustainable development in the Kingdom of Saudi Arabia during the period 2000–2019.
Selecting the years 2000–2019 enables the recording of important policy shifts and developments in the Kingdom of Saudi Arabia, including the 2016 unveiling of the Vision 2030 plan, which places a strong emphasis on sustainability and diversification. Examining this timeframe offers an insightful overview of the dynamic interplay of the use of renewable energy, economic metrics, and sustainable development. Making sure that there were enough data available was essential for creating and analyzing models. All of the selected variables will have consistent and dependent data access due to the selection of this time range. Longer time series can offer more context, but they can also cause a loss in data consistency and quality further back in time. For conducting trustworthy analysis, 2000–2019 offers a fair mix of data availability, relevance, and duration. The Cobb–Douglas production function is a widely used function that connects output to a mix of labor and capital inputs. Selecting this function is consistent with the focus of research on the financial dimensions of sustainable development. As a major force behind sustainable development, we selected the variable of renewable energy consumption. Taking renewable energy as a variable enables us to evaluate its effects on production and sustainability in general. Non-renewable energy is included, nevertheless, so that various energy sources’ effects on economic output and sustainable development may be compared and analyzed. The labor force is a vital component of economic growth and productivity. By adding this variable, the interactions among labor, energy consumption, and sustainability may be represented in the model. Finally, the investment made in the physical capital stock, which affects long-term economic development and production capacity, is represented by gross fixed capital formation. This variable’s inclusion aids in evaluating how investments contribute to the realization of sustainable development.
2. Literature Review
Therefore, many countries have begun to make significant steps toward establishing and developing renewable energy sources to foster the transition to an economy with lower CO
2 emissions, to contribute to mitigating the risks created by the climate, protecting the environment, and promoting the efficient use of available resources [
10]. For example, given the environmental benefits of renewable energy, large oil companies such as Shell are investing millions of USD in renewable solar and wind energy technologies [
11]. According to [
12]., achieving the maximum potential of community renewable energy requires a thorough project planning process. Significant and meaningful local engagement may have two main consequences: learn effects, which improve local expertise in project creation and renewable energy, and catalytic effects, which encourage more community renewable energy projects. Although the authors emphasize the value of process, they also recognize that initiatives must help local communities in a concrete way. These advantages might be social, economic, or environmental. They can also be focused on local environmental improvements and how they can contribute to larger climate change goals. Social benefits include greater community cohesiveness, empowerment, and a sense of ownership. Economic benefits include the creation of jobs, money, and lower energy prices.
Using the ARDL technique, ref. [
13] examined the link between CO
2 emissions and the use of renewable energy in Turkey between 1980 and 2016. The authors established a long-term correlation between health spending and the use of renewable energy sources and CO
2 reduction. However, it has been found that there is a short-term correlation between GDP and the use of renewable energy and a rise in [
9,
14]. In a separate study, ref. [
15] found that while the GDP and the industrial sector had marginally beneficial effects on CO
2 emissions, the use of non-renewable energy had a positive effect on CO
2 emissions in seven selected countries. Energy usage has a favorable influence on CO
2 emissions, according to [
16]. who conducted an analysis of energy consumption data from Sichuan Province, China, from 2010 to 2019. Refs. [
17,
18] asserted that carbon dioxide emissions are out of phase with an anti-cyclic impact, and that renewable energy resources lead the series. The results of their estimation showed a strong long-term relationship between renewable energy sources and CO
2 emissions. Refs. [
13,
19] used a nonlinear panel smooth transition regression model and found that the utilization of renewable energy had a significant nonlinear effect on CO
2 emissions according to panel data for 33 OECD nations from 2000 to 2018. However, the CO
2 emissions associated with adopting renewable energy sources increase in significance as globalization increases.
However, it is necessary to indicate that economic growth also depends on other external factors, such as globalization. In fact, long-term economic growth is stimulated by economic, social, and political globalization. There is strong evidence that globalization in the political, social, and economic spheres reduces energy use. Third, we have discovered that energy consumption only considerably contributes to economic growth in the context of economic and social globalization, whereas economic growth is strongly correlated with energy consumption. Finally, while variables related to globalization have a considerable impact on both economic growth and energy consumption, the effect is nonlinear and differs greatly between models of both [
20,
21].
Ref. [
22] implied that there is substantial proof of a long-term relationship between the variables. Their results showed that, over the long term, expenditures for research and development, the consumption of renewable and non-renewable energy, and research have positive impacts on CEI, by 0.27%, 0.75%, and 0.21%, respectively, whereas the urban population has a negative effect of 2.31%. On the other hand, the short-term CEI has been positively impacted by both technical innovation and the urban population, by 0.23% and 12.17%, respectively [
22].
It is anticipated that the projected power demand in the Kingdom of Saudi Arabia (KSA); will exceed 120 gigawatts (GW) by the year 2032 [
23]. The KSA is the largest state in the Arabian Peninsula and the Middle East, encompassing a total area of over 2.25 million km
2. Also, the KSA occupies the highest position in terms of gross domestic product (GDP) within the Gulf Cooperation Council (GCC). However, it also demonstrates the highest rate of carbon dioxide (CO
2) emissions, which suggests a significant dependence on gas and oil as primary sources of energy generation [
24]. Approximately 80% of electricity consumption is allocated to the operation of air-conditioning systems. Water distillation companies consume an extra 17 million kilowatt-hours (kWh) in order to provide a daily supply of 235 L of drinking water per individual [
23]. The consumption of power and oil resources in the KSA has exhibited a significant and concerning growth trajectory when compared to global trends [
25,
26]. Therefore, in line with the goals proposed by the United Nations’ 2030 Agenda [
27], which include “grow affordable and clean energy”, ”improve clean water and sanitation”, and “organize climate action” [
28,
29], the Kingdom of Saudi Arabia’s Vision 2030 was coined, which strives to achieve comprehensive sustainable development. Among the primary objectives of the Saudi Vision 2030 is to establish renewable and sustainable energy initiatives, with the goal of generating 9.5 GW of renewable and sustainable energy” [
30], found that younger generations are more willing to pay for renewable energy than older generations. This suggests a shift in societal values towards sustainability and environmental protection. The study on the societal acceptability of renewable energy technologies (RETs) has been criticized by [
31]. According to the author, the discipline has undergone three different phases: the 1980s’ Normative Phase, the 1990s–2000s’ Criticism Phase, and the 2010s’ Critical Phase. Promoting the advantages of RETs and arguing for their social acceptability were the main goals of the first phase. The first phase’s excessively rosy outlook was contested in the second phase, which raised issues with local opposition to RETs and NIMBYism (not in my backyard). Ultimately, the third stage investigated the many social, political, and economic elements affecting RETs’ acceptability, going beyond NIMBYism.
Accordingly, the current study will focus on the role played by Saudi Arabia’s efforts as a developing country that seeks steady steps in accordance with its vision to reduce fossil fuels and rely on renewable energy, along with the impact of this in achieving sustainable development. Nonetheless, the literature has a clear gap concerning the verification of a causal relationship between efforts to replace conventional energy with renewable energy resources and achieving sustainable development in developing countries, e.g., Saudi Arabia. This article contributes to filling this gap and enriching the scientific research in this field.
3. Data and Model Specification
3.1. Data
Before starting our estimation, it is necessary to give the different abbreviations, definitions, measures, and sources of the different variables included in our econometric model. In effect, GDP denotes the gross domestic product in constant prices (calculated in million USD), EC denotes the non-renewable energy consumption measured as percentage of GDP, L denotes the human capital measured as the total labor force, and K denotes as the physical capital measured as the gross capital formation (calculated in constant LCU). All data variables were obtained from the World Development Indicators (WDI).
Table 1 recapitulates all of this information.
In next step, we try to give the descriptive analyses for the different variables summarized in
Table 2 below.
According to
Table 2’s results, all variables in Saudi Arabia have a slight positive skewness, which suggests that the country’s distribution is slightly skewed to the right. More data points are displayed on the right side of the distribution in this way. The distribution is somewhat leptokurtic, as the kurtosis indicator is marginally greater than the normal distribution. This indicates that the distribution contains higher extreme values of variables, corresponding to heavier tails than the normal distribution. One statistical test for determining normalcy is the Jarque–Bera test. In Saudi Arabia, the Jarque–Bera test’s
p-value is significant at the 10% level. This indicates that Saudi Arabia has a normal variable distribution.
3.2. Model Specification
To investigate the impact of renewable energy on sustainable development in the Kingdom of Saudi Arabia, this study employs the Cobb–Douglas production function [
31,
32] used in [
33] to analyze the relationship between energy consumption and economic growth. OLS is a computationally efficient and easily interpretable statistical model that excels in its simplicity and resilience to outliers. It could, however, need additional statistical adjustments due to its sensitivity to violations such as non-constant variance, correlated variables, and two-way interaction between variables. On the other hand, AMG [
34] handles these problems well, offering efficiency and versatility. It provides alternatives for handling endogeneity and is less prone to multicollinearity. Its processing requirements and complexity, however, pose difficulties, and on smaller datasets it might not perform better than OLS. The decision between OLS and AMG ultimately comes down to the particularities of our data, the nature of our research issue, and the resources that are at our disposal. For our study of Saudi Arabia, carefully considering the benefits and drawbacks of the OLS strategy will help us to arrive at the most reliable and perceptive conclusion.
In general, the equation of the production function is as follows:
where
Y denotes the gross domestic product (at constant prices),
RE is the renewable energy share in the total final energy consumption (%),
EC is the non-renewable energy consumption as a percentage of GDP,
L is the labor force,
K is the gross capital formulation,
C is a positive constant (the level of technology), and
α1,
α2,
α3, and
α4 are the returns to scale associated with renewable energy consumption, capital, labor, and non-renewable energy consumption, respectively. Due to data availability, this study depends on data covering the period 2000–2019.
The log transformation of the model is as follows:
where
log C is a constant and
,
,
, and
are the elasticities of output with respect to renewable energy consumption, non-renewable energy consumption, labor force, and gross fixed capital formation, respectively, while
ut is an error term.
Initially, the model was estimated using ordinary least squares (OLS). Before explaining the estimated multiple linear regression model, several tests were conducted to check the goodness of fit of the estimated model. One of these tests was the covariance matrix of the explanatory variables. Covariance can be positive, negative, or zero. A positive covariance means that the two variables tend to increase or decrease together. A negative covariance means that the two variables tend to move in opposite directions. A zero covariance means that the two variables are not related.
In order to check the problem of non-stationarity of the dependent variables, a unit root test was carried out. The null hypothesis is always that the variable has a unit root. Two options can be used to detect the unit root in the time series: including the drift term in the regression, and including the drift and trend terms in the regression. This step was carried out using the augmented Dickey–Fuller (ADF) test. Because we were initially concerned about unit roots in the time-series data, we decided to use the augmented Dickey–Fuller test with the trend and constant terms (ADF with trend). This version is perfect for our GDP data analysis, since it supports datasets that show both a possible unit root and a linear trend. We set out to verify stationarity with the trend, as opposed to the null hypothesis, which suggests the existence of a unit root. To put it another way, this suggests that there is a unit root associated with a deterministic trend that eliminates the non-stationarity after one differencing. Our choice of the ADF with trend was informed by a visual examination of the data, supported by other unit root tests such as KPSS, and consistent with the predictions of economic theory. We do, however, acknowledge the existence of other versions of the ADF test, which, depending on the particular data under consideration, may be investigated in future research. Examples of these versions include those that incorporate seasonal differencing or structural breaks.
On the other hand, statistical methods for simulating linear connections between variables are employed in multiple linear regression (MLR) models. With the help of the independent variables (x), they seek to determine the equation of a line that best matches the data points, enabling the forecasting of the dependent variable (y). Both employ the OLS technique to calculate the model’s coefficients. In order to minimize the sum of squared residuals (errors) between the dependent variable’s predicted and actual values, this approach makes certain assumptions about the data, including homoscedasticity, normality, and linearity. Apart from that, OLS is easier to compute and explain because it only works with one independent variable. However, because of the increasing number of variables and their interactions, MLR is more complicated and can handle two or more independent variables.
4. Results
Initially, the model was estimated using ordinary least squares (OLS), as represented in
Table 3. The results show that the variables RE and EC have negative impacts on Saudi GDP. However, it is appears that both K and L played crucial roles in increasing Saudi GDP during the 2000–2019 period.
Table 4 shows the covariance matrix of the explanatory variables of the estimated model. However, covariance is only useful to find the direction of the relationship between two variables, not the magnitude. The covariance matrix of regression model coefficients shows that there are negative correlations between L and RE, and between L and K. Moreover, there are three negative correlations between EC and K, between EC and L, and between EC and L. On the other hand, RE is positively correlated with K and EC.
To check the magnitude of the correlation between the explanatory variables, the correlation matrix was calculated, and the variance inflation factor (VIF) test was conducted for the independent variables of the estimated model. Correlation between independent variables may result in a problem of multicollinearity.
Table 5 displays the correlation matrix between the explanatory variables of the estimated model. It is obvious that there is a high positive correlation between LogRE and LogK (0.849), while there is a high negative correlation between LogRE and LogL (−0.942) and between LogK and LogL (−0.944). These results may indicate that there is a problem of multicollinearity in the estimated model.
The variance inflation factor is also a useful way to look for multicollinearity amongst the independent variables. A VIF value of more than 10 indicates that there is a problem of multicollinearity of that variable with other independent variables.
Table 6 shows that VIFs of the variables LogRE, LogK, and LogL are very high (i.e., more than 10), which indicates that the estimated model suffers from the problem of multicollinearity.
When dealing with time-series data, the multicollinearity problem frequently arises. The simultaneous changes in variables over time, which give rise to the issue of time-series instability, are among the primary challenges that researchers face when utilizing time-series data. This issue may result in misleading correlations between variables and insufficient statistical conclusions due to incorrect regression findings. Some drawbacks of multicollinearity include inflated standard errors. In fact, it becomes harder to distinguish each variable’s unique impacts inside the model when there is a significant correlation between them. As a result, it may become more difficult to assess the statistical significance of certain coefficients, due to exaggerated standard errors. In our scenario, the interaction between renewable energy and other elements, such as non-renewable energy, may make it difficult to determine the real impact of renewable energy on GDP and its relevance. It is also critical to discuss erroneous coefficient estimates. Therefore, estimations of the coefficients themselves may potentially be erroneous as a result of multicollinearity. This implies that certain factors’ estimated effects on GDP may be deceptive in terms of both their size and direction. For instance, a negative but negligible coefficient for renewable energy may just be an artifact of its association with other model variables, rather than accurately reflecting its relationship with GDP. Multicollinearity can also worsen a model’s fit. In fact, multicollinearity may have a detrimental influence on the model’s overall fit under extreme circumstances. This suggests that if the variables had less correlation, the model might not be able to explain the fluctuation in GDP as effectively. This calls into question the general validity of any findings about the correlations between the variables.
In order to check the problem of non-stationarity of the dependent variables, a unit root test was carried out. The results from the ADF test are shown in
Table 7. It is obvious that all variables are non-stationary at level but stationary at the first or second difference. In fact, the variables Y, R, and K are not stationary at level, but there are stationary at the first difference. L becomes stationary at the second difference. Finally, NR is stationary at level only in the case of constant; however, it is stationary at the first difference in the case of constant and/or constant and trend.
As data series are not stationary at level, estimating the previous model using OLS frequently suffers from the problem of non-stationary regressors and spurious regressions, which do not reflect long-term relationships but, rather, common temporal trends [
35]. In order to overcome this problem, the model can be estimated using stationary variables (first or second difference).
Therefore, the estimated model is
The estimated results of the revised model are shown in
Table 8.
The results of the estimated model indicate that there is a negative but insignificant impact of renewable energy consumption on GDP. An increase in renewable energy consumption by 1 percent results in a decrease in GDP by 0.033 percent (contradicting the findings of [
36]. The results also show that fixed capital formulation has a significant positive impact on per capita income, as expected [
37]. A 1% increase in fixed capital formulation leads to a 0.139% increase in GDP. Moreover, the labor force has a positive impact on GDP, as expected; however, this effect is not statistically significant (the same result was found [
38,
39])). Furthermore, energy consumption has a negative and significant impact on GDP (contradicting the findings of [
12,
15])). A 1 percent increase in the energy consumption ratio of GDP results in a 0.712 percent decrease in GDP. The constant of the model refers to the level of technological progress. It is clear that technological progress has a positive and significant impact on sustainable development in Saudi Arabia, as technological progress boosts productivity. An increase in technological progress by 1 percent results in an increase in GDP by 0.03 percent.
The goodness of fit for the linear regression model is measured by R-squared. R-squared measures the strength of the relationships between the model and the dependent variables. R-squared explains how the explanatory variables explain the variations in the dependent variable. The adjusted R-squared in the fitted model is 0.716, which indicates that about 71.6% of the observed variation can be explained by the explanatory variables in the model.
The F-test of overall significance indicates whether the linear regression model provides a better fit to the data than a model that contains no independent variables. The value of the F-statistic of the estimated model is 11.69, and the p-value of the F-test for the overall fit of the model is significant, at 1%, which indicates that the model is well specified.
Again, the VIF test was used to estimate the explanatory variables of the revised estimated model. The results in
Table 9 show that the VIFs are less than five, which is a good indicator of the non-existence of a multicollinearity problem in the revised model.
The assumption of homoscedasticity (constant variance) is central to linear regression models. Homoscedasticity describes a situation in which the error term is the same across all values of the independent variables. This means that the residuals have constant variance at every point in the linear model. Heteroscedasticity is present when the size of the error term differs across the values of an independent variable. To test the existence of heteroscedasticity, the Breusch–Pagan/Cook–Weisberg test was conducted after fitting the model. The null hypothesis (Ho) was that the error term has a constant variance, versus the alternative that the error variances are not constant. A large chi-squared would indicate that heteroscedasticity was present. The chi-squared value of the test was small (0.05) and insignificant, indicating that heteroscedasticity is not a problem in the estimated model.
To check that the residuals of the model were normally distributed, the Shapiro–Wilk W test was conducted for the residuals of the fitted model. As reported in
Table 10, the
p-value of the test was 0.023, which indicates that the residuals of the model were not normally distributed at the 5% level of significance. However, normalization of residues is not required to obtain unbiased estimates of regression coefficients. OLS regression merely requires that the errors be identically and independently distributed.
A common source of model specification error in OLS regressions is the omission of relevant variables. When variables are omitted, variations in the dependent variable may be falsely attributed to the included variables. The Ramsey test was used to check if there was a problem with omitted variables in the estimated model. The null hypothesis of this test is that the model has no omitted variables. The value of the F-statistic was relatively low (F = 0.34), and the p-value = 0.797, which indicates that the fitted model did not suffer from specification error of omitted variables.
To check autocorrelation between residuals, Durbin’s alternative test was conducted for the estimated model. This test is an alternative to the Durbin–Watson (DW) test for autocorrelation in the residuals, which always has a value ranging between 0 and 4. The Durbin–Watson test only looks at autocorrelation at lag 1. The DW and Durbin’s alternative exact tests are quite comparable in their overall performance, as indicated by their estimated powers. However, Durbin’s alternative test does not require that all of the regressors be strictly exogenous, and it is suitable for a small sample size [
35]. The null hypothesis is that “there is no serial correlation”. As shown in
Table 11, the value of chi
2 was 0.011 and the
p-value of the test was 0.9167, which indicates that there was no serial correlation between the errors.
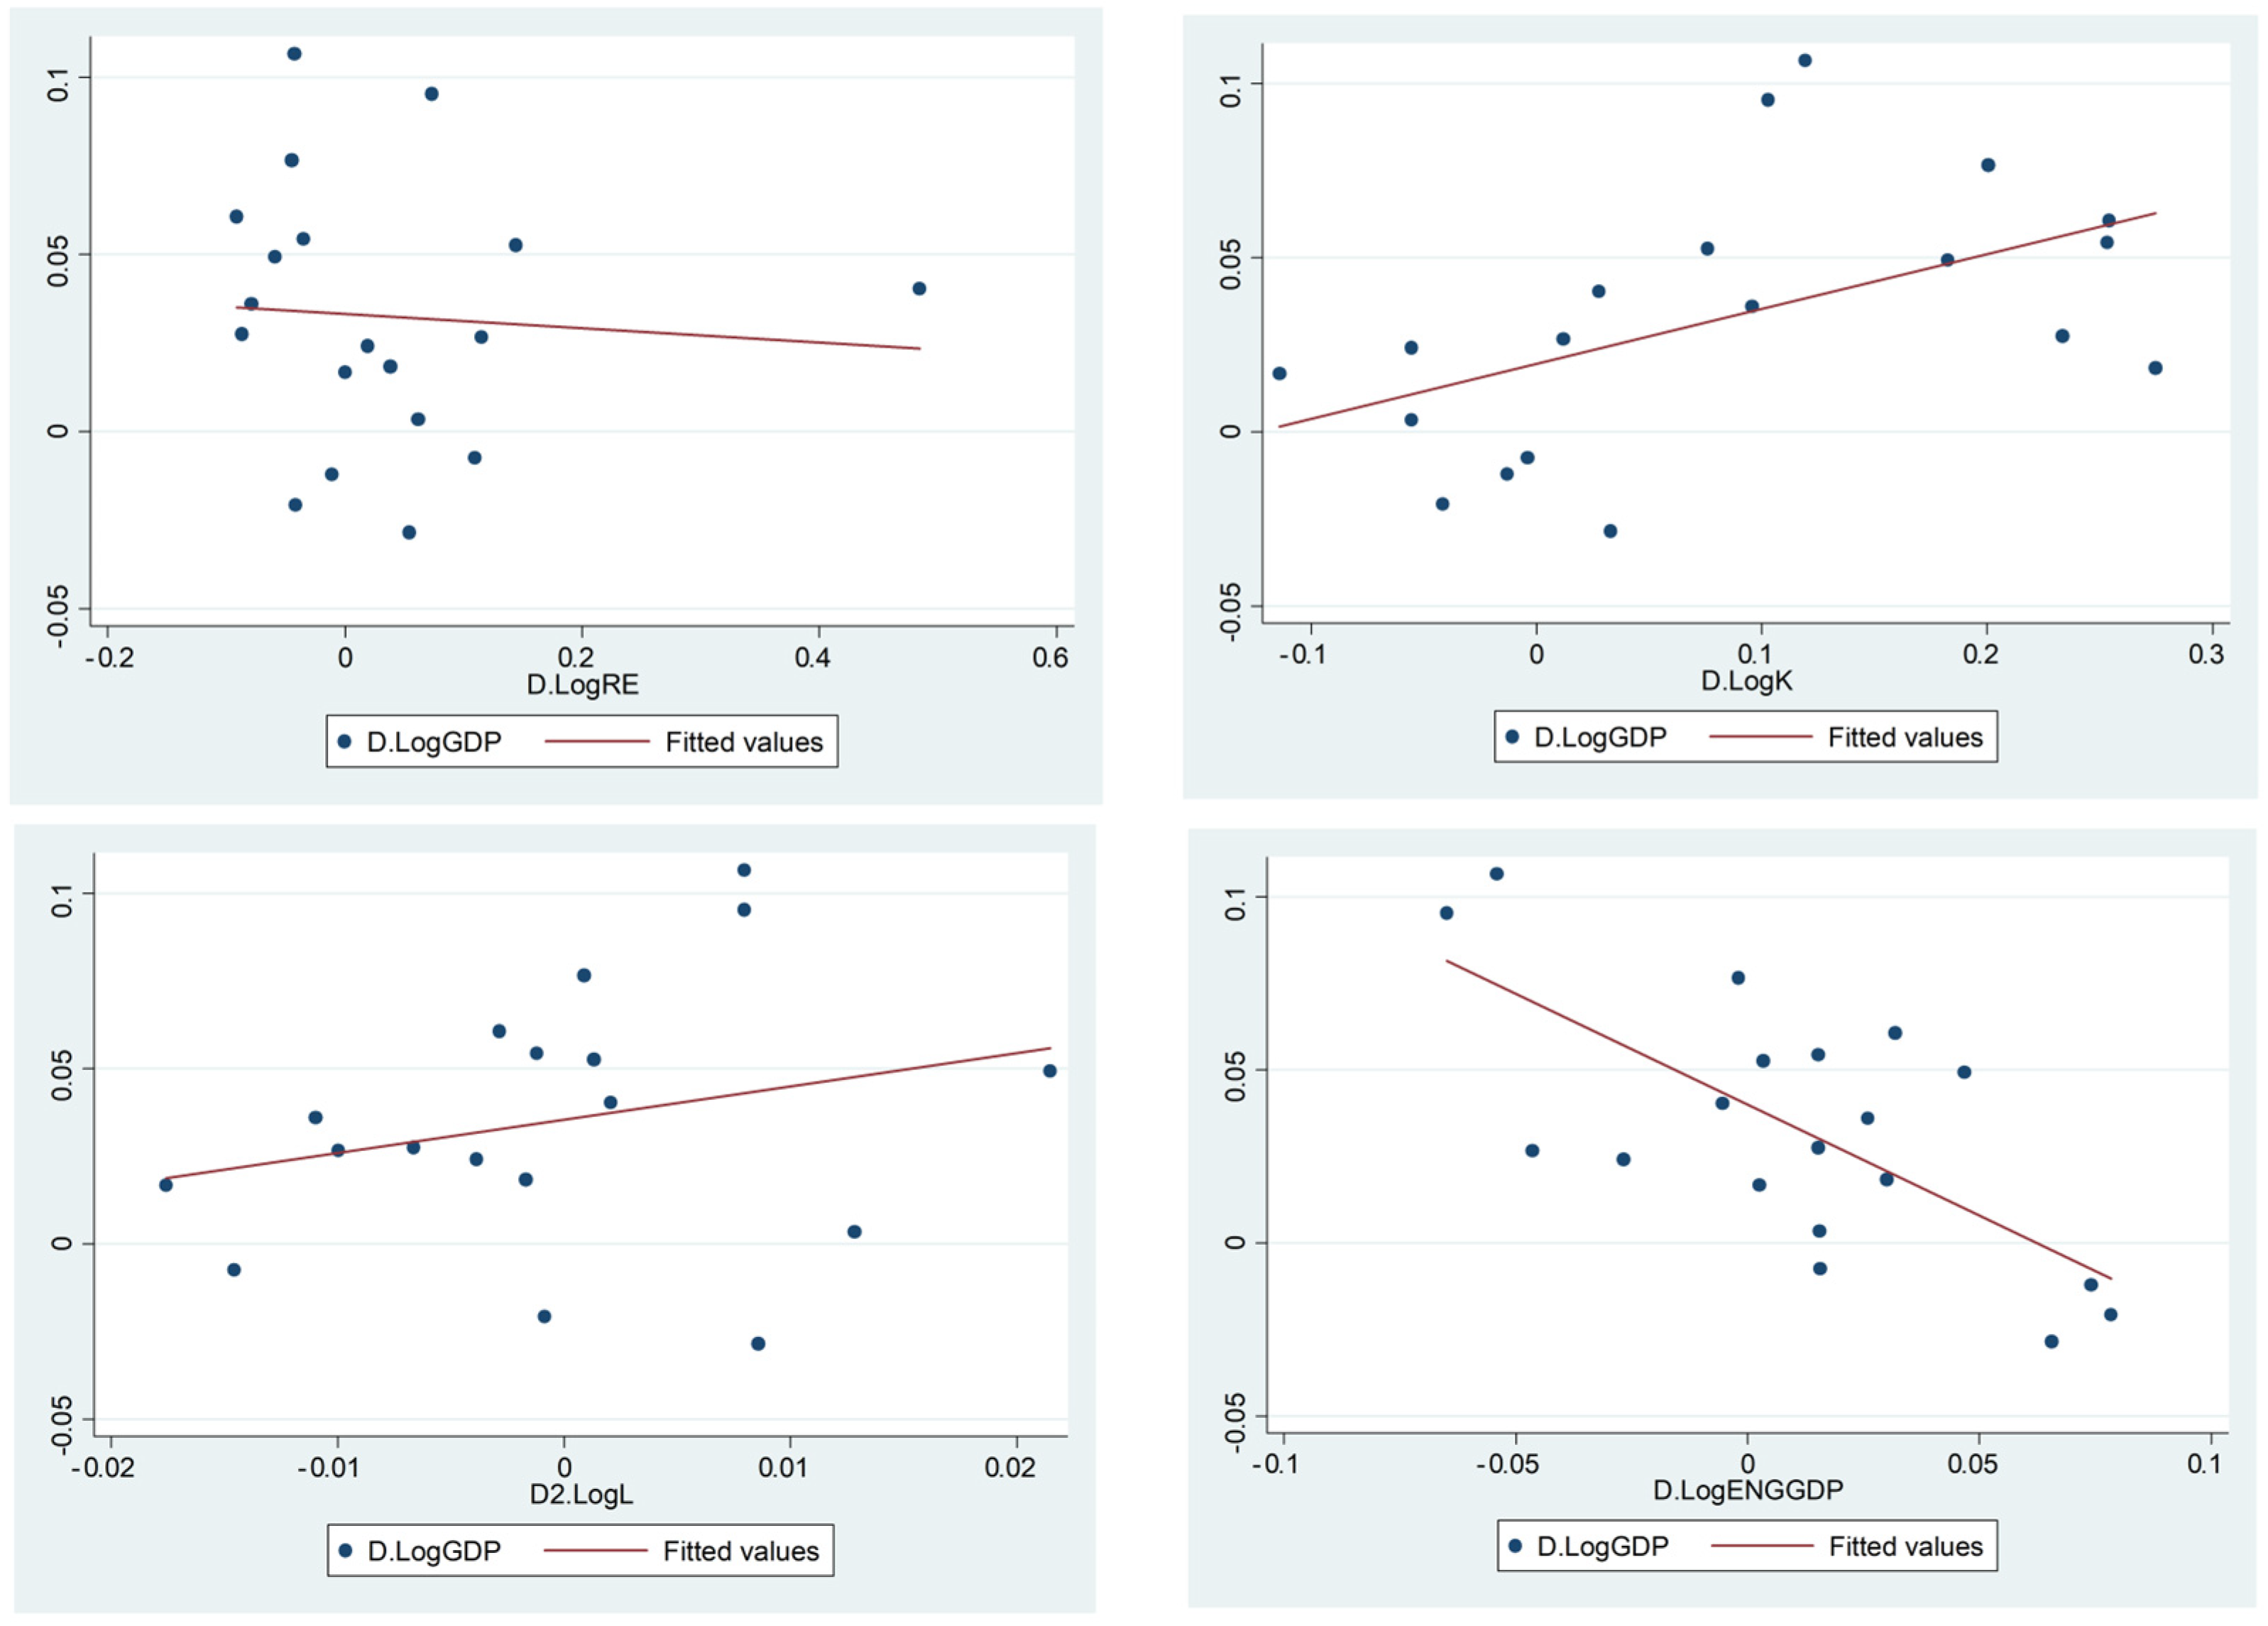
Linear regression needs the relationship between the independent and dependent variables to be linear. When we perform linear regression, we assume that the relationship between the response variable and the predictor is linear. If this assumption is violated, the linear regression will try to fit a straight line to data that do not follow a straight line. The linearity assumption can best be tested with scatterplots to see if nonlinearity is present, such as a curved band or wave-shaped curve. The scatterplots of the dependent variable (DLogGDP) with the explanatory variables in
Figure 1 show that the relationships between them are linear.
5. Discussion
The results of the estimated model provide evidence that renewable energy does not have a significant impact on sustainable development in Saudi Arabia. This may be due to the heavy dependence of the industrial sector in Saudi Arabia on traditional sources of energy, especially fossil fuels. This implies that efforts to increase reliance on renewable energy sources, which would assist countries in cutting fossil fuel use and achieving sustainability, have a negative impact on GDP. This may be related to the high economic cost of using renewable energy and, thus, may negatively affect GDP. The insignificant impact of renewable energy consumption on GDP may be due to the humble percentage of renewable energy consumption as a proportion of the total energy consumption, as reported in
Table 12. It appears that all variables shown in
Table 12 display an increasing rate over time.
Furthermore, the results indicate that energy consumption from non-renewable sources has a negative and significant impact on GDP. According to BP World Energy Statistics in 2017, in 2016 Saudi Arabia was the tenth-largest consumer of total primary energy, equivalent to 266.5 million tons of oil, 63% of which consisted of oil and petroleum liquids. Natural gas accounted for the remaining 37% of consumption. Saudi Arabia is the largest consumer of oil in the Middle East. In 2016, Saudi Arabia consumed 3.9 million barrels of oil per day (bpd). Oil consumption increased by an average of 7% per year between 2006 and 2016, mainly due to rapid economic growth and government-subsidized energy prices [
40]. The negative impact of energy consumption of non-renewable resources provides evidence that primary energy consumption constrains sustainable development (as represented by GDP) in Saudi Arabia.
The results also indicate that the labor force has a positive impact on GDP, as expected; however, this effect is not statistically significant (the value of
t-standard error, equal to 0.499, is greater than 0.005). More human resources are effectively accessible for production in a variety of industries, including manufacturing, services, and agriculture, when there is a greater labor force. As a result, more products and services are created overall, which directly supports economic growth. Furthermore, greater employment increases workers’ earnings, which raises the economy’s total demand for products and services. This encourages companies to increase their output and add staff, resulting in a positive feedback cycle that fosters growth. Furthermore, a more employed labor force increases the government’s tax receipts. This makes it possible for the government to invest more in infrastructure, healthcare, and education, all of which enhance the economic climate and draw in new investors and enterprises, resulting in economic growth [
41].
6. Conclusions
This research employed the Cobb–Douglas production function to study the impact of renewable energy consumption, non-renewable energy consumption, labor force, and gross fixed capital formation on sustainable development in the Kingdom of Saudi Arabia, and it identified the most important practices carried out by the Kingdom in this field to achieve sustainable development during the 2000–2019 period. The results of the estimated model indicate that there is a negative and insignificant impact of renewable energy consumption on GDP. This result implies that the effort to increase reliance on renewable energy sources, which would assist countries in cutting fossil fuel use and achieving sustainability, has a negative impact on GDP. This may be related to the high economic cost of using renewable energy and, thus, may negatively affect GDP. It is important to consider potential mechanisms behind this observation. In effect, the “high economic cost” is based on factors like the initial infrastructure investment. So, transitioning to renewable energy often requires upfront investments in infrastructure like wind farms or solar panels, which can initially impact GDP even before generating positive returns. However, it is important to discuss the subsidy dependence. In fact, some renewable energy sources may rely on government subsidies for viability, making them vulnerable to policy changes and potentially creating economic instability. Finally, the new technological process has some limitations. In reality, certain renewable energy technologies might have lower energy density or efficiency compared to fossil fuels, leading to higher costs per unit of energy produced.
The results also show that fixed capital formulation has a significant positive impact on per capita income, as expected. Moreover, the labor force has a positive impact on GDP, as expected; however, this effect is not statistically significant. Furthermore, energy consumption has a negative and significant impact on GDP, which implies that primary energy consumption constrains sustainable development (as represented by GDP) in Saudi Arabia. Also, the results indicate that technological progress has a positive and significant impact on sustainable development in Saudi Arabia.
Although this study made use of tried-and-true techniques and variables, its results highlight several intriguing and perhaps novel ideas, including a surprising discovery about renewable energy. In actuality, renewable energy has a negligible but surprising negative effect on GDP, which may be innovative. This casts doubt on the widely held belief that renewable energy fosters economic expansion in general. The findings of this research also raise the possibility of the high economic expenses of renewable energy as a reason, which may warrant further debate and research. Furthermore, attention must be paid to technical advancement. Thus, this study emphasizes how technological advancement has a beneficial and substantial influence on sustainable development. This highlights how crucial technological innovation is to reaching sustainability objectives, perhaps even going beyond renewable energy technologies alone. Finally, this research looks at these connections in the particular setting of Saudi Arabia, a significant oil producer making the switch to renewable energy. This context-specific study may provide insightful information for economies that are comparable to others.
This study, taken as a whole, makes some recommendations to Saudi government policymakers about how to improve energy efficiency and consumption technologies in order to cut down on energy waste and accomplish sustainable development goals. One such recommendation is to introduce targeted subsidies for particular renewable energy projects or technologies in order to lessen the initial high cost burden. Additionally, this study recommends providing tax benefits or loan guarantees to people and companies who make renewable energy investments, as well as creating stable, long-term energy policies to reduce uncertainty and promote investment—for example, investing in energy-efficient renewable technologies and supporting research and development into newer, more efficient renewable technologies to reduce costs per unit of energy produced and increase energy density. Prioritizing the development and implementation of grid-scale storage technologies is crucial in order to enhance the assimilation of variable renewable energy sources into the electrical system. Secondly, in order to reduce reliance on certain technologies and meteorological factors, it is critical to diversify the mix of renewable energy sources, including wind, solar, geothermal, hydropower, and biofuels.
However, this analysis may be constrained by the lack of precise and comprehensive data on Saudi Arabia’s use of renewable energy, particularly for the earlier years of the 2000–2019 timeframe. The validity of the analysis and results may be impacted by this. It is possible that data on all relevant variables, such as institutional factors, social indicators, and environmental indicators that potentially have an impact on sustainable development, were not available for this study. This might have resulted in an inaccurate representation of the intricate connection between sustainable development and renewable energy. Furthermore, this research may only have access to aggregated data on the use of renewable energy, which may obscure significant regional differences. This might make it more difficult to understand the unique factors influencing the adoption of renewable energy in various regions of the nation.
With respect to international affairs and forthcoming investigations, the recent surge in energy costs, coupled with geopolitical unrest, may have a substantial bearing on the future course of renewable energy in Saudi Arabia. These possible modifications should be acknowledged in this study, and their potential impacts on the assumptions and results should be taken into account. Rapid technological developments, however, have the potential to alter the viability and cost-effectiveness of many renewable energy solutions in Saudi Arabia. Future studies must include these advancements and investigate how they could affect the nation’s sustainable development objectives. Saudi Arabia’s social and political environment is changing dramatically, which may have an impact on how the public views renewable energy sources and the government’s readiness to make investments in them. Future studies should take these variables into account and investigate how they could affect the popular acceptance of renewable energy sources and the policies that govern them.
7. Policy Implementation, Implementation Challenges, and Social Acceptability
Rather than only proposing changes to energy efficiency and consumption technologies, researchers may more deeply explore the particular policies that might be put into place. Details including incentive schemes for producers and users of renewable energy, such as tax incentives, subsidies, and feed-in tariffs, may be included. It is crucial to concentrate on regulatory reforms as well, such as requiring businesses to use a certain amount of renewable energy, revising building rules to promote energy efficiency, and expediting the permit process. In addition, it is critical to promote domestic solar and wind energy production, develop renewable energy technology research and development, and build the grid infrastructure needed to integrate renewable energy sources.
In terms of implementation difficulties, researchers should recognize the possible difficulties like the initial investment costs that come with putting these ideas into practice. In actuality, switching to renewable energy requires large upfront costs, which may impose a financial burden. But this is the moment to talk about fossil fuel dependence first. The economy of Saudi Arabia is actually highly dependent on fossil fuels, and those with entrenched interests may be resistant to change. Second, research ought to focus on technological constraints, e.g., some renewable technologies might not be appropriate for all areas or applications, and grid integration issues might arise.
Ultimately, in order to adopt renewable energy plans in Saudi Arabia, it is imperative to consider societal acceptance. This might involve educating the public about the advantages of renewable energy sources and resolving any potential concerns about noise pollution, aesthetics, or environmental effects. Additionally, it is critical to take sociocultural factors into account by identifying and resolving any potential cultural or religious sensitivities related to the use of renewable energy.
Here are a few key points on the relationship between policy and social acceptability to wrap up: First, it can highlight the ways in which policy choices and the general efficacy of sustainable development initiatives can be impacted by addressing social acceptability issues. Second, although ignoring social issues might result in public opposition and impede the implementation of renewable energy projects, successful public participation can lead to more focused and efficient policies.
8. Avenues for Future Research
Although insightful, the first study on Saudi Arabia’s sustainability and renewable energy offers opportunities for more in-depth research. Subsequent investigations could explore the intricate effects on GDP of certain renewable energy sources (wind, solar, etc.). It would be helpful to give context if the model is expanded to incorporate elements like policy tools, infrastructural changes, and financial dynamics. It might be particularly instructive to investigate potential nonlinearities in the link between GDP and renewable energy, including tipping points for increased effect. Furthermore, dynamic models that monitor the changing policy and energy environments will provide a more forward-looking viewpoint. Ultimately, conducting comparative analyses among other nations could yield more comprehensive perspectives for improving Saudi Arabia’s sustainable energy approach. By exploring these paths more thoroughly, we may gain a greater understanding of how renewable energy actually influences sustainable development, not only for Saudi Arabia, but for the whole world.


