1. Introduction
The eighth of the 17 Sustainable Development Goals (SDG) calls for long-term, inclusive, sustainable economic growth and full and productive employment. To attain this goal, sustainable economic development and full employment are required. In 2020, COVID-19 triggered a global recession and a major increase in unemployment, leading to a global collapse in SDG performance, including nations from the Organization for Economic Cooperation and Development (OECD) [
1].
Thus, the European economy is currently being tested by multiple challenges. The COVID-19 pandemic and, more recently, the Russian invasion of Ukraine are testing the resilience of the European economy, as they have unexpectedly thrown the European Union and the whole world into a severe economic and social crisis. In addition to all of this, the need to ensure the green and digital transition in the context of unfavourable structural trends (demographic and labour market changes, as well as essential changes in global trade) requires well-designed, fair and efficient tax systems that ensure stable and sustainable fiscal revenues and stimulate innovation and productivity, thereby supporting sustainable and inclusive growth [
2].
Income inequality is a significant problem because it can lead to reduced social cohesion, lower economic growth, increased political instability, and poorer health and education outcomes. As such, policymakers and society as a whole need to work together to address this issue and promote a more equitable distribution of income and wealth [
3,
4,
5].
Properly designed fiscal policy can be critical in distributing disposable income (after taxes and transfers), and this fiscal policy supports social mobility indirectly by reducing income inequality. Progressive taxation favours also social mobility through an insurance effect, which allows for better allocation of skills. Several fiscal policy measures have the potential to directly increase social mobility (progressive taxation, cash transfers, progressive social spending, inclusive labour market policies or asset-building policies) [
6,
7].
Those with greater salaries pay a higher percentage of their income in taxes, which can assist in reducing income disparity and improving social mobility. Direct cash transfers, such as social assistance programs or universal basic income, can offer low-income people and families a safety net, while reducing income inequality. Progressive social expenditure initiatives, such as investments in education and healthcare, can enhance social mobility by equipping people with the tools and skills they need to thrive in the job market. Minimum wage regulations, collective bargaining, and anti-discrimination legislation can assist in reducing economic disparity and encourage social mobility. Generally, fiscal policy measures that reduce income inequality provide a safety net for the most disadvantaged, invest in human capital, and promote inclusive and fair labour markets, thus assisting in fostering social mobility. At the same time, combating tax evasion and fraud remains a priority, both at national and European levels, so that Member States can collect taxes reasonably and efficiently; ensuring trust in public policies is essential.
With all these factors in mind, research and debate on the tax system are indispensable in the current context in order to identify the best way to manage both the problems arising from unfortunate and relatively recent events, as well as the structural problems associated with the efficiency and the equity of the tax system.
Taxes are necessary, and their primary aim is to collect cash to pay for government spending and meet public needs. Taxes are often classified into two types: direct and indirect. Direct taxes are collected on taxpayers’ income and activities and are paid directly to the government, whereas indirect taxes are allocated to products and services.
According to [
8], to maximise the effectiveness of the tax system without making the tax burden onerous, tax facilities that damage neutrality and encourage legitimate tax cheating must be rejected.
Regarding individual earnings, a greater taxation degree might have two effects: a negative one, wherein a person stops their activity, and a critical one, wherein the person begins a complementary activity to enhance their income level. High taxes may hurt businesses because they reduce the motivation for careful and sensible business practices when applied to corporate revenue and excessive profits [
9]. Their level of capital, as well as that of investment, savings, and the rate of loan facilities issued, would be discouraged.
Keynes [
10] argued that reducing the government’s taxes would lead to increased individual spending, more relaxed business operations, and higher demand for everyday goods. He believed that fiscal policy should be used to achieve a fair income distribution, and that this would result in increased consumption. Keynes also emphasised that tax contributions should be proportional to an individual’s income and wealth, as unequal taxation could lead to tax evasion.
Over the years, significant debate and studies have been conducted on the influence of direct taxes on economic growth. According to several types of research, large amounts of direct taxes may harm economic growth by discouraging labour, savings, and investment. This is because high tax rates lower the motivation for individuals and corporations to work harder and invest more, eventually slowing economic development [
11,
12,
13].
Some studies, however, imply that the link between direct taxation and economic growth is more complex, and that the influence of taxes on growth is affected by several factors, including the degree of economic development, the structure of the tax system, and the use of tax proceeds [
14,
15,
16]. These studies acknowledged that various factors, including the level of economic development, the form of the tax system, and the utilisation of tax proceeds, impact the relationship between direct taxation and economic growth. Furthermore, direct taxation may not be the most effective approach to redistribute income in developing nations, and the structure of the tax system may need to be modified to local conditions. Similarly, the utilisation of tax resources may substantially influence economic growth, since taxes can be used to support human capital or infrastructural improvements, which can boost economic growth.
In rich and developing nations, taxes on domestic products and services, including tariffs, have increased GDP growth [
17,
18,
19]. On the other hand, taxes negatively correlate with economic growth in emerging countries [
20]. Moreover, income tax is negatively and strongly correlated with GDP in industrialised nations, but it is inconsequential in underdeveloped nations [
21,
22,
23]. To fully understand the effect of taxes on economic development in industrialised and developing nations, additional research is necessary to bring to light these contradictory results.
Therefore, in this context, this research used panel data from all 27 EU countries covering the period 2008–2020 to investigate the impact of direct taxation on economic growth at the level of two main clusters of countries concerning fiscal efficiency. Therefore, the analysis employed cluster methods to classify the main EU countries in both groups of countries with a high level of fiscal efficiency and those with a rather limited level of fiscal efficiency.
This paper brings important contributions to the literature in several ways. The study presents empirical evidence on the link between direct taxation and economic growth, which may be used to drive policy decisions and provide insights into how taxation affects economic growth. Panel data analysis was employed in the study to evaluate the effect of direct taxes on economic growth. It incorporates classifying EU countries based on fiscal efficiency indicators into highly efficient countries and rather limited fiscal efficiency countries. It used the most recent official statistics, covering the period 2000–2020, considering how the COVID-19 pandemic affected economic growth.
Furthermore, in addition to direct taxation components, the panel data regression models also incorporated investments, government expenditures, unemployment and tax revenue increases. Additionally, the research extended the theoretical framework to explain how direction taxation affects economic growth by considering the potential relationship between the informal and official economies. As a robustness check, the study used a fixed effects (FEE) and dynamic GMM method to examine the relationship between the direct taxation system and economic development. The dynamic GMM method for panel data analysis over FE models offers the capacity to handle endogeneity, increase efficiency, handle unobserved heterogeneity better, and incorporate lags.
The study also adds to the literature by contextualising the impact of direct taxation on economic growth within broader economic, social, and political contexts, as well as providing evidence on how the relationship between taxation and growth varies across countries or is affected by other factors such as the informal economy.
The paper is organised as follows. After introducing the main topic of the research, the next section points out the main studies from the literature and acknowledges the empirical evidence of this relationship. In contrast, the section on materials and methods introduces the main data used and the research methodology. The
Section 4 is dedicated to the empirical results, including the robustness check, and the paper ends with the main conclusions and limitations of the study.
2. Literature Review
The national government is vital in producing revenue through taxes, regulating economic activity, and promoting economic advancement [
24]. These functions ensure that the economy operates effectively and fairly, and that the advantages of economic progress are dispersed in a way that promotes societal well-being.
The increased tax will constrain individual taxpayers’ ability to contribute to economic progress, while the same holds for business taxpayers, since greater taxes may limit their capacity to release more goods onto the market. The government states that the raised tax would provide funding for infrastructure, health, education, and basic information technology investments, expected to generate future economic productivity gains.
According to the Solow Growth Model [
25], variations in the rates of population increase, savings growth, and technical advancement all impact economic development. Barro [
26] and Jones [
27] developed the economic model into endogenous growth models, which explored the economic consequences of tax composition. The economic model was expanded to account for the impact of personal income tax on the saving rate. According to [
11], p. 104), consumption taxes indirectly impact the “net after-tax return on physical capital” through the labour–leisure decision. Moreover, ref. [
12] pointed out that when consumer items grow more costly, value-added tax (VAT) also influences the labour–leisure decision. According to economic theory, all taxes impact how quickly the economy grows Analysing the connection between fiscal policy and economic growth in industrialised and emerging nations is attractive to many academics and researchers [
27,
28,
29,
30,
31,
32]. These studies shed light on the effects of various fiscal policies, including capital flow regulations, government spending programs, and tax policies, on variables such as investment, employment, and productivity growth.
Taxes impact household income and economic production. The taxpayer’s capacity to labour is significantly reduced when taxation is high. Additionally, because higher taxes will significantly cut their income, many doubt their decision to put in additional hours at the office. Governments should thus consider taxation’s economic and social effects by observing how raising taxes may make taxpayers work harder to balance their income levels. The link between taxes and economic development is complicated, and has prompted extensive research and analysis.
Numerous studies have been conducted to investigate the influence of taxes on economic growth [
12,
19,
33,
34,
35,
36,
37,
38,
39,
40,
41]. Ref. [
34] defines economic growth as the foundation for increased prosperity, and the gross domestic product is typically used as a proxy for a country’s growth. According to some research, high tax rates discourage labour, savings, and investment and harm economic development. This is because high taxes can lower the incentives for individuals and enterprises to engage in productive economic activities, resulting in a decrease in economic growth [
20,
21,
42,
43,
44,
45]. Ref. [
46] discovered similar results in their analysis of the Turkish economy, revealing that taxes had a considerable negative influence on economic growth.
Ref. [
35] examined seventy nations between 1980 and 1997, and discovered that corporation taxes are related to poorer economic development. At the same time, their findings revealed that a 10% drop in the statutory corporate rate enhances annual GDP per capita growth by 0.7% to 1.1%. Ref. [
12] looked into the association between taxes and economic development in 21 OECD nations, and discovered that income taxes are often associated with poorer economic growth than consumption and property taxes.
In their study, ref. [
47] pointed out the negative effect of direct and indirect taxes on the economic growth of developing countries, and the existence of a positive relationship for developed countries.
In the long run, ref. [
48] found a negative correlation between personal and corporate income tax rates and economic growth in the wealthiest OECD countries.
In addition, ref. [
38] conducted an examination of 17 OECD nations from 1970 to 2004, indicating that direct taxes, particularly personal and corporate income tax, are more damaging to economic growth. Other authors, such as [
37], examine how changes in the marginal tax rate affected gross domestic product per capita in the United States from 1912 to 2016, concluding that a 1% decrease in the marginal tax rate leads to an increase of approximately 0.5% in gross domestic product per inhabitant the following year. Similarly, ref. [
49] discovered that higher marginal tax rates had a detrimental influence on economic growth.
Ref. [
39] have proved that a 1% reduction in PIT increases real GDP per capita by 1.4% in the first quarter and up to 1.8% after three quarters. In addition, the same fall in CIT resulted in a rise in real GDP per capita of 0.4% in the first quarter, and 0.6% a year later.
Another piece of research [
40] estimated the long-run and short-run elasticities of sales tax on growth in the United States from 1960 to 2013. The findings imply that a sales tax is detrimental to economic growth in the long term, but beneficial in the short term.
Some studies, however, have concluded that taxes can have a favourable impact on economic development [
50,
51,
52]. Taxation gives governments the cash they need to spend on public goods and infrastructure, resulting in higher productivity, innovation, and competitiveness. Income disparity may also be addressed through taxes, enhancing social cohesion and minimising social discontent, resulting in a more stable and prosperous economy. Ref. [
53] proved the existence of a significant and positive relationship between tax revenues and GDP, highlighting that tax revenues accelerate the economic growth of African states. Vintila et al. [
19] found that implementing efficient and expansionary fiscal policies has shown a favourable relationship between fiscal variables and economic growth in OECD nations. The study by Mutașcu et al. [
54] proved a positive impact of 1.61% on GDP due to a 1% increase in direct taxation. As for indirect taxes, they decrease GDP per capita by 0.83% for a 1% increase in direct taxes, suggesting that fiscal harmonisation would be more appropriate than fiscal competition.
Economic theory offers a viable answer to the following question: “What happens to prices and GDP when the economy sees an increase in its corporate taxes?”. Reducing corporate tax rates will increase spending and shift the aggregate demand curve to the right, resulting in higher real GDP and price levels. Higher corporate income tax rates will reduce real GDP and price levels, resulting in less investment and a move to the left in the aggregate demand curve.
Income taxes have an impact on the consumption component of total demand. Income tax increases lower discretionary personal income and spending (but by less than the change in disposable personal income).
The aggregate demand curve is shifted to the left by the initial change in consumption caused by the change in income taxes or the multiplier. As tax rates vary, the multiplier’s value changes.
Research often demonstrates a negative link between income tax rates and GDP, implying that higher income tax rates can reduce incentives for people and firms to engage in productive economic activities such as labour, savings, and investment [
55,
56,
57].
The migration of higher-skilled, higher-income persons in an open economy works against the objectives of progressive state and local tax regimes to achieve long-term income redistribution. As a tax system’s progressivity diminishes, the likelihood that the employed household head will acquire a better job within a year increases. A decrease in a tax system’s progressivity relates to an increase in the actual rate of wage growth.
Fiscal changes are directly tied to changes in private investment and consumption rates, while the magnitude of increases in investment and consumption varies. However, the link between the variables is always inverse; as tax levels or rates decline, investment and consumption rise, and vice versa. Lower marginal tax rates are strongly linked to reduced unemployment rates.
Ref. [
39] (p. 10) discovered a negative link between the average individual income tax rate and per capita real GDP. “A one percentage point reduction in the average personal income tax rate resulted in a rise in real GDP per capita of 1.4% at the impact level and up to 1.8% after three quarters”, according to the study. In terms of the multiplicative effect on the economy, a change in individual income tax rates that results in a 1% drop in tax collections increases GDP by 2.5%.
The study of [
58] concluded that in the short run, if the average income tax rate were reduced by one percentage point, GDP would increase by 0.78% immediately after the tax change. After four quarters from the induced exogenous shock (income tax reduction), GDP would increase by 1.5%.
Ref. [
59] proved that personal and corporate income taxes had pronounced adverse effects on the amount of innovation that occurs, as measured by the number of inventors and patents filed. Ref. [
60] stated that at the level of 26 EU countries from 2013 to 2019, personal income tax and value-added tax rates did not significantly impact growth, and corporate income tax had a negative impact.
Therefore, the imposition of taxes reduces taxpayers’ disposable income. This will reduce their expenditure on the necessary goods that must be consumed to improve efficiency. As efficiency suffers, work capacity decreases. Ultimately, this negatively affects savings and investment. Hence, lowering taxes improves disposable income, allowing consumers to spend more, thereby boosting GNP. As a result of tax cuts, the aggregate demand curve rises, as consumers with increased discretionary incomes want more products and services.
The link between corporate sustainability policies and business performance can be complicated, and the influence of direct taxes on economic development can play a role. Corporate sustainability practices are activities carried out by organisations to enhance their environmental, social, and governance (ESG) performance, such as lowering greenhouse gas emissions, encouraging workplace diversity, and implementing ethical business practices.
Corporate sustainability policies can improve business performance, especially financial performance. Companies that embrace sustainable practices appeal more to socially conscious investors and customers, leading to greater sales and market share. Moreover, sustainable methods can save costs by reducing energy use and trash creation. Ref. [
61] discovered that businesses with strong sustainability performance outperformed others in financial performance, including greater returns on assets and equity. Ref. [
62] discovered that during the COVID-19 pandemic, sustainable firms outperformed their rivals, highlighting the possible relationship between sustainability and financial success.
Ref. [
63] investigated the factors that influence corporate debt levels in 181 Slovak enterprises, discovering that larger companies and those with higher profitability were more likely to have higher debt levels. In contrast, companies with greater ownership concentration were less likely to have high debt levels. Using a systematic literature review, ref. [
64] drew attention to the fact that there is a lack of quality schemes related to environmental and social sustainability.
Analysing the relationship between sustainability management and companies using a sample of 86 studies based on a systematic literature review, ref. [
65] proved that companies that adopted sustainability strategies performed better financially and were more likely to attract and keep customers and staff.
The influence of direct taxes on economic development, on the other hand, can play a part in this connection. High direct taxes can restrict the resources available for firms to engage in sustainable practices by reducing their disposable income. Moreover, high direct taxes might encourage enterprises to engage in tax avoidance and evasion, limiting resources available for investment in sustainability programs. According to the study [
66], enterprises with high sustainability performance were less likely to participate in tax evasion methods, implying that sustainable practices may be associated with greater tax compliance.
Overall, the relationship between corporate sustainability practices and firm performance in terms of the impact of direct taxation on economic growth is complex and can depend on various factors, including the tax system’s structure, taxation level, and incentives for businesses to invest in sustainable practices.
Taking into all the theoretical considerations, the main hypotheses of the research are the following:
Hypothesis H1. Tax revenues are associated with higher economic growth.
Hypothesis H2. Direction taxation is associated with lower economic growth.
A shadow economy can complicate the link between direct taxation and economic development by altering the incentives for individuals and enterprises to engage in the formal economy and pay taxes. Individuals and corporations may be enticed to engage in shadow economic activity to avoid paying taxes if direct taxation is high. This can reduce government tax collections and hinder governments’ capacity to invest in public goods and services that are important for economic progress. Furthermore, developing a shadow economy can put enterprises that follow tax procedures at a competitive disadvantage, since they are liable to higher tax rates than businesses that do not record their revenue. On the other hand, the shadow economy can be a source of work and income for those who would otherwise be jobless or underemployed. Furthermore, the development of a shadow economy may spur competition and innovation, leading to improved productivity and economic growth.
Ref. [
67] evaluated this relationship for the case of Romania using the ARDL cointegration approach for 2000–2010, claiming a negative relationship exists between them in the long run. Empirical evidence of this countercyclical relationship has been approved by [
68,
69,
70], studies in which the authors tackled the relationship between the official and unofficial economies and the unemployment rate or minimum wage. Additionally, including informality in the estimated models becomes even more important if we acknowledge that the tax burden is one of the main causes of boosting informality in the literature [
71,
72,
73].
Generally, research on the link between taxes and economic progress is complicated and sometimes inconsistent, with contradictory findings recorded. Further study is required to understand how taxes impact economic development in various contexts and to find the most effective tax policies for fostering economic growth and development.
3. Materials and Methods
The research methodology is built on two main premises. In the first one, the fiscal efficiency of the EU member states has been evaluated using cluster analysis with the help of five leading indicators at the European level:
Personal income tax (PIT), % of GDP.
Corporate income tax, % of GDP. Eurostat’s Quarterly Government, Finance Statistics database is the data source for both types of taxes.
The size of the informal economy is expressed as a percentage of the official GDP. The data source is the study [
74], and the data were taken from the Global Economy platform.
Control of corruption index is a scaled variable on the interval (−2.5; 2.5), with a scale from a weak to a high level of control. The data source is the WGI database of the World Bank.
The degree of fiscal compliance that records the taxes and mandatory contributions that a medium-sized company must have paid or withheld each year, as well as the administrative burden of paying taxes and contributions. The data source is the Doing Business index of the World Bank.
The analysis used standardised data at the level of 2019. The value of the Cronbach Alpha coefficient, which measures the internal consistency of the considered variables, is 0.7155. Its value is above the threshold of 0.7 [
75], suggesting that if the correlation is high, there is evidence that the individual indicators measure the same essential construct: fiscal efficiency.
In order to obtain homogeneous clusters of countries from the point of view of fiscal efficiency, hierarchical clustering was applied based on the Ward Euclidean distance method. Ward’s method is the most effective for performing all hierarchical classification algorithms [
76]. It explicitly deals with the problem of homogenisation of classes, i.e., minimising intracluster variability. At each step, those two clusters are merged, and the cluster variability of the result is the smallest of all cluster merging possibilities. An essential premise of Ward’s method is the decomposition of the total variance into intra-cluster variance and inter-cluster variance, as follows:
where
and
are the intra- and intercluster variances, respectively.
Cluster analysis is a statistical technique that groups similar observations or objects into clusters based on their characteristics. In the context of fiscal efficiency in the European Union (EU), cluster analysis can group EU countries based on their fiscal efficiency scores. The findings can influence policy choices, such as identifying areas for improvement in nations with poor fiscal efficiency, or benchmarking best practices in countries with high fiscal efficiency ratings.
The cluster analysis technique can assist policymakers in understanding which EU nations are most comparable in fiscal efficiency, and provide insight into variables that contribute to fiscal efficiency. Policymakers may use cluster analysis to detect patterns and trends that may be difficult to distinguish using other data analysis methods, allowing them to make educated decisions about enhancing fiscal efficiency in their nations.
At the second stage, the impact of direct taxation on economic growth has been evaluated at the level of two main clusters of countries based on fiscal efficiency, as follows:
The class of countries with high fiscal efficiency (ten countries): Belgium, Germany, Austria, France, Ireland, Netherlands, Finland, Sweden, Luxembourg and Denmark;
The class of countries with limited fiscal efficiency: Bulgaria, Greece, Poland, Croatia, Romania, Hungary, Italy, Czechia, Slovakia, Estonia, Spain, Slovenia, Lithuania, Portugal, Latvia, Cyprus and Malta.
The main objective of the analysis was to highlight and analyse the impact of direct taxes on economic growth with the decomposition of both types of taxes—PIT and CIT—expressed as a percentage of GDP. The analysis included variables for inflation, unemployment, government expenses and investments, and tax revenue increases as the economy’s leading indicators. As control variables, the size of the informal economy as a percentage of the official GDP and control of corruption were considered. To achieve this, the regression analysis based on panel data covers the period between 2008 and 2020. The primary data source is represented by the databases of the Eurostat Government Finance Statistics, Employment and Unemployment, Inflation, and National Accounts, as well as the WGI database of the World Bank and the study [
74] for the size of the informal economy as % of GDP (
Table 1).
In order to quantify the impact of direct taxation on economic growth, the following model was tested:
where
i = 1 … 27 represents the 27 member countries,
t = 1, 2, …,
t represents time (period 2008–2020),
are the parameters of the model, and the errors
represent a composite term of the errors that can be decomposed into specific effects and the term error.
In the first step of our estimation, we employed the ordinary least squares approach together with cross-section and period fixed effects models. The models’ temporal components were designed to accurately represent the income inequality across all CEE countries over time. The decision to use fixed (FEM) or random effects (REM) has been formalised based on the redundant fixed effects and Hausman tests. Using the Breusch–Pagan Lagrange (LM) multiplier, which allows us to choose between a regression of random effects and a straightforward OLS regression, we also evaluated the consistency of random effects.
A high correlation between independent variables is called multicollinearity, and can skew regression results. The correlation matrix and variance inflationary factor (VIF) may determine the presence of multicollinearity.
The heteroscedasticity problem is a severe issue in the multiple regression model for assessing panel data, as it might undermine the effectiveness of statistical conclusions [
53,
54,
55]. Therefore, heteroskedasticity has been identified using the statistical test of Breusch and Pagan. The problem of error components correlating over time due to strong similarities is known as autocorrelation. Additionally, panel data autocorrelation tests are employed to identify serial or first-order autocorrelation. The correlation of the residuals across entities is referred to as cross-sectional dependency, also known as contemporaneous correlation. Pesaran’s test best determines whether the data have a cross-sectional dependency issue. Breuch–Pagan LM, Pesaran-scaled LM, and Pesaran CD were used to test for cross-sectional dependency. Panel heteroskedasticity, R.LR and Jarque–Bera tests were used to assess the homoscedasticity and normality of the residuals, respectively.
Without altering the values of the coefficients, the issue of cross-sectional heteroskedasticity was addressed using standard corrected heteroskedasticity errors based on the improvement of standard estimator errors. The existence of residual autocorrelation was examined using Durbin–Watson statistics. The model’s goodness of fit has been assessed using modified R2, RMSE, and the model’s standard error, while the Fisher test has been used to determine its validity.
The problem of potential endogeneity can arise from omitted variables, measurement errors of the variables, and simultaneity between the dependent and independent variables. The dynamic GMM method has been applied to overcome this problem, relying on the idea that the lagged dependent variables and the endogenous regressors are instruments for the current endogenous regressors. In some circumstances, dynamic GMM can be more efficient than fixed-effects models, particularly when the number of periods is limited [
77].
EViews 13.0 software was used to estimate the suggested econometric models.
4. Results
4.1. Evolution of Direct Taxation at the EU Level
Traditionally, taxes in the EU are classed as either direct or indirect. A direct tax is imposed on long-term income and wealth that is charged directly to a specific person (legal or natural) via a notice of assessment (personal income tax (PIT), corporate income tax (CIT), or wealth tax).
According to [
43], fiscal pressure is higher in developed countries and lower in emerging countries. Direct taxes have a substantial impact on the tax revenues of developing countries and a minor impact on the revenues of developed countries as a percentage of gross domestic product.
Employers and workers contribute to a social insurance plan that covers pensions, healthcare, and other forms of social security. In 2019, this effectively required taxes and social contributions in Europe’s 27 member states, which accounted for 40.1% of GDP. The tax burden was higher compared to other advanced countries, 6.3 percentage points more than the OECD average (33.8%), and more than 15 percentage points higher than the US average [
78].
Changes to the general EU and Eurozone tax systems reflect variations between nations. Among the 27 member countries, 19 saw substantial changes (more than 0.1 percentage point) in tax collections relative to GDP. Of these nations, income climbed in ten, declined in nine, and remained stable in eight. The most substantial rises were reported in Cyprus (2 percentage points) and Denmark (1.8 percentage points), while the most significant reductions were recorded in Belgium (1.2 percentage points), France, and Sweden (0.8 percentage points in both countries). Tax collections in 20 Member States were greater in 2019 than in 2009, including Greece, which experienced the largest rise of 8.7 percentage points. Ireland, on the other hand, had the greatest reduction (6 percentage points) [
78].
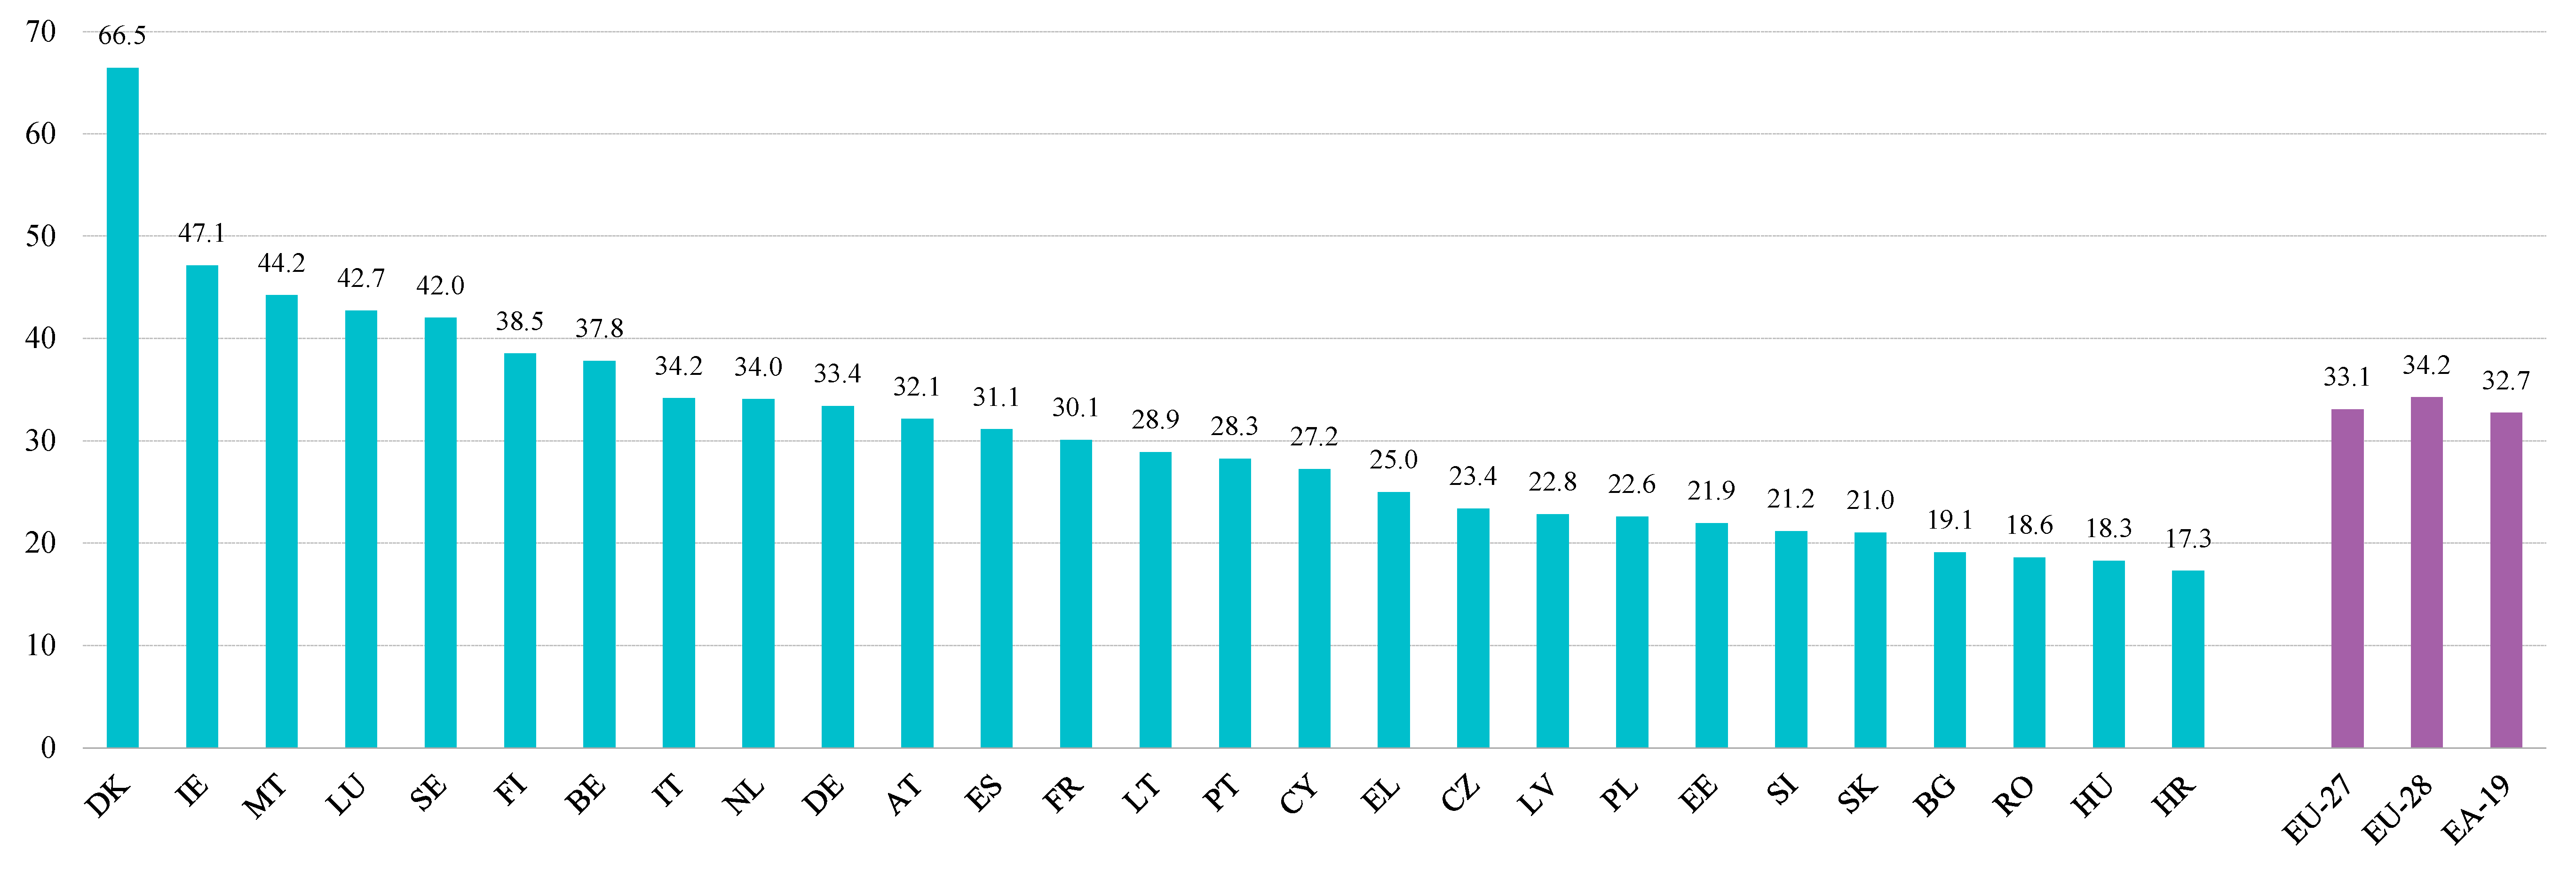
In 2019, revenues from direct taxes, indirect taxes, and social contributions amounted to almost one third of total EU-27 income. The relative share of direct taxes grew by 1.3 percentage points compared to 2009, while the relative share of social contributions declined by 1.8 percentage points.
The taxation system differs greatly between EU member states. Denmark has the greatest percentage of total tax collection from direct taxes (66.5%), followed by Ireland and Malta (
Figure 1).
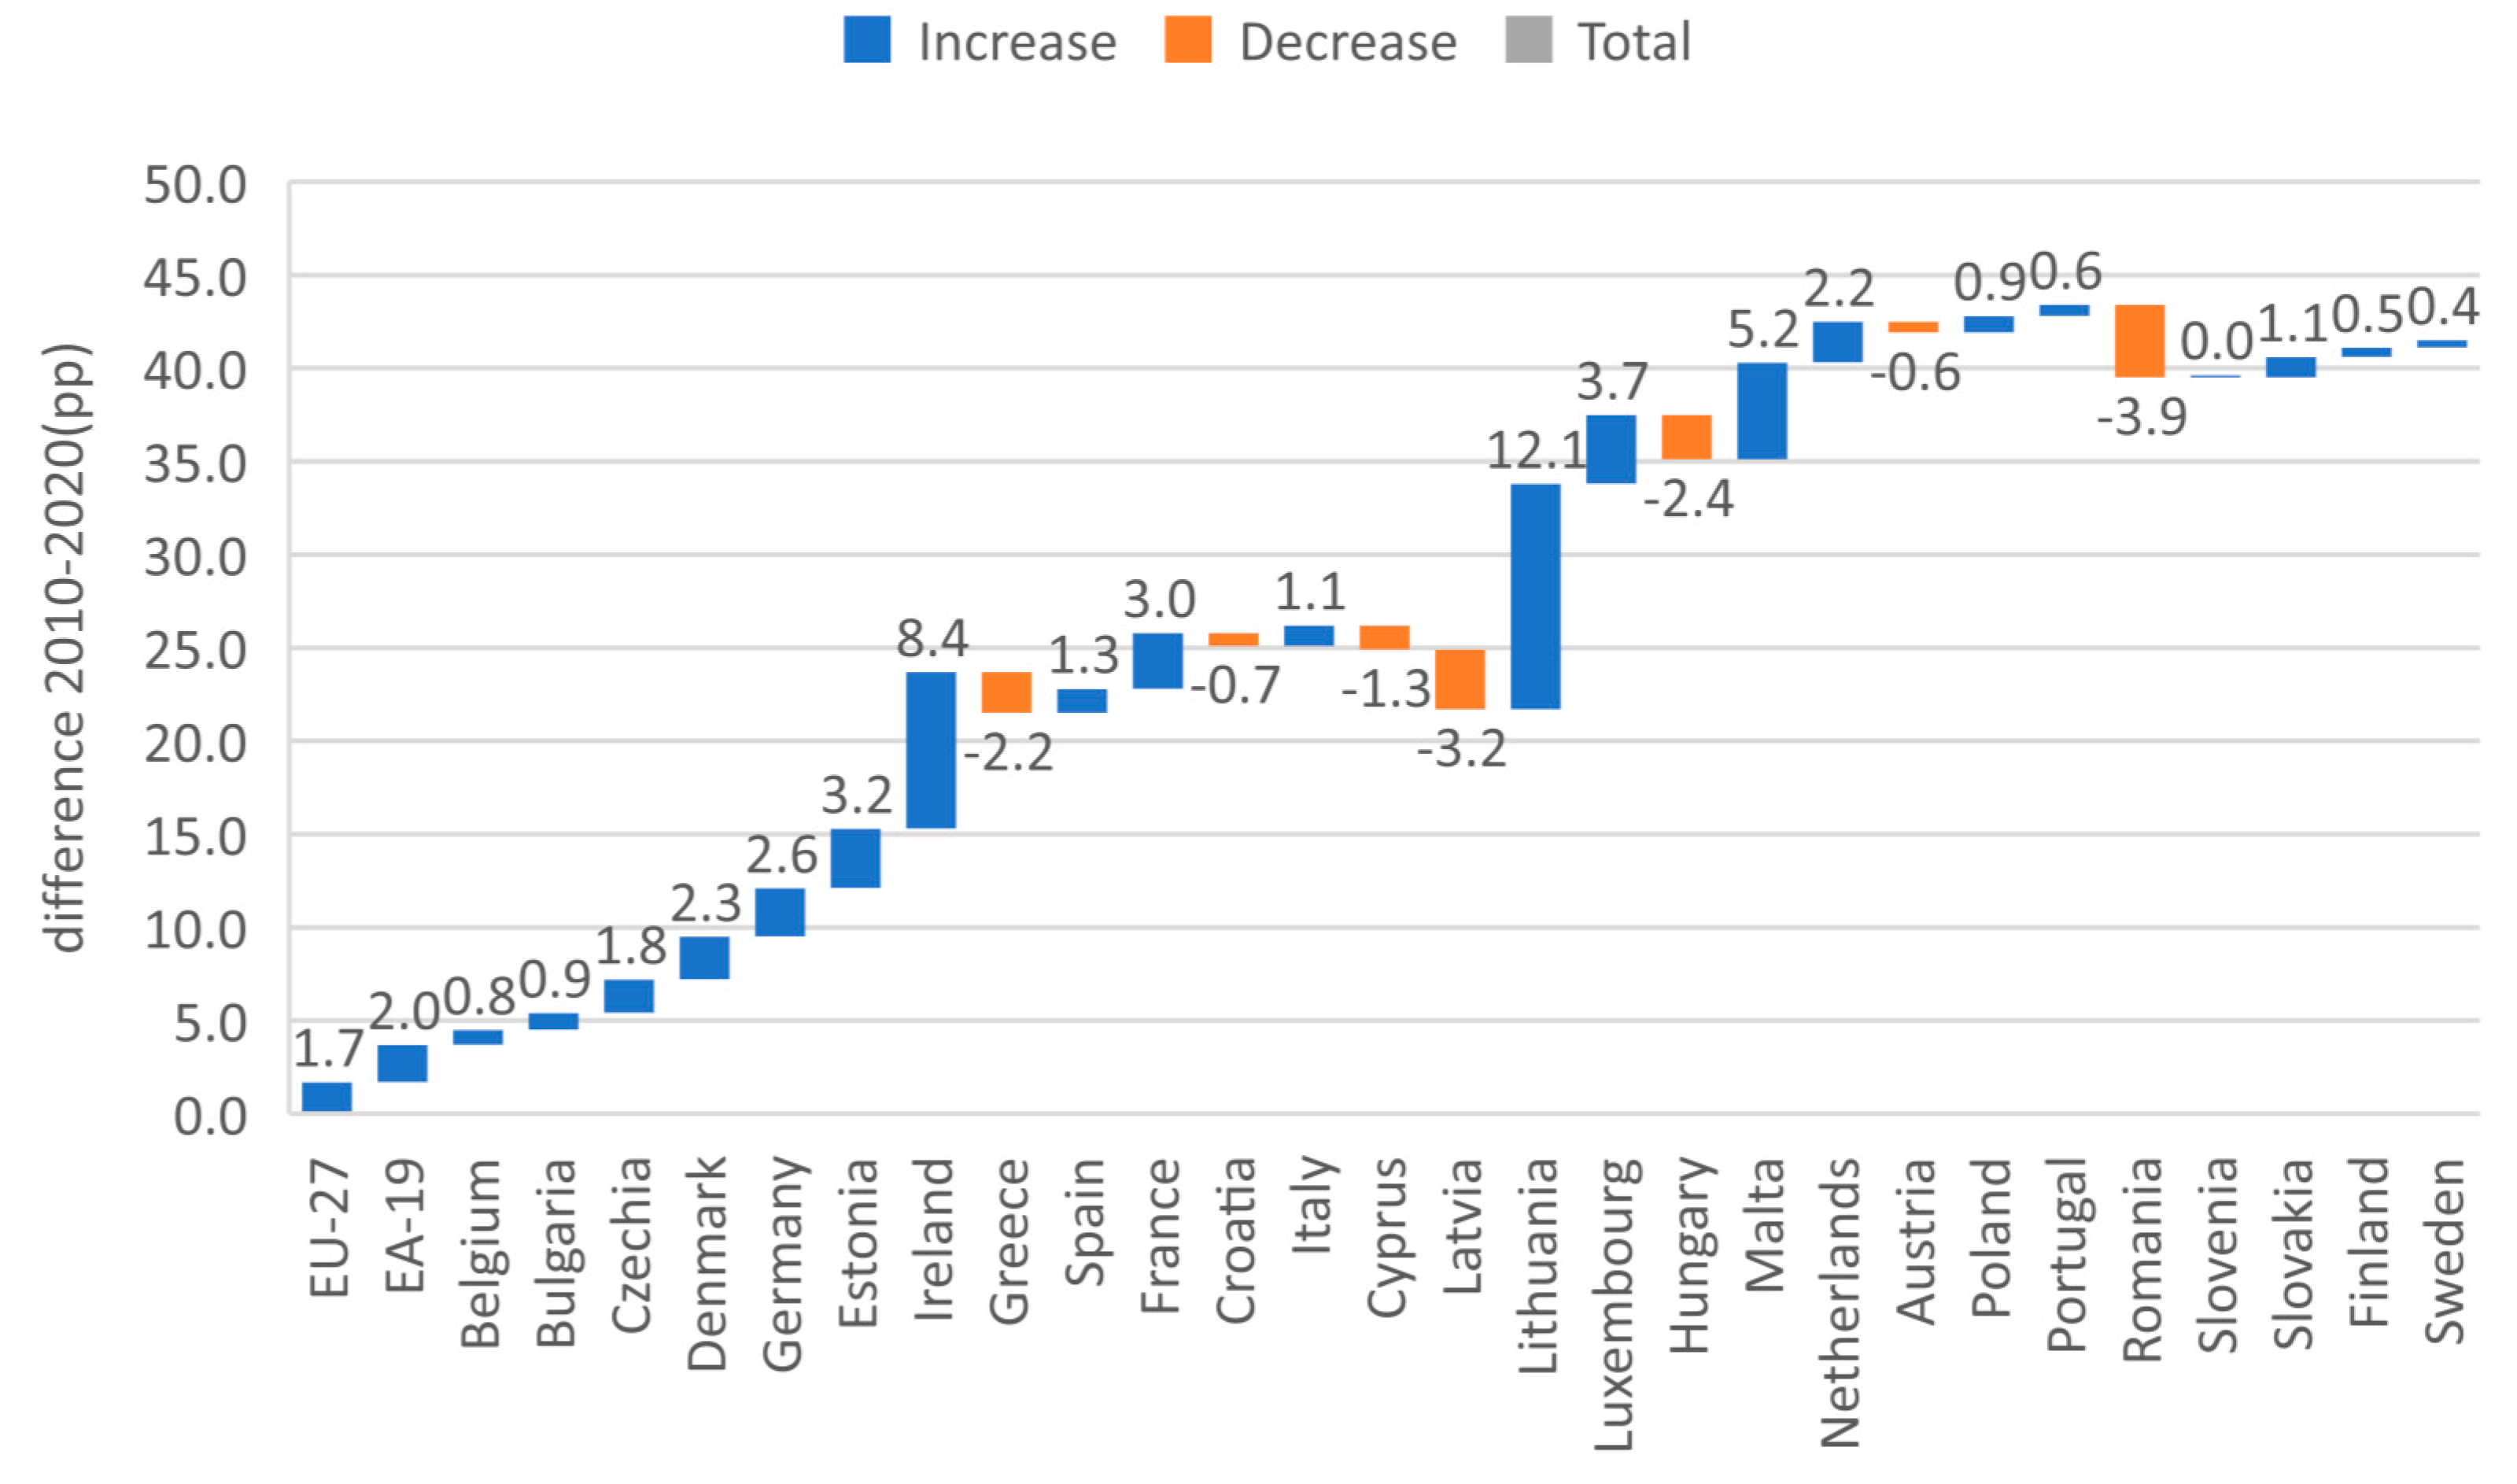
The highest increase in direct taxes among EU countries in 2020 when compared to 2010 has been registered by Lithuania (12.1 percentage points), followed by Ireland (8.4 percentage points) and Malta (5.2 percentage points), while on the opposite side, the highest decrease in direct taxation has been registered by Romania (−3.9 percentage points) and Latvia (−3.2 percentage points) (
Figure 2).
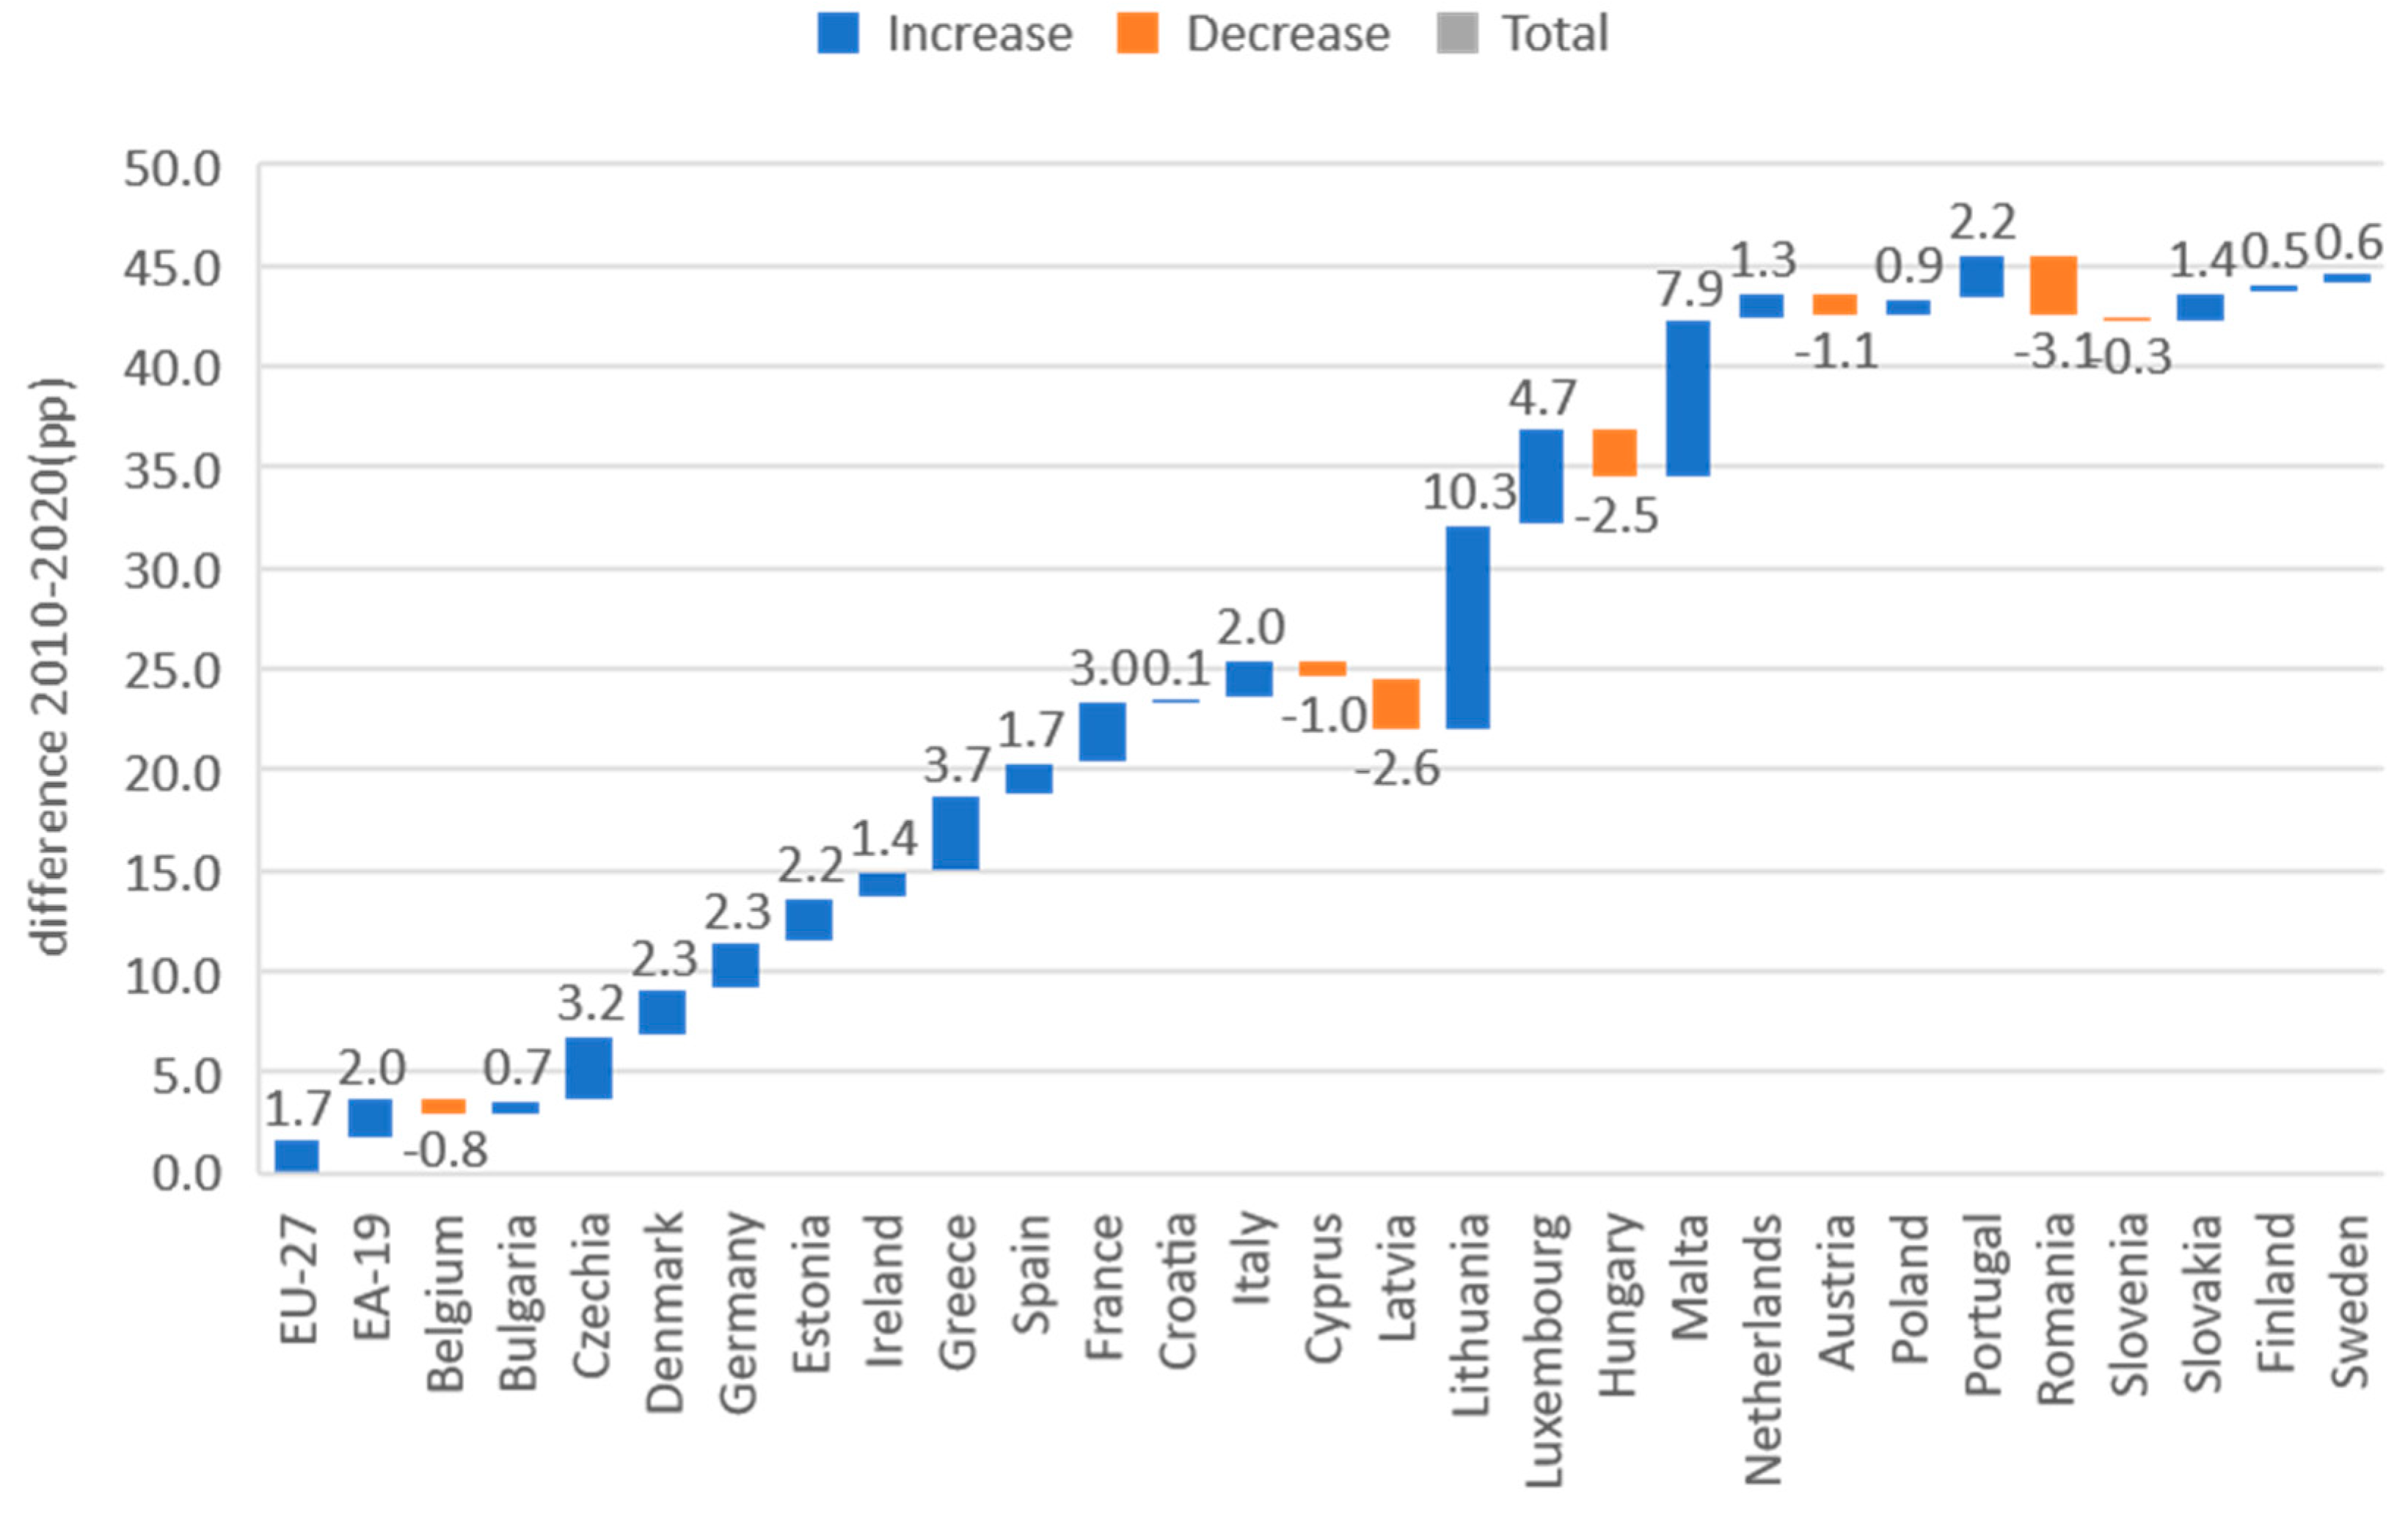
Regarding taxes on individual or household income, the highest increase has been registered by Lithuania (10.3 percentage points) and Malta (7.9 percentage points) (
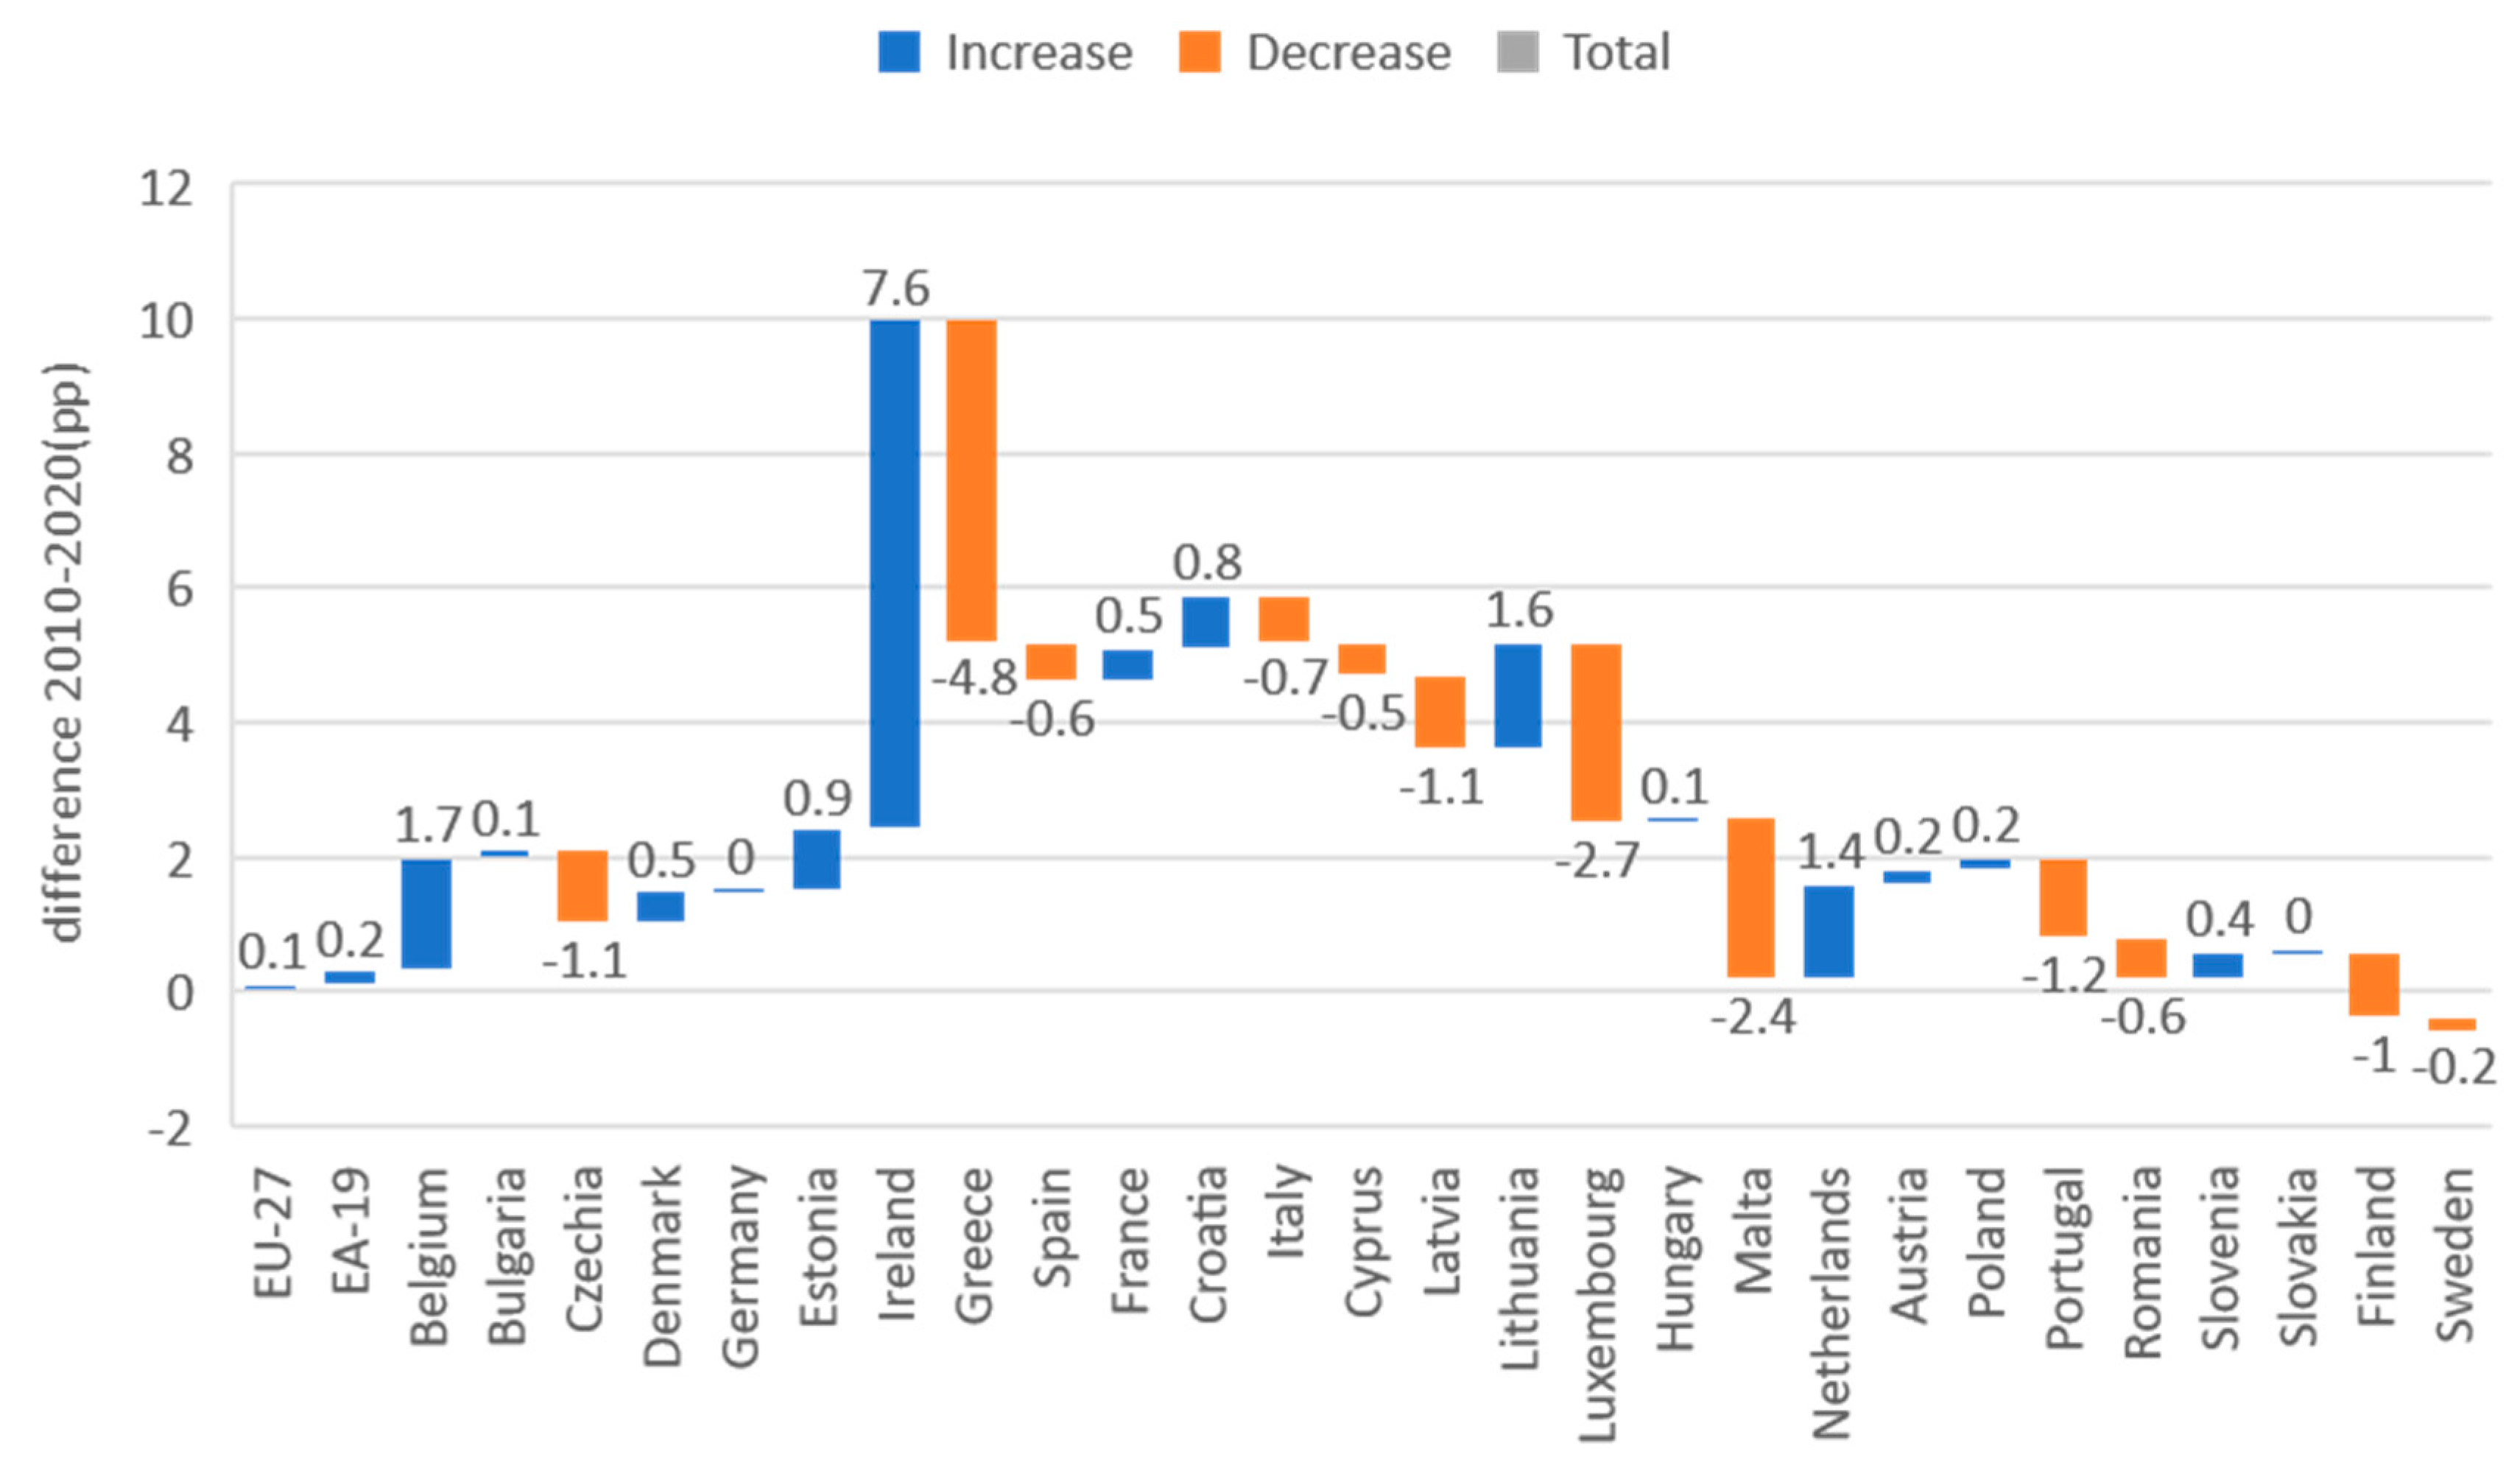
Figure 3). In contrast, Romania and Latvia are located at the opposite end, with the biggest decreases. Analysing the evolution of income taxes, Ireland (7.6 percentage points) reached the highest increase in 2020 compared to 2010, while the sharpest decreases were registered by Greece (−4.8 percentage points), Luxembourg (−2.7 percentage points) and Malta (−2.4 percentage points) (
Figure 4).
4.2. Analysis of the Fiscal Efficiency of the EU Member States Using Cluster Analysis
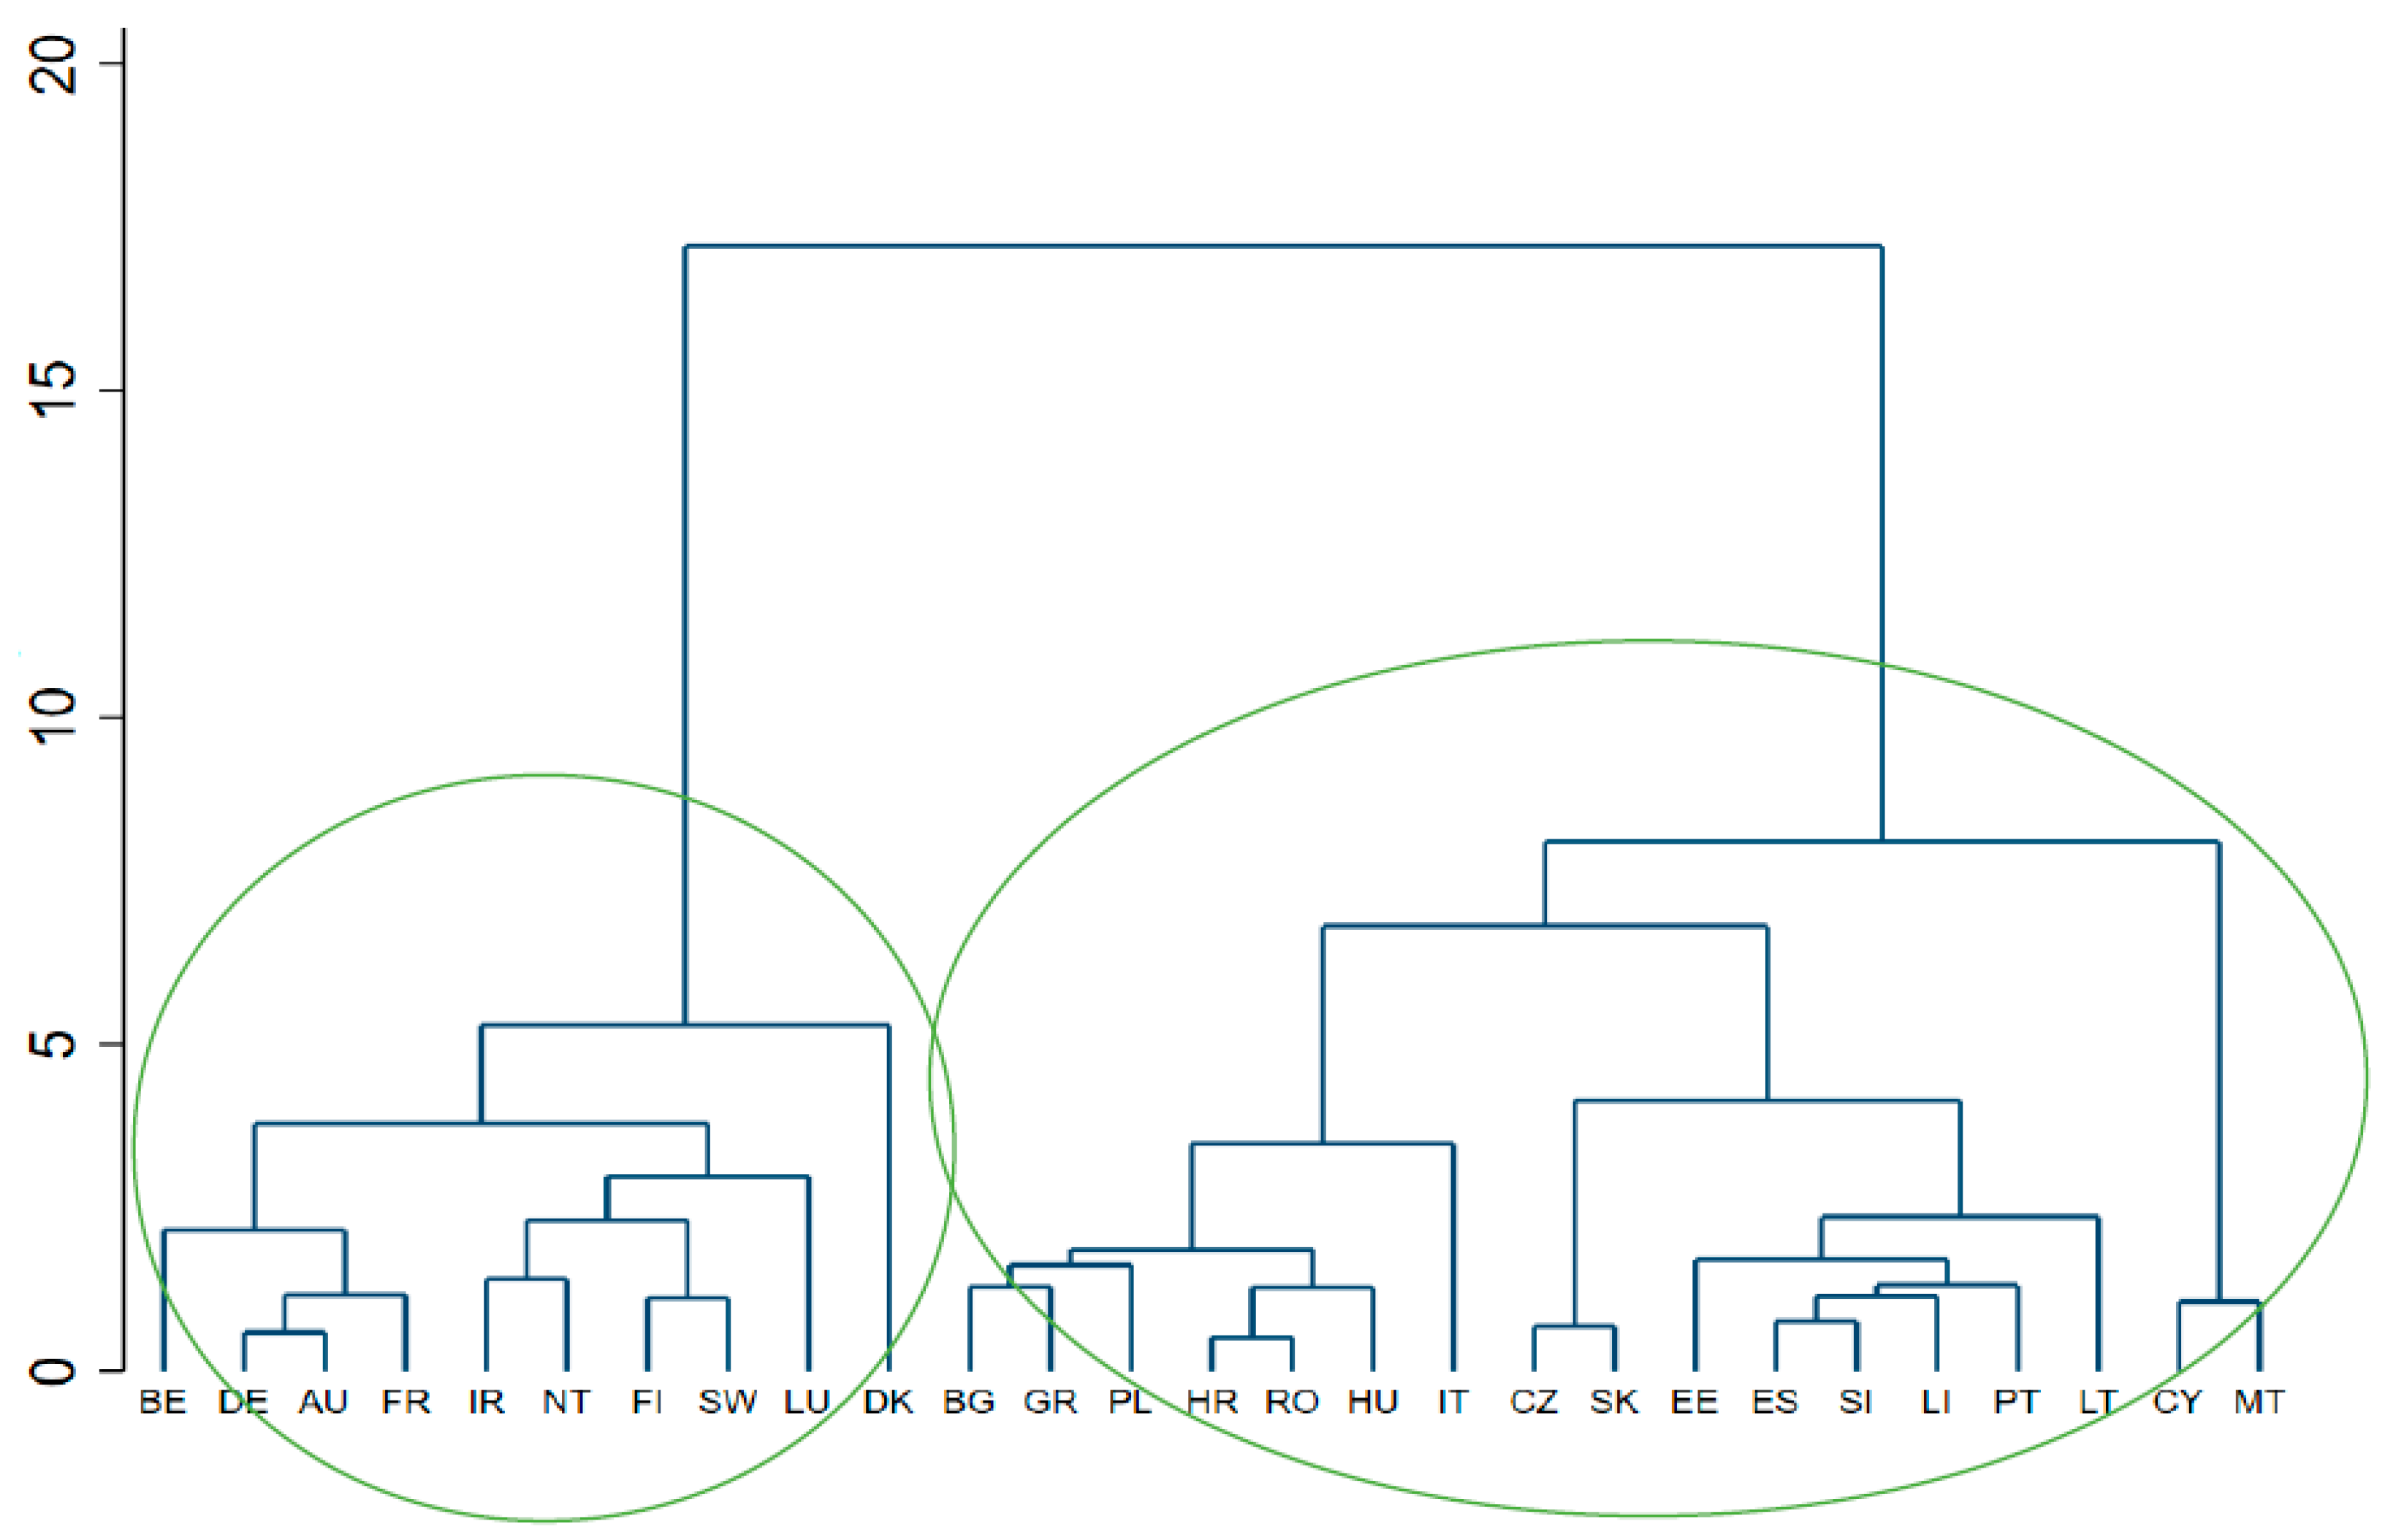
The empirical results of the cluster analysis (
Figure 5) revealed two main clusters of countries, as follows:
The class of countries with high fiscal efficiency: Belgium, Germany, Austria, and France join together, while Ireland and the Netherlands are grouped. Finland and Sweden form a group together, and Luxembourg and Denmark form a group;
The class of countries with low fiscal efficiency: Bulgaria, Greece and Poland group together, while Croatia, Romania and Hungary form a group of countries, and Italy stabilises in a separate group. Czechia and Slovakia are grouped. Estonia, Spain, Slovenia, Lithuania, Portugal and Latvia form a separate sub-class, while Cyprus and Malta are grouped.
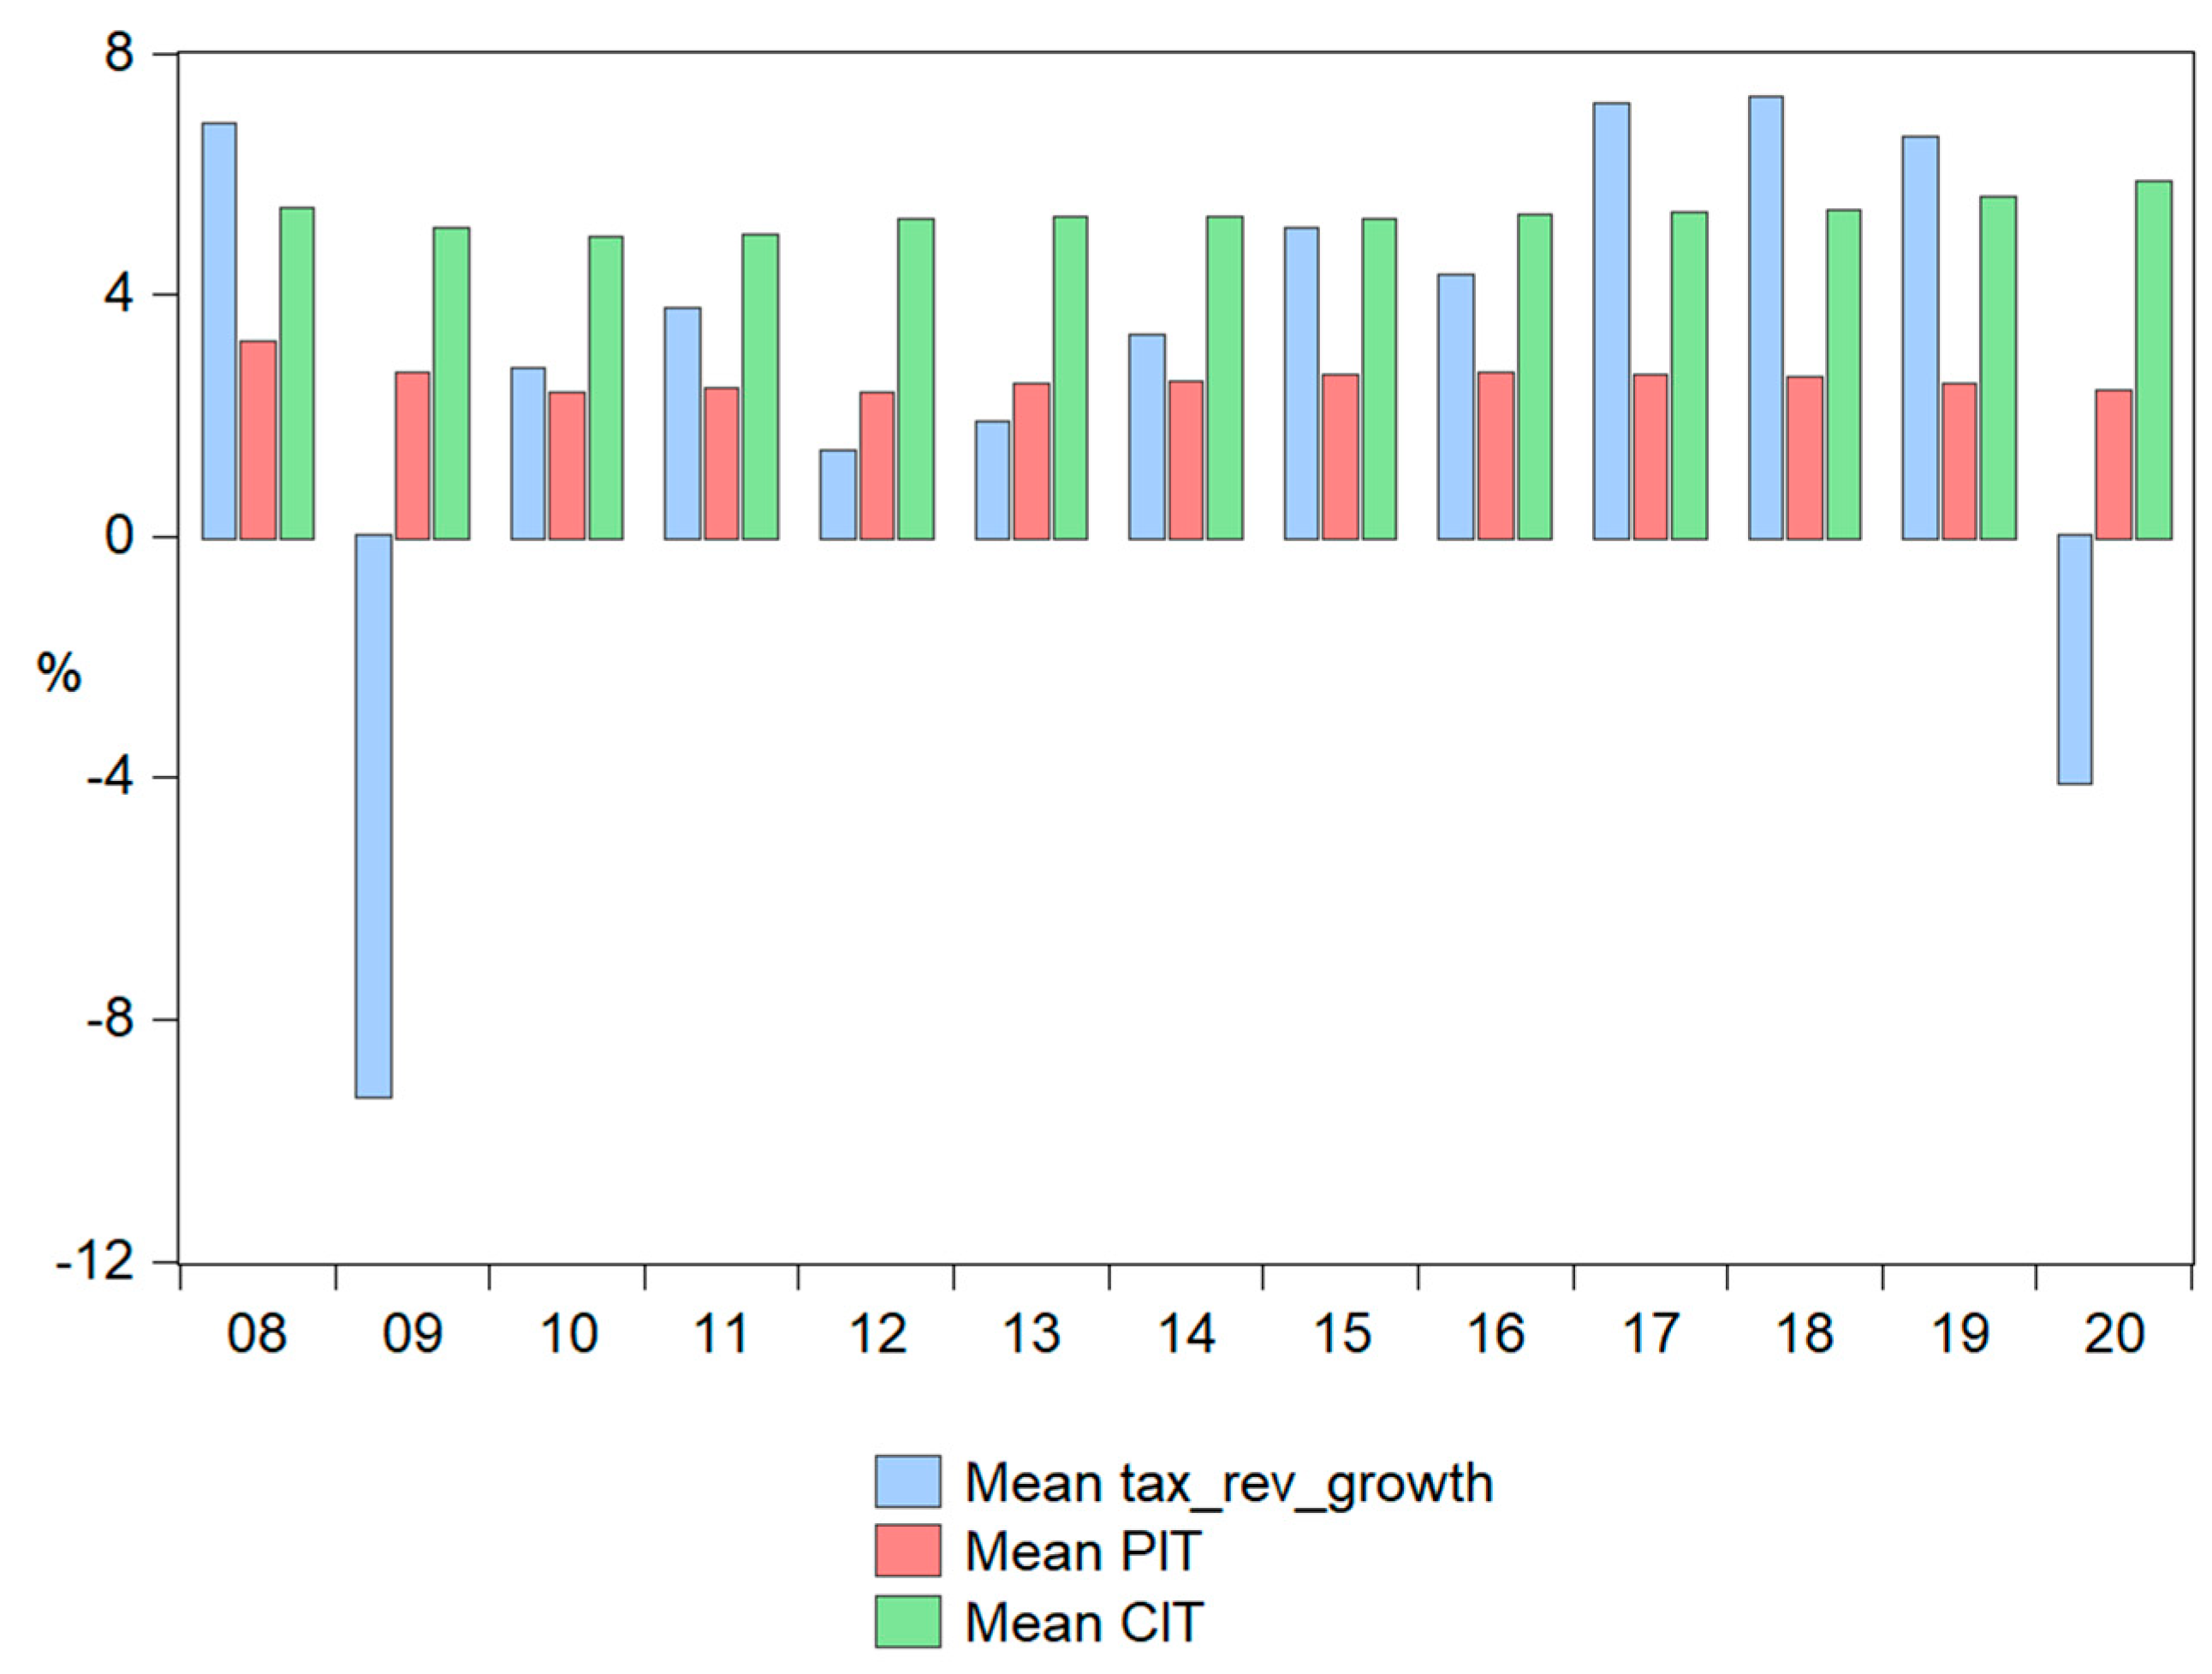
In countries with high fiscal efficiency, the average increase in fiscal revenues from 2008–2020 was 2.54%, with an average value of personal income tax of 2.88% of GDP and an average value of corporate income tax of 11.69% of GDP (
Figure 6).
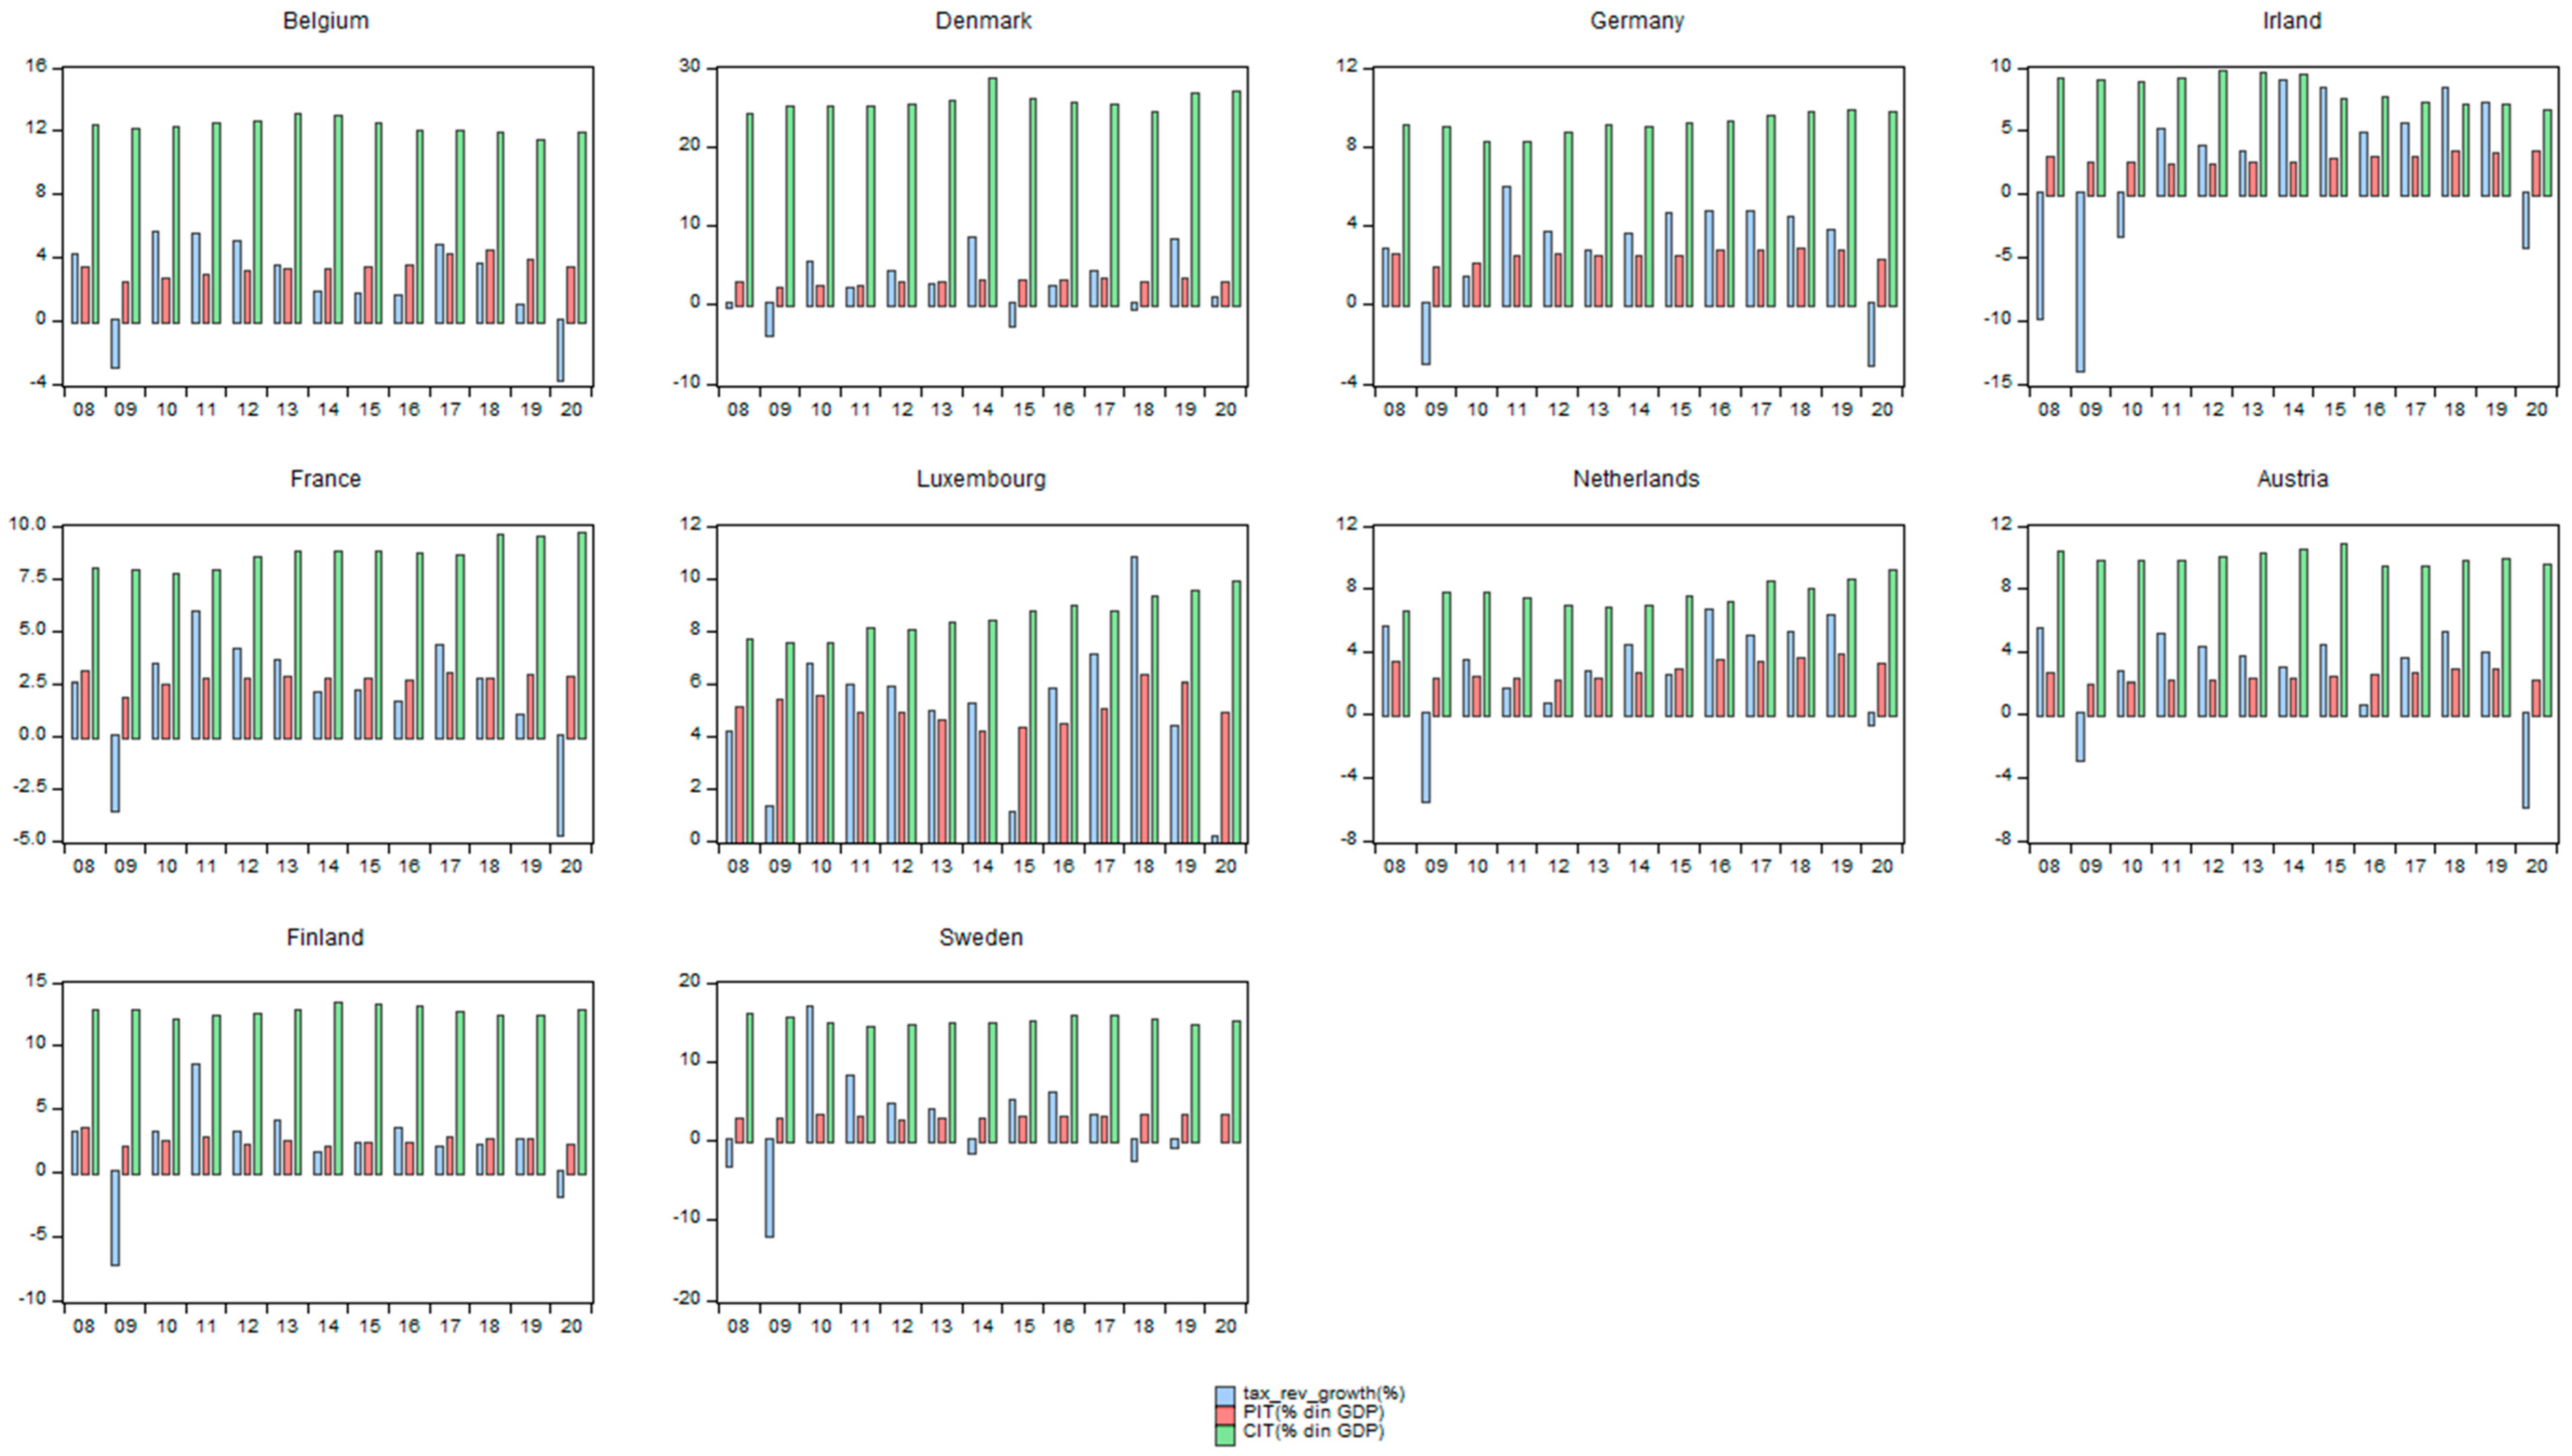
Austria and France are the countries with steep decreases in tax revenues in 2020, marking decreases of almost 6% of their GDP compared to the previous year. Denmark has the highest corporate income tax (26.9%), while Luxembourg has the highest personal income tax (4.8%) of the GDP (
Figure 7).
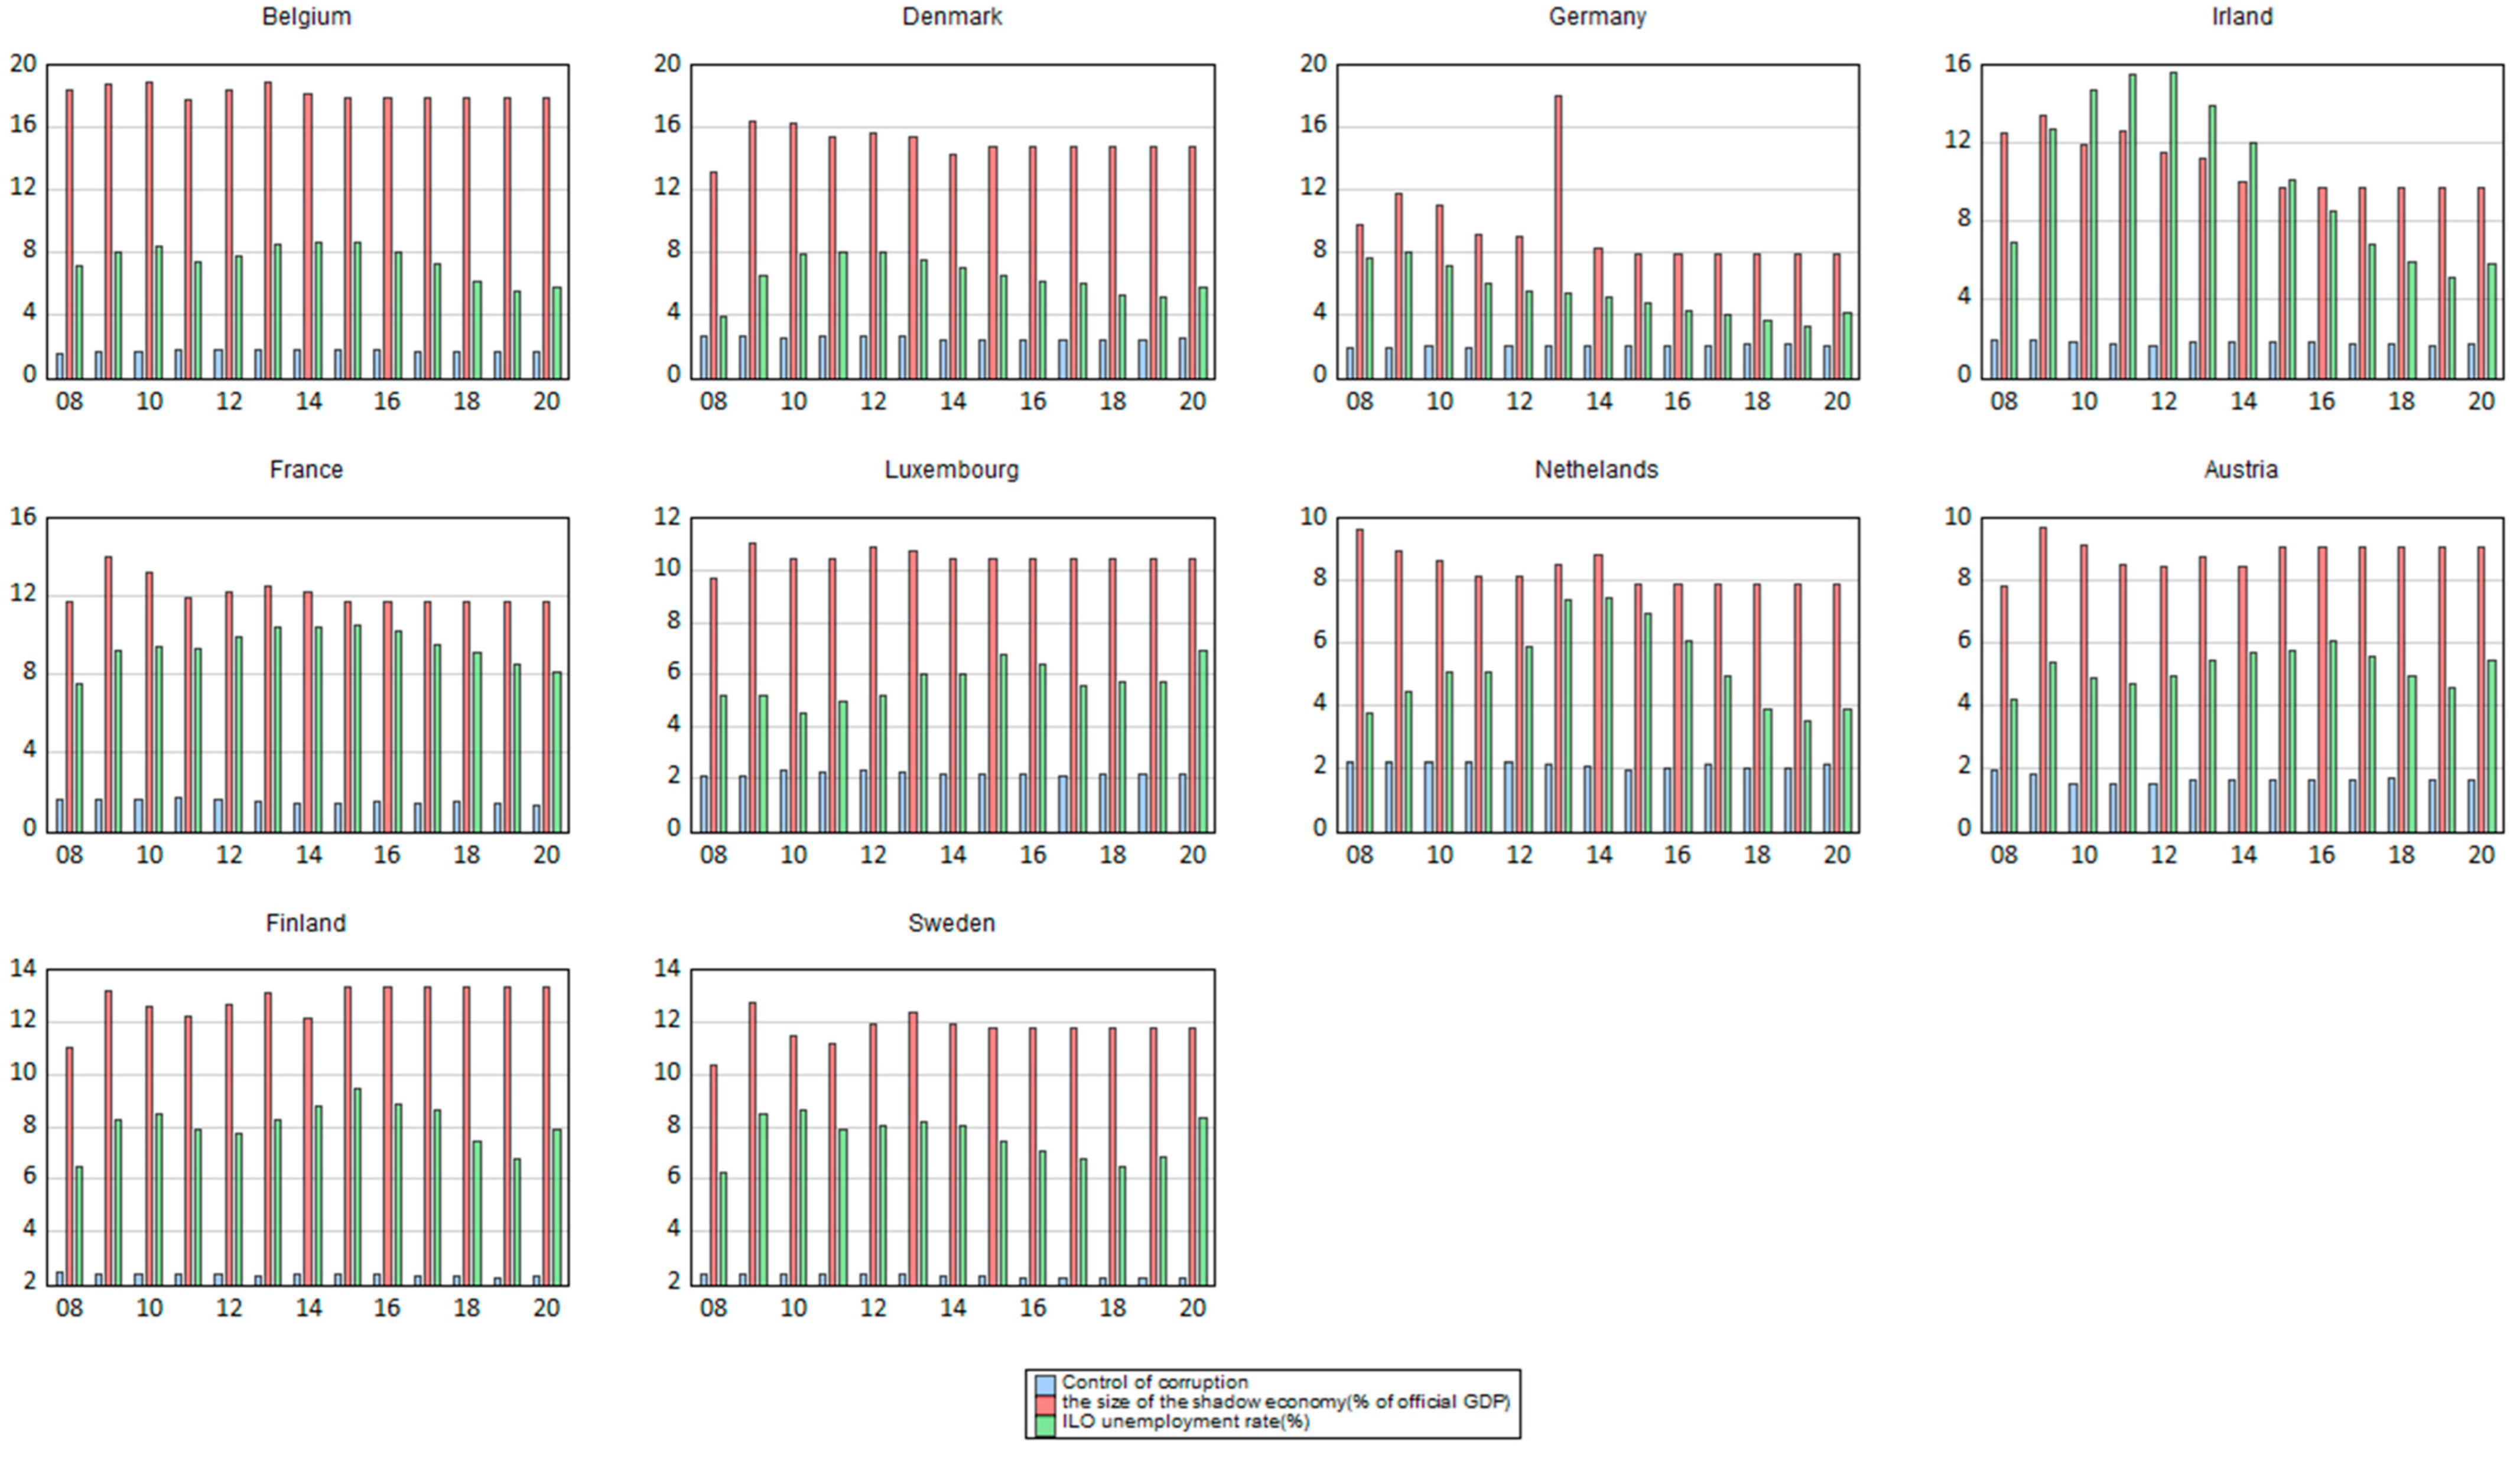
Regarding informality prevalence, Belgium recorded the largest magnitude of the informal economy, with 18.11% of the official GDP, followed by Denmark, with 14.9%. At the opposite pole is Germany, with 9.43% (
Figure 8).
From the perspective of corruption control, countries such as Denmark, Finland, Sweden, the Netherlands, and Luxembourg have increased their efforts, registering values greater than 2 for this indicator. The unemployment rate, an indicator closely related to the phenomenon of informality, presents higher values in France and Finland.
Multicollinearity was tested based on the correlation matrix of external variables and the variable inflation criterion (VIF); results are shown in Annexes 3 and 4. The results allow for the conclusion that both the initial and optimal models do not have multicollinearity because the values of the VIF criteria are significantly lower than the reference threshold of 10.
The empirical results of both regression models are presented in
Table 2. In the first model, all factors were considered, while only statistically significant factors were kept for the optimal one. Both models emphasised the tax revenue increase’s direct and statistically significant impact on economic growth. On the contrary, from the two components of direct taxation, only one-corporate income tax (CIT) significantly impacted economic growth, with adverse and statistically significant effects of inflation and public expenditure on economic growth. Regarding taxation impact on economic growth, the positive and statistically significant impact of tax revenue increases in economic growth can be highlighted, together with a negative impact of profit taxes on economic growth. Personal income tax has not had a significant impact on economic growth. The level of investments does not significantly influence variation in economic growth. In contrast, in the case of the magnitude of the informal economy and the control of corruption, even if following economic theory, the coefficients suffer from the lack of statistical significance, not reflecting a significant impact on economic growth. Additionally, inflation and government spending were associated with lower economic growth.
Therefore, judging from the perspective of the components of the direct tax system, at the level of this group of countries, profit taxes exhibited a significant impact on economic growth, a potential explanation for the negative sign being given by the fact that income taxes affect the consumption component of total demand. Increasing income taxes reduces disposable income and consumption (but to a lesser extent than changes in disposable income). All these facts shift the total demand curve to the left, increasing the initial change in consumption due to changes in income taxes or multipliers. Changes in the tax rate will change the value of the multiplier.
According to economic theory, the coefficients of the control of corruption variable show a positive impact, so a higher control of corruption leads to increased economic growth. However, the statistical significance of the coefficient could not be proven. In the case of the informality phenomenon, even if the empirical relationship is negative for developed countries [
74], the coefficient suffered from a lack of statistical significance, invalidating any relationship for this group of countries. Therefore, we can conclude that the two economies are substitutes, revealing that an increase in the official economy will lead to a decrease in the prevalence of the unofficial economy.
The Hausman test was applied to verify whether the estimated specific effects are random and do not correlate with the explanatory variables. Rejection of the null hypothesis (if the statistic is significant) implies adopting the fixed-effects model, which means that specific correlated effects are better captured in the fixed-effects model (
Table 3).
The results of the LR test confirmed the significance of the fixed effects, with probabilities below the significance threshold of 1% (
Table 4).
Regarding diagnosing both models, multicollinearity has been investigated using the correlation matrix and variance inflationary factor (VIF) (
Appendix A,
Table A1 and
Table A2). Additionally, the presence of heteroscedasticity, cross-sectional dependence, the residuals’ autocorrelation and normality have been tested. The results of Breuch–Pagan LM, Pesaran-scaled LM, and Pesaran CD were used to test for cross-sectional dependency, revealing the presence of cross-sectional dependence. However, according to Baltagi, this is a problem in macro panels with long-time series (over 20–30 years). This is not much of a problem in micro panels (a few years and a few cases). Panel heteroskedasticity, R.LR and Jarque–Bera tests were used to assess the homoscedasticity and normality of the residuals, respectively. The empirical results revealed the presence of heteroskedasticity without altering the values of the coefficients. The issue of cross-sectional heteroskedasticity was addressed using standard corrected heteroskedasticity errors.
Analysed through the lens of the Fisher test, the models are statistically valid. The goodness-of-fit of the models measured by the adjusted R2 is high; all the statistically significant factors explain approximately 65% of the variation in economic growth.
Therefore, in the case of the first group of countries with high fiscal efficiency, the increase in tax revenues boosts economic growth. These countries often have efficient tax systems, solid governance frameworks, and efficient public financial management procedures. Tax revenues can boost economic growth in such nations by allowing the government to spend on infrastructure, education, healthcare, and other sectors supporting economic development.
Corporate income tax has been proven to affect economic development in nations with strong fiscal efficiency negatively. High corporate income tax rates discourage investment and entrepreneurship, harming economic growth. In nations with strong fiscal efficiency, lowering corporate income tax rates can be an efficient policy instrument for fostering economic growth.
4.3. Quantifying the Impact of Direct Taxation on Economic Growth Using Panel Data Regression Analysis for the Low Fiscal Efficiency Cluster of Countries
In the European Union, only four states practise a single tax rate (Romania, Bulgaria, Estonia, and Hungary), delimiting the cluster of countries with a single tax rate.
In the 1990s–2000s, there was a tendency for CEE countries to move from progressive to flat-rate taxation. The single-income tax rate (initially 16%) was introduced in Romania on 1 January 2005. In 2018, it was reduced to 10% (as a compensatory measure for transferring social contributions to the employee’s responsibility). However, some CEE countries abandoned the single rate and returned to progressive taxation (Czechia and Slovakia, 2013; Latvia, 2018; Lithuania, 2019). Only four EU countries practise the single quota: Bulgaria, Romania, Estonia and Hungary.
Both tax systems enjoy certain advantages; however, they can be more or less fruitful, depending on the level of sophistication of the tax system in each country and its specificities.
Among the advantages of the single quota is the simplification of the method of calculation and collection, the perception that taxation is fair, the reduction of distorting effects on the labour market and, implicitly, an increase in economic efficiency.
On the other hand, however, progressive taxation is seen as more suitable for combating inequality and poverty, which are higher in developing countries, such as Romania.
In the low fiscal efficiency cluster, some countries have limited fiscal efficiency, such as Bulgaria, Greece, Poland, Croatia, Romania, Hungary, Italy, Czechia, Slovakia, Estonia, Spain, Slovenia, Lithuania, Portugal, Latvia, Cyprus, and Malta.
Particular attention has been given to the relationship between the official and informal economies and their interdependencies with the unemployment phenomenon [
67,
68]. According to them, the two economies are positively correlated, meaning that growth in the official economy is generally associated with growth in the unofficial economy and vice versa, leading to complementarity. However, they can also be substitutes; a growth in the official economy will be associated with a reduction in the informal economy. Ref. [
79] mentioned that the relationship between the two economies depends on the level of economic development.
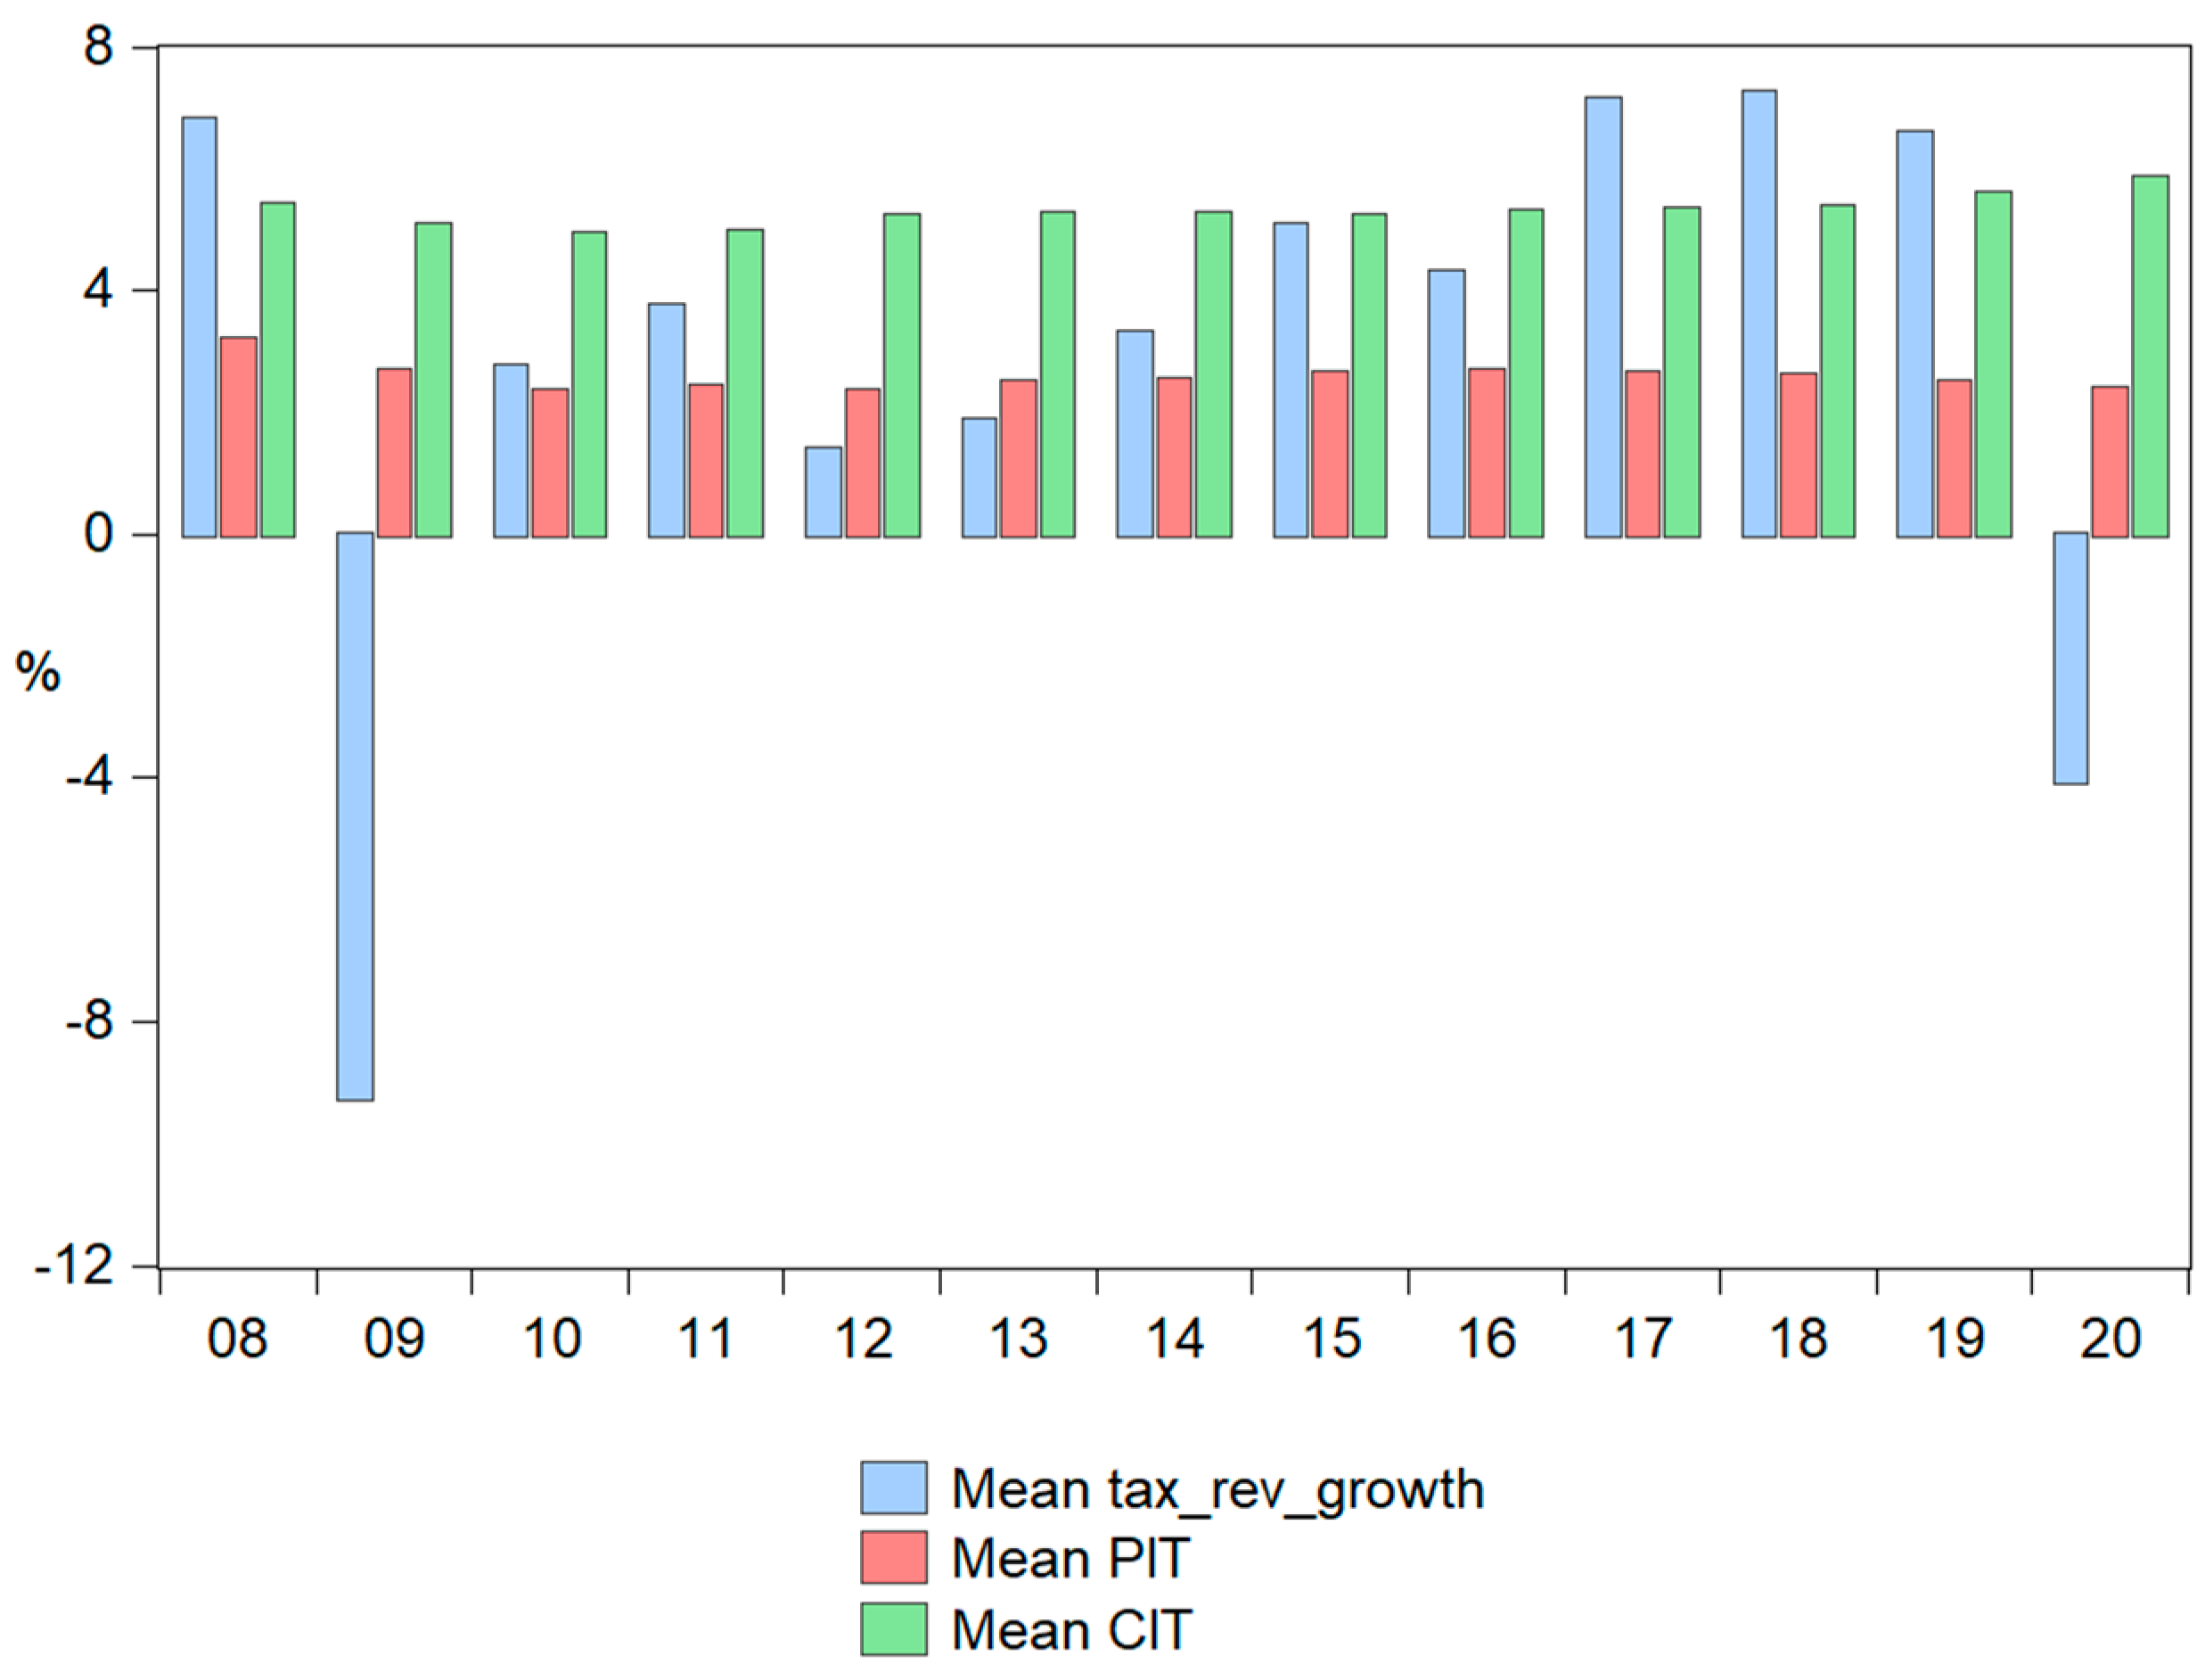
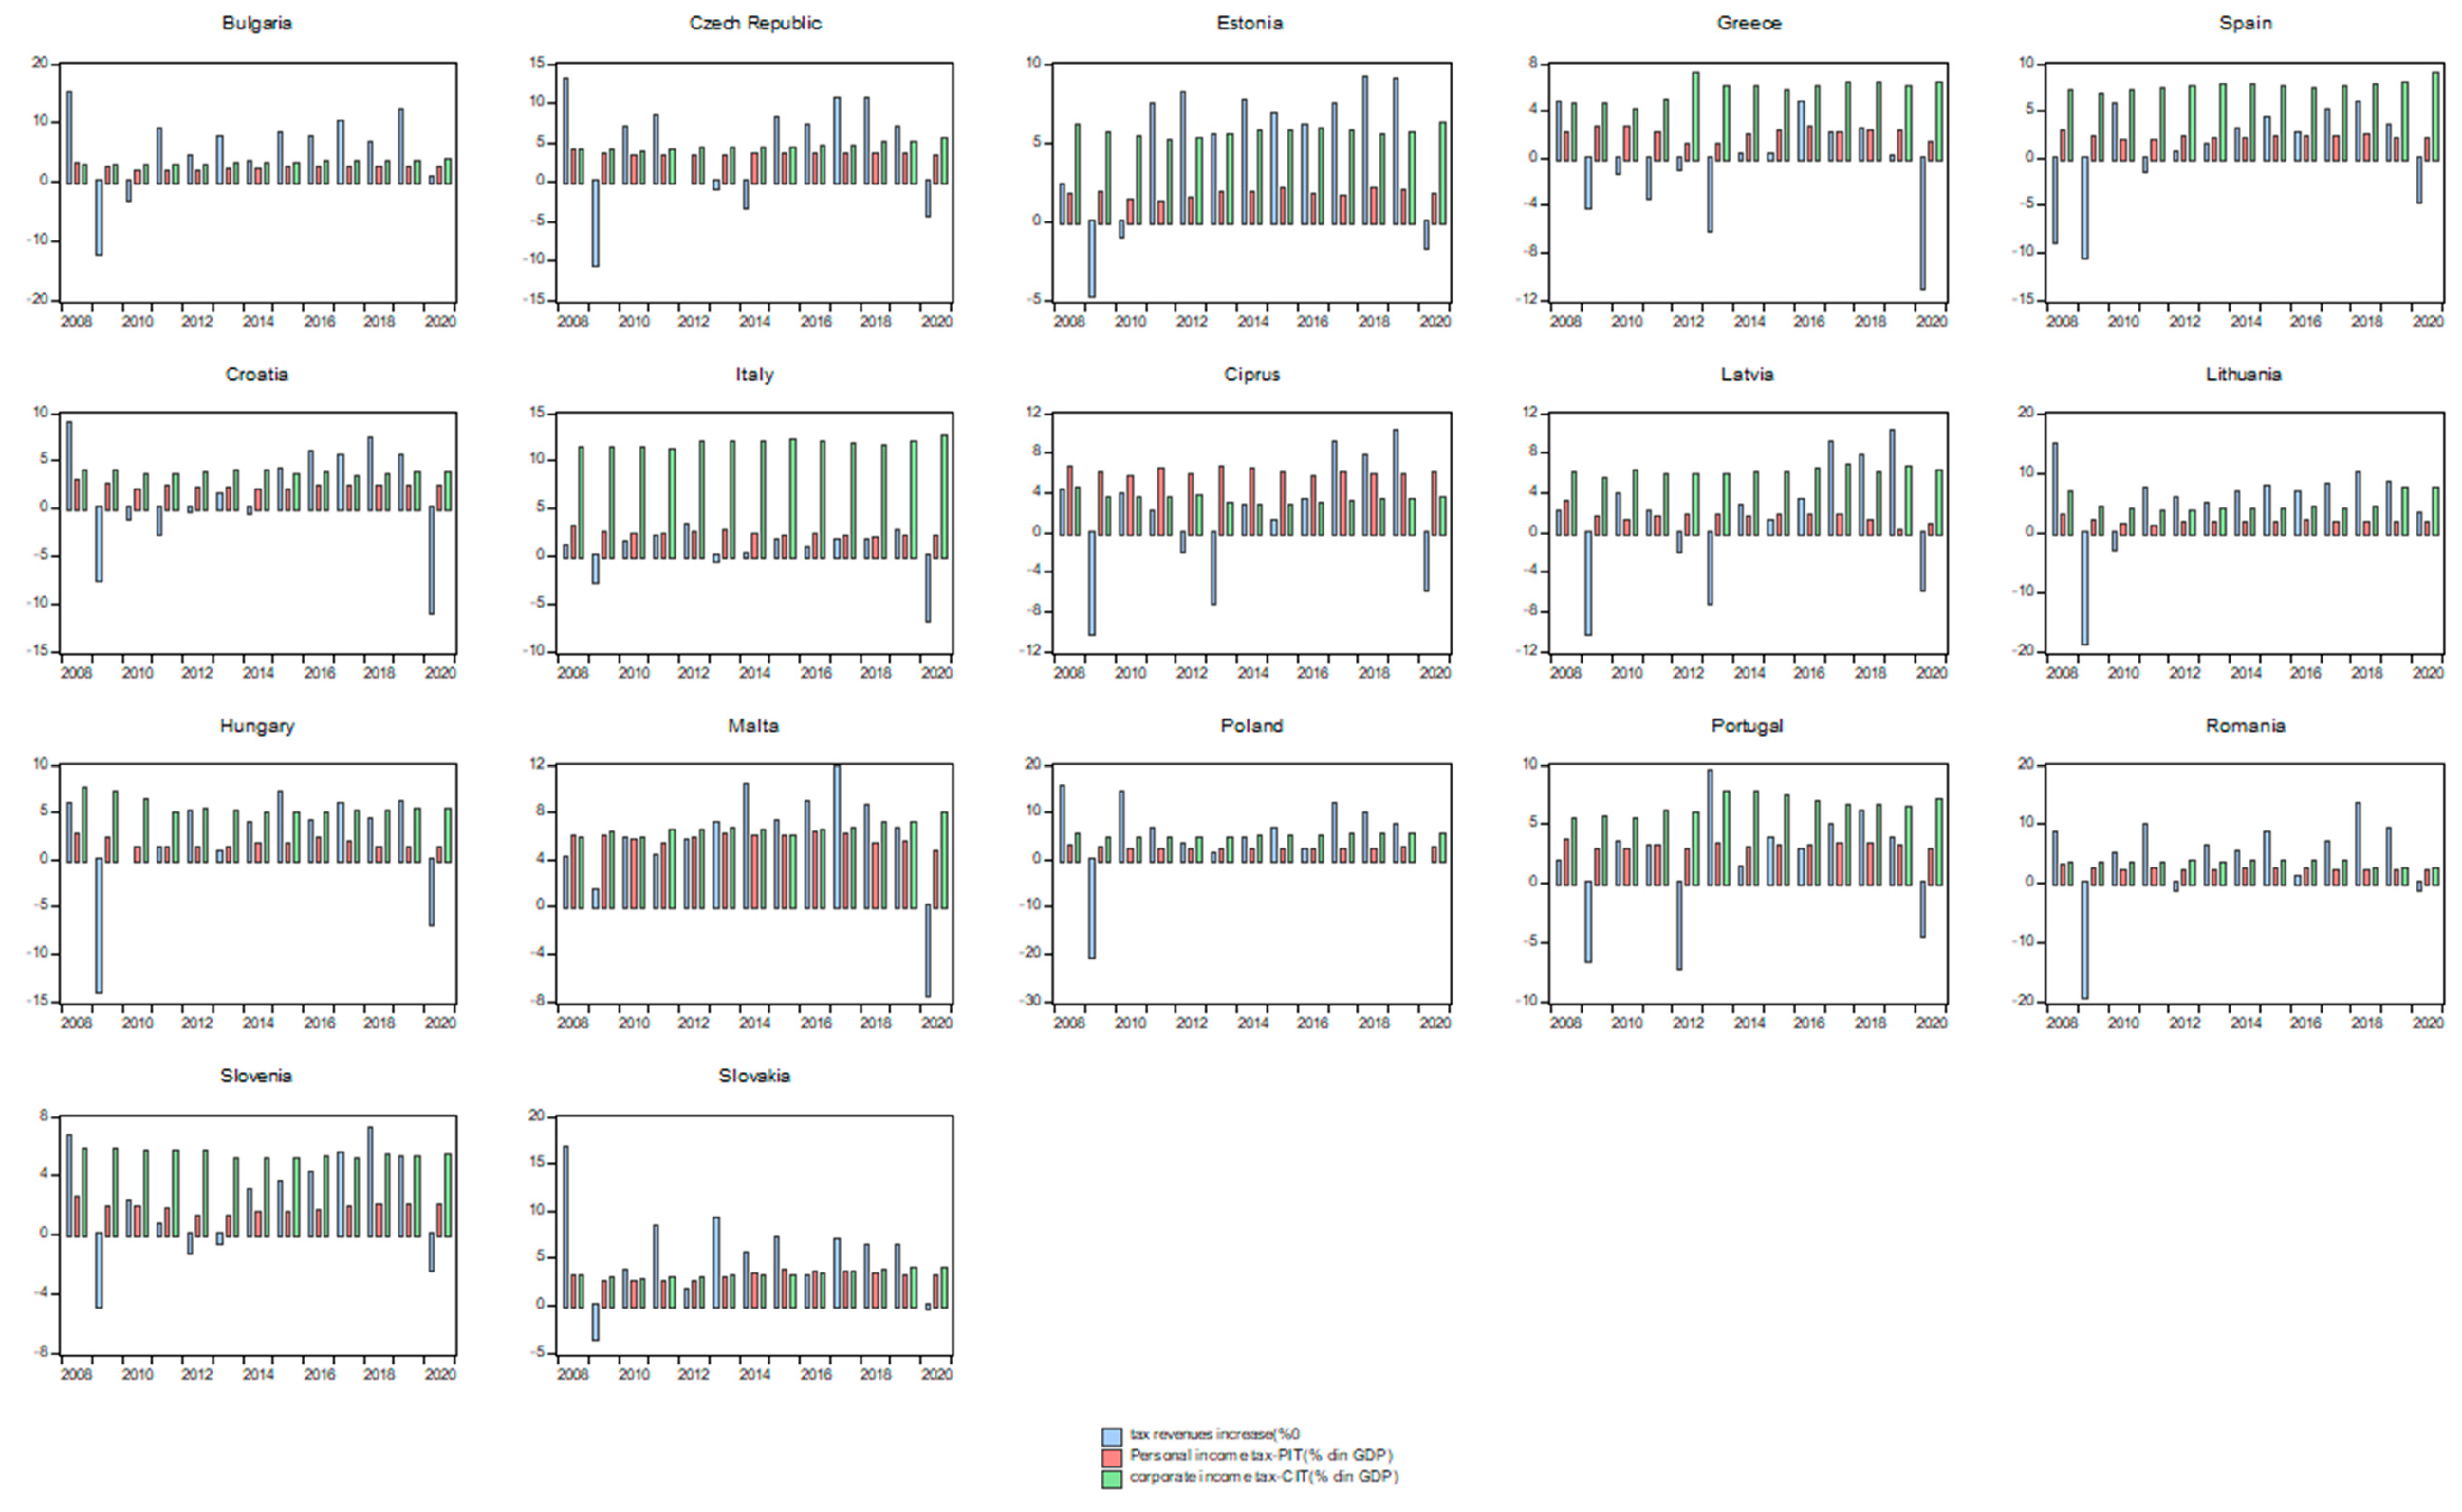
Therefore, analysing the patterns in the macroeconomic indicators at the level of the limited fiscal efficiency group of countries, the average increase in tax revenues over the period 2008–2020 was 2.83%, with an average value of personal taxes income of 2.57% of GDP, and an average value of corporate income tax of 5.28% of GDP (
Figure 9).
Estonia recorded the highest increases in tax revenues, while Italy recorded the highest shares of corporate tax. Personal tax income registered the highest values in Malta and Cyprus (
Figure 10).
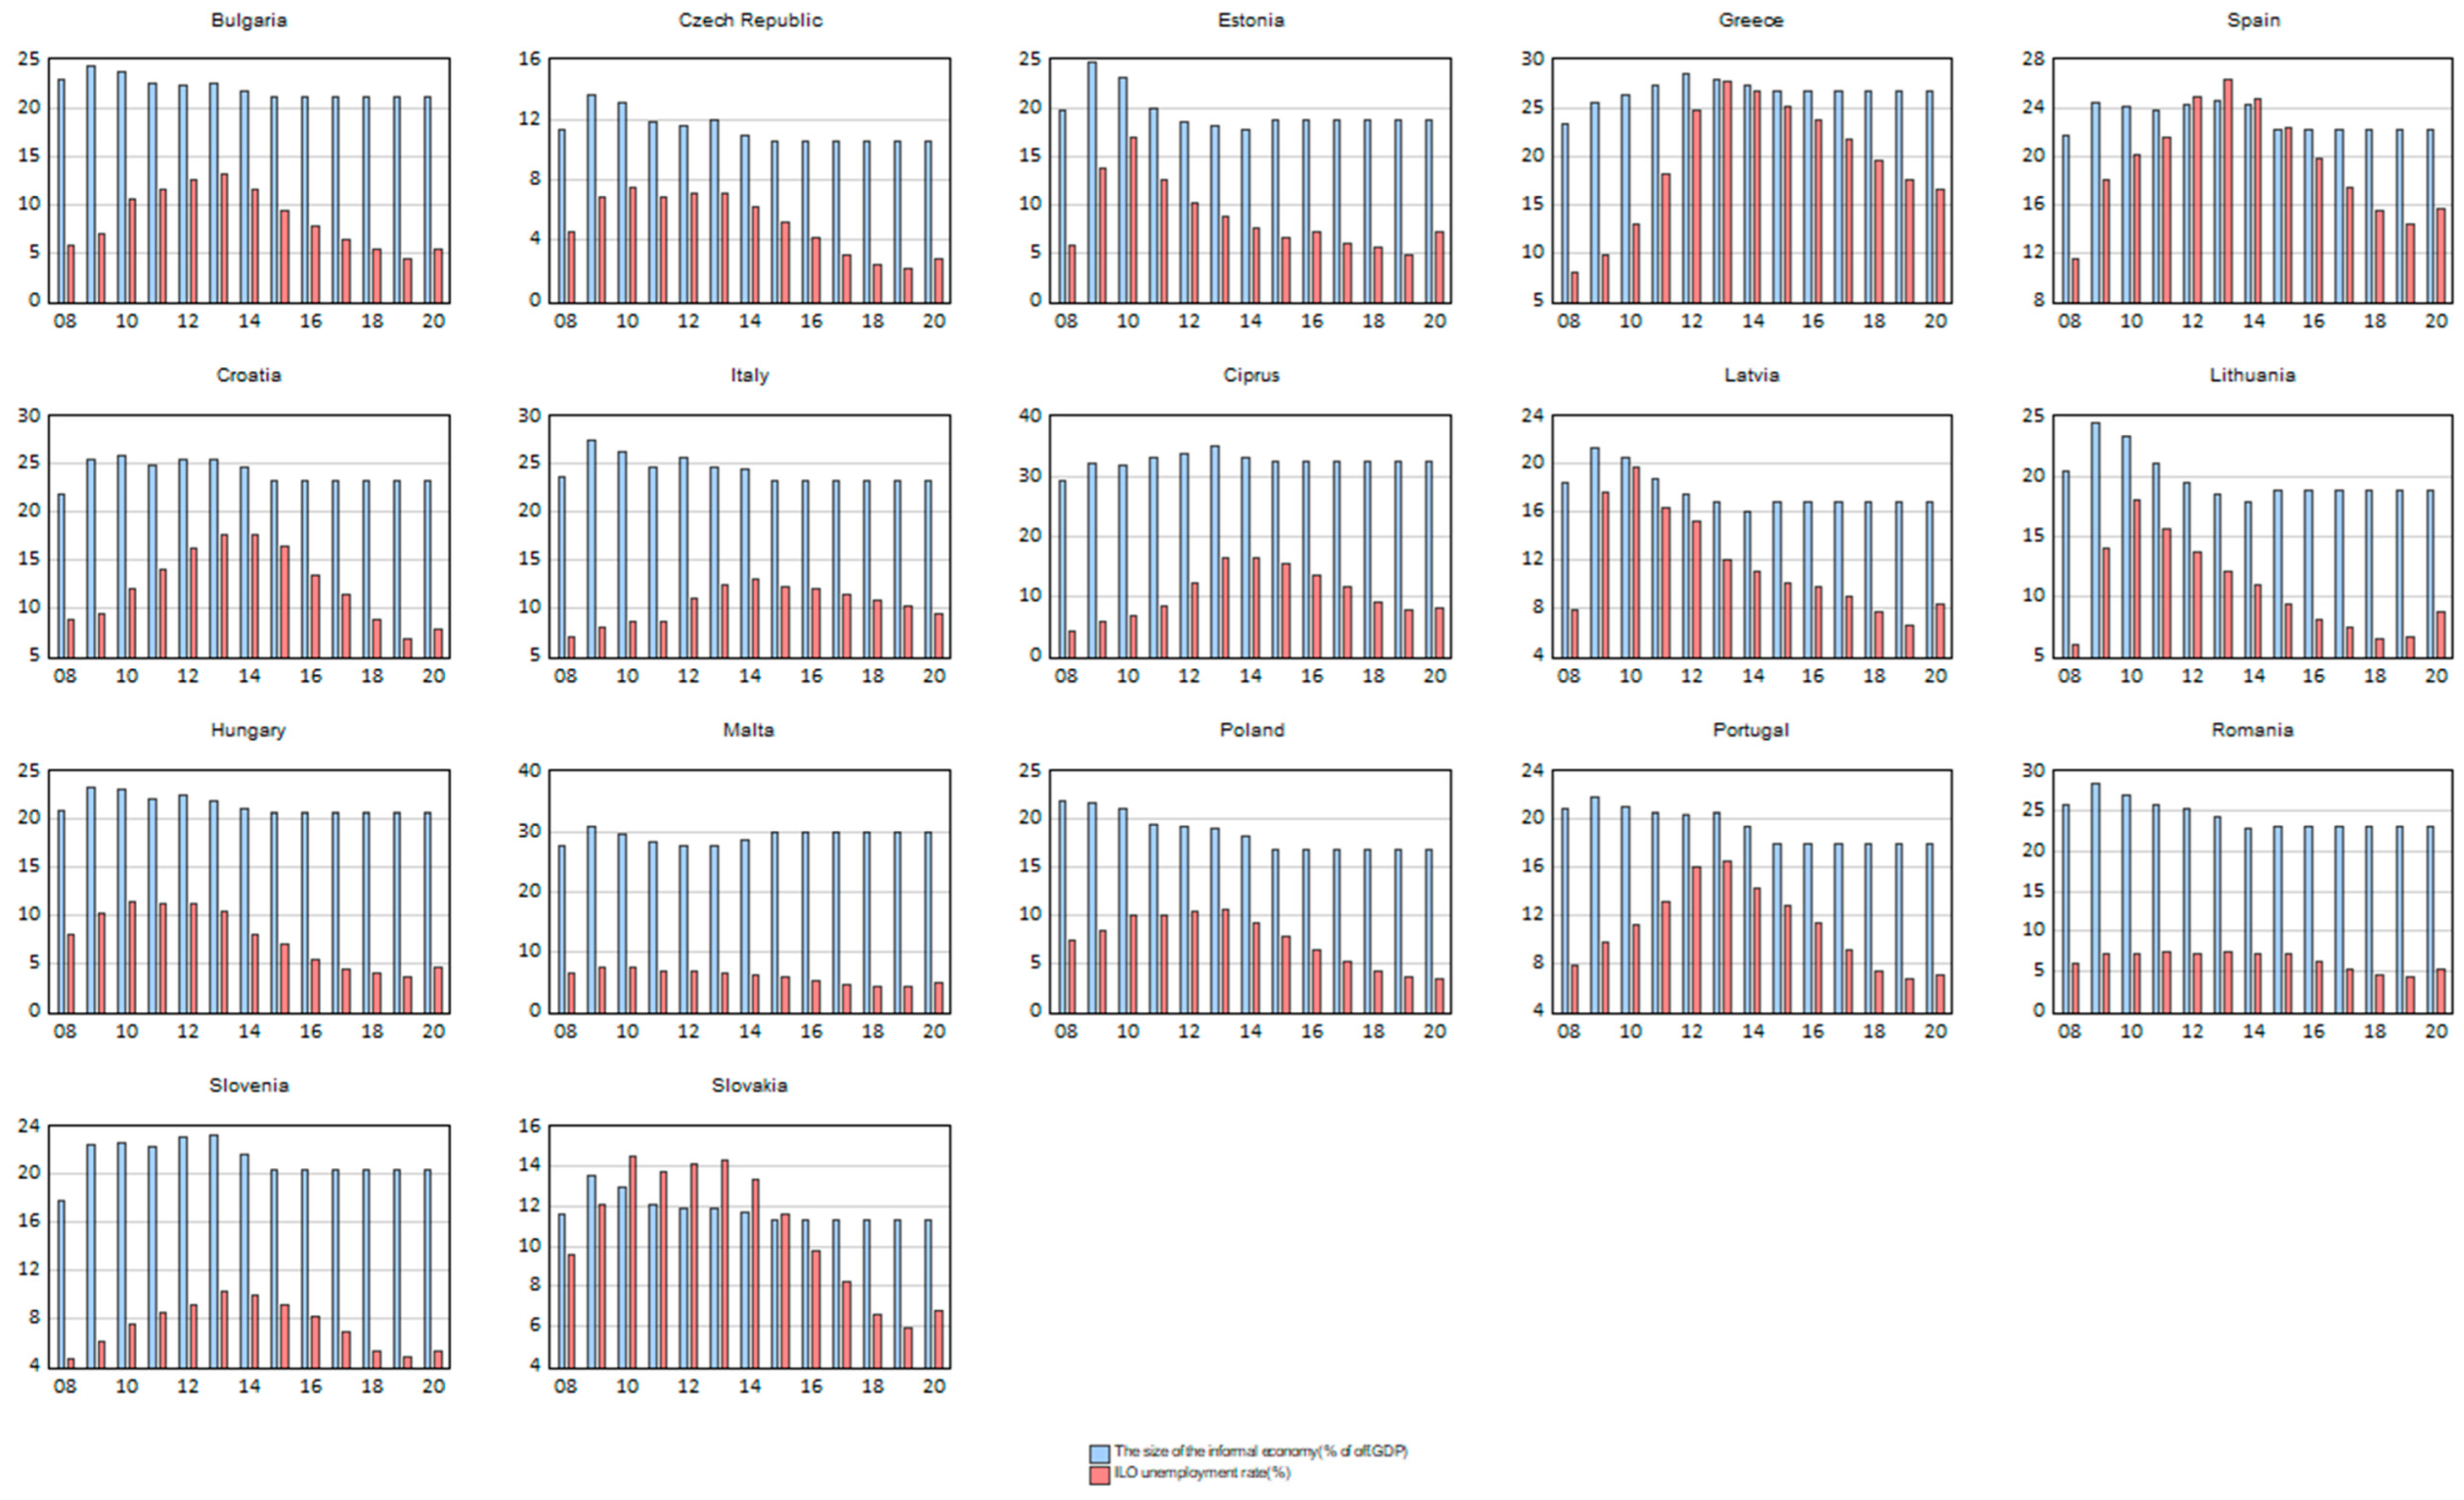
Regarding the prevalence of the informal economy, Cyprus, Malta, Greece, Bulgaria, and Romania have registered the highest values. In contrast, Greece and Spain registered the highest unemployment rate levels (
Figure 11).
The empirical results of both regression models, the initial one and the optimal one are displayed in
Table 5.
Both models exhibited a negative and statistically significant impact of both components of direct taxation-personal tax income and corporate tax income on economic growth, a possible explanation being that income taxes affect the consumption component of total demand. Income tax increases lower personal discretionary income and spending (but less than the change in personal disposable income). This shifts the aggregate demand curve to the left by the initial consumption change produced by increases in income taxes or multipliers. Tax collection procedures in these nations may be inadequate, and tax revenues may not be used properly, limiting the government’s capacity to spend in areas that encourage economic development. Moreover, high tax rates might deter entrepreneurship, investment, and labour force participation, all of which can slow economic growth. To increase the efficacy of tax revenues, policymakers in these nations may need to focus on enhancing tax-collecting methods and public financial management procedures. Therefore, lowering personal and corporate income tax rates might be an effective policy instrument for stimulating economic growth in these countries.
Changes in tax rates also have a significant positive impact on economic growth, while government spending is a barrier to economic growth.
For those limited fiscal efficiency groups of countries, the empirical results revealed a negative impact of the informal economy on the official one, confirming the substitution effect between both economies.
According to [
79], the impacts of the shadow economy (SE) on official economic growth are conditioned by the level of economic development, with a negative connection in low-income nations and a positive association in industrialised and transition countries. Their reasoning was that taxes overburden citizens in high-income nations and regulations overburden citizens in high-income nations; hence, rising SE supported the official economy, since the increased revenue gained in the SE was spent in the official sector. On the contrary, rising SE erodes the revenue base of low-income nations, reducing the provision of public infrastructure and essential public services, hence producing a poorer official economy [
74].
There is a high probability of a negative relationship between informal and formal economies for developing countries, meaning that the informal economy is countercyclical for developing economies.
The Hausman test was applied to confirm whether the estimated specific effects are random and uncorrelated with the explanatory variables. Rejecting the null hypothesis (when the statistic is significant) implies adopting the fixed effects, which means that specific correlated effects are better captured with the fixed-effects model (
Table 6).
The results of the LR test confirmed the significance of the fixed effects, with probabilities below the significance threshold of 1% (
Table 7).
The results of Breuch–Pagan LM, Pesaran-scaled LM, and Pesaran CD were used to test for cross-sectional dependency, revealing the presence of cross-sectional dependence. However, according to Baltagi, this is a problem in macro panels with long-time series (over 20–30 years). This is not much of a problem in micro panels (a few years and a few cases). Panel heteroskedasticity, LR and Jarque–Bera tests were used to assess the homoscedasticity and normality of the residuals, respectively. The empirical results revealed the presence of heteroskedasticity. Furthermore, without altering the values of the coefficients, the issue of cross-sectional heteroskedasticity was addressed using standard corrected heteroskedasticity errors. Regarding diagnosing both models, multicollinearity has been investigated using the correlation matrix and variance inflationary factor (VIF) (
Appendix B,
Table A3 and
Table A4).
Analysed through the lens of the Fisher test, the models are statistically valid, and the degree of the model determination revealed that the joint action of all predictors explained approximately 70% of the variation in economic growth.
Therefore, in the case of the second cluster of countries with limited fiscal efficiency, both components of direct taxation significantly impacted economic growth and increased tax revenues and government expenditures.
4.4. Endogeneity Testing of the Impact of Direct Taxation on Economic Growth Using GMM Estimation
The empirical results of the GMM estimates, exploring the impact of direct taxation structure on economic growth for both clusters of countries, are presented in
Table 8. The lagged economic growth variable pointed out its statistical significance in both models, revealing that the economic growth from the previous year leads to economic growth in the current year. This result is preserved among both groups of countries.
Increased tax revenues contribute to increased economic growth in both clusters, with a greater influence in developed nations. This conclusion shows that a percentage point increase in these taxes corresponds to a 0.48 and 0.30 percentage point increase in GDP growth, respectively.
Analysing the impact of direct taxation structure, the empirical results revealed an adverse impact of direct taxation on economic growth for both clusters. Thus, they acknowledged the impact of corporate tax in the case of the countries in the high fiscal efficiency group and the impact of both personal income tax and corporate tax for the limited fiscal efficiency group of countries. Government spending and inflation exhibited an adverse effect on economic growth. The negative relationship between both economies has been preserved for countries in the limited fiscal efficiency groups, confirming the previous studies in the field.
5. Discussion
Fiscal policy is one of the most suitable and used tools which acts, through redistribution, on social well-being, or more concretely on reducing income inequality. It is also an important factor in the regulation of the economy. The government can act on companies and individuals through fiscal policy to regulate their behaviour. As a general objective, fiscal policy aims to collect the resources in the form of fiscal revenues that constitute the funding for public expenses; it also aims to redistribute these revenues fairly, stabilise the economy, and support economic growth. Economic growth is the basis for economic and social performance. This creates the conditions for an uptick in the population’s standard of living by reducing inequalities and poverty and improving access to education and health, all leading to increased social well-being.
The main aim of this research has been to examine the impact of direct taxation structure on economic growth at the level of EU countries covering the period 2008–2020. In order to do that, the countries have been classified into two groups: those with high fiscal efficiency and those with limited fiscal efficiency.
The empirical results for both clusters of countries revealed that amplifying tax revenues increases the economic growth of both clusters, with a higher impact in the case of developed countries, fully supporting hypothesis H1. This result was preserved irrespective of the method applied. Thus, a percentage point increase in these taxes leads to GDP growth by 0.48 and 030 percentage points, respectively. These findings are in line with research carried out in developed and high-income nations, confirming the link between taxation and economic development [
80,
81,
82]. This outcome is not unexpected because it is consistent with the way most tax research on growth has established a direct correlation between taxes and economic growth [
83,
84,
85].
Ref. [
80] acknowledged the role of corruption in this equation, claiming that taxes have a favourable and significant influence on growth in a state with low levels of corruption. According to [
82], the tax structure positively and substantially influences economic growth and is connected to general fiscal policy development, government expenditure, a balanced budget, and the tax structure, all of which encourage growth in the 28 European nations. According to [
81], who looked at the data from the various groupings of nations, the tax revenue to GDP ratio positively impacts growth in high-income and upper-middle-income countries. However, it harms growth in lower-middle-income and low-income countries.
Analysing the two components of direct taxation, personal income tax and corporate income tax, the empirical results revealed that the negative effect of corporate income taxes on economic growth had been preserved for both clusters of countries. Additionally, for countries in the limited fiscal efficiency group, the empirical results revealed that personal income tax was associated with lower economic growth. Therefore, the empirical results only partially supported the hypothesis H2.
The research results align with the general lines of the empirical studies that confirm the negative impact of direct taxation on economic growth. Ref. [
35] acknowledged that corporate tax is associated with lower economic growth. The studies [
12,
38,
48,
49] confirmed that corporate income taxes are associated with lower economic growth at the level of OECD countries.
The negative effect of personal income tax on economic growth has been stipulated by the studies [
39,
48], pointing out that a decrease in PIT and CIT will lead to an increase in economic growth.
The informal sector represents a factor that can undermine fiscal policy’s economic and social efficiency. Companies and individuals can contribute to adverse effects on sustainable economic growth and social well-being by circumventing taxation. According to [
86], these activities reduce the tax base and prevent the efficiency of fiscal policy. Our results confirmed that the relationship between both economies is countercyclical for countries in the limited fiscal efficiency group. Furthermore, an increasingly informal economy erodes the tax base, resulting in a lower provision of public infrastructure and basic public services, which leads to a lower official economy [
69,
79].
Thus, informality can reduce income to the state budget, diminishing the state’s ability to invest in public goods [
87]. Researchers [
88,
89] agree that informality in the labour market is both a social problem and a public health problem (as informal workers have reduced access to public health services). This significantly contributes to a reduction in social well-being, which is subsequently reflected in reduced sustainable economic growth perspectives.
On the other hand, the reduction of direct taxation can boost the reduction of informality by leading to the accumulation of more tax revenues in the state budget, a sustained economic increase (in both collection and activity), and increased social well-being, thereby improving the redistribution mechanism. This aspect may be especially valid in developing countries, as they have a higher degree of informality, because the tax system represents an expensive burden.
Direct taxation and informality have often been associated in empirical studies with both evidence of a positive relationship between them [
90], as well as a negative relationship [
91], and these differences mainly derive from the application mode and quality [
92,
93].
Thus, the study concludes that tax revenue increases boost economic growth for both groups of countries, while corporate income taxes are associated with lower economic growth. Additionally, the empirical results revealed that personal income taxes harm the economic growth of countries characterised by limited fiscal efficiency.
Furthermore, the study proved the validity of the substitution effect between the informal economy and the official one, acknowledging the existence of a negative relationship between both sectors for the limited fiscal efficiency group of countries. This inverse link between the informal and formal sectors in nations with low fiscal efficiency shows that as the informal economy increases, the formal economy declines, and vice versa. People and firms may operate in the informal sector to avoid the taxes, regulations, and other costs connected with official economic activity. As a result, the government may receive less money, reducing fiscal efficiency and limiting the ability of the government to deliver public goods and services. Conversely, if the government increases fiscal efficiency and lowers the costs of doing business in the formal sector, more individuals and enterprises may opt to do so, reducing the size of the informal economy.
We can mention the study’s main limitations: the study may not establish causality between direct taxation and economic growth. Other factors may contribute to economic growth, and the study may not account for all of them, such as sociopolitical circumstances and technology, using a single analysis method. Because economic conditions and tax policies differed widely among nations, the study’s conclusions may not apply to all countries or areas. The study may not capture the long-term effects of direct taxation on economic growth. Economic growth is a complex process that may take years or even decades to materialise, and the study may only cover a limited timeframe. Analysing only one year of the pandemic crisis might not adequately represent its phases. The availability and quality of data limit the study’s findings. Some countries had incomplete or inaccurate data, making it difficult to draw accurate conclusions.
6. Conclusions
The main aim of this research has been to examine the impact of direct taxation structure on economic growth at the level of EU countries covering the period 2008–2020. In order to do that, the countries have been classified into two groups: those with high fiscal efficiency and those with limited fiscal efficiency. The empirical results for both clusters of countries revealed that amplifying tax revenues increases the economic growth of both clusters, with a higher impact in the case of developed countries.
Tax revenues can be increased by raising tax rates, broadening the tax base, or improving tax administration. The influence of increasing tax collections on economic growth can vary depending on a variety of factors, including the country’s degree of development.
Increased tax revenues can contribute to increased economic growth through several channels. First, the additional revenues may fund public goods and services such as infrastructure, education, and healthcare. This boosts economic productivity, attracts foreign investment, and generates new employment possibilities, resulting in stronger economic growth. Second, tax money may decrease public debt, boost government legitimacy and investor confidence, and increase investment and economic growth. Lastly, tax money may be utilised to minimise income disparity and give social protection to disadvantaged groups, boosting social cohesion and promoting population well-being, resulting in stronger economic development.
Analysing both the components of direct taxation, personal income tax and corporate income tax, the empirical results revealed that the negative effect of corporate income taxes on economic growth had been preserved for both clusters of countries. Additionally, the empirical results revealed that personal income tax was associated with lower economic growth for countries in the limited fiscal efficiency group.
Overall, corporate income taxes negatively influence economic growth due to their disincentive effect on investment, promotion of debt financing, discouragement of entrepreneurship, and lowering competitiveness. Personnel taxes negatively influence economic growth due to their disincentive effect on labour, encouragement of the informal sector, loss of disposable income, and discouragement of human capital investment.
As a result, while creating tax policies, officials should carefully evaluate the economic consequences of personnel and corporate income tax rates and balance the trade-offs between tax collections and economic growth.
This negative impact of direct taxation on economic growth can be seen from different perspectives:
Incentive effects: Direct taxation can reduce the incentive for individuals and businesses to work and invest, as they may perceive that the government will take a larger portion of their income or profits. This can lead to lower productivity, lower levels of investment, and ultimately slower economic growth. Overall, incentive effects are important when considering direct taxation’s impact on economic growth. While taxation is necessary to fund government activities and provide public goods and services, high tax rates can reduce the incentive for people to work, save, and invest. Finding the right balance between taxation and economic growth is challenging for policymakers.
Disincentive to work: High direct taxation levels can discourage people from working and limit their willingness to take on additional work. Their extra income may be taxed more, reducing the incentive to work harder or take on extra hours.
Lower disposable income: Direct taxation can reduce the amount of money people have left over after paying taxes. This, in turn, can reduce consumer spending, a key driver of economic growth.
Reduction in investment: Direct taxation can reduce the level of investment in the economy. This is because investors may perceive that the returns on their investments will be reduced by higher taxes, making them less attractive to investors.
Large direct taxes may harm economic growth by discouraging labour, savings, and investment. This is because high tax rates lower the motivation for individuals and corporations to work harder and invest more, eventually slowing economic development.
However, the link between direct taxation and economic growth is more complex, and the influence of taxes on growth is affected by several factors, including the degree of economic development, the structure of the tax system, and the use of tax proceeds. Therefore, policymakers should consider the trade-offs between tax revenues and economic growth when designing tax policies.
The negative impact of direct taxation on economic growth can have several implications for businesses:
Reduced investment: When tax rates are high, businesses may be less inclined to invest in new projects or expand their operations, as the returns on investment may be lower due to higher taxes. This can limit the growth opportunities for businesses and reduce their ability to create jobs and contribute to economic growth.
Higher costs: Higher tax rates can increase business costs, as businesses may have to pay more taxes on their profits or revenue. This can reduce their profitability and competitiveness, especially if their competitors operate in countries with lower tax rates.
Reduced innovation: High tax rates can discourage innovation, as businesses may be less willing to take risks and invest in new technologies or processes if they face high tax burdens. This can limit their ability to compete and adapt to changing market conditions.
Limited access to capital: If businesses cannot invest due to high tax rates, they may also find it difficult to access capital from financial markets. This can limit their ability to grow and expand and may make it difficult to weather economic downturns.
Overall, the negative impact of direct taxation on economic growth can limit growth opportunities for businesses, increase their costs, reduce their competitiveness, and limit their ability to innovate and access capital. As such, businesses may need to carefully consider the tax environment when making investment and strategic decisions, and may also need to explore ways to minimise their tax burden and maximise their competitiveness.
Additionally, the negative impact of direct taxation on economic growth can have several implications for politicians, including reduced revenues, reduced popularity, slower economic growth, and increased inefficiencies. As such, politicians may need to carefully consider the economic implications of their tax policies and balance the trade-offs between tax revenues and economic growth.
When tax rates are high, taxpayers may be less inclined to work, save, or invest, leading to lower tax revenues for governments. This can limit the ability of politicians to fund important programs and initiatives, and may also lead to fiscal imbalances.
High tax rates can be unpopular with taxpayers, as they may feel hampered by the high tax burden. This can make it difficult for politicians to win support and popularity, especially if they are seen as advocating for high tax rates.
High tax rates can also lead to inefficiencies in the allocation of resources, as taxpayers may shift their activities to other areas subject to lower tax rates, even if these areas are less productive or beneficial for the economy. This can lead to a misallocation of resources and reduce the economy’s overall efficiency.
At the administrative level, the negative impact of direct taxation on economic growth can have the implications of reduced revenues, increased pressure to find other sources of revenue, reduced efficiency, and the need for a policy response. As such, administrations may need to carefully consider the economic implications of their tax policies and balance the trade-offs between tax revenues and economic growth.
Thus, from the perspective of policymakers, lowering direct taxation can increase disposable income, stimulate consumption and economic growth, encourage investment (leading to job creation), increase competitiveness, and reduce tax evasion and avoidance, leading to a more efficient tax system.
Further research is needed to analyse how different types of taxes, such as indirect taxes, affect economic growth, how taxes affect specific industries or sectors, and whether certain tax policies could be tailored to better promote growth in these areas. Additionally, the authors suggest exploring the potential of tax incentives or other forms of tax relief that could encourage investment and stimulate economic growth. By considering a variety of tax-related factors and implementing targeted policies, policymakers may be able to effectively balance the need for revenue generation to promote economic growth.


