Article

Assessment of Sighted and Visually Impaired Users to the Physical and Perceptual Dimensions of an Oasis Settlement Urban Park

by
Samiha Boucherit
1,*,
Luigi Maffei
1,
Massimiliano Masullo
1,
Djihed Berkouk
2,3 and
Tallal Abdel Karim Bouzir
4
1
Department of Architecture and Industrial Design, Università degli Studi della Campania “Luigi Vanvitelli”, 81031 Aversa, CE, Italy
2
Department of Architecture, Biskra University, Biskra 07000, Algeria
3
School of Design and Architecture, Dar Al-Hekma University, Jeddah 22246, Saudi Arabia
4
Institute of Architecture and Urban Planning, Blida University, Blida 09000, Algeria
*
Author to whom correspondence should be addressed.
Sustainability 2023, 15(8), 7014; https://doi.org/10.3390/su15087014
Submission received: 7 March 2023 / Revised: 8 April 2023 / Accepted: 18 April 2023 / Published: 21 April 2023

Abstract

:
Inclusive design (ID) is a design process that ensures that all people, particularly marginalized groups, can use the environment. Inclusive design (ID) in architecture is based on accurate data related to user experiences where the users’ perception of the built environment demonstrates the optimal facilitation of their expectations, needs, and demands. Despite this, in studies about inclusive design and multisensory architecture, the perspective of visually impaired people (VIP) is still lacking, especially in accessing public spaces. To address this gap, this study aims to investigate how sighted and visually impaired people perceive an oasis settlement urban park’s physical environment and verify the similarities and differences between these two categories. The research was conducted by applying two approaches, one qualitative based on a series of field surveys and the other quantitative relying on in situ measurements of the physical dimensions of the environment. The main findings of this study show that visually impaired people deserve special consideration due to their varying abilities to perceive the surrounding environment. Furthermore, the results indicate that auditory environments are more perceptible to the visually impaired than the sighted. In contrast, findings from the analysis of the perceived restorativeness scale (PRS-11) show that sighted users of the park have a slightly higher average score than visually impaired users regarding its components of Fascination, Being-Away, Coherence, and Scope. According to the Semantic Differential Scale of Multi-Variable Evaluation of the Park Environment, there are no significant differences between park users’ perceptions of the park’s nature and the thermal environment. The conclusion suggests that to ensure users’ well-being, it is crucial to understand the different individual needs among groups of users and come up with innovative and all-inclusive solutions.

1. Introduction

In the last decade, oasis settlements, which are the most prevalent urban model in the Saharan region of North Africa, are facing an enormous urban sprawl [1] followed by an outdated urbanization strategy that may cause the disappearance of the feeling of calm and tranquility that these oases provide [2]. In addition, this rapid, heavy, and poorly controlled urbanization has progressively transformed most of Algeria’s oases into Saharan cities, resulting in radical changes in luminous and thermal ambiences and urban soundscapes [3]. As a result, the current urbanization of desert and Saharan regions faces many challenges regarding livelihoods, the well-being of inhabitants [4], public health, and quality of life, but the main challenge is to make cities as inclusive as possible. Although the UN Sustainable Development Goal (SDG) 11 (Make cities and human settlements inclusive, safe resilient, and sustainable) emphasizes the need to make urban areas more functional, orderly, and convenient to improve the occupants’ life quality, a critical situation for people with disabilities remains an issue. In fact, green spaces are part of the environmental systems that are indispensable to the quality of human life in urban places [5,6], which is the reason for the high demand for the services provided by urban green spaces that play a crucial role in preserving human health and quality of life [7]. In addition, urban green spaces contribute significantly to maintaining physical and mental health as they encourage physical activity and social integration [8] by providing important urban open spaces for recreation by urban dwellers [9].
The physical environment is a complex of many factors that represent the space’s ambience, as a combination of multiple perceptions such as visual, thermal, audible, and olfactory perceptions offered by a physical environment for persons at a given time [10]. So, the landscape and the soundscape of an urban park significantly impact users’ well-being. In addition, the soundscape has lately been used in urban park landscape studies to guarantee a multisensorial understanding [11,12], especially when combined with other physical stimuli, such as smell, touch, and sight [13]. As a result, urban green areas provide fertile ground for studies of how people interpret their surroundings [14]. Multisensory architecture and inclusive design are two ideas that grew out of these considerations.
Inclusive design is considered an innovative strategy to design spaces open to people’s diversity and needs, and it contributes to the understanding of the diversity of users [15]. Moreover, multisensory perception of the surrounding environment has become a well-known universal fact to ensure inclusive design principles [16]. In this framework, several studies on urban design have investigated the relationship between multisensory stimuli of open space environments and human perception. [17]. However, few have investigated specific categories [18], such as aged park users or the visually impaired.
Visually impaired and blind people (VIBP) face varied challenges in their daily lives, especially using public spaces [19]. Despite being considered one of the most vulnerable communities in urban areas, VIBP are often indirectly excluded from accessing parks and other open public spaces [20]. As they do not adequately use the sense of sight, they integrate missing cues from this sense through the auditory and tactile senses [21] to perceive the surrounding environments [22]. On the one hand, recent studies have investigated if VIBP can acquire the same spatial knowledge (and at the same level) by implementing functions that compensate for the lack of vision [23]. On the other hand, some researchers investigate the soundscape dimension of VIBP in urban parks, including details of the acoustic environment that develops soundscape dimensions [24]. However, the limitations of these studies are that they usually focus on one sensory aspect of the Visually impaired and blind people, which cannot be considered representative. In addition, oasis settlements and emerging urban spaces are often neglected.
In this framework, the present study describes the different physical characteristics of an oasis settlement’s urban park. In addition, this paper aims to explore how visually impaired people experience these settings by conducting comparative research between sighted and visually impaired users, including pupils in primary and middle schools, to extract the similarities and differences in their perception.

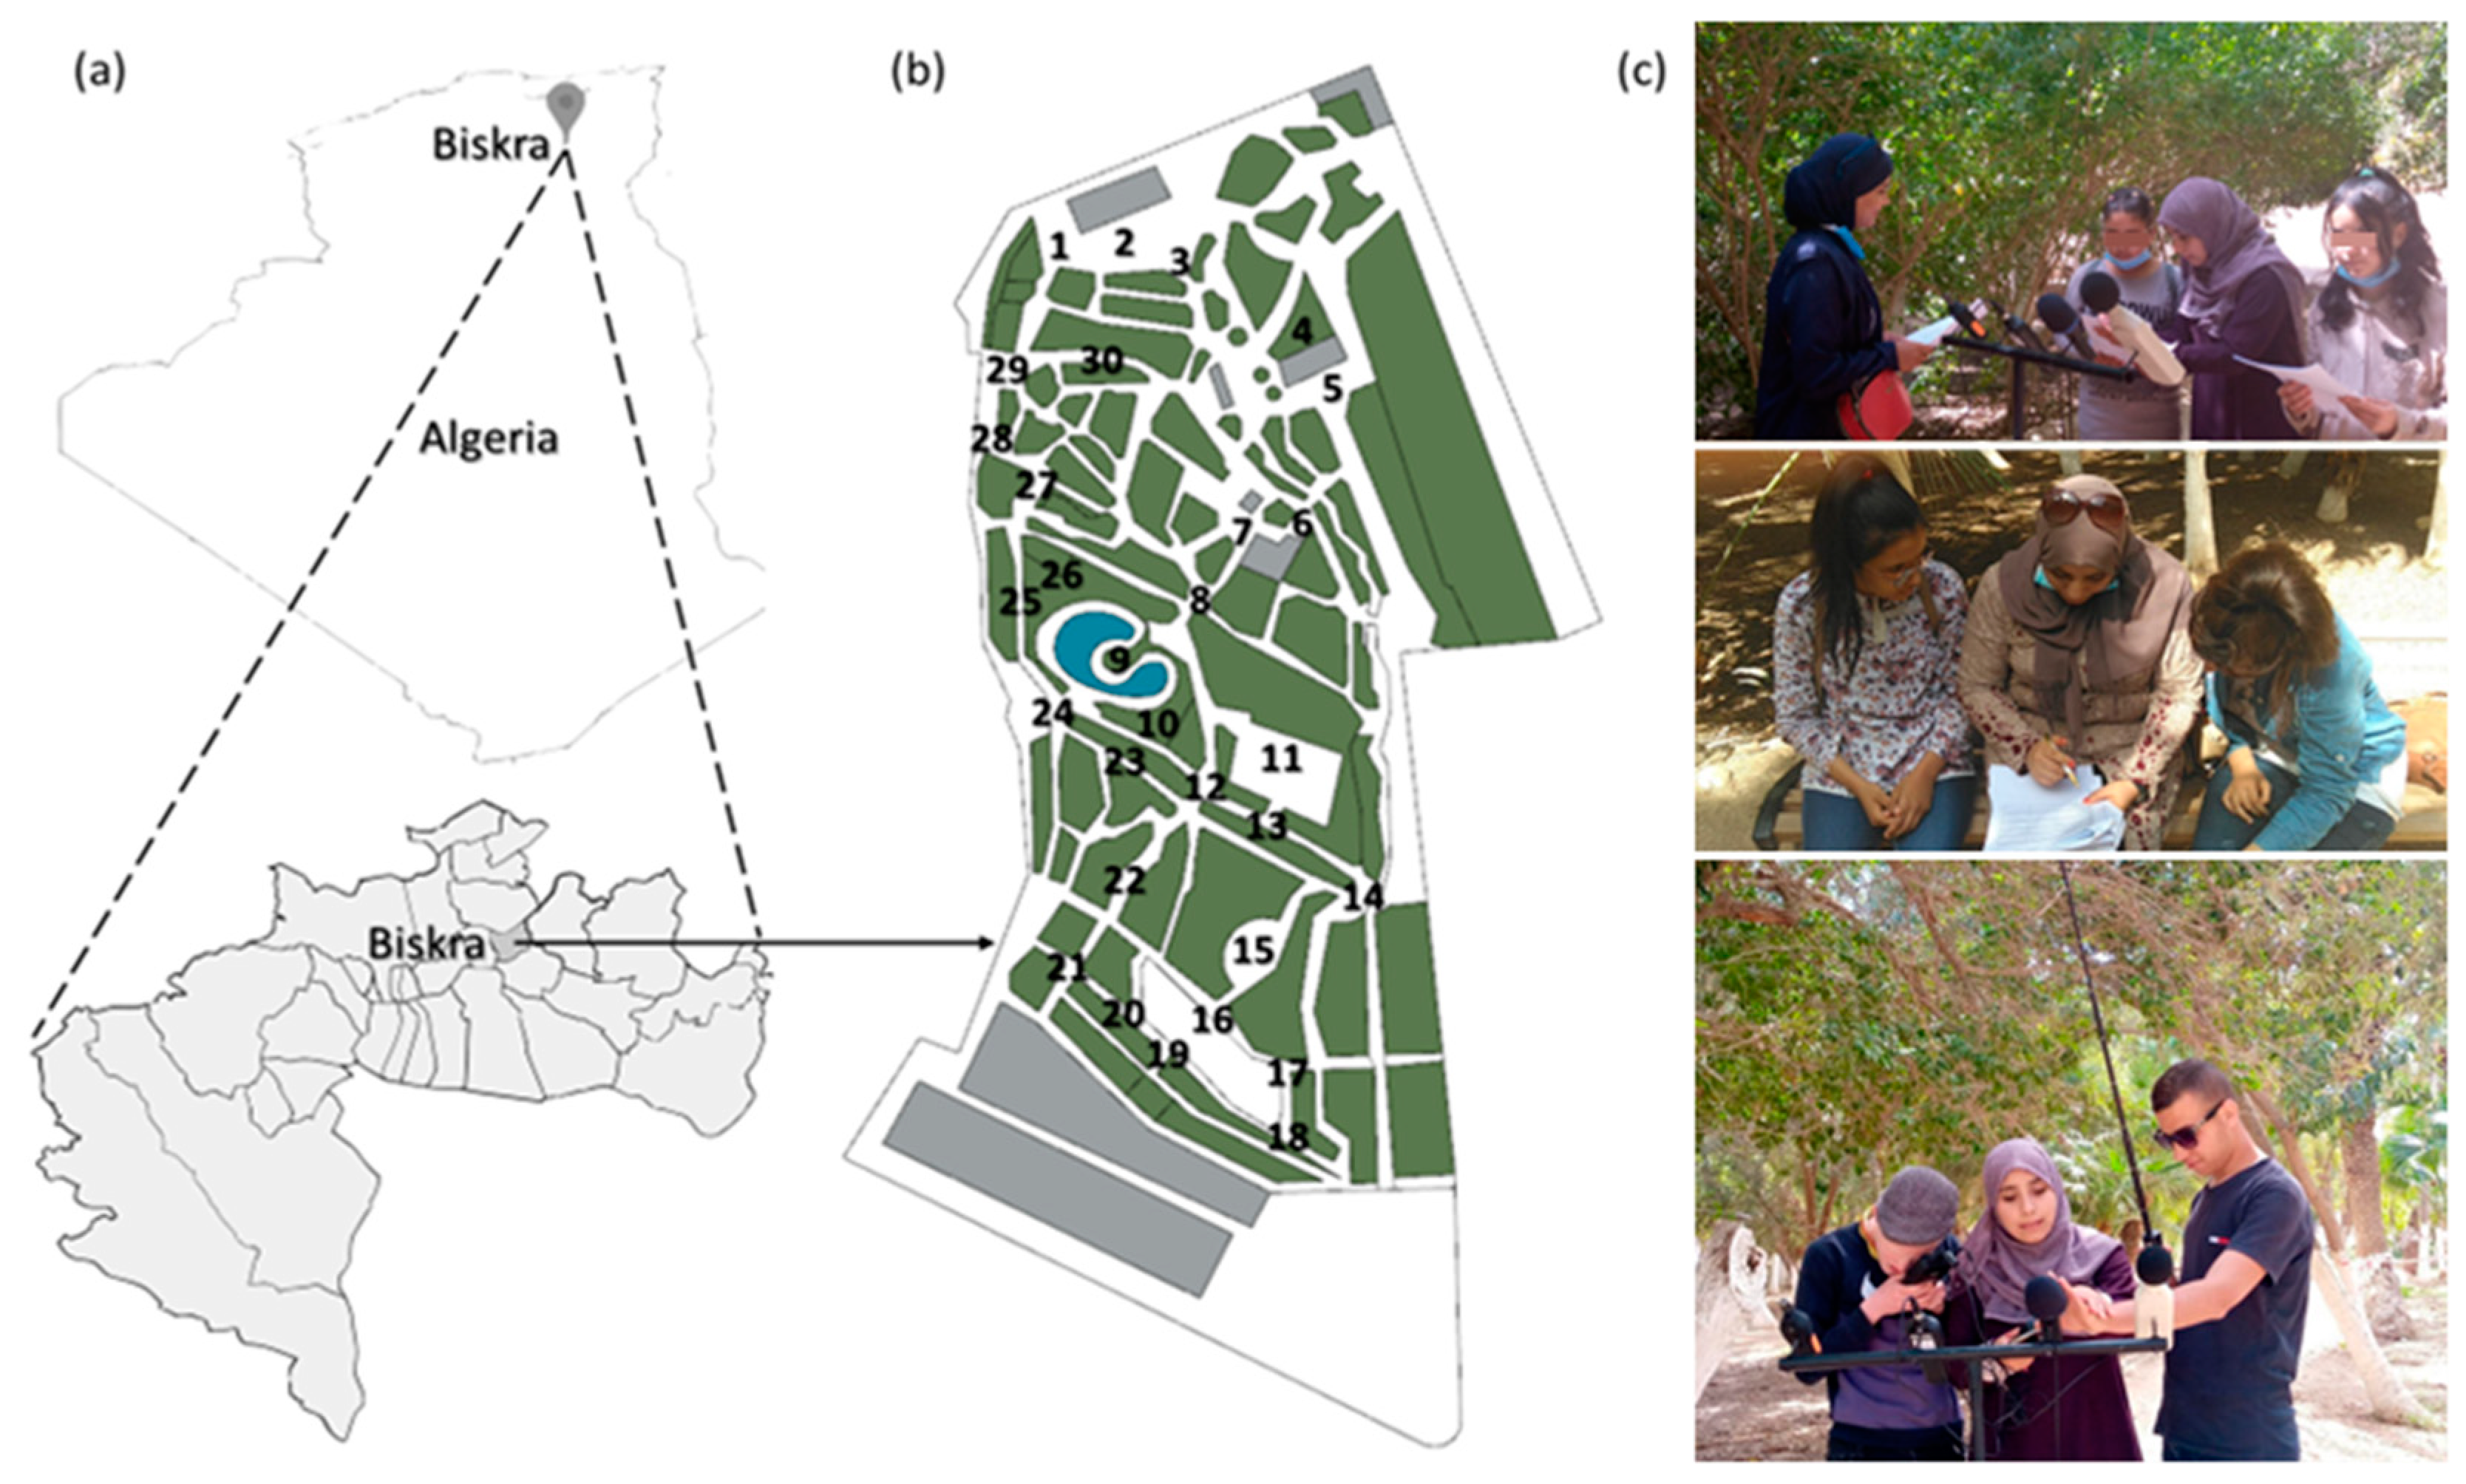
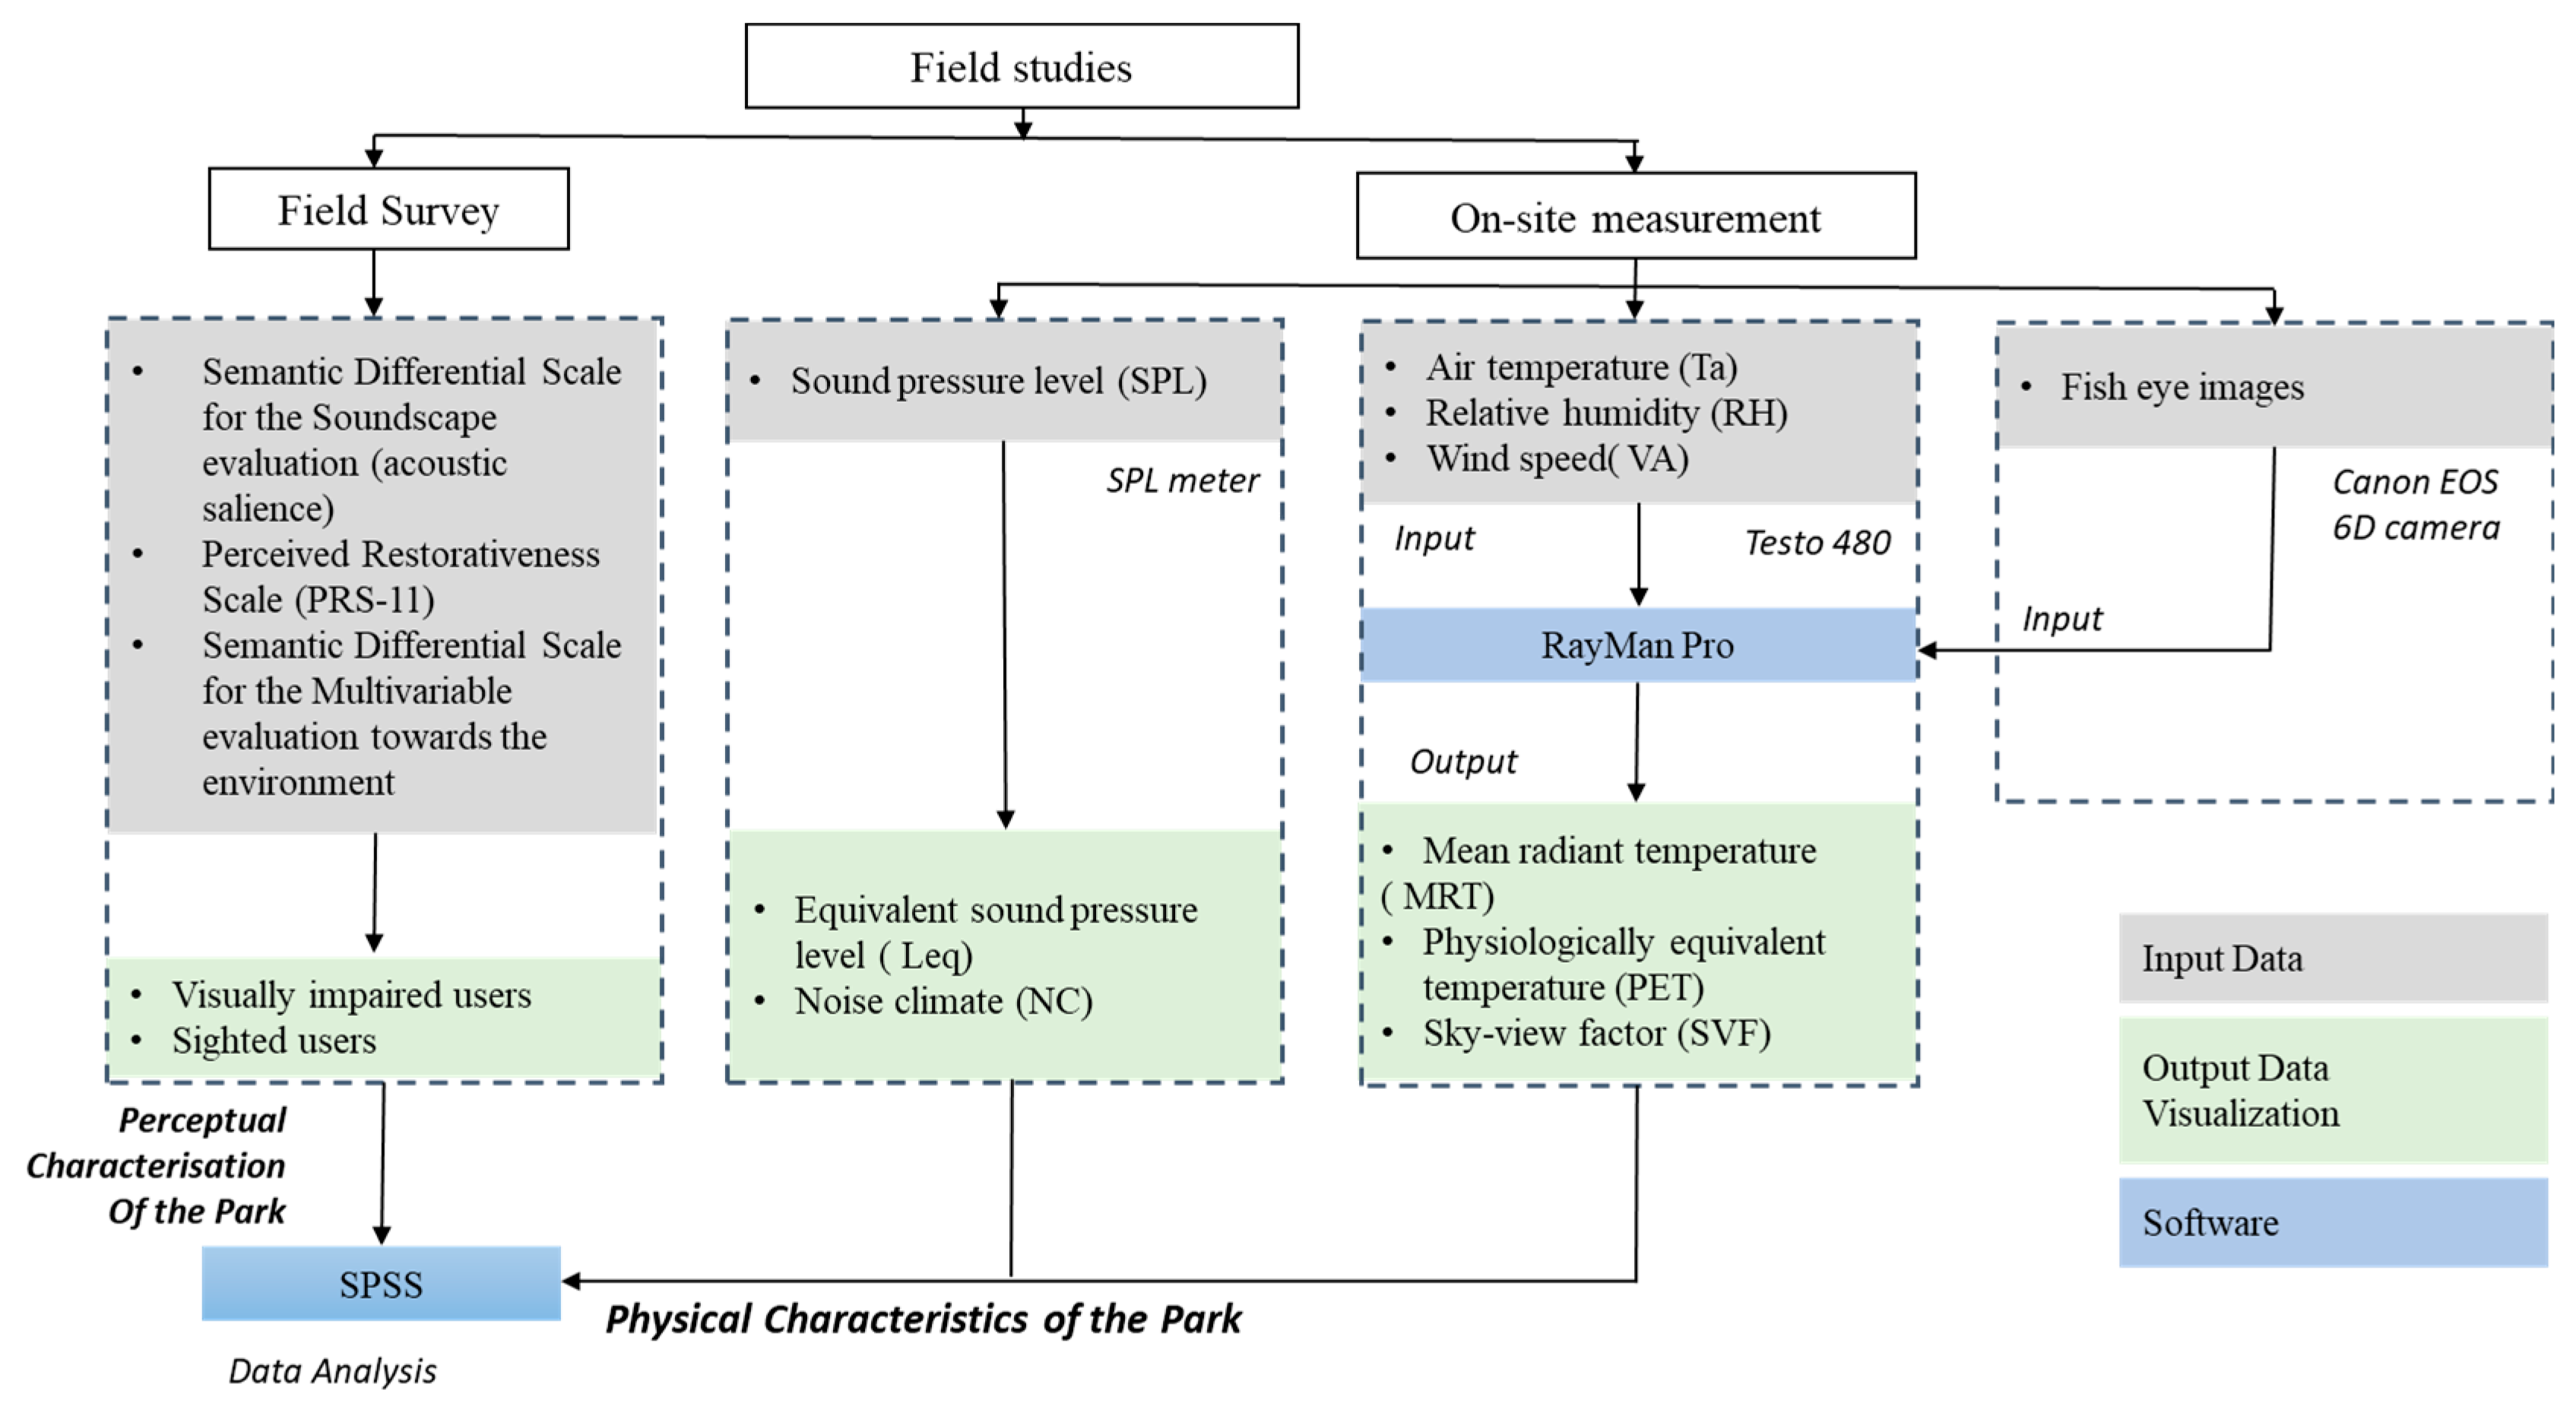
2. Methodological Approach

This research was carried out in Landon Park, one of the most important parks in Algeria. It is located in the city of Biskra, the capital of the Ziban (Oasis Settlements) and the first Saharan urban pole of the country. This city is characterized by a hot desert climate, as it is located in the northeast of the Algerian Sahara Desert (see Figure 1). In this study, field studies were conducted in two stages (see Figure 2). In stage one, in situ measurements were carried out to identify and verify the association between the physical dimensions of the urban park. In stage two, field surveys were executed to compare the perceptual characterization of the sighted and visually impaired users of this park.

2.1. Stage 1: Physical Dimensions Measurement

Several in situ measurements were conducted by calculating the different physical dimensions of the environment (acoustic and thermal dimensions) in the thirty measuring stations (see Figure 1). The choice of the measuring stations in the park was based mainly on the sky view factor (SVF) variation, which was between 0.036 and 0.557 (±0.15) (see Figure 3). It should be noted that the SVF was calculated using Rayman software based on the fish-eye images captured at the various measurement stations by a Canon EOS 6D Camera. This calculation method has been validated by Sun et al. (2017) [25].
To evaluate the acoustic environment, the Sound Pressure Level (SPL) measurement was carried out using a sound level meter [26] and extracting the Equivalent Sound Pressure Level (Leq) [27], and using the Noise Climate (NC)) [28]. These are considered the best indicators to assessing noise’s physiological and psychological impact [29].
In terms of the thermal environment, a Multifunction Meter probe (Testo 480) was used to detect the ambient air temperature (Ta), relative humidity (RH), and wind speed (Va). These data were used as inputs to determine the Mean Radiant Temperature (MRT) and Physiologically Equivalent Temperature (PET). This was performed by RayMan Pro 3.1 software, which has been used extensively in the scientific literature [25,30].

2.2. Stage 2: Field Surveys (Perceptual Characterization)

Regarding the multisensory evaluation, field surveys were conducted in March 2021, where the Emotional Salience of the sound environment [31,32] was used to verify the difference between the feeling of the park soundscape by sighted and visually impaired users (see Appendix A), while the Perceived Restorativeness Soundscape Scale PRSS [33,34,35] was administered using its shorter-version Perceived Restorativeness Scale PRS-11 [36,37,38] to compare how sighted and visually impaired users evaluate the restorative quality of the park environment (see Appendix B). In addition, the Semantic Differential Scale of Multi-Variable evaluation of the Park Environment was administered to determine which additional variables may influence the perception of sighted and visually impaired participants (see Appendix C).

2.3. Participants

One hundred and four people participated in this study, 52 visually impaired and 52 sighted people between the ages of 6 and 18 years old. The sample was divided according to age into two groups, Primary school pupils (PSP) and Middle school pupils (MSP), and according to the health condition into sighted (SIG) and Visually impaired (VIP). It is important to note that the sighted participants belong to ordinary public schools in Biskra, while the visually impaired participants belong to a special school for visual impairment, and they are all affected by diseases and visual impairments ranging from low vision to complete blindness. All the people who participated in this investigation had no hearing problems and it should be mentioned that the participants provided their consent before participating in the study.

2.4. Data Analysis

The data analysis was performed principally with the Statistical Package for the Social Sciences (SPSS) software. The data from the in situ measurements were presented using a descriptive analysis of the physical characterization of the park environment. The analysis of the Emotional Salience of the sound environment scale was based primarily on the Mann–Whitney U test. To evaluate the restorative quality of the park through the PRS-11, an homogeneity test was conducted before analyzing the effect of age and health conditions on the perception of restorativeness, which was achieved using a one-way ANOVA test. Finally, a post hoc Tukey test was carried out to explore the components that affect the perception of the restorative environment. Finally, the analysis of the Semantic Differential Scale of the multivariable evaluation of the park users was performed using the Mann–Whitney U test.

3. Results

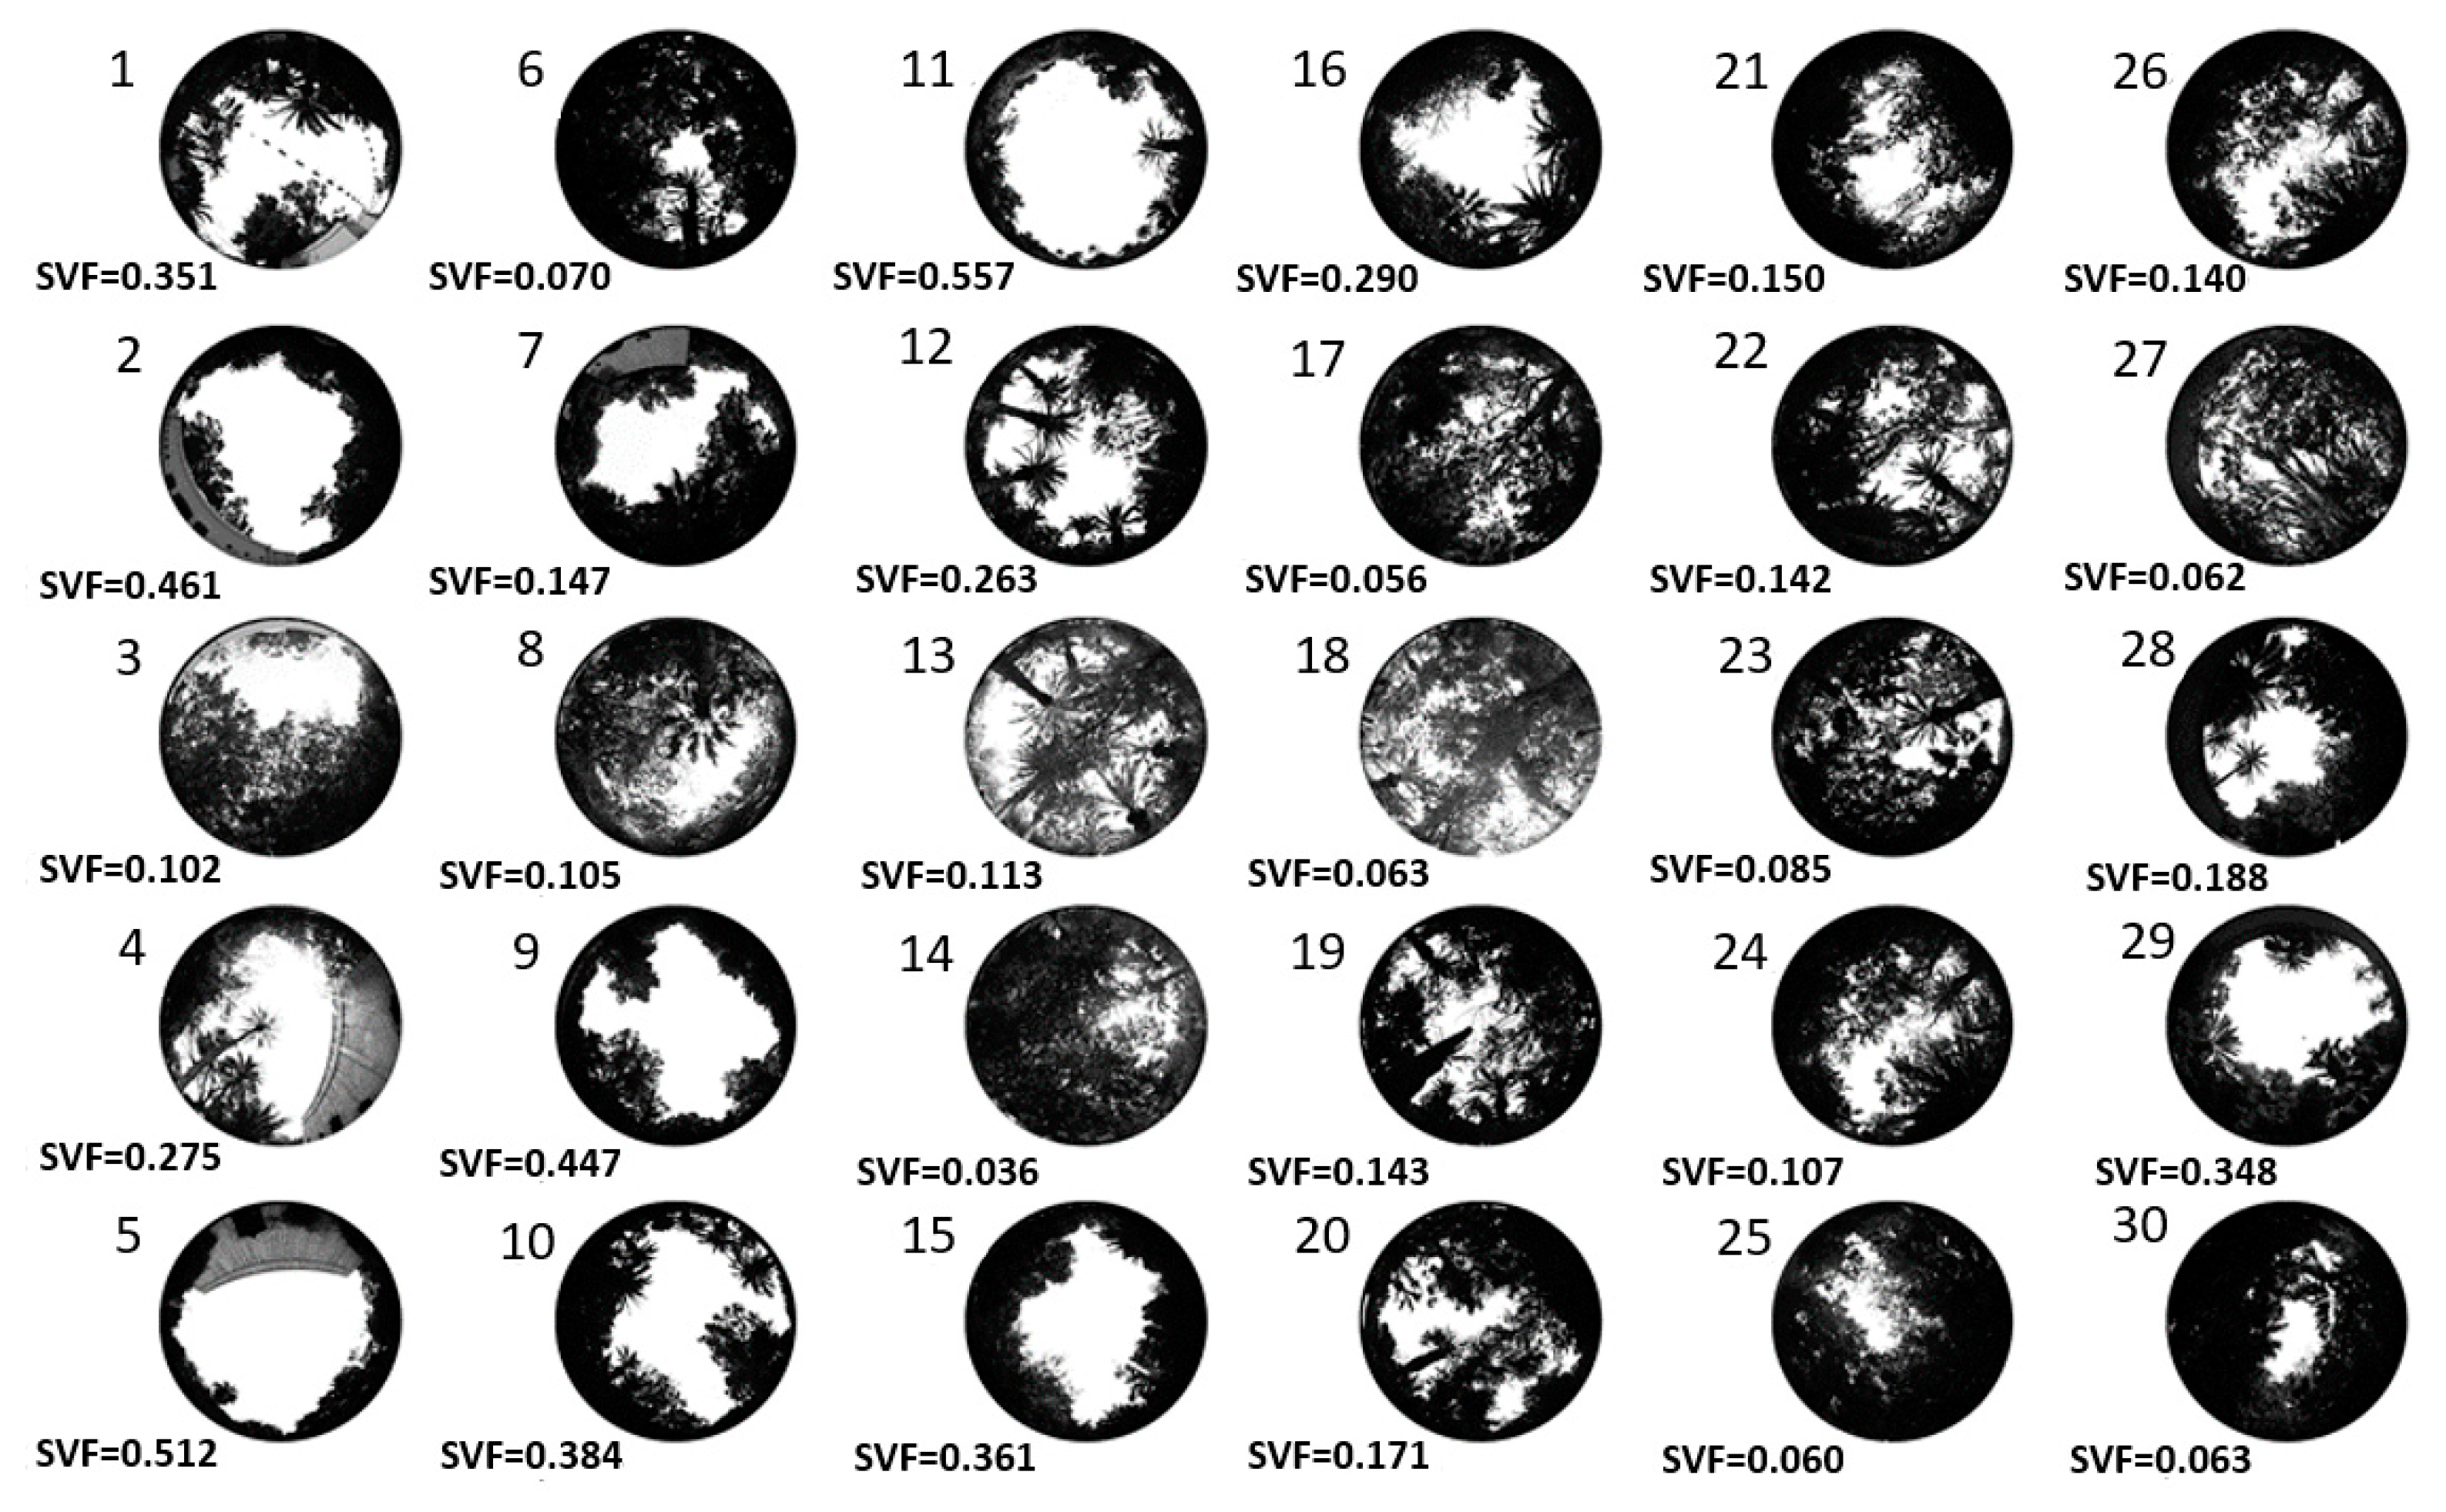
3.1. Physical Characterization of the Park

This study relied on a quantitative, objective approach focused mainly on the execution of in situ measurements of the environment’s physical dimensions in an urban public park. The first stage of this research focused on the distribution of the measurement points of the physical environmental dimensions. It should be noted that the SVF values calculated at the different points of the park are in the range of 0.04 to 0.0.56 (±0.15).
Regarding the thermogravimetric comfort conditions, the Air Temperature (Ta), Relative Humidity (RH), and Wind Speed (Va) were measured and used to calculate the Mean Radiant Temperature (MRT) and the Physiologically Equivalent Temperature (PET). Table 1 shows that the thermal comfort stress level of the park’s occupants is considered to be hot because the measured MRT values are above 47 °C, varying between 40 and 55 °C with a standard deviation of (±4.03). On the other hand, the thermal sensation of the occupants for most of the measurement stations is considered warm or higher, with PET values ranging from 25.5 to 37.6 °C with a mean value of 31.4 °C and a standard deviation of 3.5.
To evaluate the sound environment during the sound walk, the measurement of the Sound Pressure Level (SPL) was carried out. The sound equivalent level values vary between 46.5 dB(A) and 57.5 dB(A), with an average value of 51.5 dB(A) (±2.91). Moreover. the values of the noise climate vary from 0.21 to 8.03 dB(A) (±2.3), with an average of 3.44 dB(A). The acoustic environment along this outdoor urban environment is perceived as quiet by the users as the average Leq value is less than 66 dB(A), which is the recommended noise limit in urban areas [39].

3.2. Perceptual Characterization of the Park

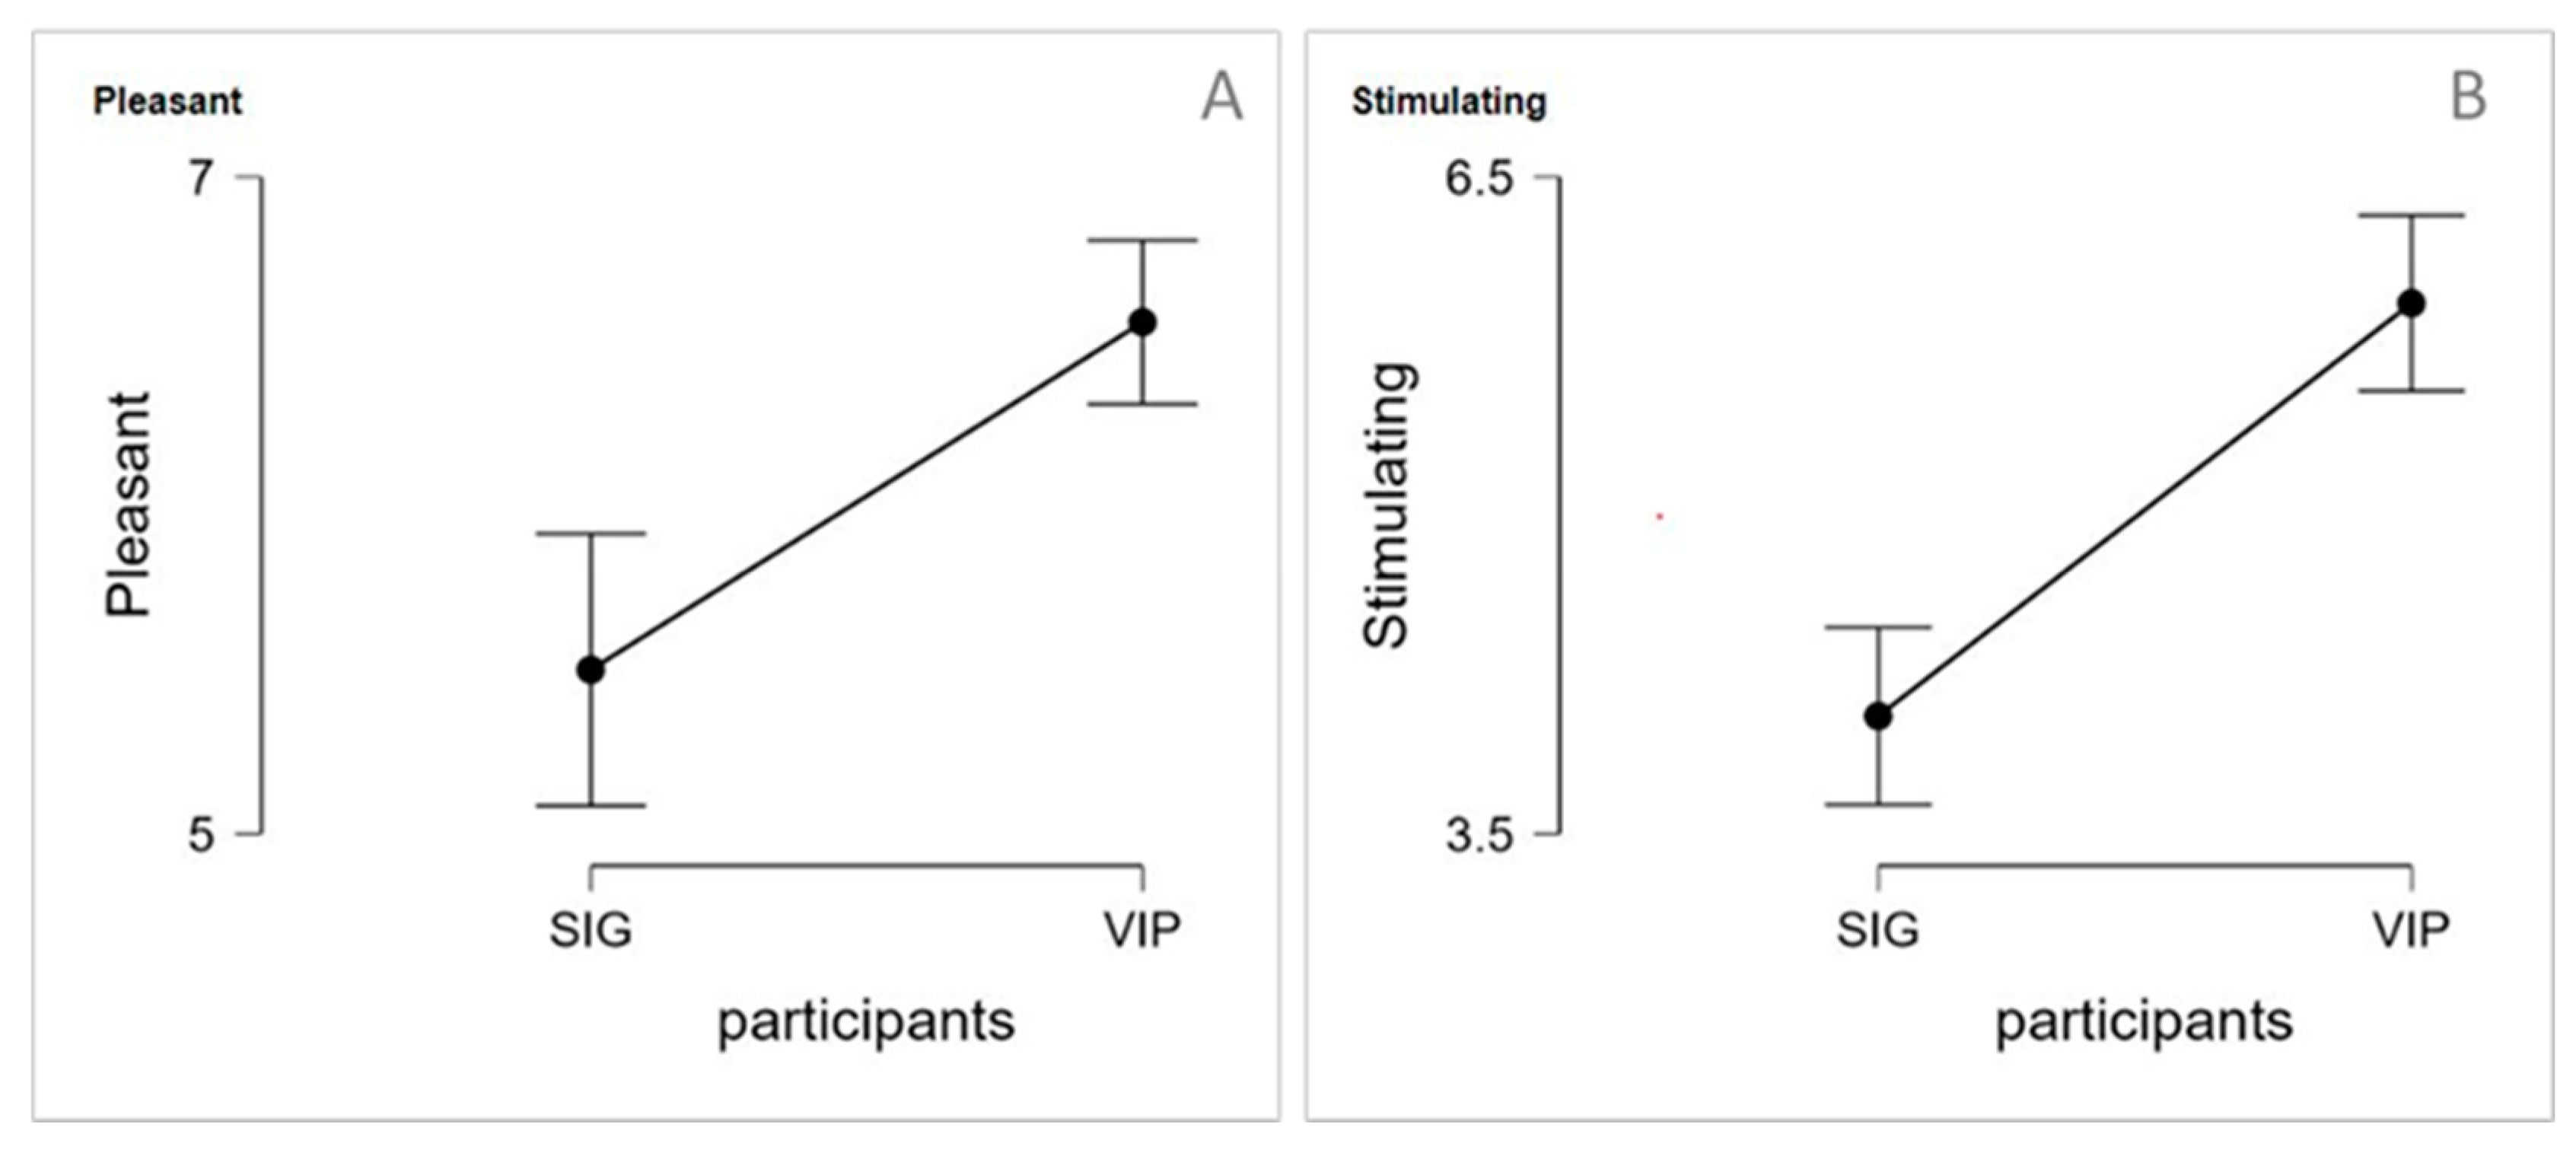
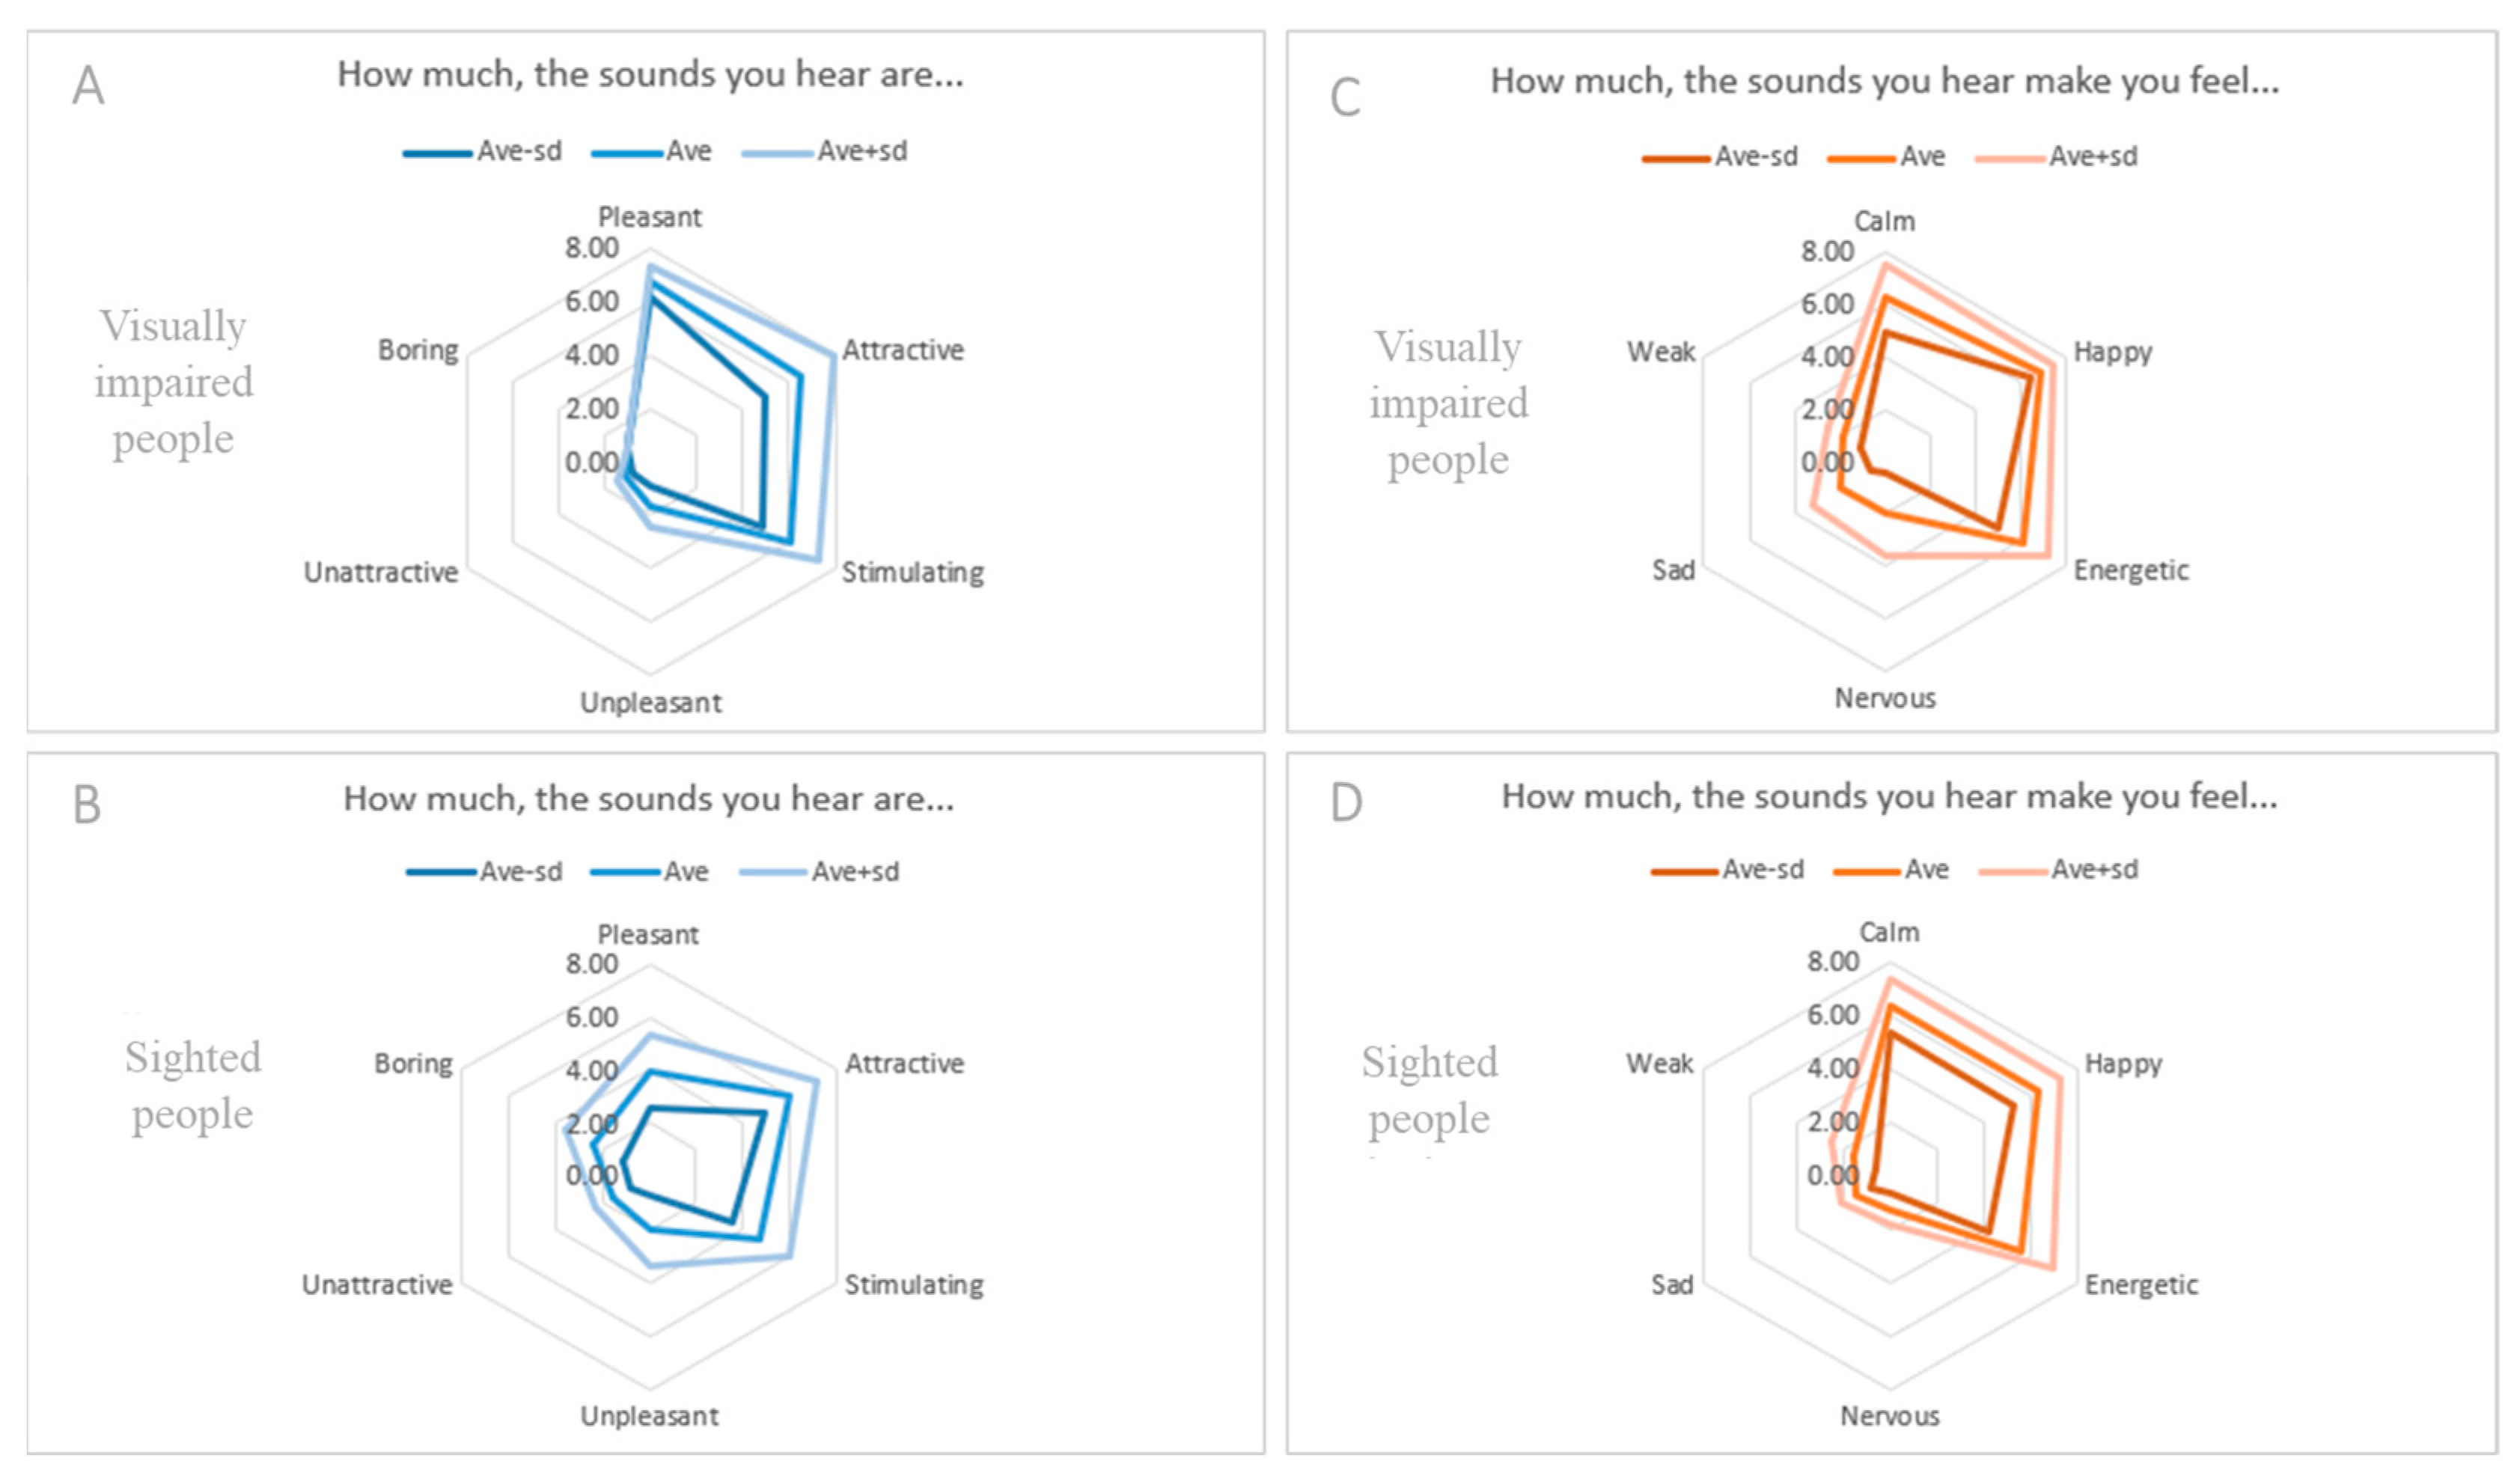
3.2.1. Emotional Salience of Sound

This questionnaire consists of 12 items. This scale was used in different studies to evaluate the perceptual and emotional feedback to auditory and non-auditory stimuli. Participants were asked to rate each stimulus using a 7-point Likert scale (1 = Not at all; 7 = Extremely), expressing, for instance, how the sound was and how the sound made them feel (see Appendix A). The results were analyzed using the Mann–Whitney U test to distinguish all differences between the evaluations of the sighted and visually impaired participants (Figure 4). Regarding the health condition, the results show that there are significant statistical differences (p-value < 0.001) between two positive components. For the Pleasant component, the evaluation of visually impaired users is considered more positive compared to sighted ones (p-value < 0.001, r = 0.443), where the visually impaired have an average of 6.56 (±0.895) and sighted users have an average of 5.50 (±1.49). In addition, regarding the Stimulating component, the result shows that there are significant statistical differences between the two groups (p-value < 0.001, r = 0.661), where the evaluation of the visually impaired has a higher average of 5.92 (±1.44) compared with the sighted participants’ average, which is 4.04 (±1.45). However, the comparison between all the other components (Attractive, Calm, Energetic, Happy) is not significant. Moreover, according to the age division, there are no significant differences between the two groups (PSP, MSP).
The results of the two components of the emotional salience of the sound environment show that the PSP with visual impairment describes the sound environment as Pleasant (Mpleas = 6.76) and Attractive (Mattr = 6.47). Less evident is the value assigned to its characteristic of being Stimulating (Mstim = 6.06). Moreover, negative attributes are very low, especially for the Boring (Mbori = 1.00), Unattractive (Munatt = 1.12), and Unpleasant (Munpl = 1.65) (Figure 5A). On the contrary, sighted PSP subjects describe the sound environment as Pleasant (Mpleas = 3.94), Attractive (Mattr = 6.00), and Stimulating (Mstim = 4.71). In addition, negative attributes are very low, especially for the Unattractive (Munatt = 1.53), Unpleasant (Munpl = 2.00), and Boring (Mbori = 2.35) (Figure 5B).
Considering the emotional component of the scale, the environment makes the PSP with visual impairment subjects feel very happy (Mhap = 6.88), but also calm (Mcalm = 6.24) and energetic (Menerg = 6.12). Negative attributes are consistent with positive attributes (Mnerv = 2.00; Mweak = 1.82; Msad = 1.94) (Figure 5C). For sighted PSP subjects, it is calm (Mcalm = 6.35), happy (Mhap = 6.29), and energetic (Menerg = 5.59). Negative attributes are consistent with positives (Mnerv = 1.24; Mweak = 1.53; Msad = 1.47) (Figure 5D).

3.2.2. Evaluation of the Restorative Quality of The Park Environments

To compare sighted and visually impaired users’ evaluation of urban park restoration, the short version of the Perceived Restorativeness Scale [36] was administered. PRS was first applied in 1996. One of the main aims of this scale is to give the designers a measurement tool that could be used to assess the impact of existing and prospective settings on people [40]. The PRS is based on the Attention Restoration Theory [41]. It was initially made up of 26 items aimed to measure an individual’s perception of 5 restorative factors assumed to be present to a greater or lesser extent in the environment. These factors are physical and/or psychological, “Being-away” from demands on directed attention; “Fascination”, a type of attention assumed to be effortless and without capacity limitations; the “Coherence” and “Scope” perceived in an environment; the “Compatibility” between one’s inclinations and environmental demands. As originally formulated, ART focused on 4 restorative factors: Being-Away, Fascination, Extent, and Compatibility [36].
Table 2 shows the 11 items associated with the four components of the Perceived Restorativeness Scale PRS-11: Fascination (three items), Being-Away (three items), Coherence (three items), and Scope (two items). As in the extended version of the scale, items present statements to which individuals must indicate their degree of agreement on a 11-point scale with both numerical and semantic anchoring (from 0 = “not at all” to 10 = “completely”). A total score was computed for each dimension where high values indicated a higher fascination, and being-away, coherence, and scope were associated with a target environment.
Main descriptive statistics as a function of the Restorativeness dimensions and the scenario are reported in Table 2. The data do not show missing values or distribution problems for the considered variables. From the analysis of the PRS-11 and its components, it can be seen that sighted park users have a slightly higher average rating when compared to visually impaired park users. In addition, the results of the Fascination component have a very high average rating for the two groups, concerning both age categories, compared to the other components, with an average of 8.29 (±0.95) for visually impaired PSP, 8.80 (±0.27) for visually impaired MSP, 8.92 (±0.64) for sighted PSP, and 9.15 (±0.39) for sighted MSP. The Park for sighted users is considered to have higher Coherence compared to visually impaired ones, where sighted people have averages of 8.43 (±0.09) for PSP and 8.27 (±0.46) for MSP, while visually impaired people have averages of 6.73 (±0.83) for PSP and 7.04 (±1.06) for MSP. The same observation is made for the other components (Being-Away, Scope), which are lower for visually impaired participants.
Table 2. Descriptive statistics (Average (A), Standard Deviation (SD)) of the Perceived Restorative Scale.
ComponentsGroupsVisually Impaired PeopleSighted People
PSPMSPPSPMSP
Items n.Overall Meaning of the Items(A)(A)(A)(A)
FascinationItem1Fascinating place9.29 (±2.17)9.11 (±1.99)9.65 (±0.61)9.60 (±1.09)
Item2Interesting place8.18 (±2.81)8.69 (±2.89)8.65 (±2.03)9.00 (±2.32)
Item3Place hard to be bored7.41 (±3.22)8.60 (±2.81)8.47 (±2.16)8.86 (±2.39)
Being-AwayItem4Refuge from nuisances8.00 (±2.39)7.86 (±3.75)8.59 (±1.46)7.89 (±2.99)
Item5Self-isolation7.18 (±3.39)6.86 (±4.08)6.53 (±3.43)8.60 (±1.75)
Item6Escaping responsibility5.94 (±3.49)6.00 (±4.36)7.94 (±2.73)5.86 (±4.09)
CoherenceItem7Good spatial arrangement6.65 (±2.83)6.14 (±3.94)8.35 (±1.66)8.71 (±2.09)
Item8Physical arrangement of the place5.94 (±3.96)6.77 (±4.17)8.41 (±1.87)8.29 (±2.74)
Item9Tidy place7.59 (±1.94)8.20 (±3.09)8.53 (±1.88)7.80 (±2.74)
ScopeItem10Exploration in many directions6.88 (±3.32)8.14 (±3.18)9.18 (±1.29)9.54 (±0.85)
Item11Few moving boundaries4.82 (±3.99)5.49 (±4.46)8.94 (±1.19)2.80 (±2.79)
To analyze the main and interactive effects of the groups of “Age” and “Health condition” on the environmental perceived restorativeness, 5 different 2 × 2 ANOVAs that treated the Age and Health condition as a 2-level between-subject factor (PSP vs. MSP and SIG vs. VIP) were carried out, the results are represented in Table 3. For both, the overall level of the PRS-11 and those of all their components (Fascination, Being Away, Coherence, and Scope) were considered. The Sidak correction was applied to analyze post hoc effects. The magnitude of significant effects was indicated by partial eta squared (η 2 p). All tests were two-sided, with an alpha level of 0.05. There are no significant differences regarding the three components of the Perceived Restorativeness Scale PRS-11 (Being-Away, Coherence, Scope). Regarding the Fascination component, there is a significant difference between the two age groups (PSP vs. MSP) with p-value < 0.001. In addition, the difference is significant in the two health conditions (SIG vs. VIP) with p-value < 0.05.

3.2.3. Analysis of the Semantic Differential Scale of Multivariable Evaluation of the Park Users

The Semantic Differential Scale of the multi-variable evaluation of the park environment was carried out to verify what other factors may cause differences between the perception of sighted and visually impaired participants; therefore, the comparison was made by using the Mann–Whitney U test (Table 4). It is seen that there are no significant statistical differences between the evaluations of the two groups of sighted and visually impaired participants (p-value > 0.05) on the perception related to the nature of the park, and that associated with the thermal environment. Furthermore, the perceived acoustic environment is not identical between the sighted and visually impaired participants, because there are statistically significant differences in some acoustic variables (p-value < 0.05), where the visually impaired participants have higher mean ranks than the sighted ones, on natural sounds, perception of background music, and noise of children playing, with values of (80.78 > 51.96), (8.26 > 47.82), and (76.81 > 58.61), respectively.
Regarding the objective variables, there are statistically significant differences between the two participant groups’ evaluations, about walking comfortably on the park floor (p-value = 0.002), the seating areas (p-value = 0.008), the comfort level of the seats (p-value = 0.008), and the absence of particular smells in the park (p-value = 0.009). It is also seen that the visually impaired users evaluate the walking condition in the park as less comfortable compared to those who perfectly use their visual perceptions, where the mean ratings of these two groups are 62.76 and 82.12, respectively. Moreover, the visually impaired park users have higher average ratings than the sighted people ones regarding the enjoyment of seating areas and even the comfort level of these seats, with values of (76.86 > 58.52) and (78.86 > 55.18), respectively. Furthermore, the visually impaired participants have a lower average rating than the sighted people on the question of the absence of particular smells in the park, with values of 63.18 and 81.41, respectively.
For subjective questions, there are only statistically significant differences between the two variables (p-value < 0.05), where the first variable of physical activity (p-value = 0.041) has a mean rating of 64.79 by the visually impaired participants’ evaluation, which is lower than that of sighted ones of 78.71, while the second variable of spending time with family and friends (p-value = 0.049) has a mean rank of 74.62 by the visually impaired participants evaluation, which is higher than that of sighted ones of 62.27.

4. Conclusions and Discussion

4.1. Synthesizing the Findings

There is a consensus that the physical dimensions of the environment are a critical standard for measuring the quality of urban spaces. This paper has aimed to investigate how sighted and visually impaired people perceive the physical environment of an urban park in an oasis settlement, and to verify the similarities and differences between them. However, before starting the comparison of the perceptual characterization between these two user groups, through the use of the field survey technique, an environmental description of the park was conducted by exploring the different physical dimensions of the environment, based on a series of in situ measurements. The main findings of this study, which are listed below, show that the visually impaired category deserves special attention for their different ability to perceive the environment of the urban parks located in a hot and dry climate, such as the oases of Algeria:
The findings from the Mann–Whitney U test of the emotional salience of sound suggest that there is a difference between sighted and visually impaired people in the evaluation of sound characterization. The visually impaired subjects’ ratings are higher compared to the sighted ones and this matches with the works of Röder et al. [42]. As for the division according to age, the results show no differences existing between primary school and middle school pupils in evaluating the sound environment. These results may be related to the same ability to perceive the surrounding environment and their cognitive performance [43].
For primary school pupils, both sighted and visually impaired, the soundscape assessment of the park is identified positively. They both consider Stimulation and Pleasantness as the most important dimensions of the soundscape, confirming the findings of Mediastika et al. (2020) [24] and Mediastika, Sudarsono, and Kristanto (2021) [21]. It is also interesting to have noticed that the visually impaired subjects describe the sound environment more positively than the sighted ones. This supports that people with visual impairment use the sense of sound to perceive more details about the surrounding environment than sighted ones [44,45], while it gives them the same positive emotions (Calm, Happy, Energetic). This is due to the complexity of feelings, as they are composed of a group of senses that overlap with each other and these young people cannot easily separate them; these results can also be interpreted through PRS-11.
In contrast, the findings from the descriptive analysis of the PRS-11 of this study show that sighted users of the park have a slightly higher average score compared to visually impaired users, regarding the components (Fascination, Being-Away, Coherence, Scope). Furthermore, we noticed that the results of the Fascination component have very high rates compared to the other components, with an average of 9.04 for the sighted and 8.55 for the visually impaired. Somewhat surprisingly, the Descriptive statistics of the Perceived Restorative Scale suggest that the evaluation of the restorative quality of the park environment is described better by younger users (sighted and visually impaired) than by older users.
The findings from this research suggest, according to the Mann–Whitney U test analysis, that there are no significant differences between the evaluations of sighted and visually impaired park users on the perception related to the nature of the park and that associated with the thermal environment, which confirms the results obtained by the in situ measurements, in which the thermal dimensions (MRT and PET) are considered as comfortable. However, we note significant differences for some acoustic variables that emerged, where visually impaired participants have higher mean ratings than sighted ones, on natural sounds, perception of background music, and noise of children playing. This means that these two groups do not have the same perception of the acoustic environment of the park and that visually impaired users can obtain more information from the acoustic environment and use it to enhance their perception [24], which supports the results from the analysis of the emotional salience of sound questionnaire, and also confirms the findings from previous studies that suggest that the auditory and visual elements of urban environments are closely related to each other [46,47,48]. The statistical analysis of the measurements of the physical dimensions of the park also supports these findings.
From the findings of this study, there are statistically significant differences between the evaluations of the two groups of participants, regarding some variables of objective questions, where the visually impaired park users evaluate the condition of walking in the park as less comfortable compared to those who use their visual perceptions optimally, but they have higher average ranks than the sighted people for the enjoyment of seating areas and even the comfort level of these seats. This explains that sighted people usually visit the park to walk, while visually impaired people often use the seats to rest because this park is not walkable for them. For this reason, our findings guide the researcher to comprehend visually impaired people’s mobility in urban settings and how they conceptualize the urban space [49] so these urban spaces could be more walkable for this category. Furthermore, we noticed that visually impaired people are more perceptive to the particular smells of the park compared to sighted people.
Furthermore, our findings also suggest that there are statistically significant differences for two variables of subjective questions, namely physical activity and spending time with family and friends. This confirms the results of the objective questions, where visually impaired people when compared with sighted people have a lower mean range for physical activity because they do not prefer to walk, and a higher mean range for spending time with family, with the enjoyment of seating areas.

4.2. Strengths and Limitations of the Study

The strengths of this research lie mainly in the use of its qualitative and quantitative approach to verify how sighted and visually impaired people perceive the environment of an urban park in an oasis setting, and to extract the similarities and differences between them. Based on semantic processing, which is becoming increasingly important in soundscape studies [31], and the different perceptual dimensions of the users of urban environments, this study was based principally on an SDS analysis of the soundscape characterization through the use of the emotional of sound, an evaluation of the restorative quality of the park environments through the use of the PRS-11, and an SDS analysis of multivariable evaluation of the park users (see Section 2.2). In addition, the strength of this study is also due to the interpretation of the results obtained by the perceptual characterization of the park users, according to the different indices reflecting the physical dimensions of the thermal (MRT. PET) and acoustic (Leq, NC) environment of the park (see Section 2.1). In addition, all this is in the context of encouraging the principles of inclusive design.
Despite all the above, it is interesting to point out that this research is limited in the study of the perception of young sighted and visually impaired users of a single urban park located in the city of Biskra, where the series of field surveys was conducted, between the period extending from March to May 2021. From this, future research should focus on long-term surveys to understand the perception of users of different urban parks in different seasons of the year in various oases.

4.3. Implication on Practice and Future Research

This study encourages architects, designers, urban planners, and decision-makers to use multisensory methods’ strategies and understand their impact on urban practices. Furthermore, the results of this study encourage the revision of the spatial configuration within the parks of the oasis settlements. Moreover, this research demonstrates that public surroundings and facilities are not user-friendly. Using the results as a guide, urban public spaces must be designed to ensure the health and safety of all users. How users spend time in public parks should be emphasized throughout the design process. For comfort to be realized, the parks must provide certain essential services and facilities, such as seating and a serene atmosphere. In addition, pedestrian pathways must be facilitated and equipped with signals and indications that enable the mobility of the visually impaired in urban areas while assuring their safety because comfort and safety are fundamental contributors to people’s quest to access parks and engage in all activities.
Although inclusive design is often used in most design disciplines, designers have not been strongly encouraged to incorporate it into their work. The user should be involved in the design phase and the data collection for further research. As the human element is considered an essential key strategy for governments, that should be considered in the early stages of urban and architectural policies, because the human perception of the built environment is a dynamic process that takes into account a variety of intricate aspects. In an inclusive design approach, users should be viewed as architects’ partners rather than as the design’s judges. In other words, design should be viewed as being created by and for everyone in future research, and it should also emphasize aesthetics, meaning, usefulness, and function.
This study invites researchers to explore how architectural or urban spaces’ physical and perceptual dimensions can be linked through a multisensory application, especially for marginalized groups such as the visually impaired. It is also worth highlighting the necessity of having specific questionnaires for these marginalized groups, which will be of great benefit to ensure a correct understanding of their environmental perception. Hence, in the creation of inclusive design solutions, they need relevant knowledge about a diversity of users throughout the design process.
Our findings are restricted to a short-term study of a single experiment for the promenade in an urban park in an oasis settlement, although the dimensions of the physical environment change as a function of time over the long term due to the change in seasons. For instance, the thermal sensitivity is seasonally variable from winter to summer, but we could only conduct one experiment for the promenade in an oasis settlement. In addition, the scope of this research is restricted to investigating the physical dimensions and confirming the associations between perceptual dimensions for a single subgroup of people between the ages of six and eighteen, significantly the visually impaired.
Thus, the authors urge the investigation of the gap in knowledge regarding the determination of the link between the physical dimensions and the qualitative replies provided by the participants, and also emphasize the application of this study in a broader manner to cover a larger segment of the population, focusing on different dimensions such as socioeconomic aspects.

Author Contributions

Conceptualization, L.M. and D.B.; methodology, S.B., M.M. and D.B.; software, S.B. and D.B.; validation, M.M. and T.A.K.B.; formal analysis, S.B. and M.M.; investigation, S.B.; resources, T.A.K.B.; data curation, S.B. and M.M.; writing—original draft preparation, S.B. and D.B. and T.A.K.B.; writing—review and editing, L.M. and M.M.; visualization, L.M. and T.A.K.B.; supervision, L.M.; project administration, L.M. and M.M.; funding acquisition, M.M. All authors have read and agreed to the published version of the manuscript.

Funding

This work was supported by Programma V:ALERE 2019 “VALERE: VAnviteLli pEr la RicErca” and Project MIELE, Multisensory Investigation for ELderly-centred design of common living urban Environments.

Informed Consent Statement

Informed consent was obtained from all subjects involved in the study.

Data Availability Statement

The data presented in this article can be obtained from the corresponding author upon request.

Acknowledgments

The authors would like to express their appreciation to all those who participated in the success of this study, especially the students and teachers (educator, sociologist, and psychologist) of the School for the Visually Impaired of Biskra. We would also like to acknowledge the LACOMOFA Laboratory of the University of Biskra “Mohamed Khider”, ACOUVI research group, and SENS i-Lab of the University of Campania “Luigi Vanvitelli”.

Conflicts of Interest

The authors declare no conflict of interest.

Appendix A

Table A1. Emotional salience of sounds (ES).
Select for each descriptor below. the number (1—not at all to 7—extremely) based on how much the descriptor describes the sound you presently heard
Pleasant
Unpleasant
Stimulating
Boring
Attractive
Unattractive
Select for each descriptor below. the number (1—not at all to 7—extremely) based on how much the descriptor describes your feeling toward the sound you presently heard
Calm
Nervous
Weak
Energetic
Happy
Sad

Appendix B

Table A2. Perceived Restorative Scale (PRS-11).
Please read every sentence carefully and then evaluate on a scale from 0 (Not at all) to 10 (Very much) as each statement corresponds to your experience in this place.
Places like that are fascinating
In places like this my attention is drawn to many interesting things
In places like this it is hard to be bored
Places like that are a refuge from nuisances
To get away from things that usually demand my attention I like to go to places like this
To stop thinking about the things that I must get done I like to go to places like this
There is a clear order in the physical arrangement of places like this.
In places like this it is easy to see how things are organized.
In places like this everything seems to have its proper place.
That place is large enough to allow exploration in many directions
In places like that there are few boundaries to limit my possibility for moving about.

Appendix C

Table A3. Multivariable questionnaire.
Questions about nature and type of vegetation (from 0—Not at all to 10—Very much)
The Park is home to a variety of plants
The land is rich in vegetation
The grass is suitable for relaxing
You can easily get in touch with nature
Questions on thermal environment (from 0—Not at all to 10—Very much)
The Park has areas shaded by plants
I come to the park to stay cool
The Park is sunny
Questions on acoustic comfort (from 0—Not at all to 10—Very much)
In the park you can hear the sounds of nature
In the park you can hear a nice background music
Inside the park. musicians or singers perform
In some places you can hear the flow of water
The Park is a quiet place
In the park. the noise of vehicular traffic is absent
In the park you can hear the children playing
There are some parts of the park that are a bit noisy
Objective questions (from 0—Not at all to 10—Very much)
The paths in the park feature beautiful textures
Water is used as an ornamental element
The flooring is comfortable and you can walk comfortably
There are enough places to sit
The seats are comfortable
In the park you can feel the scents of nature
There are no particular smells in the park
In the park you can smell bad smells caused by the presence of waste
In the park there are bad smells caused by vehicular traffic
Subjective questions (from 0—Not at all to 10—Very much)
Inside the park I relax and stop to reflect
In the park I can interact with other people
In the park I do physical activity
In the park I dedicate myself to artistic activities
In the park I like to spend time with my family and with my loved ones
I use the park for jogging or walking outdoors
In the park I feel at peace and I am very well
When I’m in the park I have a feeling of pleasure (I feel happy!)
In this park I feel at ease and I feel connected to it
I am attracted to this place. I will come again
I feel safe in the park

References

  1. Coté, M. La Ville et le Désert: Le bas-Sahara Algérien; Karthala Éditions: Paris, France, 2005. [Google Scholar]
  2. Ma, L.; Cheng, W.; Qi, J. Coordinated evaluation and development model of oasis urbanization from the perspective of new urbanization: A case study in Shandan County of Hexi Corridor, China. Sustain. Cities Soc. 2018, 39, 78–92. [Google Scholar] [CrossRef]
  3. Bouzir, T.A.K.; Berkouk, D.; Zemmouri, N. Evaluation and analysis of the Algerian oases soundscape: Case of El Kantara and Sidi Okba. Acoust. Aust. 2020, 48, 131–140. [Google Scholar] [CrossRef]
  4. El Haridi, N.M.A.; Ibrahim, M.A.; Ayad, H.M.; El Sayad, Z.T. Comparative Analysis of the Desert and Green Vernacular Architecture in the Oases of Egypt. In Cultural Sustainable Tourism: A Selection of Research Papers from IEREK Conference on Cultural Sustainable Tourism (CST); Springer International Publishing: Berlin/Heidelberg, Germany, 2019; Volume 2017, pp. 37–46. [Google Scholar] [CrossRef]
  5. Teixeira, C.F.B. Green space configuration and its impact on human behavior and URBAN environments. Urban Clim. 2021, 35, 100746. [Google Scholar] [CrossRef]
  6. Van Herzele, A.; Wiedemann, T. A monitoring tool for the provision of accessible and attractive urban green spaces. Landsc. Urban Plan. 2003, 63, 109–126. [Google Scholar] [CrossRef]
  7. Lee, A.C.; Maheswaran, R. The health benefits of urban green spaces: A review of the evidence. J. Public Health 2011, 33, 212–222. [Google Scholar] [CrossRef] [PubMed]
  8. Jeon, J.Y.; Hong, J.Y. Classification of urban park soundscapes through perceptions of the acoustical environments. Landsc. Urban Plan. 2015, 141, 100–111. [Google Scholar] [CrossRef]
  9. Chiesura, A. The role of urban parks for the sustainable city. Landsc. Urban Plan. 2004, 68, 129–138. [Google Scholar] [CrossRef]
  10. Berkouk, D.; Bouzir, T.A.K.; Boucherit, S.; Khelil, S.; Mahaya, C.; Matallah, M.E.; Mazouz, S. Exploring the Multisensory Interaction between Luminous, Thermal and Auditory Environments through the Spatial Promenade Experience: A Case Study of a University Campus in an Oasis Settlement. Sustainability 2022, 14, 4013. [Google Scholar] [CrossRef]
  11. Liu, J.; Kang, J.; Luo, T.; Behm, H. Landscape effects on soundscape experience in city parks. Sci. Total Environ. 2013, 454, 474–481. [Google Scholar] [CrossRef]
  12. Liu, J.; Kang, J.; Behm, H.; Luo, T. Effects of landscape on soundscape perception: Soundwalks in city parks. Landsc. Urban Plan. 2014, 123, 30–40. [Google Scholar] [CrossRef]
  13. Grahn, P.; Stigsdotter, U.K. The relation between perceived sensory dimensions of urban green space and stress restoration. Landsc. Urban Plan. 2010, 94, 264–275. [Google Scholar] [CrossRef]
  14. Kothencz, G.; Blaschke, T. Urban parks: Visitors’ perceptions versus spatial indicators. Land Use Policy 2017, 64, 233–244. [Google Scholar] [CrossRef]
  15. Boucherit, S.; Berkouk, D.; Bouzir, K.; Masullo, M.; Maffei, L. A Review of Inclusive Design and Multisensory Interactions Studies and Applications in Public Spaces. In IOP Conference Series: Earth and Environmental Science; IOP Publishing: Bristol, UK, 2022; p. 012017. [Google Scholar]
  16. Calleri, C.; Astolfi, A.; Armando, A.; Shtrepi, L. On the ability to correlate perceived sound to urban space geometries. Sustain. Cities Soc. 2016, 27, 346–355. [Google Scholar] [CrossRef]
  17. Nitidara, N.P.A.; Sarwono, J.; Suprijanto, S.; Soelami, F.X. The multisensory interaction between auditory, visual, and thermal to the overall comfort in public open space: A study in a tropical climate. Sustain. Cities Soc. 2021, 78, 103622. [Google Scholar] [CrossRef]
  18. Maffei, L.; Boucherit, S.; Berkouk, D.; Masullo, M. Physical and Perceptual Dimensions of Open Urban Spaces in Biskra, Algeria; Institute of Noise Control Engineering: Washington, DC, USA, 2021; pp. 3160–3166. [Google Scholar]
  19. Martinez-Cruz, S.; Morales-Hernandez, L.A.; Perez-Soto, G.I.; Benitez-Rangel, J.P.; Camarillo-Gomez, K.A. An Outdoor Navigation Assistance System for Visually Impaired People in Public Transportation. IEEE Access 2021, 9, 130767–130777. [Google Scholar] [CrossRef]
  20. Siu, K.W.M. Accessible park environments and facilities for the visually impaired. Facilities 2013, 31, 590–609. [Google Scholar] [CrossRef]
  21. Mediastika, C.E.; Sudarsono, A.S.; Kristanto, L. Using the Sonic Perception to Improve Public Spaces and Develop a Place Identity. Cities’ Vocabularies: The Influences and Formations. In Advances in Science. Technology and Innovation; Mohareb, N., Versaci, A., Mahgoub, Y., Maruthaveeran, S., Alberti, F., Eds.; Springer International Publishing: Cham, Switzerland, 2021; pp. 97–107. [Google Scholar] [CrossRef]
  22. Mediastika, C.E.; Sudarsono, A.S.; Kristanto, L. The sound perceptions of urban pavements by sighted and visually impaired people—A case study in Surabaya, Indonesia. J. Urban. Int. Res. Placemaking Urban Sustain. 2022, 15, 106–129. [Google Scholar] [CrossRef]
  23. Botteldooren, D.; Van Renterghem, T.; Guastavino, C.; Can, A.; Fiebig, A.; Wunderli, J.-M.; Kang, J.; Aletta, F. Abstracts of the Second Urban Sound Symposium. Proceedings 2021, 72, 4. [Google Scholar] [CrossRef]
  24. Mediastika, C.E.; Sudarsono, A.S.; Kristanto, L.; Tanuwidjaja, G.; Sunaryo, R.G.; Damayanti, R. Appraising the sonic environment of urban parks using the soundscape dimension of visually impaired people. Int. J. Urban Sci. 2020, 24, 216–241. [Google Scholar] [CrossRef]
  25. Sun, S.; Xu, X.; Lao, Z.; Liu, W.; Li, Z.; García, E.H.; He, L.; Zhu, J. Evaluating the impact of urban green space and landscape design parameters on thermal comfort in hot summer by numerical simulation. Build. Environ. 2017, 123, 277–288. [Google Scholar] [CrossRef]
  26. Nassiri, P.; Karimi, E.; Monazzam, M.R.; Abbaspour, M.; Taghavi, L. Analytical comparison of traffic noise indices—A case study in District 14 of Tehran City. J. Low Freq. Noise Vib. Act. Control. 2016, 35, 221–229. [Google Scholar] [CrossRef]
  27. Kalawapudi, K.; Singh, T.; Vijay, R.; Goyal, N.; Kumar, R. Effects of COVID-19 pandemic on festival celebrations and noise pollution levels. Noise Mapp. 2021, 8, 89–93. [Google Scholar] [CrossRef]
  28. Guha, A.K.; Chowdhury, A.K.; Debsarkar, A.; Chakrabarty, S. Assessment of Noise Pollution of Kolkata Metro Railway System and Its Impact on Urban Receptors-A Case Study. IJRAT 2020, 8, 1–13. [Google Scholar] [CrossRef]
  29. Hunashal, R.B.; Patil, Y.B. Assessment of noise pollution indices in the city of Kolhapur, India. Procedia Soc. Behav. Sci. 2012, 37, 448–457. [Google Scholar] [CrossRef]
  30. Antoniadis, D.; Katsoulas, N.; Papanastasiou, D.Κ. Thermal Environment of Urban Schoolyards: Current and Future Design with Respect to Children’s Thermal Comfort. Atmosphere 2020, 11, 1144. [Google Scholar] [CrossRef]
  31. Kang, J.; Zhang, M. Semantic differential analysis of the soundscape in urban open public spaces. Build. Environ. 2010, 45, 150–157. [Google Scholar] [CrossRef]
  32. Davies, W.J.; Bruce, N.S.; Murphy, J.E. Soundscape reproduction and synthesis. Acta Acust. United Acust. 2014, 100, 285–292. [Google Scholar] [CrossRef]
  33. Payne, S.R. The production of a Perceived Restorativeness Soundscape Scale. Appl. Acoust. 2013, 74, 255–263. [Google Scholar] [CrossRef]
  34. Payne, S.R.; Guastavino, C. Exploring the validity of the Perceived Restorativeness Soundscape Scale: A psycholinguistic approach. Front. Psychol. 2018, 9, 2224. [Google Scholar] [CrossRef]
  35. Fang, X.; Qiu, L.; Gao, T. Associations between perceived occurrences of different sounds and perceived restorativeness in urban parks. In INTER-NOISE and NOISE-CON Congress and Conference Proceedings; Institute of Noise Control Engineering: Reston, VA, USA, 2020; pp. 3449–3456. [Google Scholar]
  36. Pasini, M.; Berto, R.; Brondino, M.; Hall, R.; Ortner, C. How to measure the restorative quality of environments: The PRS-11. Procedia Soc. Behav. Sci. 2014, 159, 293–297. [Google Scholar] [CrossRef]
  37. Masullo, M.; Maffei, L.; Iachini, T.; Rapuano, M.; Cioffi, F.; Ruggiero, G.; Ruotolo, F. A questionnaire investigating the emotional salience of sounds. Appl. Acoust. 2021, 182, 108281. [Google Scholar] [CrossRef]
  38. Negrín, F.; Hernández-Fernaud, E.; Hess, S.; Hernández, B. Discrimination of Urban Spaces with Different Level of Restorativeness Based on the Original and on a Shorter Version of Hartig et al.’s Perceived Restorativeness Scale. Front. Psychol. 2017, 8, 1735. [Google Scholar] [CrossRef]
  39. Analysis and Evaluation of Road Traffic Noise in Al-Dammam: A Business City of the Eastern Province of KSA. Available online: https://scialert.net/abstract/?doi=jest.2010.47.55 (accessed on 26 February 2023).
  40. Rennit, P.; Maikov, K. Perceived restoration scale method turned into (used as the) evaluation tool for parks and open green spaces, using Tartu city parks as an example. City Territ. Arch. 2015, 2, 249. [Google Scholar] [CrossRef]
  41. Ohly, H.; White, M.P.; Wheeler, B.W.; Bethel, A.; Ukoumunne, O.C.; Nikolaou, V.; Garside, R. Attention Restoration Theory: A systematic review of the attention restoration potential of exposure to natural environments. J. Toxicol. Environ. Heal. Part B 2016, 19, 305–343. [Google Scholar] [CrossRef] [PubMed]
  42. Röder, B.; Rösler, F. Memory for environmental sounds in sighted, congenitally blind and late blind adults: Evidence for cross-modal compensation. Int. J. Psychophysiol. 2003, 50, 27–39. [Google Scholar] [CrossRef]
  43. Maxwell, L.E.; Evans, G.W. The Effects of Noise on Pre-School Children’s Pre-Reading Skills. J. Environ. Psychol. 2000, 20, 91–97. [Google Scholar] [CrossRef]
  44. Mediastika, C.E.; Sudarsono, A.S.; Kristanto, L.; Tanuwidjaja, G.; Sunaryo, G.; Damayanti, R. Recalling the sonic perception of visually impaired people of Surabaya’s urban parks. In Proceedings of the MATEC Web of Conferences, Banjarmasin, Indonesia, 11–12 October 2018; p. 02007. [Google Scholar]
  45. Mediastika, C.E.; Sudarsono, A.S.; Kristanto, L. Indonesian shopping malls: A soundscape appraisal by sighted and visually impaired people. Archit. Eng. Des. Manag. 2020, 18, 184–203. [Google Scholar] [CrossRef]
  46. Carles, J.L.; Barrio, I.L.; De Lucio, J.V. Sound influence on landscape values. Landsc. Urban Plan. 1999, 43, 191–200. [Google Scholar] [CrossRef]
  47. Viollon, S.; Lavandier, C.; Drake, C. Influence of visual setting on sound ratings in an urban environment. Appl. Acoust. 2002, 63, 493–511. [Google Scholar] [CrossRef]
  48. Hong, J.Y.; Jeon, J.Y. The effects of audio–visual factors on perceptions of environmental noise barrier performance. Landsc. Urban Plan. 2014, 125, 28–37. [Google Scholar] [CrossRef]
  49. Šakaja, L. The non-visual image of the city: How blind and visually impaired white cane users conceptualize urban space. Soc. Cult. Geogr. 2018, 21, 862–886. [Google Scholar] [CrossRef]
Figure 1. Case study: (a) Situation of the city of Biskra. (b) Measuring stations in Landon Park. (c) Some pictures of the investigation.
Sustainability 15 07014 g001
Figure 2. Methodological framework.
Sustainability 15 07014 g002
Figure 3. SVF values and Fish-Eye Images of the measurement stations in the park.
Sustainability 15 07014 g003
Figure 4. Descriptive Plots according to the health condition: (A) Pleasant component. (B) Stimulating component.
Sustainability 15 07014 g004
Figure 5. Perceptual and Emotional components of the emotional salience of the sound environment described by primary school pupils (PSP): (A) Perceptual component for VIP, (B) Perceptual component for SIG, (C) Emotional component for VIP, (D) Emotional component for SIG.
Sustainability 15 07014 g005
Table 1. Descriptive statistics of the physical characterization of the park.
Descriptive Statistics
IndicatorsThermal EnvironmentAcoustic Environment
SVFMRT [°C] PET [°C]Leq [dB(A)]NC [dB(A)]
Measurement Points Number3030303030
Mean0.2147.0231.4851.523.44
Std. Deviation0.154.0313.502.912.30
Minimum0.04040.8025.5046.540.21
Maximum0.5655.0037.6057.518.03
Table 3. ANOVA statistics of the fascinating components of the Perceived Restorativeness Scale PRS-11.
ANOVA—FASC
CasesSum of SquaresdfMean SquareFpη²η²pω²
Age53.877153.87721.568<0.0010.1710.1770.162
Health condition9.81919.8193.9310.0500.0310.0380.023
Age ✻ Health condition2.03112.0310.8130.3690.0060.0080.000
Residuals249.8001002.498
Note. Type III Sum of Squares.
Table 4. Comparison of sighted (SIG) and visually impaired (VIP) users’ multivariable evaluation toward the park environment: Using Mann–Whitney U test.
ComponentsCodeVariablesAverage
(SIG and VIP)
SDMean Ranks
(SIG)
Mean Ranks
(VIP)
Sig.
Nature and type of vegetationNV1Plant variety9.391.2872.3766.030.251
NV3Vegetation riches9.241.4872.3766.040.276
NV4Relaxation in the grass6.863.5671.2867.860.616
NV5Touch with nature9.171.4572.0966.500.362
Thermal environmentThC1Shading of plants9.530.9971.0968.180.599
ThC2Cool state8.722.4773.0764.860.176
ThC3Sunning6.43.6270.3269.460.900
Acoustic comfortAC1Natural sounds92.1080.7851.960.000
AC2Music in the background6.633.8983.2647.820.000
AC3Singers’ Song3.963.7073.5164.130.178
AC4Water flow sounds8.91.8670.8668.560.713
AC5Quietness9.041.8567.2374.630.209
AC6Absence of traffic noise6.264.0265.0178.35 0.051
AC7Noise of children playing7.723.4576.8158.610.005
AC8Noisy6.883.4773.8463.580.131
Objective questions related to spaceOQ1Beautiful textures8.62.3669.8270.310.94
OQ3Ornamental water9.251.7868.8671.900.582
OQ5Walking Comfortable Floors8.622.3662.7682.120.002
OQ6Seating areas7.262.6276.8658.520.008
OQ9Comfortable seating6.762.9578.8655.180.001
OQ10Scents from nature9.141.9268.5672.400.499
OQ11Absence of particular smells5.643.9963.1881.410.009
OQ12Bad smells from waste products1.953.0872.4365.940.330
OQ13Bad smells from traffic1.612.7671.5267.460.524
Subjective questions related to behaviorSQ1Relaxation and reflection8.22.8566.2176.340.116
SQ2Interaction with people8.912.1868.3472.770.444
SQ3Physical activity7.293.5064.7978.710.041
SQ4Artistic activity4.133.9167.2374.630.282
SQ5Spending time with family and friends8.552.5274.6262.270.049
SQ6Jogging and walking8.122.9469.3671.070.791
SQ7Feeling of peace9.141.6970.1069.830.961
SQ8Feeling of pleasure9.491.2668.8771.880.548
SQ9Feeling of ease and connection to the park8.991.6570.0669.900.98
SQ10The attraction9.281.5367.5774.060.257
SQ11Feeling of security9.51.2869.3571.090.732
Disclaimer/Publisher’s Note: The statements, opinions and data contained in all publications are solely those of the individual author(s) and contributor(s) and not of MDPI and/or the editor(s). MDPI and/or the editor(s) disclaim responsibility for any injury to people or property resulting from any ideas, methods, instructions or products referred to in the content.

