1. Introduction
The target of reducing energy consumption and greenhouse gas emissions concerns every aspect of everyday life. In particular, in the building sector, an important effort has been made in this direction, although it still needs to be enhanced because of the deviation in the actual performance versus the necessary pathway [
1]. Based on the last IEA World Energy Outlook [
2], in 2021, the world final energy consumption was 121.9 PWh and almost 30% (36.7 PWh) was related to buildings, with 4.4 PWh only for the European Union. This challenging plan of final energy reduction has been coupled with a critical scenario of energy supply following the Russian invasion of Ukraine, since 38.7% of the natural gas imported by the EU in 2020 came from Russia [
3]. The main European economies did not make significant steps toward the reduction of their dependency from Russian imports [
4] and in the late 2022, the vulnerability of the gas market is highly critical [
5]. Hence, the European Union developed the REPowerEU Plan, a challenging measure within the European Green Deal based on energy efficiency, clean energy generation, and energy supplies diversification [
6]. Regarding the Italian energy market, the overall imports of natural gas amount to 632 TWh, 43.3% (274 TWh) of which comes from Russia [
3]: due to the evident impact of the Ukrainian war to the Italian energy balance, the Ministry of the ecological transition issued a national plan aimed to control the natural gas consumption for heating [
7].
The energy demand for space heating and cooling depends on several conditions including environmental (e.g., site exposition, outdoor air temperature, solar radiation), constructive (e.g., building geometry, thermal transmittance of the envelope, window to wall ratio, airtightness), and actual use and operation (e.g., occupancy, indoor set-point). Each condition has a variable impact on the global energy balance and several studies have been carried out: the impact of improving the building envelope on energy savings and thermal performance has been investigated, focusing on residential buildings on the east Mediterranean coast [
8], and a direct relationship between thermal insulation and energy saving during the heating season has been pointed out. The same outcome occurred for the non-residential building studied in [
9], where the larger thickness of the insulating material entailed a larger reduction in the energy demand. The air infiltration also had a considerable effect on energy consumption and internal comfort, as demonstrated for several Canadian dwellings, and a model based on the machine learning approach has been proposed to support new building designs [
10]. The same findings were discussed in [
11], where the energy load for the heating season decreased with the increase in the airtightness, regardless of the wall composition. A combined energy-economic assessment of the airtightness was proposed in [
12], demonstrating that the reduction in the infiltration rate through the external building envelope, glazing, and doors is both a valuable refurbishing path and a cost-effective measure. Concerning the actual presence of people in buildings, a study on Italian dwellings demonstrated that the higher the occupancy (e.g., homemakers), the lower the energy demand for space heating [
13]. For non-residential buildings, occupancy monitoring is strongly recommended to enhance the energy saving due to the customization of heating, ventilation, and air conditioning (HVAC) and lighting operation [
14]. A thorough investigation focused on the relationship between several design parameters and both building energy needs and indoor thermal comfort has been proposed for offices located in China, highlighting that the effect of the parameters is doubtless linked to the climatic zone; also, it is suggested to examine in depth the infiltration rate due to its different impact on heating and cooling demand [
15]. Office buildings have been analyzed in Spanish climate zones using a comprehensive tool to determine both the energy demand and energy consumption by varying several parameters [
16], and the envelope insulation stood out as the most significant of them. Despite a large number of studies that have focused on each boundary condition have been performed, the investigation of mutual correlations between them has been suggested [
17], based on the substantial improvement of building energy efficiency related to optimal combinations of the considered conditions.
Furthermore, the topic of refurbishment costs has been accurately addressed by researchers: two calculation methods for assessing the energy-economic performance of building renovation were proposed in [
18], and considerable issues arose regarding the investment viability due to the reliability of different methods. The energy saving related to residential buildings refurbishment was estimated in [
19] through the investigation of two real case studies, highlighting a consistent relationship between expenditure and energy saving; on the other hand, the most deployed energy efficient measures are the low-priced, due to the restricted access to bank credit. A comprehensive index that includes energy, economic, and environmental features of building insulation materials was introduced in [
20] with the aim of evaluating the affordability of thermal coating application. This type of building refurbishment is mostly driven by economic criterion and the authors showed that the insulating materials should be characterized by a complete sustainability investigation. A coupled building-district level optimization based on multi-objective algorithms was proposed in [
21], with the aim of maximizing the energy saving and minimizing the investment cost for building, and maximizing the global warming potential reduction and minimizing the payback time for the district. The proposed method was able to identify several feasible scenarios and, among them, the airtightness improvement stood out as one of the optimal cost-efficient passive strategies.
Despite the trade-off between energy efficiency improvement and investment cost being a well-known issue, changing certain boundary conditions can represent an effective way to achieve satisfactory results in terms of both energy and cost. Hence, this work focused on the effect of varying three low-effort boundary conditions on the building thermal loads. The three parameters were heating/cooling set-point temperature, working shift, and infiltration rate, and they were identified based on the ease of achievement; in fact, the first two parameters were administrative and their variation was effortless while the third was a building-related feature that can be changed with low effort. To perform a reliable estimation of the energy savings, a dynamic approach was used due to its capability of duplicate the actual measured energy [
22] and DesignBuilder, a powerful software that couples a graphical user interface to the EnergyPlus engine [
23], has been used to model and simulate the building. EnergyPlus is a console-based program realized by the U.S. Department of Energy’s Building Technologies Office [
24] and through its modules, allow one to assess the energy demand and the energy consumption of the whole building. Moreover, EnergyPlus is currently the most adopted research-oriented engine for approaching energy modeling and simulation tasks [
25]. The novelty of this study is the parametric investigation of the energy saving potential related to low-effort parameters using a dynamic modeling approach. The main outcome is the formulation of the thermal loads map of a building that provides an immediate picture of the heating and cooling demand as a function of the three boundary conditions on which the parametric analysis was based. Moreover, a thorough study on the final and primary energy consumption of the whole building was proposed, along with the comparison of two HVAC layouts for thermal load fulfillment. Such loads and energy maps could represent a useful and immediate tool to support energy decision-makers such as energy managers, company administrators and entrepreneurs as well as policymakers who could take advantage of this methodology for the development of energy efficiency measures or to face unplanned scenarios (e.g., sanctions, new foreign policies, or trade agreements).
2. Methods and Building Modeling
A typical office building from the last quarter of the 20th century was used as a case study: it is a low-rise building with three floors whose envelope features were taken from the literature [
26]. The external wall was modeled by outer plaster, hollow bricks, insulating layer, air gap, hollow bricks, and inner plaster. The ground floor was modeled by pebbles, screed, semi-rigid board, slab and tiles, and flat roof by outer concrete, screed, semi-rigid board, slab and inner plaster, from the outer to the inner side. The resulting overall thermal transmittances of the envelope were 0.770 W/m
2K (+1.2%), 0.502 W/m
2K (−2.7%), and 0.849 W/m
2K (+2.5%) for the vertical, ground floor, and flat roof, respectively; the percent between brackets is the deviation from [
26].
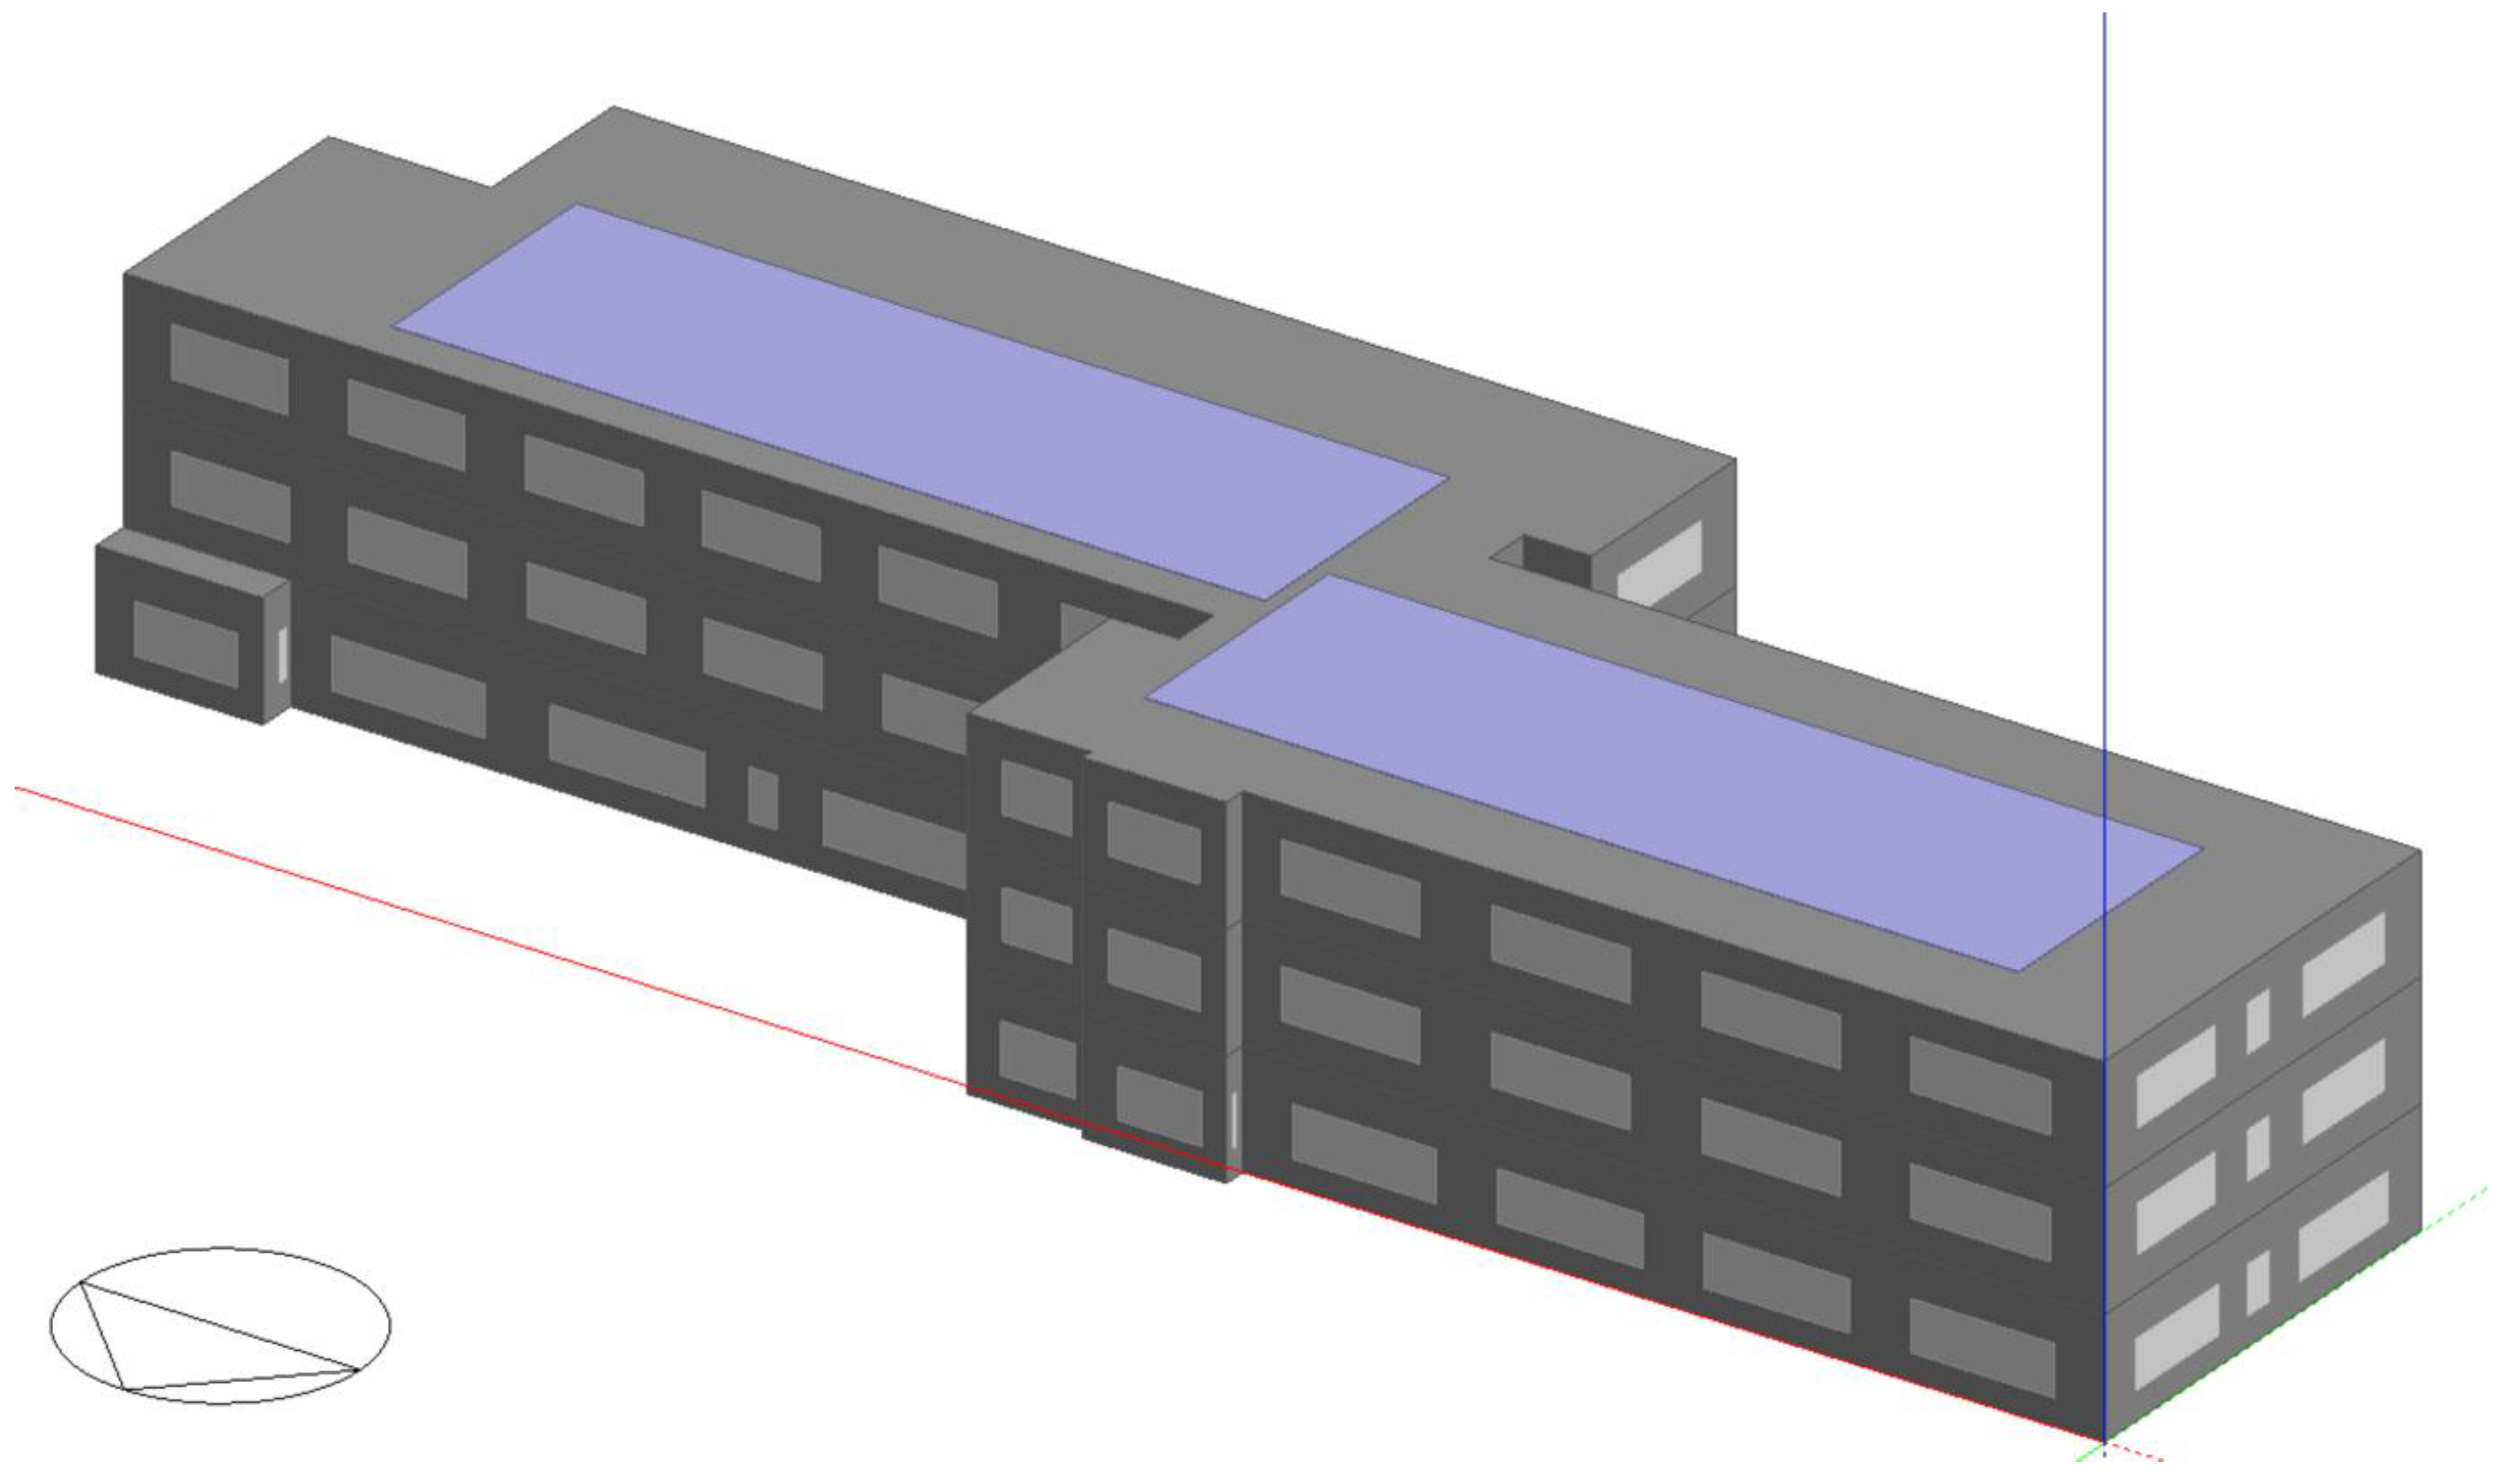
Table 1 summarizes the envelope composition. The windows were set with an average value (3.19 W/m
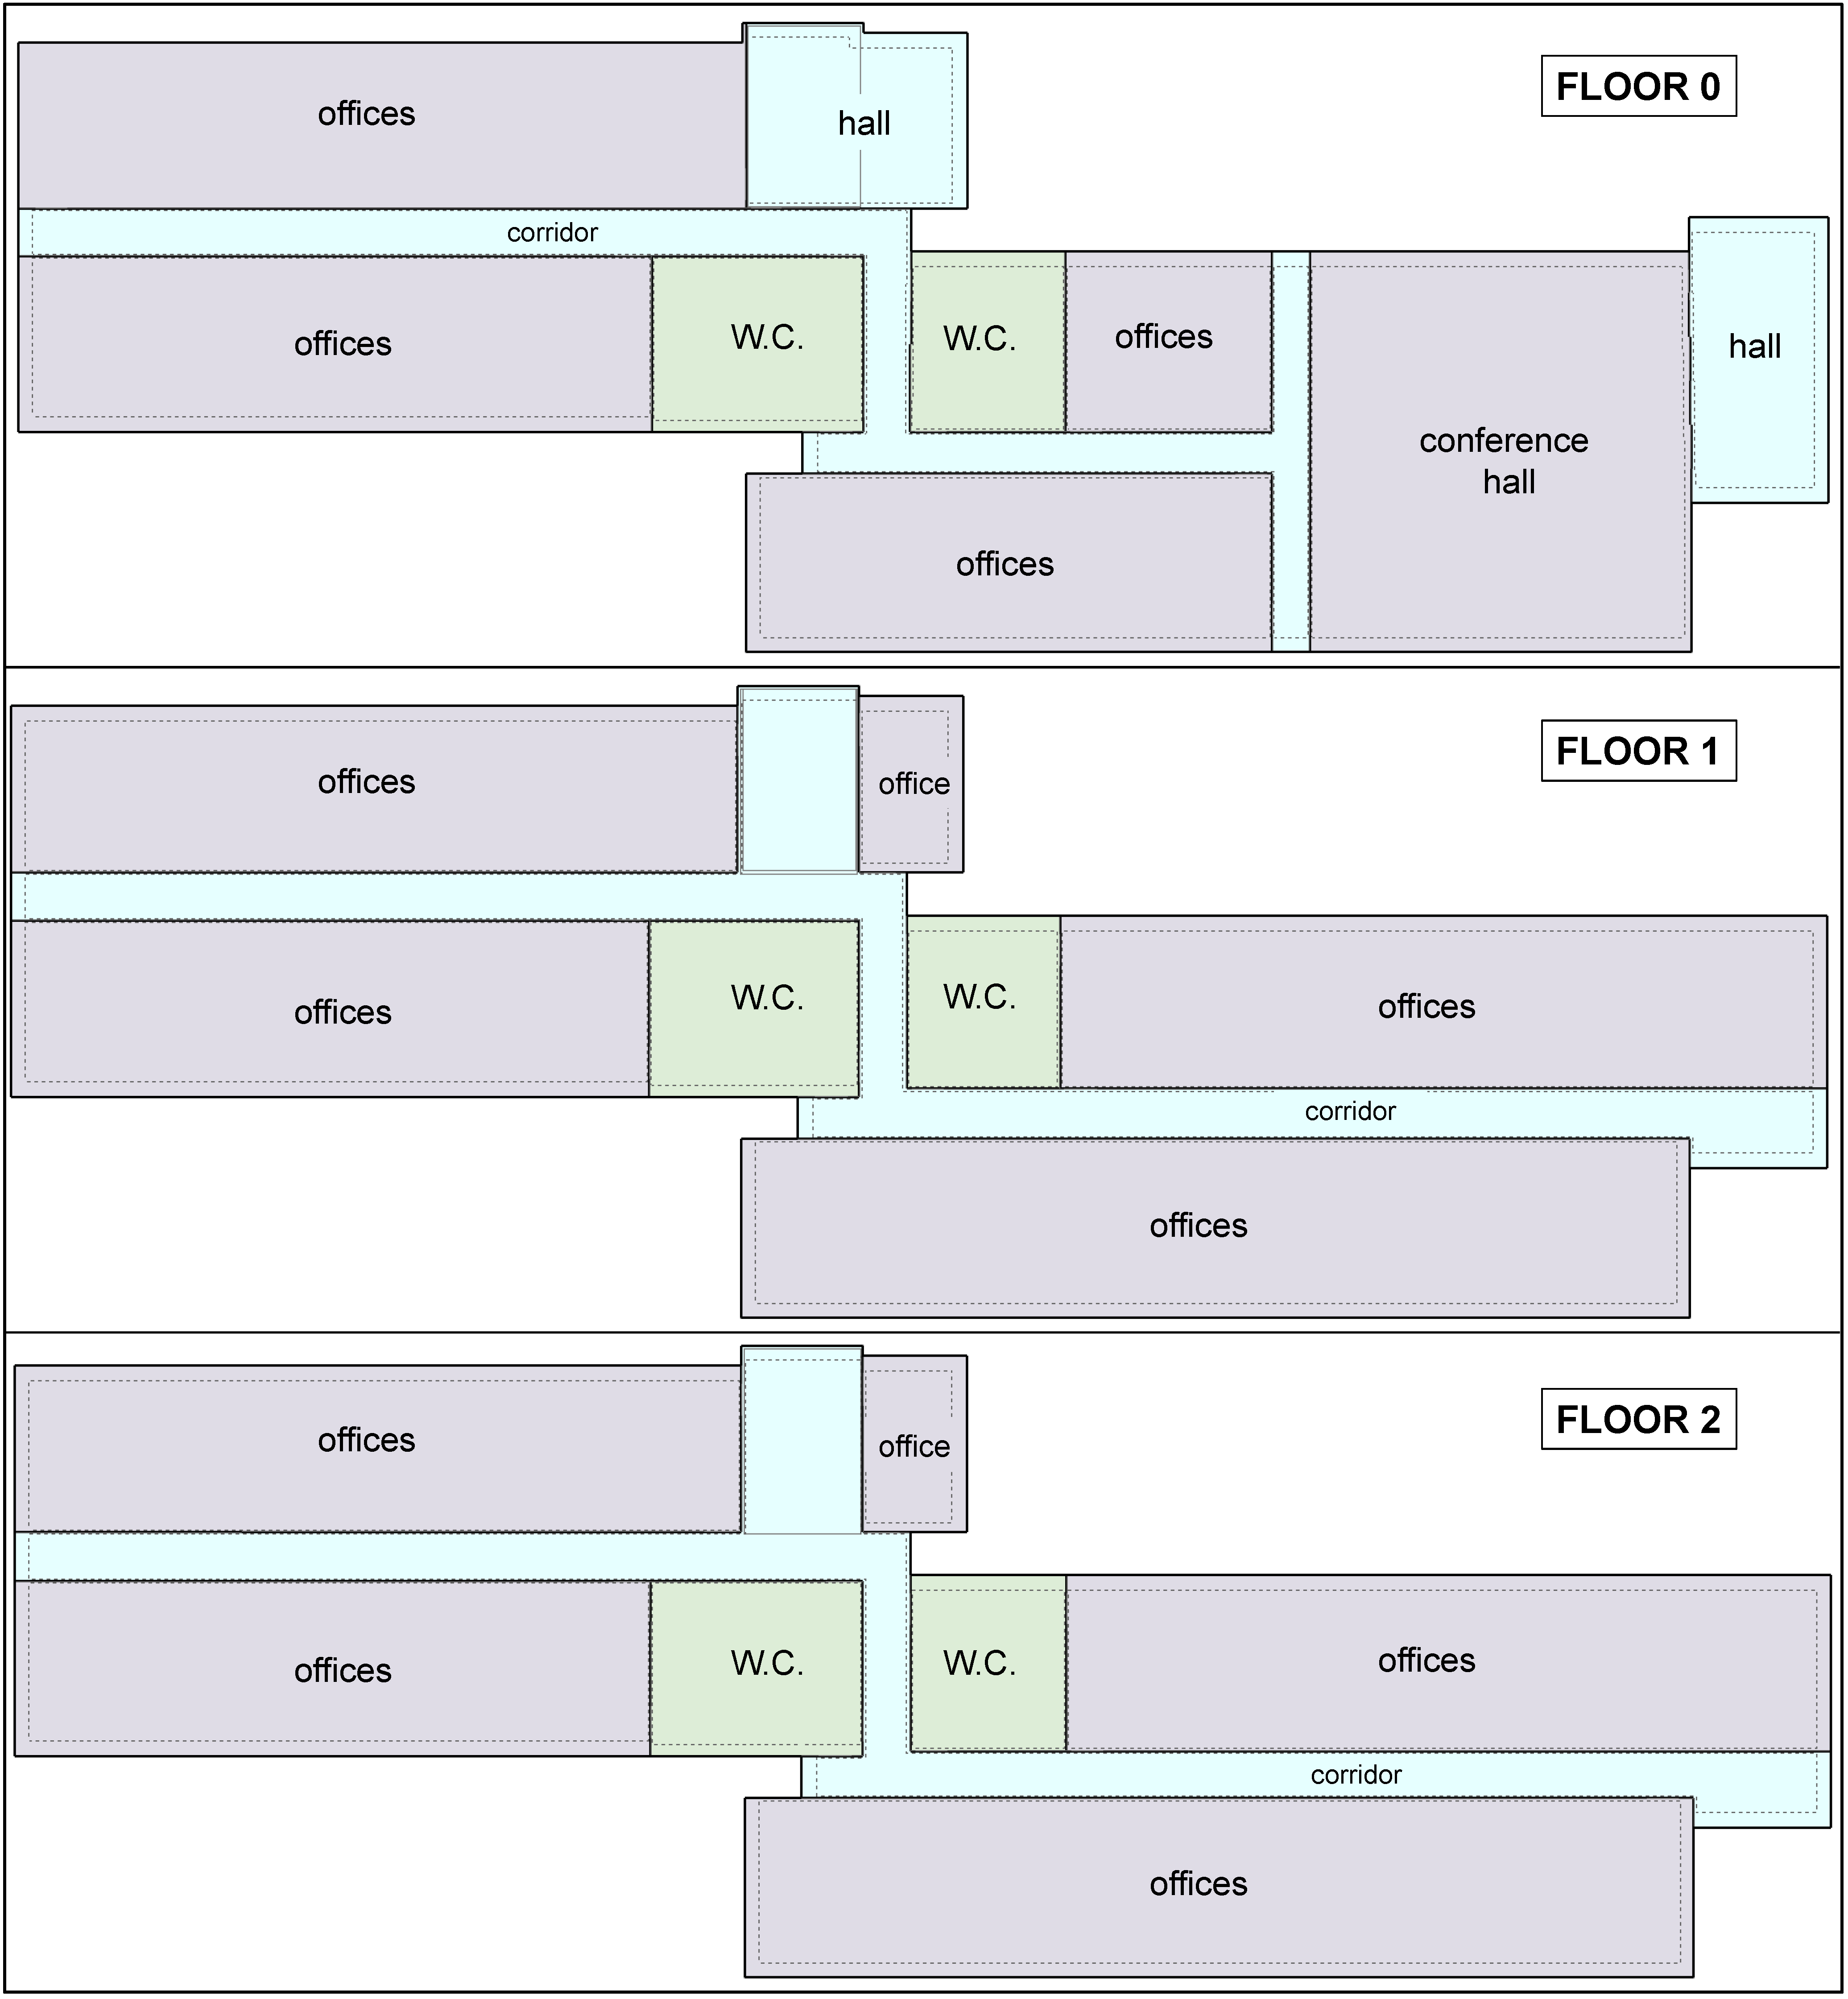
2K) of the transmittance for the considered years as well as the window-to-wall ratio (30%). The benchmark building model is illustrated in
Figure 1, and in
Figure 2, the outline of the three floors is depicted: the office rooms were modeled as open space (purple), hall and corridors are in light blue, and bathrooms in green.
The working day starts at 8:00 and ends at 17:00, with lunch break at 12:00–13:00. The conference hall is used once a week in the four morning hours, as a good practice for internal meeting and work planning. Concerning the lighting systems and gains, the illuminance and power consumption per unit area have been defined based on the project Premium Light Pro [
27], and is described in
Table 2. The appliances in office rooms account for 12 W/m
2 [
28].
The studied building is located in Rome, which belongs to Italian climate zone D due to 1415 degree days [
29]; the considered heating period is 1 November–15 April as set by national regulation [
30], although it has been reduced by 15 days (8 November–7 April) within a ministerial decree aimed to reduce the natural gas consumption [
7] following the Ukrainian invasion. To simulate a typical office building, the efficiency of the natural gas boilers for heating (160 kW) and domestic hot water (DHW) were set as Appendix A of ministerial decree [
31] (i.e., standard boilers with 0.95 and 0.85 efficiency, respectively). Regarding the cooling period season, the Italian legislation lacks a definition and a comprehensive schedule, hence it was set to 20 May–6 September, based on the climatic severity index described in [
32,
33,
34]; moreover, a commercial 150 kW heat pump with a 3.35 COP for cooling was chosen. Despite air renewal currently being mandatory for an office building, most Italian buildings built in the last quarter of the 20th century only have heating and cooling plants, hence one hour of natural ventilation has been scheduled twice a day for each room. Finally, each conditioned room was equipped with fan coil units.
According to the Introduction section, the proposed thermal load mapping method was applied to the described office building, whose numerical model was carried out with the software DesignBuilder, which matches the EnergyPlus engine accuracy and a user-friendly interface [
23]. The development of EnergyPlus was funded by the U.S. Department of Energy [
24] and the first version was released in the early 2000s. There are three basic components of EnergyPlus: a simulation manager, which handles the whole simulation process; a heat and mass balance simulation module, which is an improved engine based on the former IBLAST; and a building systems simulation module, which controls the interplays between all the equipment and the heat and mass balance module [
35]. The same modeling approach was applied to commercial buildings in [
36]. In the following sections, a parametric analysis involving three low-effort variables (i.e., heating/cooling set-point temperature, infiltration rate and working shift) was applied to a typical non-residential building in order to investigate the pertinent changes in thermal loads. Moreover, a later analysis on the final and primary energy consumption focused on the comparison of gas boiler and electric heat pump for heating purpose was proposed.
3. Heating and Cooling Loads
In the following sub-sections, the results in terms of heating and cooling load were analyzed as a function of the design parameters. First, the thermal loads were studied depending on the set-point temperatures and infiltration rate. The latter analysis focused on the impact of three different working shifts on the heating and cooling load and, for each of them, the set-point temperatures and infiltration rate ranged for a thorough investigation.
3.1. Set-Point Temperature and Infiltration Rate
A typical office building used as the benchmark was oriented to the north and had a window-to-wall ratio of 30%. A parametric analysis was carried out considering five values of the infiltration rate (0.25, 0.50, 0.75, 1.00, 1.25) and three values of set-point temperature for each season (20, 19, 18 for heating period and 26, 27, 28 for cooling period), as listed in
Table 3.
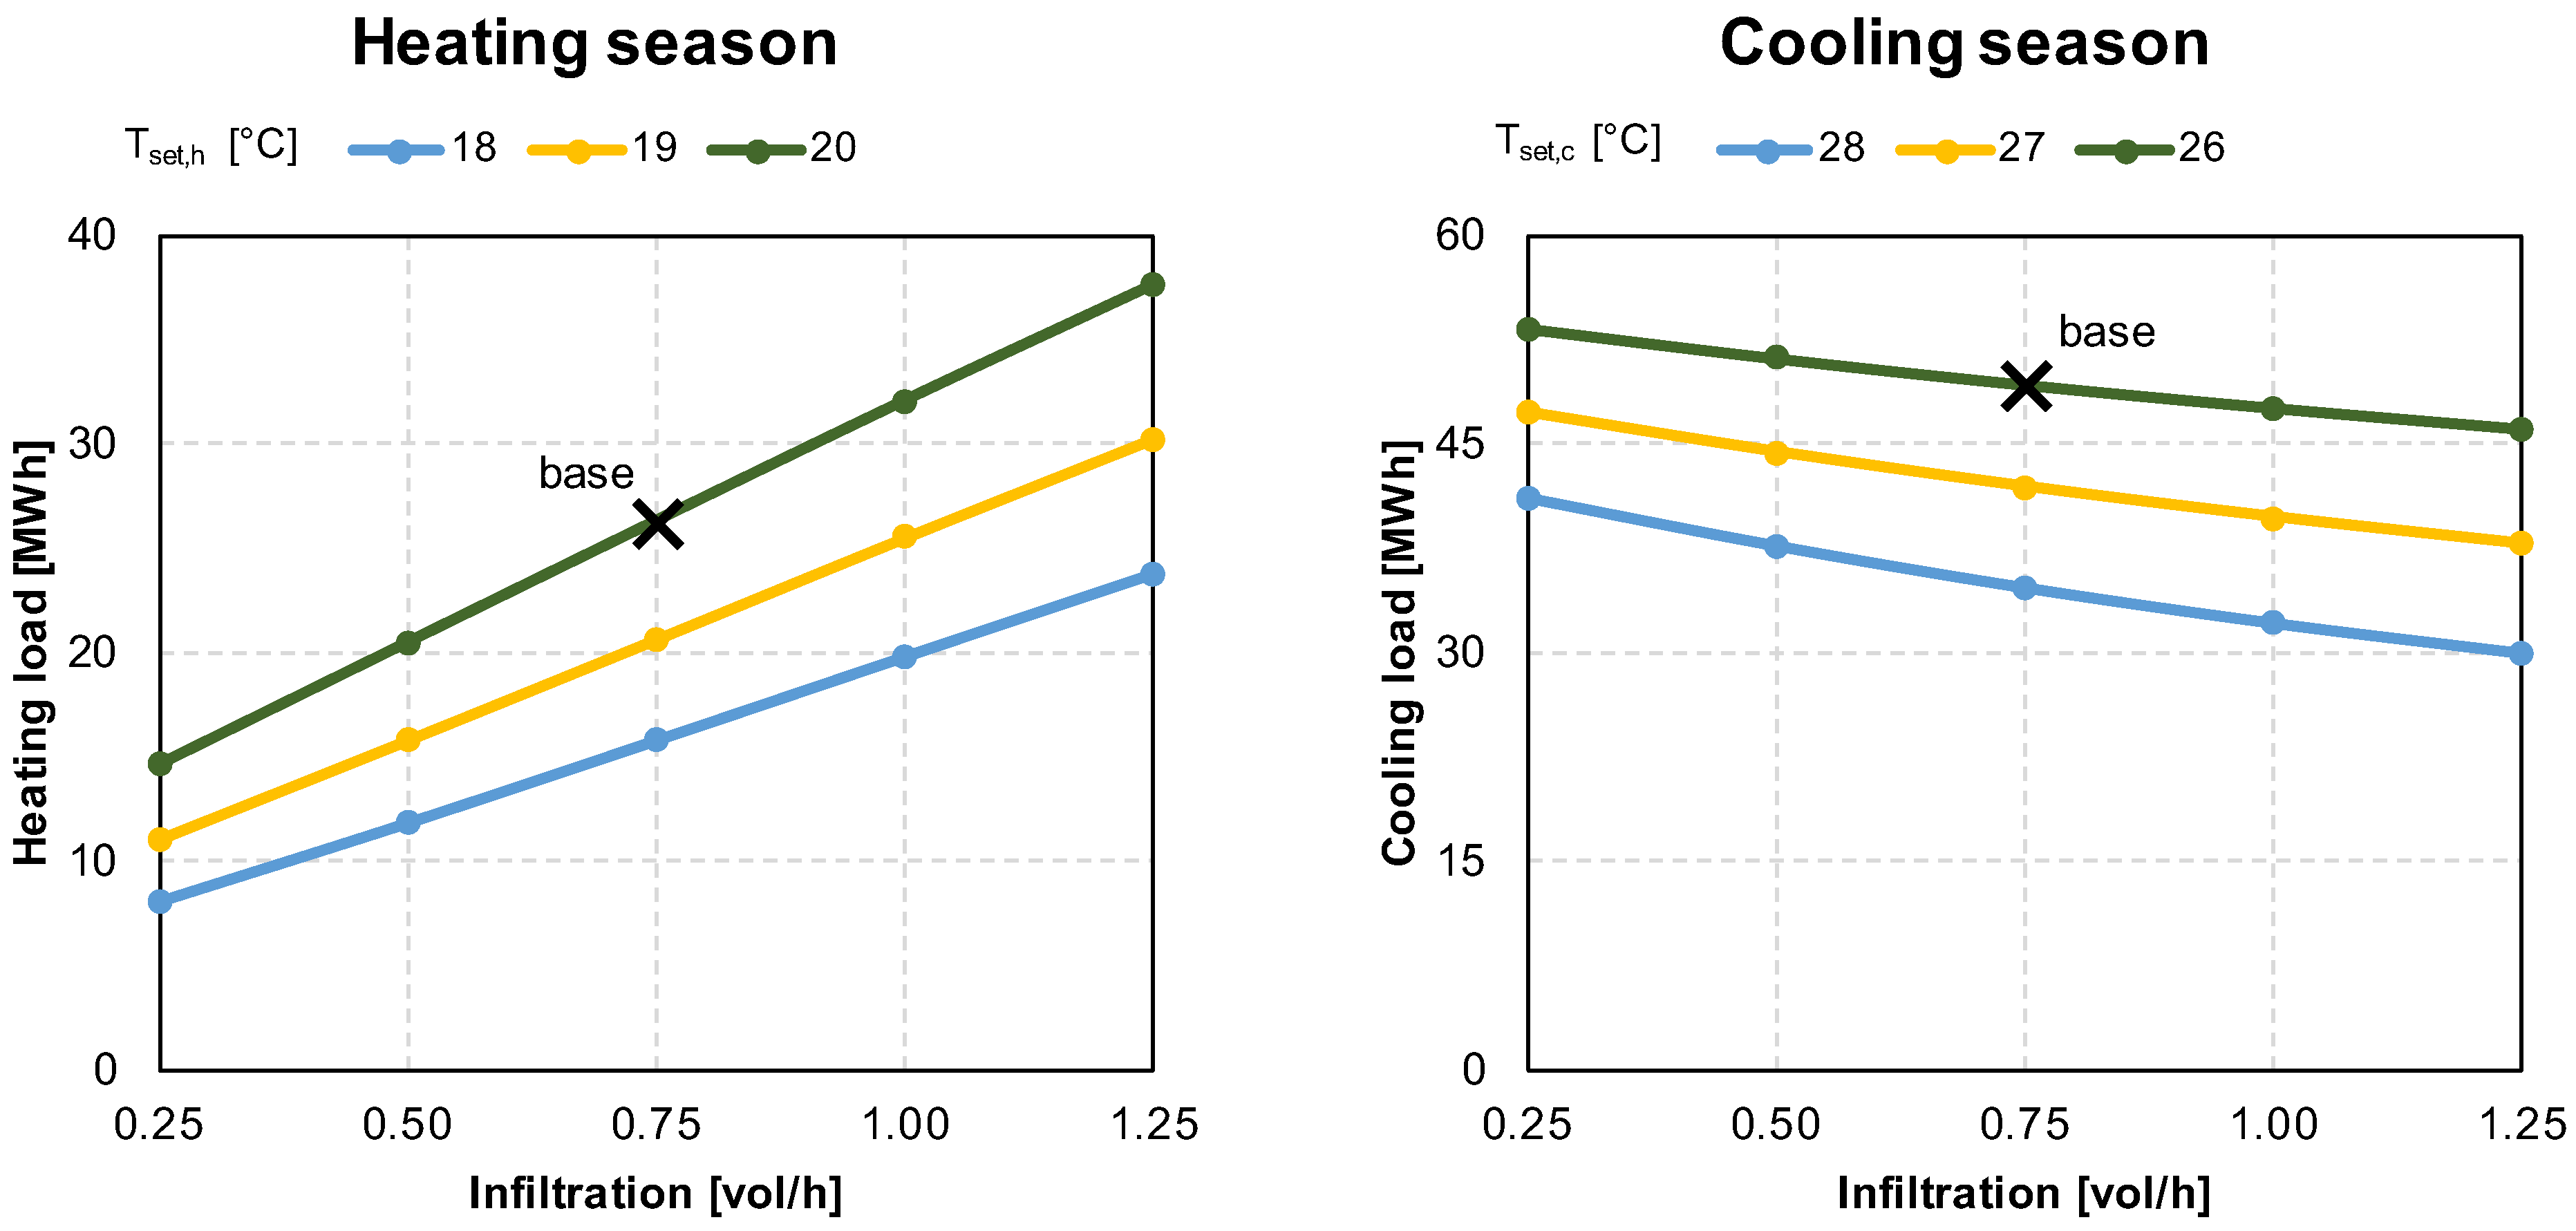
In
Figure 3, the heating and cooling loads are shown as a function of indoor set-point temperature and airtightness. The baseline infiltration was assumed to be 0.75 air change per hour, and the set-point temperatures were 20 and 26 for heating and cooling, respectively; the baseline is depicted with a black cross in the two charts. The heating load increases with both the air infiltration and the set-point temperature. Hence, the thermal load for the heating season could be reduced by decreasing one or both of them (e.g., starting from the baseline conditions, the heating load can be diminished of more than 20% by reducing the infiltration to 0.50 vol/h or by reducing the setpoint temperature to 19 °C). The effect of reducing both of them involved a heating load cut of 40%. Regarding the cooling season, the thermal load decreased with the increase in the set-point temperature and infiltration rate following different rules: for the baseline, by increasing the temperature from 26 °C to 27 °C, the energy saving reached 15%, while increasing the infiltration to 1.00 vol/h, the gain in energy saving was almost 4%; the effect of both was quantified in a cooling load decrease of 20%. Overall, for the studied low-rise building, a variation of one degree Celsius of temperature resulted in a substantial variation in the thermal load for both seasons, while varying the airtightness level involved a thermal load change strongly affected by the season.
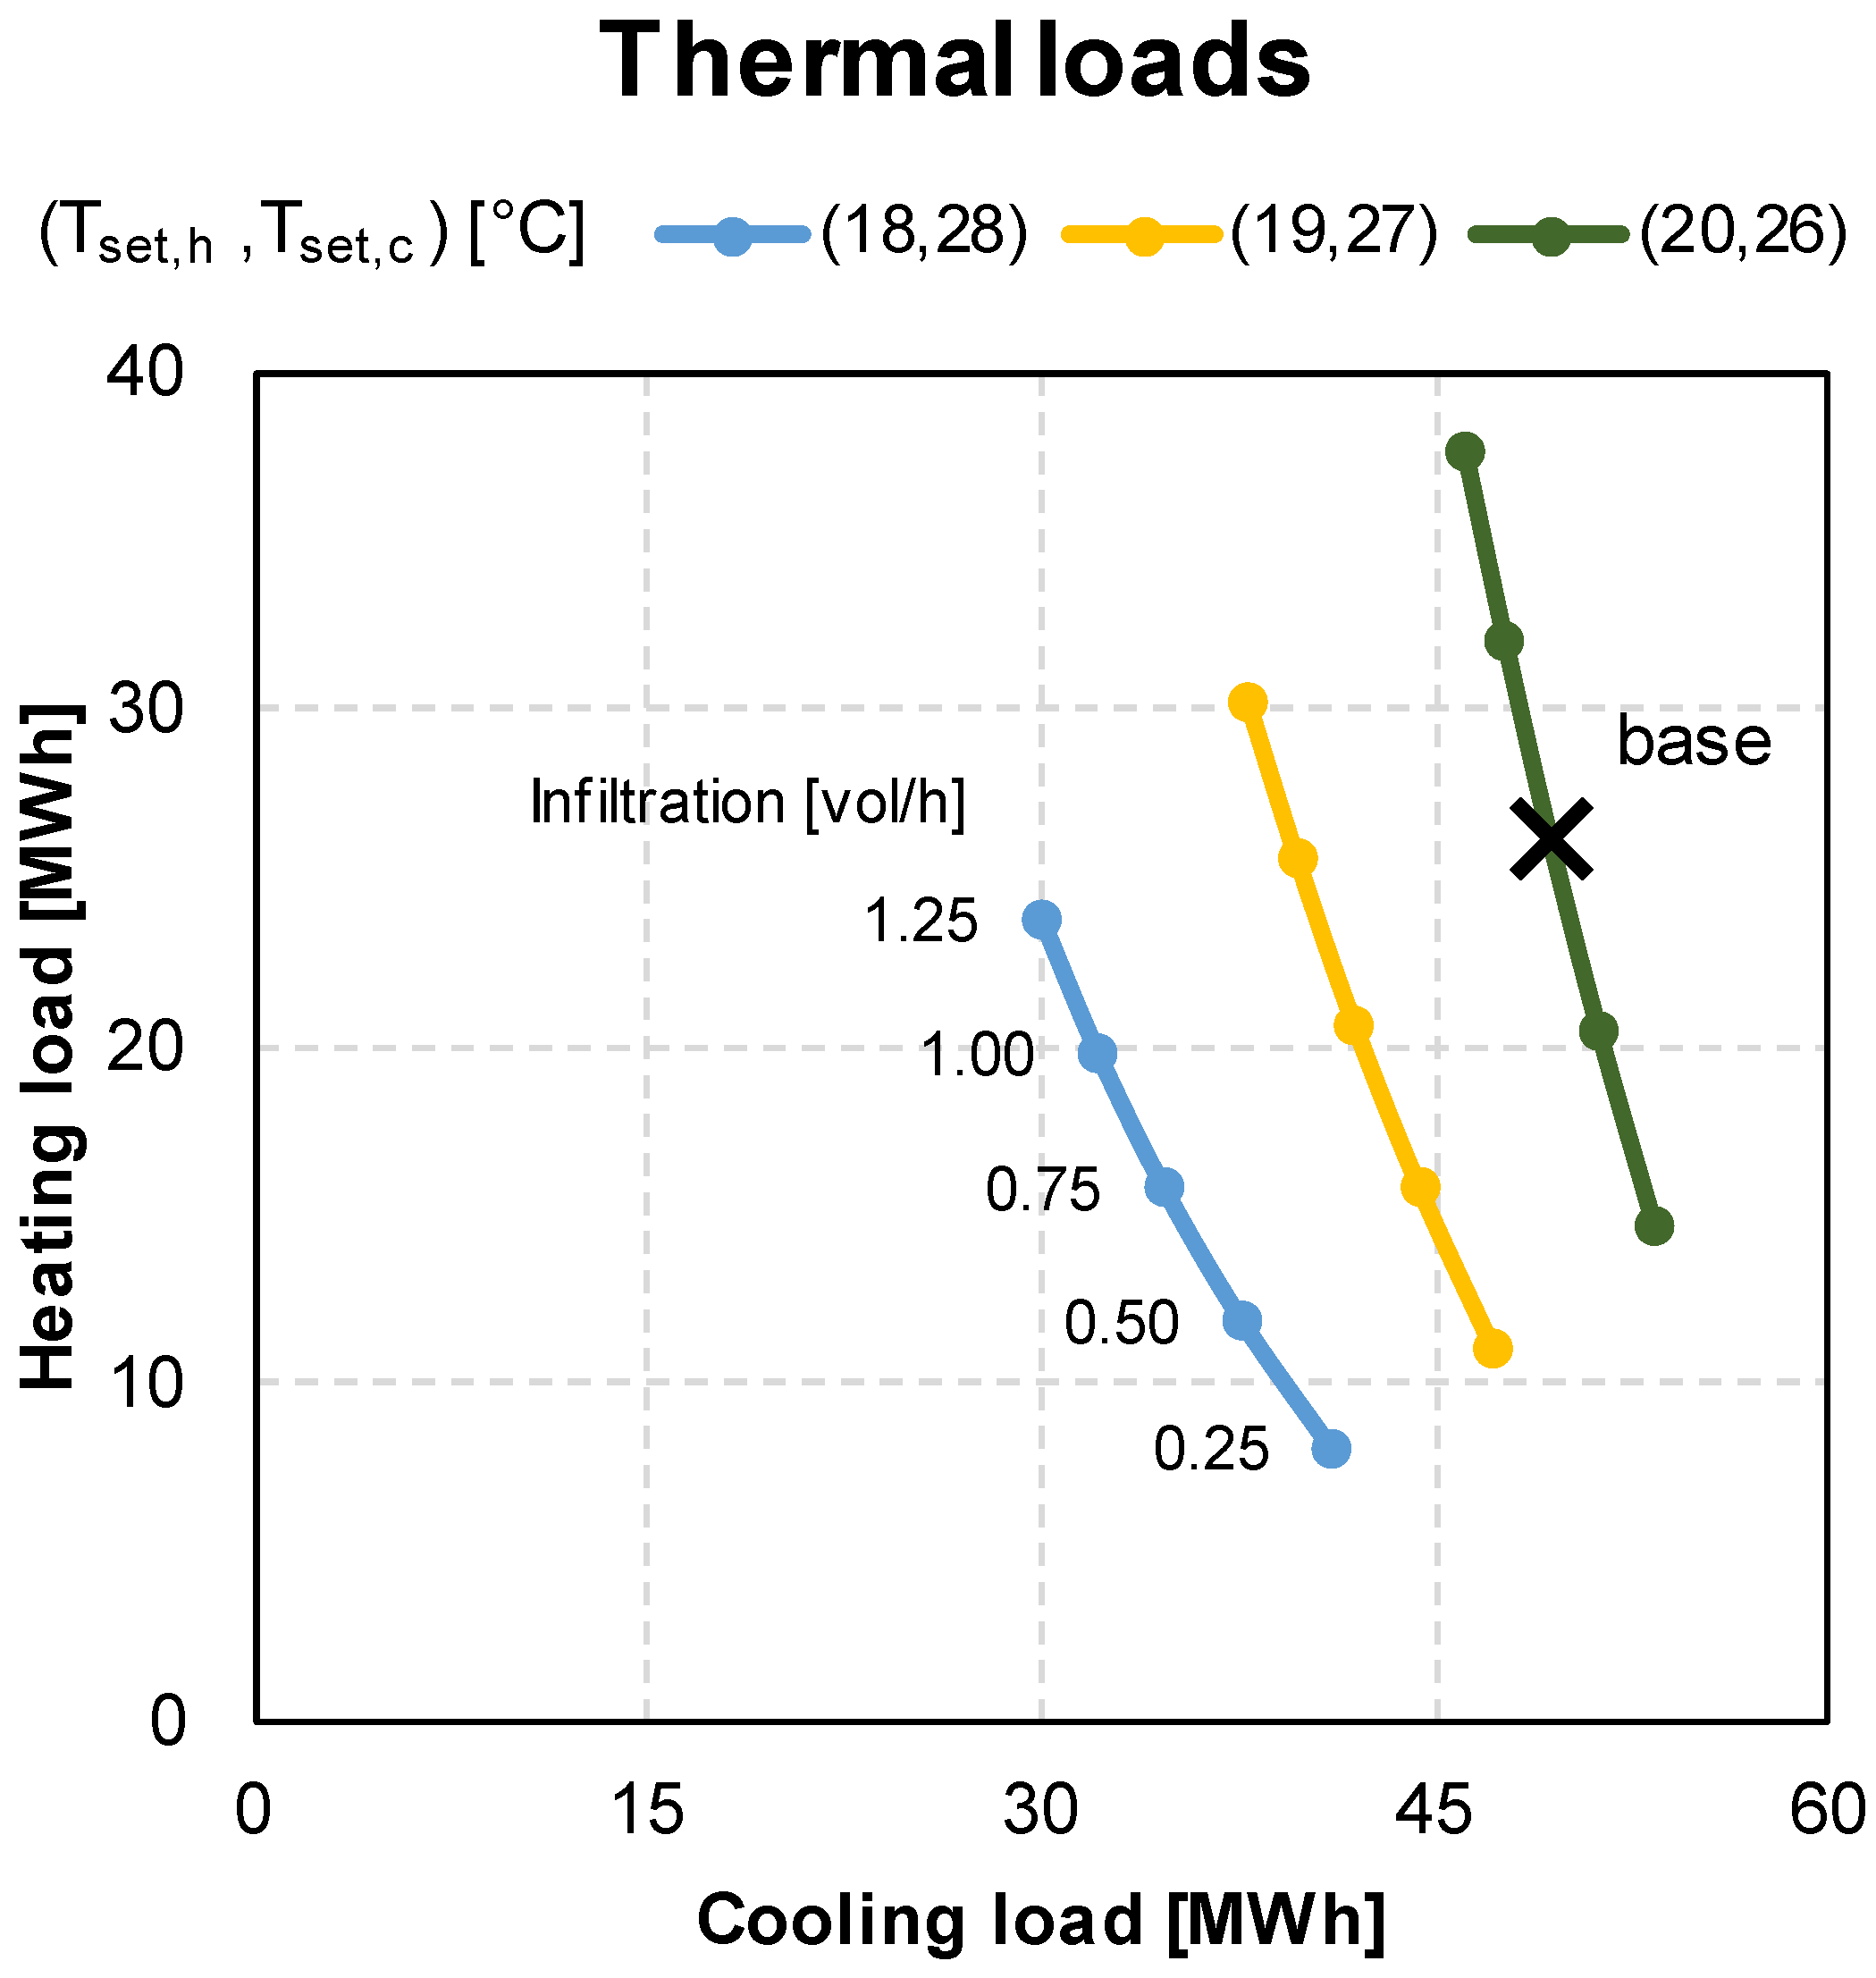
Both thermal loads for heating and cooling season are shown on the same chart in
Figure 4, where three lines represent three pairs of set-point temperature and the baseline is marked with a black cross; each line connects five points that are related to the five values of infiltration rate.
3.2. Work Shifts
Furthermore, the set-point temperature, an effortless parameter that could involve a significant change in the heating and cooling load is the occupancy: for dwellings, it is not possible to set a fixed presence within the rooms, but it is feasible for an office building by setting different work shifts. To this aim, two work shifts were added to the baseline (shift A): one from Monday to Friday that includes only 50% of workers (shift B) and one limited from Tuesday to Thursday that includes 100% of workers (shift C). For the sake of completeness, the remaining 50% of workers in shift B are working from home as well as all the workers on Monday and Friday during shift C.
Table 4 lists the three proposed work shifts.
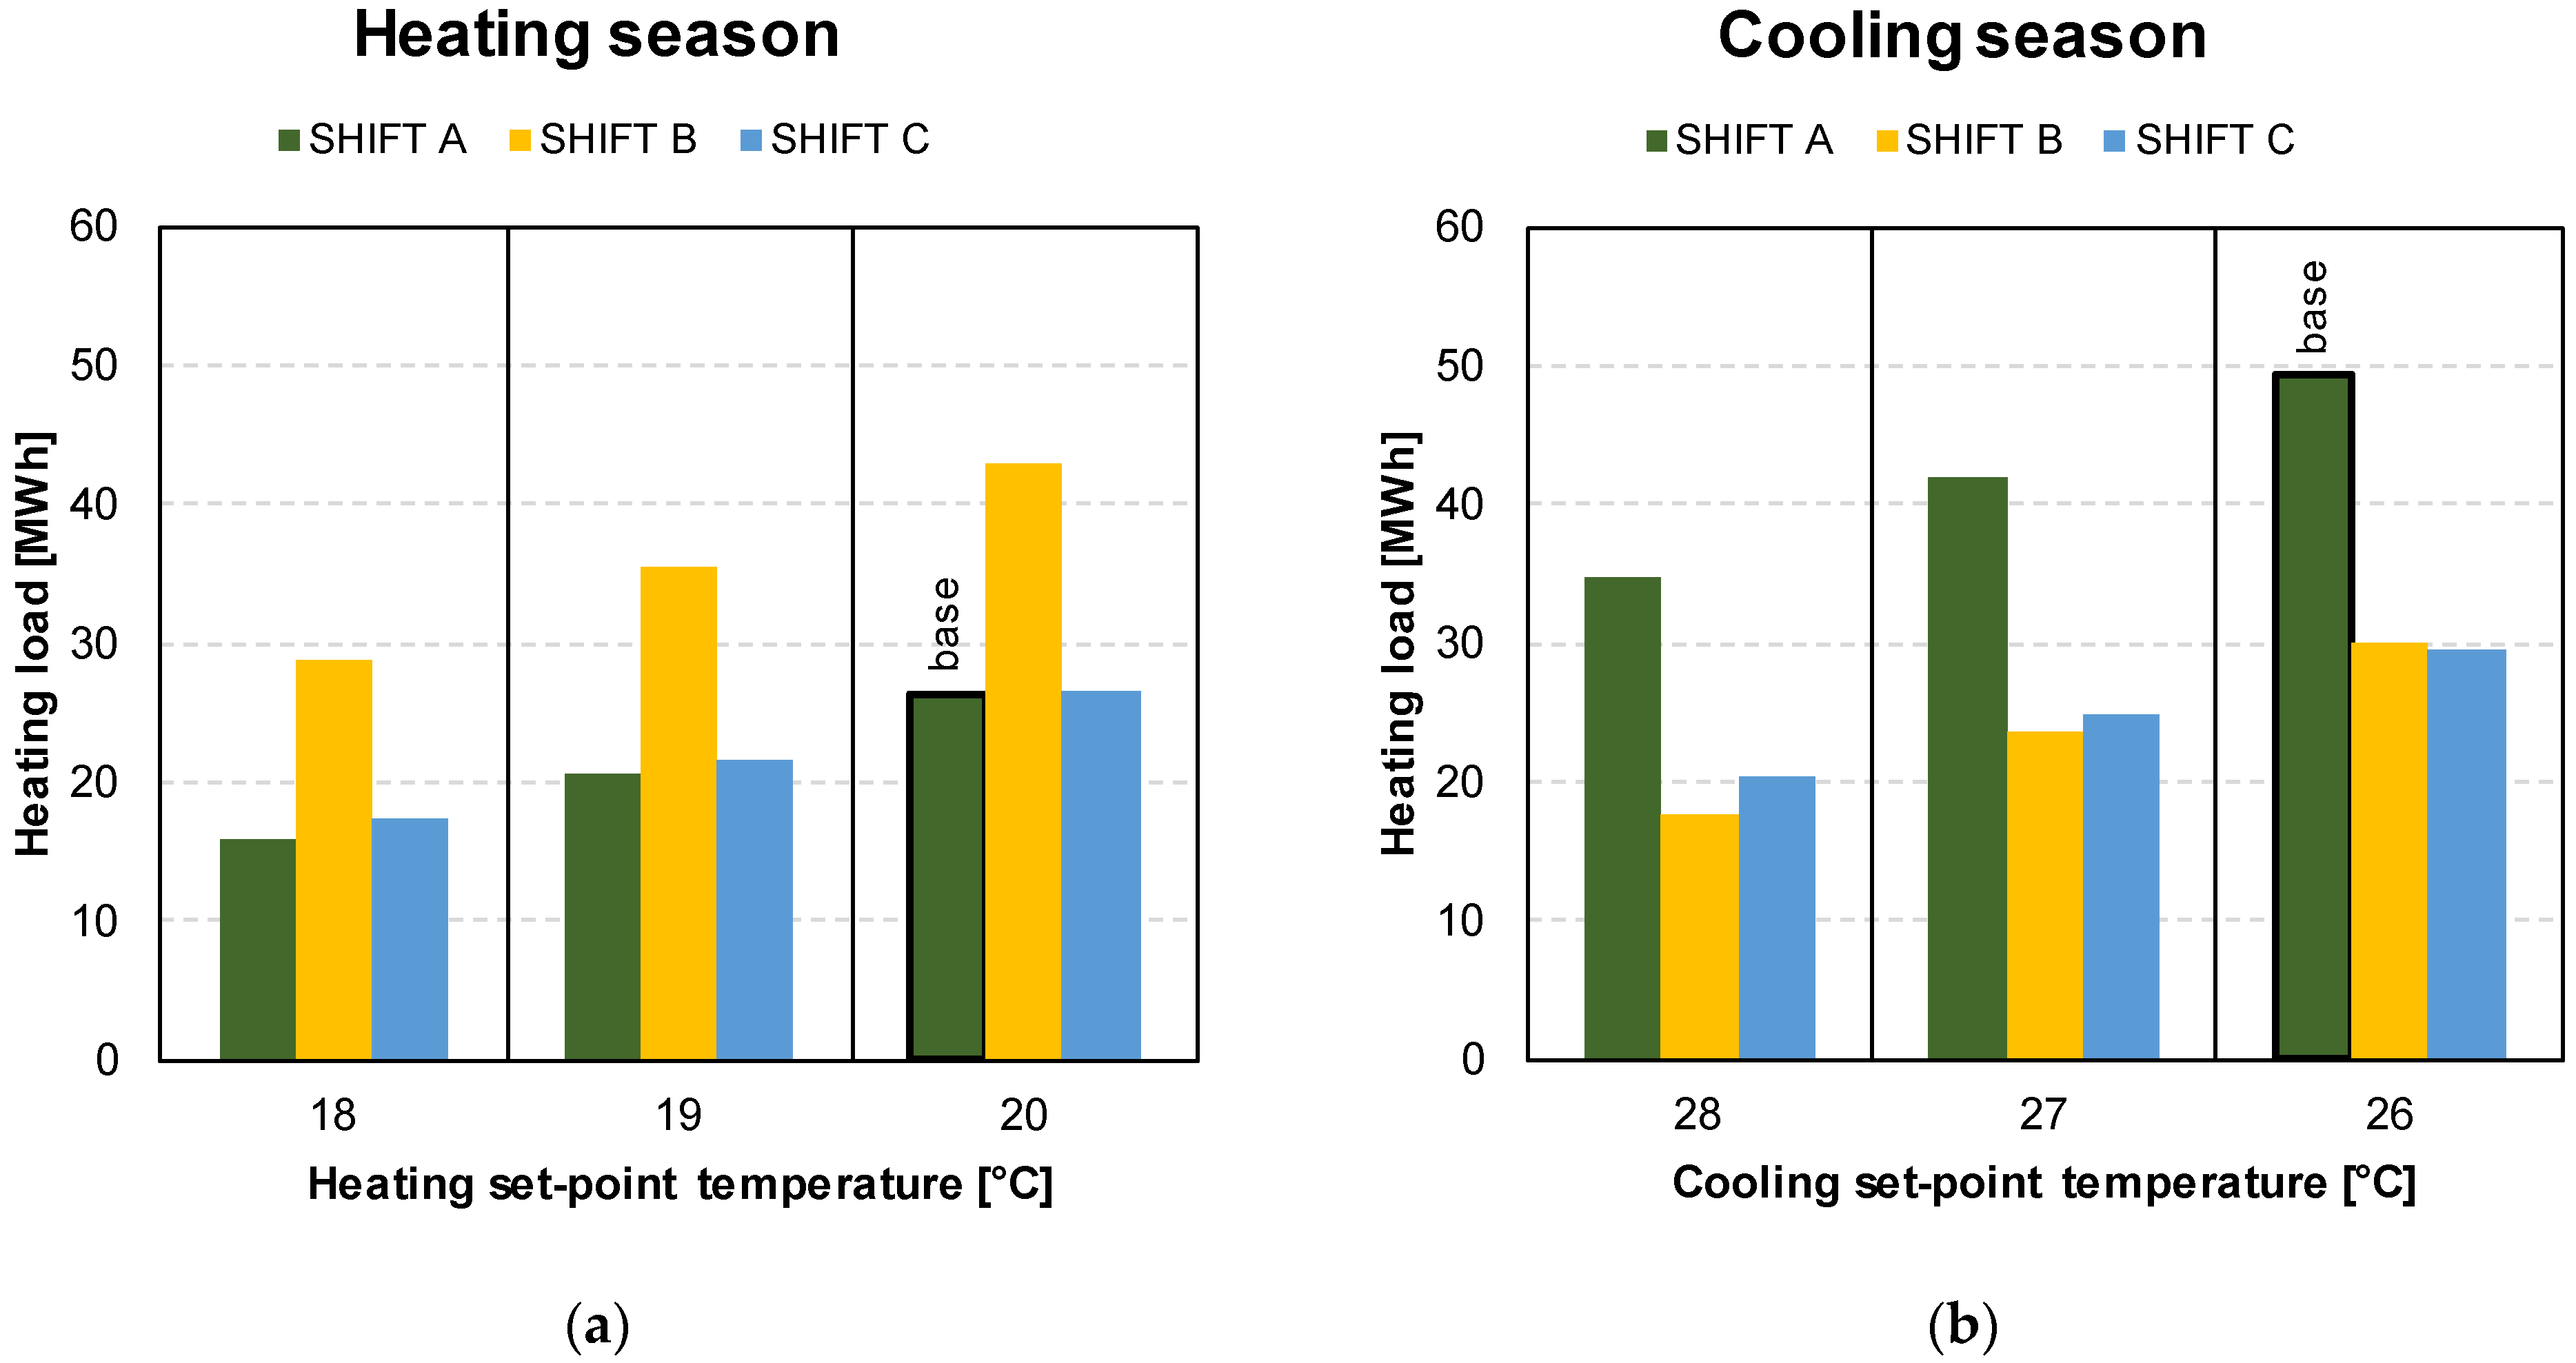
The heating and cooling loads are shown in
Figure 5 for three set-point temperatures and for three work shifts; the baseline loads are marked with a black line for both seasons. For each T
set,h, the heating load was larger for shift B, while shifts A and C were almost similar. The reason beyond this trend is the lower people heating rate due to only 50% of workers in the office that must be balanced by the HVAC plant. For the same reason, the higher cooling load is related to shift A, which corresponds the maximum of both occupancy and working days. For the set-point temperature pair (T
set,h = 20°, T
set,c = 26°), the switch to shift B meant an increase of 64% in the heating load and a decrease of 39% in the cooling load, while setting the work shift C involved an increase of 1% in the heating load and a decrease of 40% in the cooling load.
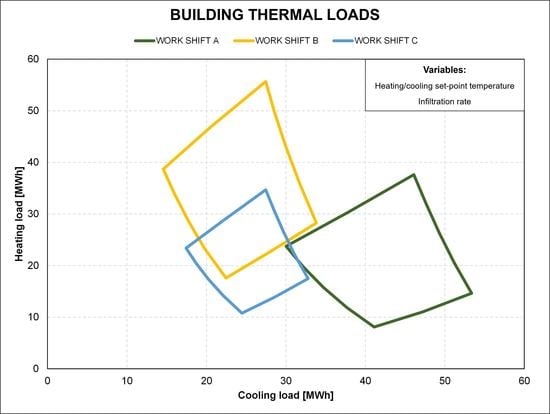
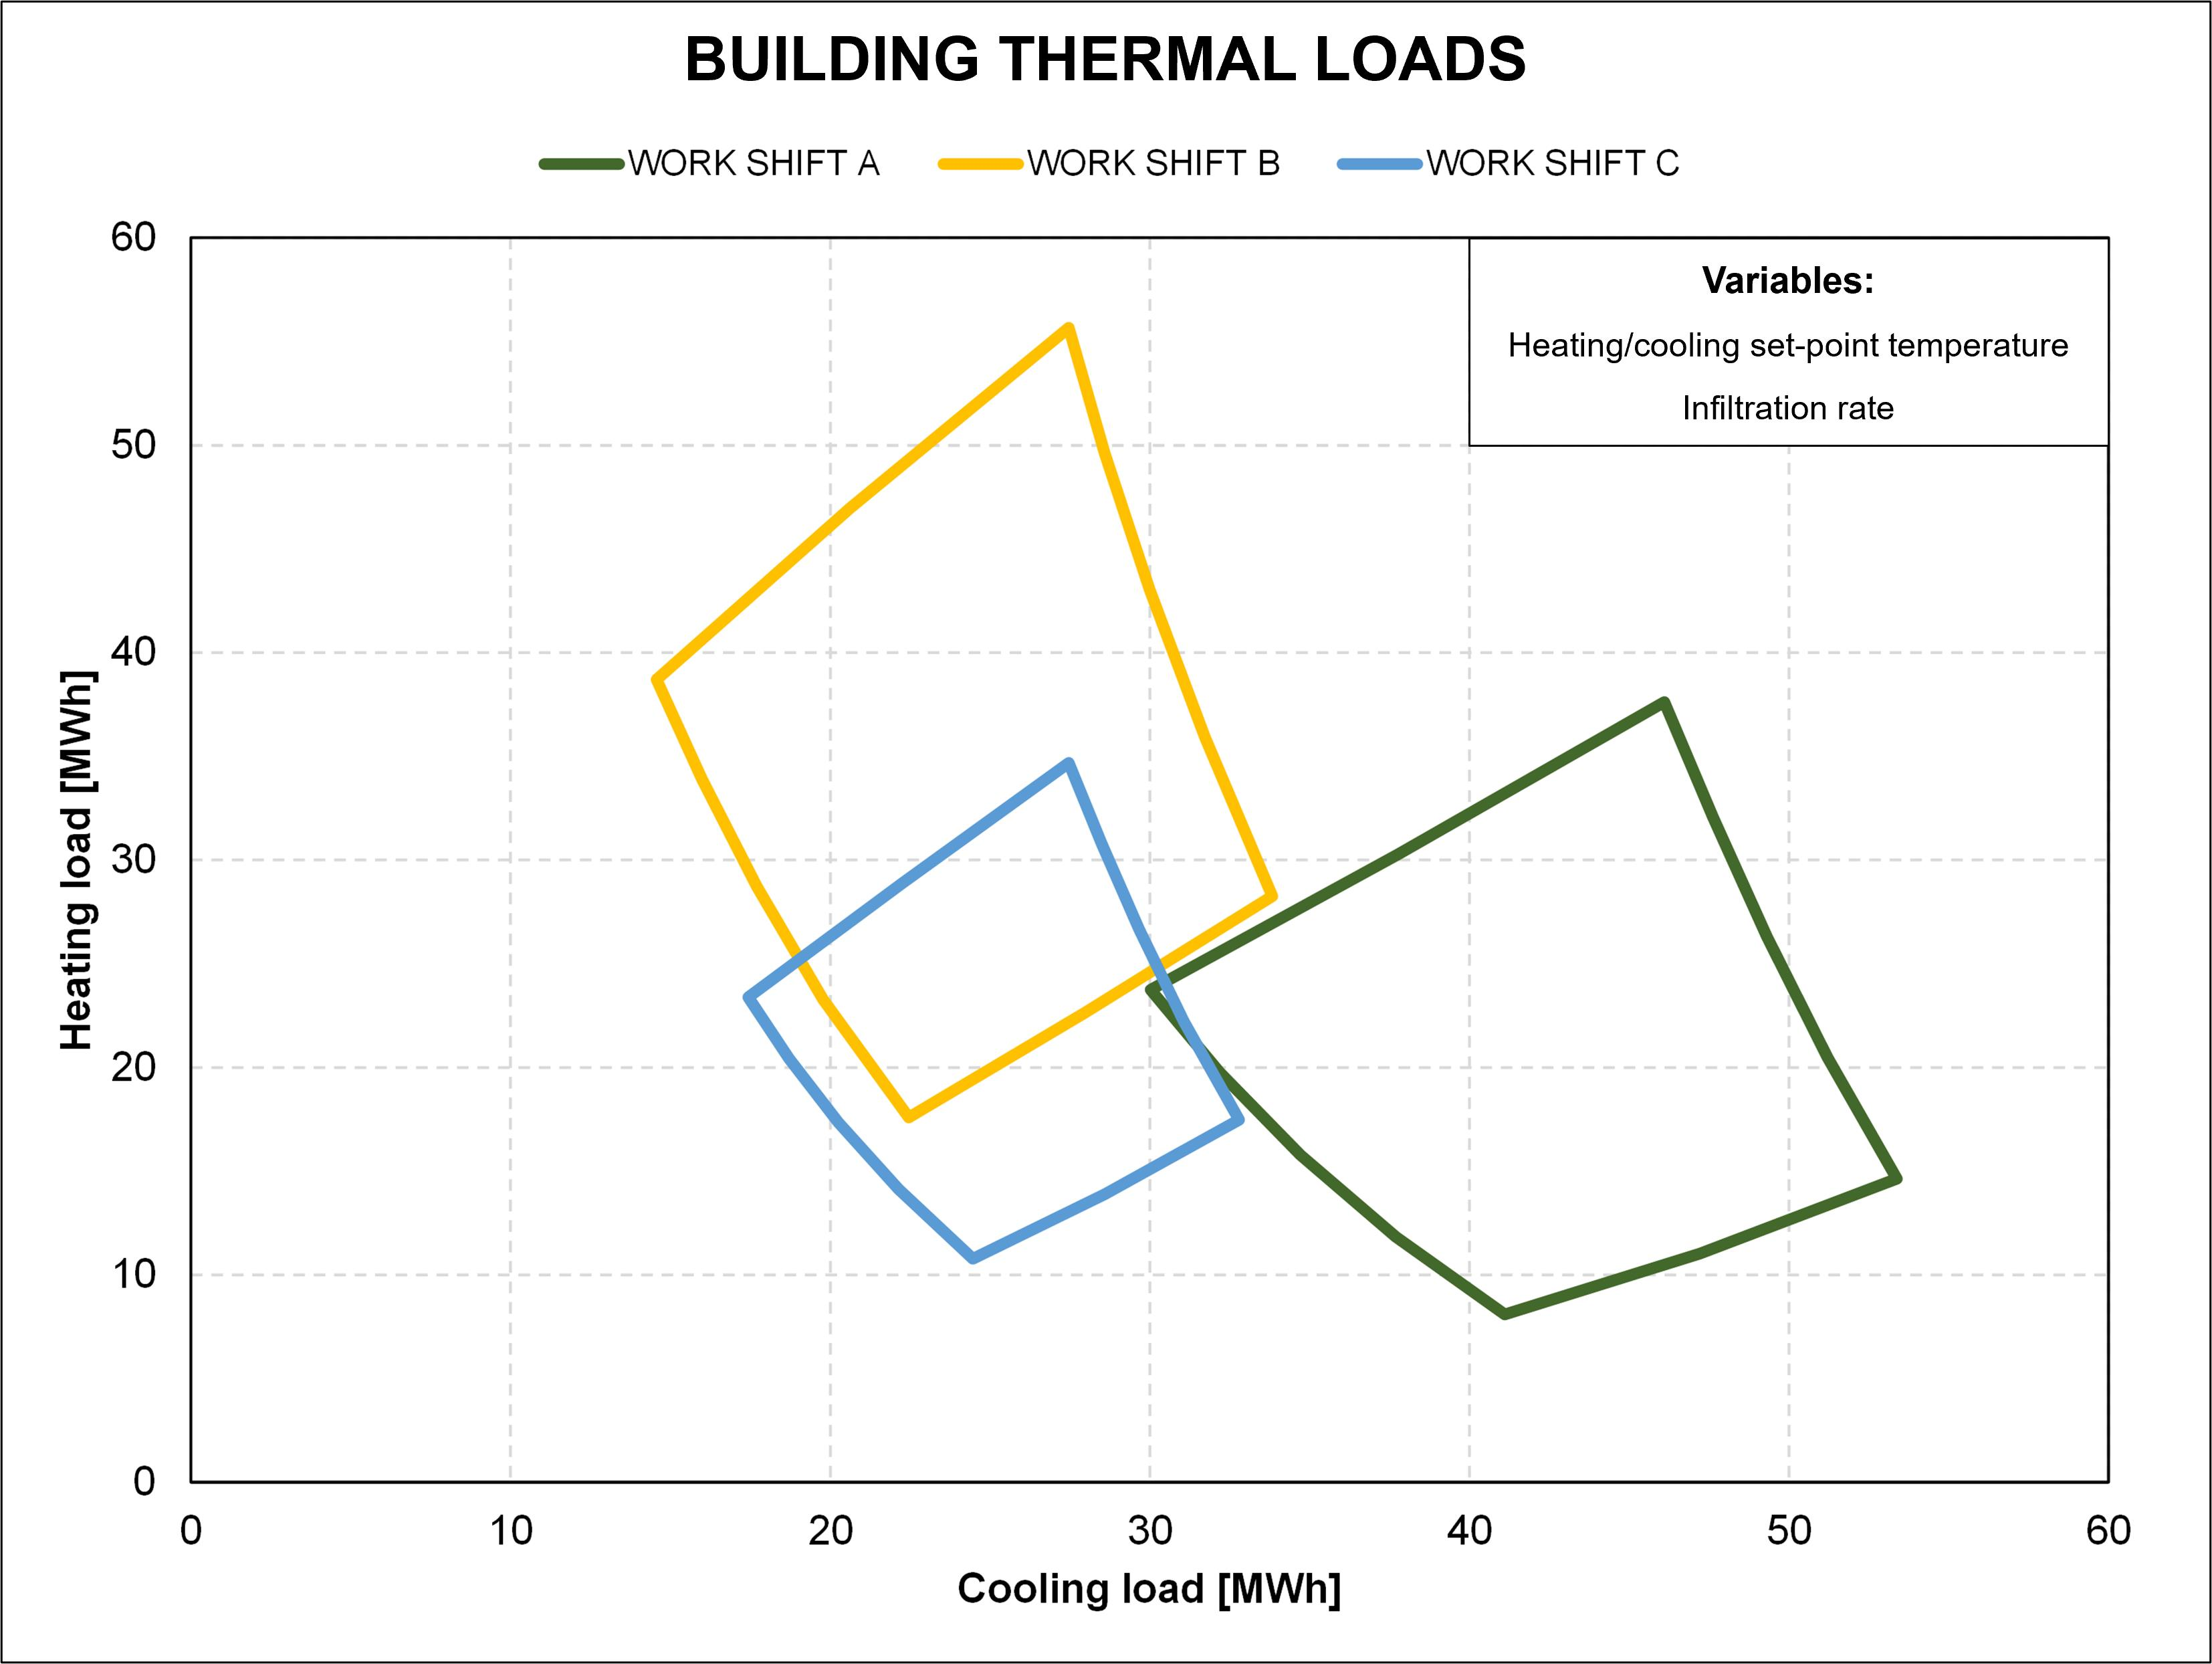
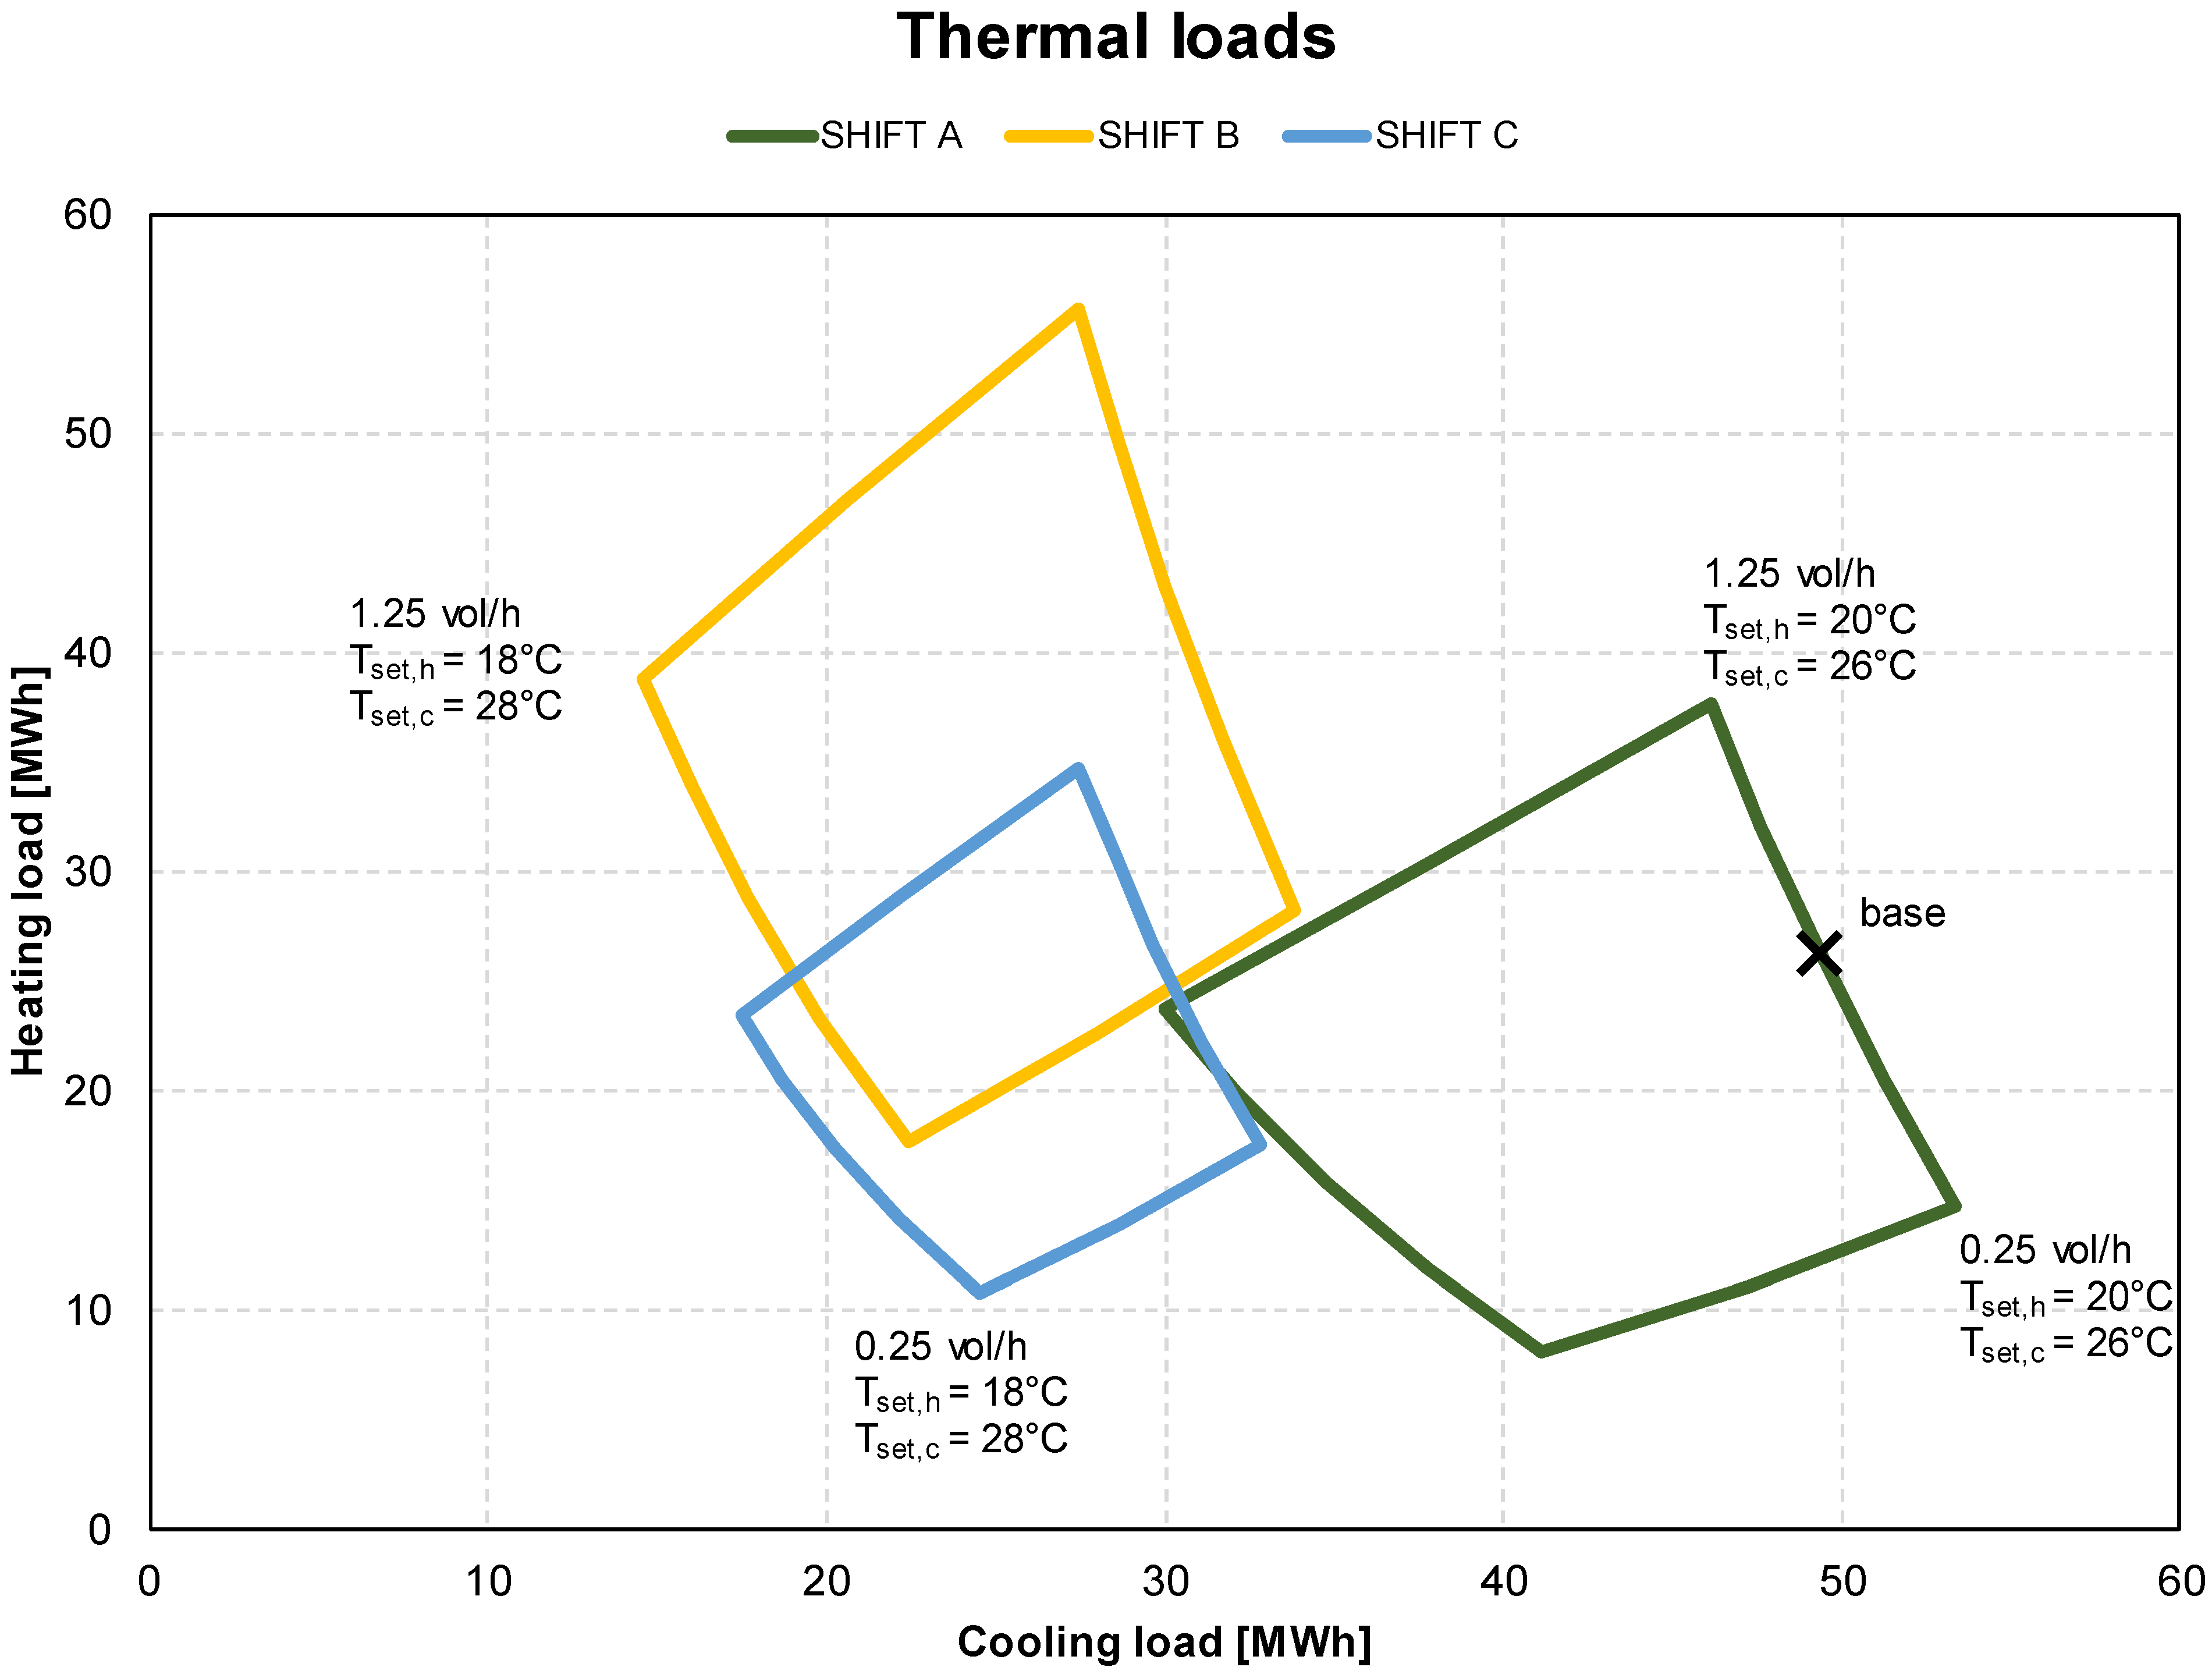
Both thermal loads are shown on the same chart in
Figure 6 as a function of set-point temperature, work shift, and infiltration rate. In particular, the combination of the three parameters resulted in outlining the contours of a thermal load map for each work shift; the set-point temperature pairs were the same as those in
Figure 4, with (20,26) representing the vertical right boundary and (18,28) representing the vertical left boundary for each work shift, with (19,27) lying in the middle of the map. The five values of infiltration rate already considered define the horizontal boundaries, with 0.25 vol/h at the bottom and 1.25 vol/h at the top. To ease the maps analysis, the values of four angular points are illustrated; it should be noted that the area of the baseline in work shift A, depicted with green contours, corresponds to the points illustrated in
Figure 4. The comparison of the maps suggests that the number of working days was more significant than the employees’ attendance in terms of the extension of the thermal load area: for the studied case, the area of shift A was more comparable with the area of shift B than shift C, although the percentage of workers present was half.
The maps represent the range of thermal loads achievable by combining the three low-effort parameters. In other words, for the studied benchmark building, it is possible to predict the variation in heating and cooling demands by varying from one to three low-effort variables among the set-point temperature, work shift, and infiltration rate. For instance, the three areas moved closer to each other at about a 30 MWh cooling load and 25 MWh heating load, meaning that approximately the same thermal load could be achieved with three different boundary conditions, in other words:
- -
Shift A, (Tset,h = 18, Tset,c = 28), infiltration rate = 1.25 vol/h;
- -
Shift B, (Tset,h = 19, Tset,c = 27), infiltration rate = 0.25 vol/h;
- -
Shift C, (Tset,h = 20, Tset,c = 26), infiltration rate = 0.75 vol/h.
However, the three combinations have a significant difference in the indoor thermal comfort and this aspect should also be considered. In other words, starting from the baseline, the thermal loads can be reduced in several ways, such as keeping the work shift A, increasing the infiltration rate and enlarging the set-point temperatures of 2 °C or switching to work shift B, increasing the airtightness and enlarging the set-point temperatures of 1 °C; finally, the infiltration rate and the set-point temperature pair can be kept constant and only the work shift can be changed from A to C, ensuring both an acceptable indoor quality and an effortless action.
3.3. Discussion
The studied building has the typical Italian building envelope of the late 20th century. Focusing on the thermal loads of
Figure 4, changing the set-point temperature of 1 °C had a considerable impact on both the heating and cooling energy, it should also be considered that it does not involve any extra cost; on the other hand, when the set-point temperature varies (i.e., decreasing during the winter and increasing during the summer), concerns about the indoor thermal comfort may arise. The EN 16798-1 standard [
28] establishes four categories of the level of expectations of thermal comfort (high, medium, moderate, low), each one characterized by an operative temperature pair among other parameters, as listed in
Table 5. Moreover, despite ranging the infiltration rate has limited direct costs, its impact on heating and cooling showed the opposite trend and magnitude. In particular, increasing the air change per hour involves an important increase in heating load and a slight decrease in cooling load, hence it could be complex to define the optimal value of airtightness.
Introducing two further work shifts, the possible pairs of heating and cooling load increased, as the three areas in
Figure 6 clearly illustrate. The baseline work shift (A) had lower loads for heating but required most of the highest loads for cooling; when halving the workers’ occupancy of the office building (shift B), the heating load reached its peak and the cooling load decreased; finally, when reducing from five to three working days and restoring 100% of occupancy (shift C), both thermal loads achieved an acceptable compromise. Therefore, the working flexibility, wherever applicable, should be considered, even for thermal load control.
4. Final and Primary Energy
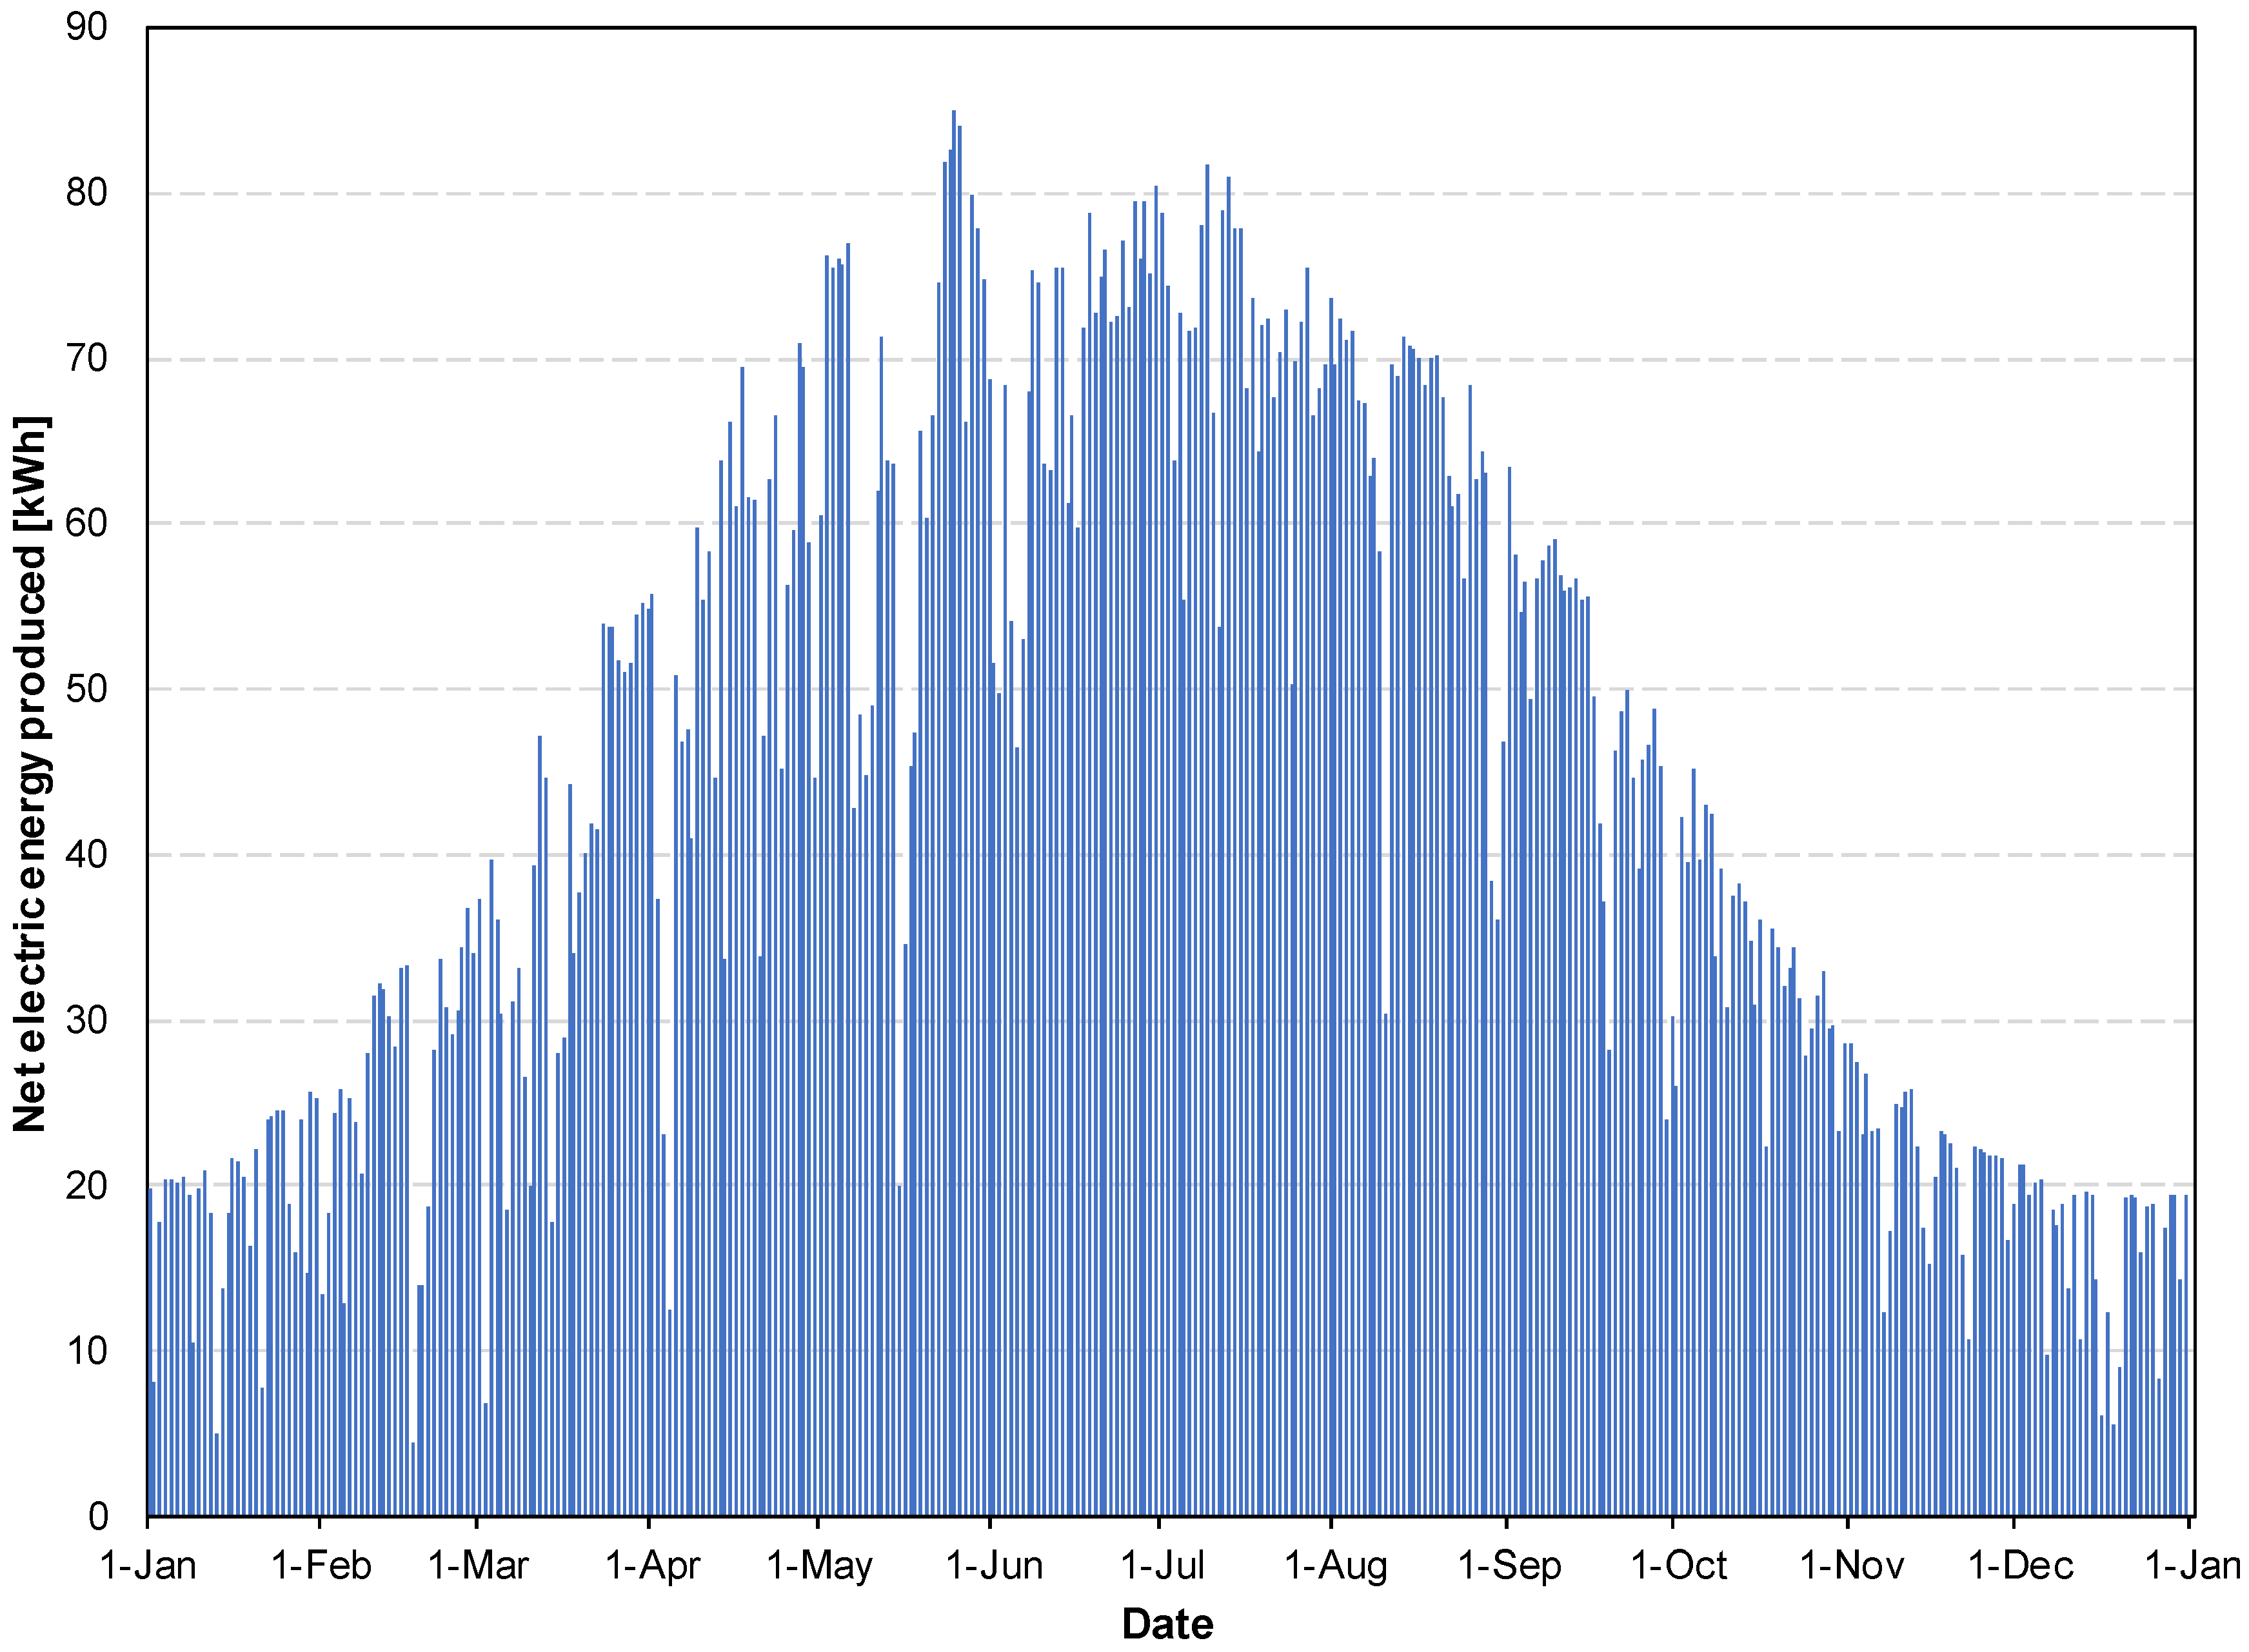
In order to broaden and expand the energy investigation, a photovoltaic plant on the flat roof of the low-rise building was assumed. The actual utilization of the available roof surface is aleatory for commercial buildings, ranging from 34% in Saudi Arabia [
37], 40 ÷ 50% in Ireland [
38] and 62% in Germany [
39]; thus, an average value of 45% (i.e., a surface of 416 m
2) was set and a fixed panel efficiency of 21.7% was assumed. Based on the EnergyPlus built-in weather data and considering an inverter efficiency of 95%, the electric energy supplied by the photovoltaic plant during the whole year was 109.7 MWh.
Figure 7 depicts the hourly energy net production.
Furthermore, with the aim of comparing the final and primary energy demand, another HVAC layout, which consisted of a 150 kW heat pump with a 3.52 COP for heating purposes and a 3.1 COP heat pump for DHW production, was included for each work shift case; the two analyzed HVAC layouts are summarized in
Table 6.
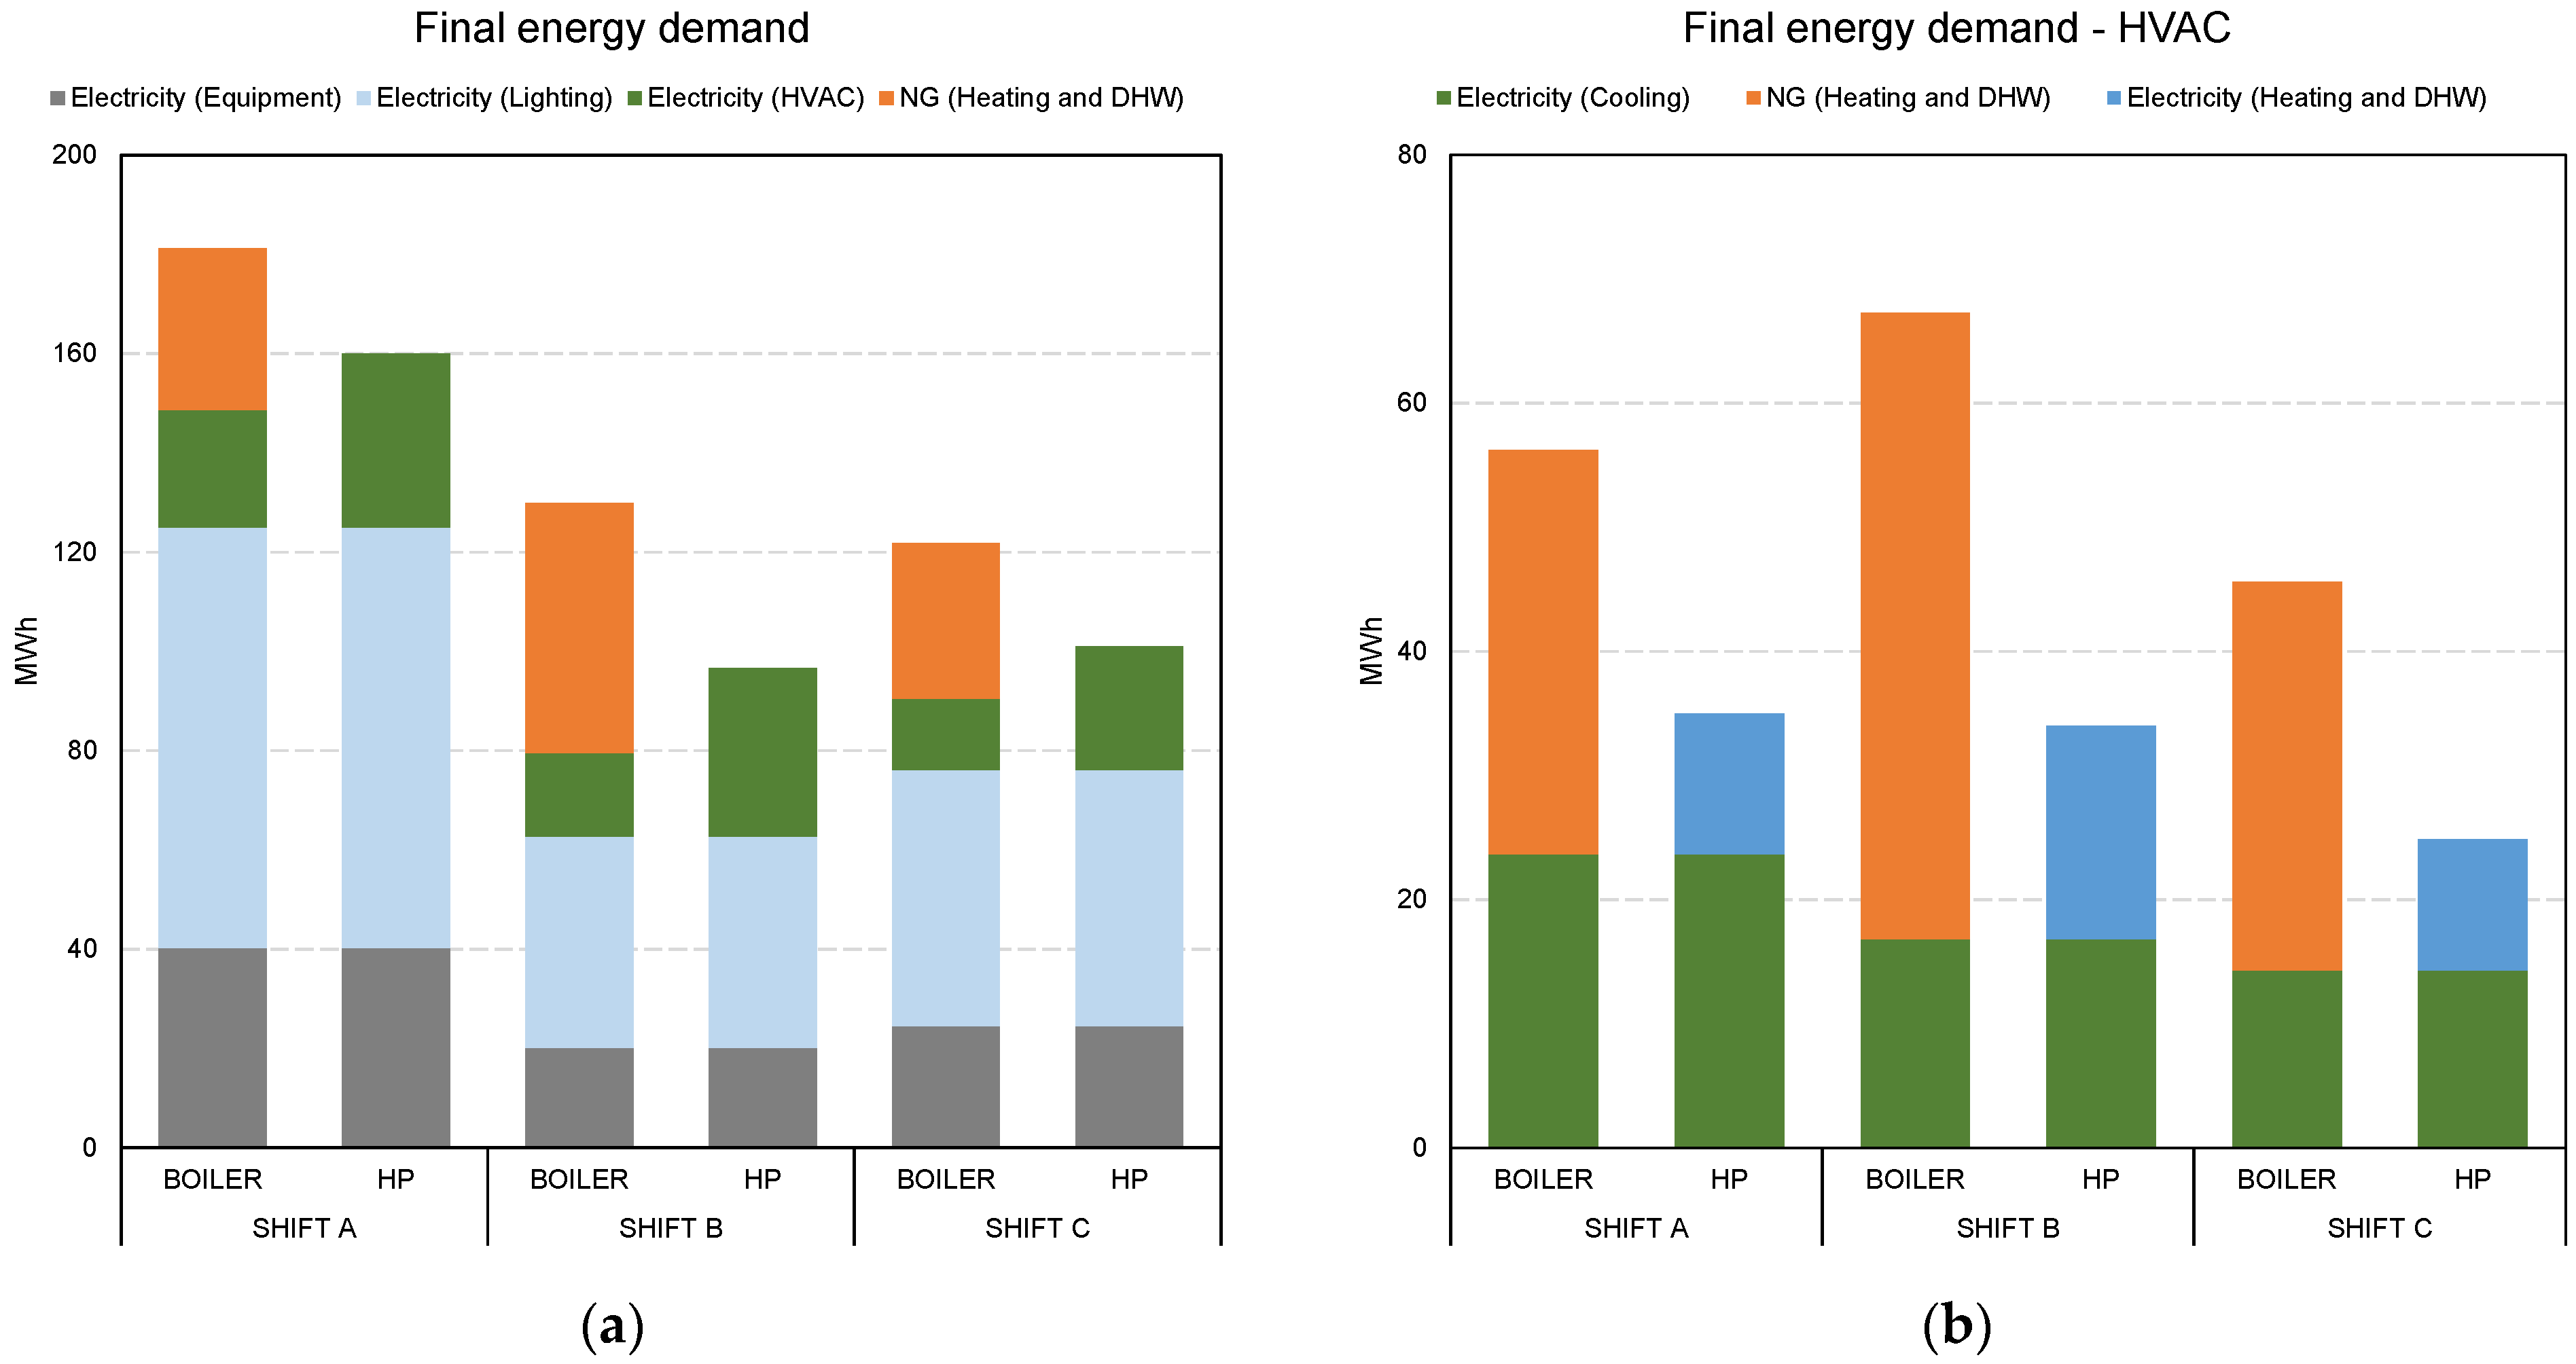
The final energy demand of the two HVAC layouts for the three work shifts is shown in
Figure 8a. The energy demand is composed of both natural gas and electricity, which is further divided into equipment, lighting, and HVAC. As expected, for each work shift, the amount of electric energy for the equipment and lighting was the same, while the HVAC share varied; moreover, natural gas was used for the boiler layout and it was entirely substituted by an additional electricity load for the HP layout.
Figure 8b focuses on the HVAC consumption and evidently shows that the additional electric energy was lower than the natural gas for each case due to the difference between the HP coefficient of performance and the boiler efficiency. The benefit of the heat pump deployment can be observed by comparing the final energy of the three shifts in
Figure 8a: for boiler layouts, the final energy of shift B was higher than shift C, although the latter required a higher electric energy for equipment and lighting, but switching to HP layouts, the final energy demand for shift C was slightly larger than shift B. As shown in
Figure 8b, the adoption of a heat pump reduced the shift B final energy demand for heating and DHW to almost the same value of cooling, notwithstanding the huge heating load depicted in
Figure 5a with yellow bars. The final energy demand for HVAC, as illustrated in
Figure 8b, leads to a further remark: the total HVAC demand for the shift A boiler was lower than the shift B boiler, but when the HP layout was used, the difference in terms of the final energy was negligible; again, the benefit of a high efficiency heat pump was considerable for the whole energy demand, and the higher the heating load, the larger the benefit.
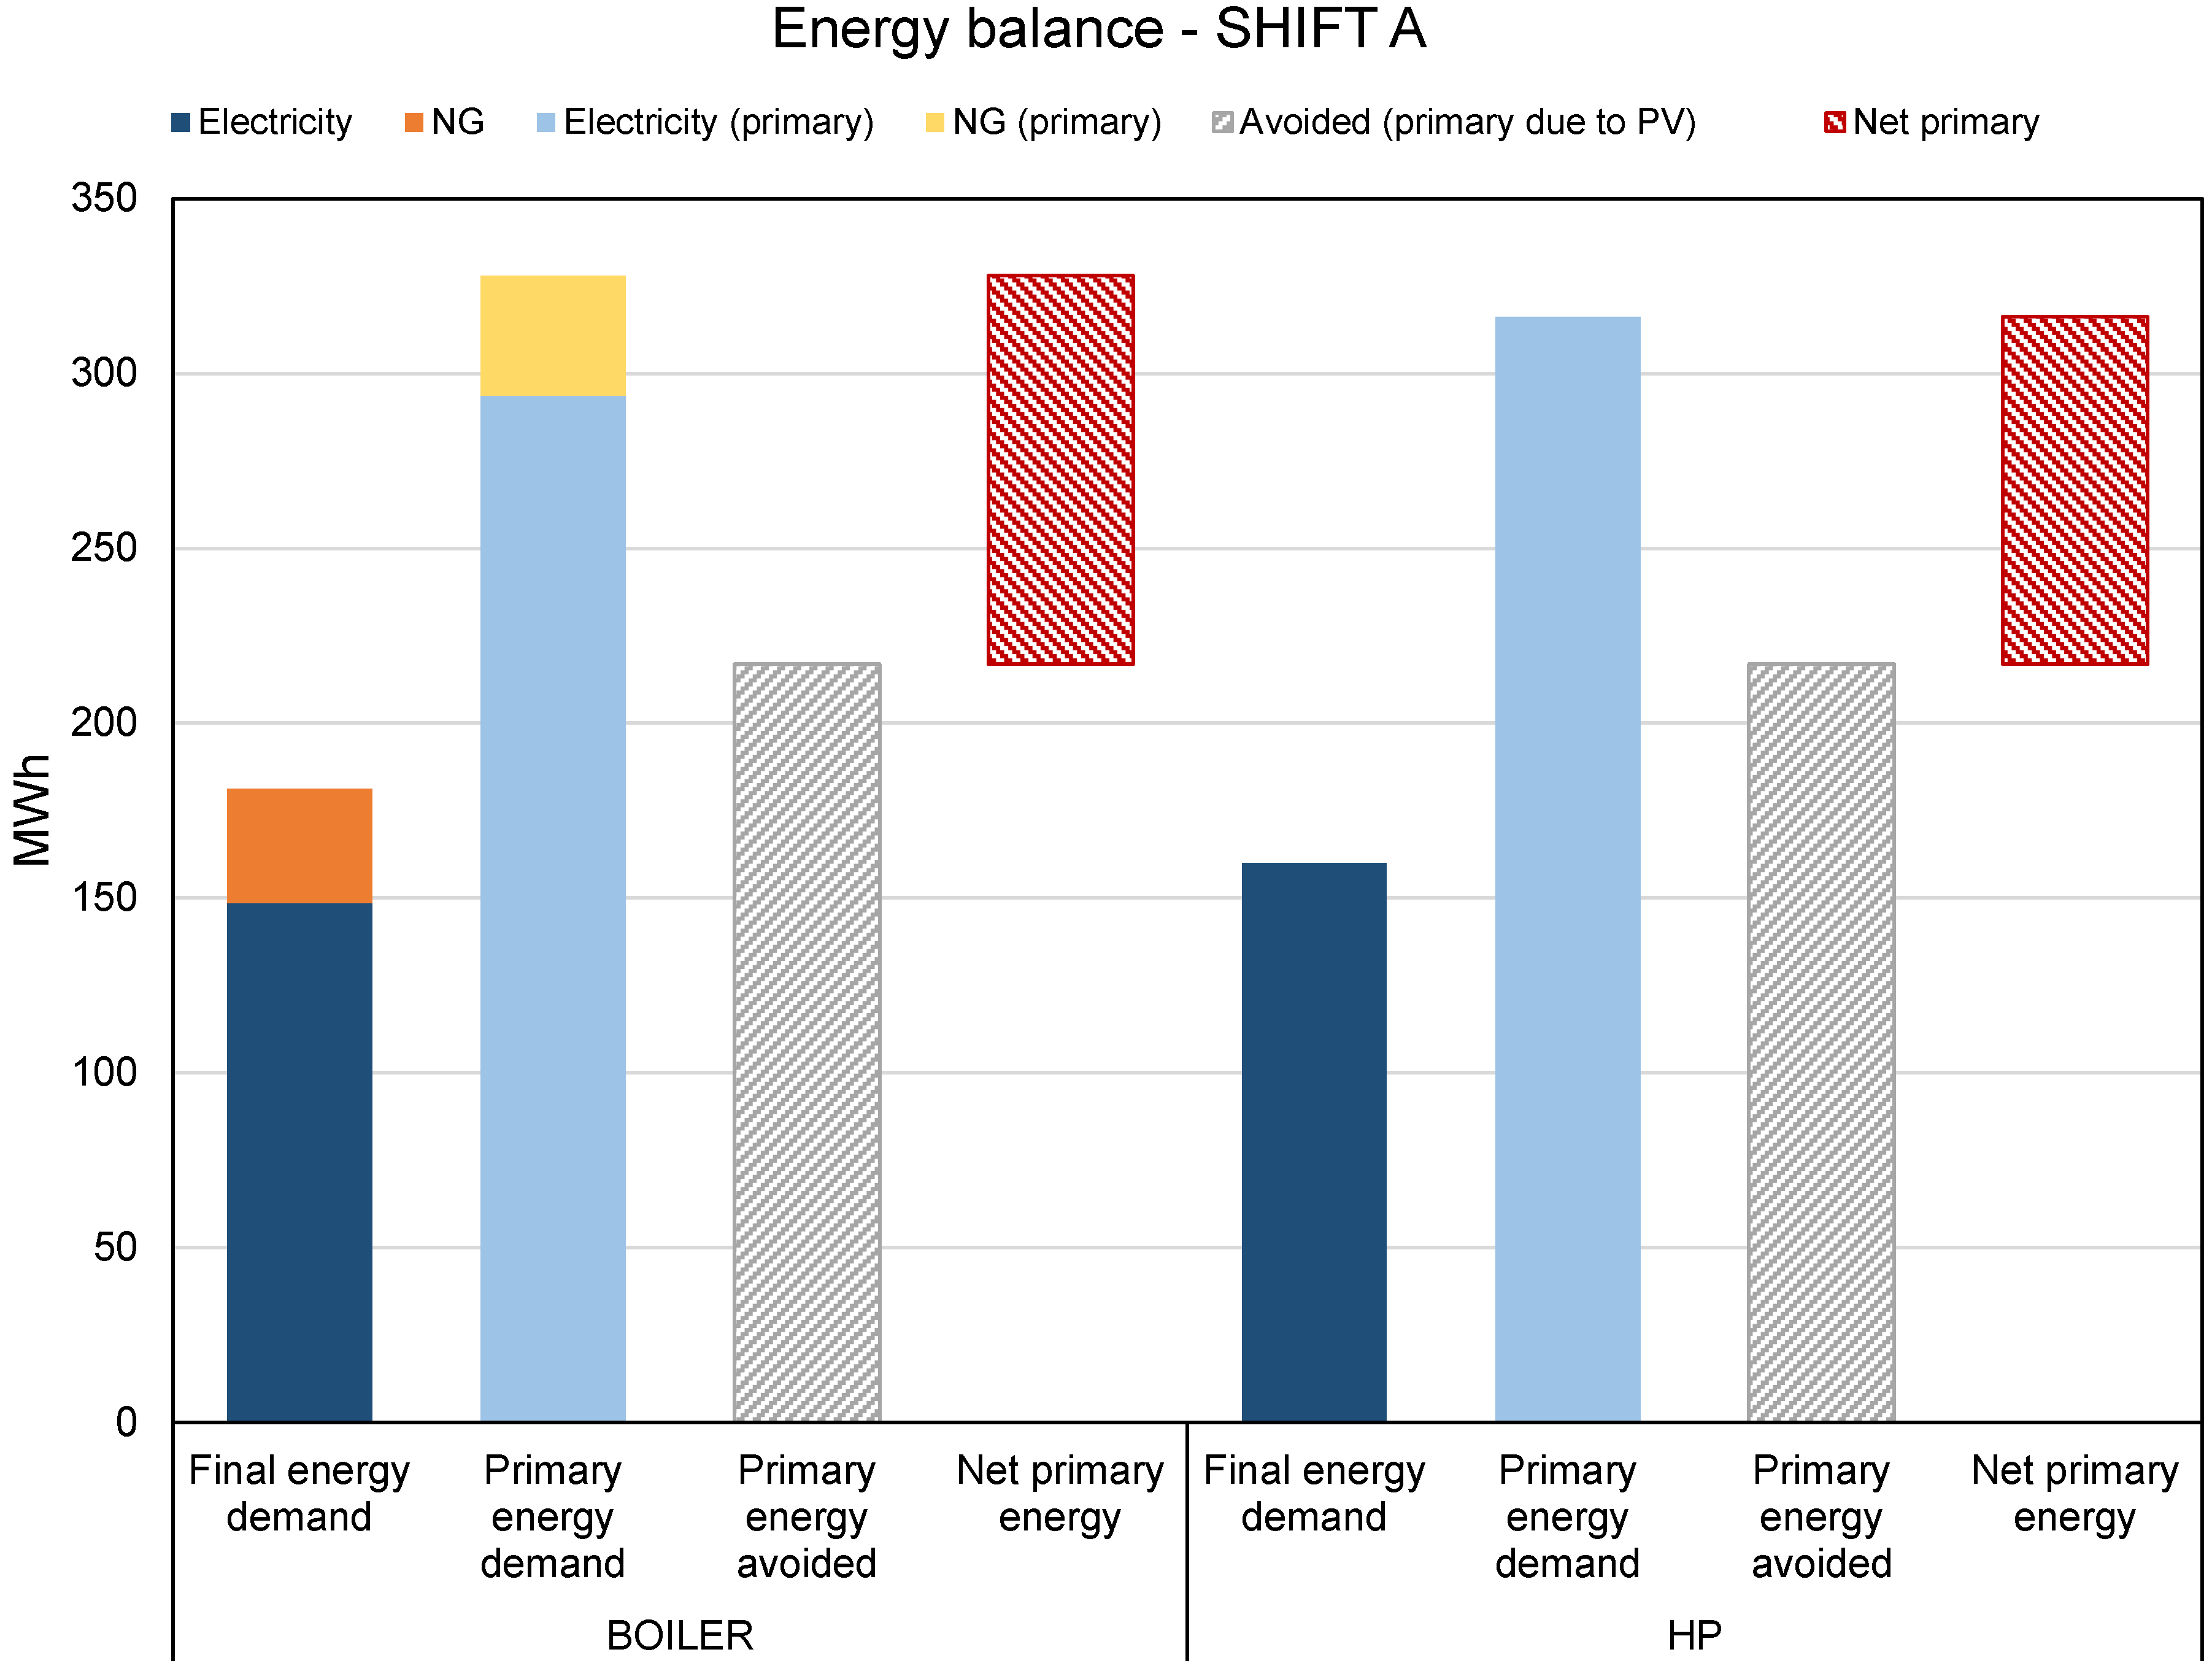
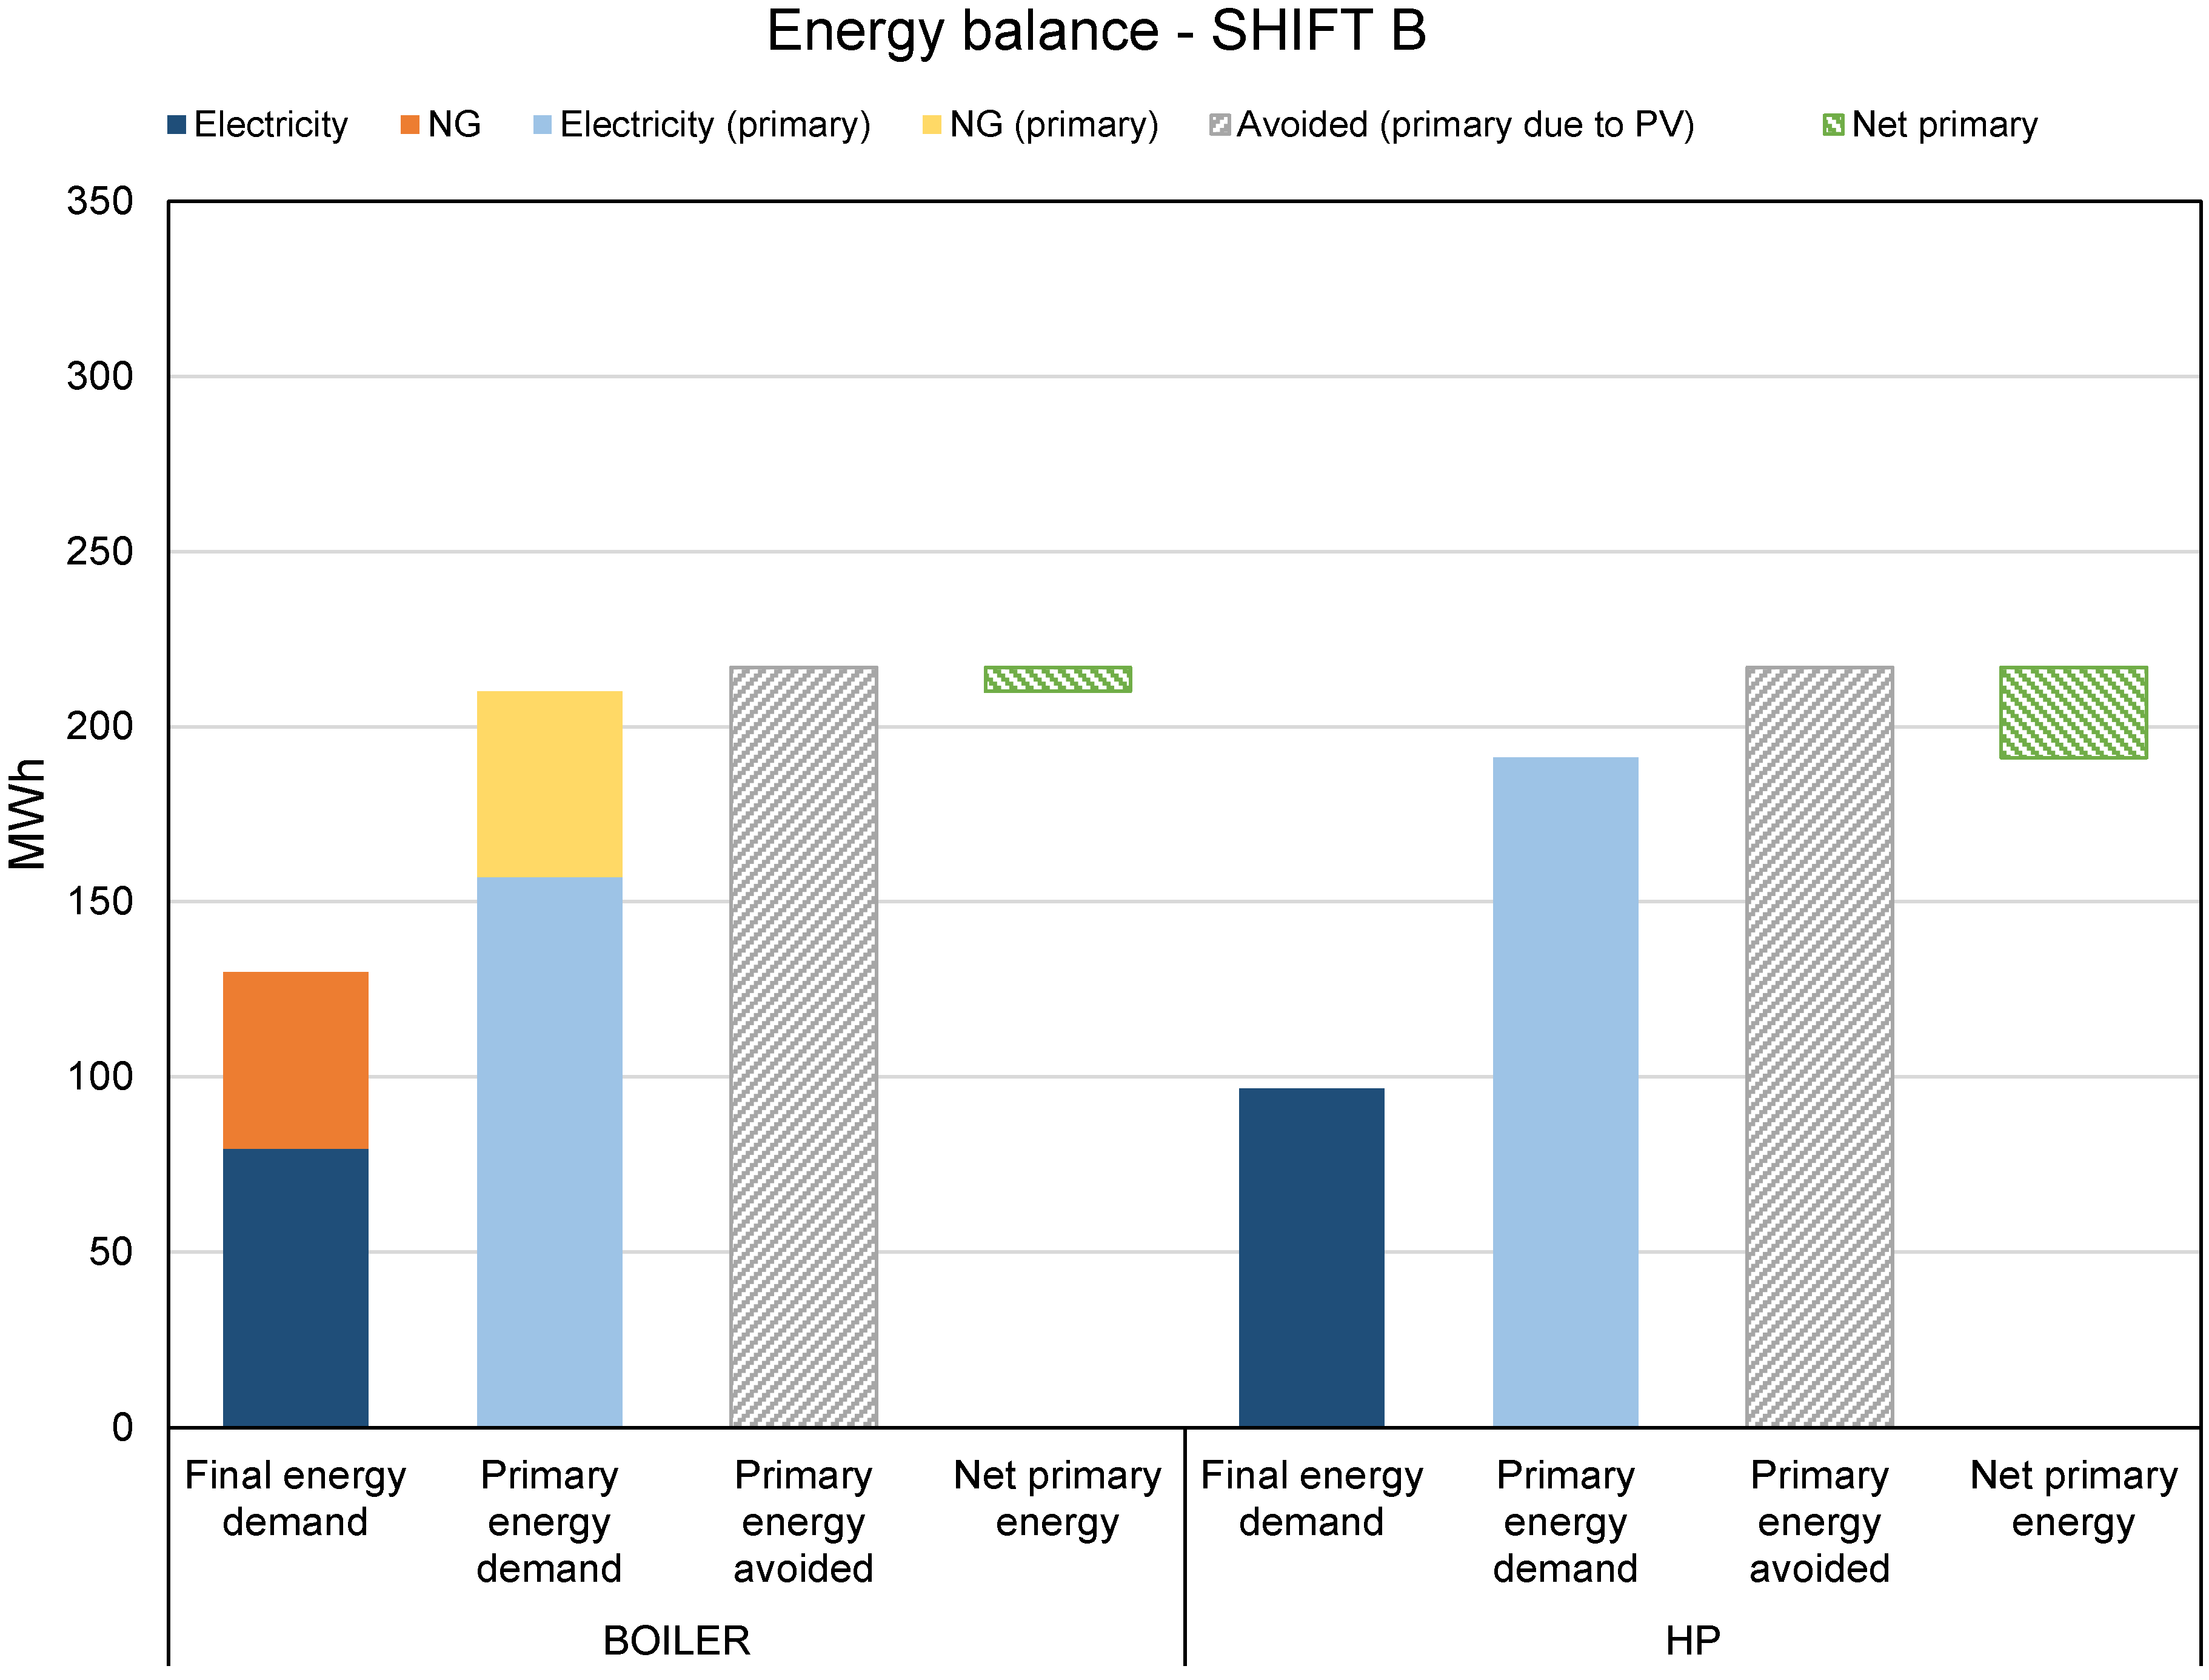
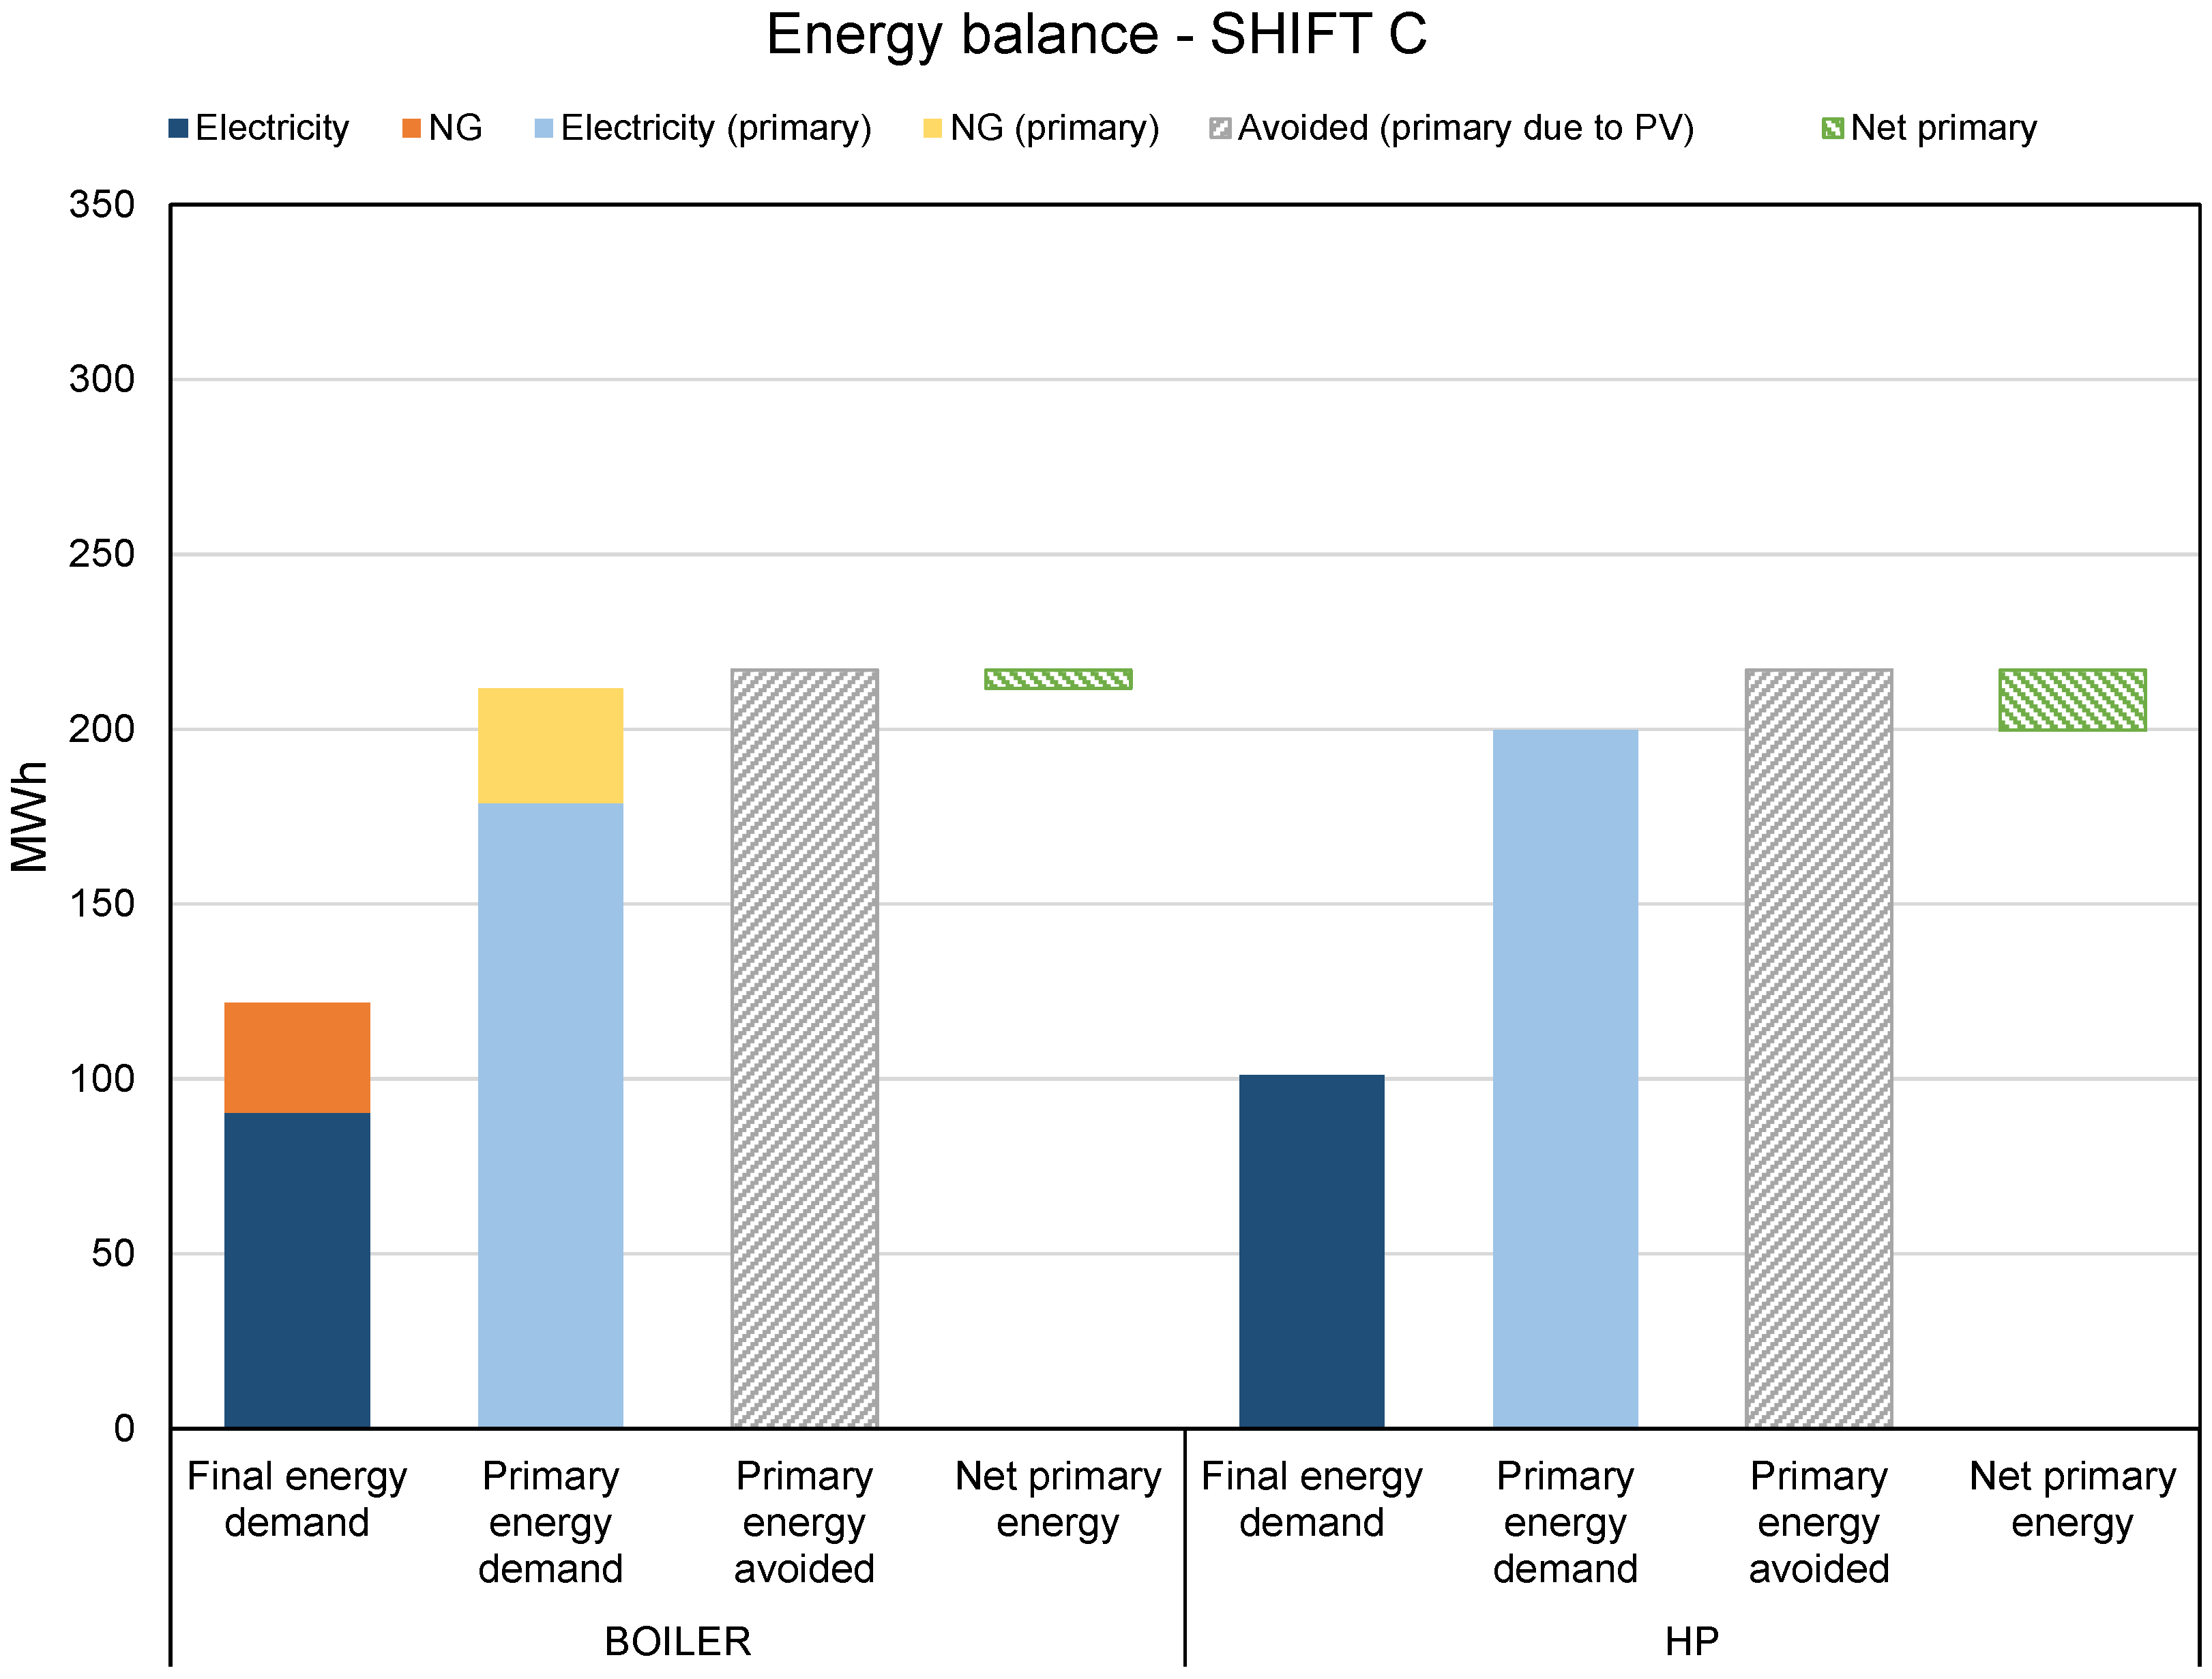
To assess the primary energy demand, the following conversion factors were identified: a 0.95 factor for natural gas [
31], and a value of 0.506 for the average Italian electricity generation efficiency [
40]. Accordingly, the comprehensive energy balance for the three work shifts is detailed in
Figure 9 for shift A, in
Figure 10 for shift B, and in
Figure 11 for shift C. Each figure depicts the energy balance with four columns for the two HVAC layouts:
- -
Final energy demand, made by electricity (blue) and natural gas (orange);
- -
Primary energy demand, calculated using the energy conversion factors for electricity (light blue) and natural gas (yellow);
- -
Primary energy avoided, related to the net electricity generated by the photovoltaic plant (gray hatched);
- -
Net primary energy, which represents the difference between the primary energy demand and the primary energy avoided, and it can be positive (red hatched) or negative (green hatched).
For all the studied cases, for a given work shift, the final and primary energy for the boiler layout was always greater than the HP layout. The primary energy avoided, obtained by dividing the electricity produced by the energy conversion factor, was fixed for all cases, since it only depends on the site location and not on the user load. Therefore, the lower primary demand of shifts B and C, compared to shift A, allowed for a positive balance of primary energy to be achieved, which was larger for the HP layout than the boiler layout. In particular, the balance of primary energy was the most favorable for shift B than shift C: for the boiler layout, shift B had a larger consumption of natural gas, whose energy conversion factor was more beneficial than that for electricity; for the HP layout, the reason beyond the larger final energy of shift C has been already discussed, and the consequently larger primary energy involves a lower positive balance.
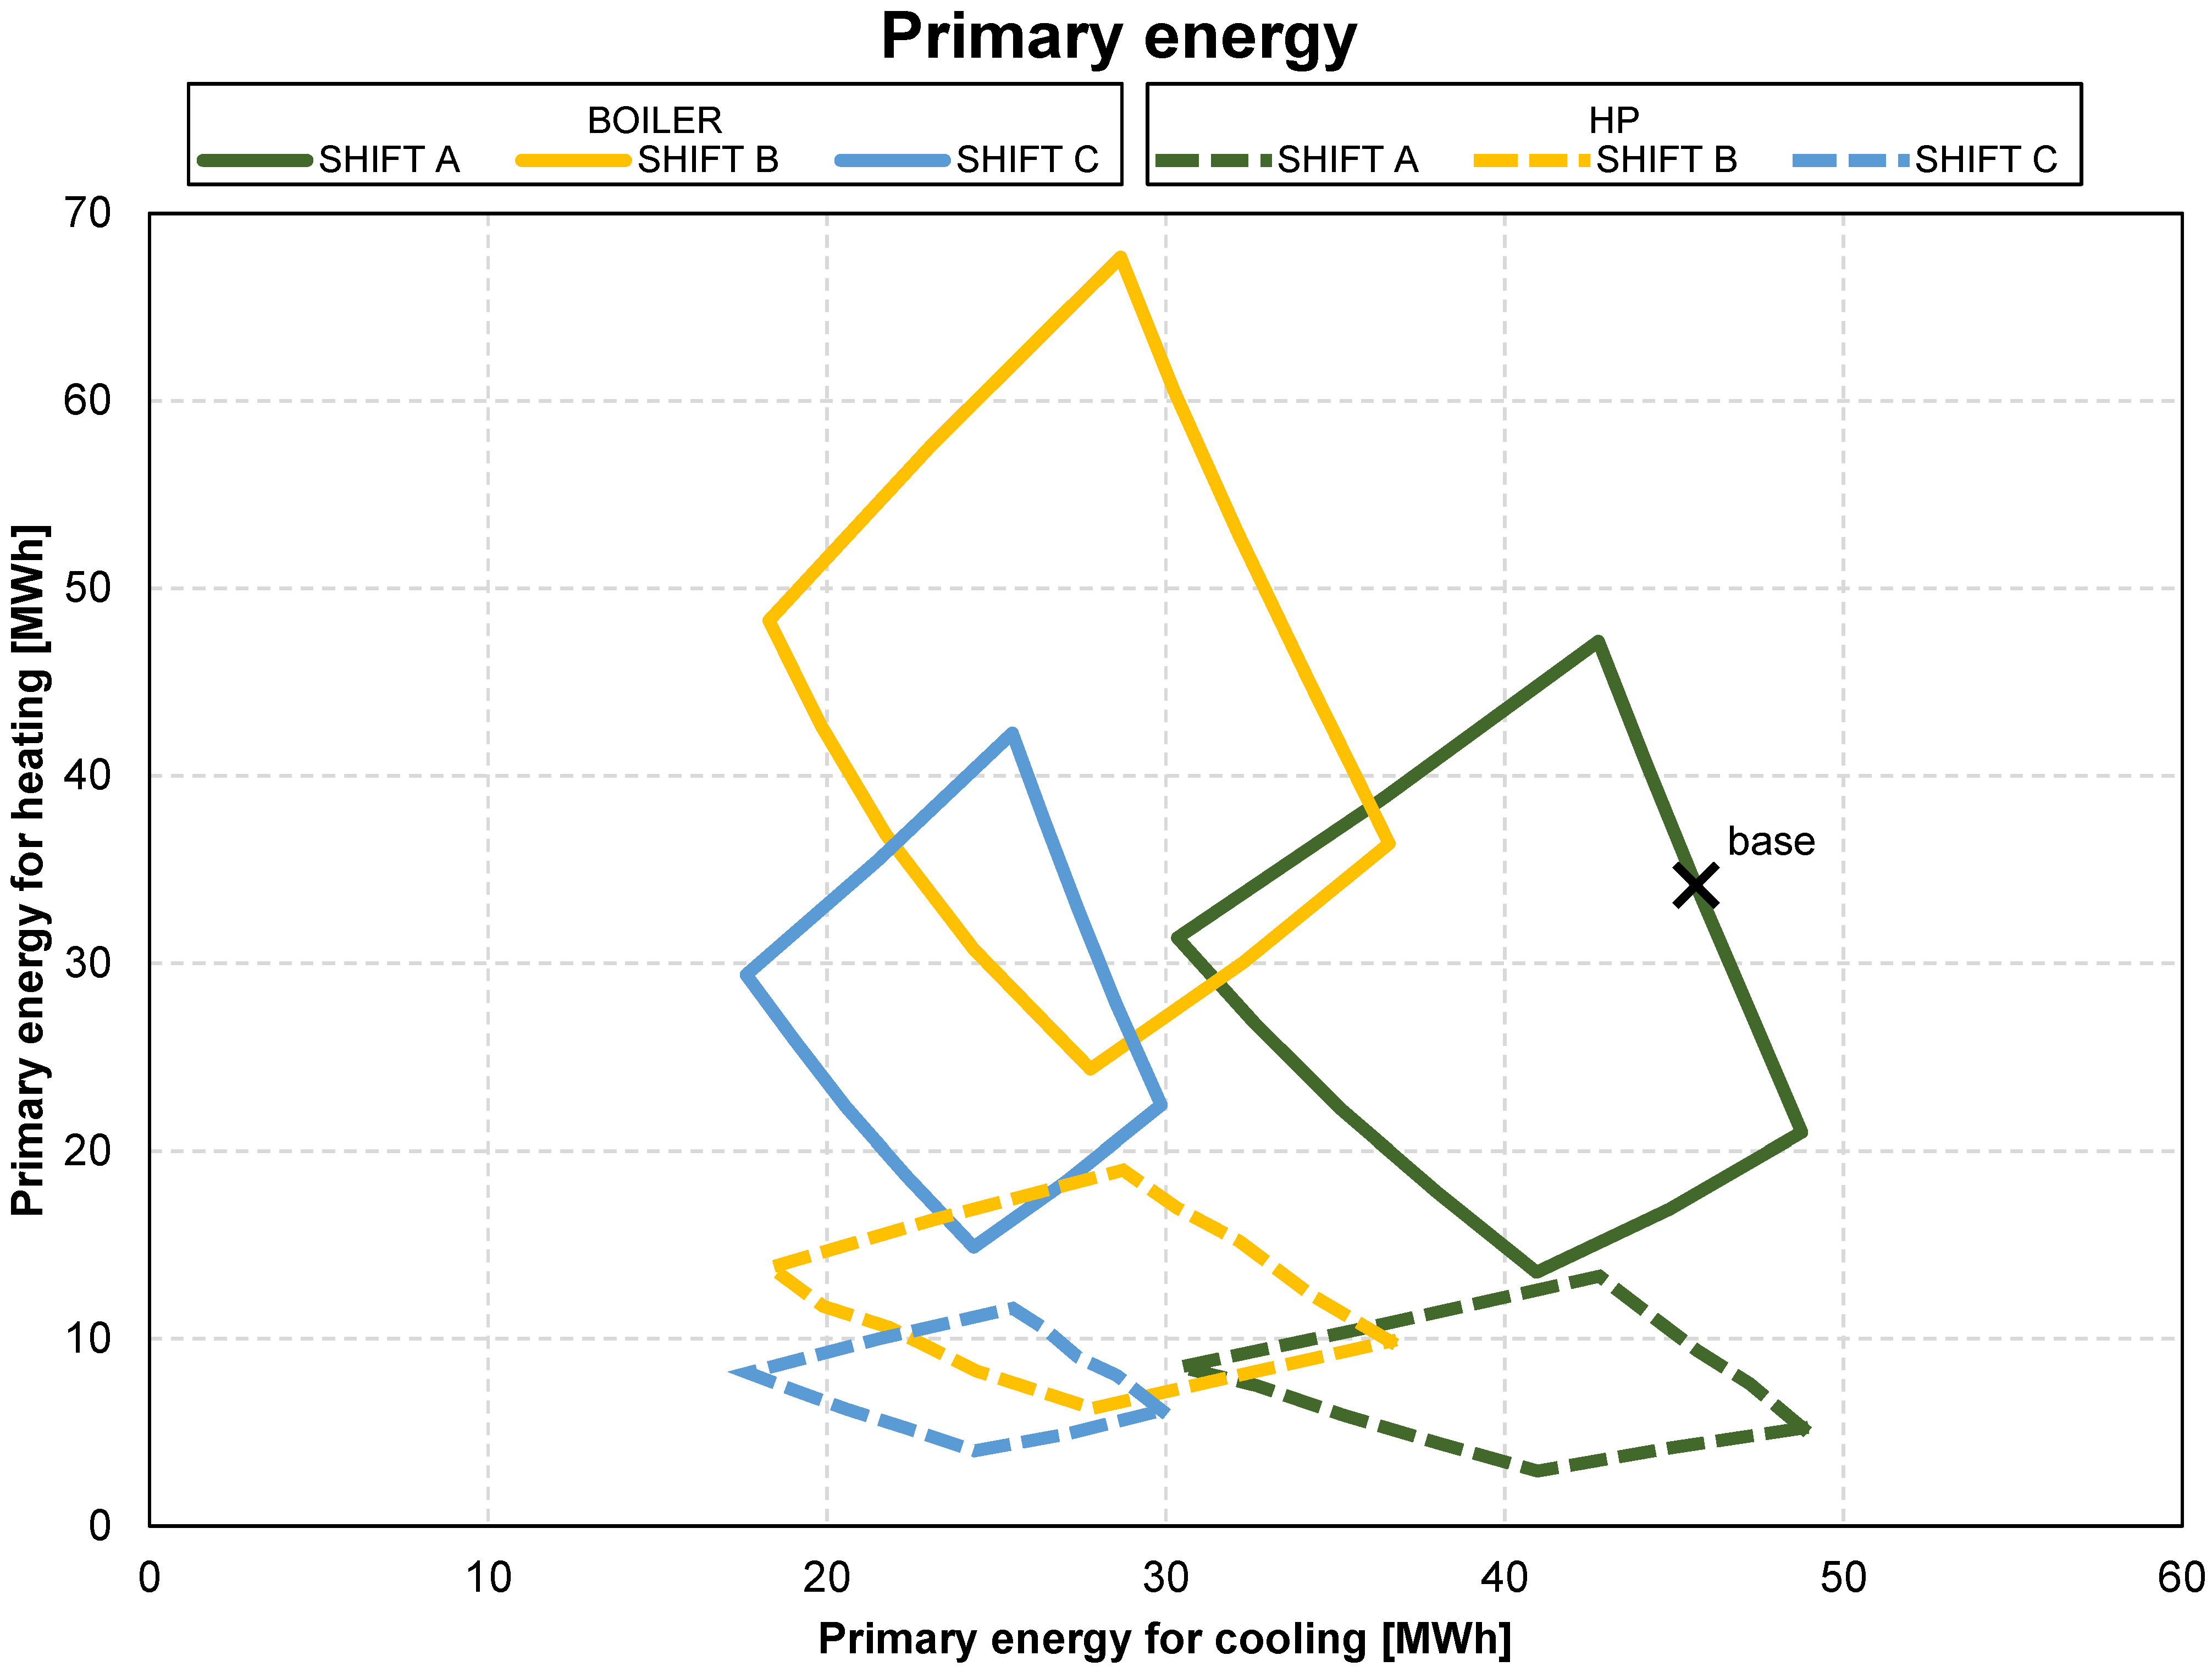
In
Figure 12, the parametric analysis based on the set-point temperature, work shifts, and infiltration rate, as shown in
Figure 6, was applied to map and compare the primary energy of both the boiler and HP layouts. The solid lines of
Figure 12 represent the primary energy pertinent to the boiler layout and the three dashed lines depict the primary energy of the HP layout; each work shift is characterized with one color for both layouts (i.e., green for shift A, yellow for shift B, and blue for shift C). As expected, for a fixed work shift, the primary energy for cooling was constant for both the boiler and HP due to the same plant, but the primary energy for heating was substantially different. In particular, to satisfy the same heating load, the HP layout needs an amount of primary energy that is at least 70% less than the boiler layout. Therefore, the opportunity of substituting a gas boiler with a heat pump should also be considered in terms of the primary energy.
5. Conclusions
This work proposes the mapping of the heating and cooling load of a building as a function of three low-effort boundary conditions (i.e., heating/cooling temperature set-point, infiltration rate, and work shift). These parameters represent the variables of a numerical model carried out with EnergyPlus-based software, the purpose of which was to assess the thermal loads and the energy consumption. This method was applied to a typical low-rise Italian office building from the late 1900, and although the thermal performance of the actual envelope could be improved, the proposed parametric analysis was based on three conditions whose change required low (infiltration rate) or no effort at all (set-point temperature and work shift). Enhancing the vertical and horizontal walls with new insulating materials or thermal coatings is expensive and troublesome, although it leads to significant performance gain, while the present work focused on inexpensive measures.
The thermal load maps resulting from the parametric analysis provided an immediate picture of the energy demand for space heating and cooling achievable by changing the proposed low-effort conditions. The set-point temperature for both seasons arose as a key factor to control the thermal load, allowing a load reduction of up to 40% for heating and up to 30% for cooling, unlike the airtightness, which had a stronger effect on the heating load than on cooling. Concerning the impact of different work shifts, the reduction in the working days (shift C) had a more substantial influence on the energy demand compared to the reduction in the office occupancy (shift B). Indeed, shift B involved a raise in the heating load up to 82% for T
set,h = 18 °C, although it could reduce the cooling load close to 50% compared to shift A for T
set,c = 28 °C; work shift C, on the other hand, showed the most favorable pairs of heating and cooling demand, with heating loads close to the lowest of shift A and cooling loads close to the lowest of shift B, as depicted in
Figure 6, standing out as the shift with optimal thermal loads. The work organization based on three working days implies a larger adoption of “work from home” arrangement, whose effectiveness in terms of work–life balance has already been demonstrated [
41] as well as the increase in job satisfaction and employee well-being [
42]. Regarding the environmental aspect, despite currently being a topic of great interest because there are many elements to be considered (e.g., commuting distance, private/public transport, HVAC plants, local emission factors, building insulation), enhancing remote working wherever possible could be a win–win pattern for both the employers and employees, in addition to the reduction in the energy consumption and greenhouse gas emissions related to the workers’ transport [
43]. Furthermore, at the public sector level, the outdated remote working barriers such as diffidence and “presence culture” should be overcome: as stated in [
44], strong leaderships and ongoing communication when teleworking strengthen the administration resilience and improve the job effectiveness by granting autonomy on the working operation. It must be underlined that teleworkers could be affected by feelings of isolation and a lack of connection with colleagues and, to make WFH effective, employees should learn to connect and communicate with each other on both a professional and personal level. Moreover, companies should comprehend that the workers’ presence is not a mandatory component of success and, at the same time, the difference between working in an office and at home should not be undervalued [
45].
Finally, the primary energy represents a major element that should be considered when comprehensive energy analyses are performed. As shown in
Figure 12, to satisfy the same thermal load, different plants can be used, each of which is characterized by an energy vector and a conversion efficiency: despite electricity being the carrier with the highest energy conversion factor, the coefficient of performance of the heat pumps was far better than the gas boilers based on the state-of-the-art. Therefore, the electric heat pump option for room heating appears to be the optimal approach from an environmental point of view [
22,
42]. Thus, the primary energy investigation generally suggests all-electric plants as being the most favorable, although it has been shown that, in some cases, plants supplied by natural gas also achieve a noticeable primary energy balance.
The purpose of the present work was to describe the thermal load mapping method and to discuss its application on a typical non-residential building. Therefore, the results of the application should not be considered pertinent to all building types, at least not before a relevant case has been studied. Future research could apply the mapping method to buildings with different features such as intended use, envelope, location, and orientation.


