Article

Overviewing Global Surface Temperature Changes Regarding CO2 Emission, Population Density, and Energy Consumption in the Industry: Policy Suggestions

1
Department of Banking and Finance, Tamkang University, No. 151, Yingzhuan Road, Tamsui District, New Taipei City 25137, Taiwan
2
Department of Banking and Finance, Chinese Culture University, No. 55, Hwa-Kang Road, Yang-Ming-Shan, Taipei City 11114, Taiwan
*
Author to whom correspondence should be addressed.
Sustainability 2023, 15(8), 7013; https://doi.org/10.3390/su15087013
Submission received: 5 March 2023 / Revised: 12 April 2023 / Accepted: 20 April 2023 / Published: 21 April 2023
(This article belongs to the Special Issue Sustainable Development Goals and Role of Energy)

Abstract

:
The focus of this study is to investigate the causal relationships between global surface temperature changes and various relevant economy-related factors and to provide a clearer regime for authorities. The study reveals that the growth rate of production-based CO2 productivity and energy consumption in industrial, service, and transport sectors positively correlates with global surface temperature changes, aggravating the problem in the long run. However, it is evident that, on the one hand, the energy efficiency of industrial and service sectors needs to be highly scrutinized to address the mitigation issues of global surface temperature change. On the other hand, the contributions of the agricultural and transport sectors are not obvious due to their bidirectional causal relationships with respect to global surface temperature changes. Thus, improving energy efficiency and consumption in these sectors should also be a significant concern. Furthermore, the study highlights the positive causal relationship between population density and the contribution of renewable energy to global surface temperature change. Although population density aggravates the issue, the use of renewable energy confronts it. The contribution from empirical evidence presented in this study emphasizes the need for industries to improve their energy efficiency and consumption in order to mitigate global surface temperature changes.

1. Introduction

Despite efforts made via international agreements such as the Kyoto Protocol and the Paris Agreement, the global surface temperature continues to rise (as shown in Figure 1). Measuring energy use contributions to global surface temperature change is challenging due to the varying developmental levels of industry sectors and their inherent environmental conditions. The pattern of logical relationships between global surface temperature change and energy consumption in different industry sectors remains unclear. This study aims to address these research gaps by investigating causal relationships between CO2 emissions, energy consumption in various industry sectors, population density, and renewable electricity generation concerning global surface temperature change.
This study adopts a panel regression model to analyze the causal relationships between production-based CO2 productivity and global surface temperature change. The study further investigates the pattern of logical relationships between global surface temperature change and energy consumption in different industry sectors for three time periods, namely a 30-year period (1990–2019), a 20-year period (2000–2019), and a 10-year period (2010–2019). The study identifies the contributions from each industrial sector with respect to global surface temperature change for each time period. The role of population density and the growth rate of renewable electricity generation in confronting global surface temperature change and reducing CO2 emissions are also examined.
This study provides empirical evidence that CO2 emissions constitute the opportunity cost of economic growth, and economic growth remains a priority. This study also provides evidence that energy consumption in the industrial and service sectors exacerbates global surface temperature changes in the long run, but their contributions to confronting global surface temperature changes can be observed. This study recognizes that contributions to mitigating global surface temperature changes from the transport and agricultural sectors are not apparent due to their bidirectional causal relationship with global surface temperature changes. Additionally, this study finds that increased temperatures may intensify the energy consumption of the population leading to concentrated CO2 emissions, highlighting the need to address population density in confronting global surface temperature change. Finally, this study provides empirical evidence that the contributions to renewable energy adoption are clearly beneficial for mitigating global surface temperature changes.
The main contribution of this study is a comprehensive analysis of the causal relationships between CO2 emissions, energy consumption in different industry sectors, population density, and renewable electricity generation relative to global surface temperature change. The study provides empirical evidence that addressing CO2 emissions and energy consumption in the industrial and service sectors is vital for mitigating global surface temperature changes. Additionally, the study emphasizes the importance of addressing population density and increasing the adoption of renewable energy. The findings of this study can provide policymakers with empirical suggestions and solutions for regulating CO2 emissions and promoting sustainable energy practices.
This study is organized as follows. Section 2 provides a comprehensive theoretical framework of the analysis and suggestions regarding CO2 emissions and global surface temperature change. Section 3 introduces the methodology, including an introduction to the panel regression model, data, and the definitions of each variable. Section 4 describes and discusses empirical results. Finally, Section 5 provides the conclusions of this study.

2. Theoretical Framework

First, this study discusses various methods for minimizing CO2 emissions in different sectors, as CO2 is the most prevalent greenhouse gas (GHG). GHGs trap heat in the Earth’s atmosphere, resulting in the greenhouse effect, which warms the planet. In different sectors, from wide-ranging discussions, a comprehensive theoretical framework of suggestions is provided. Later, as renewable energy is the widely acknowledged solution to global surface temperature change, this study focuses on advanced research on this essential energy resource.

2.1. Various Solutions to CO2 Emissions

Environmental pollution, which is caused by emissions of pollutants and greenhouse gases, has been the opportunity cost of economic growth since the industrial revolution in the 18th century; furthermore, environmental pollution and greenhouse gases are closely linked to CO2 emissions; as earlier studies have suggested, the interaction effect of economic aggregation and land use factors, including scale and intensity, causes a strong positive effect on CO2 emissions [1]. Human activities produce various pollutants, including CO2, which is a significant greenhouse gas. For example, deforestation and urbanization can lead to changes in land use, which in turn can result in the production of particulate matter such as PM2.5. These pollutants can become concentrated due to spatial and temporal clustering [2]. When GHG concentrations increase, more heat is trapped, leading to the greenhouse effect and, subsequently, surface temperature changes. Furthermore, the interactions between environmental pollution, CO2 emissions, and greenhouse gases can create feedback loops that amplify their effects.
Since CO2 is the most prevalent greenhouse gas emitted by human activities, many advanced research studies on the causal relationship between economic growth and CO2 emissions and energy consumption have been conducted in different regions, such as European countries, BRIC countries, and China [3,4,5].
Apart from the macroeconomic perspective, due to its high-intensity energy consumption and CO2 emissions, a discussion on industrial CO2 emissions is essential, and many studies have offered various suggestions. It is suggested that instead of mitigating the scale of industrial emissions of CO2 by regulations, controlling its intensity is more efficient [6]. Furthermore, after observing the economic impact of the 1997 Asian financial crisis and the ensuing changes in CO2 emissions, it can be seen that CO2 emissions may be reduced by optimizing the national input–output structure based on economic factors such as domestic demand and trade exports [7]. As a surplus in production can be eliminated, unnecessary CO2 emissions can be avoided. Nevertheless, an unexpected but essential result was provided, suggesting that CO2 emissions are positively correlated with energy efficiency if the scale of energy consumption exceeds the current capability of technology in CO2 reduction [8]. Based on this scenario, optimizing the energy consumption structure and reducing energy intensity for the industry sector can be a pathway to CO2 reduction. In addition, is has also been indicated that energy-saving technology is beneficial [9], but its effectiveness varies across regions; hence, the improvement and expansion of energy-saving technology should be considered a priority by relevant authorities.
This issue is frequently debated in the transport sector, as the green vehicle industry is still considered to be in its infancy, and its benefits may be overstated due to consumer preferences [10]. As the majority of transportation still relies on fossil fuels, most research has concentrated on energy efficiency and control, given the existing technological limitations in the transportation field. By emphasizing the heavy reliance on fossil-fuel energy in the transport sector and indicating that CO2 reduction in transport is more costly than in other sectors, implementing environmental taxes may change the relative costs of alternate energies [11]. In addition, although the cost of CO2 reduction is high, it can be reduced by increasing CO2 emissions efficiency [12]. As CO2 emissions are generated not only from the transport sector but also from almost all human activities, urban planning and spatial optimization have been pointed out as potential solutions [13], which may increase the operating efficiency in transport and other sectors and, hence, reduce CO2 emissions. In addition, optimizing energy consumption structures with further regulations on vehicle populations can be considered under economic concerns [14].
The agriculture sector is complicated because it includes various types of industries. In short, it contains the food chain and forestry industries, and whereas the former is a major source of CO2 emissions and water pollution [15], the latter is a major source of CO2 reduction. Most studies have focused on the former topic, as nitrogen fertilizer used for agricultural production is one of the major sources of CO2 emissions; therefore, a higher value-added tax on fertilizer and the promotion of organic fertilizer are beneficial for the issue [16]. Similar results have been proposed worldwide, and various suggestions have been offered, such as optimizing agricultural land utilization [17].
From studies on CO2 emissions, the causes and the corresponding solutions, which are most costly in terms of time and money, seem to differ from place to place due to differences in environmental conditions and development levels in each sector. Therefore, the innovation of renewable energy seems to be an ideal, practical, and universal solution, as fewer structural transformations and costs are needed in long-established industries.

2.2. Feasibility of Renewable Energy

Adopting renewable energy sources for energy consumption does not mean that CO2 and other GHG emissions can be completely eliminated; however, its comparative advantages are significant and have been highlighted by many researchers. Except for nuclear-based energy, renewable energy certainly emits less GHG than conventional energy resources [18].
As mentioned above, although renewable energy may be a universal solution, its efficiency can vary among different industry sectors. The potential of renewable energy in the agricultural sector can be noted, although evidence varies. From the research focusing on North African countries, CO2 emissions increase in the long run as renewable energy consumption increases, but renewable energy consumption further escalates value-added agriculture, which eventually reduces CO2 emissions and strengthens GDP. Therefore, as the net outcome of an increase in renewable energy is valuable, relevant authorities should encourage the adoption of renewable energy [19]. On the other hand, a study in India strongly supported the adoption of renewable energy together with ISO 14001 due to its feasibility in CO2 reduction [20]. In addition, a similar result has been presented in China [21].
To summarize, the issue of global surface temperature change from CO2 emissions is extremely complicated, and different scenarios can be found in different regions and industries. Consequently, by recognizing the cost efficiency of renewable energy with respect to time and money in the long run, this study focuses on renewable energy and seeks to estimate its feasibility in addressing global surface temperature changes.

3. Methodology

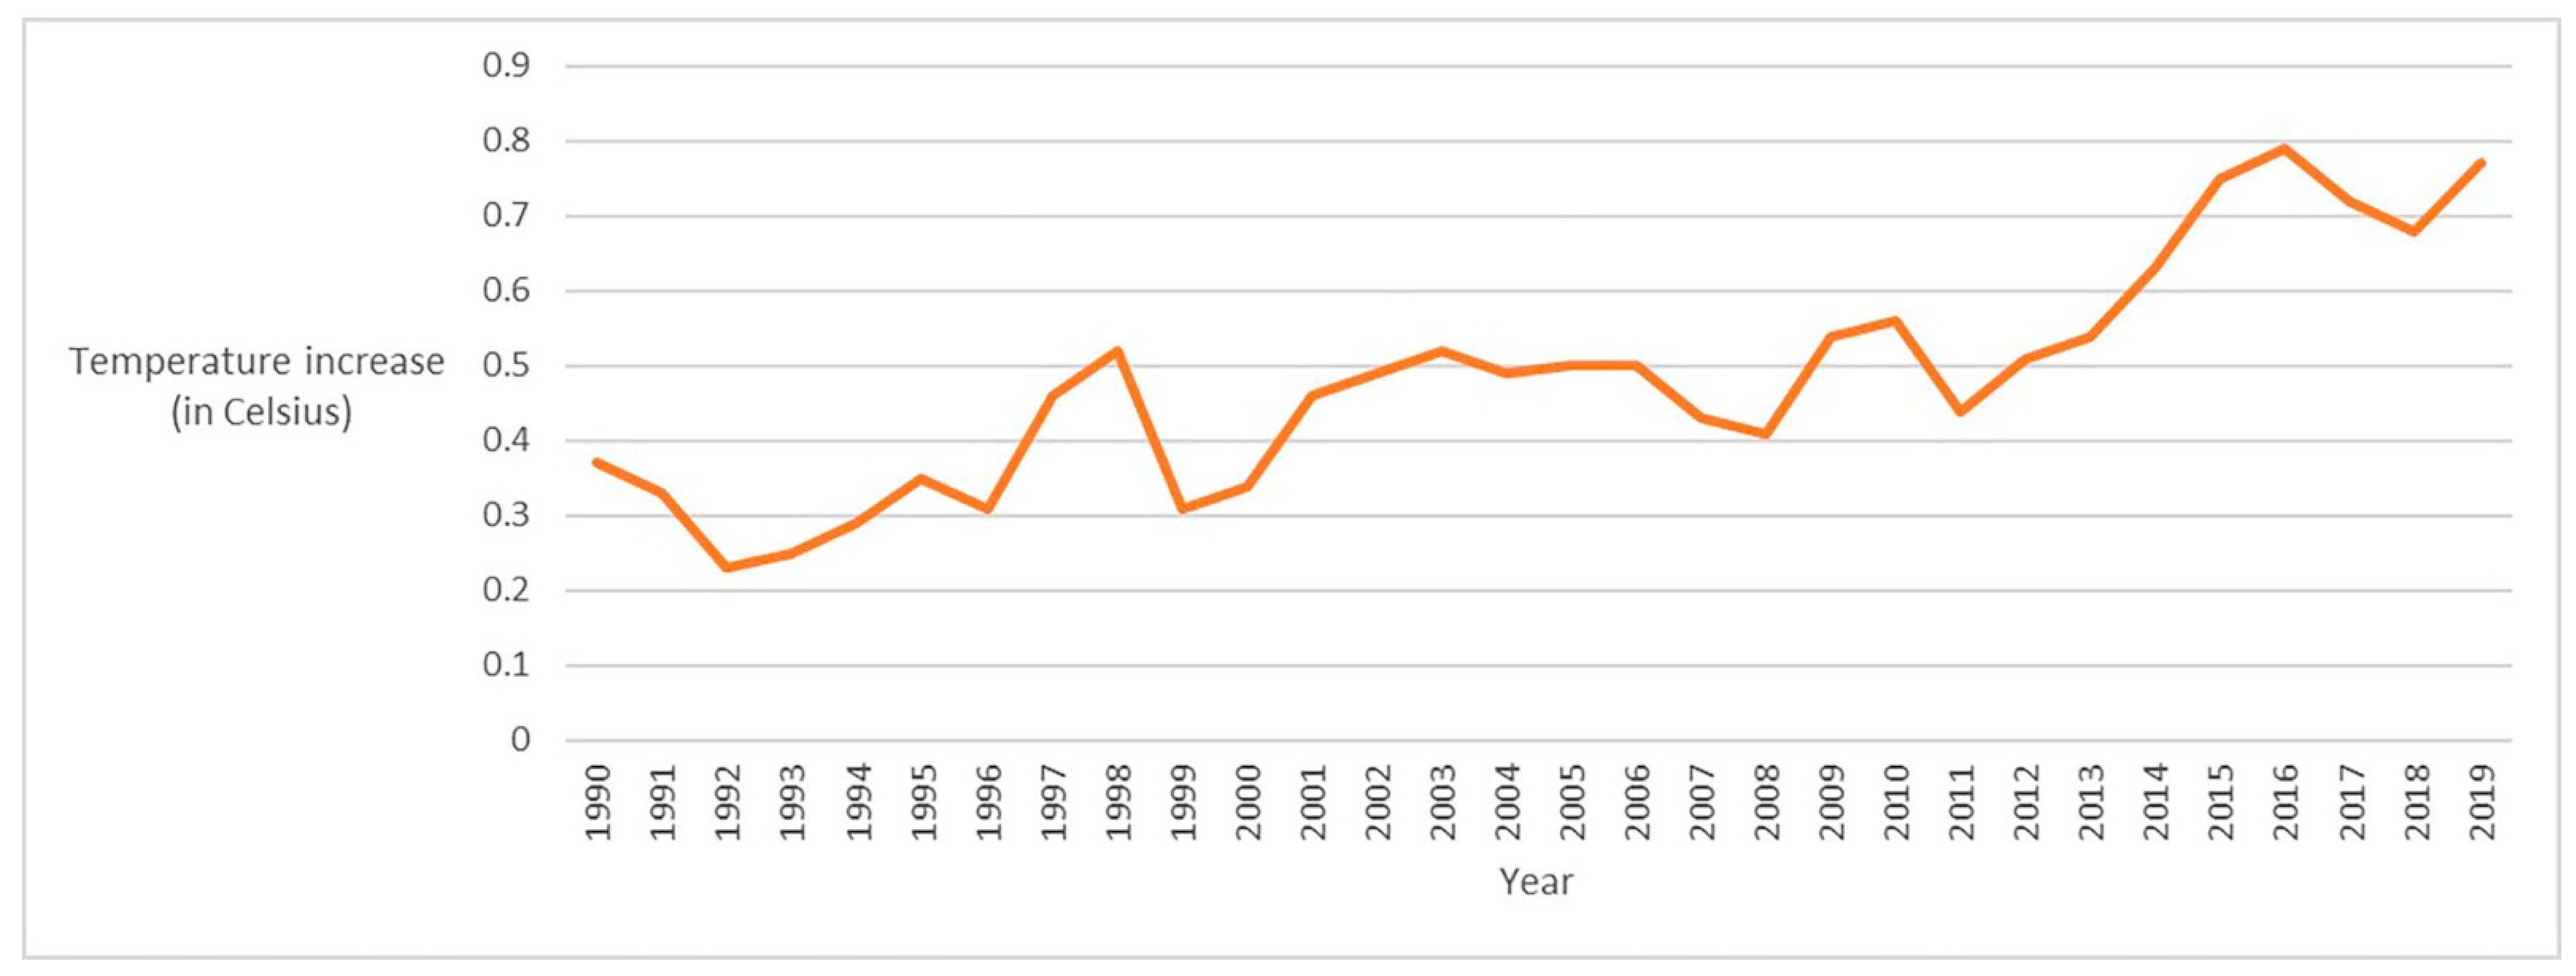
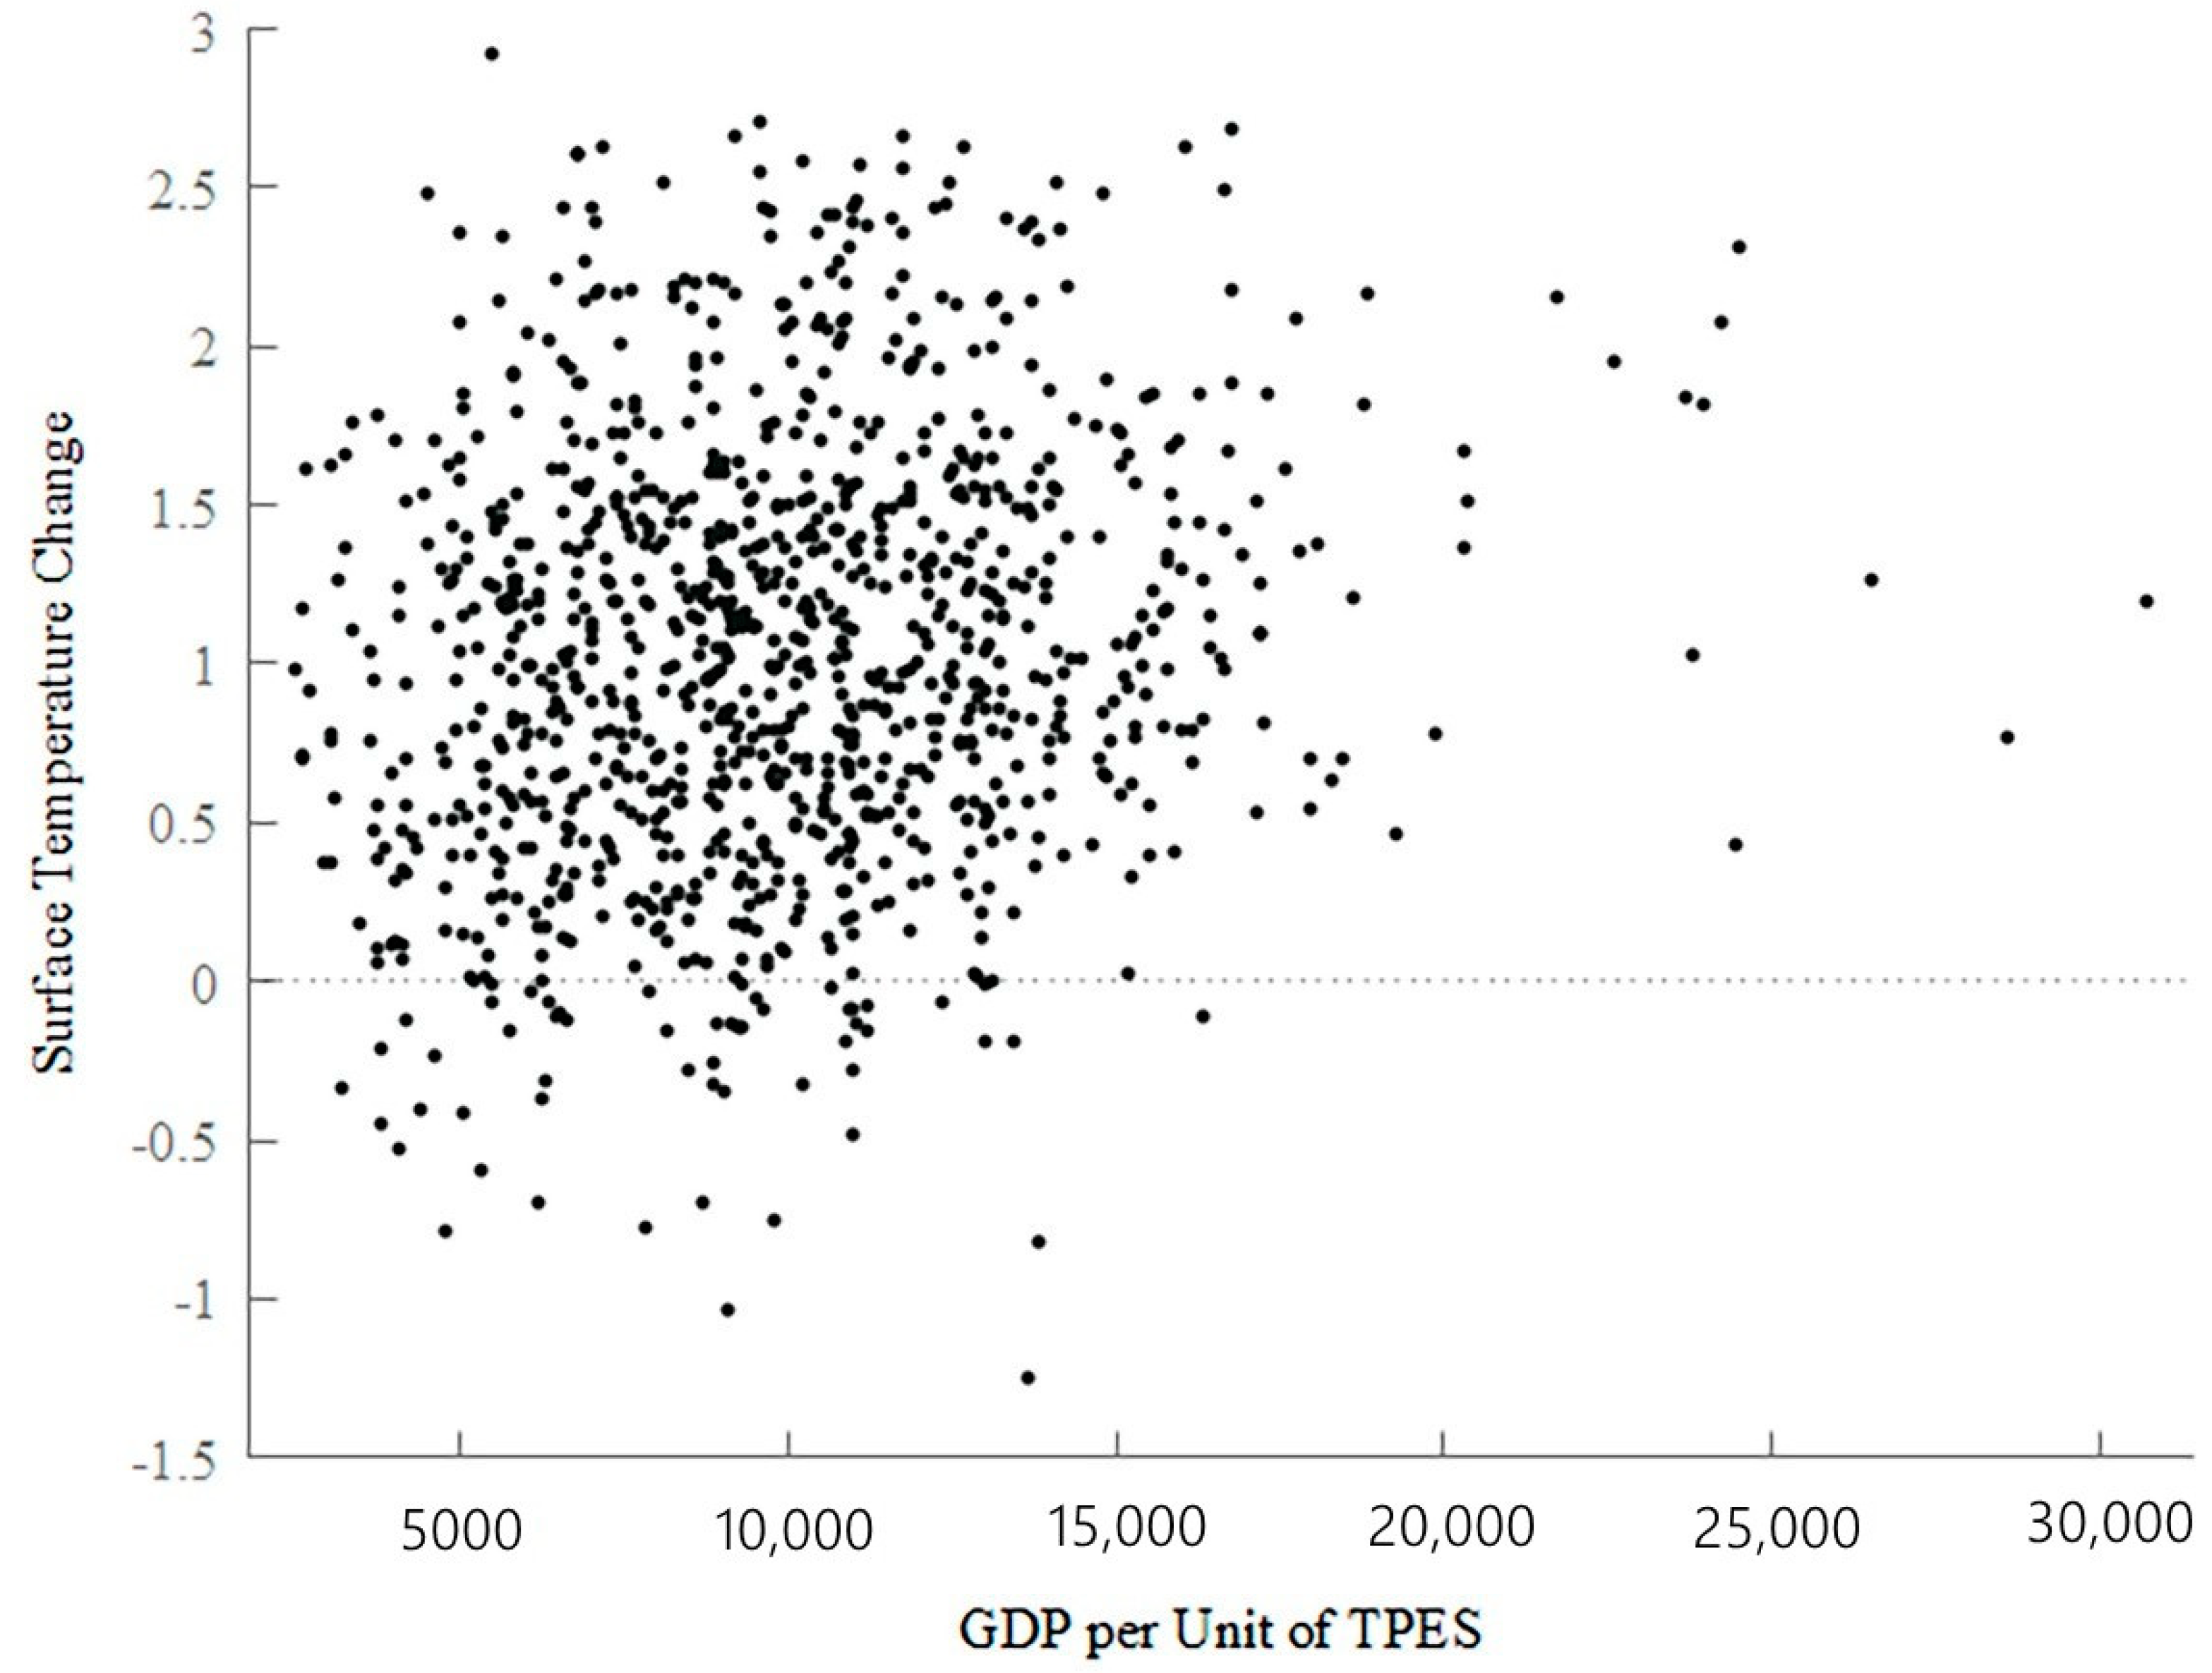
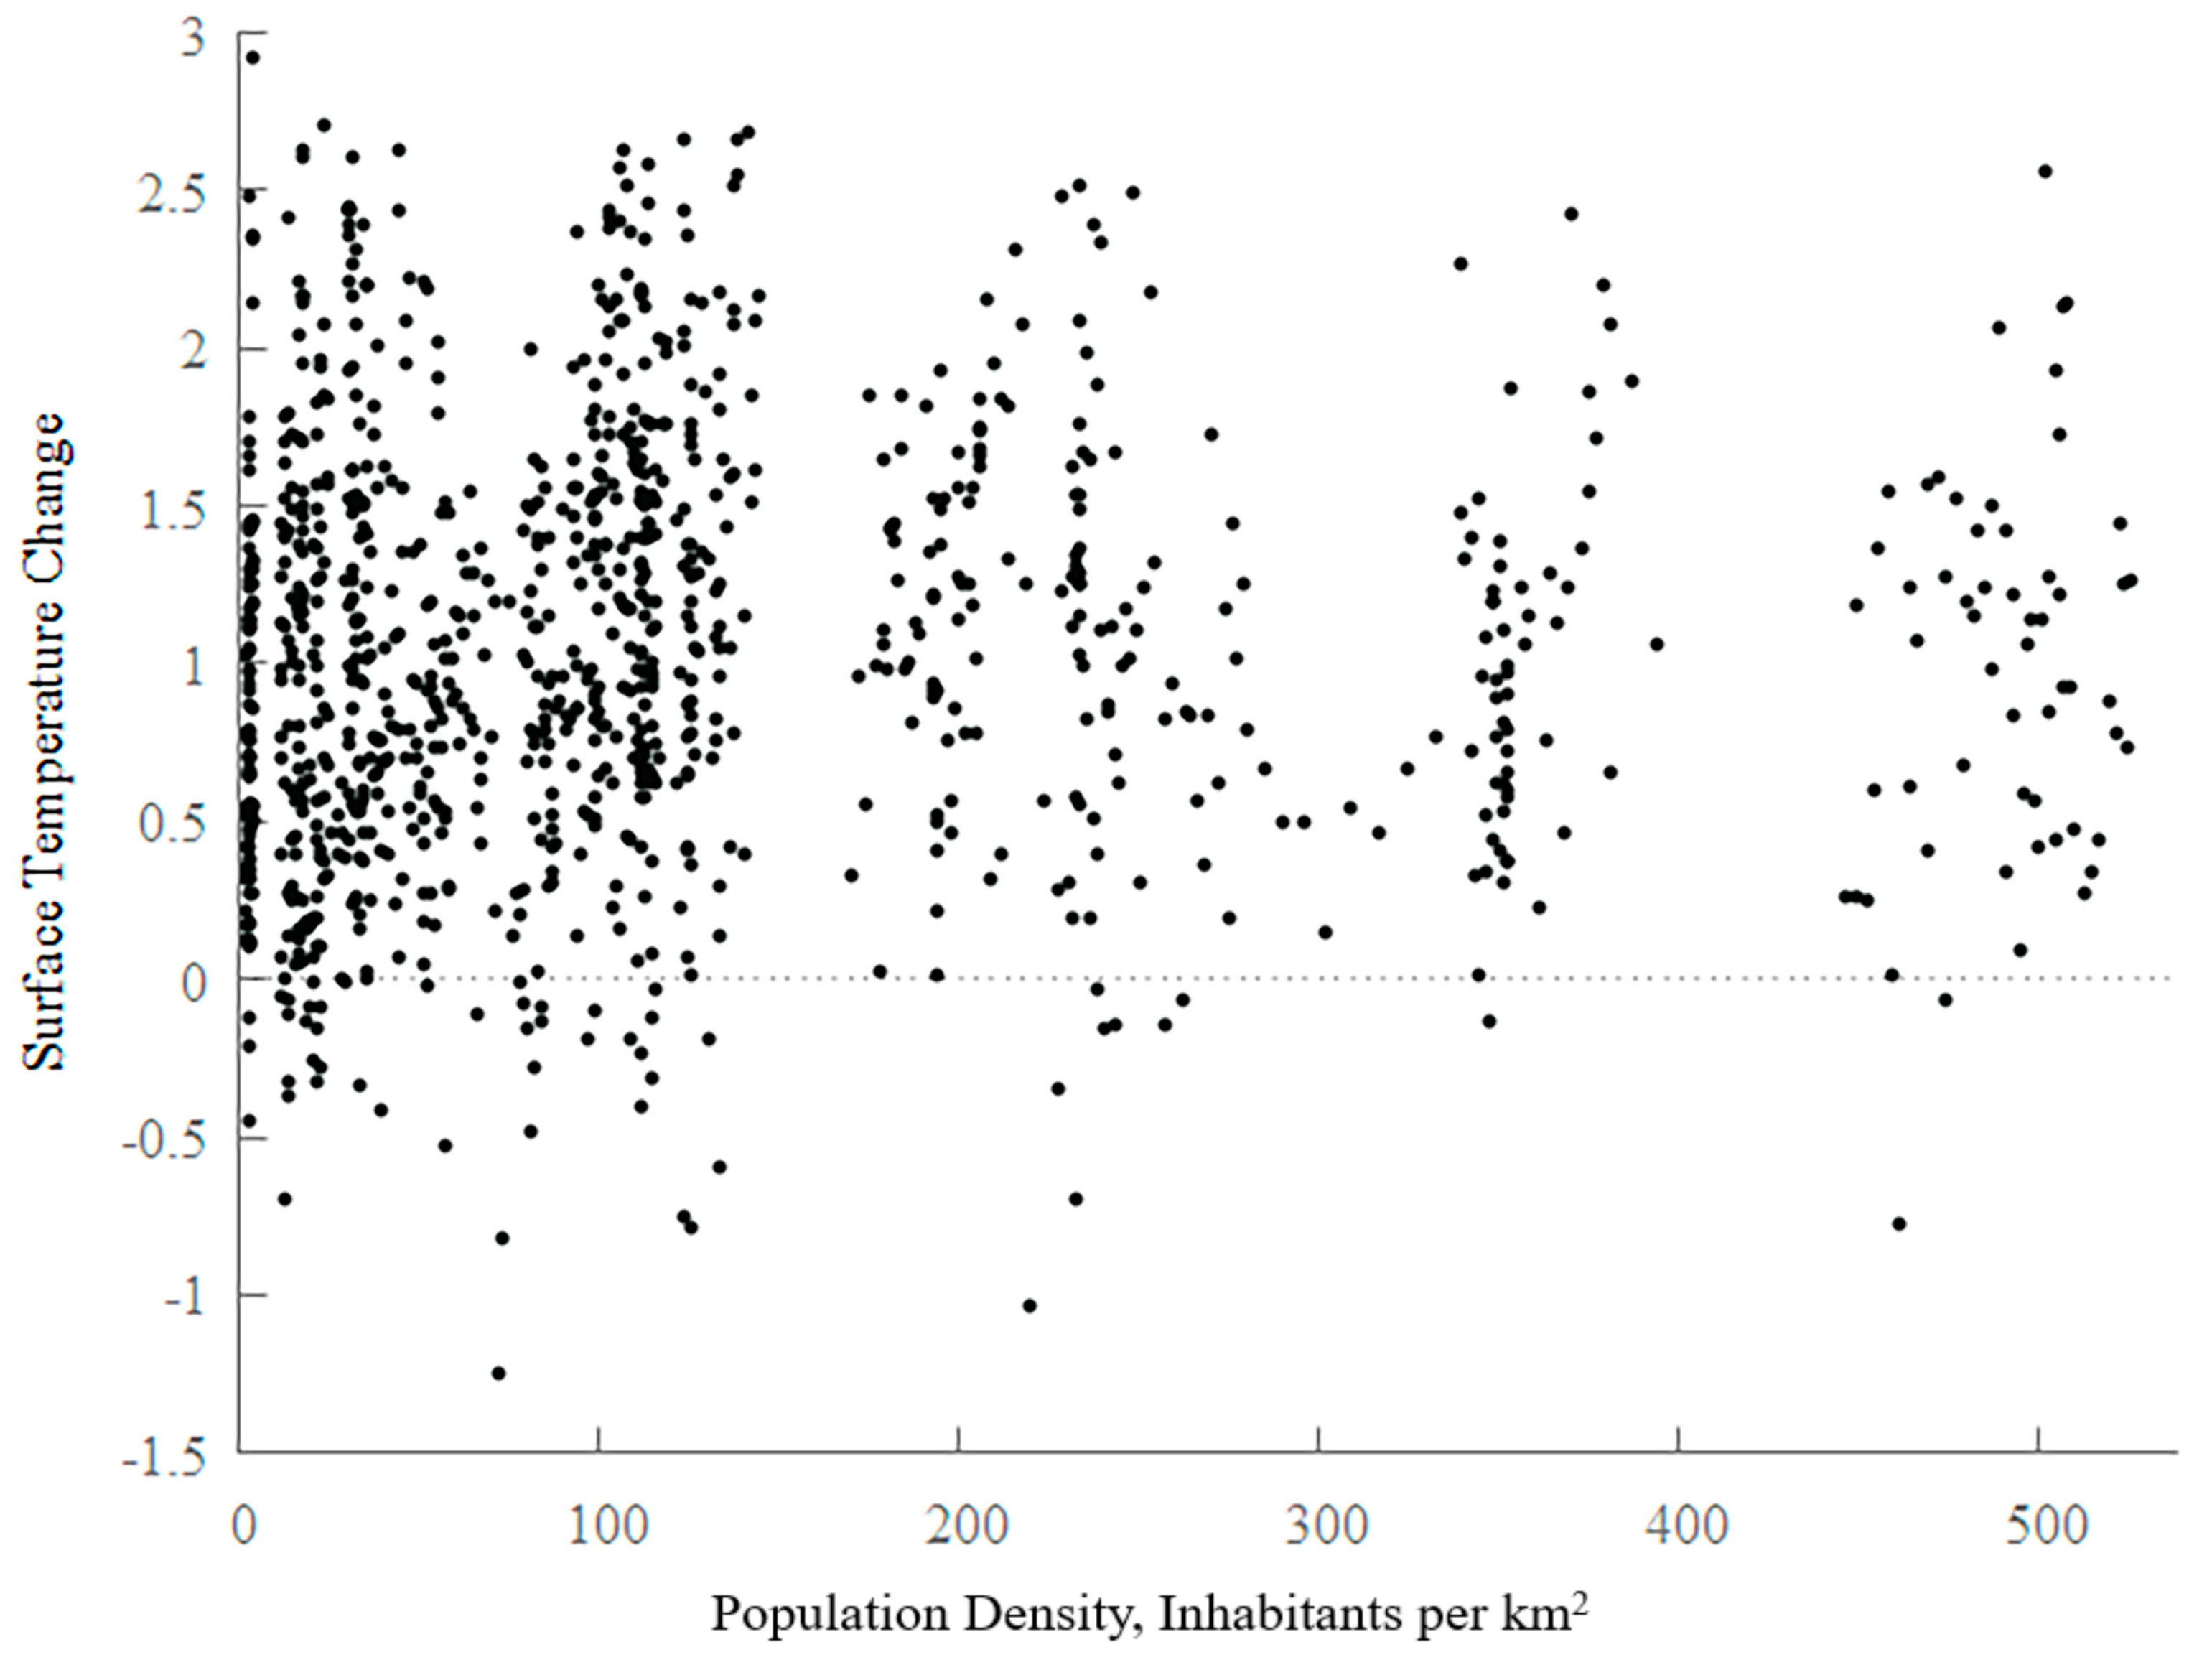
3.1. Data and Variables

The data for empirical estimations were collected from the official OECD database “https://stats.oecd.org/Index.aspx?DataSetCode=green_growth#” (accessed on 30 August 2021). The variables used are global surface temperature; production-based CO2 productivity; national energy consumption in the agricultural sector; national energy consumption in the industrial sector; national energy consumption in the service sector; national energy consumption in the transport sector; population density; and renewable electricity.
The data collected for this study cover 37 OECD countries over a period of 30 years from 1990 to 2019 in panel form. Costa Rica is not included in this study, as the country was not invited to be an official OECD member until 25 May 2020. The OECD countries are among the largest emitters of greenhouse gases, and their policies and actions have a substantial impact on the global climate system. Therefore, understanding the relationship between carbon emissions and temperature changes in these countries is of significant importance for addressing the global warming crisis. Overall, 8880 data points were collected for the panel regression model, including 1 dependent variable and 7 independent variables. The descriptive statistics of each variable are exhibited in Table 1.
The dependent variable adopted in this study is global surface temperature change, and the measure is calculated as the percentage of the difference in the average annual surface temperature in the 1990–2019 period in comparison with the same measure in the 1951–1980 period. The measure represents the severity of global surface temperature change. There are seven independent variables to be estimated. First, the annual growth rate of production-based CO2 productivity is calculated as the real GDP generated per unit of CO2 emissions measured in USD per kilogram, representing the cost of the GDP unit regarding CO2 emissions. The second to fifth independent variables are the national energy consumption in different sectors, which are the agricultural, industrial, service, and transport sectors. Each value is presented as a percentage of the total annual energy consumption in a country. The measures of energy consumption in different sectors offer a variety of endogenous information, such as the countries’ efficiency level in energy use and their development level in the corresponding industry sector. The sixth variable, population density, which is recorded as inhabitants per square kilometer of total country area, can be used as a proxy for the intensity of residential energy consumption. Finally, renewable electricity, which presents the growth rate of renewable electricity generation in comparison with national total electricity generation, represents the dedication level of a country to renewable energy generation.
To further explain the purpose of using these variables, we have provided illustrations of their relationships over a 30-year period. To effectively convey the aim of this study, we adopted the GDP per unit of total primary energy supply (TPES) as a comprehensive representation of national energy consumption in different sectors, as this factor reflects a country’s energy efficiency in relation to its GDP.
As shown in Figure 2, there is a positive correlation between GDP per unit of energy-related CO2 emissions and GDP per unit of TPES. This means that the more economic value a country generates, the more CO2 it produces. Figure 3 shows that although there are separate clusters, indicating a wide range and hierarchy of population density in OECD countries, there is still an increasing trend of positive correlation between CO2 emissions and population density.
Figure 4 clearly demonstrates the urgent need to improve energy efficiency. It shows the relationship between surface temperature changes and the GDP per unit of energy-related CO2 emissions. The data indicate that the lower GDP per unit of energy-related CO2 emissions may lead to a decrease in surface temperature change, but such circumstances are rare. Despite the observation of efforts implemented to control excessive CO2 emissions from economic activities over the past three decades, the issue remains a concern. Similar circumstances can also be observed in Figure 5 and Figure 6, which show the relationships between surface temperature change, GDP per unit of TPES, and population density.
By considering all these figures together, it becomes evident that there are significant links between CO2 emissions, population density, and energy efficiency. Improving these links is essential and must be pursued at all costs.

3.2. The Panel Regression Model

The panel regression model is adopted as the key estimation method to determine the influences on global surface temperature changes, as it can be used to analyze data that are collected from the same set of entities, such as the data from countries adopted in this study, over multiple periods. The advantages of this model are plentiful, but the key is that the panel regression model has greater potential for identifying causal relationships and complex relationships, as it is advantageous in controlling unobserved heterogeneity and reducing omitted variable bias because it allows for controlling both time-invariant and time-varying confounders, reducing the risk of spurious relationships. Depending on how heterogeneity is assumed, three extensions of the panel regression can be adopted for estimation: the pooled regression model, the fixed effects model, and the random effects regression model. Each model is described in the following.
Pooled regression model:
G T C i , t = α + β 1 C O P i , t + β 2 E C a r i , t + β 3 E C i n i , t + β 4 E C s e i , t + β 5 E C t r i , t + β 6 P D N i , t + β 7 R N E i , t + ε i , t              
Fixed effects model:
G T C i , t = α i + β 1 C O P i , t + β 2 E C a r i , t + β 3 E C i n i , t + β 4 E C s e i , t + β 5 E C t r i , t + β 6 P D N i , t + β 7 R N E i , t + ε i , t                                                                                        
Random effects model:
G T C i , t = α + u i + β 1 C O P i , t + β 2 E C a r i , t + β 3 E C i n i , t + β 4 E C s e i , t + β 5 E C t r i , t + β 6 P D N i , t + β 7 R N E i , t + ε i , t
where G T C is the global surface temperature change rate; C O P is the growth rate of production-based CO2 productivity; E C a r , E C i n , E C s e , and E C t r represent energy consumption in the agricultural sector, industrial sector, service sector, and transport sector, respectively; P D N is the population density; R N E is the growth rate of renewable electricity with respect to total electricity generation. Subscripts i and t denote each sampled country and year, respectively. As α is the constant term that suggests the absence of a country-specific difference, α i suggests that an observable country-specific difference exists. u i is the unobservable random error term across countries, and ε i , t is the idiosyncratic error term across countries over time.
In the pooled regression model, if the condition that idiosyncratic error term ε i , t ~ N i i d 0 , σ 2 is assumed, ordinary least squares (OLS) estimation provides efficiency and consistency. However, ignorance of longitudinal heterogeneity (in this case, constant term α declares the exclusion of country-specific differences) leads to biased estimations. Hence, the fixed effects and the random effects models can be adopted for better estimation. In the former, constant term α i   encompasses the observable effects from country-specific differences over time; the latter, due to composite error term α + u i , assumes country-specific differences to be unobservable longitudinally.
The goodness of fit of each model varies depending on the sample structure and its characteristics; nevertheless, it can be determined via a comparison of three statistical tests: the F test, the Lagrange multiplier test (LM test), and the Hausman’s specification test (H test) [22,23,24]. Each testing model is described in the following.
F test:
                  F n 1 , n T n k = R f i x e d 2 R p o o l e d 2 / n 1 1 R f i x e d 2 / n T n k
LM test:
                L M = n T 2 T 1 i = 1 n t = 1 T ε i , t 2 i = 1 n t = 1 T ε i , t 2 1 2
H test:
                      H = β ^ f i x e d β ^ r a n d o m Σ f i x e d Σ r a n d o m 1 β ^ f i x β ^ r a n d o m
where n denotes the number of countries in the estimation, and T denotes the number of years that have been taken. The determination coefficient R 2 and the estimated coefficient   β ^ are the estimated results from the corresponding model indicated by pooled, fixed, and random subscripts. Σ is the covariance matrix.
First, the null hypothesis of the F test is that the pooled regression model applies better goodness of fit than the fixed effects model. Second, the null hypothesis of the LM test is that the pooled regression model applies better goodness of fit than the random effects model. Finally, the null hypothesis of the H test is that the random effects model applies better goodness of fit than the fixed effects model. By contrasting each testing result, the most appropriate model can be determined and used in the following estimation analyses.

4. Empirical Results with Discussions

As shown at the bottom of Table 2, the null hypotheses of the F test, LM test, and H test were all rejected for the three groups; hence, the fixed effect model was adopted for panel regression estimations due to the best goodness of fit. Additionally, the variance inflation factors (VIFs) of the independent variables were between 0.0186 and 0.9384 for the 30-year period, between 0.0184 and 1.1539 for the 20-year period, and between 0.0182 and 1.3926 for the 10-year period. As the collinearities between variables are tolerable, the applicability of the panel regression estimation can be confirmed.
As explained in the earlier section, the independent variable “production-based CO2 productivity” represents the annual growth of the GDP value gained from units of energy-related CO2 emissions. The positive and significant coefficients across three time periods, which are 0.0308, 0.0240, and 0.0362, suggest that when the GDP value increases with CO2 emissions, the corresponding economic behavior may be increasingly encouraged and invested for further economic outcomes due to the greater global aspiration for wealth and economic progress [25]. Therefore, CO2 emissions increase and consequently aggravate global surface temperature changes. From the estimated results, the connection between global surface temperature change and economic growth is established, as global surface temperature change appears to be the opportunity cost for economic growth, and this trend does not seem to be well known given that the coefficient is the highest in the 10-year period. This pattern appears to be less recognized, as evidenced by the highest coefficient observed in the 10-year period. This finding aligns with other studies in the field, demonstrating a bidirectional causal relationship between economic growth and energy consumption, while identifying only a unidirectional causal relationship from energy consumption to CO2 emissions [26].
Understanding energy consumption for production industries (agricultural, industrial, and service sectors) is extremely essential. As shown in Figure 7, the energy consumption of production industries is approximately 41% of the total energy consumption. By segmenting energy consumption into different industry sectors, estimations vary across the three time periods, and the influence of energy consumption on global surface temperature change, in relation to CO2 emissions and population density, can be observed and discussed.
The composition of the agriculture sector is complicated, including crops and pastoral farming along with hunting and forestry. Whereas crops and pastoral farming have been proven to be major GHG sources and, hence, aggravate global surface temperature changes [27,28], forestry is beneficial for reducing GHG emissions. The 30-year-period estimated coefficient of energy consumption in agriculture is significant at −0.0600, which highlights the importance of forestry, and such evidence is consistent with the earlier findings [29]. Nevertheless, the estimated coefficients are insignificant in both 20- and 10-year periods. Such contradictory results instead indicate the importance of contributions from forestry, as food chain production emits 19–29% of all GHG emissions globally [27]. The long-term significant sign suggests that overall energy efficiency in the agriculture sector, along with population density, plays a role in global surface temperature change. However, the estimated coefficients are insignificant in both the 20- and 10-year periods, at −0.0179 and 0.0016, respectively. Although the estimated results are insignificant, the transformation from negative to positive indicates that deforestation is aggregated and, hence, deteriorates the positive influence of the agriculture sector. Such an indication can be confirmed, as it is in line with many advanced studies [30,31,32,33]. Furthermore, as mentioned earlier, the global surface temperature change has an increasing trend (as shown in Figure 1), and its impact is certainly enhanced. As the entire agricultural sector is facing undesired consequences from global surface temperature change—extreme environmental crises such as bushfires and drought—to mitigate the issue of global surface temperature change, in the context of CO2 emissions and population density, aside from the given suggestions from advanced studies about the regulation implemented on fertilizer use, this study indicates that restrictions on deforestation and relevant remedies in the forestry sector should be proposed more vigorously.
Energy consumption in the industrial sector is positively and significantly correlated with global surface temperature changes in the 30- and 20-year periods, with values of 0.0161 and 0.0212, respectively, and it is insignificant in the 10-year period at −0.0077. Such a difference in estimated results indicates that in the industrial sector, efforts to increase energy efficiency and mitigate global surface temperature can be observed. The cause of increases in CO2 emissions from industrial expansion can be traced to financial development [34], as it provides financial support for productivity expansion, which incidentally increases industrial CO2 emissions. However, the Fourth Industrial Revolution, which was triggered by Germany’s Industries 4.0 strategy, initiated the computerization of manufacturing, which significantly increases energy efficiency and contributes to environmental sustainability in the industrial sector. For example, 3D printing technology is more efficient and environmentally friendly than traditional manufacturing for industrial applications [35]. In addition, in the financial industry, as the usage of e-finance has been initiated following technology innovation, CO2 emissions generated from the financial industry have also been significantly reduced.
Similarly, the effects of increasing energy efficiency and mitigating global surface temperature are more noticeable from the estimation results in the service sector; the coefficient is significant at −0.1321 in the 10-year period, whereas those in the 30- and 20-year periods are significant at 0.0313 and insignificant at 0.1367 (10−4), respectively. Many arguments can explain such results. First, as information and computer technology have been well developed in the last two decades, message delivery has been more efficient, and the needs of traditional intermediaries of message delivery—paper products—have been reduced (namely, it is beneficial for forestry). Second, the big data environment supports the service industry in reducing uncertainty and increasing its efficiency, transparency, and productivity by conducting predictive information analysis [36]. Finally, unlike in the industrial sector, inner changes are relatively easier to undertake, such as restructuring resource allocation and operation strategies. Therefore, high energy taxation is effective in enforcing the service industry to increase technical and energy efficiency, consequently influencing the relationship between CO2 emissions and surface temperature changes [37].
The estimated results of energy consumption in the transport sector are in line with many studies, suggesting that all transport activities emit GHGs and continually aggravate global surface temperature changes. As 1% of energy consumption increased in the transport sector, the global surface temperature change increased by 0.0882% and 0.0849% in the 30- and 20-year periods, respectively; moreover, it reached 0.1487% in the 10-year period, and the influences from this sector were the highest among all factors. Such undesired results suggest that reducing CO2 emissions and their influence on surface temperature changes is hardest to achieve [38], and improving efficiency in energy consumption is difficult in the transport sector. Therefore, revolutionary development among all transport activities should be prioritized for the purpose of mitigating global surface temperature changes. The correlation between global surface temperature change and transport activities does not work as a unidirectional causal relationship; extreme environmental crises caused by global surface temperature changes [39], such as sea level rise, storms, and floods, may put transportation infrastructure at risk. Additionally, bushfires, another environmental crisis, not only damage transportation infrastructure and activities but also seriously jeopardize public safety and emit a large amount of CO2. Therefore, other than enhancing transportation infrastructures, accelerating the development of green vehicles should be considered a priority. Meanwhile, as the abovementioned suggestions are time-consuming, encouraging the usage of public transportation should be enhanced, especially in regions with a high population density.
Compared with energy consumption in production industries, residential energy consumption is unignorable based on the investigation of population density in this study, as the relationships between CO2 emissions and population density are positively and significantly correlated [40]. This study expands the analyses and confirms that population density is positively correlated with global surface temperature change across three time periods, and the causal relationships from population density are stronger in the most recent period with coefficient values of 0.0370, whereas the other two are 0.0080 and 0.0066. Regardless of whether fossil-fuel energy or renewable energy is used, higher population densities emit more GHGs, including CO2, and lead to an increase in global surface temperature as frequent activities are exhibited in concentrated populations, such as emissions from automotive exhausts and refuse burning. Furthermore, the usage of air conditioners, which emit GHGs, increases as temperature increases, forming an undesired bidirectional causal relationship between CO2 emissions, population behavior, and surface temperature changes, especially in urban regions with high population density, where the urban heat island effect is triggered [41]. In fact, similarly to the case discussed in the previous section, a bidirectional causal relationship is likely to exist between global surface temperature change and population density. Areas with comfortable and warm temperatures tend to have higher population densities, meaning that there is a strong correlation between population density and climate conditions [42]; however, this can also affect CO2 emissions and the relationship with surface temperature changes.
Therefore, to avoid excessive population concentrations, policies promoting renewable energy in place of fossil-fuel energy should be encouraged due to its long-term comparative advantages in reducing GHG emissions. As an increase in adopting renewable energy for electricity resources occurs, which is advantageous with respect to being environmentally friendly in comparison with fossil-fuel energy, the global surface temperature decreases. As shown at the bottom of Table 2, the coefficients of the three time periods are −0.0145, −0.0107, and −0.0174, with significance exhibited for all. The relatively low effectiveness can be attributed to the fact that the contribution of renewable sources to the total energy supply is relatively low, making it insufficient [43]; given the empirical evidence from this study, it is undeniable that adopting renewable energy is more beneficial for the environment.
From the above discussions, the causal relationships between all variables and global surface temperature change are explored, and the differences between each sector become apparent. By performing comparisons among individual results, as shown in Table 2, the differences in contributions made by each sector can also be observed. Although evidence suggests that contributions to global surface temperature in the industrial and service sectors can be observed as their coefficient decreases when investigations are focused more on current time periods, the coefficients of the transport and agricultural sectors increase and become insignificant. This phenomenon can be attributed to the nature of these industries. The industrial and service sectors suffer relatively less from the impact of global surface temperature change. However, the agricultural and transport sectors are victimized due to their impact. Based on the empirical evidence of pattern differences across the coefficients of variables over time, the study suggests that barriers to global surface temperature change mitigation exist if the bidirectional causal effect is significant with an undesired influence between variables and the global surface temperature. In addition, the renewable energy industry is also a victim of global surface temperature change regardless of the fact that renewable energy may work as a universal solution to environmental impacts. As solar, wind, hydro, and other renewable generation technologies rely on comprehensive infrastructures and most are triggered by natural energy resources [44], similarly to the case of transport infrastructure, if either the related infrastructure or natural energy resources for renewable energy generation are impacted, the cost issue and efficiency are jeopardized.
In addition, as the influences of energy consumption in the service sector transform from significantly positive to significantly negative from the 30- to the 10-year period and the influences of energy consumption in the industrial sector become insignificantly negative in the 10-year period, the study suggests that global surface temperature change does not necessarily need to be the opportunity cost of economic growth if energy efficiency can be increased along with other proper planning regarding the mitigation of GHG emissions, such as the adoption of renewable energy and proper urbanization. Apart from spatial optimization [13], if urban ventilation can be efficiently improved, not only can the urban heat island effect be mitigated, but it can also reduce energy consumption in urban areas [45].
Understanding the causal relationships between different sectors and global surface temperature change is vital for developing effective strategies to mitigate the negative impacts of climate change. By focusing on increasing energy efficiency, promoting renewable energy, and implementing proper urban planning, we can work towards creating a more sustainable future that balances economic growth with environmental preservation.

5. Conclusions

By using panel regression estimations, the influences of different factors on global surface temperature change can be identified. From a macroeconomic perspective, although global surface temperature change has become a concerning issue, economic growth still seems to be a priority regardless of global surface temperature changes. Such circumstances should be repeatedly considered.
In different industrial sectors, the logical relationships among energy consumption, CO2 emissions, population density, and their impact on global surface temperature change are mostly significant, except in the agricultural sector. Additionally, from the comparisons between the three time periods, contributions to global surface temperature change mitigation are observable in the industrial sector and service sector. This statement does not suggest that there are no contributions from the agricultural and transport sectors (in fact, the agricultural sector significantly mitigates global surface temperature changes in the long run), but their energy efficiency and other economic activities are impacted by extreme environmental events; hence, it can be inferred that the causal relationships between global surface temperature change and energy efficiency in the agricultural and transport sectors are bidirectional.
In addition, from a demographic perspective, as there exists a logical connection between high population density, increased energy consumption, CO2 accumulation, and rising surface temperatures in modern society (especially when the urban heat island effect is triggered), proper urbanization should be implemented. Evidence has also been found, based on the negative causal relationship between the contribution to renewable electricity and temperature change, that indicates the feasibility of renewable energy adoption.
Taking into account the logical connections between surface temperature changes, CO2 emissions, population density, and energy consumption, this study proposes several policy suggestions:
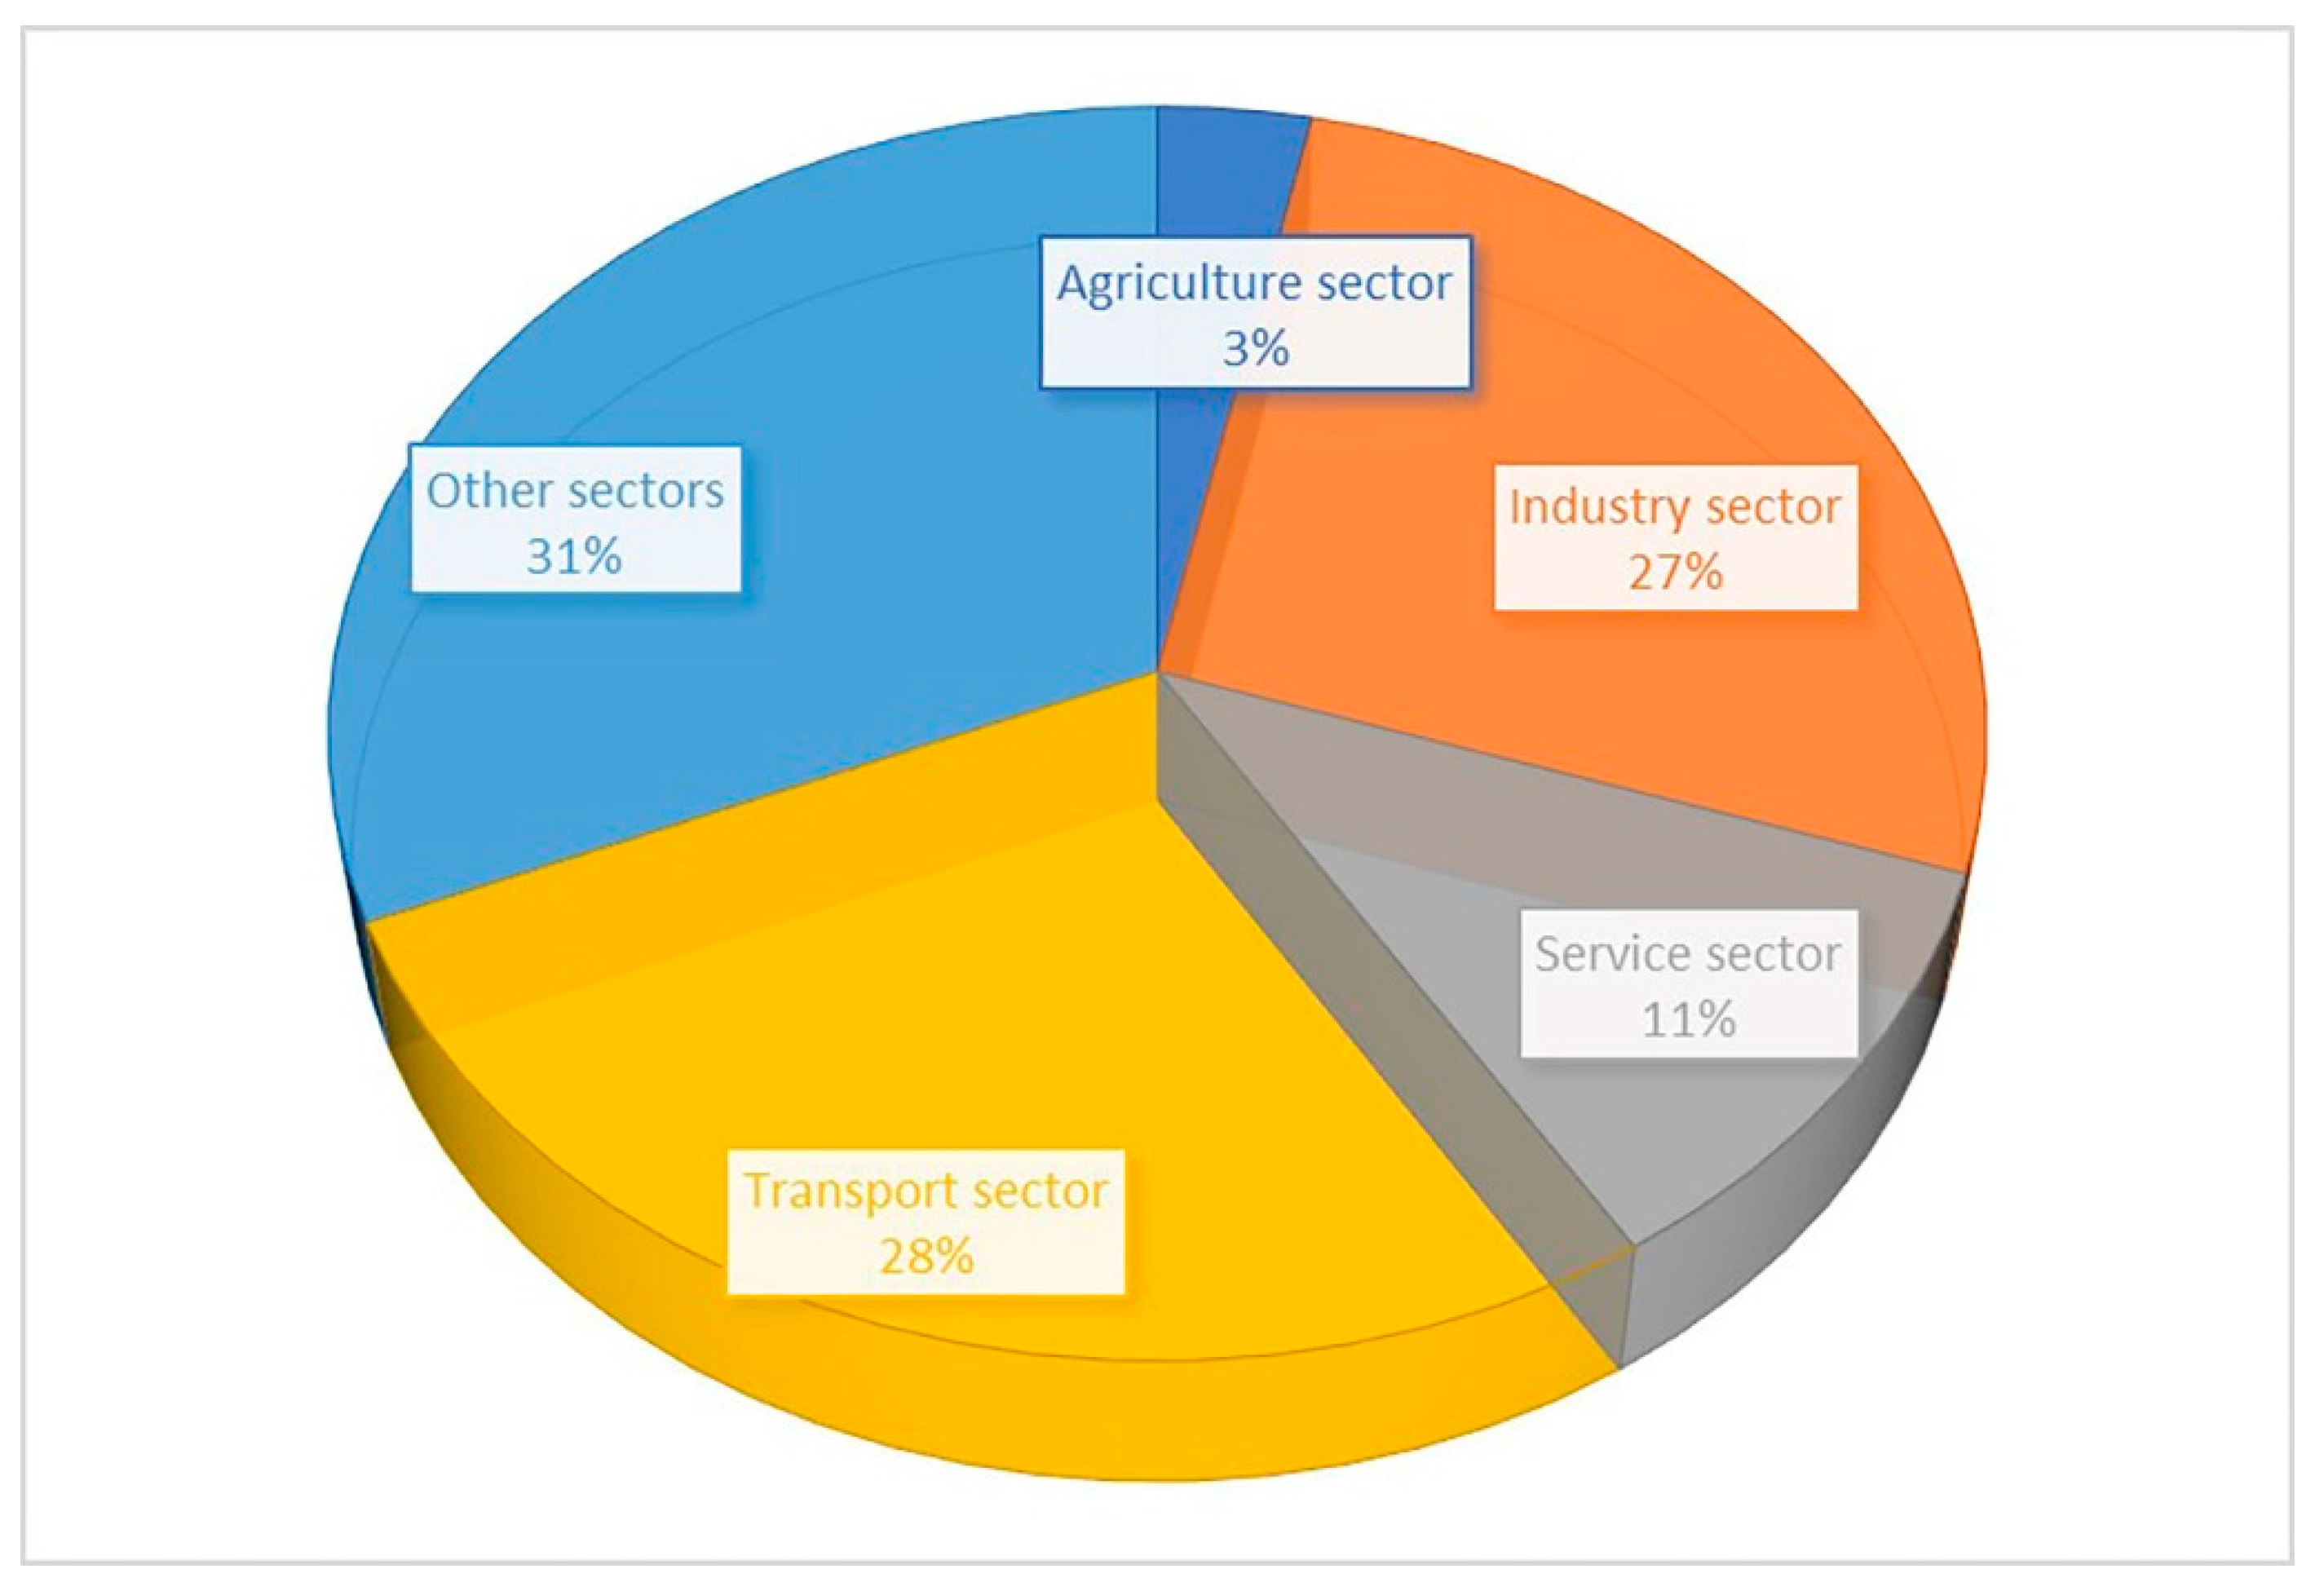
  • Increase energy efficiency across all industries, as significant results indicate that improved energy efficiency can mitigate global surface temperature change. The agricultural and transport industries, in particular, have substantial room for improvement.
  • Introduce regulations to curb deforestation while encouraging forestry expansion, considering its valuable carbon reserve function.
  • Implement proper planning of population allocation and urbanization to avoid GHG emissions resulting from high population density. This includes promoting sustainable urban development and green spaces.
  • Encourage the adoption of renewable energy sources as a feasible and universal solution to mitigate global surface temperature changes. This can be achieved via policy incentives, subsidies, and research and development investments.
In conclusion, it is vital to consider the unique environmental and developmental contexts of each country when formulating policies. However, the consequences of global surface temperature change are shared by all, emphasizing the need for concerted global efforts. By implementing these policy suggestions, we can work towards a more sustainable future that balances economic growth with environmental protection.

Author Contributions

Conceptualization, C.-L.C.; Project administration, C.-L.C.; Methodology, C.-L.C.; Supervision, C.-L.C.; Formal analysis, I.-F.H.; Data curation, I.-F.H.; Investigation, I.-F.H.; Resources, I.-F.H.; Validation, I.-F.H.; Visualization, I.-F.H.; Writing—original draft, I.-F.H.; Writing—review & editing, L.C. All authors have read and agreed to the published version of the manuscript.

Funding

This research received no external funding.

Institutional Review Board Statement

Not applicable.

Informed Consent Statement

Not applicable.

Data Availability Statement

(1) The OECD data are openly available at “OECD.stat.”: “https://stats.oecd.org/Index.aspx?DataSetCode=green_growth#” (accessed on 30 August 2021). (2) The data for “Figure 1. Global surface temperature increase” are openly available at “NOAA National Centers for Environmental information.”: “https://www.ncdc.noaa.gov/cag/” (accessed on 30 August 2021).

Conflicts of Interest

The authors declare no conflict of interest.

References

  1. Song, C.; Yang, J.; Wu, F.; Xiao, X.; Xia, J.; Li, X. Response Characteristics and Influencing Factors of Carbon Emissions and Land Surface Temperature in Guangdong Province, China. Urban Clim. 2022, 46, 101330. [Google Scholar] [CrossRef]
  2. Zhang, D.; Zhou, C.; He, B.-J. Spatial and Temporal Heterogeneity of Urban Land Area and PM2.5 Concentration in China. Urban Clim. 2022, 45, 101268. [Google Scholar] [CrossRef]
  3. Acaravci, A.; Ozturk, I. On the Relationship between Energy Consumption, CO2 Emissions and Economic Growth in Europe. Energy 2010, 35, 5412–5420. [Google Scholar] [CrossRef]
  4. Pao, H.-T.; Tsai, C.-M. CO2 Emissions, Energy Consumption and Economic Growth in BRIC Countries. Energy Policy 2010, 38, 7850–7860. [Google Scholar] [CrossRef]
  5. Wang, S.S.; Zhou, D.Q.; Zhou, P.; Wang, Q.W. CO2 Emissions, Energy Consumption and Economic Growth in China: A Panel Data Analysis. Energy Policy 2011, 39, 4870–4875. [Google Scholar] [CrossRef]
  6. Shao, S.; Yang, L.; Yu, M.; Yu, M. Estimation, Characteristics, and Determinants of Energy-Related Industrial CO2 Emissions in Shanghai (China), 1994–2009. Energy Policy 2011, 39, 6476–6494. [Google Scholar] [CrossRef]
  7. Lim, H.-J.; Yoo, S.-H.; Kwak, S.-J. Industrial CO2 Emissions from Energy Use in Korea: A Structural Decomposition Analysis. Energy Policy 2009, 37, 686–698. [Google Scholar] [CrossRef]
  8. Lin, B.; Xu, B. Growth of Industrial CO2 Emissions in Shanghai City: Evidence from a Dynamic Vector Autoregression Analysis. Energy 2018, 151, 167–177. [Google Scholar] [CrossRef]
  9. Wang, M.; Feng, C. Understanding China’s Industrial CO2 Emissions: A Comprehensive Decomposition Framework. J. Clean. Prod. 2017, 166, 1335–1346. [Google Scholar] [CrossRef]
  10. Wolinetz, M.; Axsen, J.; Peters, J.; Crawford, C. Simulating the Value of Electric-Vehicle–Grid Integration Using a Behaviourally Realistic Model. Nat. Energy 2018, 3, 132–139. [Google Scholar] [CrossRef]
  11. Santos, G. Road Transport and CO2 Emissions: What Are the Challenges? Transp. Policy 2017, 59, 71–74. [Google Scholar] [CrossRef]
  12. Wang, Z.; He, W. CO2 Emissions Efficiency and Marginal Abatement Costs of the Regional Transportation Sectors in China. Transp. Res. Part D Transp. Environ. 2017, 50, 83–97. [Google Scholar] [CrossRef]
  13. Wang, S.; Liu, X.; Zhou, C.; Hu, J.; Ou, J. Examining the Impacts of Socioeconomic Factors, Urban Form, and Transportation Networks on CO2 Emissions in China’s Megacities. Appl. Energy 2017, 185, 189–200. [Google Scholar] [CrossRef]
  14. Solaymani, S. CO2 Emissions Patterns in 7 Top Carbon Emitter Economies: The Case of Transport Sector. Energy 2019, 168, 989–1001. [Google Scholar] [CrossRef]
  15. Stuart, D.; Schewe, R.L.; McDermott, M. Reducing Nitrogen Fertilizer Application as a Climate Change Mitigation Strategy: Understanding Farmer Decision-Making and Potential Barriers to Change in the US. Land Use Policy 2014, 36, 210–218. [Google Scholar] [CrossRef]
  16. Luo, Y.; Long, X.; Wu, C.; Zhang, J. Decoupling CO2 Emissions from Economic Growth in Agricultural Sector across 30 Chinese Provinces from 1997 to 2014. J. Clean. Prod. 2017, 159, 220–228. [Google Scholar] [CrossRef]
  17. Zhou, M.; Hu, B. Decoupling of Carbon Emissions from Agricultural Land Utilisation from Economic Growth in China. Agric. Econ. Czech 2020, 66, 510–518. [Google Scholar] [CrossRef]
  18. Amponsah, N.Y.; Troldborg, M.; Kington, B.; Aalders, I.; Hough, R.L. Greenhouse Gas Emissions from Renewable Energy Sources: A Review of Lifecycle Considerations. Renew. Sustain. Energy Rev. 2014, 39, 461–475. [Google Scholar] [CrossRef]
  19. Ben Jebli, M.; Ben Youssef, S. The Role of Renewable Energy and Agriculture in Reducing CO2 Emissions: Evidence for North Africa Countries. Ecol. Indic. 2017, 74, 295–301. [Google Scholar] [CrossRef]
  20. Ikram, M.; Zhang, Q.; Sroufe, R.; Shah, S.Z.A. Towards a Sustainable Environment: The Nexus between ISO 14001, Renewable Energy Consumption, Access to Electricity, Agriculture and CO2 Emissions in SAARC Countries. Sustain. Prod. Consum. 2020, 22, 218–230. [Google Scholar] [CrossRef]
  21. Lin, B.; Zhu, J. The Role of Renewable Energy Technological Innovation on Climate Change: Empirical Evidence from China. Sci. Total Environ. 2019, 659, 1505–1512. [Google Scholar] [CrossRef]
  22. Maddala, G.S. The Use of Variance Components Models in Pooling Cross Section and Time Series Data. Econometrica 1971, 39, 341–358. [Google Scholar] [CrossRef]
  23. Breusch, T.S.; Pagan, A.R. The Lagrange Multiplier Test and Its Applications to Model Specification in Econometrics. Rev. Econ. Stud. 1980, 47, 239–253. [Google Scholar] [CrossRef]
  24. Hausman, J.A. Specification Tests in Econometrics. Econometrica 1978, 46, 1251–1271. [Google Scholar] [CrossRef]
  25. Mitić, P.; Fedajev, A.; Radulescu, M.; Rehman, A. The Relationship between CO2 Emissions, Economic Growth, Available Energy, and Employment in SEE Countries. Environ. Sci. Pollut. Res. 2022, 30, 16140–16155. [Google Scholar] [CrossRef] [PubMed]
  26. Wang, S.; Li, Q.; Fang, C.; Zhou, C. The Relationship between Economic Growth, Energy Consumption, and CO2 Emissions: Empirical Evidence from China. Sci. Total Environ. 2016, 542, 360–371. [Google Scholar] [CrossRef]
  27. Vermeulen, S.J.; Campbell, B.M.; Ingram, J.S.I. Climate Change and Food Systems. Annu. Rev. Environ. Resour. 2012, 37, 195–222. [Google Scholar] [CrossRef]
  28. Clark, M.A.; Domingo, N.G.G.; Colgan, K.; Thakrar, S.K.; Tilman, D.; Lynch, J.; Azevedo, I.L.; Hill, J.D. Global Food System Emissions Could Preclude Achieving the 1.5° and 2 °C Climate Change Targets. Science 2020, 370, 705–708. [Google Scholar] [CrossRef]
  29. Agovino, M.; Casaccia, M.; Ciommi, M.; Ferrara, M.; Marchesano, K. Agriculture, Climate Change and Sustainability: The Case of EU-28. Ecol. Indic. 2019, 105, 525–543. [Google Scholar] [CrossRef]
  30. Rowntree, R.; Nowak, D. Quantifying the Role of Urban Forests in Removing Atmospheric Carbon Dioxide. AUF 1991, 17, 269–275. [Google Scholar] [CrossRef]
  31. Escobedo, F.; Varela, S.; Zhao, M.; Wagner, J.E.; Zipperer, W. Analyzing the Efficacy of Subtropical Urban Forests in Offsetting Carbon Emissions from Cities. Environ. Sci. Policy 2010, 13, 362–372. [Google Scholar] [CrossRef]
  32. Weissert, L.F.; Salmond, J.A.; Schwendenmann, L. A Review of the Current Progress in Quantifying the Potential of Urban Forests to Mitigate Urban CO2 Emissions. Urban Clim. 2014, 8, 100–125. [Google Scholar] [CrossRef]
  33. Waheed, R.; Chang, D.; Sarwar, S.; Chen, W. Forest, Agriculture, Renewable Energy, and CO2 Emission. J. Clean. Prod. 2018, 172, 4231–4238. [Google Scholar] [CrossRef]
  34. Elheddad, M.; Benjasak, C.; Deljavan, R.; Alharthi, M.; Almabrok, J.M. The Effect of the Fourth Industrial Revolution on the Environment: The Relationship between Electronic Finance and Pollution in OECD Countries. Technol. Forecast. Soc. Change 2021, 163, 120485. [Google Scholar] [CrossRef]
  35. Yin, Y.; Stecke, K.E.; Li, D. The Evolution of Production Systems from Industry 2.0 through Industry 4.0. Int. J. Prod. Res. 2018, 56, 848–861. [Google Scholar] [CrossRef]
  36. Lee, J.; Kao, H.-A.; Yang, S. Service Innovation and Smart Analytics for Industry 4.0 and Big Data Environment. Procedia CIRP 2014, 16, 3–8. [Google Scholar] [CrossRef]
  37. Pardo Martínez, C.I.; Silveira, S. Analysis of Energy Use and CO2 Emission in Service Industries: Evidence from Sweden. Renew. Sustain. Energy Rev. 2012, 16, 5285–5294. [Google Scholar] [CrossRef]
  38. Marsden, G.; Rye, T. The Governance of Transport and Climate Change. J. Transp. Geogr. 2010, 18, 669–678. [Google Scholar] [CrossRef]
  39. Christodoulou, A.; Demirel, H. Impacts of Climate Change on Transport: A Focus on Airports, Seaports and Inland Waterways; Publications Office of the European Union: Luxembourg, 2017; ISBN 978-92-79-76902-3.
  40. Field, C.B.; Raupach, M.R. (Eds.) The Global Carbon Cycle: Integrating Humans, Climate, and the Natural World; SCOPE; Island Press: Washington, DC, USA, 2004; ISBN 978-1-55963-526-4. [Google Scholar]
  41. Bornstein, R.D. Observations of the Urban Heat Island Effect in New York City. J. Appl. Meteorol. Climatol. 1968, 7, 575–582. [Google Scholar] [CrossRef]
  42. Zhang, D.; Zhou, C.; Zhou, Y.; Zikirya, B. Spatiotemporal Relationship Characteristic of Climate Comfort of Urban Human Settlement Environment and Population Density in China. Front. Ecol. Evol. 2022, 10, 953725. [Google Scholar] [CrossRef]
  43. Hasnisah, A.; Azlina, A.A.; Taib, C.M.I.C. The Impact of Renewable Energy Consumption on Carbon Dioxide Emissions: Empirical Evidence from Developing Countries in Asia. IJEEP 2019, 9, 135–143. [Google Scholar] [CrossRef]
  44. Solaun, K.; Cerdá, E. Climate Change Impacts on Renewable Energy Generation. Rev. Quant. Projections. Renew. Sustain. Energy Rev. 2019, 116, 109415. [Google Scholar] [CrossRef]
  45. Yang, J.; Wang, Y.; Xue, B.; Li, Y.; Xiao, X.; Xia, J.; He, B. Contribution of Urban Ventilation to the Thermal Environment and Urban Energy Demand: Different Climate Background Perspectives. Sci. Total Environ. 2021, 795, 148791. [Google Scholar] [CrossRef] [PubMed]
Figure 1. The average global surface temperature change according to OECD data (in Celsius).
Sustainability 15 07013 g001
Figure 2. The relationship between GDP per unit of energy-related CO2 emissions and GDP per unit of TPES.
Sustainability 15 07013 g002
Figure 3. The relationship between GDP per unit of energy-related CO2 emissions and population density.
Sustainability 15 07013 g003
Figure 4. The relationship between surface temperature change and GDP per unit of energy-related CO2 emissions.
Sustainability 15 07013 g004
Figure 5. The relationship between surface temperature change and GDP per unit of TPES.
Sustainability 15 07013 g005
Figure 6. The relationship between surface temperature change and population density.
Sustainability 15 07013 g006
Figure 7. The composition of average energy consumption in OECD countries (1990–2019).
Sustainability 15 07013 g007
Table 1. Descriptive statistics.
VariablesMean Std. Dev.MinimumMaximum
30-year period (1990–2019)
Global surface temperature change1.37020.6774−1.25102.9170
Production-based CO2 productivity2.57745.3020−20.708435.0273
Energy consumption in agricultural sector3.25432.69990.079520.9211
Energy consumption in industrial sector26.66087.25649.449152.4687
Energy consumption in service sector11.06603.77981.968627.3501
Energy consumption in transport sector27.64798.47927.743358.9386
Population density126.9842127.84032.2375525.3340
Renewable electricity0.52944.0519−21.456625.9319
20-year period (2000–2019)
Global surface temperature change1.21800.6219−0.32802.9170
Production-based CO2 productivity2.81845.2214−20.708435.0273
Energy consumption in agricultural sector3.00992.22610.079515.8371
Energy consumption in industrial sector25.87137.37849.449152.4687
Energy consumption in service sector11.48753.15282.982919.2611
Energy consumption in transport sector28.67738.472110.076458.9386
Population density131.9845131.15982.4721525.3340
Renewable electricity0.76764.0811−21.456625.9319
10-year period (2010–2019)
Global surface temperature change1.34450.6756−0.32802.9170
Production-based CO2 productivity3.16545.5936−20.708435.0273
Energy consumption in agricultural sector2.85861.88280.51569.8115
Energy consumption in industrial sector25.34657.53449.449152.4687
Energy consumption in service sector11.86532.93203.005318.4020
Energy consumption in transport sector29.47928.539010.076458.9386
Population density135.7781135.00952.8839525.3340
Renewable electricity1.32554.5226−20.497225.9319
Table 2. Estimated coefficients relative to changes in global surface temperature.
30-Year Period 20-Year Period 10-Year Period
(1990–2019) (2000–2019) (2010–2019)
Coefficient VIF Coefficient VIF Coefficient VIF
Production-based CO2 productivity0.0308 **0.4916 0.0240 **0.4931 0.0362 **0.4700
(0.0038) (0.0042) (0.0064)
Energy consumption in agricultural sector−0.0600 **0.9384 −0.0179 1.1539 0.0016 1.3926
(0.0166) (0.0245) (0.0507)
Energy consumption in industrial sector0.0161 *0.4751 0.0212 *0.4822 −0.0077 0.5024
(0.0070) (0.0097) (0.0271)
Energy consumption in service sector0.0313 **0.8078 0.1367 (10−4) 0.9646 −0.1321 **1.0852
(0.0100) (0.0166) (0.0473)
Energy consumption in transport sector0.0882 **0.4722 0.0849 **0.4855 0.1487 **0.5289
(0.0077) (0.0106) (0.0234)
Population
density
0.0081 **0.0186 0.0066 **0.0184 0.0370 **0.0182
(0.0015) (0.0023) (0.0074)
Renewable electricity−0.0145 **0.5984 −0.0107 *0.5896 −0.0174 *0.5225
(0.0045) (0.0050) (0.0072)
F-test13.9661** 10.5507** 6.6054 **
LM-test312.4172** 263.6653** 22.9934 **
H-test25.1653** 19.7999** 16.6578*
RegressionFixed effects model Fixed effects model Fixed effects model
Notes: 1. * and ** denote significant levels at 5% and 1% level, respectively. 2. ( ) represents the standard error.
Disclaimer/Publisher’s Note: The statements, opinions and data contained in all publications are solely those of the individual author(s) and contributor(s) and not of MDPI and/or the editor(s). MDPI and/or the editor(s) disclaim responsibility for any injury to people or property resulting from any ideas, methods, instructions or products referred to in the content.

