Article

Fuzzy Analytical Hierarchy Process for Strategic Decision Making in Electric Vehicle Adoption

by
Pasura Aungkulanon
1,
Walailak Atthirawong
2 and
Pongchanun Luangpaiboon
3,*
1
Department of Materials Handling and Logistics Engineering, Faculty of Engineering, King Mongkut’s University of Technology North Bangkok, Bangkok 10800, Thailand
2
School of Science, King Mongkut’s Institute of Technology Ladkrabang, Bangkok 10520, Thailand
3
Thammasat University Research Unit in Industrial Statistics and Operational Research, Department of Industrial Engineering, Faculty of Engineering, Thammasat School of Engineering, Thammasat University, Pathumthani 12120, Thailand
*
Author to whom correspondence should be addressed.
Sustainability 2023, 15(8), 7003; https://doi.org/10.3390/su15087003
Submission received: 22 February 2023 / Revised: 14 April 2023 / Accepted: 17 April 2023 / Published: 21 April 2023
(This article belongs to the Special Issue Multicriteria Decision Analysis in Planning Sustainable Energy Use)

Abstract

:
In response to the requirement to address the global climate crisis in urban areas caused by the logistics sector, an increasing number of governments around the world have begun aggressive strategic actions to encourage manufacturers and consumers to adopt electric vehicle (EV) technology. One of the most beneficial aspects of driving an EV is that it reduces pollution while also reducing the use of fossil fuels, as well as improving public health by improving local air quality. Nevertheless, the level of EV adoption differs significantly across markets and geographies. EV adoption barriers slow the overall rate of electric mobility. This study ranks a list of obstacles and sub-hindrances to the adoption of electric vehicles in Thailand using the Fuzzy Analytical Hierarchy Process (FAHP), a Multi-Criteria Decision Making (MCDM) technique. The results showed that infrastructure policy barrier (A), which had the highest weight of 0.6058, was the biggest barrier to EV adoption, followed by technological barrier (B) with a weight of 0.2657, and then by market barrier with a weight of 0.1285. Insufficient charging infrastructure network (A3), lack of proper government support/incentives and collaboration (A1), insufficient electric power supply (A2), high capital cost (C3), and EV charging time (B3) were key sub-barriers to EV adoption in Thailand. Decision Making Systems (DMS) have additionally been created to assist executives in making decisions about the aforementioned barriers. The DMS is based on the concept of computer-aided decision making in that it allows for direct user interaction, analysis, and the ability to change circumstances and the decision-making process based on the executives’ own experience and abilities. Thus, the findings of this study aid in the formulation of market strategies for relevant stakeholders and shed light on potential policy responses.

1. Introduction

Reportedly, energy demand in the transportation sector is increasing due to the rapid increase in vehicle numbers, making this sector a significant emitter of global greenhouse gas emissions from gasoline-fueled consumption. The transportation sector was responsible for 24.6% of total global CO2 emissions [1]. Automobiles are clearly the main source of emissions in this sector, which contributes to the deterioration of the ecological environment [2]. Concerns about this issue have grown around the world [3,4]. According to Samaras and Meisterling [5] and Adhikari et al. [6], electric vehicles (EV) are among the most promising energy vehicle technologies, with the potential to reduce energy consumption as well as life-cycle GHG emissions in the transportation sector. Cox [7] and Romm [8] have also asserted that EVs are one of the relatively lowest-cost solutions to the problem of CO2 emissions and air pollution.
Aware of the potential environmental benefits of EVs, a number of countries, including Thailand, are contemplating EV adoption [6]. Since 2015, the Thai government has launched Thailand 4.0, a new national economic strategy, and developed a roadmap and policy to promote EV technology and support EV production, RandD, and usage in the country. The main goal was to reduce road pollution and promote the country as one of the world’s major production bases for zero-emission vehicles (ZEVs). Furthermore, the Thai government has established a Twenty-Year Plan EV roadmap and countrywide energy policy (2016–2036), with ambitious targets of manufacturing 1.2 million EVs, building 690 public fast chargers, and reducing energy intensity by 30% by 2036 [9]. To encourage EV market penetration, the Thai government has implemented a number of incentives and subsidies, including tax breaks and subsidies for imported and domestically produced automobiles and motorcycles. The excise tax on electric vehicles has been reduced from 8% to 2%, with subsidies amounting from 2000 to 4000 USD, depending on the vehicle’s type and model.
Electric vehicle adoption has increased since 2015. Nonetheless, several impediments to widespread purchasing activity remain. Several studies, mostly based on surveys and questionnaires, investigated numerous barriers to the successful diffusion of EVs in international contexts such as the United States, the United Kingdom, China, and India [10]. There is, however, very little empirical evidence specific to Thailand. Two studies on this topic were discovered focusing on the Thai market. Kongklaew et al. [11] investigated the relationship between barriers and personal characteristics on the consumer side of EV adoption. Meesuwan [12] conducted a qualitative analysis to identify barriers to EVs uptake in Thailand.
It was found that those barriers were frequently classified into several categories with both tangible and intangible aspects. Acknowledging those barriers and prioritizing the most major obstacles to EV acceptance would aid in the planning of strategies for tackling and extracting top-ranked barriers, as well as enabling and accelerating consumer adoption of EVs.
Since the majority of problems encountered in practice, including barriers to EV adoption in Thailand, are complicated and have various features, various investigations have been carried out to discover decision-making methods that minimize errors. The allocation of weight between the various aspects is critical to the predictive ability of multi-criteria decision-making (MCDM), and different aspect weighting strategies may lead to various decision outcomes [13]. Equal weights (EW) method [14], rank-order centroid (ROC) weights are some examples of various approximation weighting methods in scenarios where only the rank order information is available [15]. Other popular methods include rank-sum (RS) and rank reciprocal (RR) weights, which were proposed by Einhorn and McCoach [16] and Stillwell, Seaver and Edwards [17], respectively. These methods rank the attributes in order of importance, then weight each one in proportion to its position in the rank order.
Furthermore, when relative weight information is available, a ratio scale weighting method can be used, as it not only provides weight order information but also illustrates the magnitude difference between weights. However, true ratio weights are challenging to determine and are especially susceptible to response error [18].
According to Ishizaka and Nemery [19] and Song and Kang [20], other approaches for acquiring specific weights in real-world applications include the Delphi method [21], utility theory [22], Data envelopment analysis (DEA) [23] and analytic hierarchy process (AHP) [24]. Nevertheless, none of these techniques are completely perfect. Each has its own set of limitations, peculiarities, hypotheses, premises, and perspectives [25]. The Delphi method is based on multiple rounds of questionnaires distributed to an expert panel. There are two drawbacks: (1) the response time can be long, slowing the rate of discussion; and (2) it is also possible that the knowledge gained from the experts does not have inherent value. Utility analysis attempts to elicit a multidimensional utility function over the relevant attributes of the decision problem’s consequences in order to rank options. It can, however, be a time-consuming and difficult, if not impossible, task. This is due to difficulties in specifying the appropriate set of attributes and how they should be measured, as well as in comprehending the complex, obscure, and uncertain relationships that frequently exist between decisions and their consequences. In a DEA model, each decision unit is evaluated based on various outputs and inputs and classified as effective or ineffective. However, depending on the identified outputs and inputs, the measurement results may be sensitive.
The AHP method, on the other hand, is widely used in many fields of life due to its simplicity and flexibility. AHP makes decisions based on both quantitative and qualitative criteria [26], and it is well suited for group decision making as well as being understandable to administrators and decision-makers [27]. However, it has been claimed that AHP is incapable of dealing with an imprecise or unbalanced scale of judgment resulting from a pair-wise comparison process, which will affect the accuracy of the data and the results obtained. On the basis of this, another theory, the Fuzzy Analytic Hierarchy Process method, was developed.
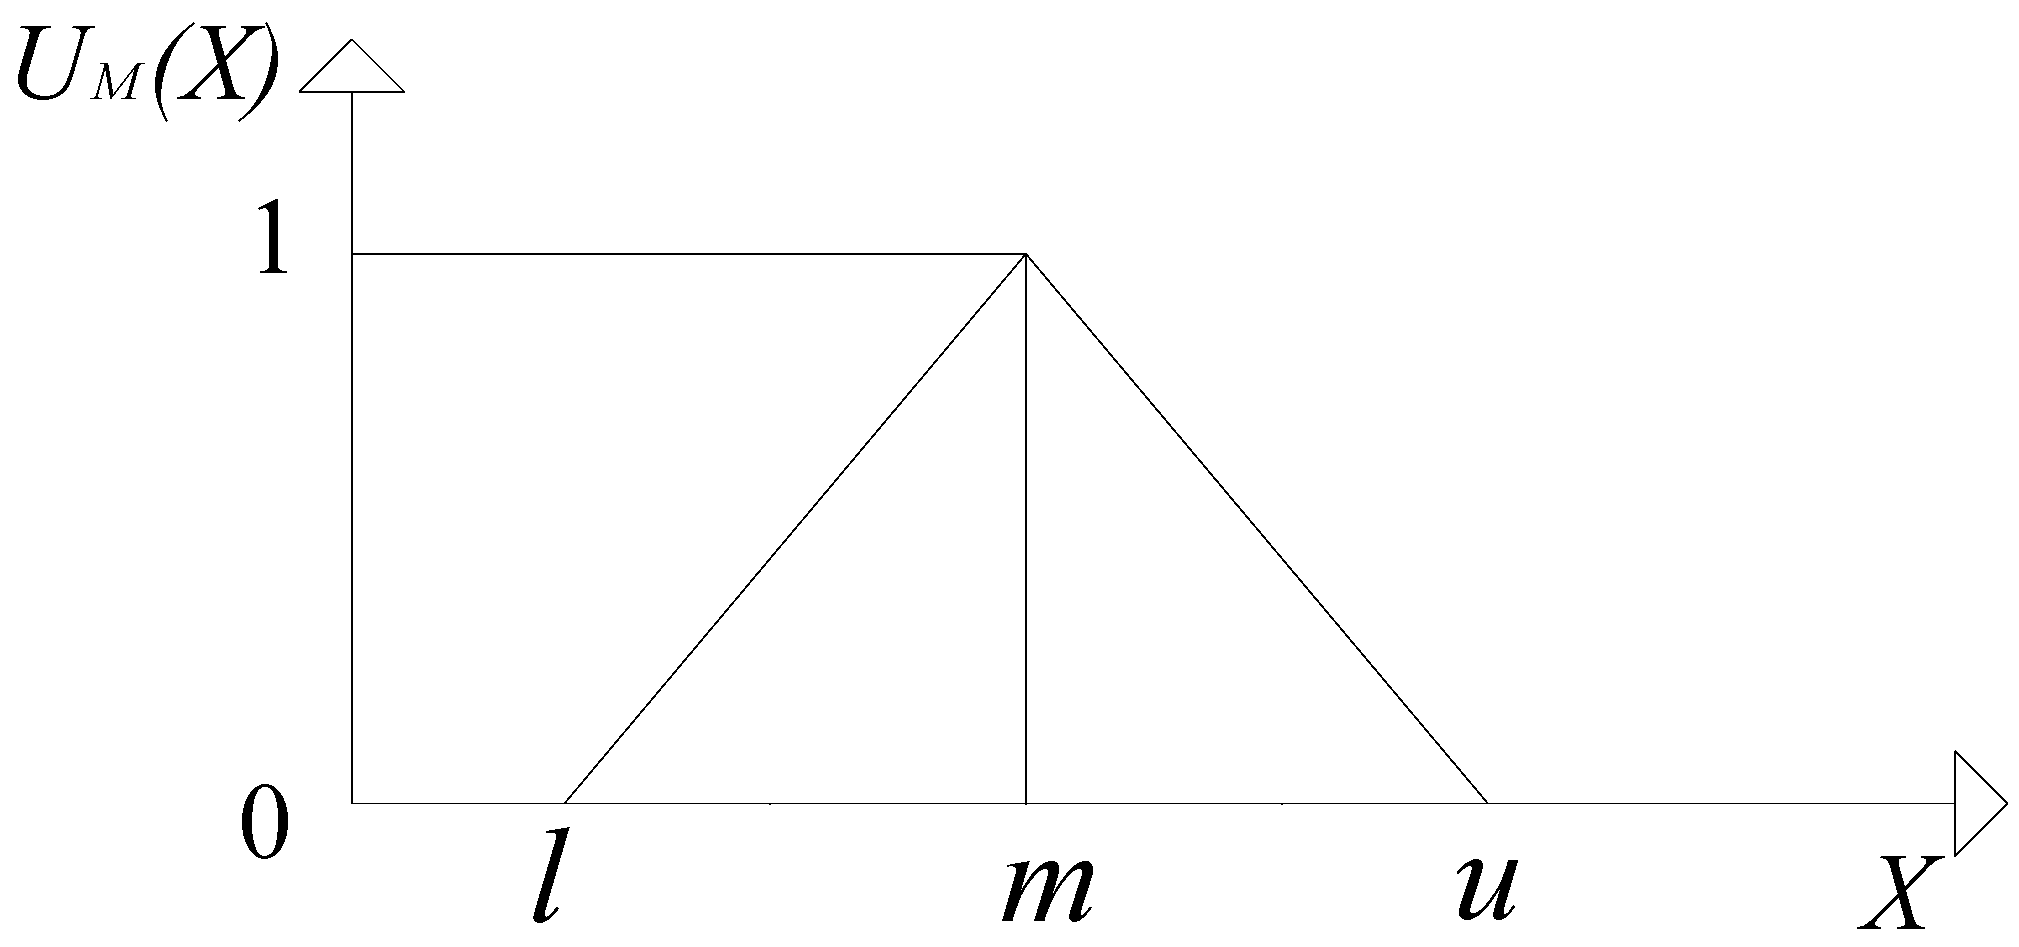
Fuzzy logic is founded on the observation that people make decisions based on inaccurate and non-numerical data. Fuzzy models and sets are mathematical tools used to represent ambiguous and inaccurate data. These models can recognize, represent, manipulate, interpret, and use ambiguous and uncertain data and information. The fuzzy set theory can be used to deal with uncertainty caused by vagueness [28]. Given that fuzzy can assist decision-makers in dealing with ambiguities in level of measurement data evaluation, it was combined with multi-criterion decision methods to determine the best result [29]. Consequently, Fuzzy Analytical Hierarchy Process (FAHP) method can be thought of as a sophisticated analytical approach that evolved from the conventional AHP.
In order to help managers, investors, practitioners, and researchers come up with potential solutions, it is necessary to use a MCDM technique to prioritize the obstacles to EV adoption. Additionally, it is necessary to combine MCDM techniques with fuzzy logic because the majority of decision-making issues arise in uncertain environments. As a result, FAHP was used to rank a list of various barriers of EV adoption. Despite the fact that many studies have identified barriers to electric vehicle adoption, very few have prioritized and identified the primary challenges in Thailand within the framework of a decision-making system (DMS). In this study, the FAHP is initially used to assess the barriers to EV adoption according to systematically collected data.
To extend this knowledge, this research focuses on determining the relative importance of the barriers to adopting EVs in Thailand using Fuzzy Analytical Hierarchy Process (FAHP) and ranking a list of EV barriers and sub-barriers through the pairwise comparison method.
  • To begin with, FAHP is being used more and more to determine the importance of barriers in a fuzzy environment due to its resemblance to human thoughts and coping with unclear and ambiguous information [30].
  • The method can incorporate both quantitative and qualitative factors.
  • Finally, results obtained can be used to set the guideline for barrier prevention and recommend ways to overcome them.
The following section presents a related study on barriers to the adoption of EV. After that, research methodology is summarized in Section 3. Next, the findings of this research are provided in Section 4. Finally, the conclusion and further study are highlighted.

2. Literature Review

Various governments are setting specific targets to encourage EV adoption in their countries in order to reduce GHG emissions that cause climate change. Regardless of the advantages of electric vehicles, numerous difficulties and limitations must be countered in order to be fully implemented. Previous research had been conducted to investigate the potential barriers to its adoption. According to relevant literature, barriers can be classified into several categories. For example, Zubaryeva et al. [31] divided EV adoption barriers into demographic criteria, environmental criteria, energy criteria, and transportation criteria. Some classified these impediments into three categories: infrastructure, financial, and technological obstacles [11,12,32]. These barriers were classified in this paper as infrastructure policy, technological, and market barriers. The following are the specifics:

2.1. Infrastructure Policy Barrier

Infrastructure and policy support are examples of this barrier. Infrastructure barriers include the availability and number of charging stations and networks [32,33] and the accessibility of repair and maintenance centers [34]. According to Haddadianet al. [35], because there is not enough charging infrastructure, prospective EV customers are hesitant to invest in EVs. Another impediment to the development of EV markets is the difficulty in installing home chargers, as some people do not have charging stations [36]. According to Bhalla et al. [37], investment in infrastructure and networks could encourage EV adoption. Electric vehicles use electricity as their primary energy source; however, in rural areas of the country, electricity may not be available. Furthermore, the government can play a significant role in encouraging EV adoption. As a result, the government should use appropriate incentives and effective policies to boost EV production.

2.2. Technological Barrier

According to She et al. [32], technological or vehicle performance barriers are related to consumers’ thorough evaluation of EVs, which play a crucial role in EV purchase. Safety, drive performance, reliability, car range, the short life of batteries, and low charging duration are all factors to consider. Consumers are concerned about safety standards and feeling safe while driving EVs as traffic grows [38].

2.3. Market Barrier

According to Adhikari et al. [6], a variety of variables impact consumer purchasing behavior toward EVs, such as the role of environmental awareness and attitudes, knowledge, and beliefs in relation to the intention to adopt EVs. According to Tsang et al. [39] and She et al. [32], the perception of EVs as a premium option with a higher price tag may stymie EV adoption. According to Sierzchula et al. [40], the purchase price is highly dependent on battery costs. The replacement of such batteries can also be a deterrent to consumers interested in purchasing EVs [41]. Furthermore, as technology evolves, the complexity of battery materials will be substituted in the future for increased driving range. Table 1 depicts various barriers to EV adoption that are being researched further.

3. Research Methodology

3.1. Decision Making Systems (DMS)

The way the government plays a part in encouraging investment in different kinds of electric vehicle enterprises has an impact on how effectively and how economically people are able to function. Preliminary data analysis, internal or external data evaluation, and decision-making through a reliable analysis system are necessary to promote and draw attention to sustainable energy. Therefore, expanding the usage of electric vehicles in the future is crucial. Data must be kept in the database system so that historical data can be used to forecast important future trends. A sizable database containing information from multiple databases organized by government agencies and outside organizations active in electric vehicles contains the pertinent data. To determine whether actual conditions differ from what was anticipated, this decision support tool offers an exception report or a criterion report. As a result, the system entails programming the processing to ascertain what occurred and how it should be fixed in order to achieve its intended goal.
An idea to create a channel to facilitate information seeking in multiple ways in accordance with users’ expectations came from the aforementioned issues. Users are also able to select the information they want to view on their own. Information is efficiently retrieved using the created system. Information can be received rapidly because it has already been effectively and swiftly processed by decisions made by public sector officials. Middle management makes these tactical decisions, which include overseeing and guaranteeing that duties are done in accordance with senior service policies, as well as resolving unexpected concerns [53].
As a result of all the information provided above, it has been decided that a DMS be put into place. While still being able to describe circumstances or problems for executives to use in conjunction with data processing technology to retain data, it can recognize scenarios, difficulties, as well as opportunities. There are delays and challenges with handling data while looking for information in a big database. To make data management more convenient and quicker for users, it was decided to process the data into the data storage before presenting it to the report for use in making decisions. This should enhance internal and external information search channels for managing electric vehicles. The utilization of information that has been aggregated to generate the most useful in various government agencies is another advantage that will be attained. The archive can be used to store data that has been obtained through the use of sophisticated engineering methods. The information obtained during processing aids in the executives’ hasty decision-making (Figure 1).
Decision making systems comprise sub-components of data management, mathematical model management, and user interaction management [54]. Data management sub-components include databases, database management systems, verifiability, data indexes, data extraction, and information obtained from various sources, either directly from government agencies or from the private sector. In order to retrieve or validate information relevant to decision-making, more established DMS systems may be linked to government databases or data warehouses. The statistical or mathematical model, the model-based data management system, the model language definition, and the model editing process, including model operations, are all part of mathematical model management.
The DMS in this study is focused on the management of appropriate mathematical models. Mathematical models, also known as quantitative models, are a class of models that can be used to investigate the barriers to the use of electric vehicles. A model base management system, which is software that allows users to create and manage models as well as run appropriate models, is also available. The primary function of the quantitative model base management system is to define the DMS model quickly and easily. Capabilities for decision makers to manipulate or use models for experimentation or analysis of how changes in input variables affect output variables, also known as Sensitivity Analysis.
Other features include the ability to store and manage various types of models that may become available in the future, accessing and working with other ready-made models, and grouping and displaying model table of contents. The ability to track model usage and properly link different models through the database allows for the management and maintenance of public and private model bases. Optimization models and simulations can be used as case studies to determine the optimal responses for a given conditional variable in a set of situations of interest. The goal is to represent the state of the system to be studied and then experiment from the model to see what happens to the system before putting it into action (Figure 1).

3.2. Fuzzy Analytical Hierarchy Process (FAHP)

Multi-criteria decision-making (MCDM) is a well-structured and multidimensional process that has been developed to examine a wide range of competing criteria which address decision-making problems in various fields [55,56]. MCDM methodologies offer a methodical process to assist decision-makers in selecting the most desirable and satisfactory option in an uncertain situation [57]. MCDM problems are typically classified into two types. One type of problem involves a set of alternative solutions. Another way is to illustrate problems with an infinite number of solutions. Decision making is a challenging problem in which organizations struggle to achieve the desired outcome. The decision-making process is the act of selecting the best strategy for accomplishing the desired objectives and goals [58]. Gupta [59] claims that MCDM results in logical and reasonable decision rankings.
Without a doubt, MCDM has grown in popularity in recent years and is now widely used in a variety of management contexts, particularly in policy strategic decision-making; for example, sustainable energy policy [25,60], water management [61,62,63], location selection [64,65], software selection [66], and supply chain management [67,68,69], amongst others.
In practice, the judgment of a decision-maker is typically ambiguous, uncertain and vague. Many decision-makers are unable to explain their judgments on specific attributes using precise numbers, but they are better able to explain their views using descriptive scales, such as high, medium, and low [70]. As a result, to negotiate with imprecise and ambiguous information, Zadeh [28] developed the concept of fuzzy sets. A fuzzy number is a fuzzy set in 𝕽, more specifically a mapping x: 𝕽 [0,1], that could be mathematically represented by a membership function, μ M x . A triangular fuzzy number (TFN) can be represented by a triplet (l, m, u). The specifications 𝑙, 𝑚, 𝑢 are the smallest, most likely, and highest crisp numerical values, respectively, as displayed in Figure 2.
The membership function ( μ M x ) of a triangular fuzzy number is as follows.
μ M x = x l / m l l x m u x / u m m x u 0 otherwise
Fuzzy numbers can have any value between 0 and 1. (TFN ∈ [0,1]), by fuzzy membership, functions with the inclusion of upper and lower bounds, whereas crisp values refer to the binary logic [0,1]. Fuzzy numbers can be defined with different ‘shapes’, e.g., uniform, triangular, trapezoidal, etc., which can be used depending on the situation. However, in many applications, TFNs are commonly employed in practical applications, due to ease of computation [71], and thus used here to evaluate the barriers to adopting EVs.
The Analytical Hierarchy Process (AHP), a multi-criteria decision-making method, is frequently used to address decision-making issues that involve expert judgment [72]. It creates hierarchical solutions for unstructured problems by incorporating quantitative and qualitative criteria. Lin [73] argued that AHP is incapable of dealing with an imprecise or unbalanced scale of judgments resulting from a pairwise comparison process expressed by personal opinions.
Fuzzy Analytic Hierarchy Process (FAHP), a combination of two concepts, fuzzy logic and AHP, was then proposed to address imprecise expert opinions through fuzzy numbers [74]. Several academics have recommended a variety of FAHP methods, including [75,76] used TFNs to create fuzzy weights for evaluation ratios. Chang [76] proposed an extent analysis method for calculating crisp weights from pairwise comparison matrices’ synthetic value ranges. Later, Mikhailov [77] proposed a fuzzy prioritization method based on nonlinear optimization to achieve crisp weights from fuzzy comparison matrices.
In this study, the weights of the criteria were determined using the FAHP technique. Fuzzy pairwise evaluations were established using Chang’s extent analysis approach [76]. The membership functions of a TFN were employed to demonstrate pairwise comparisons of decision variables in a set of labels from “Very bad” to “Excellent. The membership functions, Mi = (mi1, mi2, mi3), i ∈ {1,2,   ,n} and mi1, mi2, mi3 are the smallest possible values, peak value and largest possible value of the fuzzy number Mi, respectively. Following Chang’s extent analysis approach [76], each object was taken and the extent for each goal, gi,, was evaluated. Consequently, the m extent analysis values for each object were acquired as the following symbols:
M g i 1 , M g i 2 , , M g i m ;   i = 1 ,   2 ,   ,   n
where M j = 1 ,   2 , , m g i j are triangular fuzzy numbers.
Bozbura [78] describes a number of procedures for calculating the weight of an FAHP. Among these procedures, the extent analysis method proposed by Chang [76] was employed in this study to incorporate fuzzy numbers into crisp numbers by utilizing the knowledge of intersection between two fuzzy numbers and a degree of possibility. The steps in Chang’s FAHP extent analysis method is listed below [79,80]:
Step 1: The merit of fuzzy synthetic extent in relation to the object, i, is calculated as follows:
S i = j = 1 m M g i j i = 1 n j = 1 m M g i j 1
To produce j = 1 m M g i j   accomplish the fuzzy addition of m extent analysis values for a specific matrix, such that
j = 1 m M g i   j = j = 1 m l j ,   j = 1 m m j , j = 1   m u j
to obtain   i = 1 n j = 1 m M g i j 1 , perform the fuzzy addition of M g i j j =   1 , 2 , , m   values such that
i = 1 n j = 1 m M g i j = j = 1 m l j ,   j = 1 m m j , j = 1   m u j
and then calculate the inverse of the vector in Equation (5):
i = 1 n j = 1 m M g i j 1 = 1 i = 1 n u i , 1 i = 1 n m i , 1 i = 1 n l i
Step 2: The degree of possibility of M 2 = l 2 , m 2 , u 2   M 1 = l 1 , m 1 , u 1 is defined as
V M 2 M 1 = sup   min   ( μ M 1 x ,   μ M 2 y
which can be equally defined as:
V M 2 M 1 = 1 0 l 1 u 2 m 2 u 2 m 1 l 1         if     m 2 m 1 , if     l 1   u 2 , otherwise
where the plot of the greatest intersection is point, d, between μ M 1   and μ M 1   (see Figure 3). To differentiate M 1 and M 2 , it requires the values of V   M 1 M 2   and V   M 2 M 1 .
Step 3: The degree of the possibility for a convex fuzzy number to be better than k convex fuzzy numbers, M i   i   =   1 , 2 , , k , could be described as
V M M 1 , M 2 , , M k   =   min V M M i :   i = 1 ,   2 , ,   k
Step 4: Calculation of the weights vector by assuming that
d S i   =   min V S i S k   k   =   1 , 2 , , n ; k     i
then the weights vector, W, is provided by
W = d S 1 ,   d S 2 ,   ,   d S n T
Step 5: The normalized weight vectors were calculated as follows
W = d A 1 , d A 2 , ,   d A n T
Fuzzy linguistic terms and their TFNs and Triangular Fuzzy Reciprocal Numbers (TFRNs) which are used for pairwise comparisons in FAHP method are displayed in Table 2.

3.3. Consistency Ratio

The AHP method relies heavily on consistency. The decision-pairwise maker’s comparison evaluation necessitates a certain level of matrix consistency. Saaty [82] states that the consistency ratio (CR) is determined with Equation (13):
C R   =   C I R I  
where C I   =   λ m a x n n 1 and λ m a x = i = 1 n j = 1 n a i j W j , where RI denotes the random consistency index [82]. The CR must be within an acceptable range (i.e., 10%) depending on the granularity of the scale being used and on which considered comparisons were consistent, or the comparisons should be revised. The flowchart (Figure 4) below illustrates the steps, sequences, and decisions of a process or workflow.

4. Application of FAHP and Results

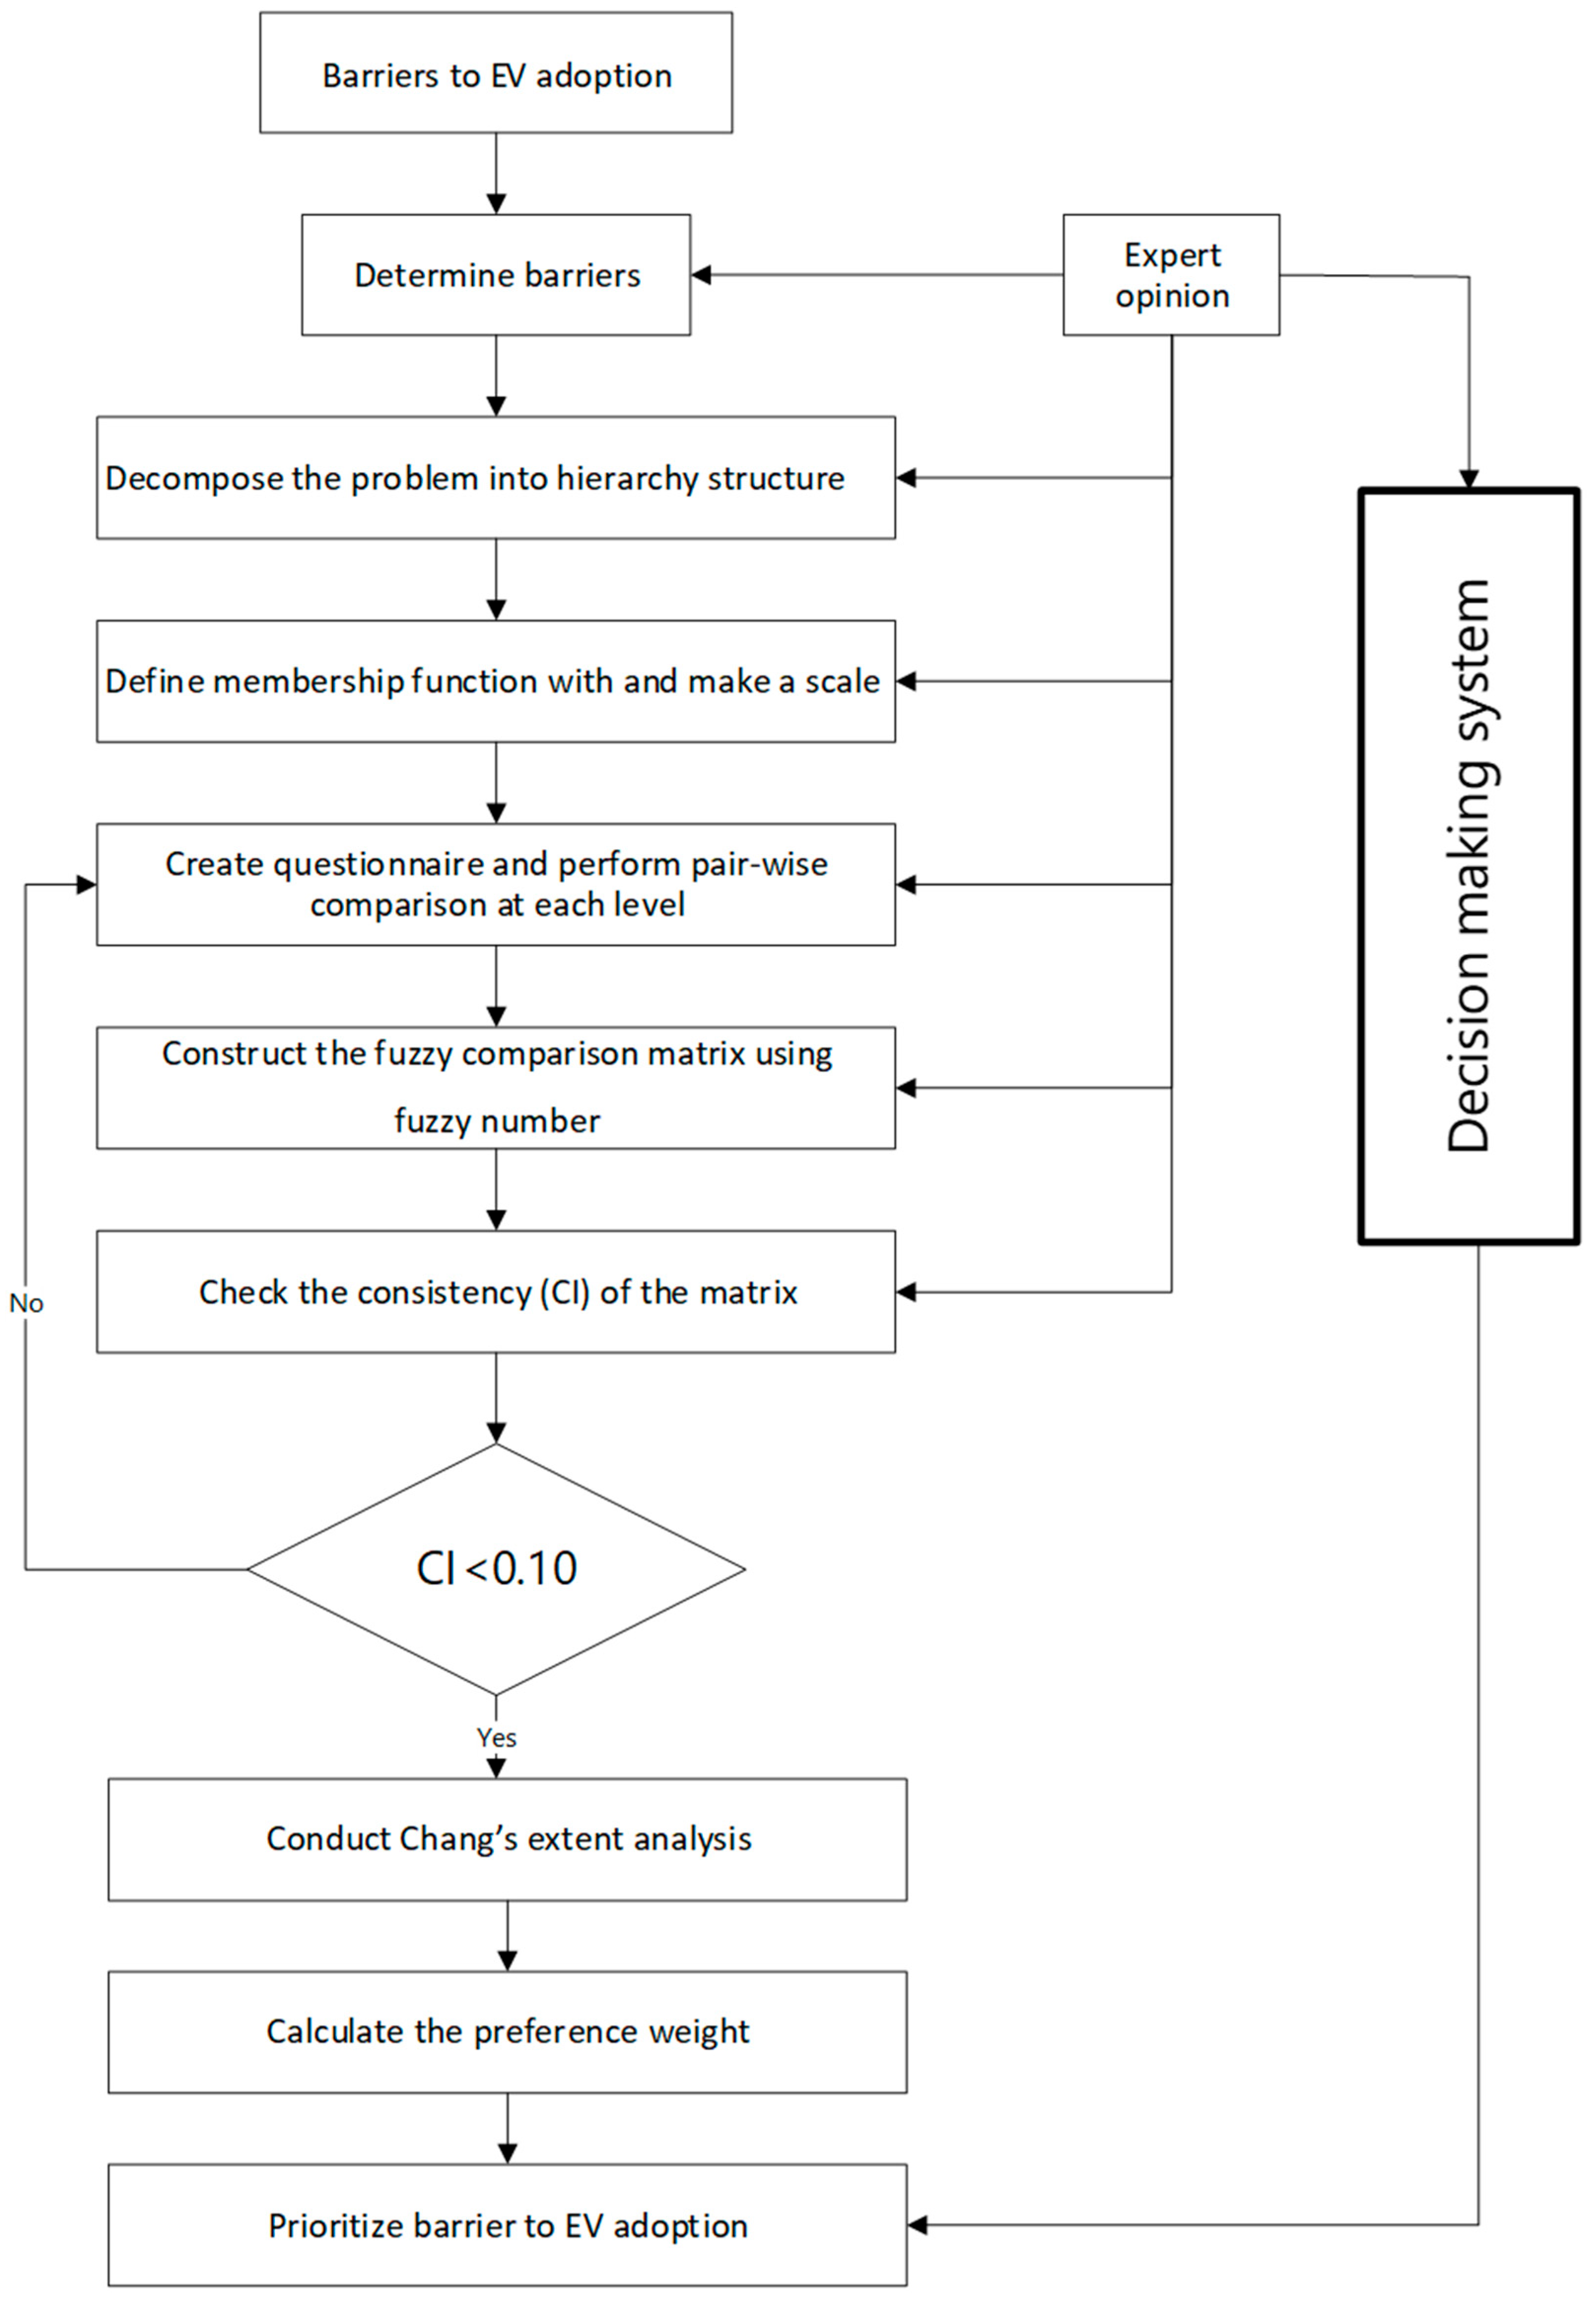
The FAHP methodology was applied to determine the most significant barriers to the adoption of EVs. The following are the steps to prioritize those barriers and the results.
Step 1: Six experts from different representatives were selected to involve in this study—two senior managers from auto manufacturing companies, two government officers, one representative from dealers, and one customer.
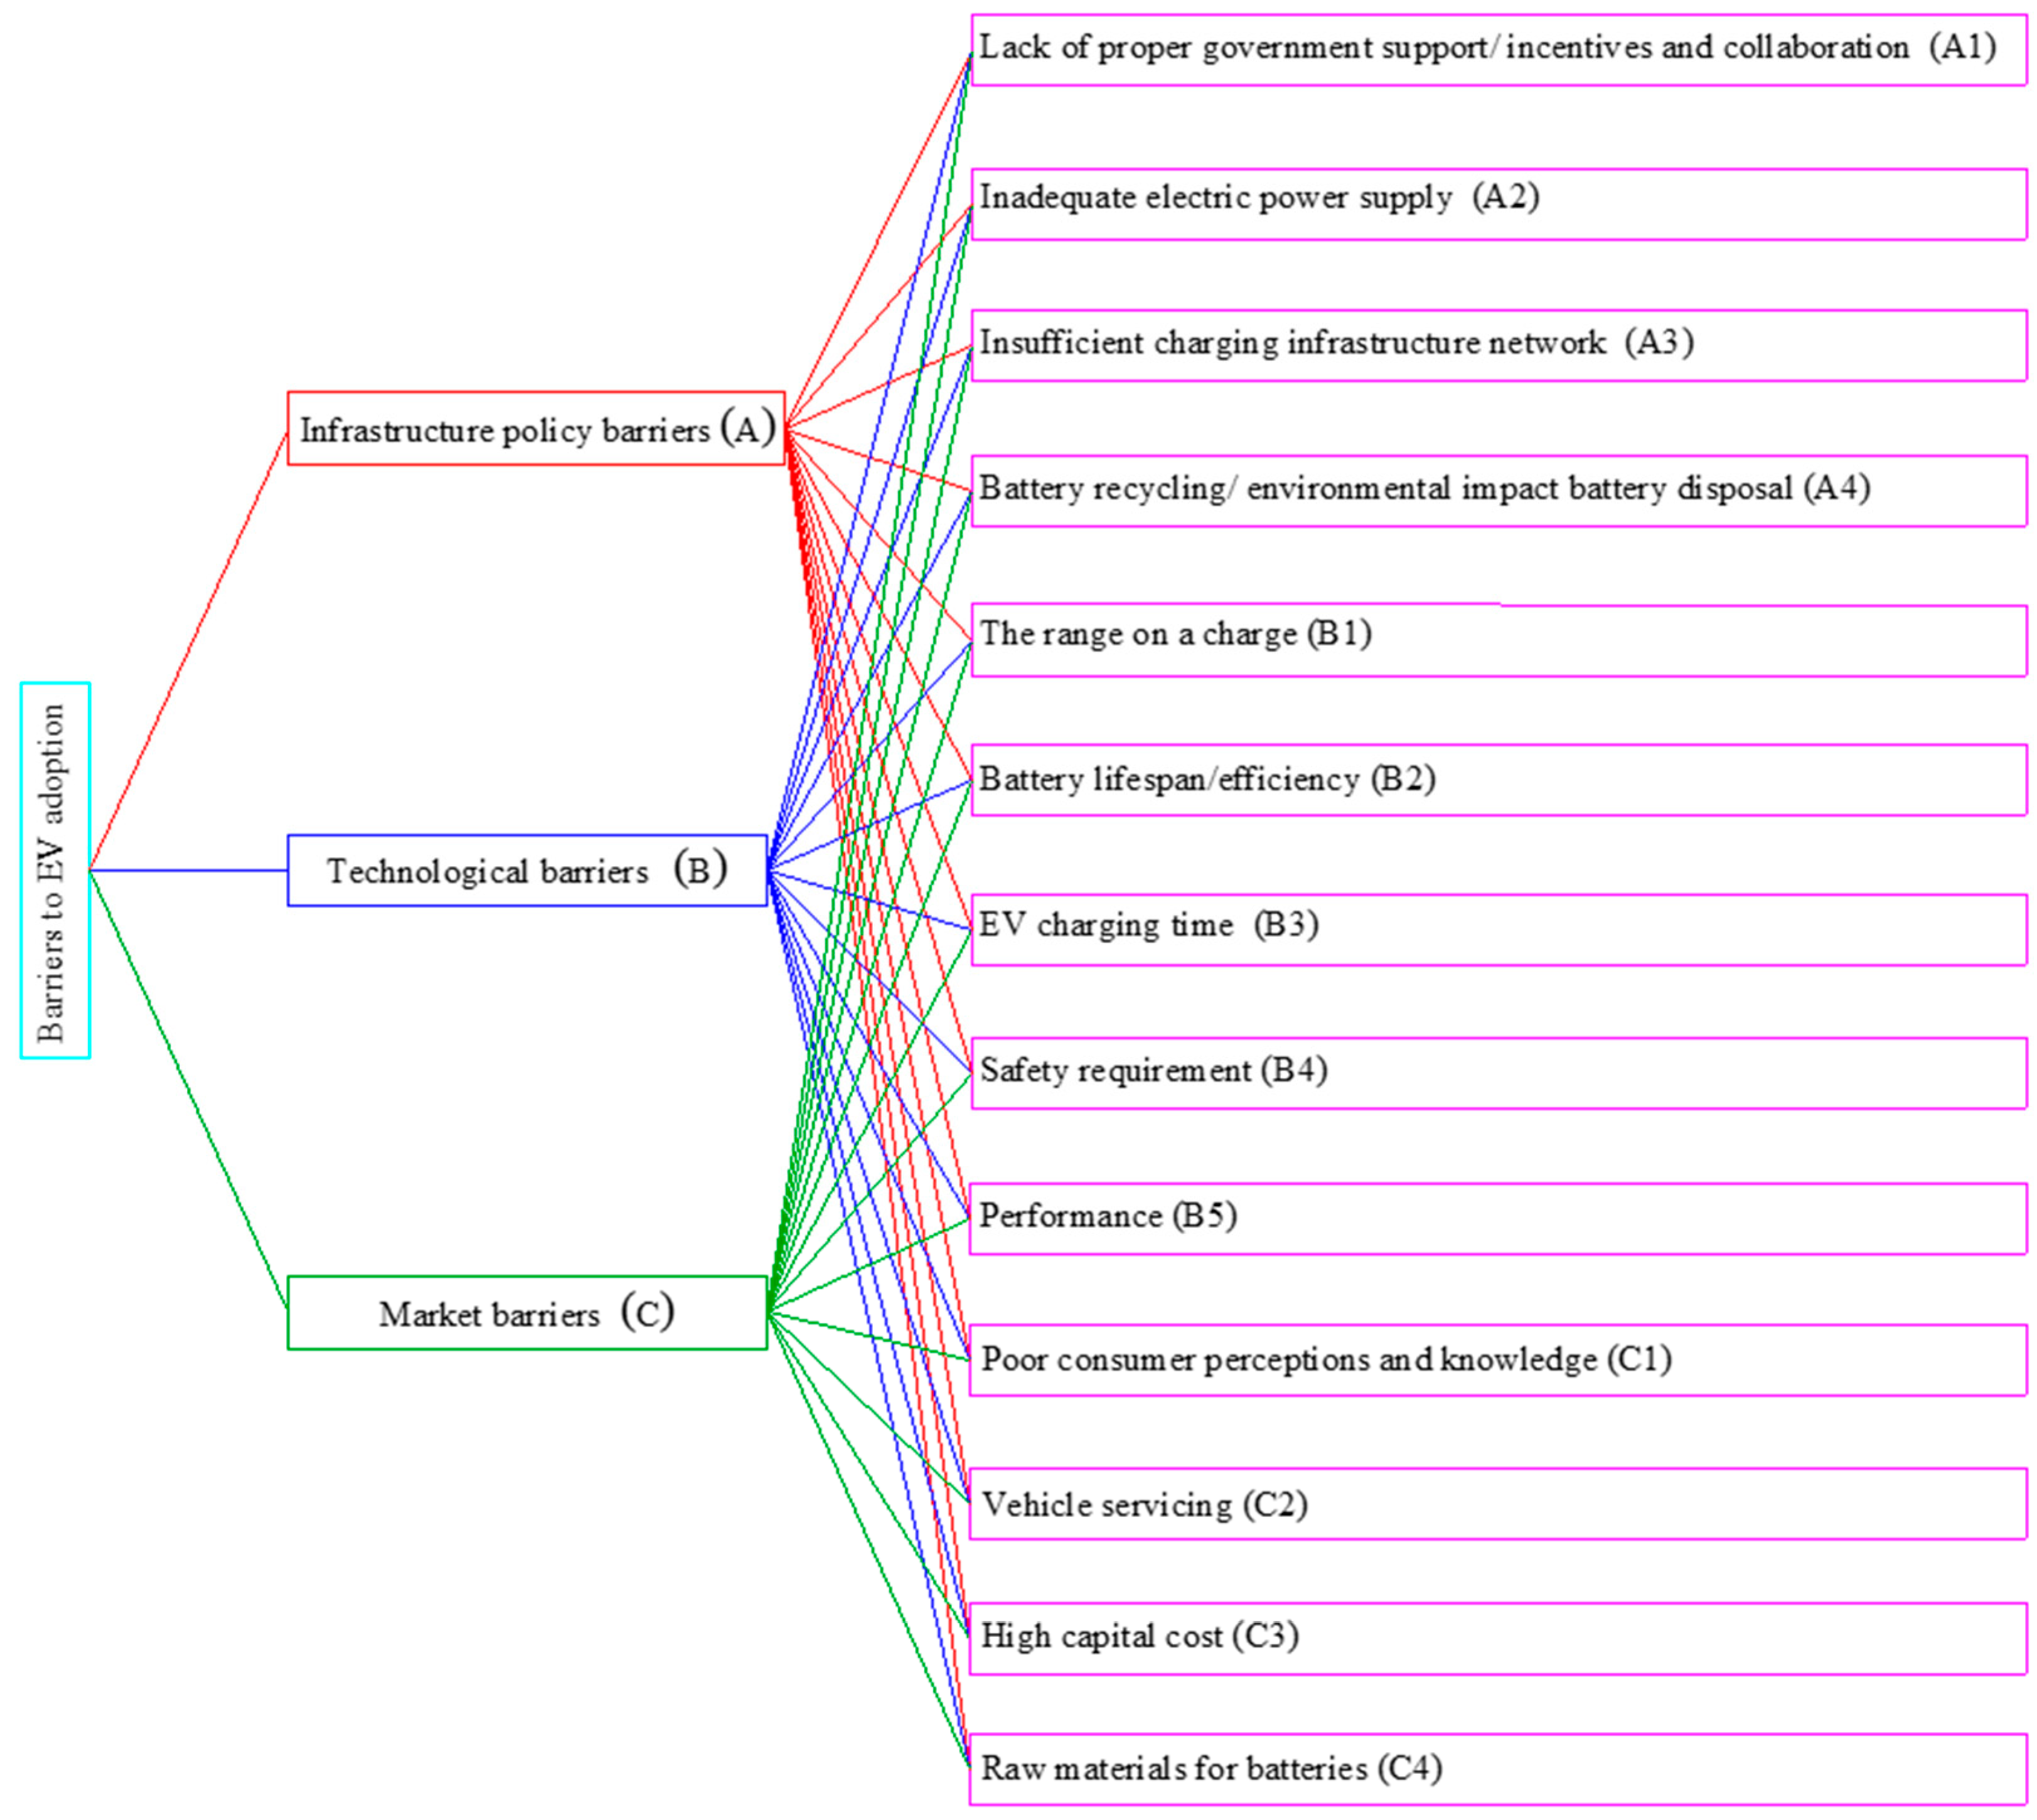
Step 2: Clarify the main barriers and sub-barriers. Following a review of the literature and consultation with experts, three main barriers—an infrastructure policy barrier (A), a technological barrier (B), and a market barrier (C)—were determined with 13 sub-barriers, as displayed in Figure 5. According to AHP’s assumptions, each barrier and its sub-barrier is comprised of mutually related elements [83]. A structural hierarchy denotes the relationships between complex system components, where these relationships are understood as an arrangement in terms of structural properties. Those barriers and sub-barriers were evaluated by six experts.
Step 3: Calculate the local weights of the main barriers and sub-barriers by using pairwise comparison matrices and calculate fuzzy weights. Pairwise comparisons using a 1–9 scale were introduced with the Fuzzy AHP method within each main barrier or sub-barriers, and then those scales were converted into linguistic scales as shown in Table 2.
Step 4: A geometric mean was applied to combine the fuzzy weights of those six experts into final pairwise tables of main and sub barriers. After that, the linguistic judgments were transformed into triangular fuzzy numbers. Table 3 shows geometric values of fuzzy triangular number of main barrier and Table 4, Table 5 andTable 6 show geometric values of fuzzy triangular number of the sub-barriers, respectively. It was also found that CR values of all matrices were less than 0.1, hence these matrices are consistent.
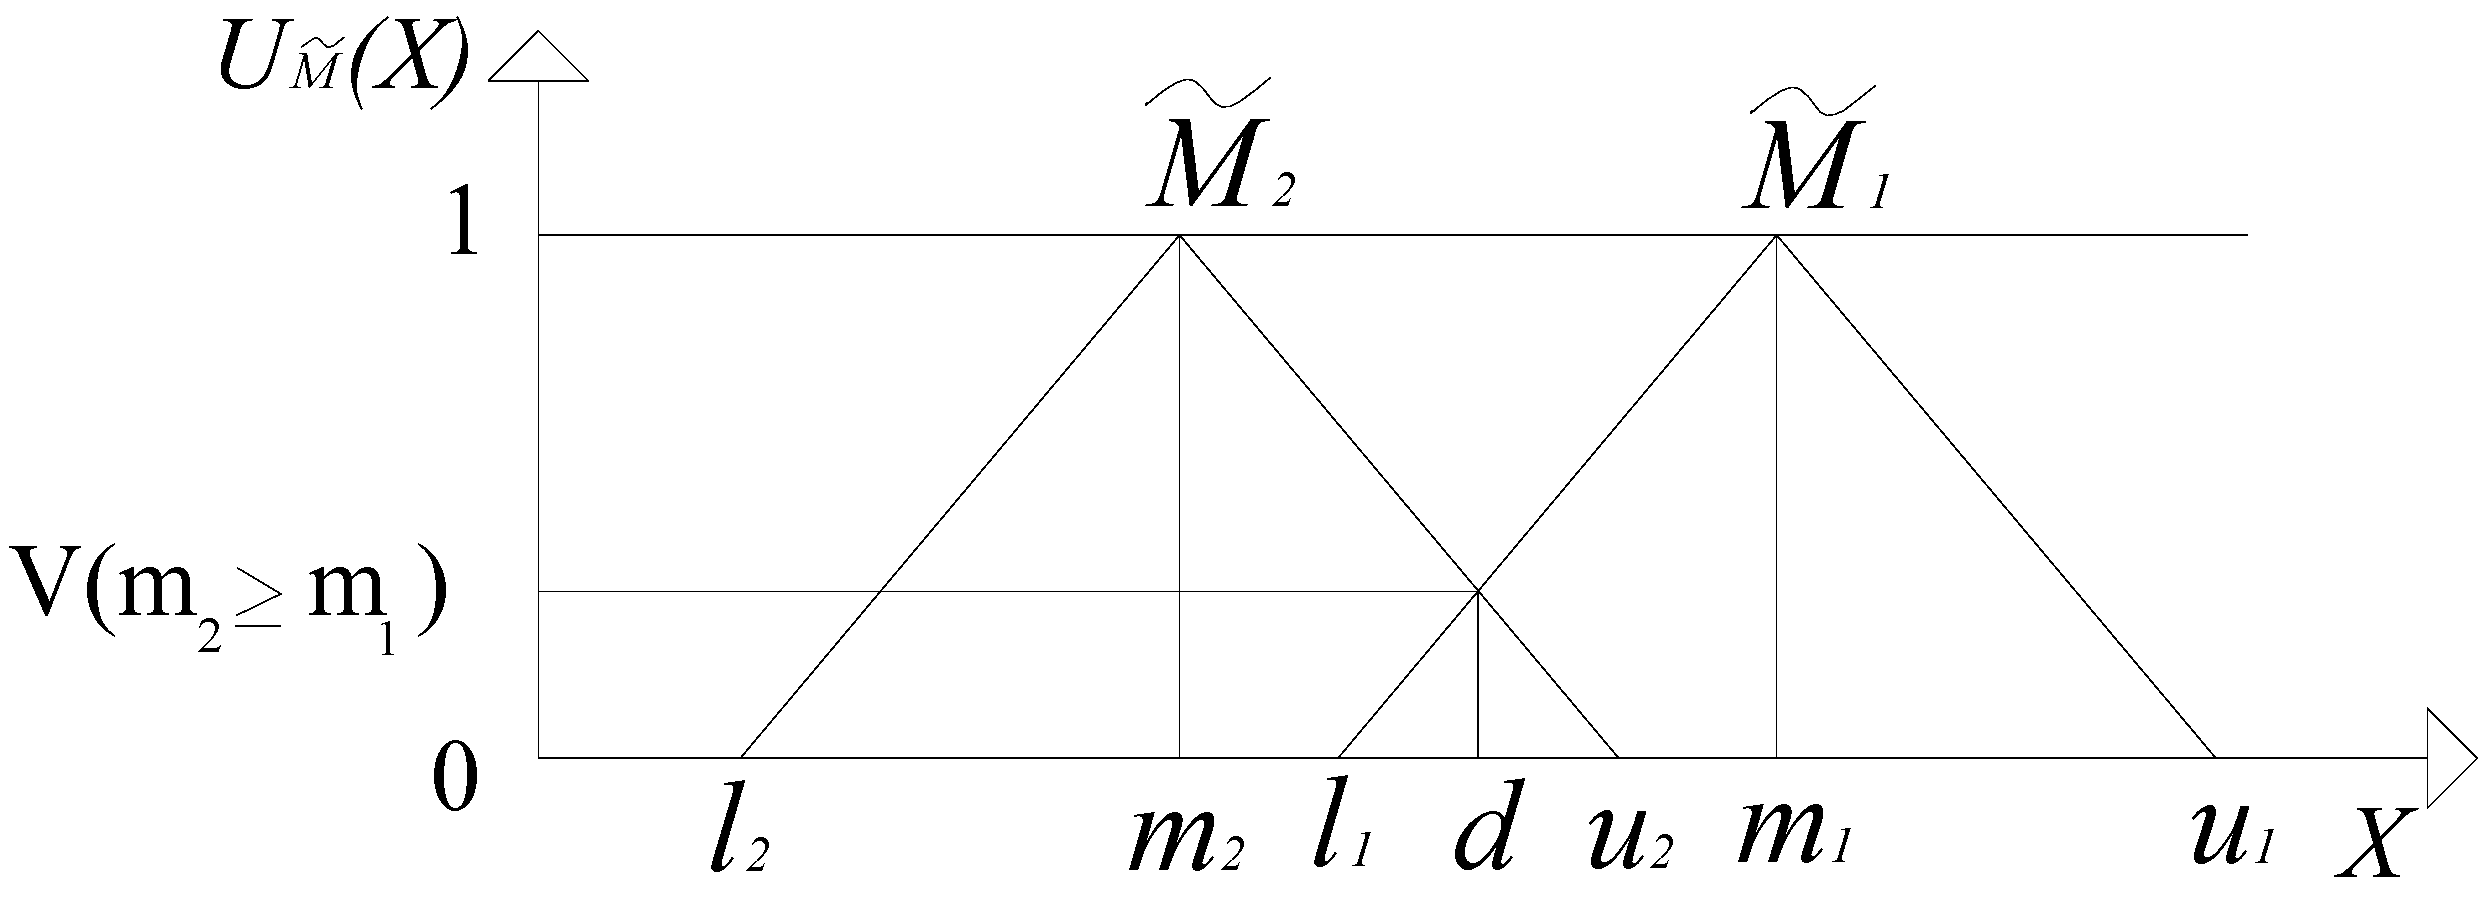
The final weight of those barriers was obtained and normalized weight vectors were finally acquired following Chang’s extent analysis method on FAHP. Table 7 demonstrates the final weight of importance for each of these main and sub-barriers.
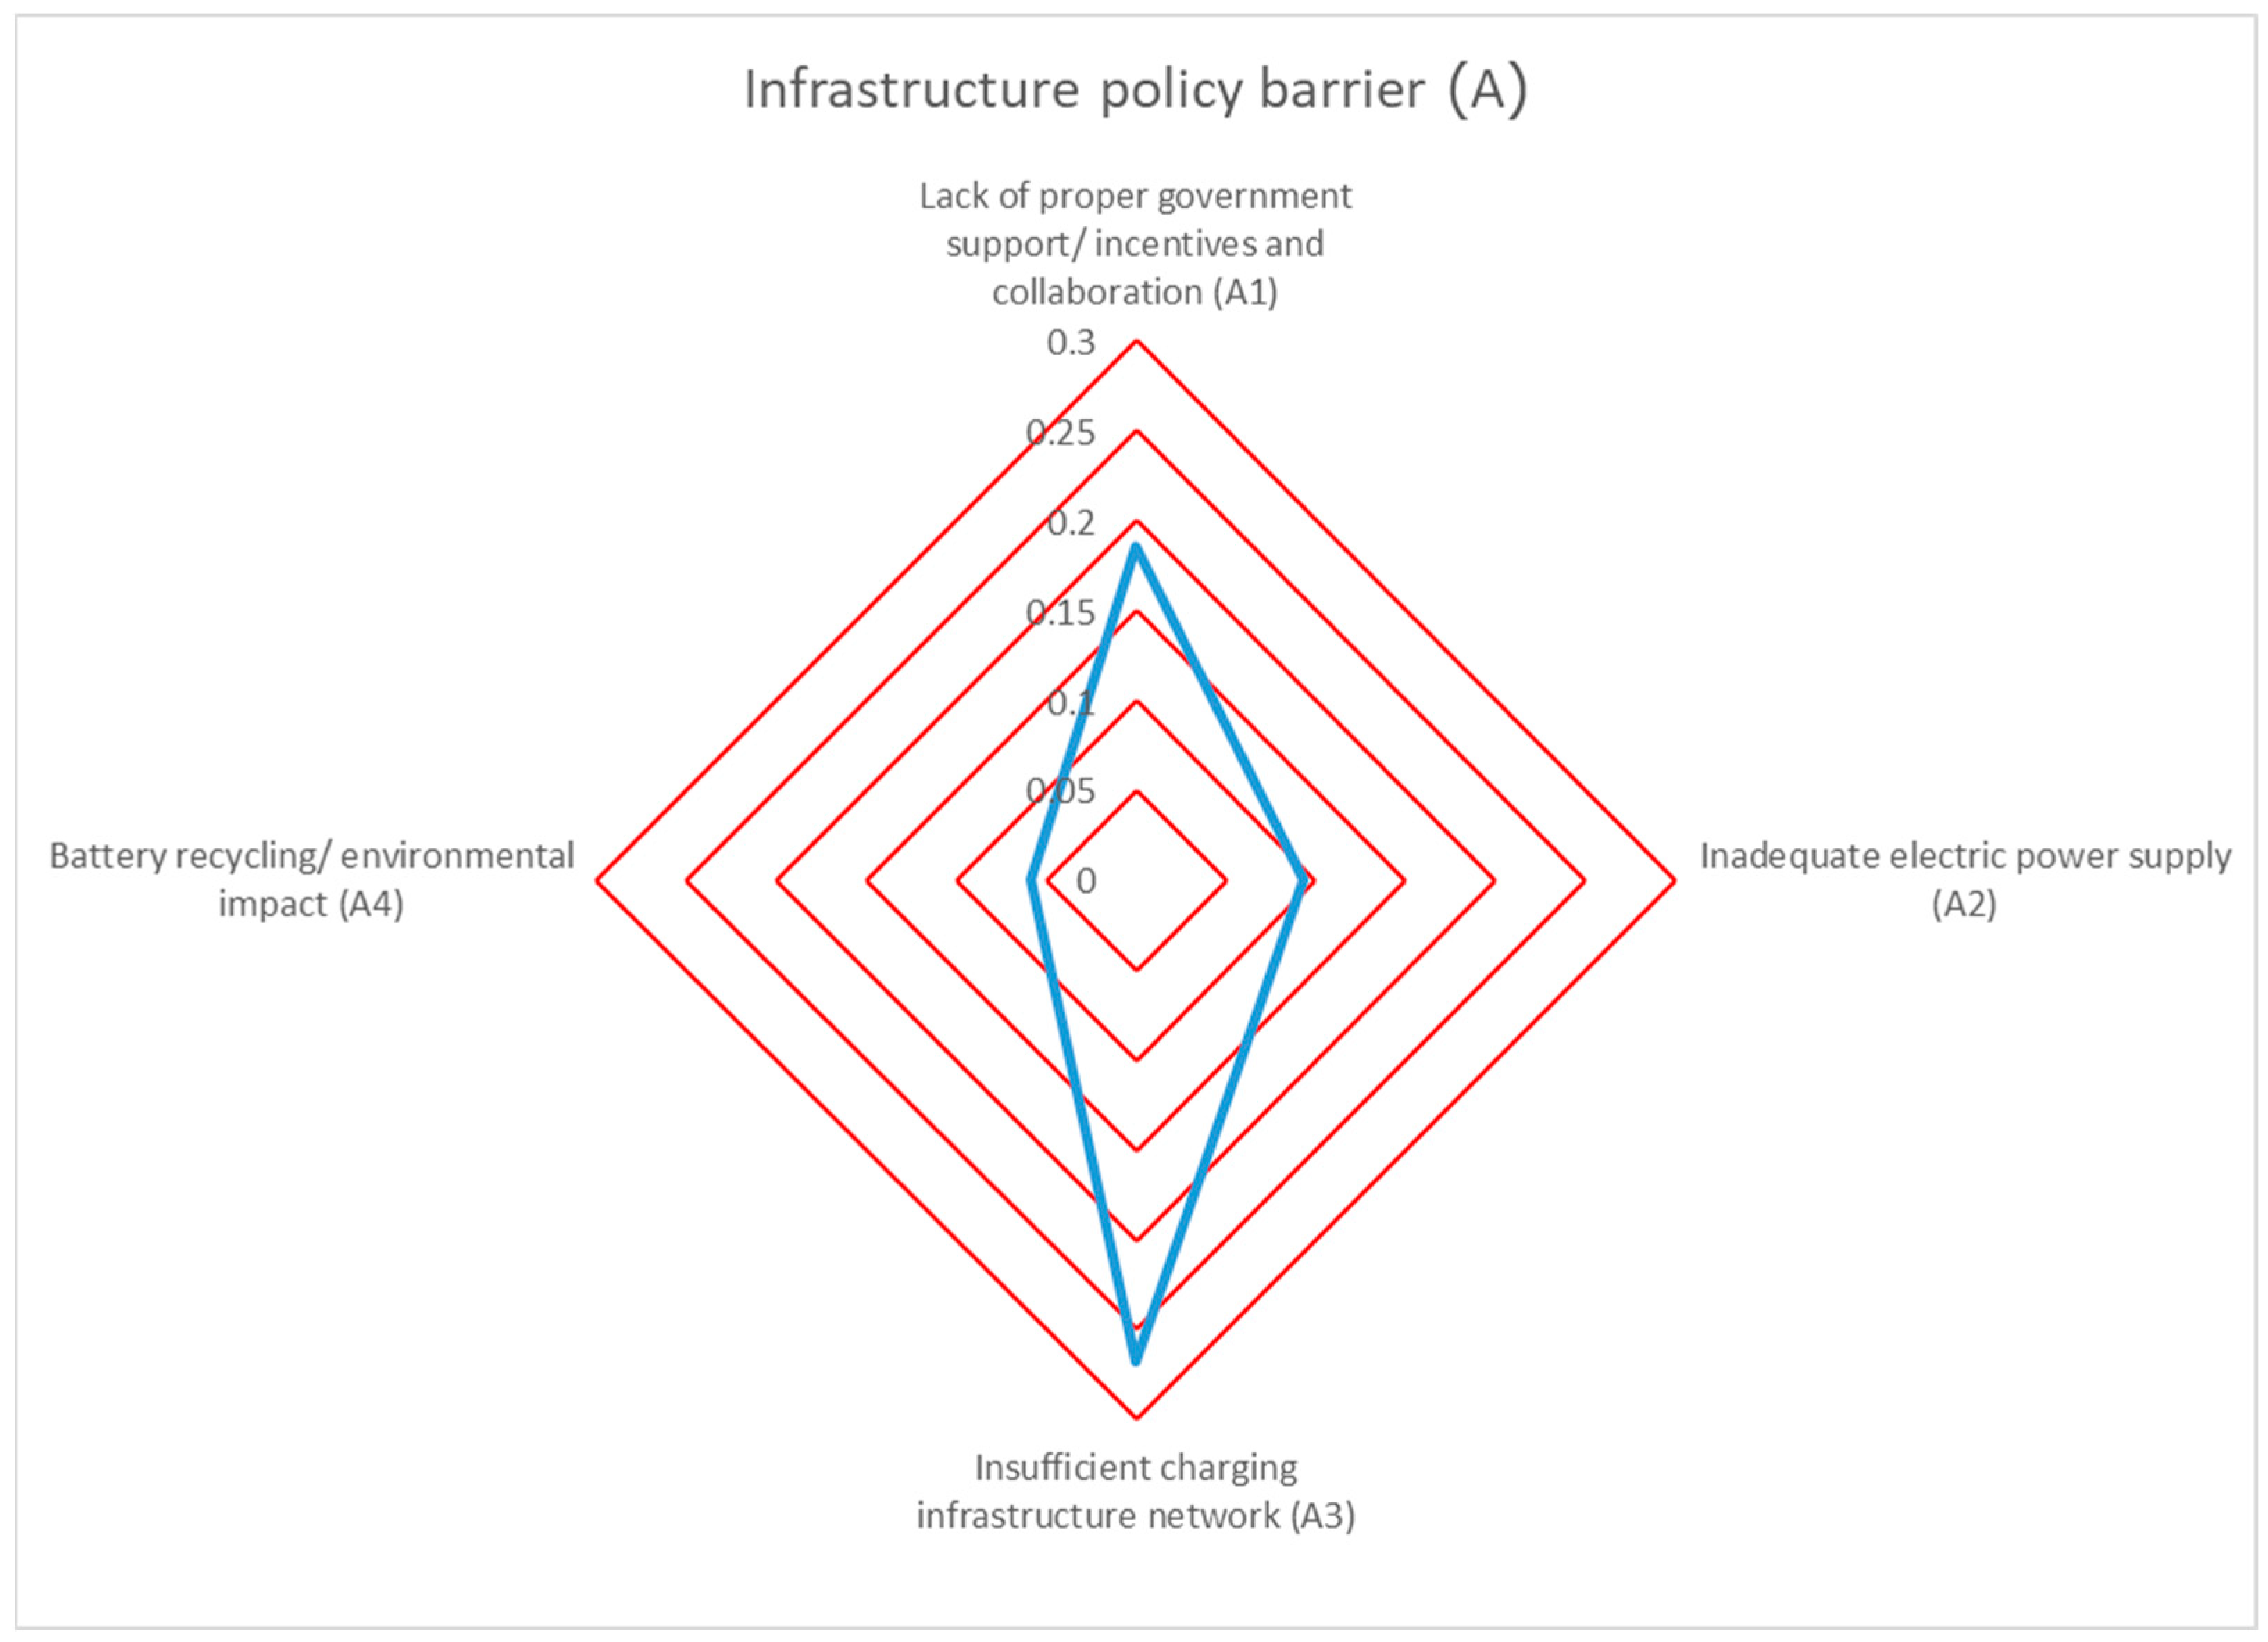
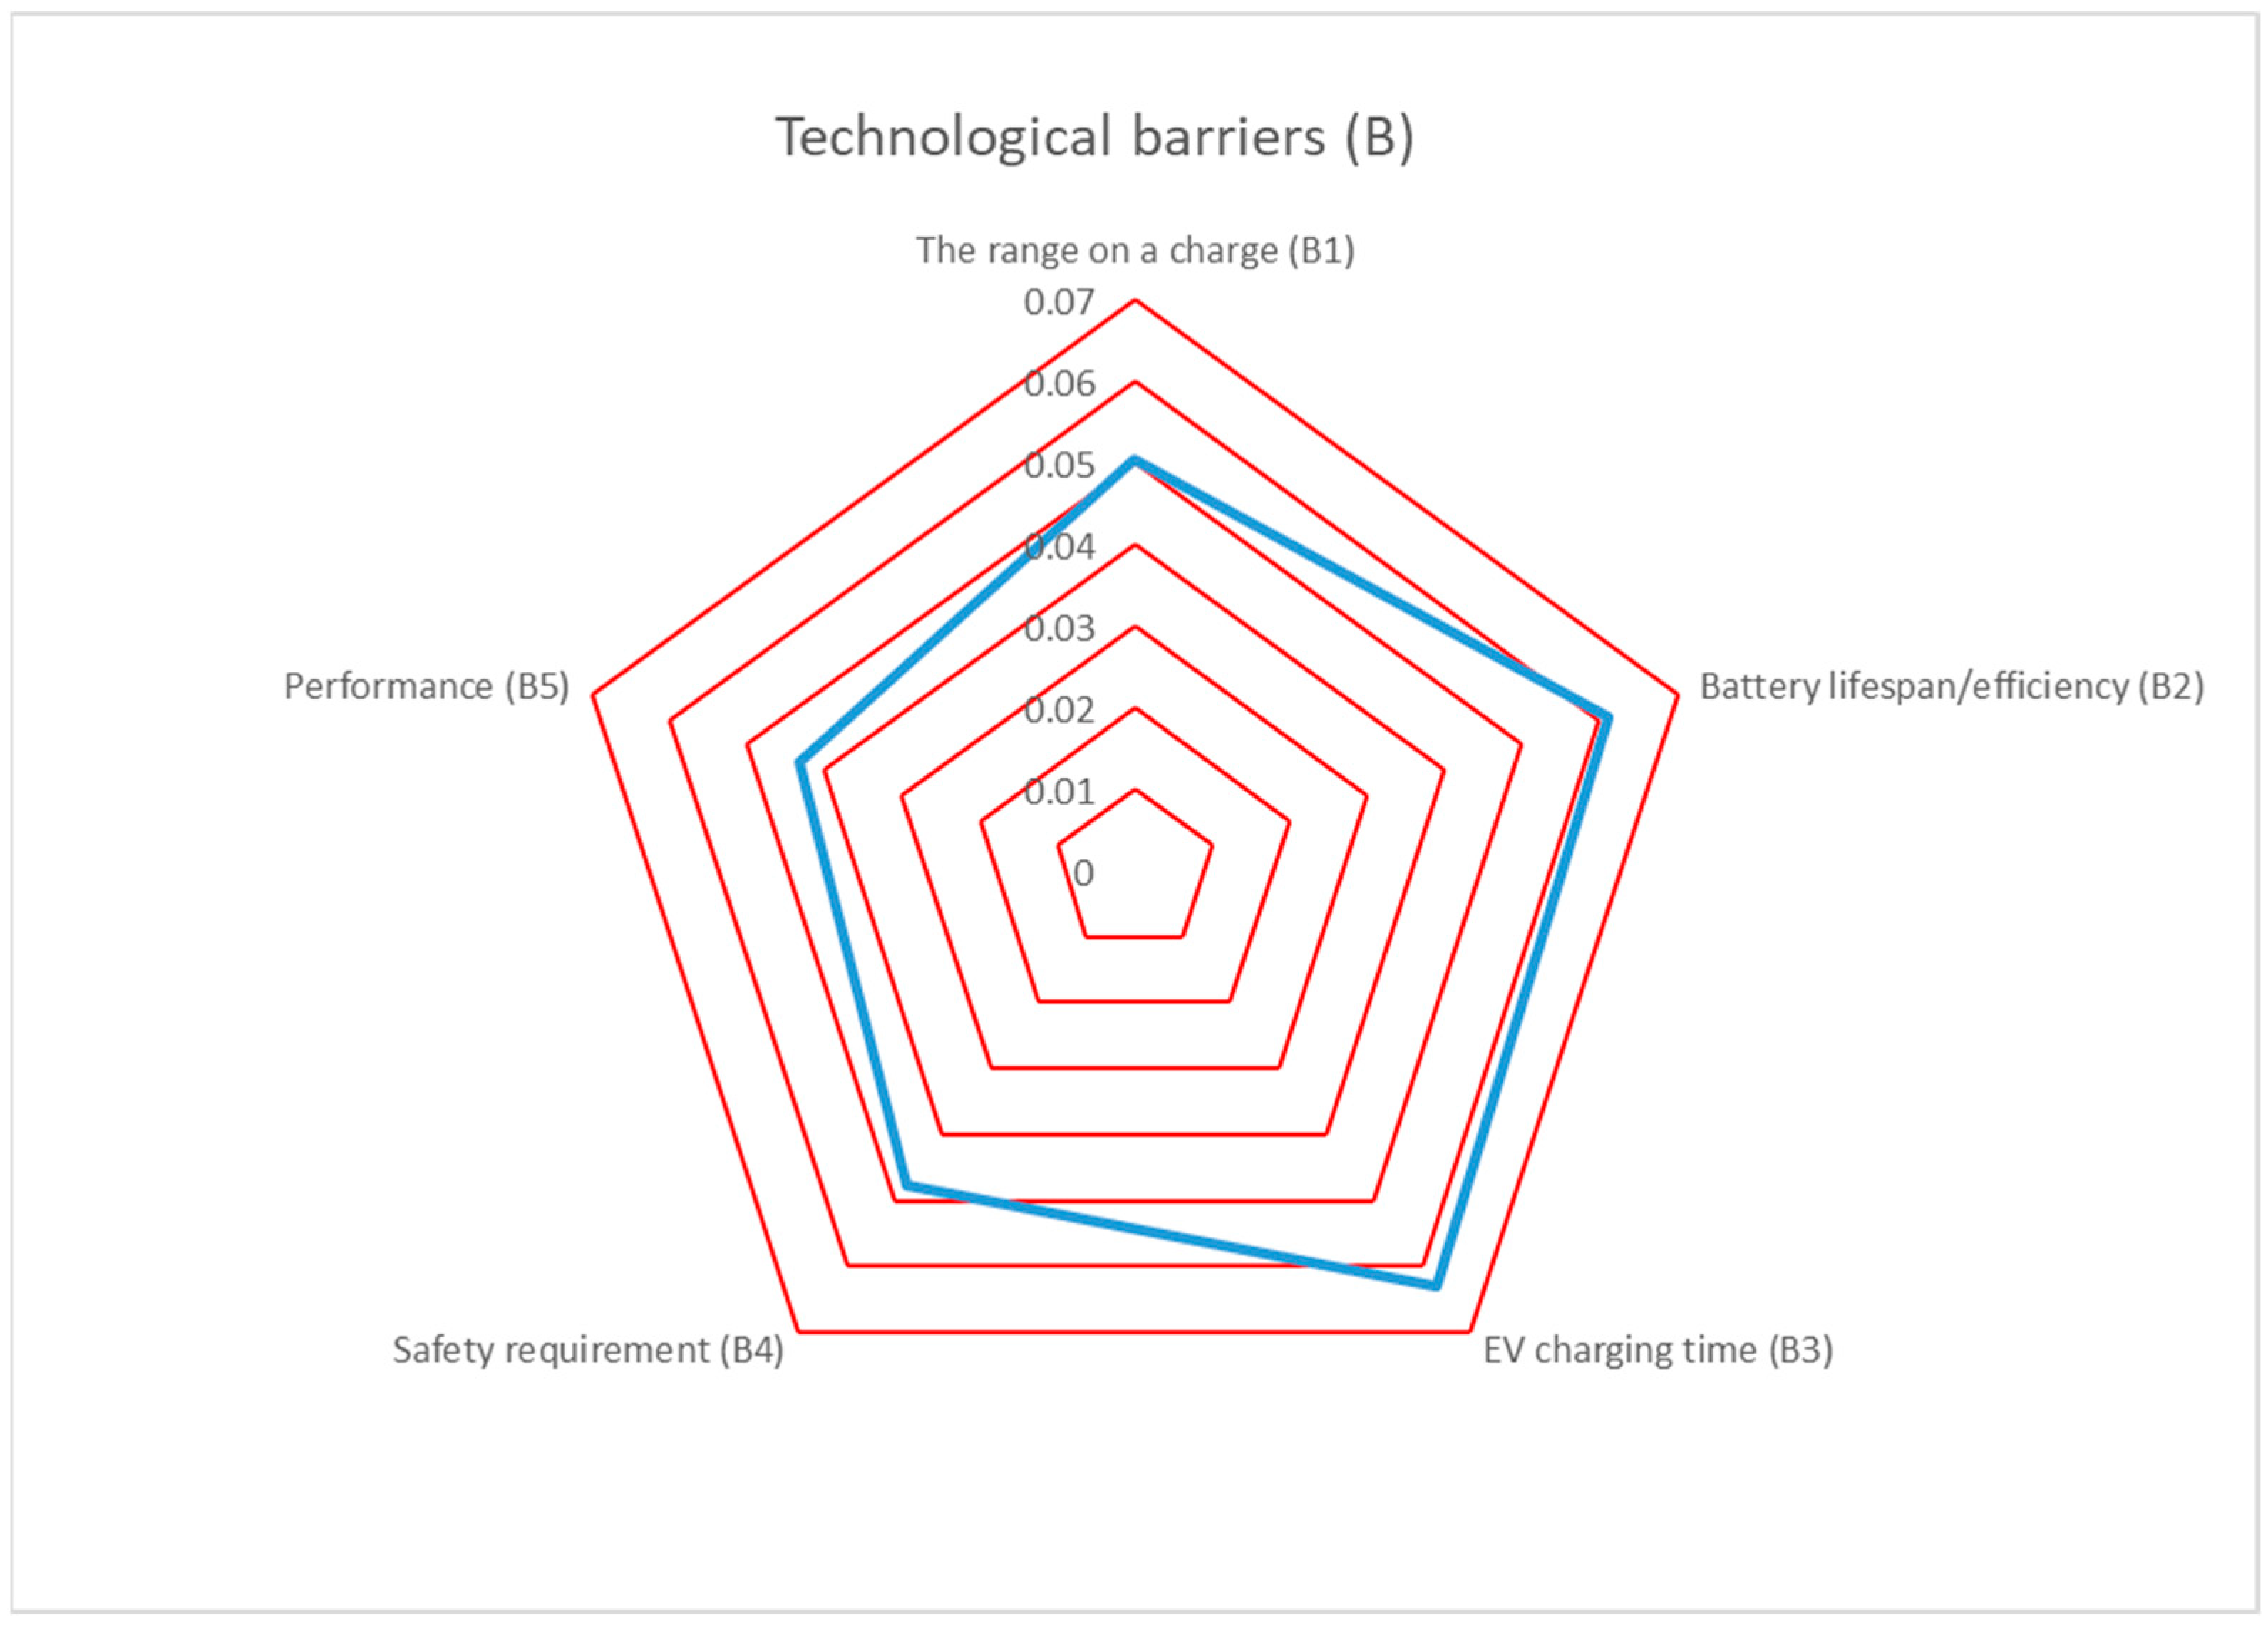
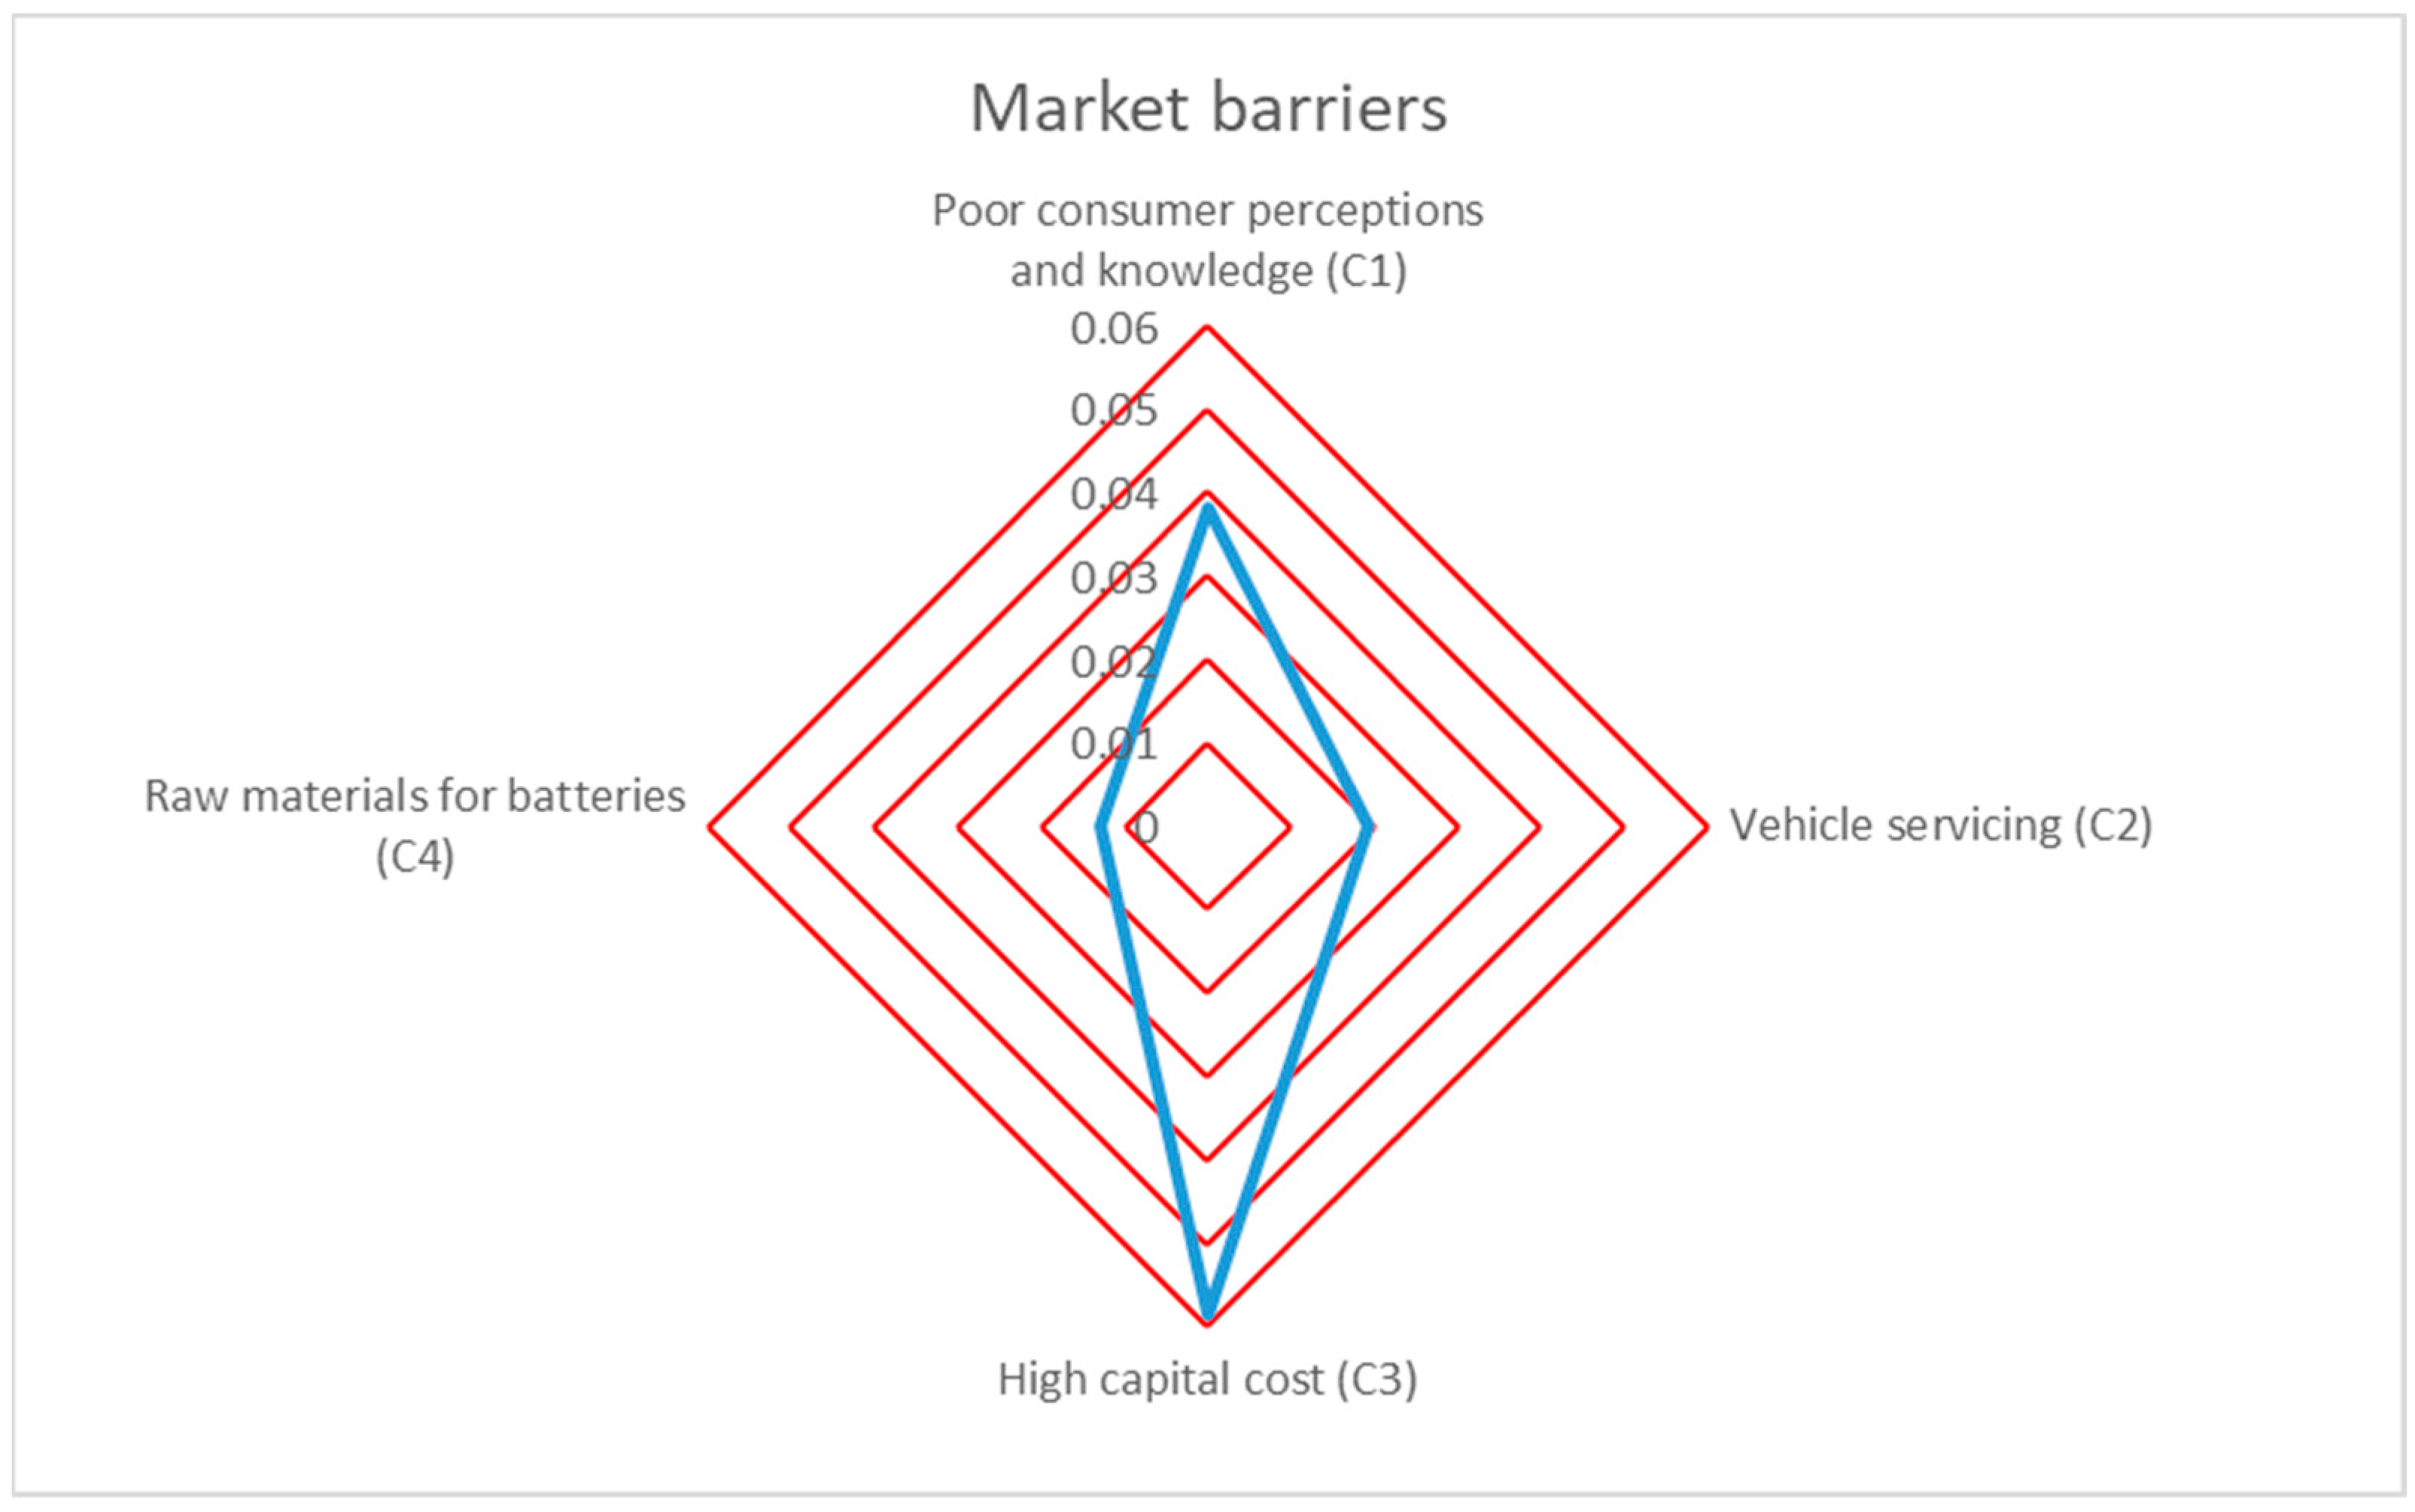
 Figure 6, Figure 7 and Figure 8 show radar charts of the sub-barrier weights of infrastructure policy, technological barriers, and market barriers.
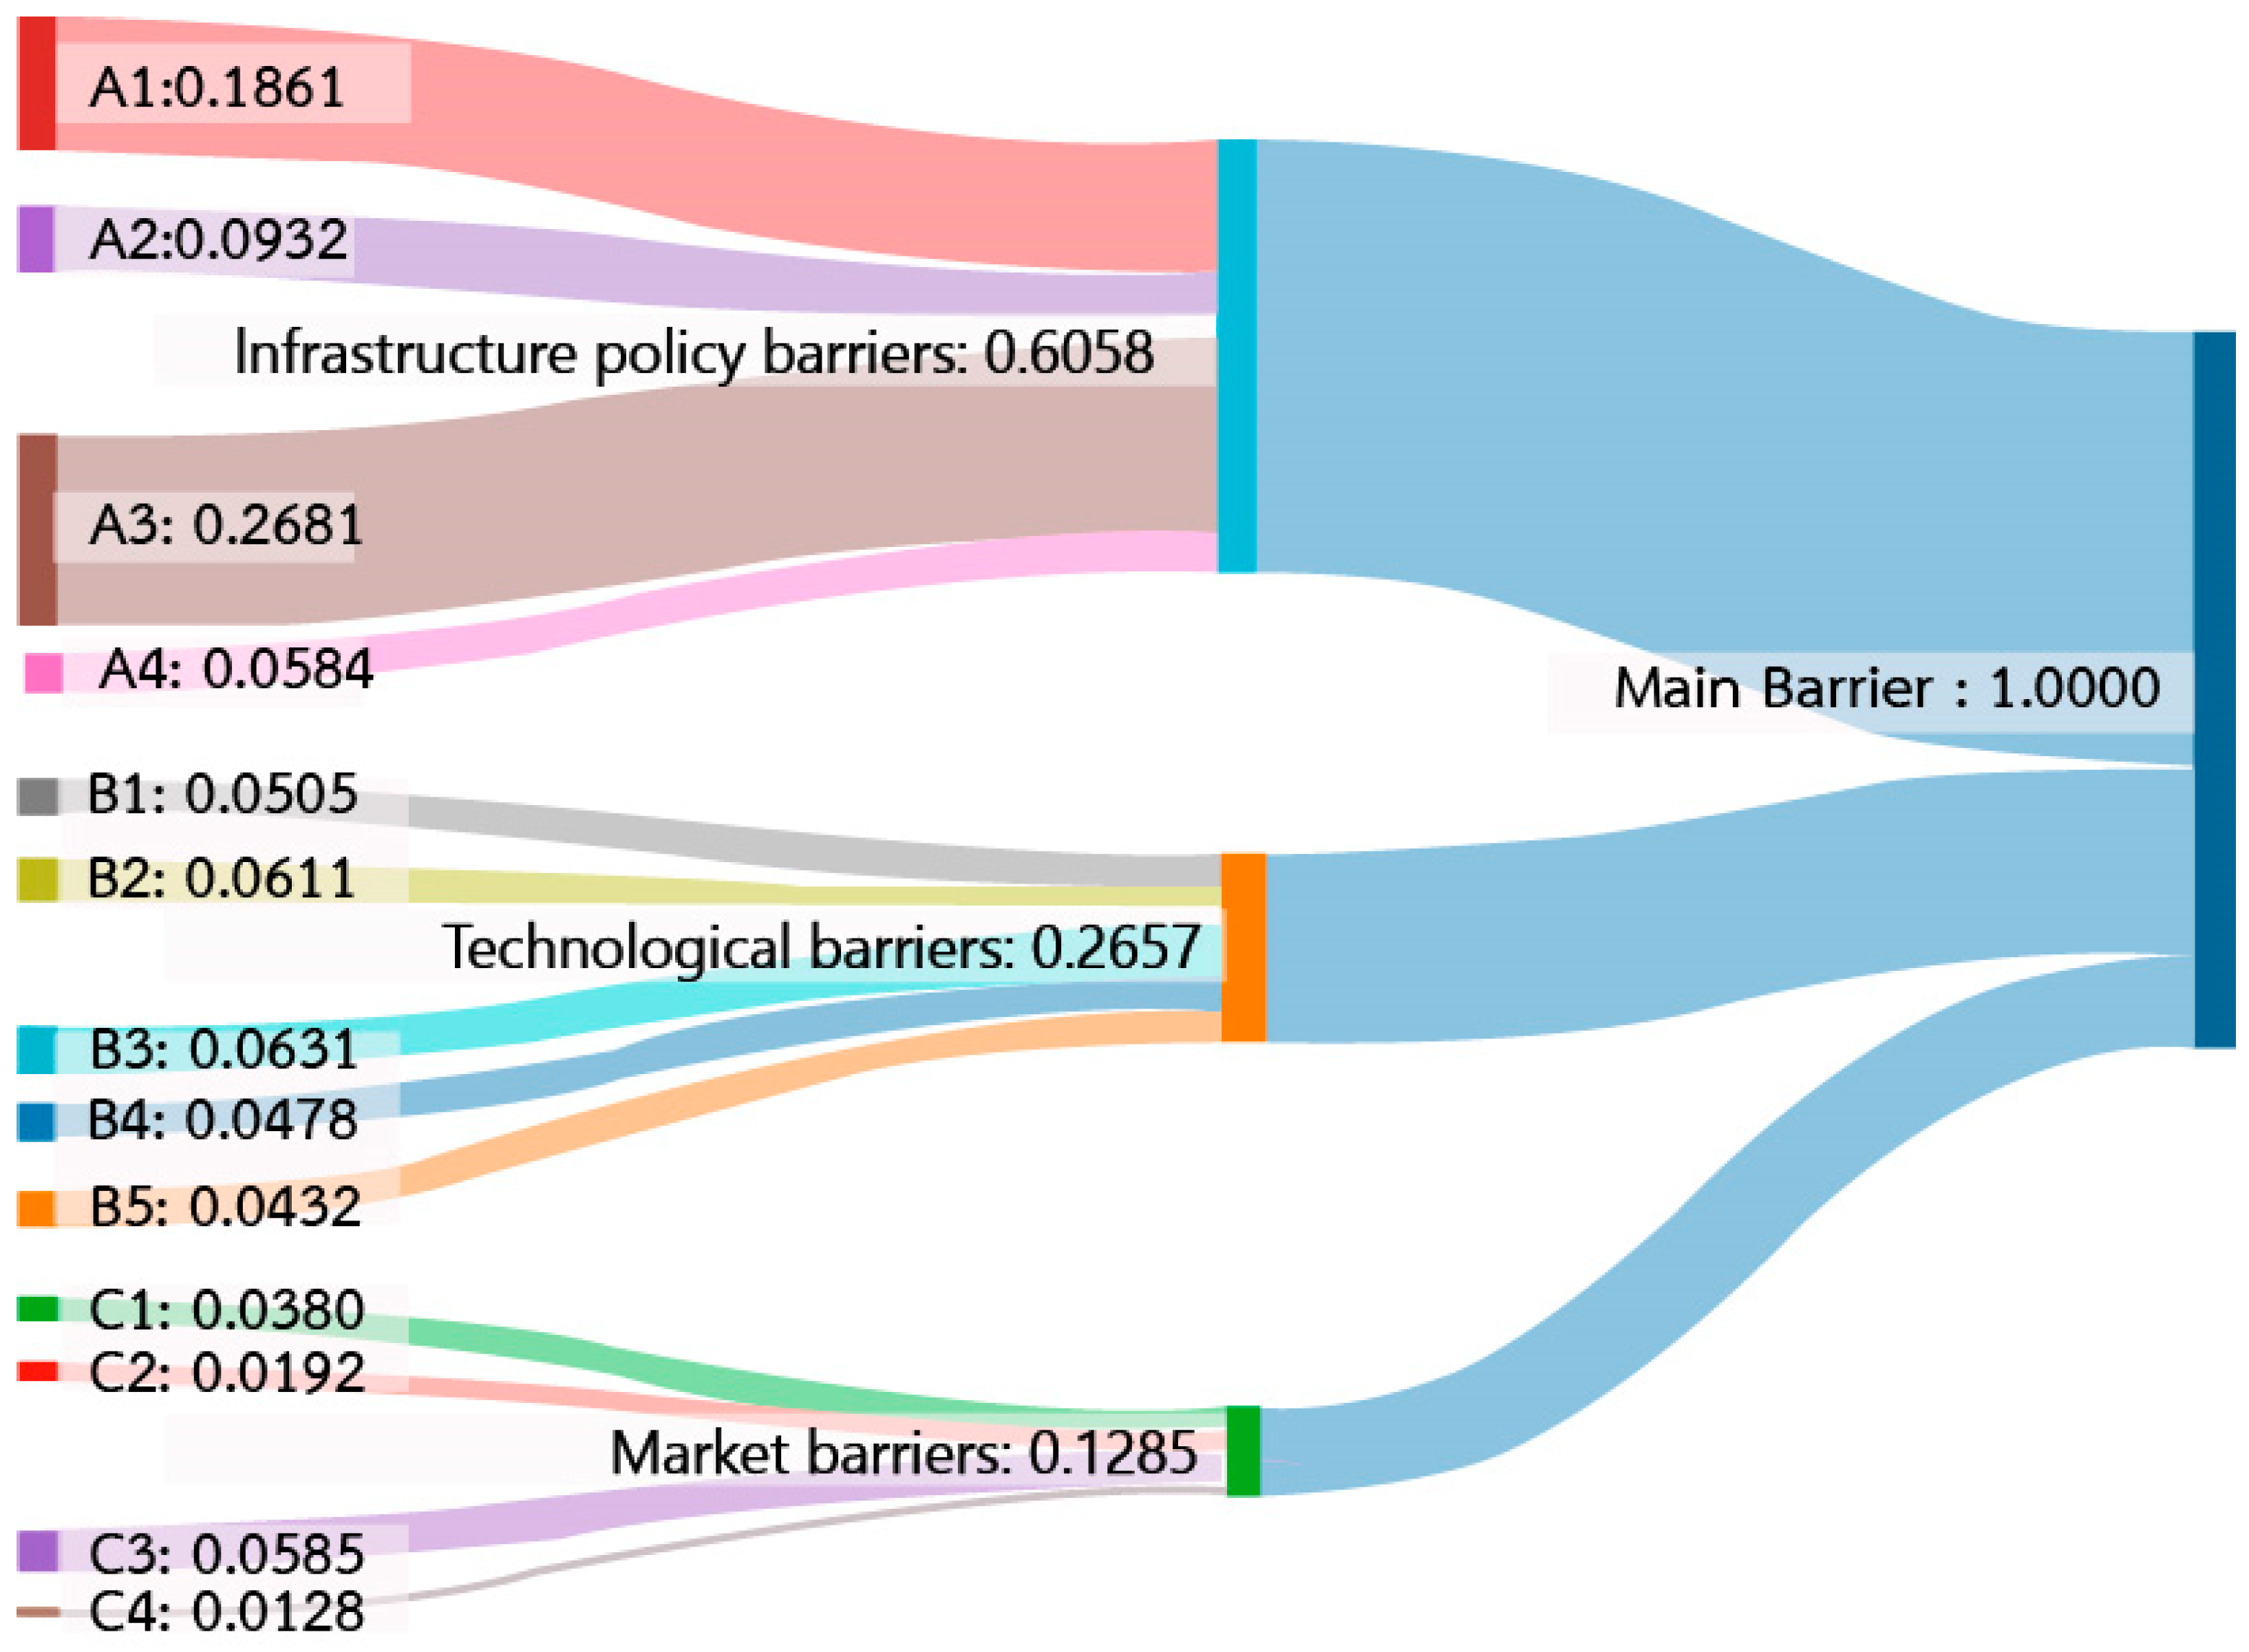
According to the findings in Table 7 and Figure 9, the most considerable impediment to EV adoption was the infrastructure policy barrier (A), which had the highest weight at 0.6058. According to the table, the top three sub-barriers to EV deployment were charging infrastructure network (A3), lack of proper government support and collaboration (A1), insufficient electric power supply (A2), high capital cost (C3), and charging time (B3), in that order. In contrast, the overall ranking results show that raw materials for batteries (C4) were the least of a concern creating a barrier to EV adoption.
With a weight value of 0.2681 of all sub-barriers compared, the lack of charging infrastructure networks plays a critical role in preventing EV adoption in Thailand. These findings are consistent with current literature, such as Azadfar et al. [84], Bakker and Jacob [85], and Barisa et al. [86], all of which state that a lack of charging infrastructure is a major barrier to EV adoption. Furthermore, the findings are consistent with the findings of an October 2021 study conducted by Thananusak et al. [87]. According to 72% of survey respondents, public charging stations in Thailand are still insufficient. According to the study, the main impediment to Thai drivers purchasing a full-fledged EV was a lack of comprehensive infrastructure.
The second barrier, with a weight value of 0.1861, was a lack of proper government support and collaboration. The findings were consistent with the findings of Zhang et al. [88], who found that relevant policies and subsidies promoting the development of EVs in various countries such as China were strictly limited due to local protectionism. Mendoza [89] argued that there were still unclear policies or actions in place to steer Thailand in the direction of implementing electrical vehicle technology. This could be due to the fact that many stakeholders had different agendas for pursuing EV transformation.
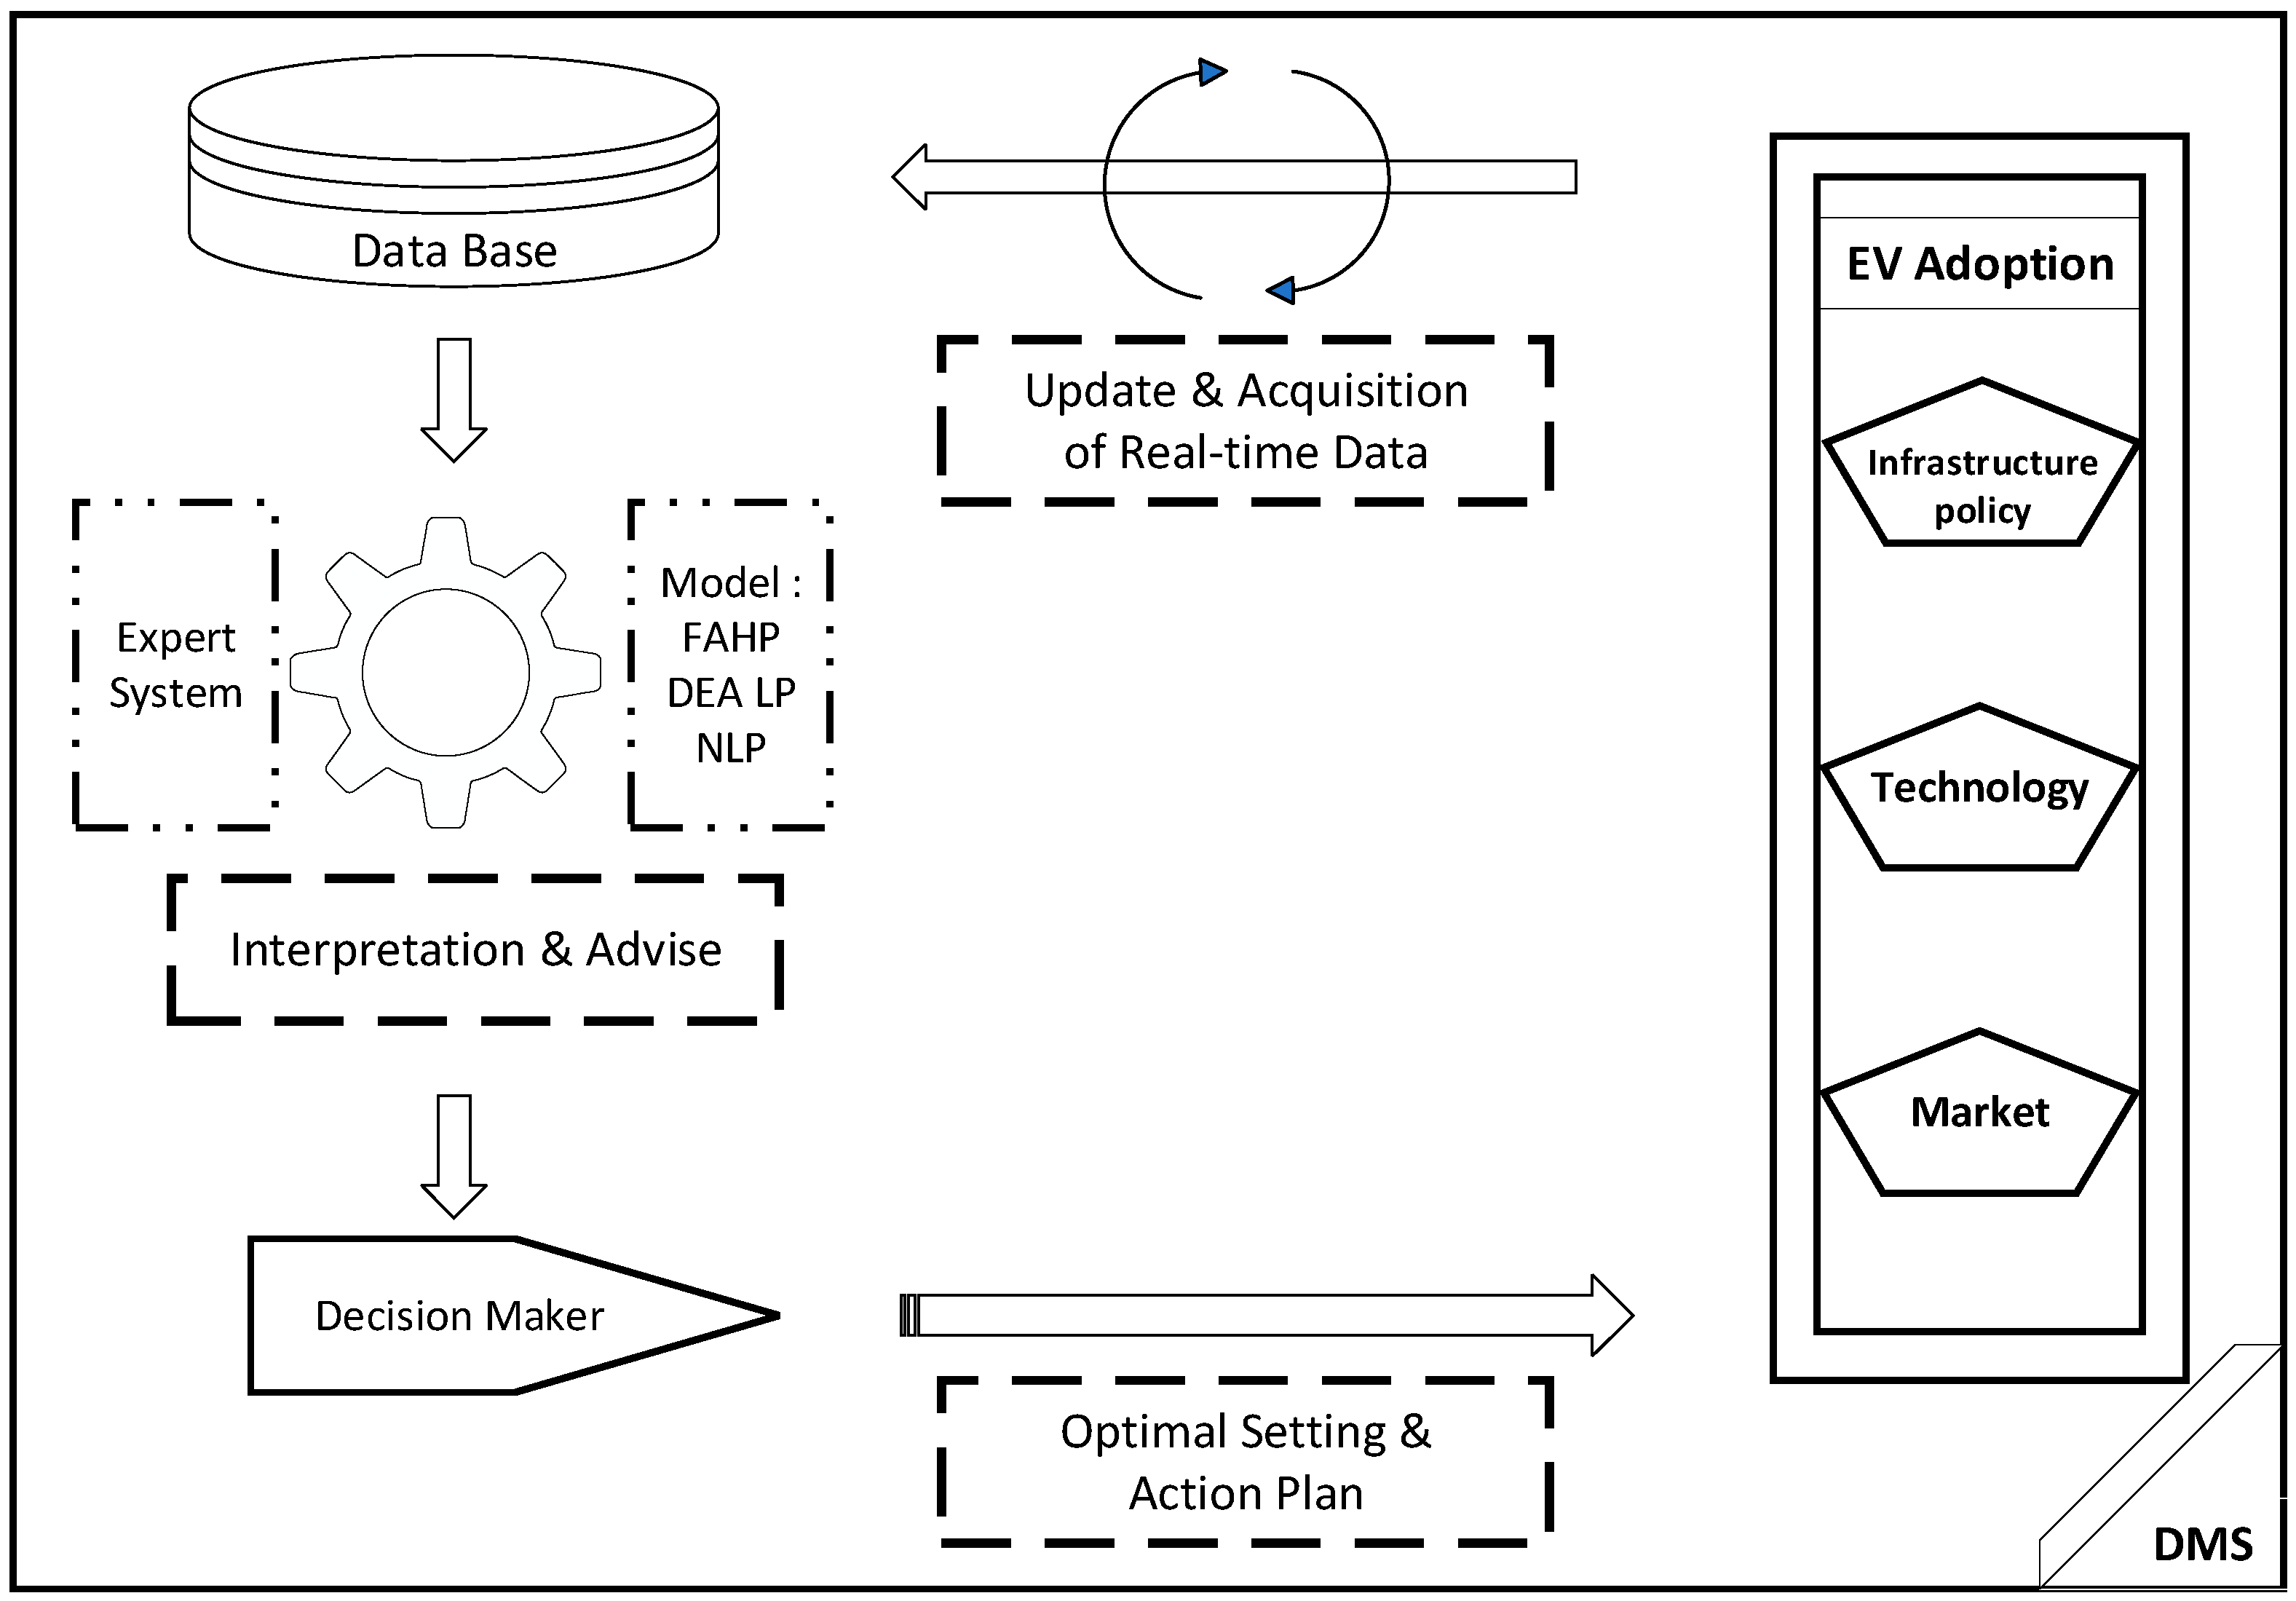
A component of the management information system is the DMS. Government-mandated executives can use decision support tools to help them make strategic judgments in unstructured or semi-structured business activities or events. Information technology-based decision support systems can be used to manage constantly changing information with the goal of lowering costs, decreasing labor, and assisting with modeling analysis to identify and solve problems.
Determining actions for the development of transmission infrastructure is the primary strategy obtained from the decision aid system. The objective is to fortify the electrical system so that it will be reliable and effective in supporting the rising number of electric vehicles in the future. This includes quickening the development of facilities for testing electric vehicles and their parts in order to create and evaluate quality and safety standards. The outcomes of such initiatives can support the need for the country to develop its electric car technology in order to increase its competitiveness in the sector of exporting and manufacturing electric vehicles in the future.
The DMS manages data based on information received both internally and externally. A DMS connects to a company’s database or data warehouse to retrieve or filter data relevant to a decision-making situation. The DMS will screen and compile extensive information from massive amounts of data for decision-making purposes. Following that, users can access various models with analytical capabilities, such as financial models, mathematical models, statistical models, or quantitative models, via the model base management system. User Interface Management is also used to connect the user to the system.
The government can strategically develop operations such as service model development, investment promotion of charging stations along the main routes to different regions of the nation, and investment in and promotion of charging stations. The crucial goals are completeness and confidence. Out of concern about the driving distance of electric vehicle users, a data center for charging stations has been established. The government must assist in the construction of an electric car testing center that complies with worldwide standards in order to lessen the financial burden on manufacturers. This entails operating equitably, fostering technological competition in the sector that manufactures electricity and batteries, and providing space for competition there.
Other activities include the creation of legislative policies to support the use of electric vehicles over the medium and long terms, as well as the improvement of pertinent standards, guidelines, and laws to support the sustainable use of electric vehicles. Other examples include the promotion of industrial estates, the small and medium business electric vehicle sector procurement, and the testing of electric power-related technology. Several institutions, including the Ministries of Transport, Finance, Industry, Energy, and Science and Technology, are involved in developing strategies and action plans to promote electric vehicles.
However, based on these goals, an accountable organization, a budget, and a plan to promote the use of electric vehicles must be appropriately implemented. As a result, a DMS that serves as a conceptual foundation for creating such policies will be successfully advanced, leading to exceptionally clear objectives and responsible agencies. Policies would be decided upon by directly and formally responsible individuals. However, it is unclear how the funds will be approved and how the policy will be altered to an action plan. This flaw makes it possible that the policy will not be able to meet the goals and objectives set forth by each agency. In order to achieve predetermined targets, the future decision-making system guides a feedback plan, which leads to sustainable energy usage.

5. Conclusions and Future Works

The use of a DMS to aid in management decision making is required for effective problem management and responsiveness to big data. Data collection and analysis, as well as complex modeling, are computerized, interactive, and systematic processes for quickly and easily finding solutions to structural problems with data incompatibility that can be easily changed in a short time. Several challenges must be tackled in order for EV adoption to be successful. Prioritizing those challenges will assist Thai government stakeholders in selecting the most important issues to address. In this study, The Fuzzy Analytical Hierarchy Process (FAHP) was applied into DMS to evaluate the three main barriers and their 13 sub-barriers to EV adoption in Thailand, as identified in the literature review. By comparing objects with multiple attributes, the FAHP can reduce the number of comparisons, as well as ambiguous, uncertain, vague, and cognitive errors, and additionally confirm response consistency. The results demonstrate that charging infrastructure networks is a major impediment to EV adoption in Thailand. The second major sub-barrier pillar was a lack of appropriate government support/incentives and collaboration. Other main challenges were determining insufficient electric power supply, high capital cost, and EV charging time.
This study’s evidence emphasizes the importance of reducing shortcomings by providing adequate charging infrastructure and charging space for EVs in several easily accessible locations across the country. To encourage EV adoption, it must be determined how much public charging infrastructure is required and where it should be located. Technology-push policies, such as consistent/sustained policy support, lowering the cost of manufacturing advancements and providing an equitable compensation plan [87,90], as well as demand-pull policies, such as regulations and tax credits and exemptions for consumers and lower electricity selling prices, must be implemented by the government. These would aid in the expansion of markets for innovations, allowing for greater investment in innovation for EV charging time [90,91]. Furthermore, a number of existing and proposed EV-related laws and regulations require review and revision in order to produce accurate policies and time frames for modernization in obtaining investor sentiment and incorporating all interested parties. According to this study, the presence of fast charging would increase EV preferences significantly. Therefore, alternative battery materials and technologies provide a promising solution to this constraint. Research-oriented approaches on solid-state batteries and alternative cathode and anode materials, including capital and human capital investments, are required and supported by stakeholders.
Aside from the numerous useful implications of this study, there is some room available for future investigations. To investigate the model’s performance, the proposed FAHP model would be compared to those of other MCDM approaches, such as fuzzy outranking methods and complex proportional assessment method (COPRAS) [92]. Another area of improvement would be to take into account the perspectives of other stakeholders including users, manufacturers, experts, and policymakers in order to provide more holistic indicators for long-term improvements in EV adoption. To ensure the model’s integrity, a sensitivity analysis should be included in the DMS. A sensitivity analysis should also be carried out to verify the integrity of the suggested model. Furthermore, it may be worthwhile to investigate other barriers that may arise alongside future EV campaigns.

Author Contributions

P.A. contributed to the design, conceptualization, methodology, and software. W.A. contributed to an implementation, formal analysis, investigation, data curation of the research, and to the writing—review and editing of the manuscript. P.L. contributed to the design, conceptualization, methodology, software, validation, visualization of the research, to the analysis of the results and to the writing—review and editing of the manuscript. P.A., W.A and. P.L. approved the final version. All authors have read and agreed to the published version of the manuscript.

Funding

The authors would like to thank all experts for participating in this study by taking the time and sharing their expertise to contribute to scientific knowledge. P.A. wishes to thank the Faculty of Engineering, King Mongkut’s University of Technology North Bangkok for financial support. W.A. thanks the School of Science, King Mongkut’s Institute of Technology Ladkrabang for the research work conducted. For P.L., this work was supported by the Thammasat University Research Unit in Industrial Statistics and Operational Research and by research funding from the Faculty of Engineering, Thammasat School of Engineering, Thammasat University.

Institutional Review Board Statement

Not applicable.

Informed Consent Statement

Not applicable.

Data Availability Statement

Data available on request from the authors: The data that support the findings of this study are available from the corresponding author, [Pongchanun LUANGPAIBOON], upon reasonable request.

Conflicts of Interest

The authors declare no conflict of interest.

References

  1. IEA. Global EV Outlook 2020; IEA: Paris, France, 2020; p. 276. [Google Scholar]
  2. Miao, Z.; Balezentis, T.; Shao, S.; Chang, D. Energy use, industrial soot and vehicle exhaust pollution-China’s regional air pollution recognition, performance decomposition and governance. Energy Econ. 2019, 83, 501–514. [Google Scholar] [CrossRef]
  3. Poder, T.G.; He, J. Willingness to pay for a cleaner car: The case of car pollution in Quebec and France. Energy 2017, 130, 48–54. [Google Scholar] [CrossRef]
  4. Ardeshiri, A.; Rashid, T.H. Willingness to pay for fast charging station for electric vehicles with limited market penetration making. Energy Policy 2020, 147, 111822. [Google Scholar] [CrossRef]
  5. Samaras, C.; Meisterling, K. Life cycle assessment of Greenhouse gas emissions from plug-in hybrid vehicles: Implications for policy. Environ. Sci. Technol. 2008, 42, 3170–3176. [Google Scholar] [CrossRef] [PubMed]
  6. Adhikari, M.; Ghimire, L.P.; Kim, Y.; Aryal, P.; Khadka, S.B. Identification and Analysis of Barriers against Electric Vehicle Use. Sustainability 2020, 12, 4850. [Google Scholar] [CrossRef]
  7. Cox, J. Time to Come Clean about Hydrogen Fuel Cell Vehicles. 2014. Available online: http://cleantechni-ca.com/2014/06/04/hydrogen-fuel-cell-vehicles-about-not-clean/ (accessed on 4 May 2016).
  8. Romm, J. Tesla Trumps Toyota: Why Hydrogen Cars Can’t Compete with Pure Electric Cars. 2014. Available online: http://thinkprogress.org/climate/2014/08/05/3467115/tesla-toyota-hydrogen-carsbatteries/ (accessed on 4 May 2016).
  9. Thailand Development Research Institute. Lack of Preparation Stifles EV Ambition; Thailand Development Research Institute: Bangkok, Thailand, 2017; Available online: http://tdri.or.th/en/tdriinsight/20161004/20June2017 (accessed on 21 February 2023).
  10. Kaur, D. Thailand Expand Incentives to Further Spur EV Adoption. Techwire Asia. 2020. Available online: https://techwireasia.com/amp/2022/04/thailand-expand-incentives-to-further-spur-ev-adoption/ (accessed on 21 February 2023).
  11. Kongklaew, C.; Phoungthong, K.; Prabpayak, C.; Chowdhury, S.; Khan, I.; Yuangyai, N.; Yuangyai, C.; Techato, K. Barriers to Electric Vehicle Adoption in Thailand. Sustainability 2021, 13, 12839. [Google Scholar] [CrossRef]
  12. Meesuwan, B. Barriers toward electric vehicle adoption in Thailand. Ph.D. Thesis, Mahidol University, Salaya, Thailand, 2020. [Google Scholar]
  13. Liu, Y.; Lee, J.M.; Lee, C. The challenges and opportunities of a global health crisis: The management and business implications of COVID-19 from an Asian perspective. Asian Bus. Manag. 2020, 19, 277–297. [Google Scholar] [CrossRef]
  14. Dawes, R.M.; Corrigan, B. Linear models in decision making. Psychol. Bull. 1974, 81, 95–106. [Google Scholar] [CrossRef]
  15. Barron, F.H.; Barrett, B.E. Decision Quality Using Ranked Attribute Weights. Manag. Sci. 1996, 42, 1515–1523. [Google Scholar] [CrossRef]
  16. Einhorn, H.J.; McCoach, W. A simple multiattribute utility procedure for evaluation. Syst. Res. Behav. Sci. 1977, 22, 270–282. [Google Scholar] [CrossRef]
  17. Stillwell, W.G.; Seaver, D.A.; Edwards, W. A comparison of weight approximation techniques in multiattribute utility decision making. Organ. Behav. Hum. Perform. 1981, 28, 62–77. [Google Scholar] [CrossRef]
  18. Jia, J.; Fischer, G.W.; Dyer, J.S. Attribute weighting methods and decision quality in the presence of response error: A simulation study. J. Behav. Decis. Mak. 1998, 11, 85–105. [Google Scholar] [CrossRef]
  19. Ishizaka, A.; Nemery, P. Multi-Criteria Decision Analysis: Methods and Software; John Wiley & Sons: Hoboken, NJ, USA, 2013. [Google Scholar]
  20. Song, B.; Kang, S. A Method of Assigning Weights Using a Ranking and Nonhierarchy Comparison. Adv. Decis. Sci. 2016, 8963214. [Google Scholar] [CrossRef]
  21. Linstone, H.; Turoff, M. The Delphi Method: Techniques and Applications; Addison-Wesley: Boston, MA, USA, 1975. [Google Scholar]
  22. Keeney, R.L.; Raiffa, H. Decisions with Multiple Objectives: Preferences and Value Tradeoffs; Cambridge University Press: Cambridge, UK, 1993. [Google Scholar]
  23. Banker, R.D.; Cooper, W.W.; Seiford, L.M.; Thrall, R.M.; Zhu, J. Returns to scale in different DEA models. Eur. J. Oper. Res. 2004, 154, 345–362. [Google Scholar] [CrossRef]
  24. Saaty, T.L. The Analytic Hierarchy Process; McGraw-Hill: New York, NY, USA, 1980. [Google Scholar]
  25. Djaković, D.D.; Gvozdenac-Urosević, D.B.; Vasić, M. Multi-criteria analysis as a support for national energy policy regarding the use of biomass. Therm. Sci. 2016, 20, 371–380. [Google Scholar] [CrossRef]
  26. Badri, M.A. A combined AHP–GP model for quality control systems. Int. J. Prod. Econ. 2001, 72, 27–40. [Google Scholar] [CrossRef]
  27. Triantaphyllou, E.; Mann, S.H. Using the Analytic Hierarchy Process for Decision Making in Engineering Applica-tions: Some Challenges. Int. J. Ind. Eng. Theory Appl. Pract. 1995, 2, 35–44. [Google Scholar]
  28. Zadeh, L.A. Fuzzy logic and approximate reasoning. Synthese 1975, 30, 407–428. [Google Scholar] [CrossRef]
  29. Hoseini, S.A.; Fallahpour, A.; Wong, K.Y.; Antucheviciene, J. Developing an integrated model for evaluating R&D organizations’ performance: Combination of dea-anp. Technol. Econ. Dev. Econ. 2021, 27, 970–991. [Google Scholar]
  30. Dos Santos, H.H.; Marques, V.N.; Paschoali, L.F.F. The analysis of barriers for implementing circular economy practices using the Analytic Hierarchy Process (AHP). Rev. Gestão Da Produção Operações E Sist. 2021, 16, 99–118. [Google Scholar] [CrossRef]
  31. Zubaryeva, A.; Thiel, C.; Barbone, E.; Mercier, A. Assessing factors for the identification of potential lead markets for electrified vehicles in Europe: Expert opinion elicitation. Technol. Forecast. Soc. Change 2012, 79, 1622–1637. [Google Scholar] [CrossRef]
  32. She, Z.-Y.; Sun, Q.; Ma, J.-J.; Xie, B.-C. What are the barriers to widespread adoption of battery electric vehicles? A survey of public perception in Tianjin, China. Transp. Policy 2017, 56, 29–40. [Google Scholar] [CrossRef]
  33. Berkeley, N.; Jarvis, D.; Jones, A. Analyzing the take up of battery electric vehicles: An investigation of barriers amongst drivers in the UK. Transp. Res. Part D Transp. Environ. 2018, 63, 466–481. [Google Scholar] [CrossRef]
  34. Graham-Rowe, E.; Gardner, B.; Abraham, C.; Skippon, S.; Dittmar, H.; Hutchins, R.; Stannard, J. Mainstream consumers driving plug-in battery-electric and plug-in hybrid electric cars: A qualitative analysis of responses and evaluations. Transp. Res. Part A Policy Pract. 2012, 46, 140–153. [Google Scholar] [CrossRef]
  35. Haddadian, G.; Khodayar, M.; Shahidehpour, M. Accelerating the Global Adoption of Electric Vehicles: Barriers and Drivers. Electr. J. 2015, 28, 53–68. [Google Scholar] [CrossRef]
  36. Wan, Z.; Sperling, D.; Wang, Y. China’s electric car frustrations. Transp. Res. Part D Transp. Environ. 2015, 34, 116–121. [Google Scholar] [CrossRef]
  37. Bhalla, P.; Ali, I.S.; Nazneen, A. A study of consumer perception and purchase intention of electric vehicles. Eur. J. Sci. Res. 2018, 149, 362–368. [Google Scholar]
  38. Weiss, M.; Patel, M.K.; Junginger, M.; Perujo, A.; Bonnel, P.; van Grootveld, G. On the electrification of road transport—Learning rates and price forecasts for hybrid-electric and battery-electric vehicles. Energy Policy 2012, 48, 374–393. [Google Scholar] [CrossRef]
  39. Tsang, F.; Pedersen, J.S.; Wooding, S.; Potoglou, D. Bringing the electric vehicle to the mass market a review of barriers, facilitators and policy interventions; Working Paper; RAND Corporation: Santa Monica, CA, USA, 2012. [Google Scholar]
  40. Sierzchula, W.; Bakker, S.; Maat, K.; van Wee, B. The influence of financial incentives and other socio-economic factors on electric vehicle adoption. Energy Policy 2014, 68, 183–194. [Google Scholar] [CrossRef]
  41. Noel, L.; de Rubens, G.Z.; Sovacool, B.K.; Kester, J. Fear and loathing of electric vehicles: The reactionary rhetoric of range anxiety. Energy Res. Soc. Sci. 2019, 48, 96–107. [Google Scholar] [CrossRef]
  42. Ruchita. Identification of potential barriers of EVsCI using EFA. Int. J. Syst. Assur. Eng. Manag. 2022, in press. [CrossRef]
  43. Krupa, A. Barriers and Opportunities to Electric Vehicle Development in Nepal. Independent Study Project (ISP) Collection. 2019, p. 3279. Available online: https://digitalcollections.sit.edu/isp_collection/3279 (accessed on 21 February 2023).
  44. Sarkar, P.K.; Jain, A.K. Intelligent Transport System; PHI Learning: Delhi, India, 2018; p. 440. [Google Scholar]
  45. Biresselioglu, M.E.; Kaplan, M.D.; Yilmaza, B.K. Electric mobility in Europe: A comprehensive review of moti-vators and barriers in decision making processes. Transp. Res. Part A Policy Pract. 2018, 109, 1–13. [Google Scholar] [CrossRef]
  46. Robinson, A.; Blythe, P.; Bell, M.; Hübner, Y.; Hill, G. Analysis of electric vehicle driver recharging demand profiles and subsequent impacts on the carbon content of electric vehicle trips. Energy Policy 2013, 61, 337–348. [Google Scholar] [CrossRef]
  47. Goel, S.; Sharma, R.; Rathore, A.K. A Review on Barrier and Challenges of Electric Vehicle in India and Vehicle to Grid Optimization. Transp. Eng. 2021, 4, 100057. [Google Scholar] [CrossRef]
  48. Lim, M.K.; Mak, H.-Y.; Rong, Y. Toward Mass Adoption of Electric Vehicles: Impact of the Range and Resale Anxieties. Manuf. Serv. Oper. Manag. 2015, 17, 101–119. [Google Scholar] [CrossRef]
  49. Krishna, G. Understanding and identifying barriers to electric vehicle adoption through thematic analysis. Transp. Res. Interdiscip. Perspect. 2021, 10, 100364. [Google Scholar] [CrossRef]
  50. Rezvani, Z.; Jansson, J.; Bodin, J. Advances in consumer electric vehicle adoption research: A review and research agenda. Transp. Res. Part D Transp. Environ. 2015, 34, 122–136. [Google Scholar] [CrossRef]
  51. Jabbari, P.; Chernicoff, W.; MacKenzie, D. Analysis of Electric Vehicle Purchaser Satisfaction and Rejection Reasons. Transp. Res. Rec. J. Transp. Res. Board 2017, 2628, 110–119. [Google Scholar] [CrossRef]
  52. Krause, R.M.; Carley, S.R.; Lane, B.W.; Graham, J.D. Perception and reality: Public knowledge of plug-in electric vehicles in 21 U.S. cities. Energy Policy 2013, 63, 433–440. [Google Scholar] [CrossRef]
  53. Kabir, G.; Hasin, M.A.A. Framework for benchmarking online retailing performance using fuzzy AHP and TOPSIS method. Int. J. Ind. Eng. Comput. 2012, 3, 561–576. [Google Scholar] [CrossRef]
  54. Luangpaiboon, P.; Aungkulanon, P.; Montemanni, R. A decision support tool for intelligent manufacturing systems via an elevator kinematic optimisation based method. Expert Syst. Appl. 2022, 203, 117576. [Google Scholar] [CrossRef]
  55. Tamosaitiene, J.; Bartkiene, L.; Vilutiene, T. The New Development Trend of Operational Research in Civil Engineering and Sustainable Development as a result of collaboration between German–Lithuanian–Polish Scientific Triangle. J. Bus. Econ. Manag. 2010, 11, 316–340. [Google Scholar] [CrossRef]
  56. Kaplinski, O.; Tupenaitė, L. Review of the Multiple Criteria Decision Making Methods, Intelligent and Biometric Systems Applied in Modern Construction Economics. Transform. Bus. Econ. 2011, 10, 166–181. [Google Scholar]
  57. Chen, C.T. A fuzzy approach to select the location of the distribution center. Fuzzy Sets Syst. 2001, 118, 65–73. [Google Scholar] [CrossRef]
  58. Haddad, M.; Sanders, D. Selection of discrete multiple criteria decision making methods in the presence of risk and uncertainty. Oper. Res. Perspect. 2018, 5, 357–370. [Google Scholar] [CrossRef]
  59. Gupta, H. Evaluating service quality of airline industry using hybrid best worst method and VIKOR. J. Air Transp. Manag. 2018, 68, 35–47. [Google Scholar] [CrossRef]
  60. Lee, H.C.; Chang, C.-T. Comparative analysis of MCDM methods for ranking renewable energy sources in Taiwan. Renew. Sustain. Energy Rev. 2018, 92, 883–896. [Google Scholar] [CrossRef]
  61. Joubert, A.; Stewart, T.J.; Eberhard, R. Evaluation of water supply augmentation and water demand management options for the City of Cape Town. J. Multi-Criteria Decis. Anal. 2003, 12, 17–25. [Google Scholar] [CrossRef]
  62. Alamanos, A.; Mylopoulos, N.; Loukas, A.; Gaitanaros, D. An integrated multicriteria analysis tool for evaluating water resource management strategies. Water 2018, 10, 1795. [Google Scholar] [CrossRef]
  63. Manikkuwahandi, T.D.S.; Hornberger, G.M.; Baroud, H. Decision Analysis for Expansion of Mahaweli Multipurpose Reservoir System in Sri Lanka. J. Water Resour. Plan. Manag. 2019, 145, 05019013. [Google Scholar] [CrossRef]
  64. Atthirawong, W.; Panprung, W. Analysis of Multi-Criteria Decision Making Techniques in Determination of Textile Manufacturing Locations in the ASEAN Region. Psychol. Educ. 2021, 58, 9507–9518. [Google Scholar]
  65. Atthirawong, W.; Panprung, W.; Wanitjirattikal, P. An Integrated Factor Analysis-Technique for Order Preference by Similarity to Ideal Solution for Location Decision in ASEAN Region: A Case Study of Thai Fabric Manufacturing Plant. Curr. Appl. Sci. Technol. 2023, 23, 1. [Google Scholar] [CrossRef]
  66. Hanine, M.; Boutkhoum, O.; Tikniouine, A.; Agouti, T. Application of an integrated multi-criteria decision making AHP-TOPSIS methodology for ETL software selection. Springerplus 2016, 5, 263. [Google Scholar] [CrossRef] [PubMed]
  67. Beck, P.; Hofmann, E. Multiple criteria decision making in supply chain management—Currently available methods and possibilities for future research. Die Unternehm. 2012, 66, 180–213. [Google Scholar] [CrossRef]
  68. Kumar, D.; Garg, C.P. Evaluating sustainable supply chain indicators using fuzzy AHP. Benchmarking Int. J. 2017, 24, 1742–1766. [Google Scholar] [CrossRef]
  69. Paul, A.; Shukla, N.; Paul, S.K.; Trianni, A. Sustainable Supply Chain Management and Multi-Criteria Decision-Making Methods: A Systematic Review. Sustainability 2021, 13, 7104. [Google Scholar] [CrossRef]
  70. Kengpol, A.; Rontlaong, P.; Tuominen, M. Design of a decision support system for site selection using fuzzy AHP: A case study of solar power plant in north eastern parts of Thailand. In Proceedings of the PICMET’12: Technology Management for Emerging Technologies, Vancouver, BC, Canada, 29 July–2 August 2012; pp. 734–743. [Google Scholar]
  71. Yeh, C.-H.; Deng, H. A practical approach to fuzzy utilities comparison in fuzzy multicriteria analysis. Int. J. Approx. Reason. 2004, 35, 179–194. [Google Scholar] [CrossRef]
  72. Saaty, T.L. How to make a decision: The analytic hierarchy process. Eur. J. Oper. Res. 1990, 48, 9–26. [Google Scholar] [CrossRef]
  73. Lin, H.-F. An application of fuzzy AHP for evaluating course website quality. Comput. Educ. 2010, 54, 877–888. [Google Scholar] [CrossRef]
  74. Govindan, K.; Soleimani, H.; Kannan, D. Reverse logistics and closed-loop supply chain: A comprehensive review to explore the future. Eur. J. Oper. Res. 2015, 240, 603–626. [Google Scholar] [CrossRef]
  75. Buckley, J.J. Fuzzy hierarchical analysis. Fuzzy Sets Syst. 1985, 17, 233–247. [Google Scholar] [CrossRef]
  76. Chang, D.Y. Applications of the extent analysis method on fuzzy AHP. Eur. J. Oper. Res. 1996, 95, 649–655. [Google Scholar] [CrossRef]
  77. Mikhailov, L. Fuzzy analytical approach to partnership selection in formation of virtual enterprises. Omega 2002, 30, 393–401. [Google Scholar] [CrossRef]
  78. Bozbura, F.; Beskese, A.; Kahraman, C. Prioritization of human capital measurement indicators using fuzzy AHP. Expert Syst. Appl. 2007, 32, 1100–1112. [Google Scholar] [CrossRef]
  79. Efe, B. An integrated fuzzy multi criteria group decision making approach for ERP system selection. Appl. Soft Comput. 2016, 38, 106–117. [Google Scholar] [CrossRef]
  80. Boutkhou, O.; Hanine, M.; Tikniouine, A.; Agouti, T. Multi-criteria Decisional Approach of the OLAP Analysis by Fuzzy Logic: Green Logistics as a Case Study. Arab. J. Sci. Eng. 2015, 40, 2345–2359. [Google Scholar] [CrossRef]
  81. Anagnostopoulos, K.P.; Gratziou, M.; Vavatsikos, A.P. Using the fuzzy analytic hierarchy process for selecting wastewater facilities at prefecture level. Eur. Water 2007, 19, 15–24. [Google Scholar]
  82. Saaty, T. A scaling method for priorities in hierarchical structures. J. Math. Psychology. 1977, 15, 234–281. [Google Scholar] [CrossRef]
  83. Cabala, P. Using the analytic hierarchy process in evaluating decision alternatives. Oper. Res. Decis. 2010, 20, 5–23. [Google Scholar]
  84. Azadfar, E.; Sreeram, V.; Harries, D. The investigation of the major factors influencing plug-in electric vehicle driving patterns and charging behavior. Renew. Sustain. Energy Rev. 2015, 42, 1065–1076. [Google Scholar] [CrossRef]
  85. Bakker, S.; Jacob Trip, J. Policy options to support the adoption of electric vehicles in the urban environment. Transp. Res. Part D Transp. Environ. 2013, 25, 18–23. [Google Scholar] [CrossRef]
  86. Barisa, A.; Rosa, M.; Kisele, A. Introducing Electric Mobility in Latvian Municipalities: Results of a Survey. Energy Procedia 2016, 95, 50–57. [Google Scholar] [CrossRef]
  87. Thananusak, T.; Punnakitikashem, P.; Tanthasith, S.; Kongarchapatara, B. The Development of Electric Vehicle Charging Stations in Thailand: Policies, Players, and Key Issues (2015–2020). World Electr. Veh. J. 2021, 12, 2. [Google Scholar] [CrossRef]
  88. Zhang, X.; Wang, K.; Hao, Y.; Fan, J.; Wei, Y. The impact of government policy on preference for NEVs: The evidence from China. Energy Policy 2013, 61, 382–393. [Google Scholar] [CrossRef]
  89. Mendoza, P.J.R. Electric vehicle uptake in the Kingdom of Thailand: Analysis using analytic hierarchy process. Master’s Thesis, Sripatum University, Bangkok, Thailand, 2018. [Google Scholar]
  90. Nemet, G.F. Demand-pull, technology-push, and government-led incentives for non-incremental technical change. Res. Policy 2009, 38, 700–709. [Google Scholar] [CrossRef]
  91. Fang, Y.; Wei, W.; Mei, S.; Chen, L.; Zhang, X.; Huang, S. Promoting electric vehicle charging infrastructure considering policy incentives and user preferences: An evolutionary game model in a small-world network. J. Clean. Prod. 2020, 258, 120753. [Google Scholar] [CrossRef]
  92. Zavadskas, E.; Kaklauskas, A.; Sarka, V. The new method of multicriteria complex proportional assessment of projects. Technol. Econ. Dev. Econ. 1994, 1, 131–139. [Google Scholar]
Figure 1. DSM conceptual framework.
Sustainability 15 07003 g001
Figure 2. A positive triangular fuzzy number, M.
Sustainability 15 07003 g002
Figure 3. Intersection between M 1 and M 2 .
Sustainability 15 07003 g003
Figure 4. Proposed methodology for prioritizing the barriers to EV adoption.
Sustainability 15 07003 g004
Figure 5. Decision hierarchy for ranking barriers to EV adoption.
Sustainability 15 07003 g005
Figure 6. Final weight of infrastructure policy sub-barriers.
Sustainability 15 07003 g006
Figure 7. Final weight of technological sub-barriers.
Sustainability 15 07003 g007
Figure 8. Final weight of market sub-barriers.
Sustainability 15 07003 g008
Figure 9. Sankey diagram illustrating the relationship between the FAHP categories “main barrier” and “sub-barrier”.
Sustainability 15 07003 g009
Table 1. Identified barriers from the literature.
Main BarriersSub-BarriersExplanationSource
Infrastructure policy barrier (A)Lack of proper government support/incentives and collaborationGovernment assistance and incentives have yet to increase EV production (A1).[42,43]
Inadequate electric power supplyIn rural Thai communities, an affordable and sustainable electricity source may not be available (A2).[44,45]
Insufficient charging infrastructure networkLack of charging stations throughout Thailand (A3).[32,46]
Battery recycling/environmental impact battery disposalThe chemical elements of the battery environmental concern during scraping of the battery elements (A4).[43]
Technological barriersThe range on a chargeLongest range of traveling on a full single charge (B1).[47,48]
(B)Battery lifespan/efficiencyBattery lifespan is caused by degradation (B2).[11,47]
EV charging time The time it takes to fully charge an EV(B3).[11,34,47]
Safety requirementSafety standards as specified by state or local regulations. Feeling safe while driving EVs (B4).[32,38,44,47]
PerformanceCompared to conventional vehicles, EVs are heavy (due to batteries) and do not handle well (B5).[49]
Market (C)Poor consumer perceptions and knowledgeWithout accurate knowledge and adequate awareness, consumers will resist purchasing EV (C1).[33,50]
Vehicle servicingSkills for technicians to rectify the troubleshoot as quickly as possible (C2).[47]
High capital costHigh costs associated with acquisition costs, maintenance, and running costs compared to general vehicles have a major obstacle to the introduction of EVs (C3).[11,47,51,52]
Raw materials for batteriesRaw materials for batteries are rare, the availability of those materials may not be available enough for battery production (C4).[47]
Table 2. Fuzzy-AHP triangular scale.
Fuzzy NumberLinguisticFuzzy Scale (Triangular Scale)TFRNs
1Equally preferable(1, 1, 1)(1,1,1)
3Weakly preferable(2, 3, 4)(1/4, 1/3, 1/2)
5Fairly preferable(4, 5, 6)(1/6, 1/5, 1/4)
7Strongly preferable(6, 7, 8)(1/8, 1/7, 1/6)
9Absolutely preferable(9, 9, 9)(1/9, 1/9, 1/9)
2, 4, 6, 8Intermediate values between the two adjacent judgments(1, 2, 3), (3, 4, 5), (5, 6, 7) and (7, 8, 9)(1/3, 1/3, 1) (1/5, 1/4, 1/3), (1/7, 1/6, 1/5) and (1/9, 1/8, 1/7)
Source: Adapted from [81].
Table 3. Pairwise comparison matrix of main barrier.
Main BarrierABC
A1, 1, 11.4837, 2.3051, 2.62074.0933, 5.3093, 6.4195
B0.2646, 0.3612, 0.52461, 1, 11.6984, 2.5132, 3.5255
C0.2100, 0.2539, 0.30780.2837, 0.3979, 0.58881, 1, 1
CR = 0.0663 < 0.10
Table 4. Pairwise comparability arrangement of sub-barriers for infrastructure policy barrier.
AA1A2A3A4
A11, 1, 11.8493, 2.5873, 3.38790.32891, 0.5529, 0.79371.9064, 2.9938, 4.0357
A20.3158, 0.3865, 0.75651, 1, 10.1895, 0.2990, 0.32401.5131, 2.5698, 3.5954
A31.0000, 1.6475, 1.88601.9652, 2.1070, 3.36041, 1, 13.6247, 4.6980, 5.7462
A40.3158, 0.3340, 0.60700.3340, 0.4903, 0.79370.1740, 0.2129, 0.27591, 1, 1
CR = 0.0139 < 0.10
Table 5. Pairwise comparability arrangement of sub-barriers for technological barrier.
B1B2B3B4B5
B11, 1, 10.9746, 1.2222, 1.81710.5210, 0.7071, 1.01770.5302, 0.7937, 1.30770.7071, 1.1776, 1.7321
B20.5992, 0.8182, 1.23221, 1, 11.2849, 1.7426, 2.27870.9005, 1.2849, 1.69840.8327, 1.2009, 1.8493
B30.9826, 1.4142, 1.91940.4388, 0.5739, 0.77831, 1, 11.2599, 2.2894, 3.30190.9806, 1.5431, 2.4019
B40.7647, 1.2599, 1.88600.5888, 0.7783, 1.11050.3029, 0.4368, 0.79371, 1, 10.8736, 1.4422, 2.2894
B50.7638, 0.8492, 1.41420.5407, 0.8327, 1.20090.4368, 0.6934, 1.14470.6300, 0.6934, 0.79371, 1, 1
CR = 0.0747 < 0.10
Table 6. Pairwise comparability arrangement of market barrier sub-barriers.
C1C2C3C4
C11, 1, 11.8493, 2.5873, 3.38790.3891, 0.5529, 0.79371.6475, 2.9938, 3.1665
C20.2952, 0.3865, 0.54071, 1, 10.2554, 0.3483, 0.43681.1225, 2.0396, 2.2209
C31.0000, 1.6475, 1.88601.9652, 2.6547, 3.36041, 1, 14.5087, 4.6980, 6.5557
C40.3158, 0.3340, 0.60700.4503, 0.4903, 0.89090.1525, 0.2129, 0.22181, 1, 1
CR = 0.0093 < 0.10
Table 7. Final prioritization of EV barrier adoption.
Main BarrierMain WeightSub BarrierCRRatio WeightFinal WeightRank
Infrastructure0.6058A10.0140.30720.18612
policy A2 0.15390.09323
barriers A3 0.44250.26811
A4 0.09640.05847
Techno logical0.2657B10.0750.19010.05058
barriers B2 0.23000.06116
B3 0.23750.06315
B4 0.18000.04789
B5 0.16240.043210
Market0.1285C10.0090.29600.038011
barriers C2 0.14970.019212
C3 0.45480.05854
C4 0.09950.012813
Disclaimer/Publisher’s Note: The statements, opinions and data contained in all publications are solely those of the individual author(s) and contributor(s) and not of MDPI and/or the editor(s). MDPI and/or the editor(s) disclaim responsibility for any injury to people or property resulting from any ideas, methods, instructions or products referred to in the content.

