
The Bird Dawn Chorus Strength of an Urban Soundscape and Its Potential to Assess Urban Green Spaces

WAVES Research Group, Department of Information Technology, Ghent University, B-9058 Gent, Belgium
Sustainability 2023, 15(8), 7002; https://doi.org/10.3390/su15087002
Submission received: 15 February 2023
/
Revised: 17 April 2023
/
Accepted: 19 April 2023
/
Published: 21 April 2023
(This article belongs to the Special Issue Urban Noise Pollution and Solutions)
Abstract
:Green areas in urban environments, such as urban parks and urban gardens, are known to provide benefits called “ecosystem services” to the urban community. Green recreational spaces offer opportunities for physical activity, leading to improved physical and mental health of residents. For this reason, the presence and the quality of such areas has to be considered and promoted in sustainable urban planning, especially in the context of contributing to the achievement sustainable cities. As the biodiversity of an area is an indication of its quality, soundecological indicators have been used to assess the biodiversity in natural areas. Due to the presence of anthropogenic sounds in urban areas, the use of these indicators to determine the quality of urban areas can be questioned. However, the vocal activity of collectively singing birds during the dawn chorus contributes to the urban soundscape, and results in a prominent biophonic component of this soundscape, as can be clearly seen in its yearly pattern. The use of soundecological indicators through the estimation of the Bird Dawn Chorus Strength has the potential to provide a means of assessing the quality of urban green spaces. To demonstrate this potential, a pilot study is presented here on the annual temporal scale of the soundscape of a typical urban green space.
1. Introduction
Due to demographic evolution, urban areas continue to grow all over the world, occupying previous green natural areas and making urban areas the main environment people live in; the resulting environmental issues (poor air and water quality, noise pollution) represent important challenges for urban designers. In the current view of urban development, urban green spaces are known to deliver ecosystem services to both residents and society [1]. Green spaces are attractive meeting places, encouraging social interaction, discussion, and picnicking, …), stimulate physical activities such as walking and running, …) and can provide opportunities for mental restoration through resting and meditation, …) [2,3]. In this way, urban green spaces facilitate social interaction and stimulate the physical and mental health of residents, improving their overall well-being. Additional environmental ecosystem services consist of air quality improvement, temperature regulation, water quality improvement, and acoustic mitigation [4,5]. Apart from larger scale green urban areas such as city parks, smaller-scale green elements such as green roofs, green walls, gardens, and additional infrastructure consisting of green elements represent important contributors to urban ecosystem services [6,7].
Demographic changes and the resulting pressures on the environment are widely understood as one of the main problems and challenges ficing contemporary society. With the statement of the sustainable development goals by the United Nations, efforts are being prepared and taken by many different stakeholders [8]. Sustainable Development Goal 11 considers sustainable cities and communities. Due to the ecosystem services they provide, an important element in reaching this goal is the creation and upgrading of urban green spaces.
Considering that limited space is a major constraint of an urban green area, assessment of its quality is necessary for evaluating design options as well as for follow-up in maintenance and redesign activities. Although green quality assessment requires a multidimensional perspective at a microspatial scale [9], the ecological structure and related ecological processes of an area are at the centre of any ecosystem services assessment [10]. Because the ecological structure integrates underlying species composition, density, and coverage, biodiversity is an important indicator from an ecological viewpoint; it reflects the green quality of an area, and is used in urban green space management [11]. Among the urban fauna, birds have high visual and acoustic saliency and can be easily observed and identified, making them an interesting model suitable for the evaluation of environmental changes in urban areas and a valuable proxy for use as a biodiversity indicator [12,13,14]. In relation to the previously mentioned well-being benefits of green spaces, focusing on birds has an additional added value, as bird watching and the expertise level of it is an important restorative element in nature-based therapies for psychological or psychiatric help [15]. During the COVID-19 pandemic, just such a positive effect was reported by psychiatrists regarding symptoms of pandemic-related isolation [16].
Where traditional bird biodiversity assessment is based on labour-intensive field studies by trained observers collecting bird presence counts at regular time intervals, acoustic monitoring has proven to be a valuable alternative when long-term recordings can be obtained [17]. Acoustic sensor nodes have been used to capture the vocal signals of acoustically active animals (i.e., birds, frogs, crickets). When automated systems for collecting sonic data over a large area can be set up, it is possible to obtain very large sonic datasets consisting of biodiversity information [18]. However, efficient processing of these datasets to identify birds is a challenging task. A first approach is a general atomic strategy in which the acoustic scene is analysed in order to identify the vocally active animals. With this purpose, different identification algorithms have been studied and applied in which sequences of feature vectors from time slices in the recordings are used to indicate the presence of birdsong and identify birds using classifiers based on, among other methods, spectral peak tracking, Hidden Markov Models, Convolutional Neural Networks, and Deep Neural Networks; for a recent review, see [19]. While these methods obtain good results, they show specific drawbacks. In general, they are designed to recognize a limited set of expected birds in the recordings, and show poor results in detecting simultaneous occurrences of multiple species or individuals. A particular problem is the fact that in urban areas birds have been shown to adapt their song to anthropophonic disturbing sounds, which often have low frequencies, by increasing their pitch [20]. As many recognisers are trained from birdsong examples, this can lead to incorrect classification results. In addition, validation of supervised recognition algorithms and their adaptation to the specific local species richness is a labour-intensive process.
In a different and more holistic approach, recorded soundscape characteristics obtained from soundecological indicators can be studied [21]. Common indicators include the acoustic complexity index (ACI) [22], normalized difference soundscape index (NDSI) [23], acoustic diversity index (ADI), acoustic evenness index (AEI), bioacoustic index (BIO) [24], and ENTROPY. These indicators reflect the biophony, geophony, and anthropophony of a soundscape, are straightforward to calculate, and have been shown to be related to the biodiversity of natural areas [25,26,27], as several of these indicators are defined in a way that emphasises the biophonic component. In urban areas, the anthropogenic component can be prominent in the soundscape, as manifold anthropogenic sounds such as those from vehicles, machinery, and human activity are present. These sources and their spectro-temporal signatures contribute to the soundecological indicators, leading to a bias in their values [28]. Soundscape recordings in urban areas have previously been reported [29,30], as has their processing to obtain the biophonic, geophonic, and anthropogenic components [31].
Bird densities in urban areas have been studied in detail [32,33]; in order to focus on the diversity of the bird population present, the dawn chorus represents an attractive moment during the day for study. During this time slot, most male birds are vocally active as a means of defending territory and attracting females [34]. Consequently, a dawn chorus screening of bird activity is valid option in the biodiversity assessment of an urban area. In this paper, we report on a pilot study with the purpose of quantify the bird dawn chorus component. Long-duration recordings from a standard urban area were collected. In the next section, this dataset is presented and its processing is explained. In the Results section, the temporal patterns are presented for daily and yearly scales of the indicators. These soundecological indicators provide a clear indication of the bird dawn chorus; based on the temporal behaviour of the selected indicator, a Bird Dawn Chorus Strength metric is defined in order to quantify the dawn chorus intensity. In the Discussion section, the use of this value is considered as a quantification value that can lead to long-term assessment of an urban green place, as is needed for urban planning and maintenance practice.
2. Materials and Methods
2.1. Data Collection
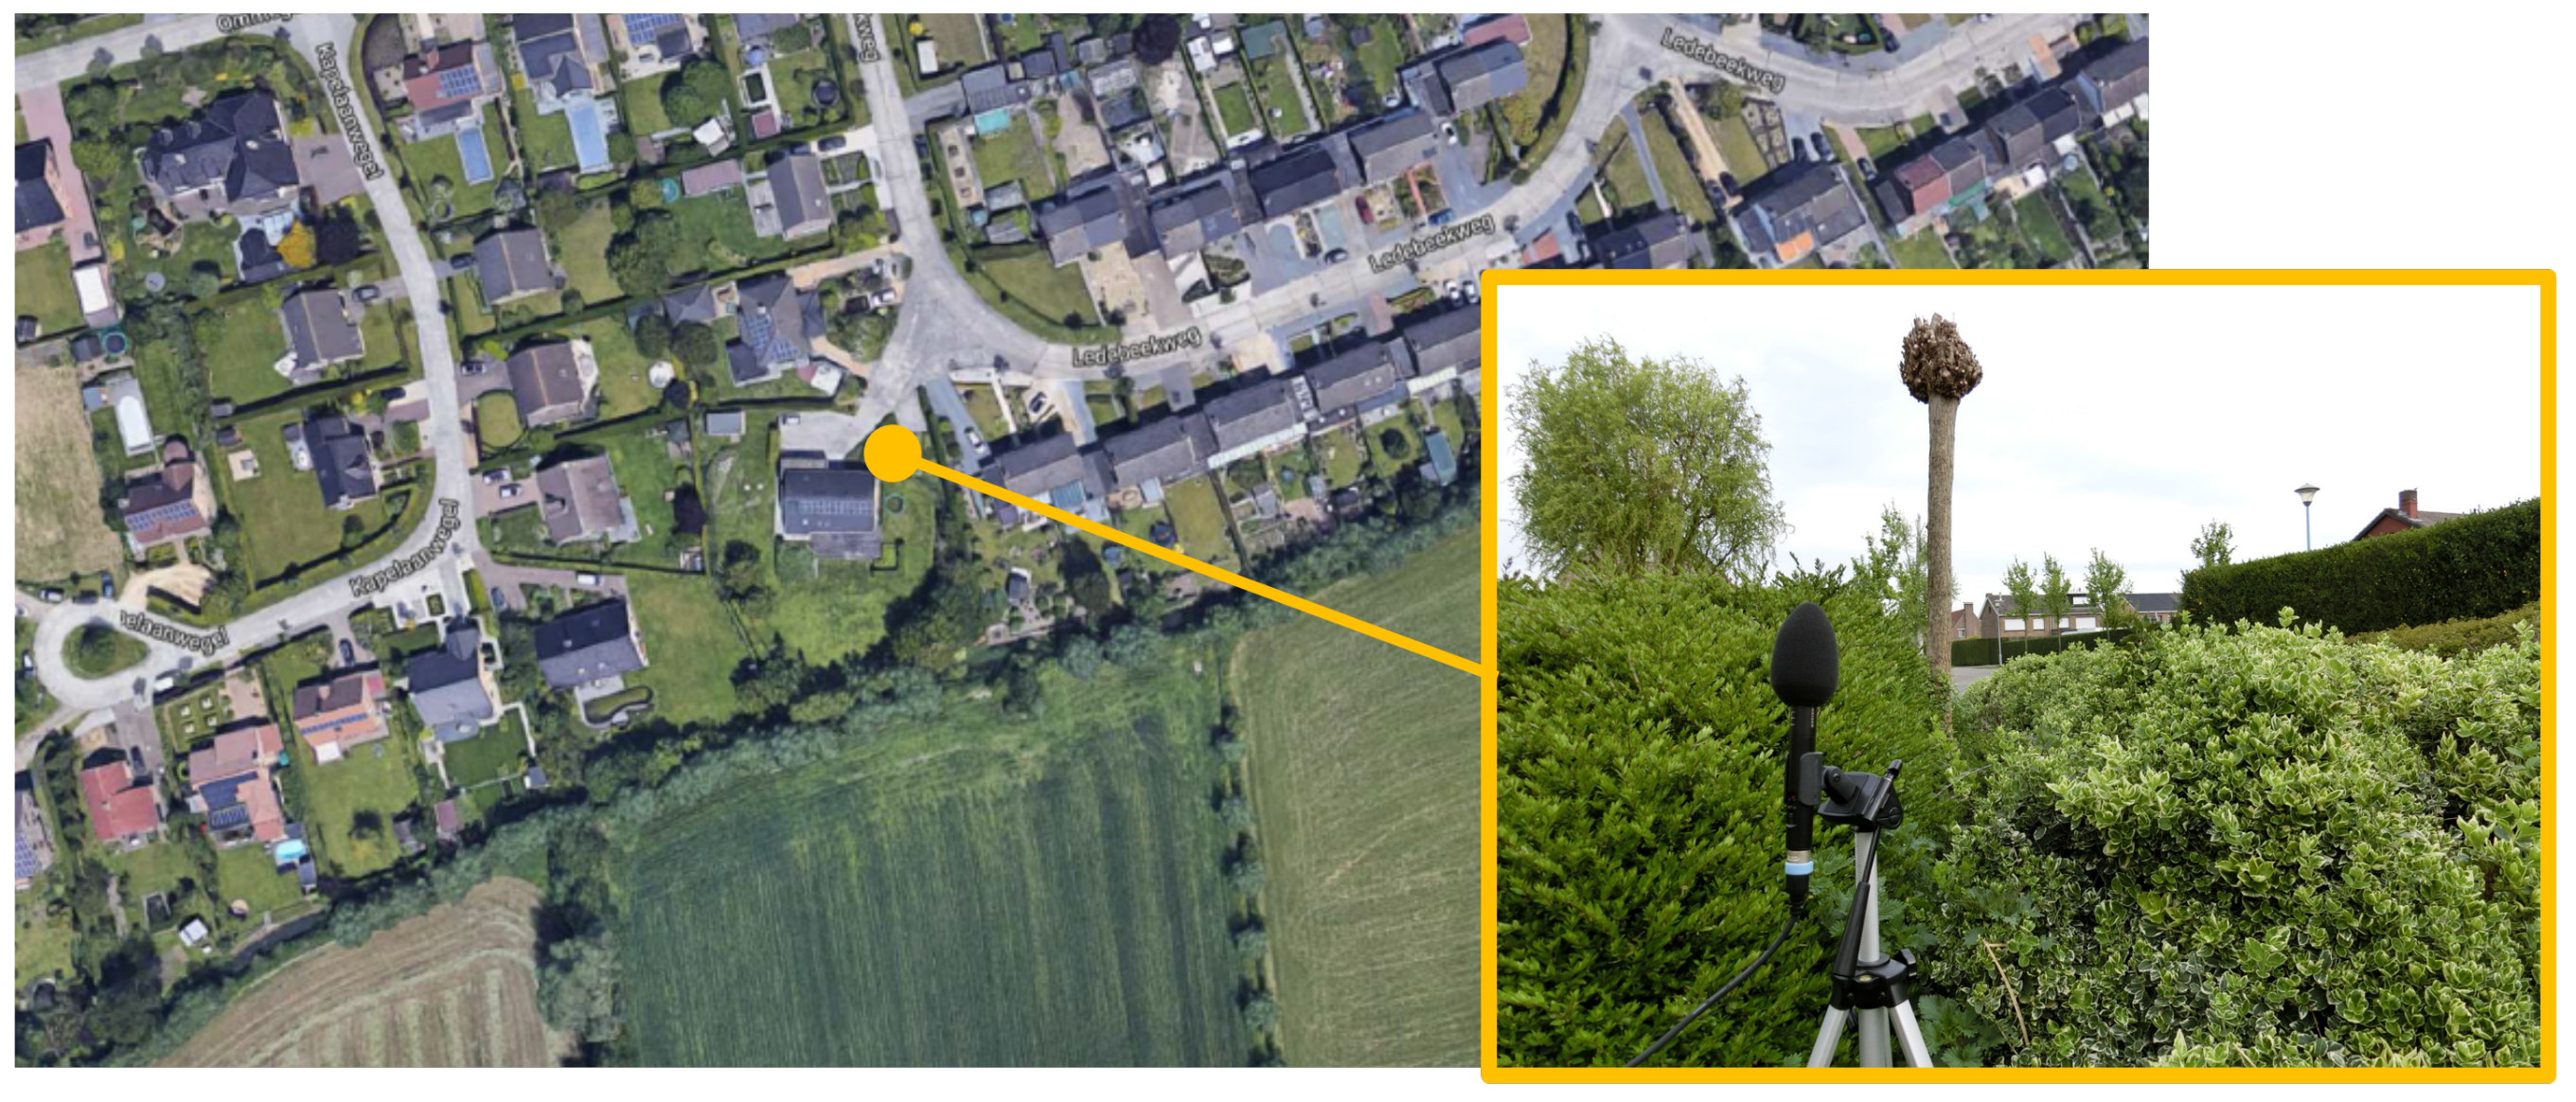
Long-duration sound recording in a typical urban area took place from spring 2016 to spring 2017. Single-track audio recordings in raw format (16 bit, 44.1 ksps wav files) were recorded. The equipment consisted of a Tascam DR60D recorder and a Sennheiser ME62 (omni-directional) microphone fitted with a wind shield. More than 150 h of recorded data were obtained during consecutive days sampled over a complete year cycle. Convenient recording conditions with no or limited rainfall and moderate wind velocities were applied. From these recordings, full-day parts of 24 h each were studied in detail for the following dates (in dd/mm/yyyy format): 18/03/2016, 03/04/2016, 13/04/2016, 01/05/2016, 01/06/2016, 10/06/2016, 21/06/2016, 26/07/2016, 17/08/2016, 14/09/2016, 06/10/2016, 24/11/2016, 15/12/2016, 20/10/2017, and 17/02/2017. The study area, located in the Ghent urban agglomeration, Belgium, is characterized as a residential area with a mix of detached single-unit housings and semi-detached dwellings, along with gardens and local roads with sparse low-speed traffic (50 km/h speed limit). The area borders an agricultural (rural) area, and as such is located at the outer edge of the urban–rural gradient (Figure 1). At a distance of about 375 m from the recorder, a railway is present in the rural landscape, resulting in related anthropogenic background sounds.
For occupancy data and bird presence detection, expert on-site observations were performed at regular time slots over the study period. Expert listening was performed to support the analysis of the recordings.
2.2. Data Processing
In habitat characterization and biodiversity assessment, different acoustic indexes known as soundecological indicators can be calculated [21]. As the frequency content of the recorded sounds is essential, the first step in their calculation is to obtain a spectrogram from the recorded time series signals using the short-time Fourier transform. Here, the indicators have been defined to capture specific aspects of the time–frequency outcome of the obtained spectrograms, and were calculated using the soundecology package [35] and seewave-R [36] package with the default parameters and time steps of one minute. to obtain the time series of the different indicators. The following indicators are used in this study:
The Acoustic Complexity Index (ACI) is calculated by dividing the time span under study into different smaller time steps, typically of about 10–20 ms. The entire frequency range is first split into sub-kHz frequency bins. Focusing on a single bin at a time, the absolute difference between intensities is then calculated for the time steps in sequence. These are summed for the complete time span and divided by the accumulated intensity over the full time span, then this result is added to similar results for all of the other frequency bins over the entire frequency range. This final result is the ACI value, which is an estimate of the number of bird vocalizations (the biophonic content) based on the strong temporal intensity modulation typical in birdsong as compared to the rather slow intensity variation typical of environmental noise from passing cars, trains, air transits, etc. [22]. In our case, the reference time span of the reported ACI values was a single minute.
The Normalized Difference Soundscape Index (NDSI) is calculated from the normalized power spectral density (PSD) of the signal after consideration of specific spectral regions. The first spectral region is a standard anthrophonic frequency window (1000–2000 Hz) in which mechanical sounds are more prevalent. The resulting sum of the power in this frequency range is provided as the -value. Then, a higher frequency range of 2000–11,000 Hz, where biophonic sounds are more prevalent, is considered. Frequency bins of the same 1 kHz range are taken and the sum of the power in the frequency bin is considered, where the -value is defined as the maximum value of the power in the different biophonic 1 kHz frequency bins. Both values are combined in the NDSI value, calculated as , resulting in a value between +1 (pure biophonic sound) and −1 (pure anthrophonic sound) [23].
The Bioacoustic Index (BIO), introduced by Boelman et al. [24], reflects biophonic activity. It is calculated from the spectral power in the frequency range from 2000 to 8000 Hz (spectral power density integrated over the given frequencies) above a predefined threshold power level. In general, the threshold level should be selected to discriminate background sounds.
The Acoustic Diversity Index (ADI) is calculated by dividing the spectral range of the spectrogram (considered as 0–10 kHz) into frequency bins (1 kHz steps by default) and considering the proportion of the signal energy in each bin above a threshold (default −50 dBFS) for the time span under study. From these ten values, the Shannon entropy index is calculated to find the ADI value [21].
The Acoustic Evenness Index (AEI) is similar to the ADI, except that the obtained distribution of the different frequency bin values is now indexed using the Gini index [21], resulting in a value between 0 and 1.
Entropy, i.e., the total entropy of the signal, is calculated as the product of the temporal entropy and the spectral entropy of the signal [25]. The temporal entropy is calculated from the envelope of the sound signal, which can be obtained by Hilbert transformation. The spectral entropy is obtained from the mean frequency spectrum of the different time frames. High variation in the frequency spectrum and in the amplitude envelope leads to high entropy values. This is the typical case in birdsong, which is expected to have high entropy values.
It must be stated that these soundecological indicators rely on typical characteristics of the different soundscape components; one such characteristic is the frequency of 2 kHz, which is considered to be the switching frequency between anthrophonic and biophonic sounds [23]. As such, while these indicators have an overall discriminative power, it is certainly not comparable with the discriminative power of a perfect classifier.
3. Results
3.1. Daily Patterns
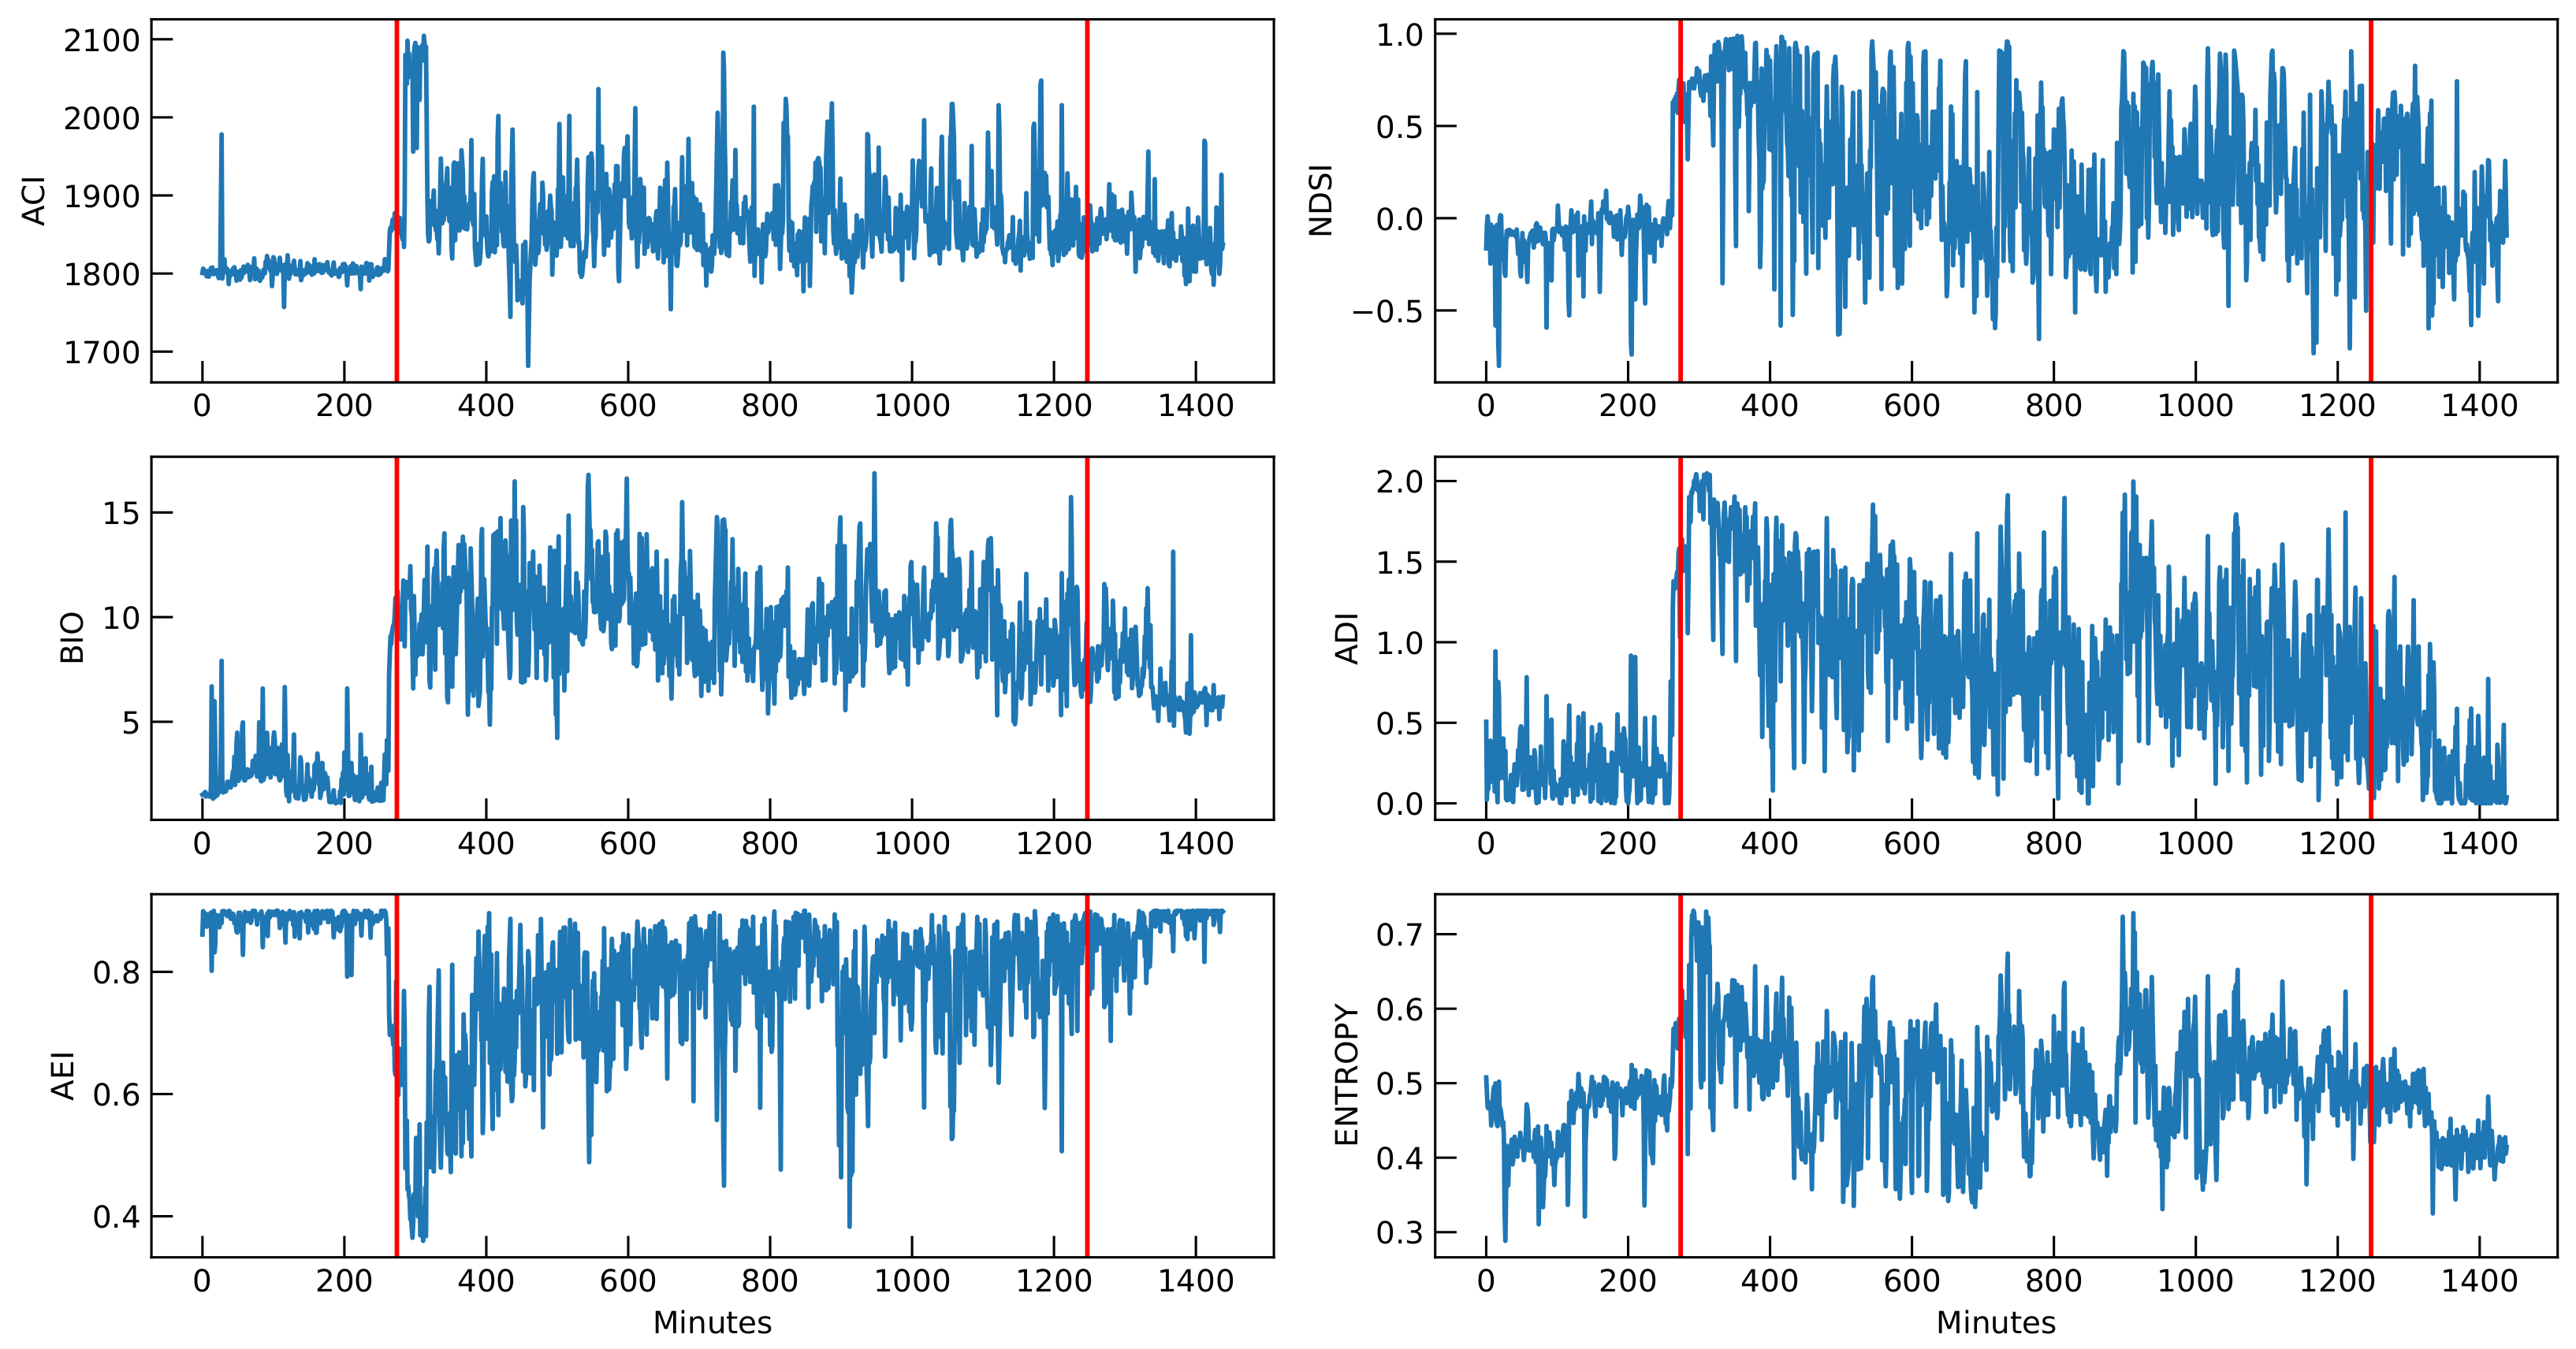
From long time recordings, daily patterns of the soundecological indicators were calculated. As an example of these measurements, the results of a 24 h cycle (1 June 2016) are shown in Figure 2, with the raw one-minute values without time averaging reported; the night-to-day (sunrise) and day-to-night (sunset) transitions are indicated in the plots as well. During the night, the values are quite stable and constant, reflecting the quiet nature of the night soundscape. All indicators for this date show an abrupt transition in their level around morning. During this, transition the indicators reach a clearly higher level (in case of ACI, NDSI, BIO, and ENTROPY) or lower level (in case of AEI), reflecting the nature of the indicator. At the end of the day, the values return to the nightly level, taking into account day-to-day variations. It should be mentioned that for other 24 h recordings the nightly level was observed to be more variable.
3.2. Annual Pattern
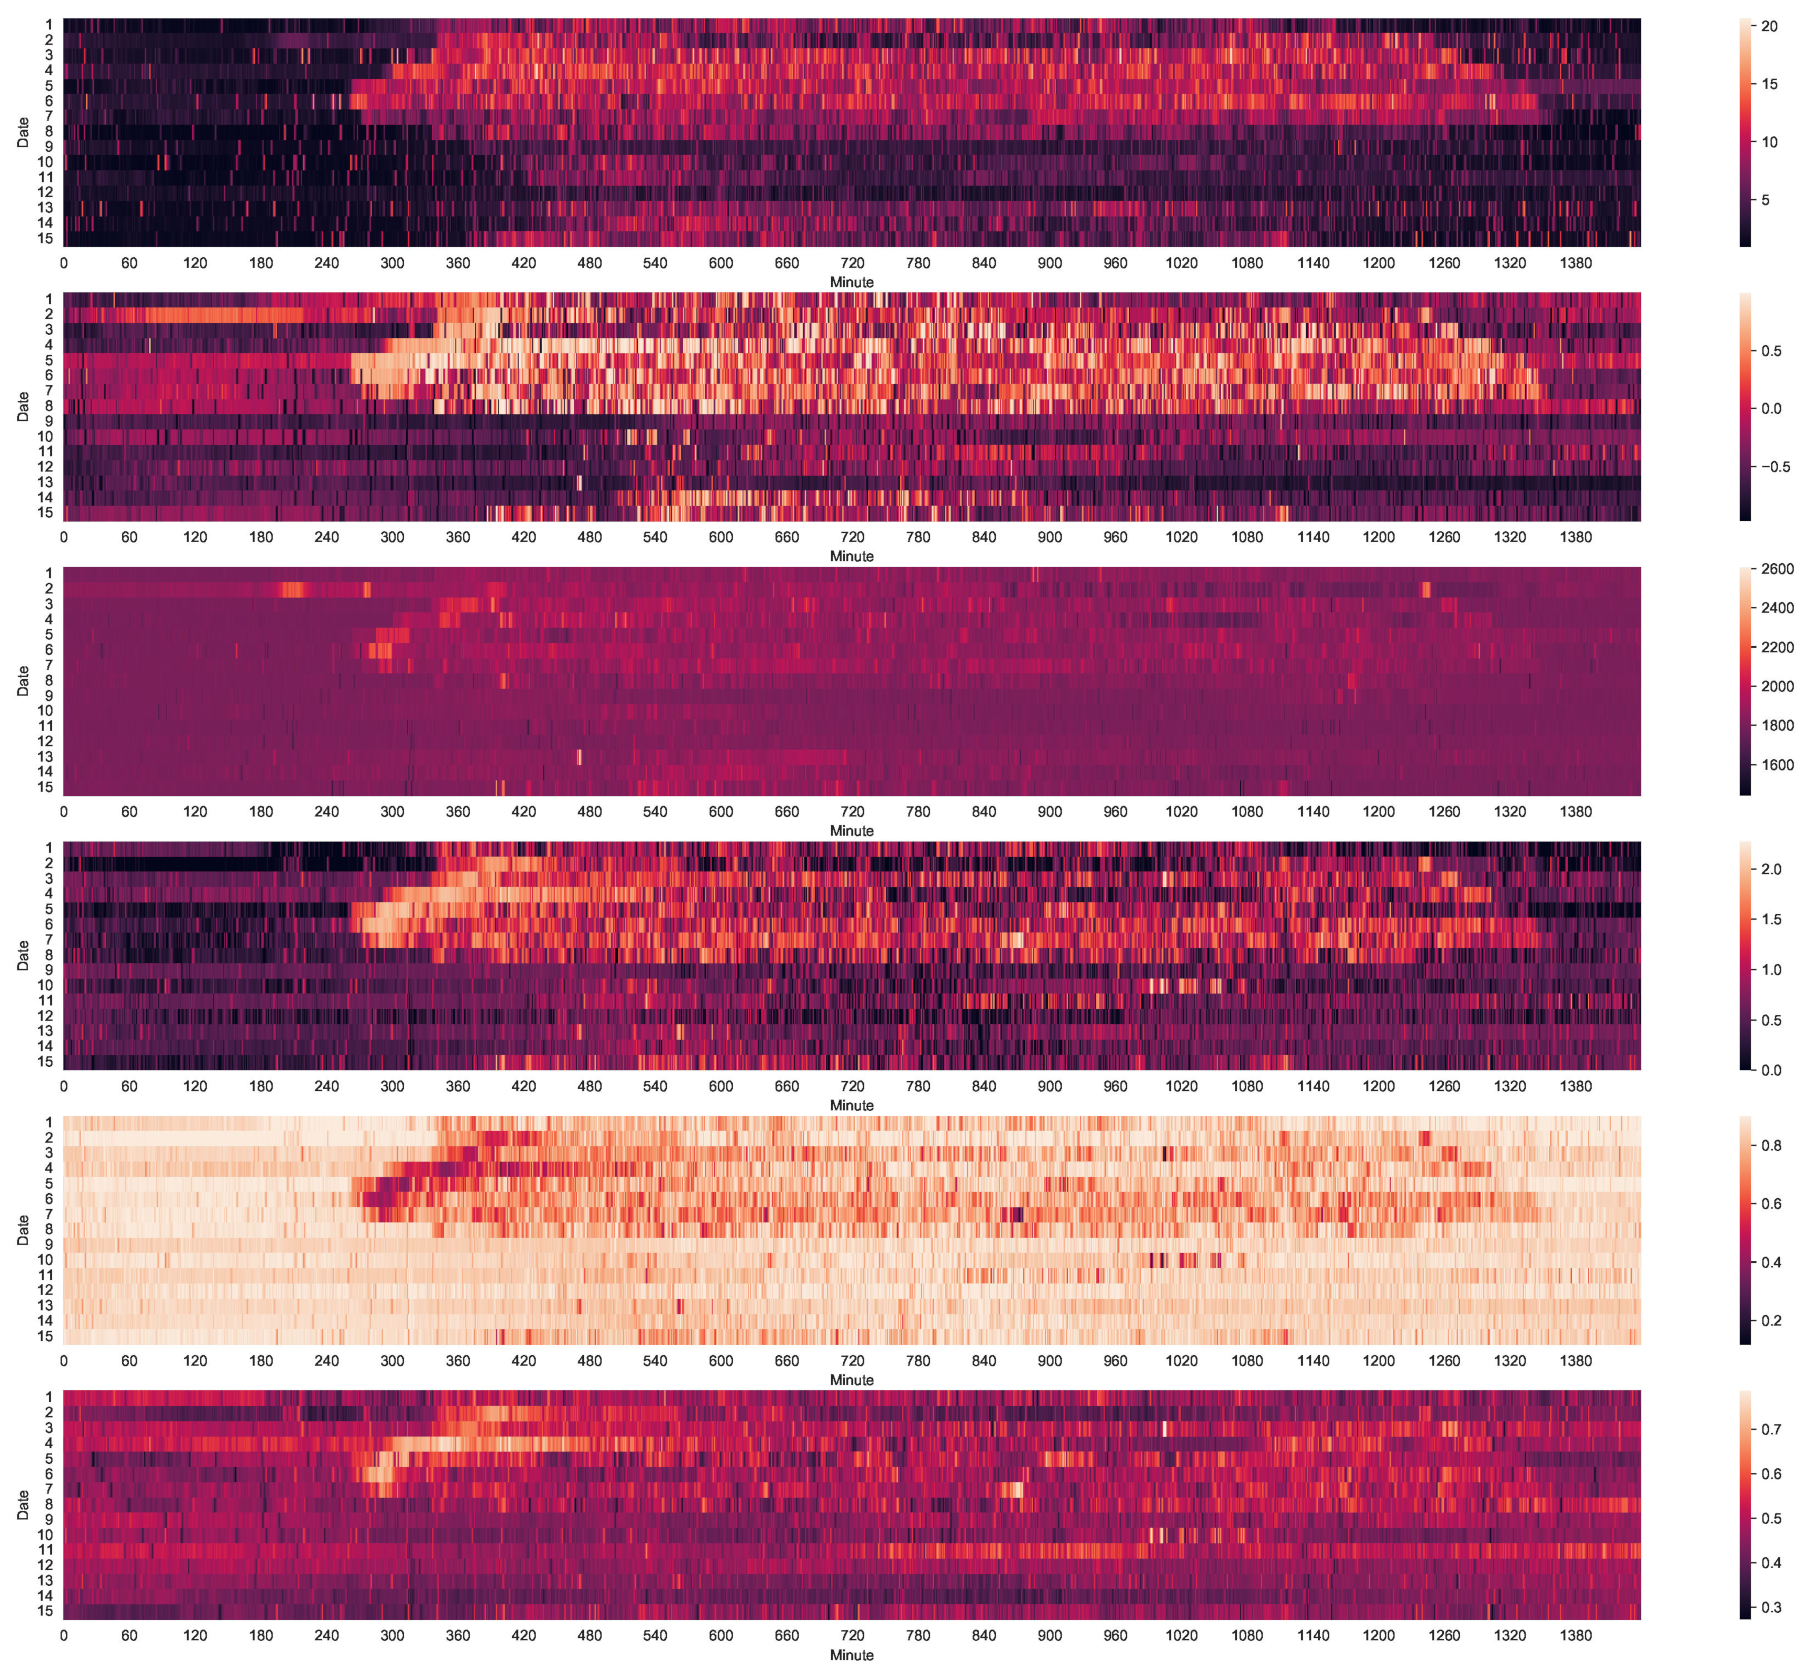
As bird activity, particularly and bird singing, is strongly dependent upon the season, it is important to consider the annual pattern. In order to do this, the daily patterns along a complete yearly cycle were obtained. The averaged daily patterns for the different soundecological indicators are shown in Figure 3. For a better indication of the trends in the cycle, a moving averaging was applied over a 15-min time window. During the first half of the year (January to June), all indicators show a clear morning transition, reflecting the onset of the dawn chorus as the biophonic component of collectively singing birds. This onset follows the changing time of the sunrise or dawn throughout the year. Apart from the dawn chorus in the morning, positive NDSI values are visible during daylight hours, reflecting biophonic activity throughout the day. In addition, in the evening, this activity stops around dusk and the values return to their nightly level, which is consistent with the daily pattern described above. While all indicators reflect this behaviour, it is only poorly observable in the BIO indicator.
During the second half of the year (July to December), the abrupt change taking place around sunrise or dawn is no longer present. Only small variations of the indicator values during the complete daily period are observed, reflecting specific changes in the soundscape content and dynamics.
3.3. Bird Dawn Chorus Strength
In order to quantify the Bird Dawn Chorus Strength (BDCS), a calculation of the transition strength of the specific indicator is provided. To reflect the observed step-like change, it is based on the integration of the indicator time-series values in a time window before and after the transition time (). In the case of ACI, we refer to these values as and , with and , where N corresponds to the length of the time window. The BDCS reflects the relative transition strength, and in the case of the ACI indicator is defined as follows:
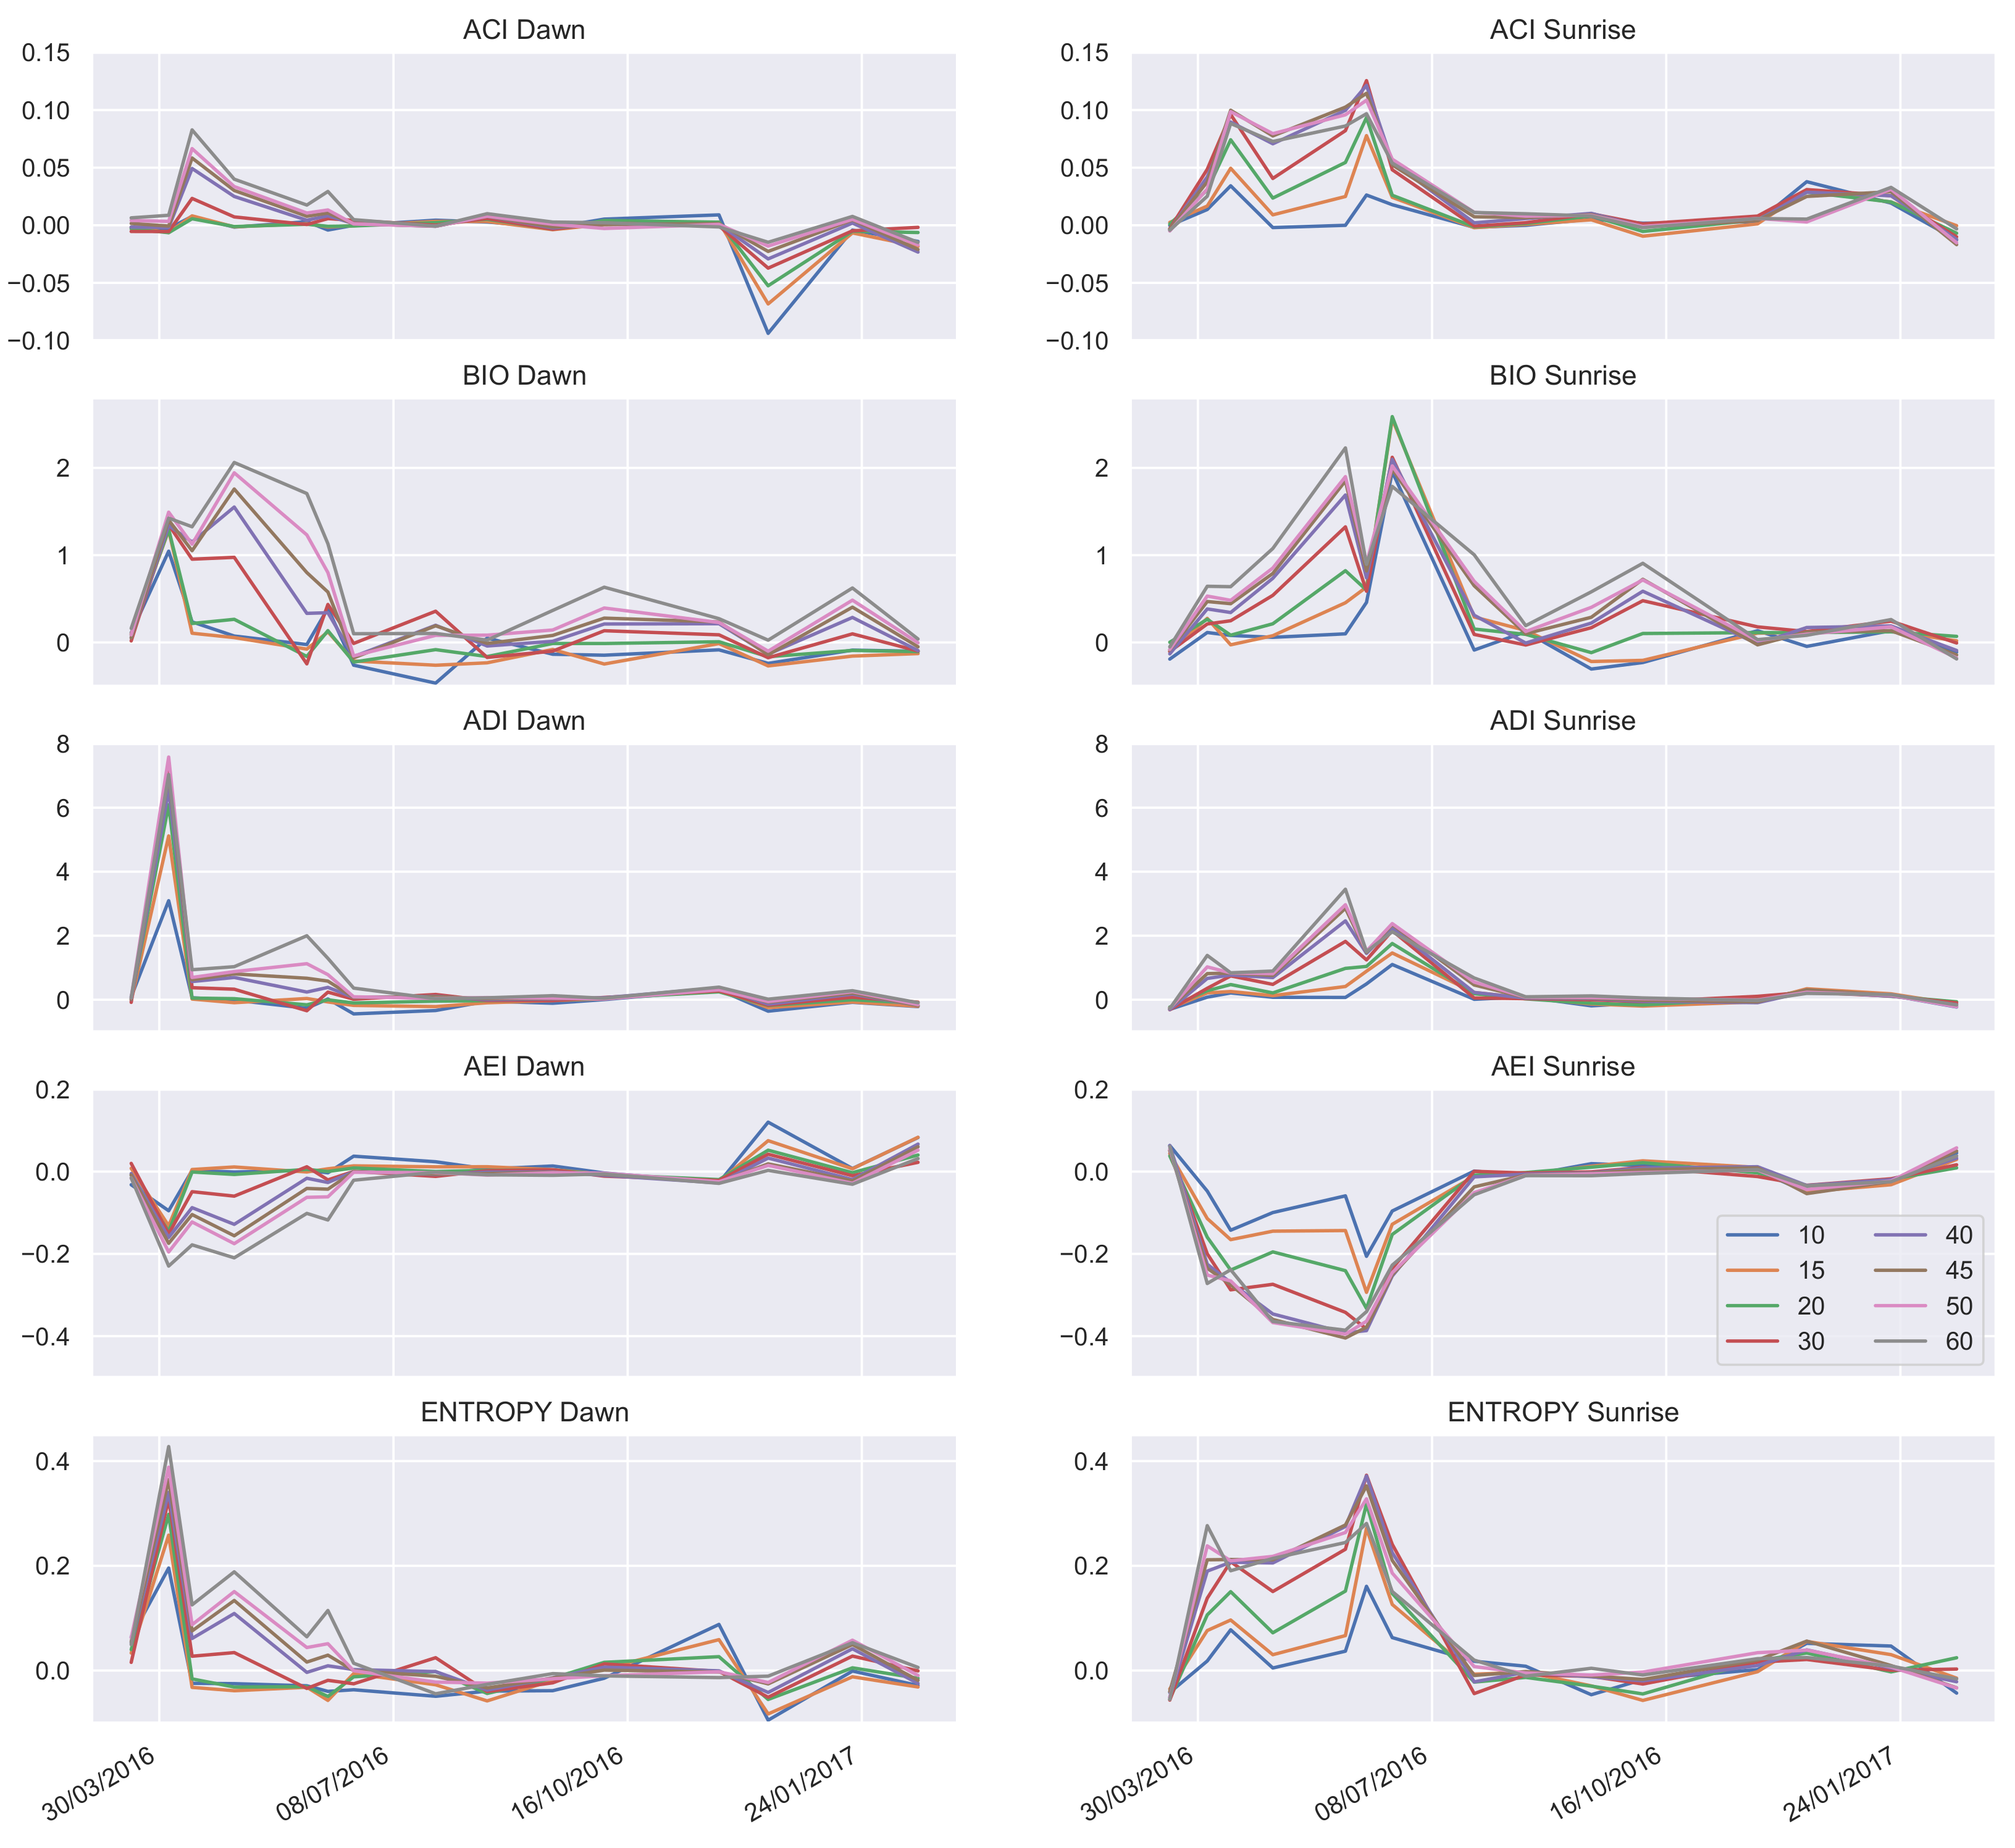
Similar definitions apply for the other indicators. As the NDSI has values around 0, it is excluded from this calculation, as the singular results could hinder interpretation of the obtained outcomes. Figure 4 reports the calculation of the BDCS from the different indicators for different time window lengths ranging from 10 to 60 min. The times of dawn (when light first appears) and sunrise (when the upper rim of the Sun first appears on the horizon) are used as the transition times. As can be seen from the plots, using the sunrise as the transition time provides a more prominent indication of the collective dawn chorus singing of birds. Thus, use of the sunrise as the transition time is preferred due to the strength of this value. Related to the time window length, as represented by the N value, it can be observed that longer window lengths are associated with higher BDCS values. For several indicators, specifically AEI, ENTROPY, and ACI, saturation of the BDCS values is observed. This saturation is present for a window length of 40 min, and remains for longer window lengths.
4. Discussion
The reported measurements of the behavior of the studied soundecological indicators over daily and yearly timescales reflect the presence and mix of different soundscape components in the urban area under study. Considering the biophonic component, the presence of different singing bird species was confirmed by an expert listening to the recordings and by supporting field observations. The following bird species common in Western Europe, among others, were identified to be present as breeding species: the common blackbird (Turdus merula), dunnock (Prunella modularis), Eurasian wren (Troglodytes troglodytes), European robin (Erithacus rubecula), and common chiff-chaff (Phylloscopus collybita). These different species present in the urban ecosystem under study have specific vocal activity pattern during the day; several prefer to sing throughout the day, while others participate most strongly in the chorus moments at dawn and dusk (e.g., the common blackbird and dunnock) [34]. This is reflected in the reported daily patterns during the first half of the year (January to June), as can be seen in Figure 3 where, e.g., the NDSI values are indicative of this. Positive NDSI values reflect a dominant biophonic soundscape, and can be seen around sunrise as well as spread throughout the day. It should be mentioned here that urbanization has an influence on the phenology of the singing of birds, making them sing longer and earlier in urban areas [37]. The start of the dawn chorus is the result of the start of singing by the different bird species that are present, and is known to be species-specific and regulated by different environmental factors such as light conditions [38].
In different study areas and regions, other vocalising animals such as frogs and crickets can contribute to the biophonic soundscape component; however, they were absent during the dawn chorus is our study area, allowing us to take birdsong, in particular the bird dawn chorus. as the main biophonic component under consideration. Birds are a high-level taxon [39], and year-long recording have been shown to be the preferred biodiversity assessment [17]. In the urban context, it is known that urbanization is a driver of cross-taxon declines in abundance and diversity at multiple spatial scales [40]. For this reason, biodiversity monitoring from acoustic measurements is attractive. However, the current holistic approach to the dawn chorus limits its use for such a complete quantitative diversity assessment, as different bird species do not participate in the dawn chorus, as is the case for birds such as owls that are active at night [41]. However, the composition within the dawn chorus reflects the diversity between songbirds, and as such has clear value for reflecting specific biodiversity changes at spatial scales much larger than the scale of the study area, or even the green area considered in general.
The anthropogenic component of an urban soundscape strongly varies with the detailed position of the recorder with respect to the presence of neighbouring active traffic elements in its close surroundings. As the current study area was in a residential area at the outer edge of an urban-to-rural transition, the main characterisation of the soundscape can be considered quiet, with an anthrophonic component only strongly present during specific and limited time spans. While the current pilot study was performed using a single fixed recorder, the use of multiple recorders covering a larger study area could improve the estimation of the dawn chorus strength, as particular vicinity effects of a single recorder could be eliminated. In the case of a single recorder, as in the case of the current study, the selection of a suitable recorder position can be estimated from a priori recordings and from standard acoustic propagation considerations.
Several different indicators have been reported in this study in an attempt to provide insight and detail in their different focus. From their overall comparison, the BIO indicator has a weak focus and could be left aside for use in practical assessment. It is known that certain indicators are correlated, meaning that the indicator set could be reduced to a selected number of components (indicators), as can be concluded from PCA analysis [30]. In this way, a more limited set of practical indicators could be used for assessment.
Considering the BDCS value, it is intended for practical assessment in urban management, where the effects of restoration measures need to be evaluated in order to define adjustments to such measures as necessary. When observing the obtained results for different calculation parameters, as seen in Figure 4, smooth variations are only present with the AEI and somewhat less with the ACI, making AEI-based calculation the preferred indicator. Because the obtained values are higher, the transition to be considered is the sunrise. For the time window length, a value of 60 min is suggested as the standard time window. In this case, the calculation shows saturation with respect to the time window length before and after the sunrise transition. Such saturation is attractive, as it provides the benefit of insensitivity to errors in the time window length. In order to obtain a yearly value of the BDCS, two options can be considered with respect to the availability of continuous or multiple repeated recordings: first, the maximum value of the BDCS daily values can be considered; or second, an aggregated value representing the mean value over a fixed period of the year during which the dawn chorus is clearly present. In this way, possible temporal irregularities can be compensated for. In the Western European region, it is suggested that this fixed period be the period covering the months of May and June. In a more accessible methodology, limited sampling during this period could be an option.
Considering the use of such assessments in the management of urban green areas, standardisation of the used indicators is preferable. The proposed BDCS could be a valuable candidate, as it is straightforward to calculate and accessible with measurements obtained using standard acoustic equipment. However, future research in different urban settings is needed in order to validate the proposed strength value and its selected calculation option. As previously mentioned, different environmental light conditions in urban areas can result in variable onset of the dawn chorus, making convenient selection of the specific transition time for the calculation of the BDCS value a point to consider in future studies. Where standard definitions can be provided, the use of the soundecological indicators themselves is not standardized with respect to their calculation parameters. Different parameters need to be set, such as the considered frequency bin ranges, the frequency range for anthrophonic sounds, and more. However, in most cases these parameters can simply be set to the default values of the calculation implementation in the available software packages.
The use of the proposed BDCS value could contribute to practical assessment in urban green management, which is necessary in order to make progress in achieving Goal 11 of the Sustainable Development Goals by promoting and maximizing the incorporation of green areas in cities, thereby participating in the global goal of realizing sustainable cities.
5. Conclusions
In order to contribute to the Sustainable Development Goals, sustainable cities and communities must be promoted and realized. Urban green areas are understood to be a key component of sustainable cities, as they provide numerous ecosystem services to both residents and society. Because space for green areas in cities is scarce and expensive, the quality of the realized green areas is important and must be considered in urban planning and management. For assessment of this quality, acoustic studies have the potential to automate this otherwise labour-intensive process. As an illustration of this potential, a pilot study was conducted in which acoustic recordings of an urban soundscape over a time span of more than a year were measured and reported. Using standard soundecological indicators, the daily and yearly patterns of the soundscape were extracted, showing the clear contribution of the dawn chorus singing of the songbirds present in the area. The introduction and definition of the proposed Bird Dawn Chorus Strength (BDCS) metric provides a quantification related to the songbird population, reflecting the quality and diversity of an urban green area. This strength value is based on a transition strength around sunrise for the considered soundecological indicators, and it is recommended that it be calculated based on the step change of the AEI values around sunrise using a one-hour time window before and after sunrise. In the case of yearly assessment, the maximum value of the BDCS during the course of a full year has to be considered. When long-duration recordings are accessible, for instance with the installation of wireless acoustic sensor nodes, this can open the way for practical assessment and use in urban green management.
Funding
This research received no external funding.
Institutional Review Board Statement
Not applicable.
Informed Consent Statement
Not applicable.
Data Availability Statement
Data supporting these reported results can be obtained from the author after motivated request.
Conflicts of Interest
The authors declare no conflict of interest.
Abbreviations
The following abbreviations are used in this manuscript:
| ACI | Acoustic Complexity Index |
| NDSI | Normalized Difference Soundscape Index |
| BIO | Bioacoustic Index |
| ADI | Acoustic Diversity Index |
| AEI | Acoustic Evenness Index |
| BDCS | Bird Dawn Chorus Strength |
| PCA | Principal Component Analysis |
| PSD | Power Spectral Density |
References
- Bolund, P.; Hunhammar, S. Ecosystem services in urban areas. Ecol. Econ. 1999, 29, 293–301. [Google Scholar] [CrossRef]
- Chiesura, A. The role of urban parks for the sustainable city. Landsc. Urban Plan. 2004, 68, 129–138. [Google Scholar] [CrossRef]
- Tzoulas, K.; Korpela, K.; Venn, S.; Yli-Pelkonen, V.; Kaźmierczak, A.; Niemela, J.; James, P. Promoting ecosystem and human health in urban areas using Green Infrastructure: A literature review. Landsc. Urban Plan. 2007, 81, 167–178. [Google Scholar] [CrossRef]
- Mensah, C.A.; Andres, L.; Perera, U.; Roji, A. Enhancing quality of life through the lens of green spaces: A systematic review approach. Int. J. Wellbeing 2016, 6, 142–163. [Google Scholar] [CrossRef]
- Pataki, D.E.; Carreiro, M.M.; Cherrier, J.; Grulke, N.E.; Jennings, V.; Pincetl, S.; Pouyat, R.V.; Whitlow, T.H.; Zipperer, W.C. Coupling biogeochemical cycles in urban environments: Ecosystem services, green solutions, and misconceptions. Front. Ecol. Environ. 2011, 9, 27–36. [Google Scholar] [CrossRef]
- Oberndorfer, E.; Lundholm, J.; Bass, B.; Coffman, R.R.; Doshi, H.; Dunnett, N.; Gaffin, S.; Köhler, M.; Liu, K.K.Y.; Rowe, B. Green Roofs as Urban Ecosystems: Ecological Structures, Functions, and Services. BioScience 2007, 57, 823–833. [Google Scholar] [CrossRef]
- Cook-Patton, S.C.; Bauerle, T.L. Potential benefits of plant diversity on vegetated roofs: A literature review. J. Environ. Manag. 2012, 106, 85–92. [Google Scholar] [CrossRef]
- Kroll, C.; Warchold, A.; Pradhan, P. Sustainable Development Goals (SDGs): Are we successful in turning trade-offs into synergies? Palgrave Commun. 2019, 5, 140. [Google Scholar] [CrossRef]
- Daniels, B.; Zaunbrecher, B.S.; Paas, B.; Ottermanns, R.; Ziefle, M.; Roß-Nickoll, M. Assessment of urban green space structures and their quality from a multidimensional perspective. Sci. Total Environ. 2018, 615, 1364–1378. [Google Scholar] [CrossRef]
- Chang, J.; Qu, Z.; Xu, R.; Pan, K.; Xu, B.; Min, Y.; Ren, Y.; Yang, G.; Ge, Y. Assessing the ecosystem services provided by urban green spaces along urban center-edge gradients. Sci. Rep. 2017, 7, 11226. [Google Scholar] [CrossRef]
- Aronson, M.F.; Lepczyk, C.A.; Evans, K.L.; Goddard, M.A.; Lerman, S.B.; MacIvor, J.S.; Nilon, C.H.; Vargo, T. Biodiversity in the city: Key challenges for urban green space management. Front. Ecol. Environ. 2017, 15, 189–196. [Google Scholar] [CrossRef]
- Tryjanowski, P.; Morelli, F.; Mikula, P.; Krištín, A.; Indykiewicz, P.; Grzywaczewski, G.; Kronenberg, J.; Jerzak, L. Bird diversity in urban green space: A large-scale analysis of differences between parks and cemeteries in Central Europe. Urban For. Urban Green. 2017, 27, 264–271. [Google Scholar] [CrossRef]
- Marzluff, J.M. Island biogeography for an urbanizing world: How extinction and colonization may determine biological diversity in human-dominated landscapes. Urban Ecosyst. 2005, 8, 157–177. [Google Scholar] [CrossRef]
- Croci, S.; Butet, A.; Clergeau, P. Does Urbanization Filter Birds on the Basis of Their Biological Traits? Condor 2008, 110, 223–240. [Google Scholar] [CrossRef]
- Randler, C.; Murawiec, S.; Tryjanowski, P. Committed Bird-Watchers Gain Greater Psychological Restorative Benefits Compared to Those Less Committed Regardless of Expertise. Ecopsychology 2022, 14, 101–110. [Google Scholar] [CrossRef]
- Murawiec, S.; Tryjanowski, T. A psychiatrist watches birds during the COVID-19 pandemic: Observations, introspections, interpretations. Psychiatr. Psychol. Klin. 2020, 20, 94–97. [Google Scholar] [CrossRef]
- Klingbeil, B.T.; Willig, M.R. Bird biodiversity assessments in temperate forest: The value of point count versus acoustic monitoring protocols. PeerJ 2015, 3, e973. [Google Scholar] [CrossRef]
- Sugai, L.S.M.; Llusia, D. Bioacoustic time capsules: Using acoustic monitoring to document biodiversity. Ecol. Indic. 2019, 99, 149–152. [Google Scholar] [CrossRef]
- Xie, J.; Zhong, Y.; Zhang, J.; Liu, S.; Ding, C.; Triantafyllopoulos, A. A review of automatic recognition technology for bird vocalizations in the deep learning era. Ecol. Inform. 2023, 73, 101927. [Google Scholar] [CrossRef]
- Nemeth, E.; Brumm, H. Blackbirds sing higher-pitched songs in cities: Adaptation to habitat acoustics or side-effect of urbanization? Anim. Behav. 2009, 78, 637–641. [Google Scholar] [CrossRef]
- Villanueva-Rivera, L.J.; Pijanowski, B.C.; Doucette, J.; Pekin, B. A primer of acoustic analysis for landscape ecologists. Landsc. Ecol. 2011, 26, 1233–1246. [Google Scholar] [CrossRef]
- Pieretti, N.; Farina, A.; Morri, D. A new methodology to infer the singing activity of an avian community: The Acoustic Complexity Index (ACI). Ecol. Indic. 2011, 11, 868–873. [Google Scholar] [CrossRef]
- Kasten, E.P.; Gage, S.H.; Fox, J.; Joo, W. The remote environmental assessment laboratory’s acoustic library: An archive for studying soundscape ecology. Ecol. Inform. 2012, 12, 50–67. [Google Scholar] [CrossRef]
- Boelman, N.T.; Asner, G.P.; Hart, P.J.; Martin, R.E. Multi-Trophic Invasion Resistance in Hawaii: Bioacoustics, Field Surveys, and Airborne Remote Sensing. Ecol. Appl. 2007, 17, 2137–2144. [Google Scholar] [CrossRef]
- Sueur, J.; Pavoine, S.; Hamerlynck, O.; Duvail, S. Rapid Acoustic Survey for Biodiversity Appraisal. PLoS ONE 2009, 3, e4065. [Google Scholar] [CrossRef]
- Gasc, A.; Pavoine, S.; Lellouch, L.; Grandcolas, P.; Sueur, J. Acoustic indices for biodiversity assessments: Analyses of bias based on simulated bird assemblages and recommendations for field surveys. Biol. Conserv. 2015, 191, 306–312. [Google Scholar] [CrossRef]
- Depraetere, M.; Pavoine, S.; Jiguet, F.; Gasc, A.; Duvail, S.; Sueur, J. Monitoring animal diversity using acoustic indices: Implementation in a temperate woodland. Ecol. Indic. 2012, 13, 46–54. [Google Scholar] [CrossRef]
- Fairbrass, A.J.; Rennert, P.; Williams, C.; Titheridge, H.; Jones, K.E. Biases of acoustic indices measuring biodiversity in urban areas. Ecol. Indic. 2017, 83, 169–177. [Google Scholar] [CrossRef]
- Alvares-Sanches, T.; Osborne, P.E.; White, P.; Bahaj, A. Spatial Variation in Sound Frequency Components Across an Urban Area Derived from Mobile Surveys. Future Cities Environ. 2019, 5, 7. [Google Scholar] [CrossRef]
- Devos, P. Soundecology indicators applied to urban soundscapes. In Proceedings of the Internoise 2016 Conference, Hamburg, Germany, 21–24 August 2016; pp. 177–184. Available online: http://pub.dega-akustik.de/IN2016/data/articles/000498.pdf (accessed on 1 February 2023).
- Wang, J.; Li, C.; Lin, Y.; Weng, C.; Jiao, Y. Smart soundscape sensing: A low-cost and integrated sensing system for urban soundscape ecology research. Environ. Technol. Innov. 2023, 29, 102965. [Google Scholar] [CrossRef]
- Clergeau, P.; Savard, J.P.L.; Mennechez, G.; Falardeau, G. Bird Abundance and Diversity along an Urban-Rural Gradient: A Comparative Study between Two Cities on Different Continents. Condor 1998, 100, 413–425. [Google Scholar] [CrossRef]
- Thompson, P.S.; Greenwood, J.J.D.; Greenaway, K. Birds in European gardens in the winter and spring of 1988–89. Bird Study 1993, 40, 120–134. [Google Scholar] [CrossRef]
- Kroodsma, D.E.; Miller, E.H. (Eds.) Ecology and Evolution of Acoustic Communication in Birds; Cornell University Press: Ithaca, NY, USA, 1996. [Google Scholar]
- Villanueva-Rivera, L.J.; Pijanowski, B.C. R Package ‘Soundecology: Soundscape Ecology’ v1.3.1 (2015). 2015. Available online: http://cran.r-project.org/web/packages/soundecology/index.html (accessed on 1 February 2023).
- Sueur, J.; Aubin, T.; Simonis, C. Seewave, a Free Modular Tool for Sound Analysis and Synthesis. Bioacoustics 2008, 18, 213–226. [Google Scholar] [CrossRef]
- Møller, A.; Díaz, M.; Grim, T.; Dvorská, A.; Flensted-Jensen, E.; Ibáñez-Álamo, J.; Jokimäki, J.; Mänd, R.; Markó, G.; Szymanski, P.; et al. Effects of urbanization on bird phenology: A continental study of paired urban and rural populations. Clim. Res. 2015, 66, 185–199. [Google Scholar] [CrossRef]
- Gil, D.; Llusia, D. The Bird Dawn Chorus Revisited. In Coding Strategies in Vertebrate Acoustic Communication. Animal Signals and Communication; Springer: Cham, Switzerland, 2020; pp. 45–90. [Google Scholar] [CrossRef]
- Pearson, D.L. Selecting indicator taxa for the quantitative assessment of biodiversity. Philos. Trans. R. Soc. London. Ser. B Biol. Sci. 1994, 345, 75–79. [Google Scholar] [CrossRef]
- Piano, E.; Souffreau, C.; Merckx, T.; Baardsen, L.F.; Backeljau, T.; Bonte, D.; Brans, K.I.; Cours, M.; Dahirel, M.; Debortoli, N.; et al. Urbanization drives cross-taxon declines in abundance and diversity at multiple spatial scales. Glob. Chang. Biol. 2020, 26, 1196–1211. [Google Scholar] [CrossRef]
- Larsen, F.W.; Bladt, J.; Balmford, A.; Rahbek, C. Birds as biodiversity surrogates: Will supplementing birds with other taxa improve effectiveness? J. Appl. Ecol. 2012, 49, 349–356. [Google Scholar] [CrossRef]
Figure 1.
The surroundings of the study area (aerial view from Google) with detail of the measurement setup. The area pictured in the aerial view has a size of about 350 m by 175 m.
Figure 1.
The surroundings of the study area (aerial view from Google) with detail of the measurement setup. The area pictured in the aerial view has a size of about 350 m by 175 m.

Figure 2.
Daily pattern of the different soundecological indicators (ACI, NDSI, BIO, ADI, AEI, and ENTROPY) as recorded during the late spring. The raw (without time averaging) one-minute values are reported on a minute scale (x-axis) of a 24-h daily cycle starting at midnight. The sunrise and sunset times are indicated as red vertical lines.

Figure 3.
Heatmap of the different soundecological indicators, revealing their daily pattern throughout an annual cycle; from top to bottom: ACI, NDSI, BIO, ADI, AEI, and ENTROPY. The 15-min averaged values of the indicators are shown for the different measurement days (vertical date label) on a minute scale (x-axis) of a 24-h daily cycle starting at midnight.

Figure 4.
Bird Dawn Chorus Strength (BDCS) as calculated from the different indicators for the different study days (x-axis), with different time window lengths for the dawn (left column) and sunrise (right column) transitions. The same colors are used for the time window length (minutes) as for all plots (see the legend for the AEI Sunrise results).

Disclaimer/Publisher’s Note: The statements, opinions and data contained in all publications are solely those of the individual author(s) and contributor(s) and not of MDPI and/or the editor(s). MDPI and/or the editor(s) disclaim responsibility for any injury to people or property resulting from any ideas, methods, instructions or products referred to in the content. |
© 2023 by the author. Licensee MDPI, Basel, Switzerland. This article is an open access article distributed under the terms and conditions of the Creative Commons Attribution (CC BY) license (https://creativecommons.org/licenses/by/4.0/).
Share and Cite
MDPI and ACS Style
Devos, P. The Bird Dawn Chorus Strength of an Urban Soundscape and Its Potential to Assess Urban Green Spaces. Sustainability 2023, 15, 7002. https://doi.org/10.3390/su15087002
AMA Style
Devos P. The Bird Dawn Chorus Strength of an Urban Soundscape and Its Potential to Assess Urban Green Spaces. Sustainability. 2023; 15(8):7002. https://doi.org/10.3390/su15087002
Chicago/Turabian StyleDevos, Paul. 2023. "The Bird Dawn Chorus Strength of an Urban Soundscape and Its Potential to Assess Urban Green Spaces" Sustainability 15, no. 8: 7002. https://doi.org/10.3390/su15087002
Note that from the first issue of 2016, this journal uses article numbers instead of page numbers. See further details here.