Article

Evidence of Multi-Source Data Fusion on the Relationship between the Specific Urban Built Environment and Urban Vitality in Shenzhen

1
Innovation Institute for Sustainable Maritime Architecture Research and Technology, Qingdao University of Technology, Qingdao 266033, China
2
Faculty of Environmental Engineering, The University of Kitakyushu, Kitakyushu 808-0135, Japan
3
Graduate School of Architecture, Planning, Columbia University, New York, NY 10027, USA
*
Author to whom correspondence should be addressed.
Sustainability 2023, 15(8), 6869; https://doi.org/10.3390/su15086869
Submission received: 25 February 2023 / Revised: 14 April 2023 / Accepted: 18 April 2023 / Published: 19 April 2023
(This article belongs to the Collection Urban Planning and Built Environment)

Abstract

:
Urban vitality is the key element of sustainable urban development. This paper aims to explore the relationship between urban vitality and the existing built-up environment of the city of Shenzhen. The regression models with multi-source geographic datasets from 2021–2022 were applied to assess Shenzhen in three dimensions: economic, social, and cultural. The results show that Shenzhen’s vitality originates from multiple popular centers. Dense road networks, abundant transportation, and commercial, recreational, entertainment, sports, and leisure facilities are positive indicators of vitality, while urban villages and residential areas have the opposite effect. The model can explain 59% of vitality changes. This paper proposes a quantifiable and replicable adaptation framework for urban villages that combines urban form with data vitality assessment in order to deepen our understanding of urban villages and offer theoretical justifications for long-term urban regeneration. The findings also suggest that spatial differences should be taken into account when formulating urban regeneration responses to make them more targeted. Overall, this paper provides valuable insights for urban planners, policymaker and researchers interested in promoting sustainable urban development through vitality-based urban regeneration.

1. Introduction

With the period of rapid urban growth that began with the reform and opening-up in the 1970s approaching a gradual end, China’s urban development has shifted from incremental development to stock development with urban renewal as a major form [1]. China’s urban construction has experienced a rapid development phase during its period of economic reform. However, the lack of standardization in the rapid urbanization process represented by urban sprawl alone makes it difficult to support sustainable urban development. In addition, China’s governance has shifted from an economy-centric to a people-centric approach [2]. New social issues have arisen from high-density urban development and highly concentrated populations. The strategies to tackle them have become the focal point of discussion among today’s urban managers, urban planning professionals, and urban research scholars [3]. In this paper, we will discuss urban vitality, which is one of the key objectives of sustainable development and urban renewal design.
Urban vitality is receiving increasing attention in the context of the gradual abandonment of rough urbanization and the increasing demand for high-quality of urban space [4]. Prior studies on urban vitality have mainly mostly used qualitative analysis and concentrated on the economy and competitiveness of cities. As a result, they suffer from internal differences between processing levels, big data information, and selected indicators; the validity of the analysis is also deficient. The evaluation results are inevitably constrained or even biased. Moreover, most studies have focused on relatively mature and developed urban cores with high building and population densities, such as central business districts, subway stations, and shopping malls [5,6]. These studies related to urban form and vitality have emerged to reflect the relationship between the physical environment and social life at a macro level. For example, Jin’s study of the vitality of residential projects in old and new urban areas in China found that new urban projects contribute negatively to higher levels of vitality due to their much lower density of junctions, POIs, and LBS [7], while Chen suggests that the classification of road networks has a positive effect on the prediction of vitality to some extent [8]. The space for small food facilities greatly influences urban vitality; POI can visualize the function, vitality, and development of individual urban areas [9]. However, the vitality in urban village areas, which are also extremely dense and have different spatial expressions, has been less discussed.
Rapid urbanization without proper urban planning has directly led to the emergence of “urban villages.” The unique morphological characteristics of urban villages are often referred to as fragmented, densely populated, poorly facilitated, and functionally homogeneous in spatial forms; these areas are far from being considered as vibrant. Urban villages, with its low rents and high inclusiveness, have accommodated many floating populations that continue to enter the city to work and reside as transitional spaces [10]. The high-density informal living space is accompanied by many problems in environment, safety, and social equity [11,12]. The unmanaged growth and untreated problems and challenges have resulted in chaotic spatial structures and loss of spatial identity [13].
In the past few decades, urban villages have been the main target of urban renewal in Shenzhen. The renewal methods have changed from large-scale demolition and construction to micro-renovation and micro-renewal; thus, the vitality and potential of urban villages have slowly emerged. The social evaluation on urban villages has gradually become objective rather than a one-sided negative event [14]. Before 2009, urban villages’ primary regeneration strategy consisted of extensive deconstruction and construction [15]. Most redevelopment projects have expelled floating populations and adopted the high-rise tower type with few native characteristics [16], gradually losing the unique urban landscape, historical and cultural connotations, and vitality of the previous urban villages. Few researchers have paid attention to the urban form indicators included in urban villages [17,18], neglecting the role of urban villages as a product of informal urbanization in the built environment. [19]. The street space of villages in the city carries a highly complex commercial layout pattern, accommodates a variety of daily life behaviors, and reflects the unique spatial vitality [10,20]. Urban villages provide affordable housing for migrants, and include affordable public services and an urban environment that provides the employment opportunities for migrants [21].
Urban form is a sophisticated economic, cultural, and social phenomenon. It is the overall imagery of the city that is perceived and reflected by people in various ways. Urban morphology divides the urban built environment into interrelated and interdependent components such as buildings, streets and blocks [22]. In the book “Creating a vibrant urban center,” Pamir proposes that location, size, planning, and design are the practical factors that make public places prosperous and vibrant [23]. Therefore, it is important to investigate how social and physical environmental factors, such as building size, land use, and road network density, affect urban vitality [1].
Big data has recently gained popularity as a research tool. Research techniques based on big data evaluate urban vitality from the perspectives of built environment and population density and have gained widespread acceptance [8,24]. It also makes it possible to develop data-based urban development policy support systems [25]. From the perspective of research methods, the development of massive geospatial data makes it possible to more accurately describe the urban form of urban villages. Regarding the approach used to determine the connection between urban vitality and form, the ordinary least squares (OLS) regression model is the most widely used due to its simplicity and interpretability. However, it ignores the spatial dependence of regional data. More scientific models and methods are needed to describe this relationship.
In order to comprehend the relationship between built environment components and vitality at the block level, this study addresses the research opportunities and flaws previously described. The main contributions of this paper are as follows: (1) from an integrated perspective of urban morphology, the multi-level characteristics of the built environment are comprehensively delineated and three level metrics are designed, including formal elements, functional elements, and atypical urban spatial elements; (2) three dimensions of economic, social, and cultural data are used to quantify urban vitality, minimizing the bias caused by a single indicator; (3) four regression models are used to explore the relationship between built environment and vitality in a step-by-step analysis; and (4) it is proposed that highly developed urban centers and underdeveloped urban peripheries should have different strategies for enhancing vitality in urban regeneration.
The rest of the paper is organized as follows: Section 2 reviews relevant research on urban form and urban vitality measurement: Section 3 describes the study area, data sources, and data management process; Section 4 describes the research methodology; Section 5 analyzes the results; Section 6 discusses the results and describes limitations and future research; and the final section summarizes the conclusions.

2. Literature Review

2.1. Urban Vitality

The historical context of urban vitality dates back to the early 20th century when cities began to experience rapid growth and development. Vitality is expressed in urban lifestyles, such as bustling streets and a variety of lively activities [26]. Jacobs first defined urban vitality as the diversity of the living environment, which includes interactions between people and the environment [27]. Montgomery emphasized that it was possible to plan and design vibrant cities through the principles of urban form, activity, street life, and urban culture. He argued that mixed use, accessibility, human scale, block density, adaptability, and permeability will facilitate the interaction between architecture and street activity [28]. As cities grow, social problems, such as overcrowding and environmental damage, appear. In the 1980s and 1990s, urban regeneration emerged in the context of urban revitalization and the focus shifted to improving the livability and attractiveness of urban areas [29]. The social dimension of sustainable urban development manifests itself in cities with highly developed human interaction, information transfer, and cultural prosperity, which are characterized by stability, equity, and dynamism [30]. Although urban areas have faced numerous challenges over the years, the creation of habitable and sustainable cities has benefited from the idea of urban vitality.
Human activity is essential to urban planning and governance [31]. Urban vitality is the foundation of urban evolution and the driving force of urban development [32]. Urban vitality is receiving increasing attention from professionals [6]. The contribution of urban form to urban vitality has become the most common consensus among urban planners [33]. The vitality of the city is the implicit and diverse soft force of the society, which is a multidimensional complex system. Urban vitality is influenced by a variety of physical and social characteristics. The content of vitality description can be roughly divided into two aspects. One aspect is the vitality behavior itself, such as crowd performance, crowd size, density, activity type, and activity duration. The second aspect is providing a space for activities, which is directly tied to the city’s built environment. Space itself is inactive; however, different spaces will guide and stimulate dynamic behaviors, reflecting the spatiotemporal distribution of dynamic behaviors.
In general, scholars concentrate on the microscopic manifestations of urban vitality, particularly the geographic dispersion of individuals and their financial, cultural, and social activities. Compared with traditional methods, big data is good at recording and analyzing human activity trajectories and communication methods and then exploring the characteristics and laws behind them. The core of urban vitality is tied to the ongoing interaction of urban society, which is intimately related to human activities and movement [34]. Population density can reflect the vitality of a region and is usually measured by data from location-based services (LBS), including cell phone signaling [1], GPS, and Baidu Heat Index, to directly represent the vitality of the city [24,35]. Commentary websites and apps are interactive platforms that integrate merchant information and consumers’ feedback. This information covers areas such as food services, shopping, entertainment and recreation, and living services. It information can well reflect economic vitality [36]. In addition, data in social media can also reflect the distribution of vitality (Sina Weibo check-in data, Twitter, etc.) [35,37]. Moreover, data from bus credit card, taxi, shared bike, and location-based food and beverage reviews are widely used to assess urban vitality [37].
In order to obtain a comprehensive description of vitality, some scholars have combined relevant indicators with entropy methods to provide a basis for a comprehensive multi-indicator evaluation [38]. For example, Feng et al. used entropy methods to obtain an assessment of urban vitality by analyzing data from 35 cities [39]. Entropy weight method is an objective method that considers the distribution of values. According to the definition of information entropy, entropy value can be used to determine the degree of dispersion of an indicator. The dispersion of the indication increases with decreasing entropy value, while the weight of the indicator’s influence on the total evaluation increases.

2.2. Urban Vitality and Urban Built Environment

At its core, urban vitality is constantly related to social interactions in cities [34], while the built environment is the place where social interactions take place. Based on the measurement of urban vitality, the researcher further quantitatively explores the impact of characteristics of the built environment, such as location, functional mix, and density on urban vitality [1,9,40,41]. Data on points of interest (POI) describe the built environment that supports human activity and is often used to measure the density and diversity of facilities [1]. Commonly employed as urban vitality, the density of points of interest is often complemented by other measures [7]. Some studies have argued that urban vitality can be measured by food and beverage facilities [4,6]. They argue that the survival of food and beverage businesses relies on a large and active footfall and places where food and beverage businesses thrive tend to be more dynamic [42]. Urban vitality is linked to the characteristics of a cafe, such as its social connections and economic transactions [34]. These characteristics make it an “indicator business” for the area [43].
Scholars in urban sociology believe that cities play a crucial part in the growth of society and the economy. They see the city as a place where culture, society, and the economy may reflect on their own existence. Economic, social, and cultural components make up urban vitality. These traits demonstrate the city’s capacity to give its citizens enough spaces and amenities [6,44]. According to academics, every element of urban form is interrelated, interactive, and inseparable [4,37,45,46]; the combined impact of form elements on vitality may be greater than their individual components [1]. Some scholars have also attempted to develop a composite indicator that serves as a stand-in for urban vitality, for instance by establishing a correlation between neighborhood characteristics, urban form and function, landscape, location, and street arrangement [47]. Other scholars have made an effort to evaluate urban vitality from a broader perspective, showing how it is connected to the economic, social, and physical environment [48]. However, most scholars still focus on the micro expressions of urban vitality; while existing research is strengthening for one aspect of economic, social, and cultural vitality of cities, comprehensive research on the three dimensions of urban vitality is still relatively rare. By defining urban vitality in our study as the integration of the intensity of various activities performed by residents in urban space, we aim to address the limitations of previous research. Three dimensions of vitality—economic, social, and cultural—were included to examine the efficacy of different urban vitality dimensions.
Linear regression models are one of the most well-known modeling techniques. Linear regression is usually one of the preferred techniques when one is learning predictive models. Ordinary least squares regression models (OLS) are often used to deal with the relationship between dynamism and urban morphology due to their simplicity and interpretability [8,38]. However, they ignore the spatial influence of the variables; thus, the spatial dynamics of the interaction between spatial variables cannot be explained [49]. The Barcelona study pointed out that there are differences in the degree of influence of urban form on vitality in different geographical spaces [50]. Several studies have made some efforts to compensate for the absence of minimum linear regression models for spatial relationships. For example, geographically weighted regression (GWR) alleviates the problem of spatial dependence by establishing local regression equations at each point in the spatial scale to explore the spatial variation in the study object at a certain scale and the associated drivers [51]. However, previous studies only focused on specific factors of the built environment, lacking an integrated perspective on morphological and functional synergy, which may lead to incomplete conclusions. Consequently, this paper tries to explore the connection between built environment and vitality from an integrated perspective.

3. Materials

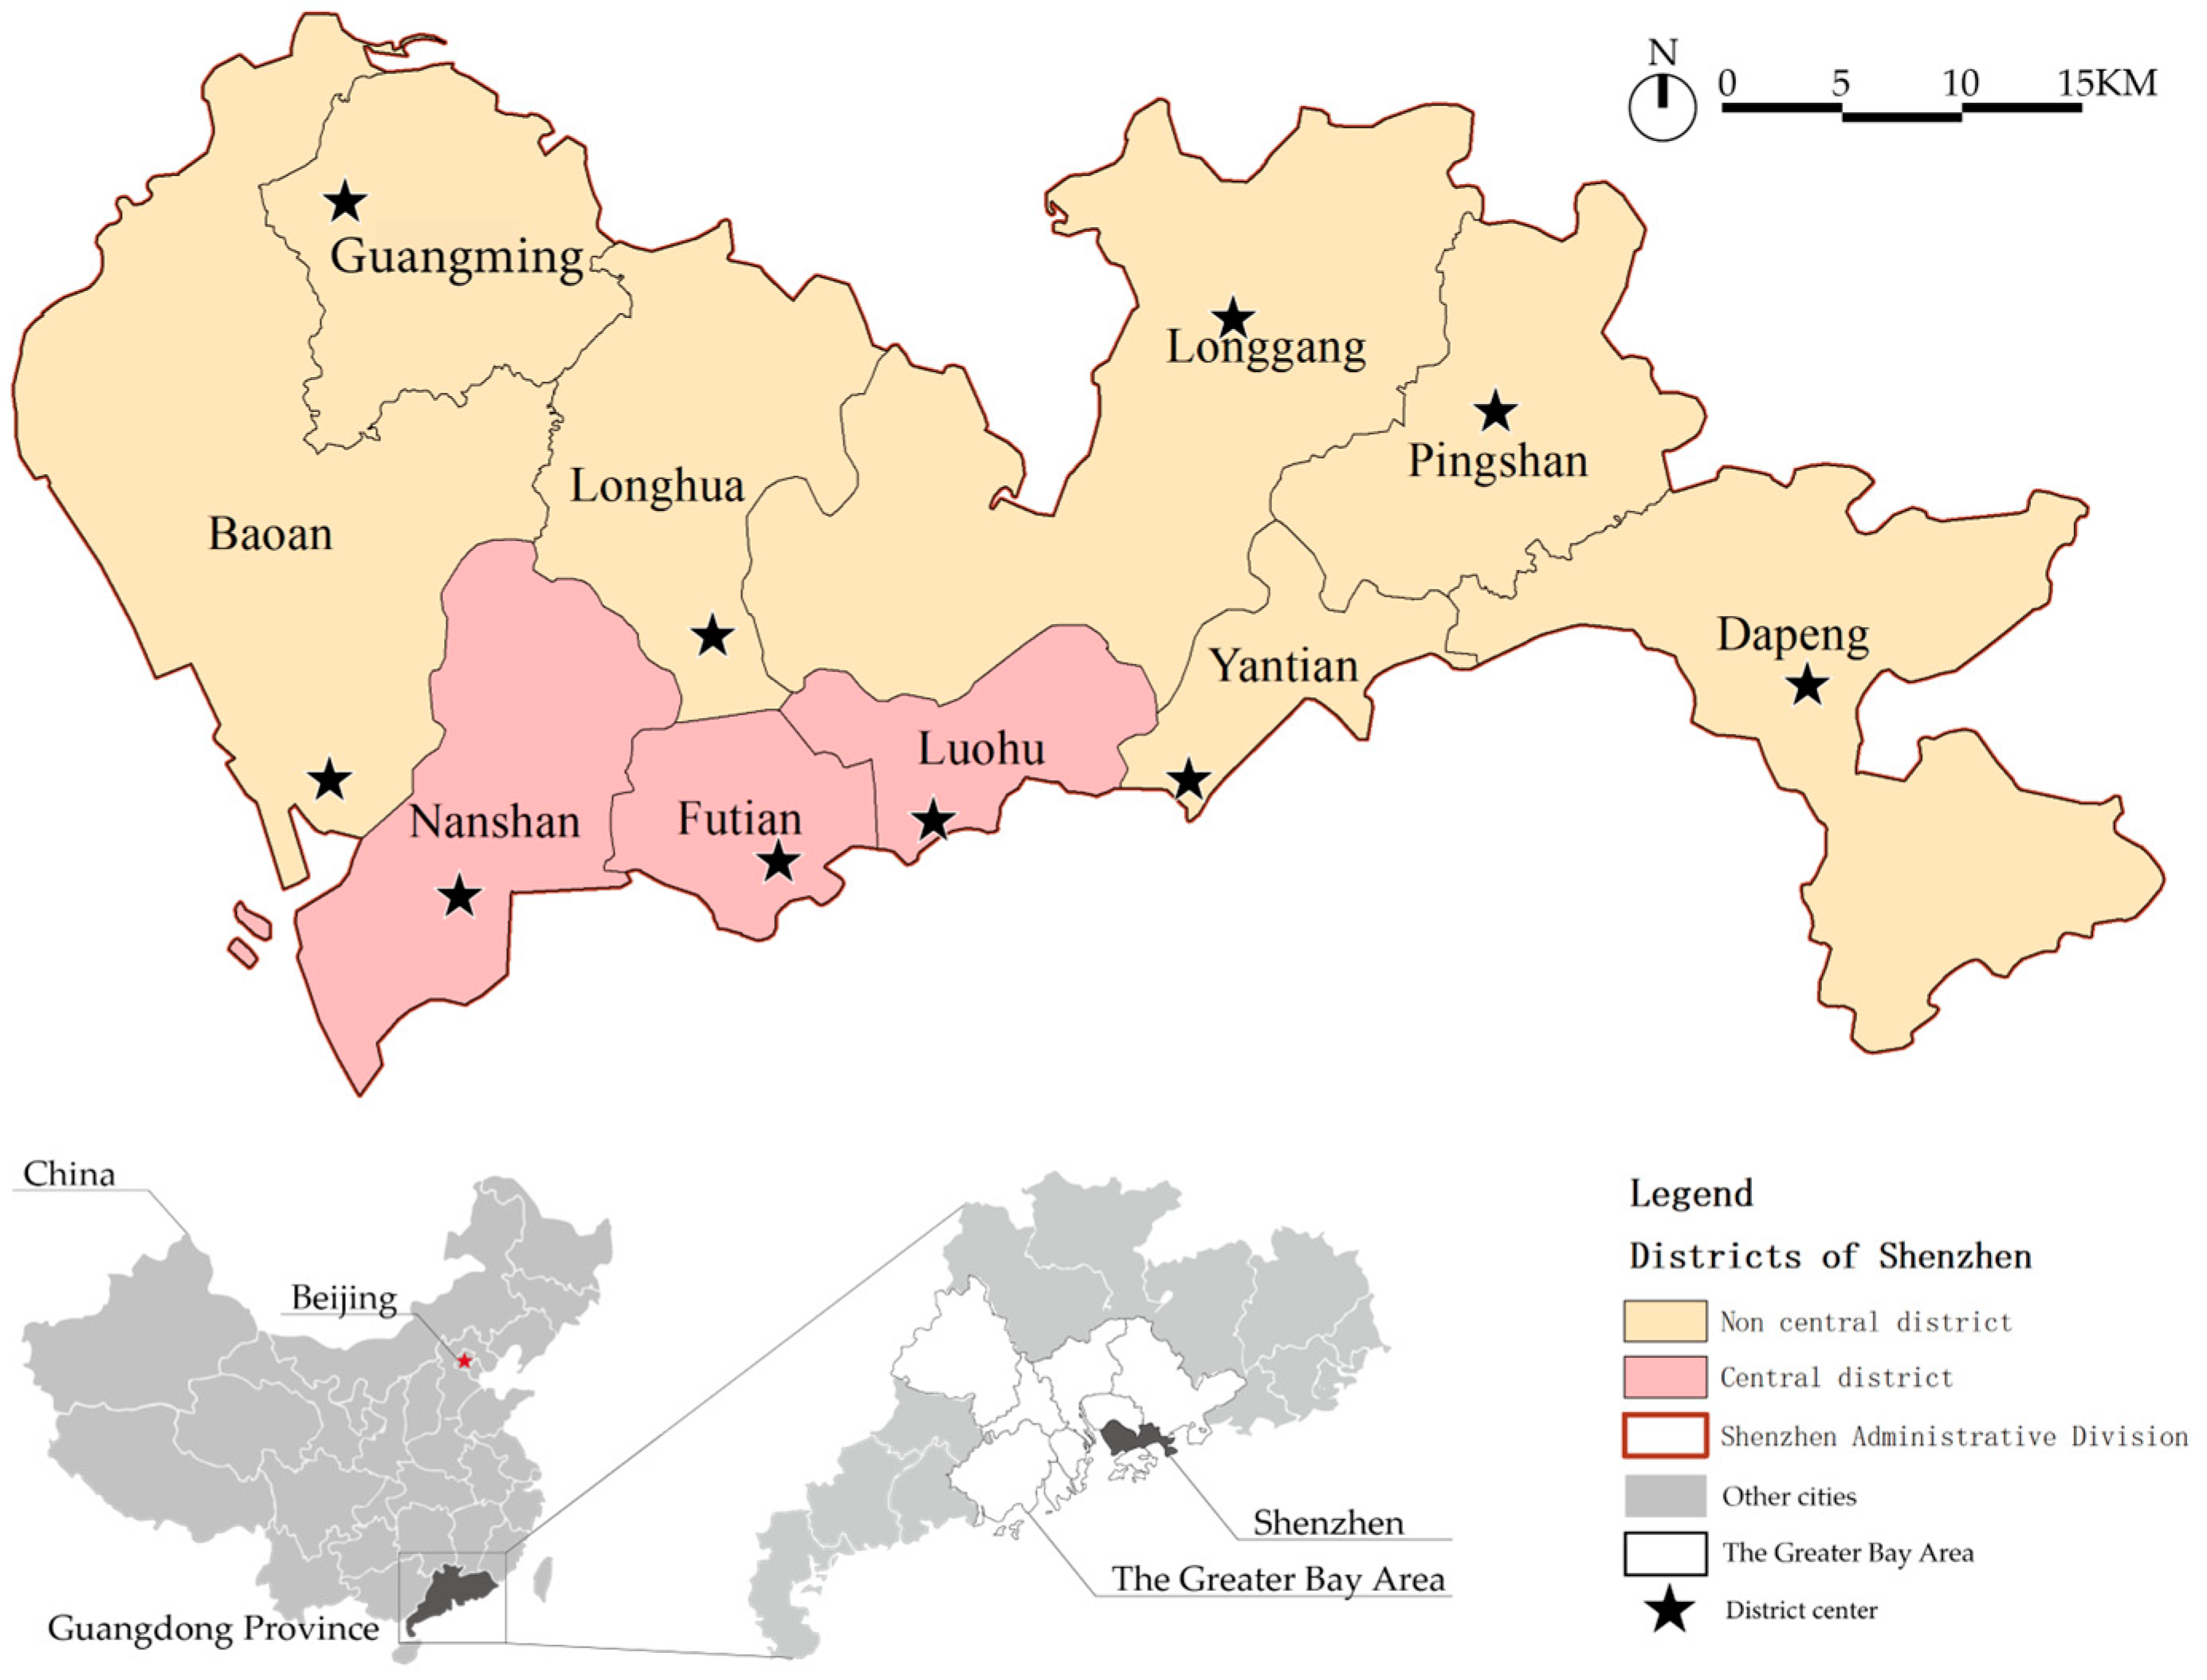
3.1. Research Scope and Spatial-Temporal Analysis Unit

Shenzhen, the only mega-city in China with a 100% urbanization rate, was the main target of this study. Shenzhen has been regarded as China’s fastest-growing cities with a high level of urban vitality; it is an international metropolis that forms a special economic zone and a national economic center [51]. The city contains 10 administrative districts, including three central districts (Nanshan, Futian, and Luohu) and seven periphery districts, with an overall land area of 1997.47 km2 and an urban area of 927.96 km2 (Figure 1). The Seventh National Census figures indicate that by 1 November 2020, there were 17.56 million people residing in Shenzhen.
Existing administrative organization units, including districts and traffic analysis zones (TAZ), were too large a boundary area to accurately reflect the qualities of vitality. This work sought to investigate the effects of the village on the vitality of the city collaborative urban built environment using the prior urban vitality analysis method as the research object [24]. The typical urban villages in the central urban areas, such as Nantou Ancient City, Shuiwei Village, and Gangxia Village, cover an area of approximately 500 m × 500 m. Therefore, a 500 m × 500 m grid was considered the best basic spatial units to study the morphological elements of the urban built environment and urban vitality [41]. Accordingly, in this study Shenzhen was divided into 8581 units.

3.2. Data Sources

There are seven main aspects of data used in this study: POI data, urban form data, population data, comment data, shared bicycle data, and urban village data (Table 1). It is worth noting that these data are also applied to the 500 m × 500 m basic spatial units as mentioned above.
POI data and urban village data were acquired from Amap at https://lbs.amap.com/ (accessed on 26 January 2022). POI data includes 23 broad categories, 267 medium categories, and 869 sub-categories, with wide coverage, large numbers, ease of access, and high accuracy. We also attempted to research human perception and behavior by integrating these qualities’ spatial distribution with other category attributes [9,52]; Data related to urban form were acquired from the open-access voluntary GIS platform OpenStreetMap at https://www.openstreetmap.org (accessed on 15 February 2022). These data included road networks, transportation facilities, building vector data, etc.; The Commentary data were obtained from Dianping at https://www.dianping.com/ (accessed on 21 February 2022), a Chinese counterpart of Yelp, which records data on restaurants and food, shopping, leisure and entertainment, lifestyle services, and events. Acknowledged as a consumer guide to Chinese cities, Dianping data proved to be very useful in understanding China’s urban geography [53]; The Shenzhen Data Open Platform at https://opendata.sz.gov.cn (accessed on 15 February 2022) provided bicycle sharing data including details of the start and end locations and use of time for a shared bicycle for each use. As a location-based service (LBS) data source, the bicycle sharing data reflected specific aspects of the city’s spatio-temporal dynamics [1,54].

3.3. Measurements

The measure of urban vitality, urban form, and their interactions made up the three components of the analytical framework for this research. We proposed a quantitative study strategy to comprehend the connection between urban morphology elements and street-level urban village vitality. Firstly, we measured urban vitality through open-source geospatial data and determine the weights of factors affecting vitality through the entropy value method to determine the final comprehensive vitality value. Secondly, we mined the built environment of the street where urban villages are located to define and measure urban morphological elements. Finally, we used the regression method to construct an econometric model to quantitatively analyze the impact on the urban built environment of specific attributes where urban villages are located on urban vitality; we also analyzed the differences between different elements affecting vitality from multiple perspectives in order to propose urban renewal spatial optimization strategies for stimulating urban vitality.
In this paper, Shenzhen was gridded using tool for establishing fishing nets in ArcGIS. The tool for establishing fishing nets in ArcGIS was used to create a grid with 500 m × 500 m as a spatial unit and the administrative boundary of Shenzhen as the scope of establishing fishing nets. The point data was dropped into the grid through spatial connection, while the connection index was the unique geo-ID of each grid.

3.3.1. Vitality Measurements

For the measurement of urban vitality, three main aspects of city vibrancy have been widely assessed through previous literature and case studies of vibrancy prediction: economic vibrancy measured by Dianping data and enterprise data; social vibrancy measured by population density data, Weibo check-in data, and bike-sharing data; and cultural vibrancy measured by point-of-interest (POI) density of cultural facilities.
Urban economic vitality was used to describe a city’s capacity and potential for economic growth. China’s cities are currently expanding quickly and their economic dynamism is mainly expressed in their ability to bring in capital and attract highly qualified labor. Dianping is China’s top lifestyle information and trader platform that can provide referential data to measure this economic growth [55]. It is an interactive platform for cyber users with information on merchants, consumer offers, and post-consumer reviews [36]. Relevant studies also confirmed that the increase in creativity, such as the number of patents and enterprises, has a greater driving effect on the economic growth of cities [34]. Therefore, drawing on existing research this paper measures the economic vitality by using the data for public reviews and companies.
Urban social dynamism is linked to human activity and mobility, while the core of urban dynamism is related to constant urban social interaction [34]. Increasing population brings vitality to cities; population density can be the most intuitive reflection of urban vitality. Urban spatial vitality is now mostly determined by “spatial social interaction,” which results from people’s social demands [56]. In addition, bicycle sharing has been widely used in past studies such as urban spatial linkages because of its wide coverage, all-weather availability, and the precise spatial–temporal characteristics of the data, which can show more objective information about residents’ travel. This study was based on bike-sharing arrival location data for a weekend in Shenzhen in 2021 and measures travel vitality through the weekly average density of bike-sharing arrivals per hour in the study unit. People mainly traveled to commute on working days, whereas most of their activities were active on weekends; thus, the weekend data was chosen to reflect active social dynamics. Based on this, population density data and bike-sharing data were chosen to measure social vibrancy in this paper.
Cultural vitality is essential to urban vitality. Employment, income generation, innovation, and regional competitiveness are all influenced by culture [57]. Cultural vibrancy includes two interrelated components: facilities and people flow [58]. Data on the people flow of venues is difficult to obtain; thus, this paper referred to existing studies and used the POI density of cultural facilities as a measure, where cultural venues and facilities are attractive to the crowd and become an extension of the concept of cultural vitality [58]. The region’s cultural facilities include theaters, music halls, exhibition halls, libraries, planetariums, art galleries, museums, planetariums, and conference centers. Table 2 describes these indicators in detail.
To determine the total vitality value (V value) of the city, we employed the entropy approach. The entropy approach was used to explain the level of indicator dispersion. The impact of the indication on the overall evaluation increases with the degree of dispersion [59]. This method determined the indicator weights of subsystems and constituent elements and, in the case of the integrated vitality indicator, entropy was derived from the data and effectively avoided the shortcomings of the subjective weighting method. In previous study, 22 indicators were subjected to entropy weighting by Liu et al. to calculate a composite vitality assessment value [39]. For this work, the social, economic, and cultural vitality values were standardized and calculated in the following steps using the entropy method:
Firstly, the original data were processed and collected to form the initial matrix of the evaluation system. We assumed that the urban vitality of m spatial unit grids needed to be evaluated; the evaluation system had n indicators. The matrix is as in Formula (1):
X = x 11 x 1 n . x 1 m x mn   x = x ij 1 i m , 1 j n
We then performed data translation using Formula (2). To avoid the nonsense of logarithms when finding the entropy value, the data were panned.
x ij = x ij + 0.01
Next, we used Formula (3) to calculate the proportion yij of index j in the spatial unit i.
y ij = x ij i = 1 m   x ij 0 y ij 1
Formulas (4) and (5) were used to determine the index information entropy value ej, K value and information utility value dj.
e j = K i = 1 m   y ij ln y ij , K = 1 ln m
d j = 1 e j
The weight wj was calculated using Formula (6).
w j = d j i = 1 m   d i
Finally, we calculated the comprehensive vitality value by using the weighted summation Formula (7).
U = i = 1 n   y i j w j

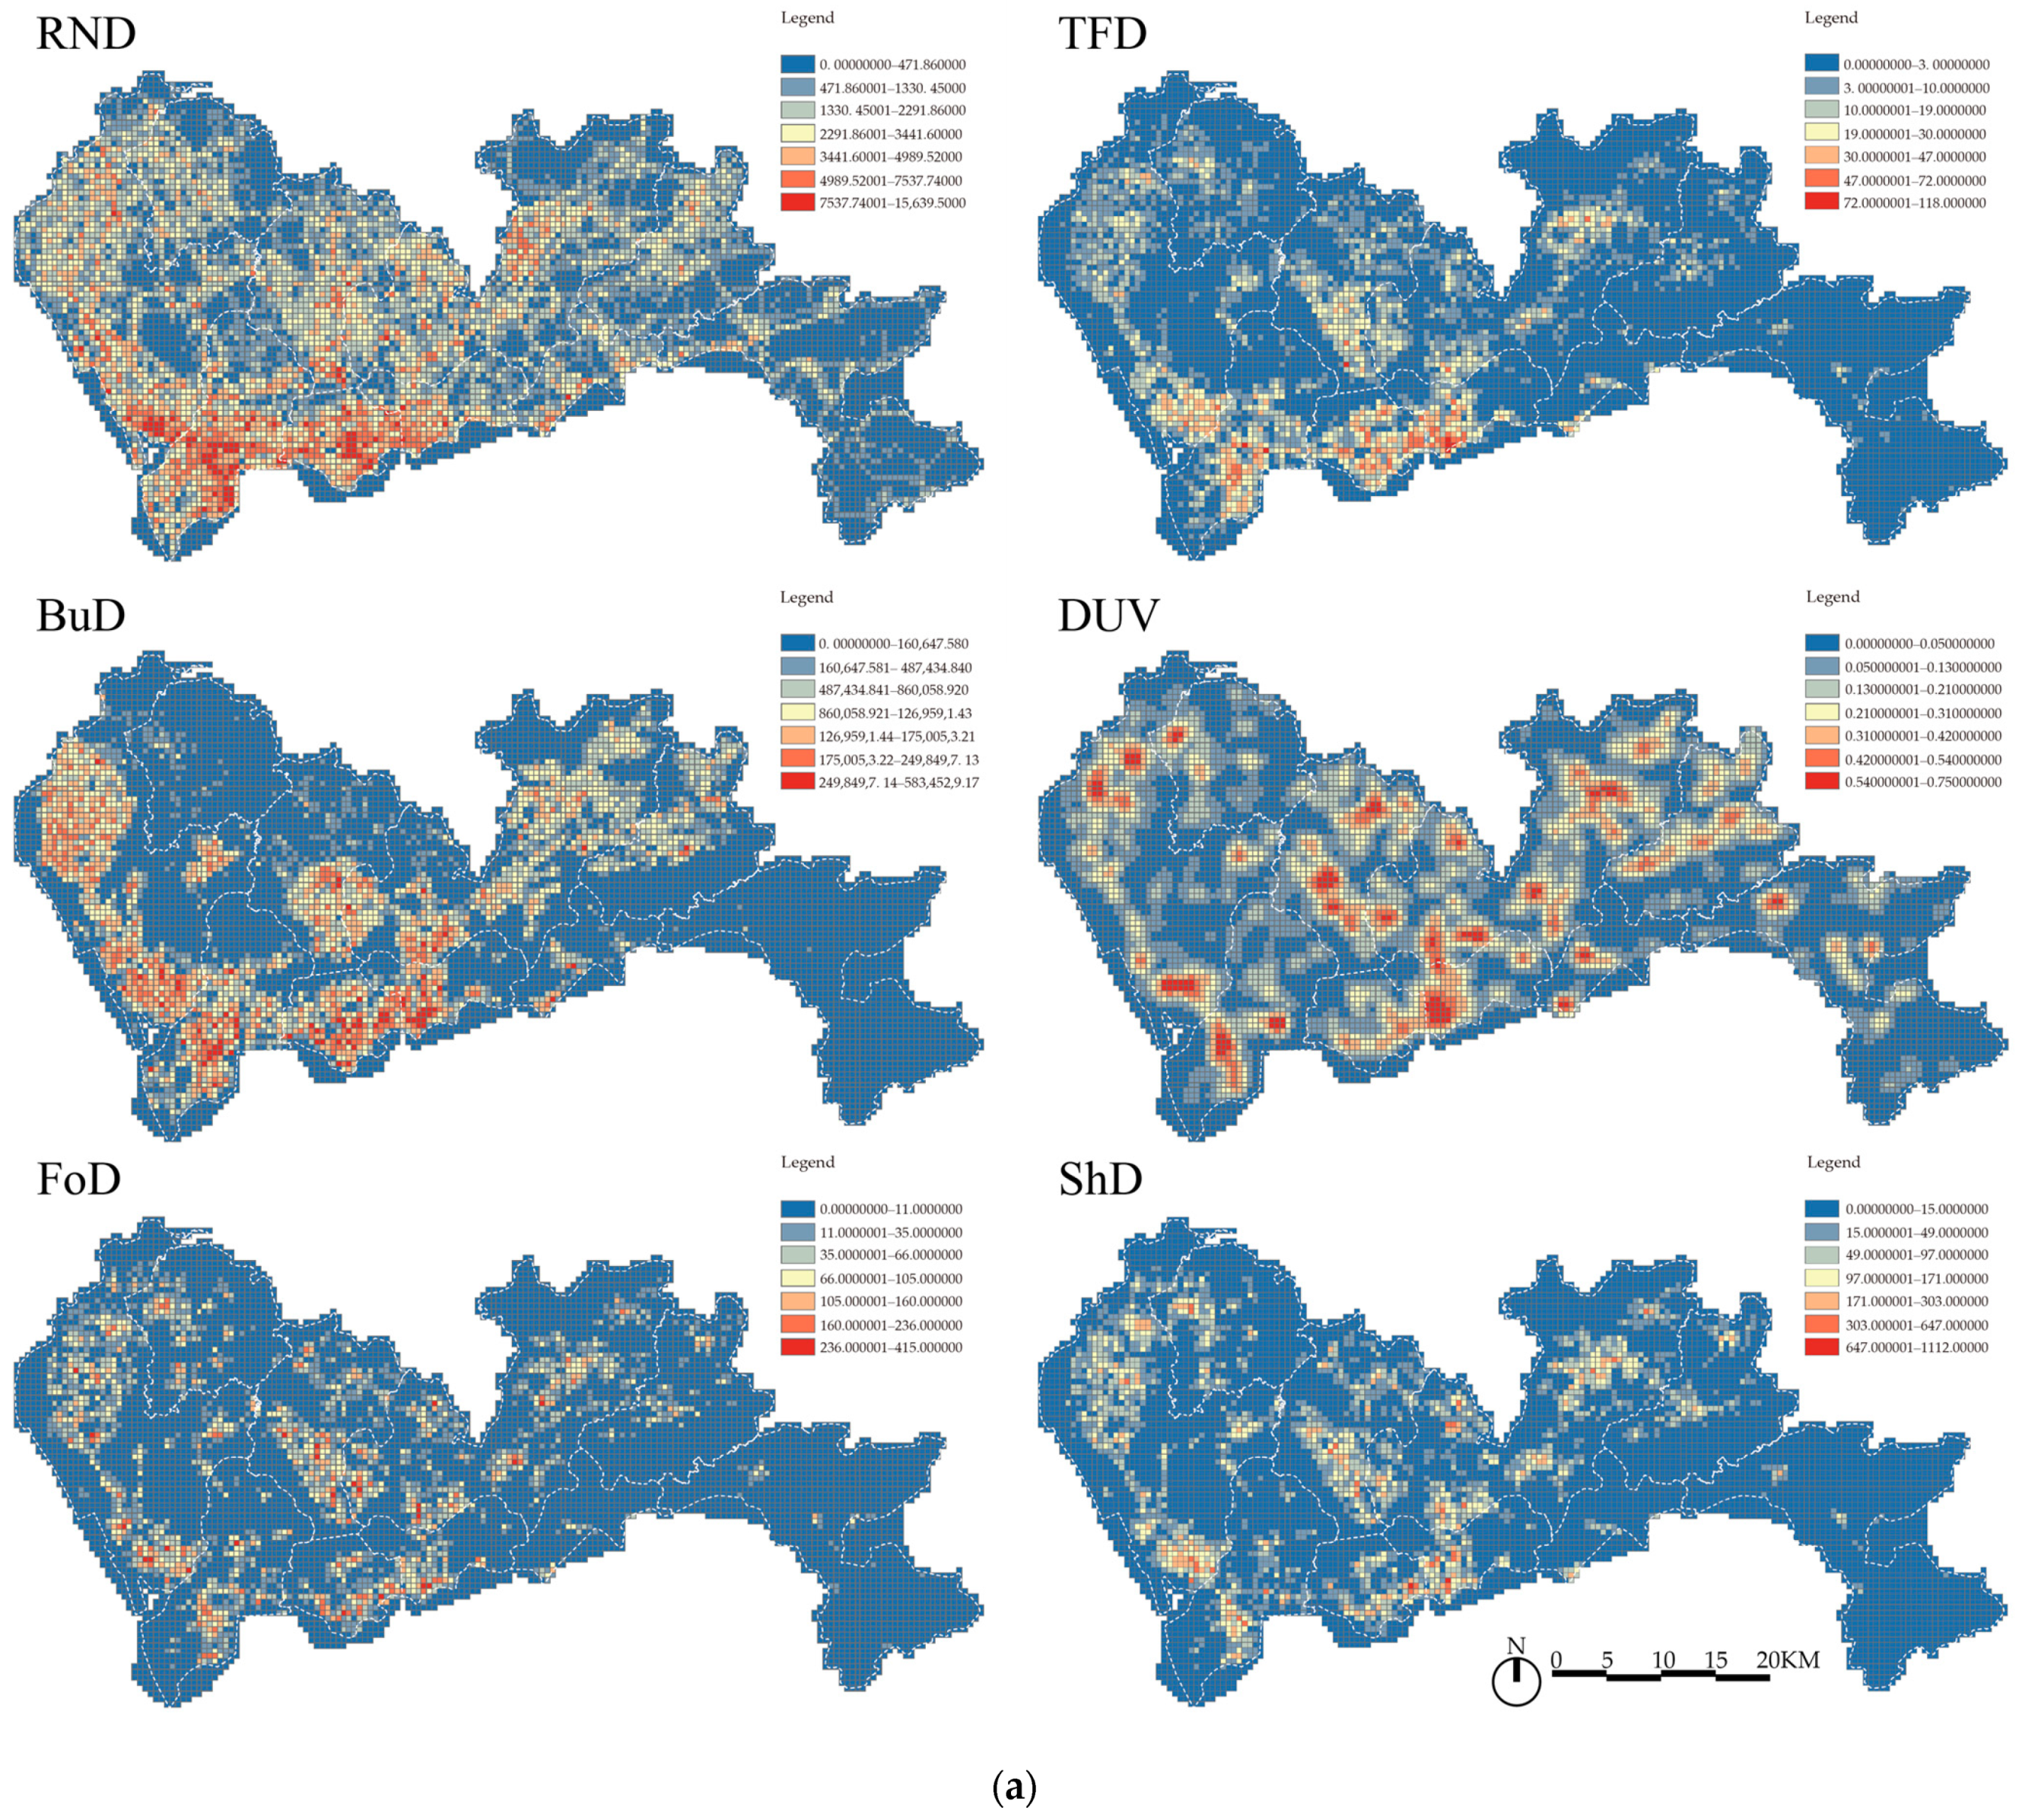
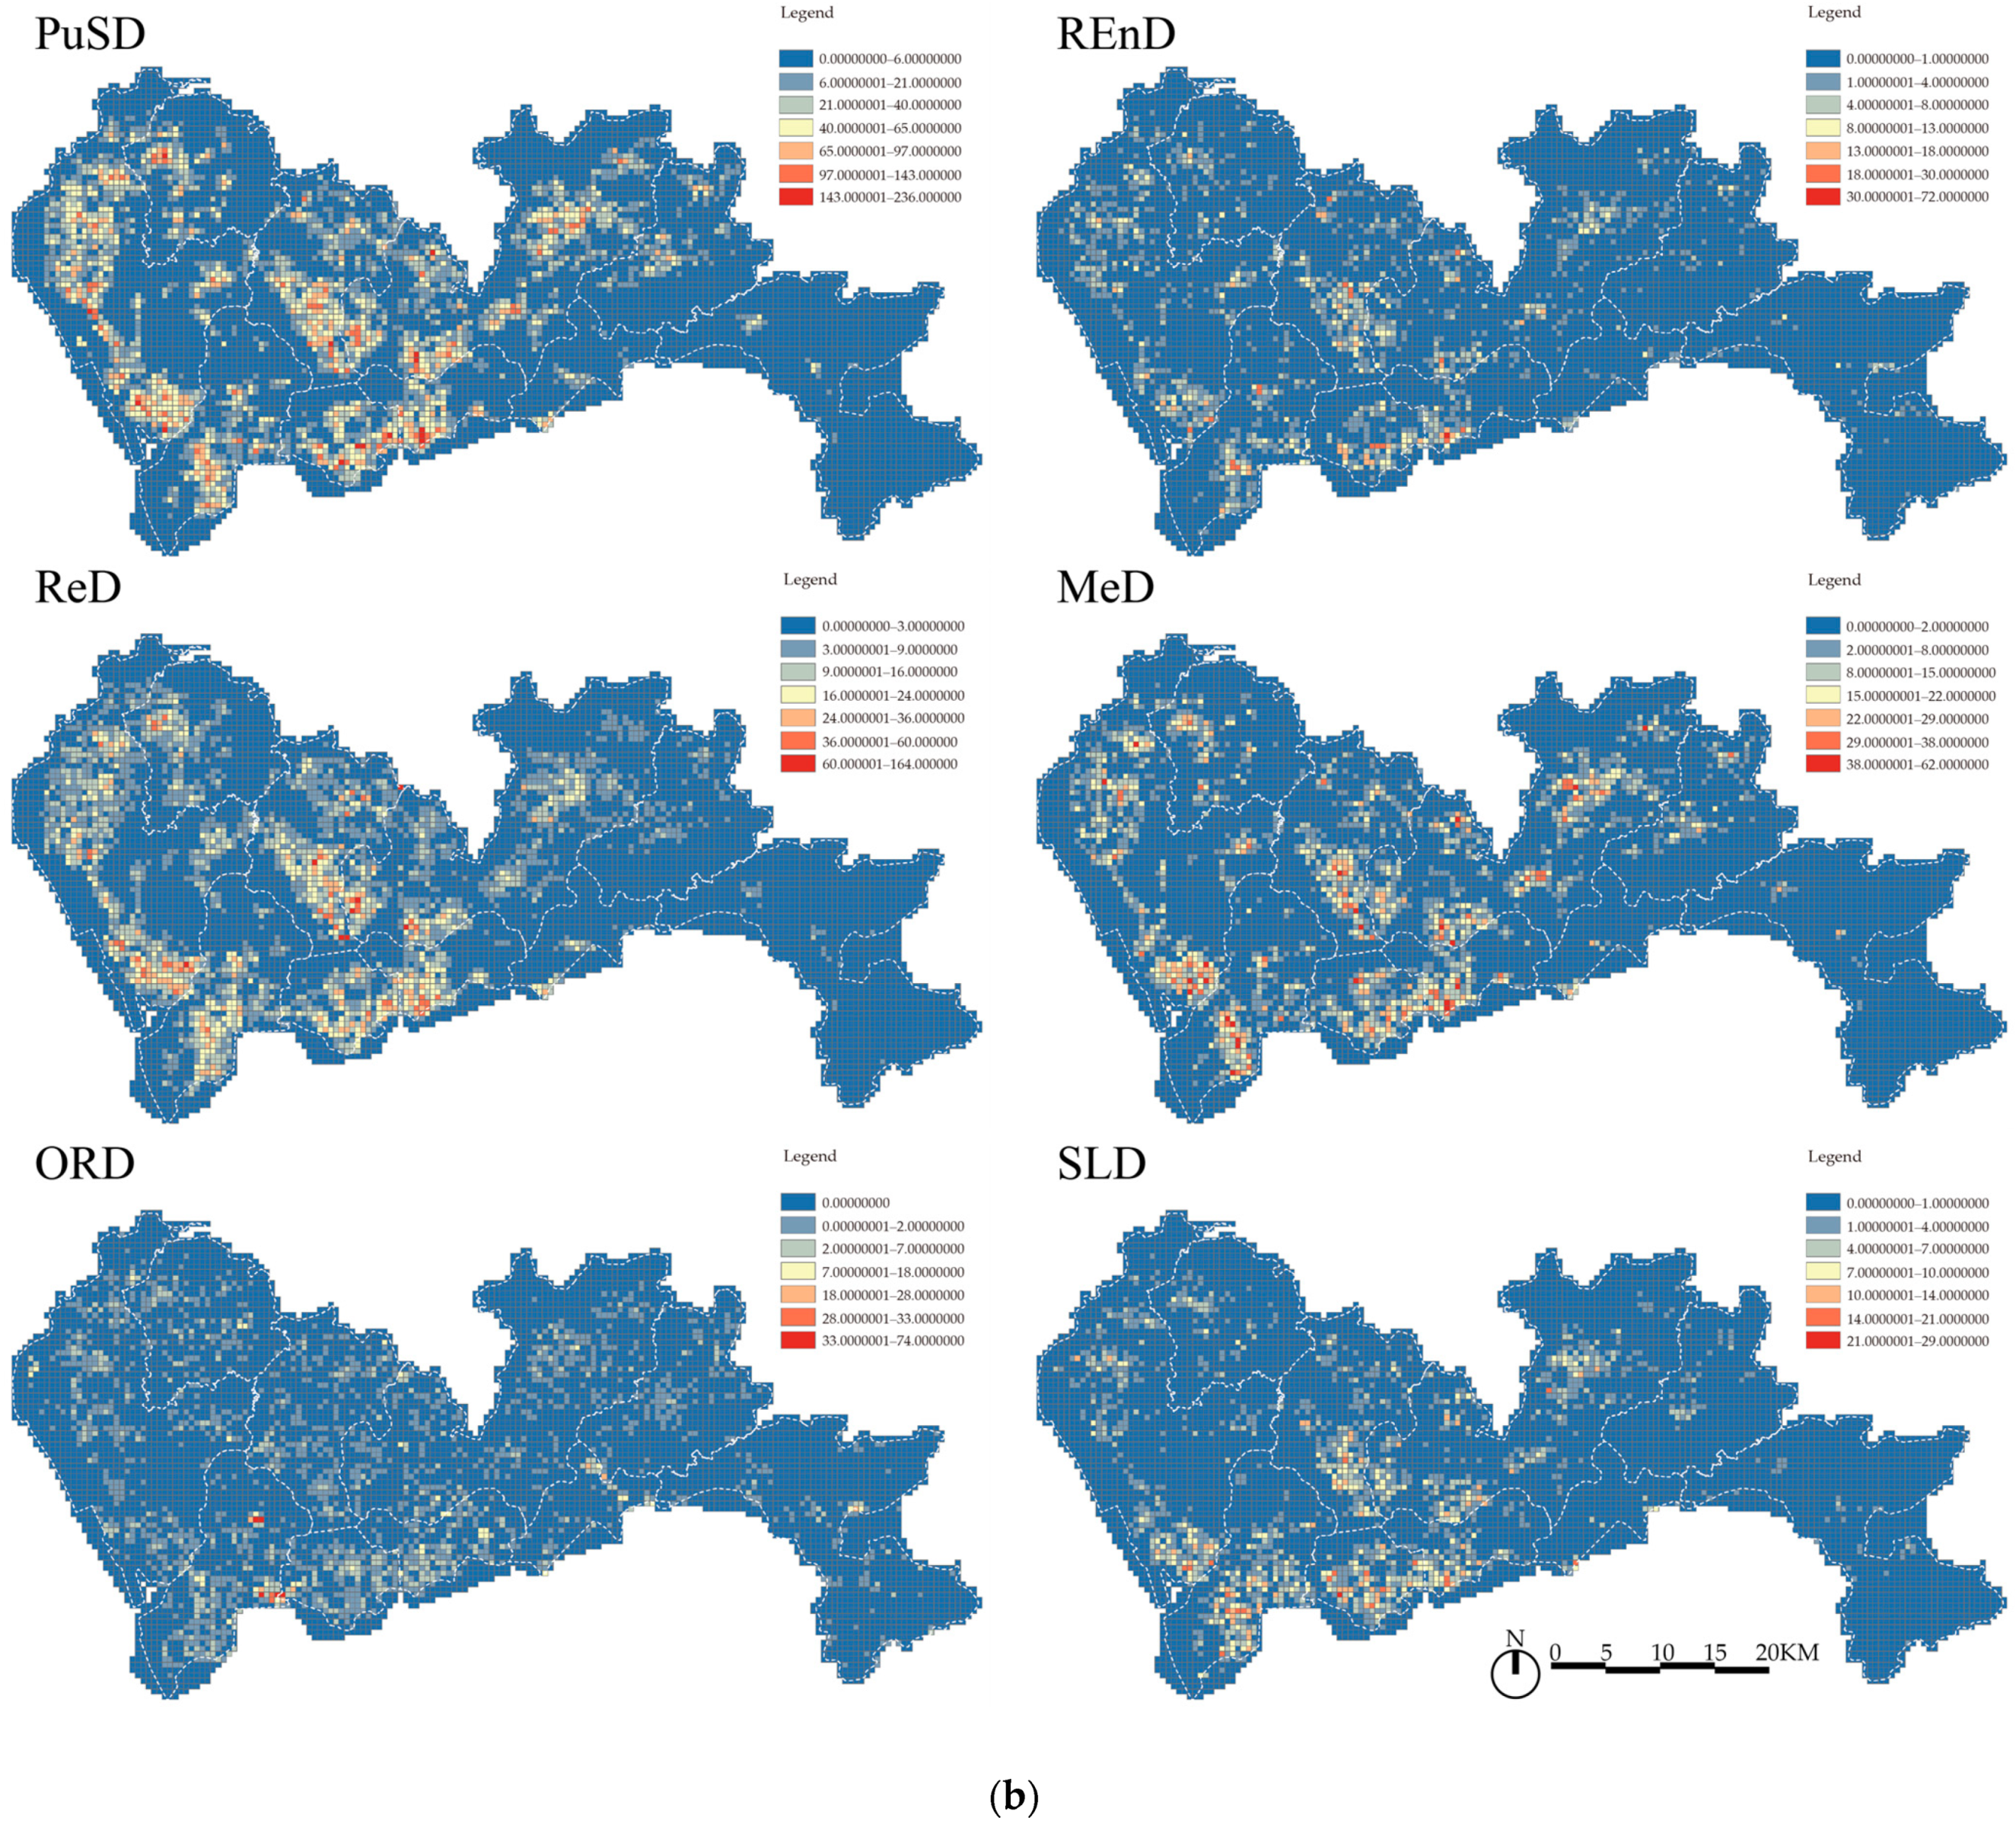
3.3.2. Measurement of Urban Built Environment

The built environment, as an integral part of overall well-being, is a spatial reflection of urban design and construction; its importance is currently increasing. There is an increasing variety of methods for measuring the built environment. All cities can be conceptualized as urban form elements, usually consisting of three main components: streets, blocks, and buildings [8]. Researchers have investigated several indexes to determine neighborhood morphological traits from morphological components (roads, blocks, buildings, and POIs) [8,37,42,47]. In 2020, Li summarized the built environment characteristics into two dimensions: formal and functional. Urban village acts as a specific spatial component of the city; on one hand, the urban form of the urban village has been described as inefficient [60]. On the other hand, the ability of urban economic and social life is significantly impacted by the mixed-use buildings and fine-grained street networks of urban villages [61]. Urban villages assume a wealth of urban functions. Therefore, this paper used urban villages as a third morphological dimension based on traditional formality and functionality. A total of 12 indicators were selected from the three morphological dimensions to measure the urban built environment. Table 3 describes these indicators in detail.
Formally, road network density (RND), transportation facilities density (TFD), and building density (BuD) were chosen to be the indicator. The total number of roads in the space unit divided by the unit’s area was used to calculate the road network density (RND). We also calculated the total number of the transportation facilities in a unit to describe the transportation facilities density (TFD). The building density (BuD) of a unit was calculated by dividing the total area of the buildings in the unit by the unit’s area.
Functionally, various types of POI data were used as indicators to identify city functions and sort out the internal spatial structure of a city. In this paper, eight common categories of POI data that highly correlated with human were selected as indicators: food facilities, shopping facilities, public service facilities, recreation and entertainment, residential facilities, medical facilities, outdoor and recreation, and sports and leisure. Specific facilities and classifications can be found in Table 2. We then figured out the density of each POI within the uni.
We included the urban village indicator as one of the independent variables. Kernel density estimation (KDE) was used to map the distance between geographical location and urban villages. This approach reflected the spatial clustering of analysis targets [51]. In this study, we obtained the urban village point data from Amap and analyzed the distance from urban village (DUV) data for each cell by KDE.

4. Modeling Approach

4.1. Ordinary Least Squares Model

Ordinary least squares regression model (OLS) is the most popular technology to study the relationship between urban vitality and urban morphology. It explains the connection between the dependent and independent variables [8,38]. Multiple linear regression models were used to help explore the relationships between incompatible parameters [62]. The dependent variable in this paper was the composite vitality value determined through economic, social, and cultural vitality, while the built environment indicators were the independent variables. The formula is as follows:
y = β 0 + j = 1 m   β j x j + ε
where y is the dependent variable, xj is the jth independent variable, βj denotes the corresponding estimated coefficient, and ε is the residual.
However, the relationship between geographic variables usually varies with location, which affects the accuracy of regression models. The spatial dynamics of the interaction between spatial variables cannot be explained by the OLS model since it ignores the spatial influence of variables [49].

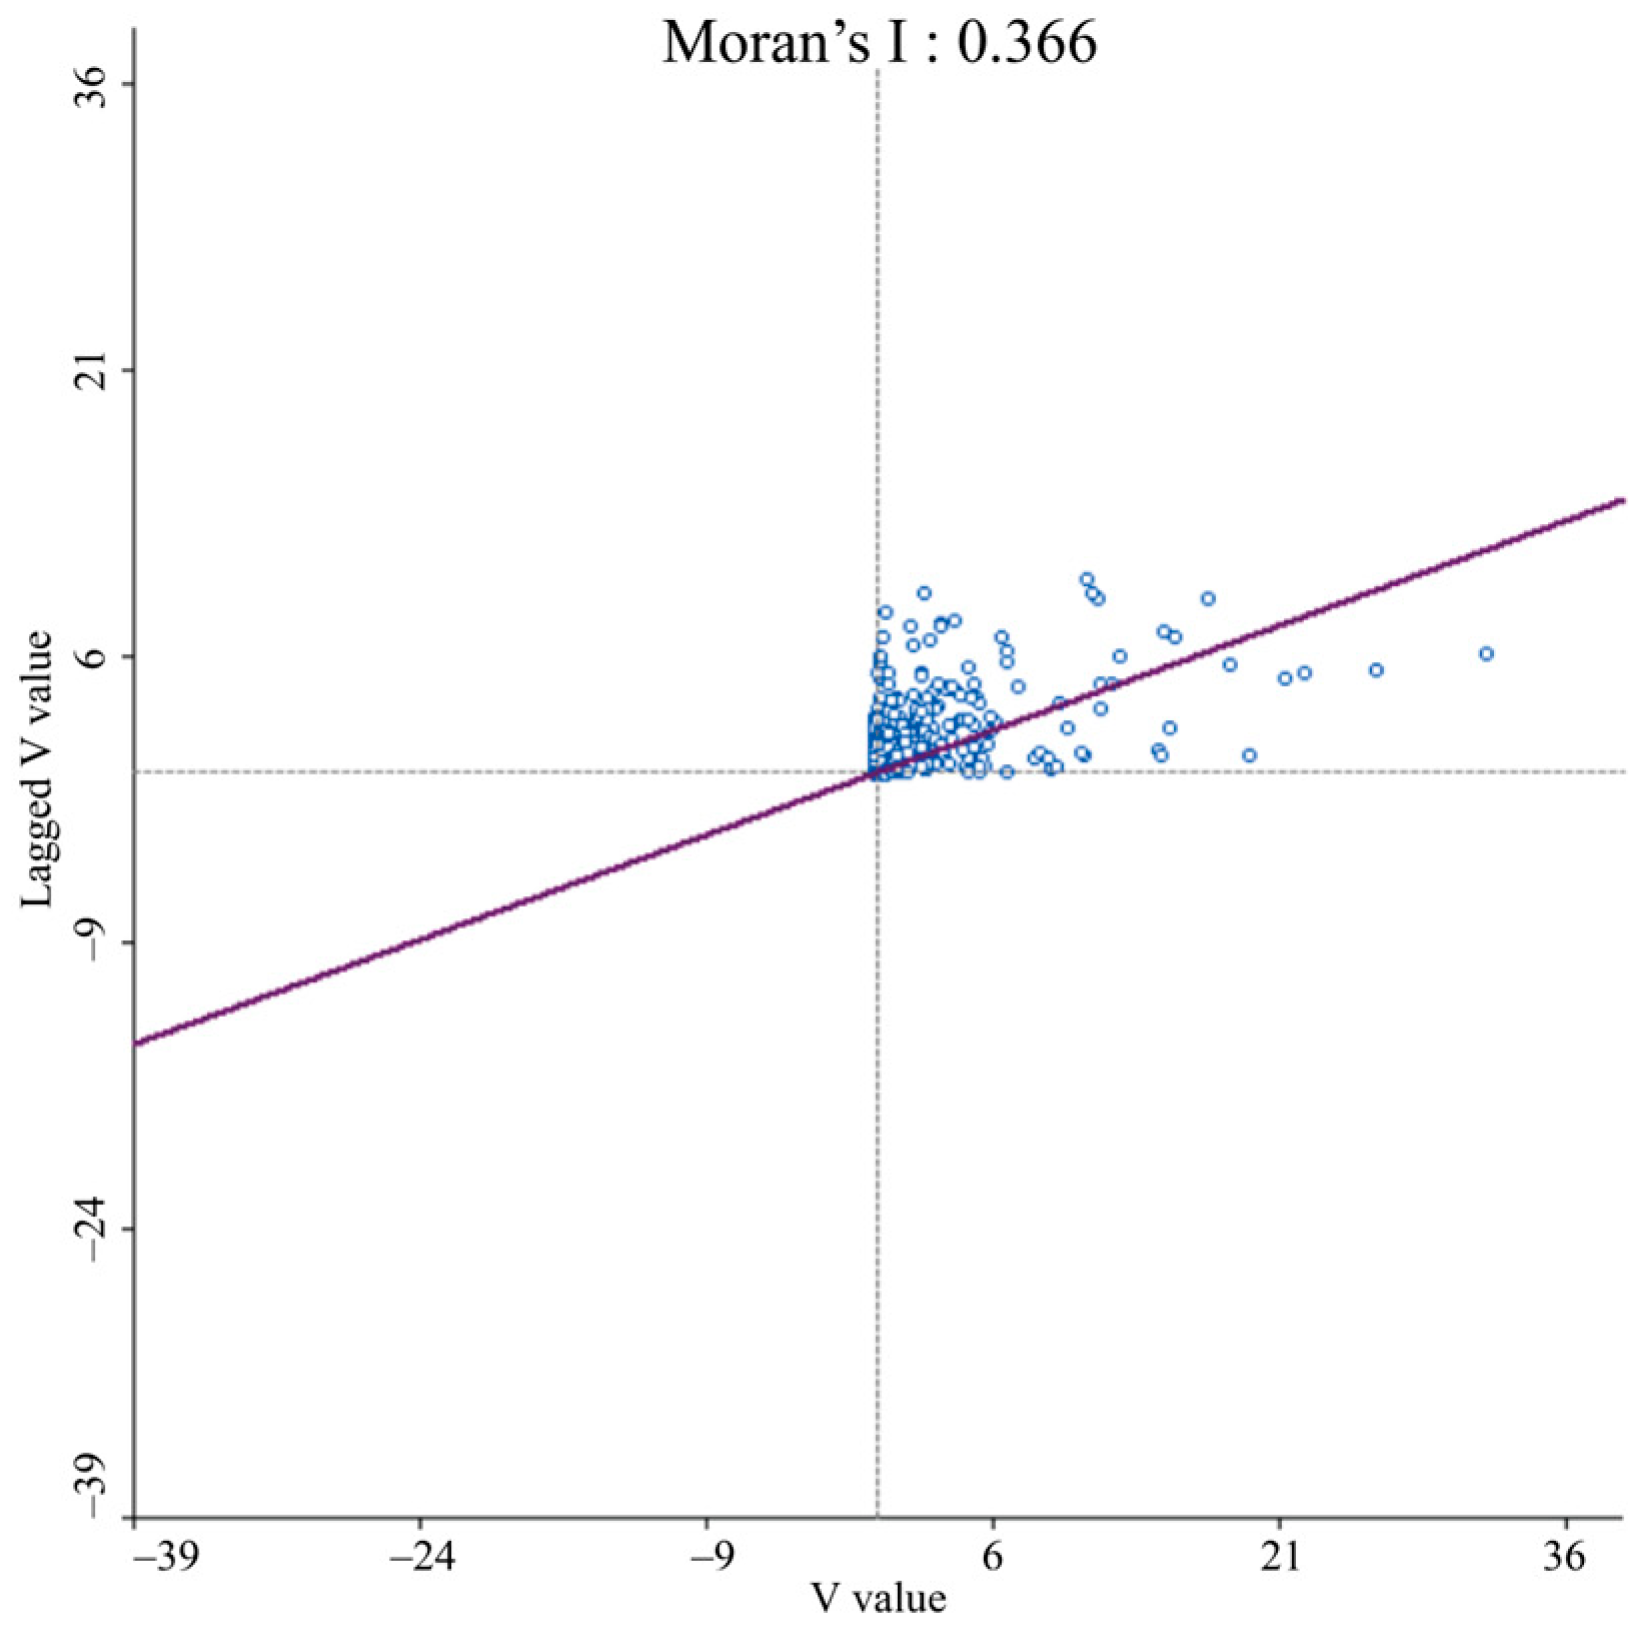
4.2. Global Moran’s I

We calculated the Moran’s I to understand the spatial patterns of urban dynamism. Moran’s I is a critical research indicator for studying dependence between variables [47]. Moran’s I typically has a value between −1.0 and 1.0, with greater absolute values denoting stronger spatial autocorrelation. The local relationship between the vitality and built environment was defined using the local indicator of spatial association (LISA) under various spatial and urban built environment conditions [6].

4.3. Spatial Lag Multiple Regression Model

The urban form elements were spatially inter-related because urban planning had the characteristics of spatial continuity. For example, roads and communities were connected in adjacent space units. Therefore, the spatial element studied may have been affected by its adjacent elements. The ordinary least squares (OLS) model based on independent assumptions has limited ability to analyze this type of data. However, spatial lag multiple regression model (SLM) can weaken the deviation of autocorrelation, thus reducing the mutual interference of adjacent units [47]. The formula is as follows:
Y = β 0 + ρ W Y + i   β i X i + ε
where Y denotes the dependent variable, X i represents the explanatory variable i, β 0 is the intercept, β i is the estimated coefficient of the explanatory variable, W is the spatial weight matrix, ρ is the spatial autoregressive coefficient, and ε is the error term. In this paper, the dependent variable was the urban vitality and the explanatory variable was the factors of the built environment.

5. Results and Analysis

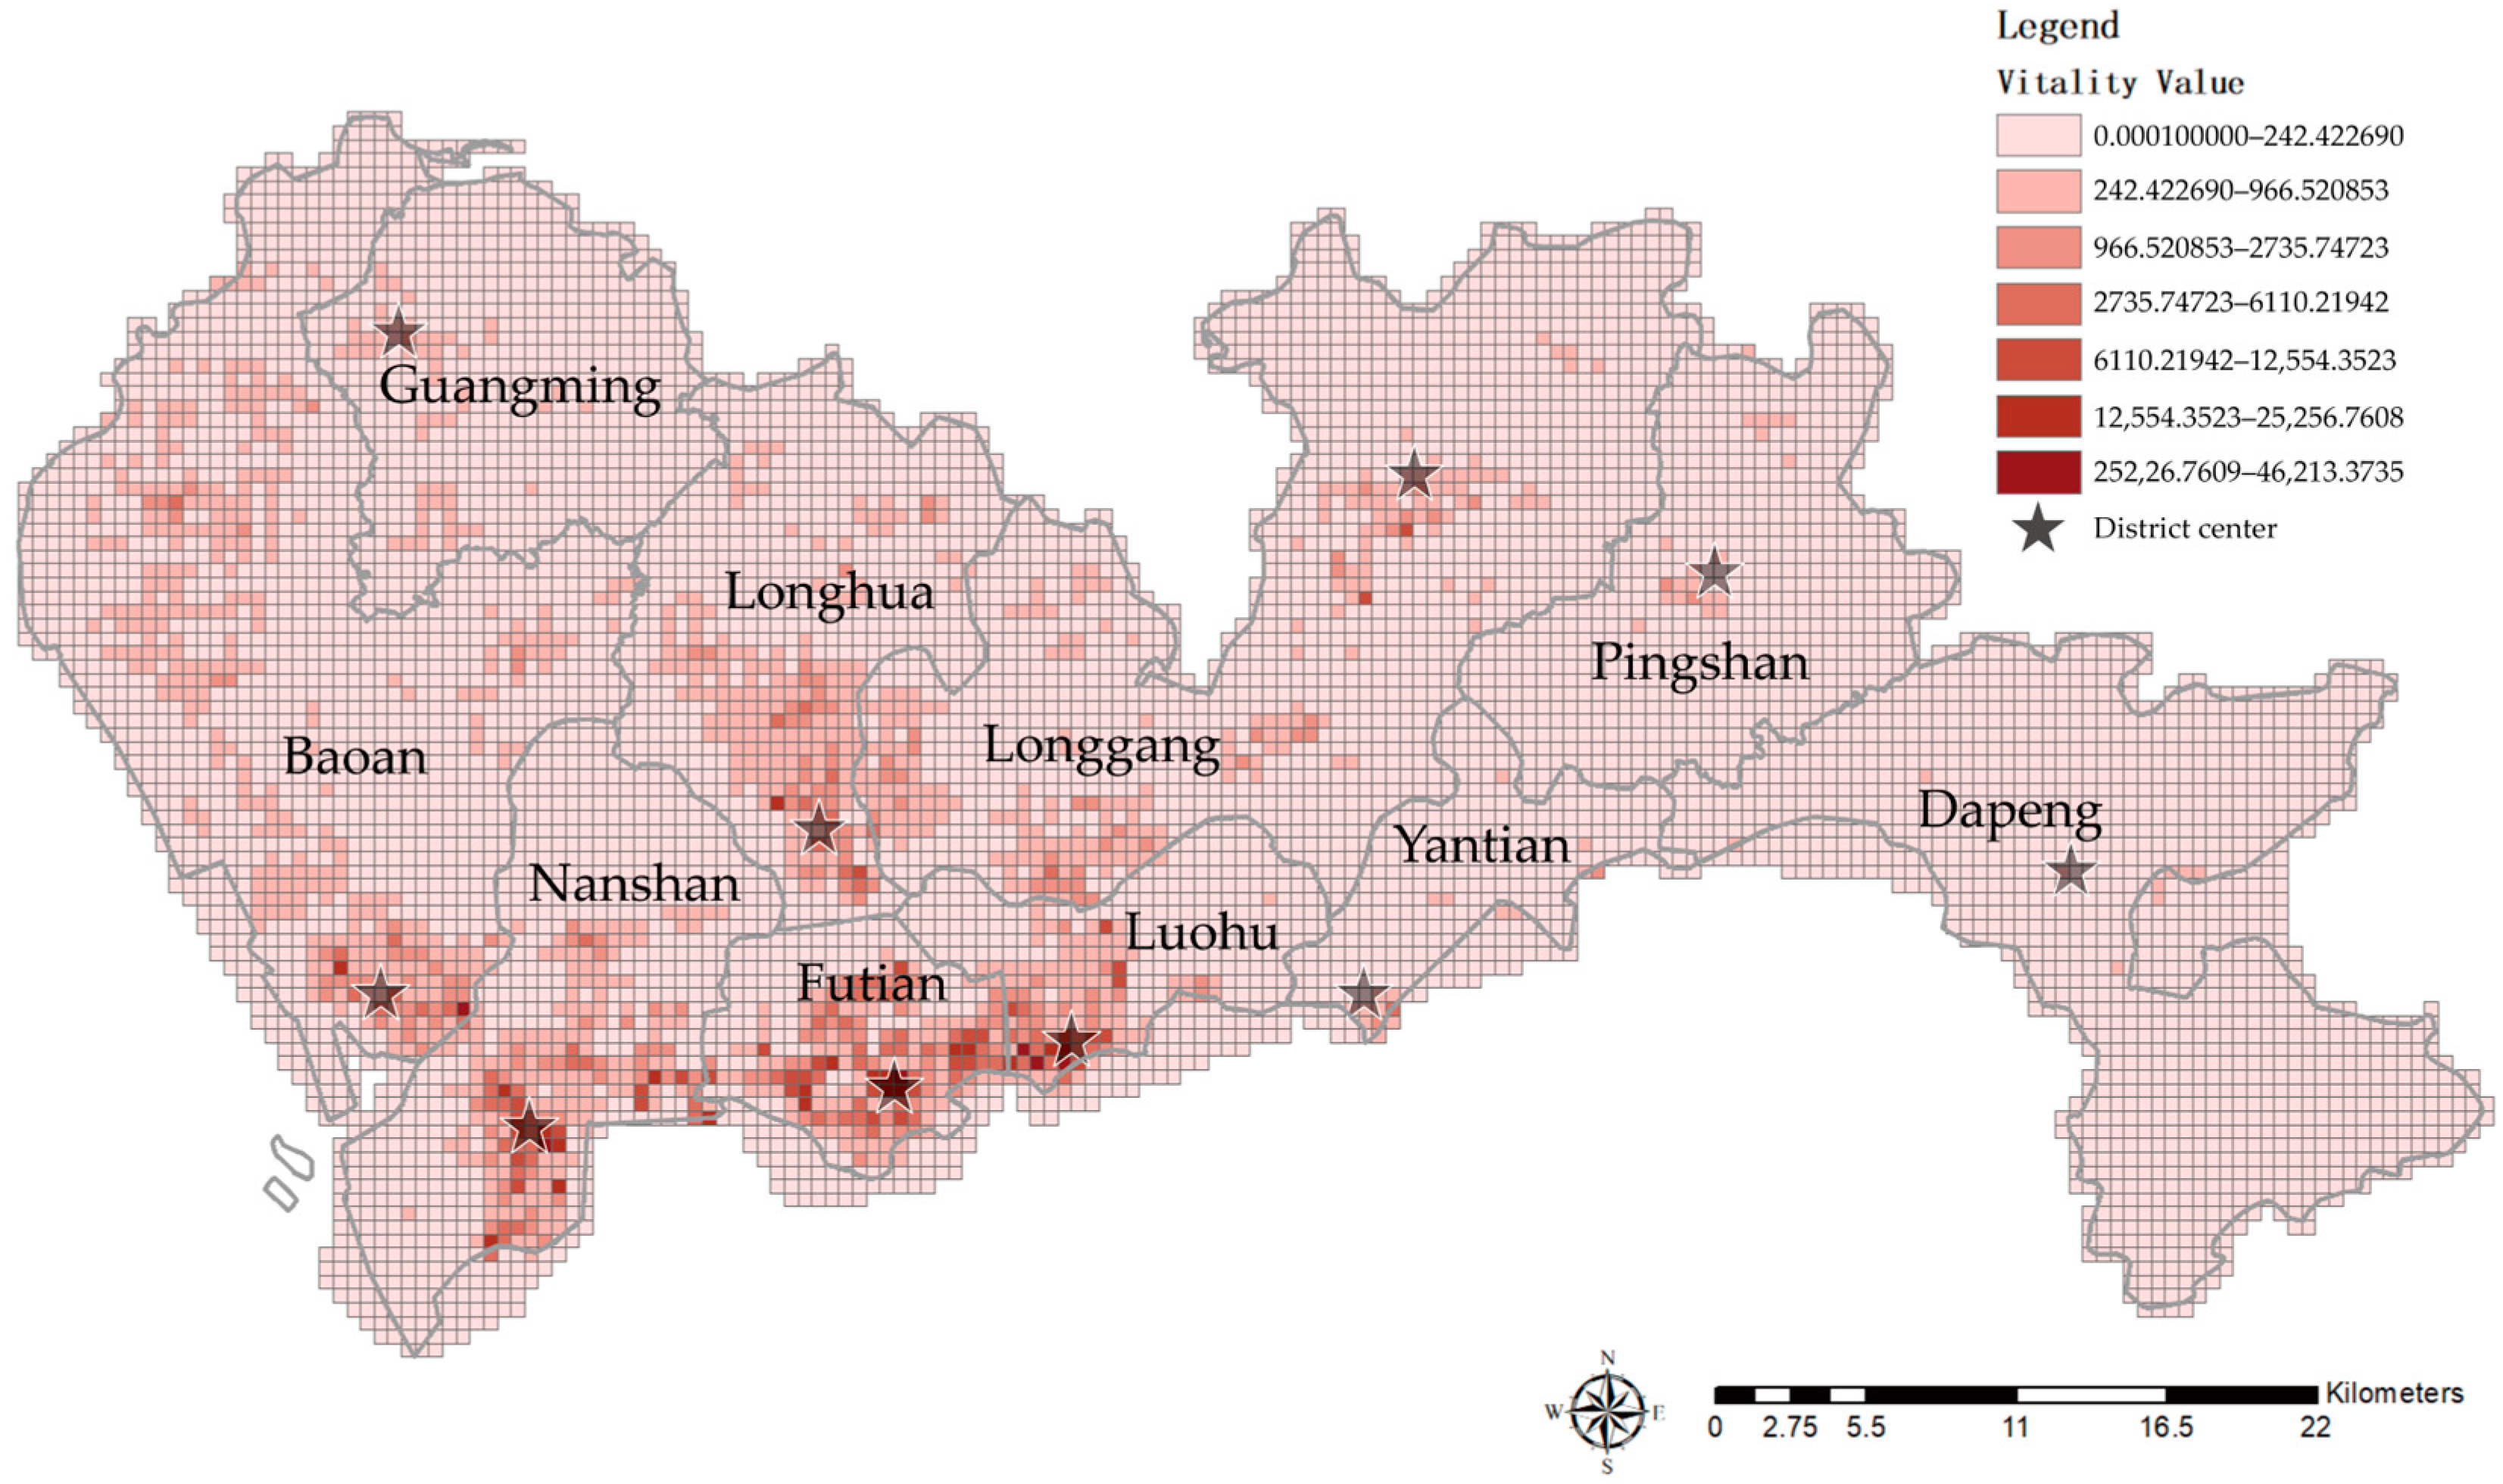
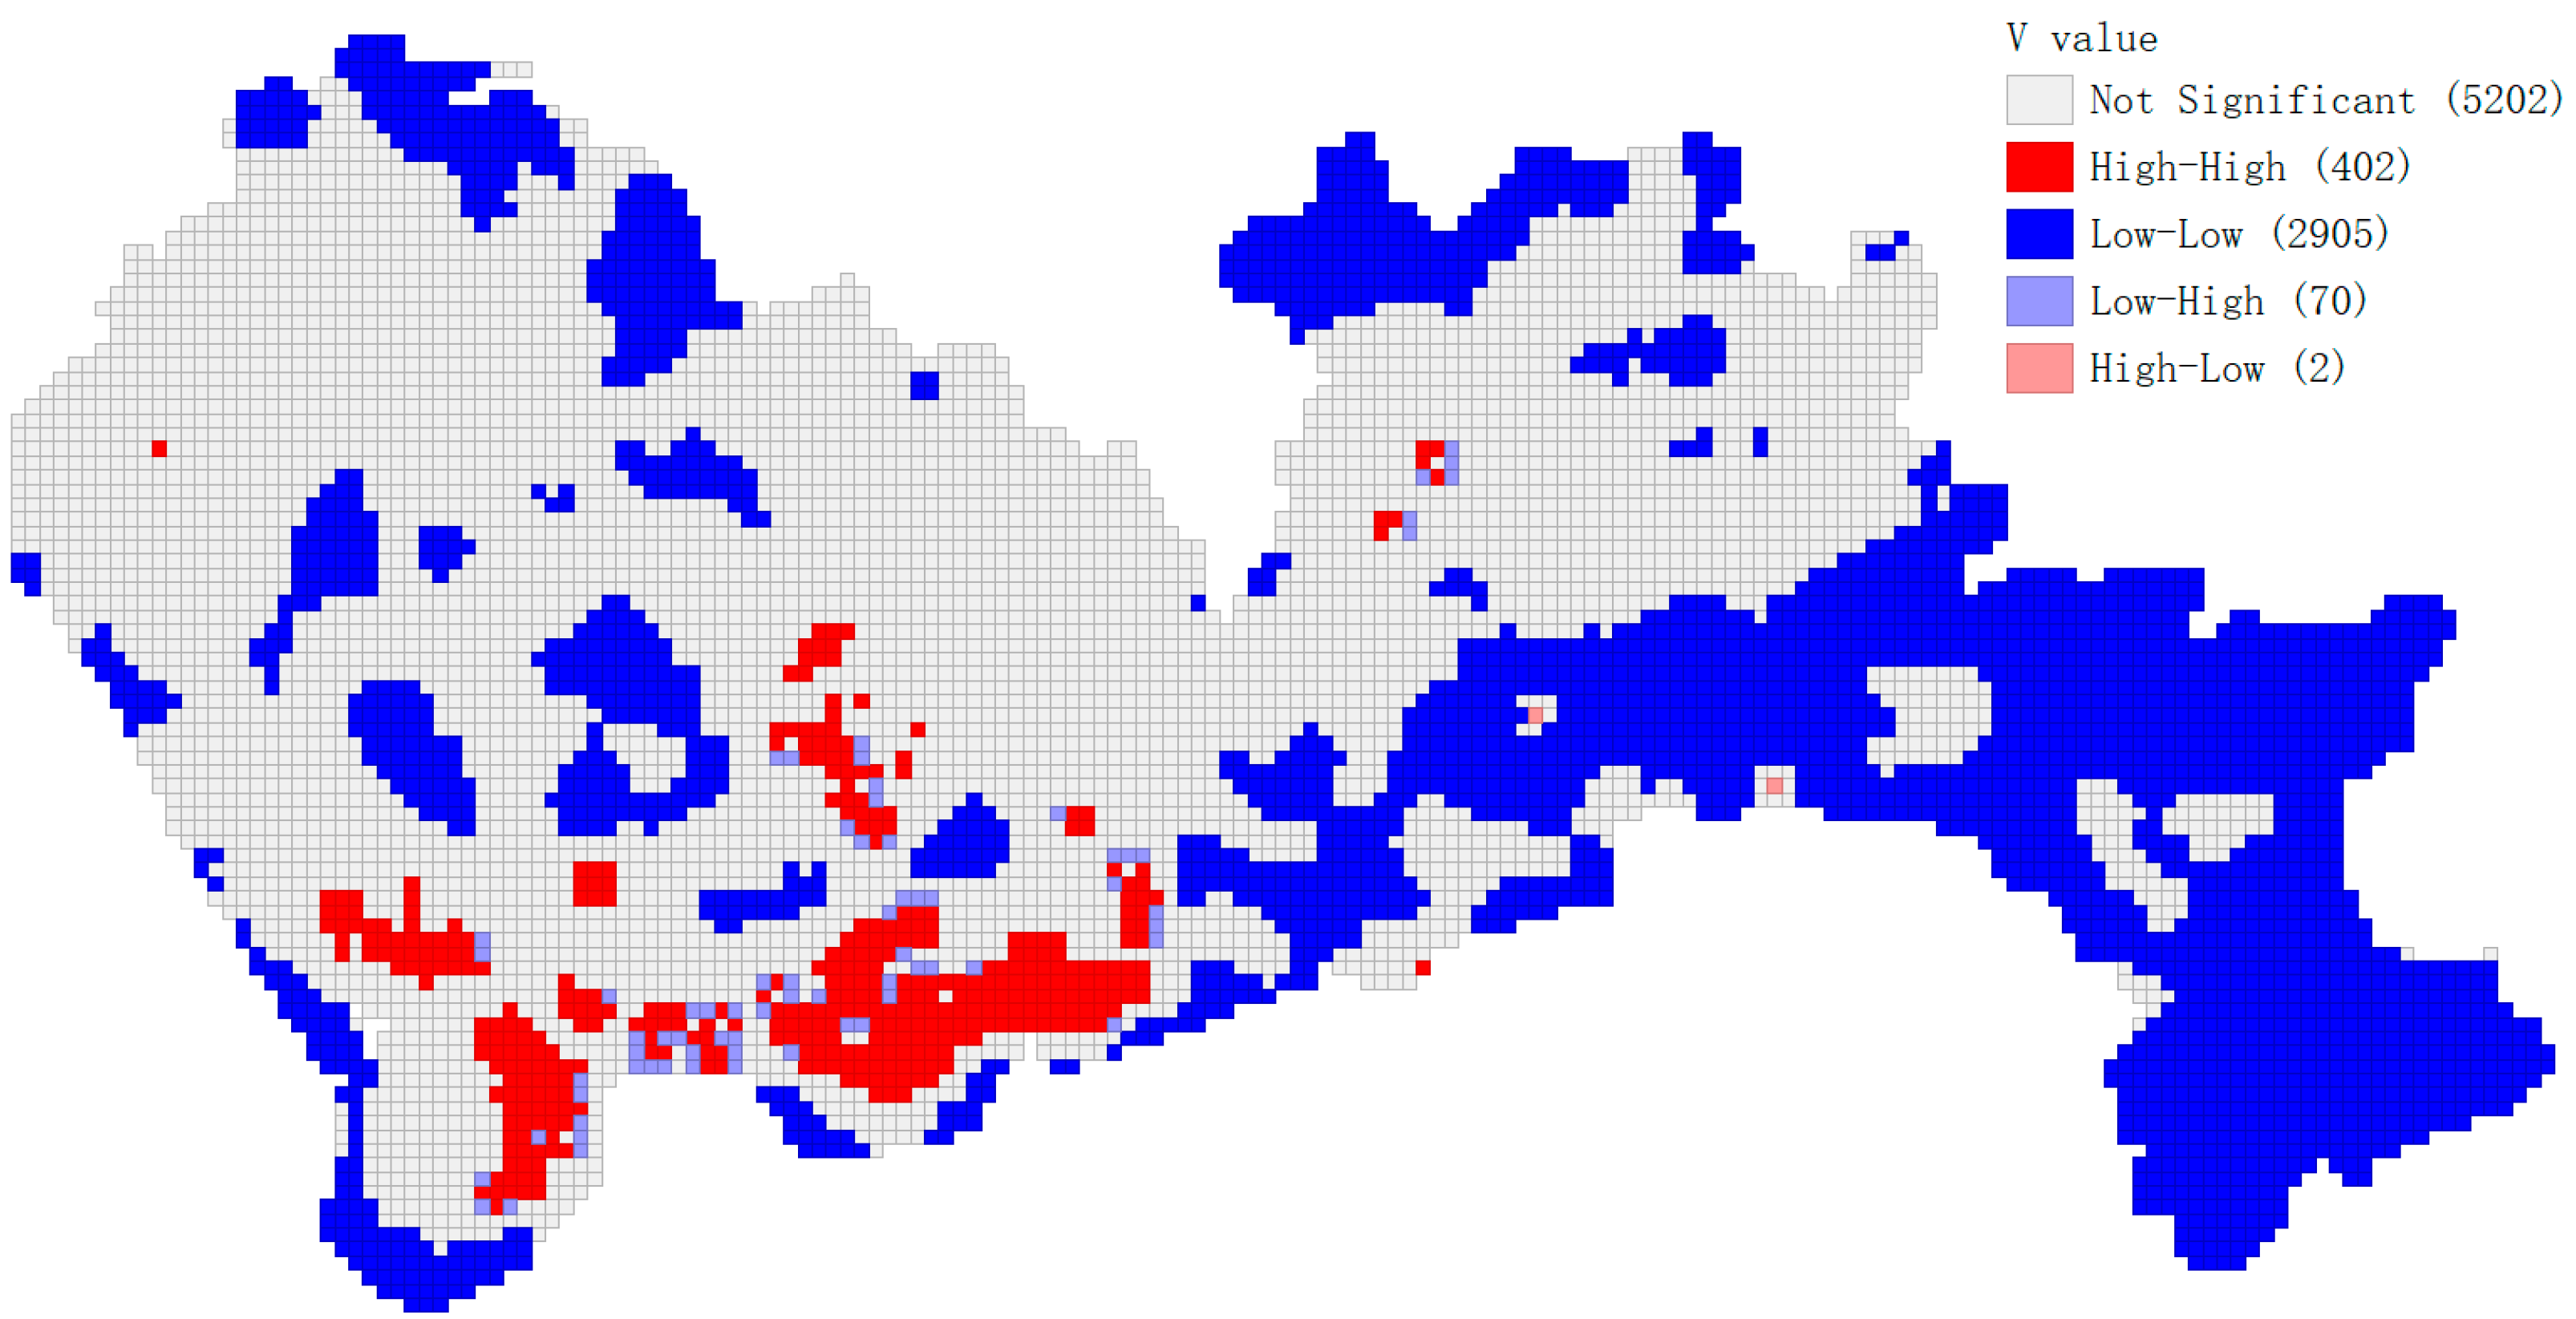
5.1. Spatial Patternning of Urban Vitality

Using a Geographic Information System (GIS), this study illustrates how the variables are spatially distributed. Figure 2 depicts the geographical spread of the composite urban vitality. Urban vitality is observed to have a uneven spatial distribution. The central district of Shenzhen, consisting of Nanshan District, Futian District and Luohu District, has a high-level vitality. The central district of Bao’an in the west, the central district of Longhua Shenzhen North Railway Station, and the central district of Longgang in the northeast also show high levels of vitality. This is consistent with the map of Shenzhen’s urban development pattern. Other non-focused peripheral areas show lower levels of urban vitality.
Figure 3 shows the spatial distribution of selected urban built environment variables. In terms of urban form, road network density performs highly across the region, with an average road network density of 9.7 km/km2, which is higher than China’s planned road network density target of 8 km/km2. In comparison to the northern region, the southern central area has a larger density of roads. Moreover, compared to other central areas and ahead of other regions, the Luohu central area has a higher density of transportation facilities; in terms of the distribution of building density, the central city is slightly higher compared to other urban areas and the overall distribution is more stable. In terms of urban villages, the indicators reflect the scattered spatial layout of urban villages in all areas of Shenzhen. In terms of urban functions, for POI the high-density units in FoD, ShD, PuSD, and MeD, are evenly distributed in all regional centers of Shenzhen, showing a polycentric layout structure. REnD, SLD, and ORD have a lower overall density and are more scattered, while the western and northern parts of ReD are slightly denser than the southern central areas.
We conducted a spatial autocorrelation analysis of the city’s vitality values using GeoDa version 1.20.0.20 software and created a weight matrix using the Queen’s continuum. As shown in Figure 4, after using 9999 permutation tests, the Moran Vitality Index has a value of 0.366, which is highly positively correlated at a significance level p-value of 0.001. The local Moran’s I was also utilized to locate geographic clusters with statistically low or high urban vitality (Figure 5); the outcomes support the idea that urban vitality is unequally spatially distributed. As shown in Figure 4, there are clusters of high vitality in the centers of Bao’an and Nanshan, as well as Futian and Luohu districts. However, the overall scale of urban dynamism is much lower in Yantian and Dapeng districts on the eastern coast, as well as in localized areas in the north.

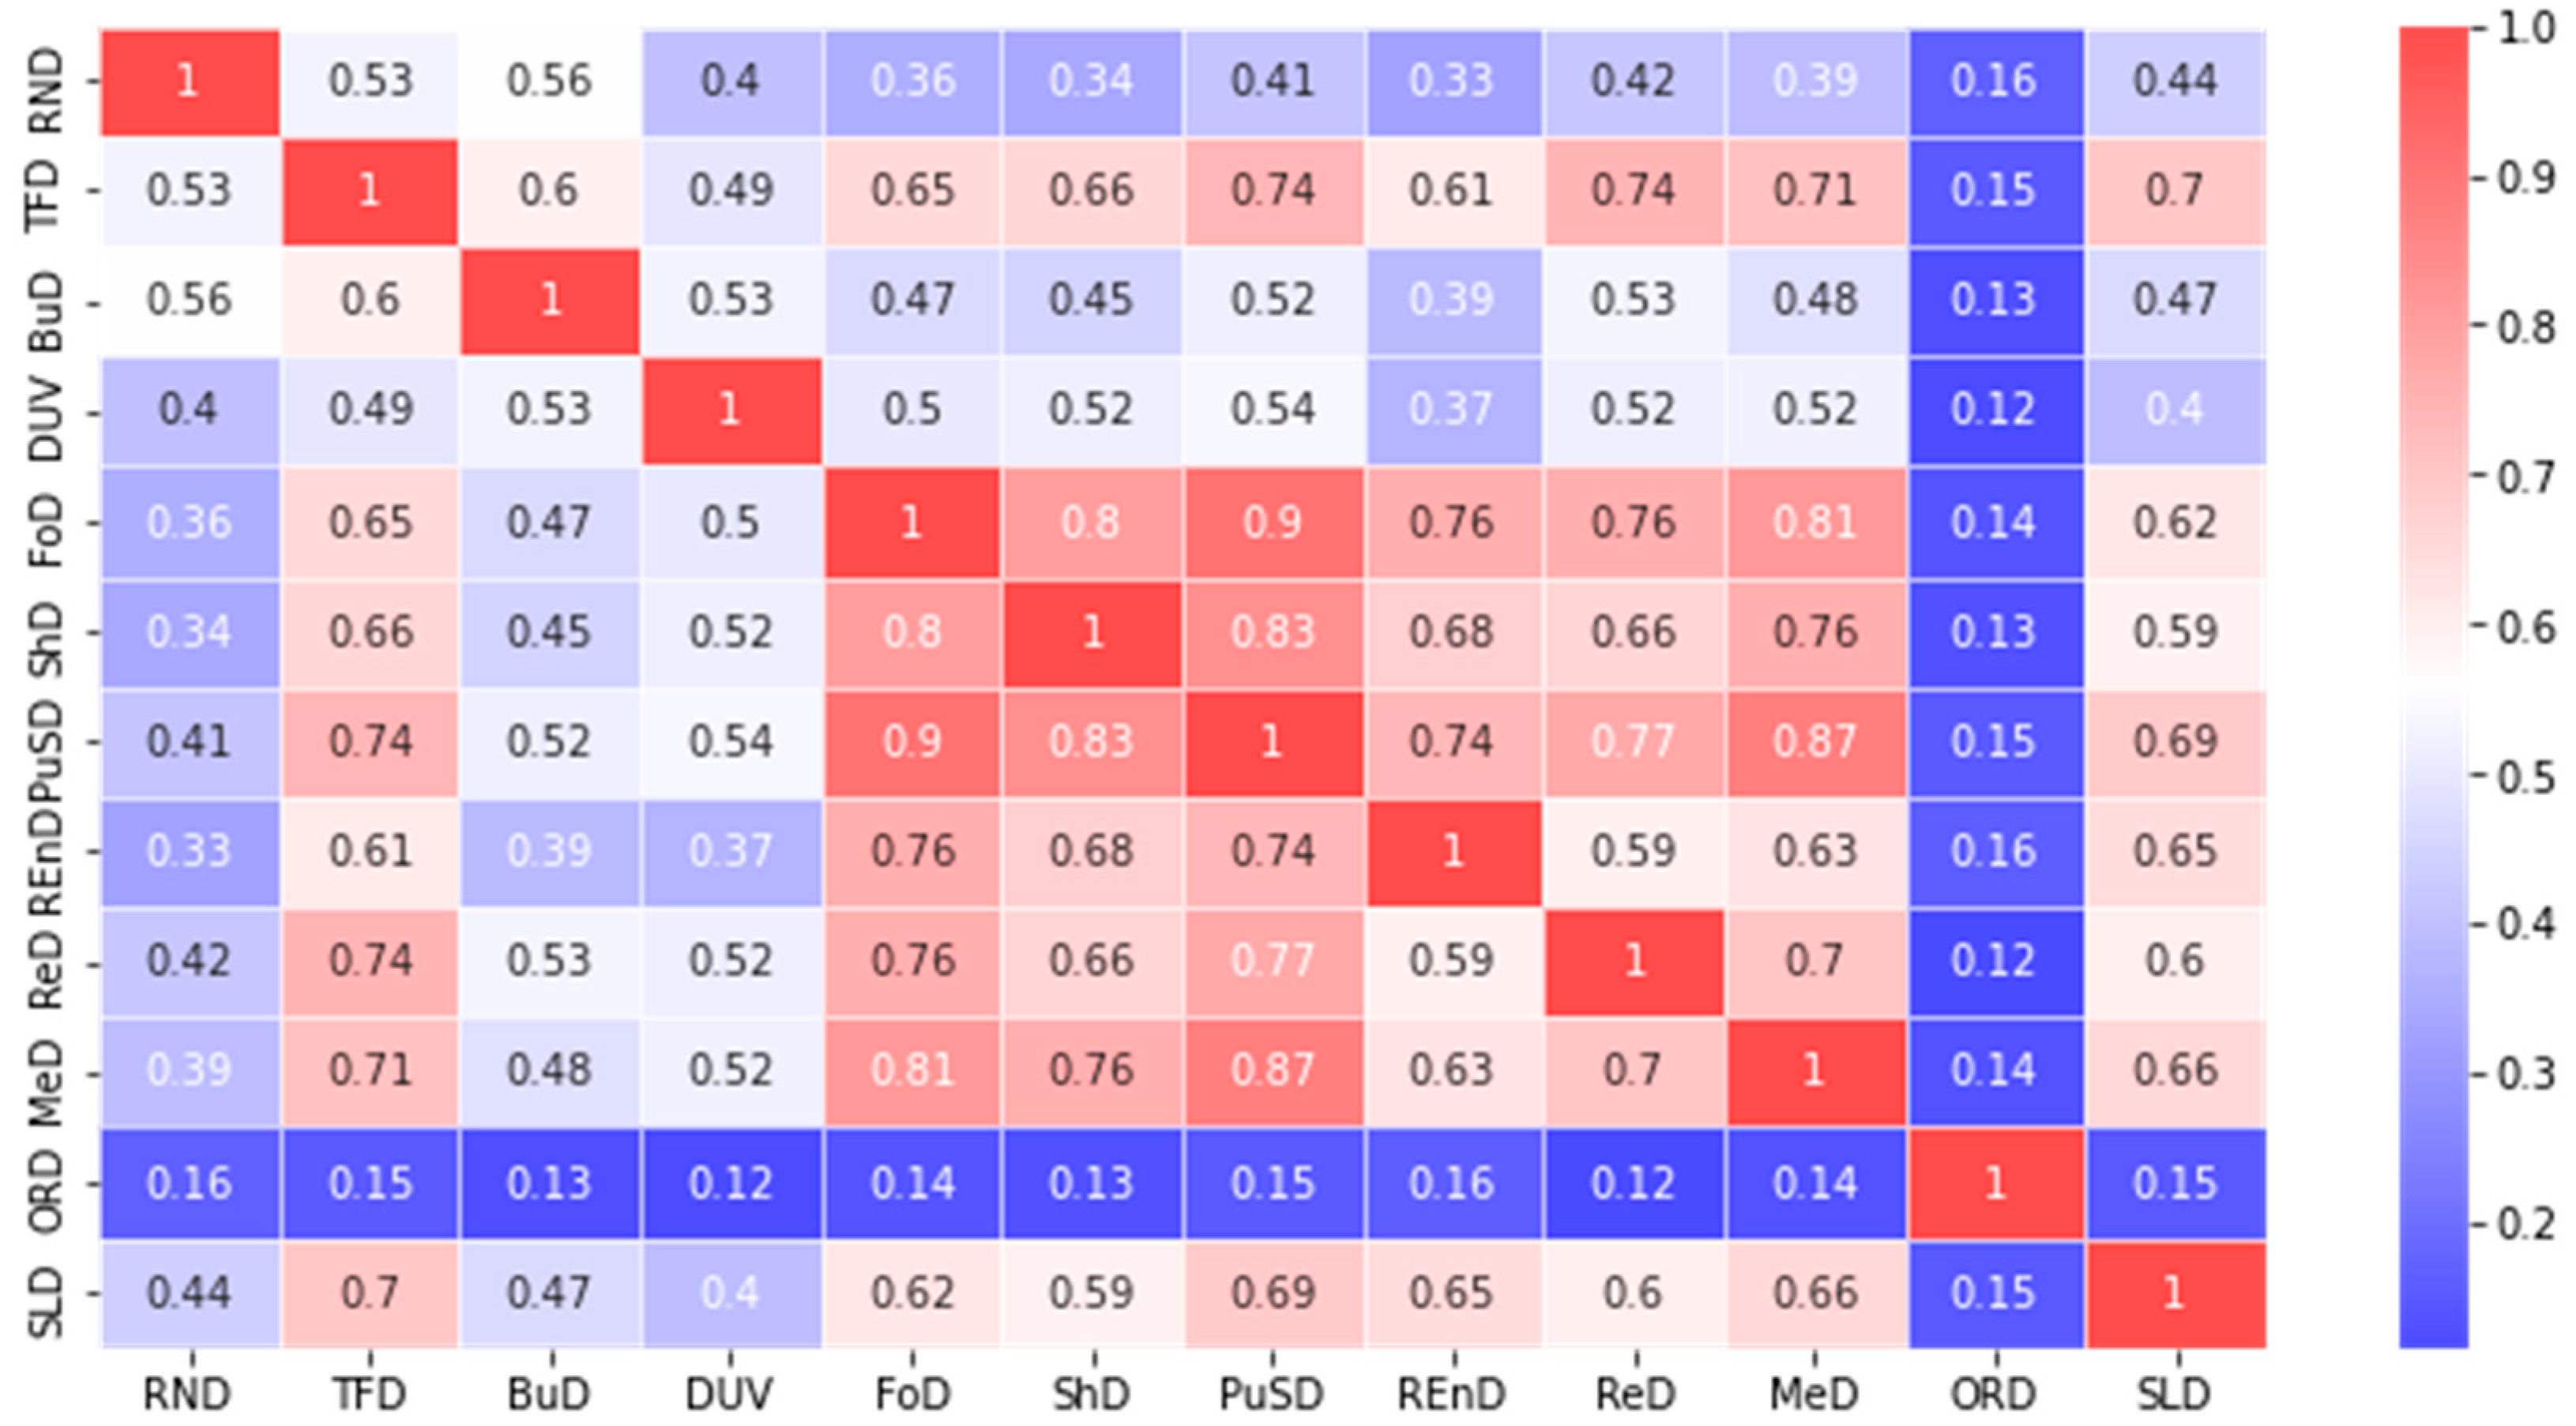
5.2. Regression Model Outcomes
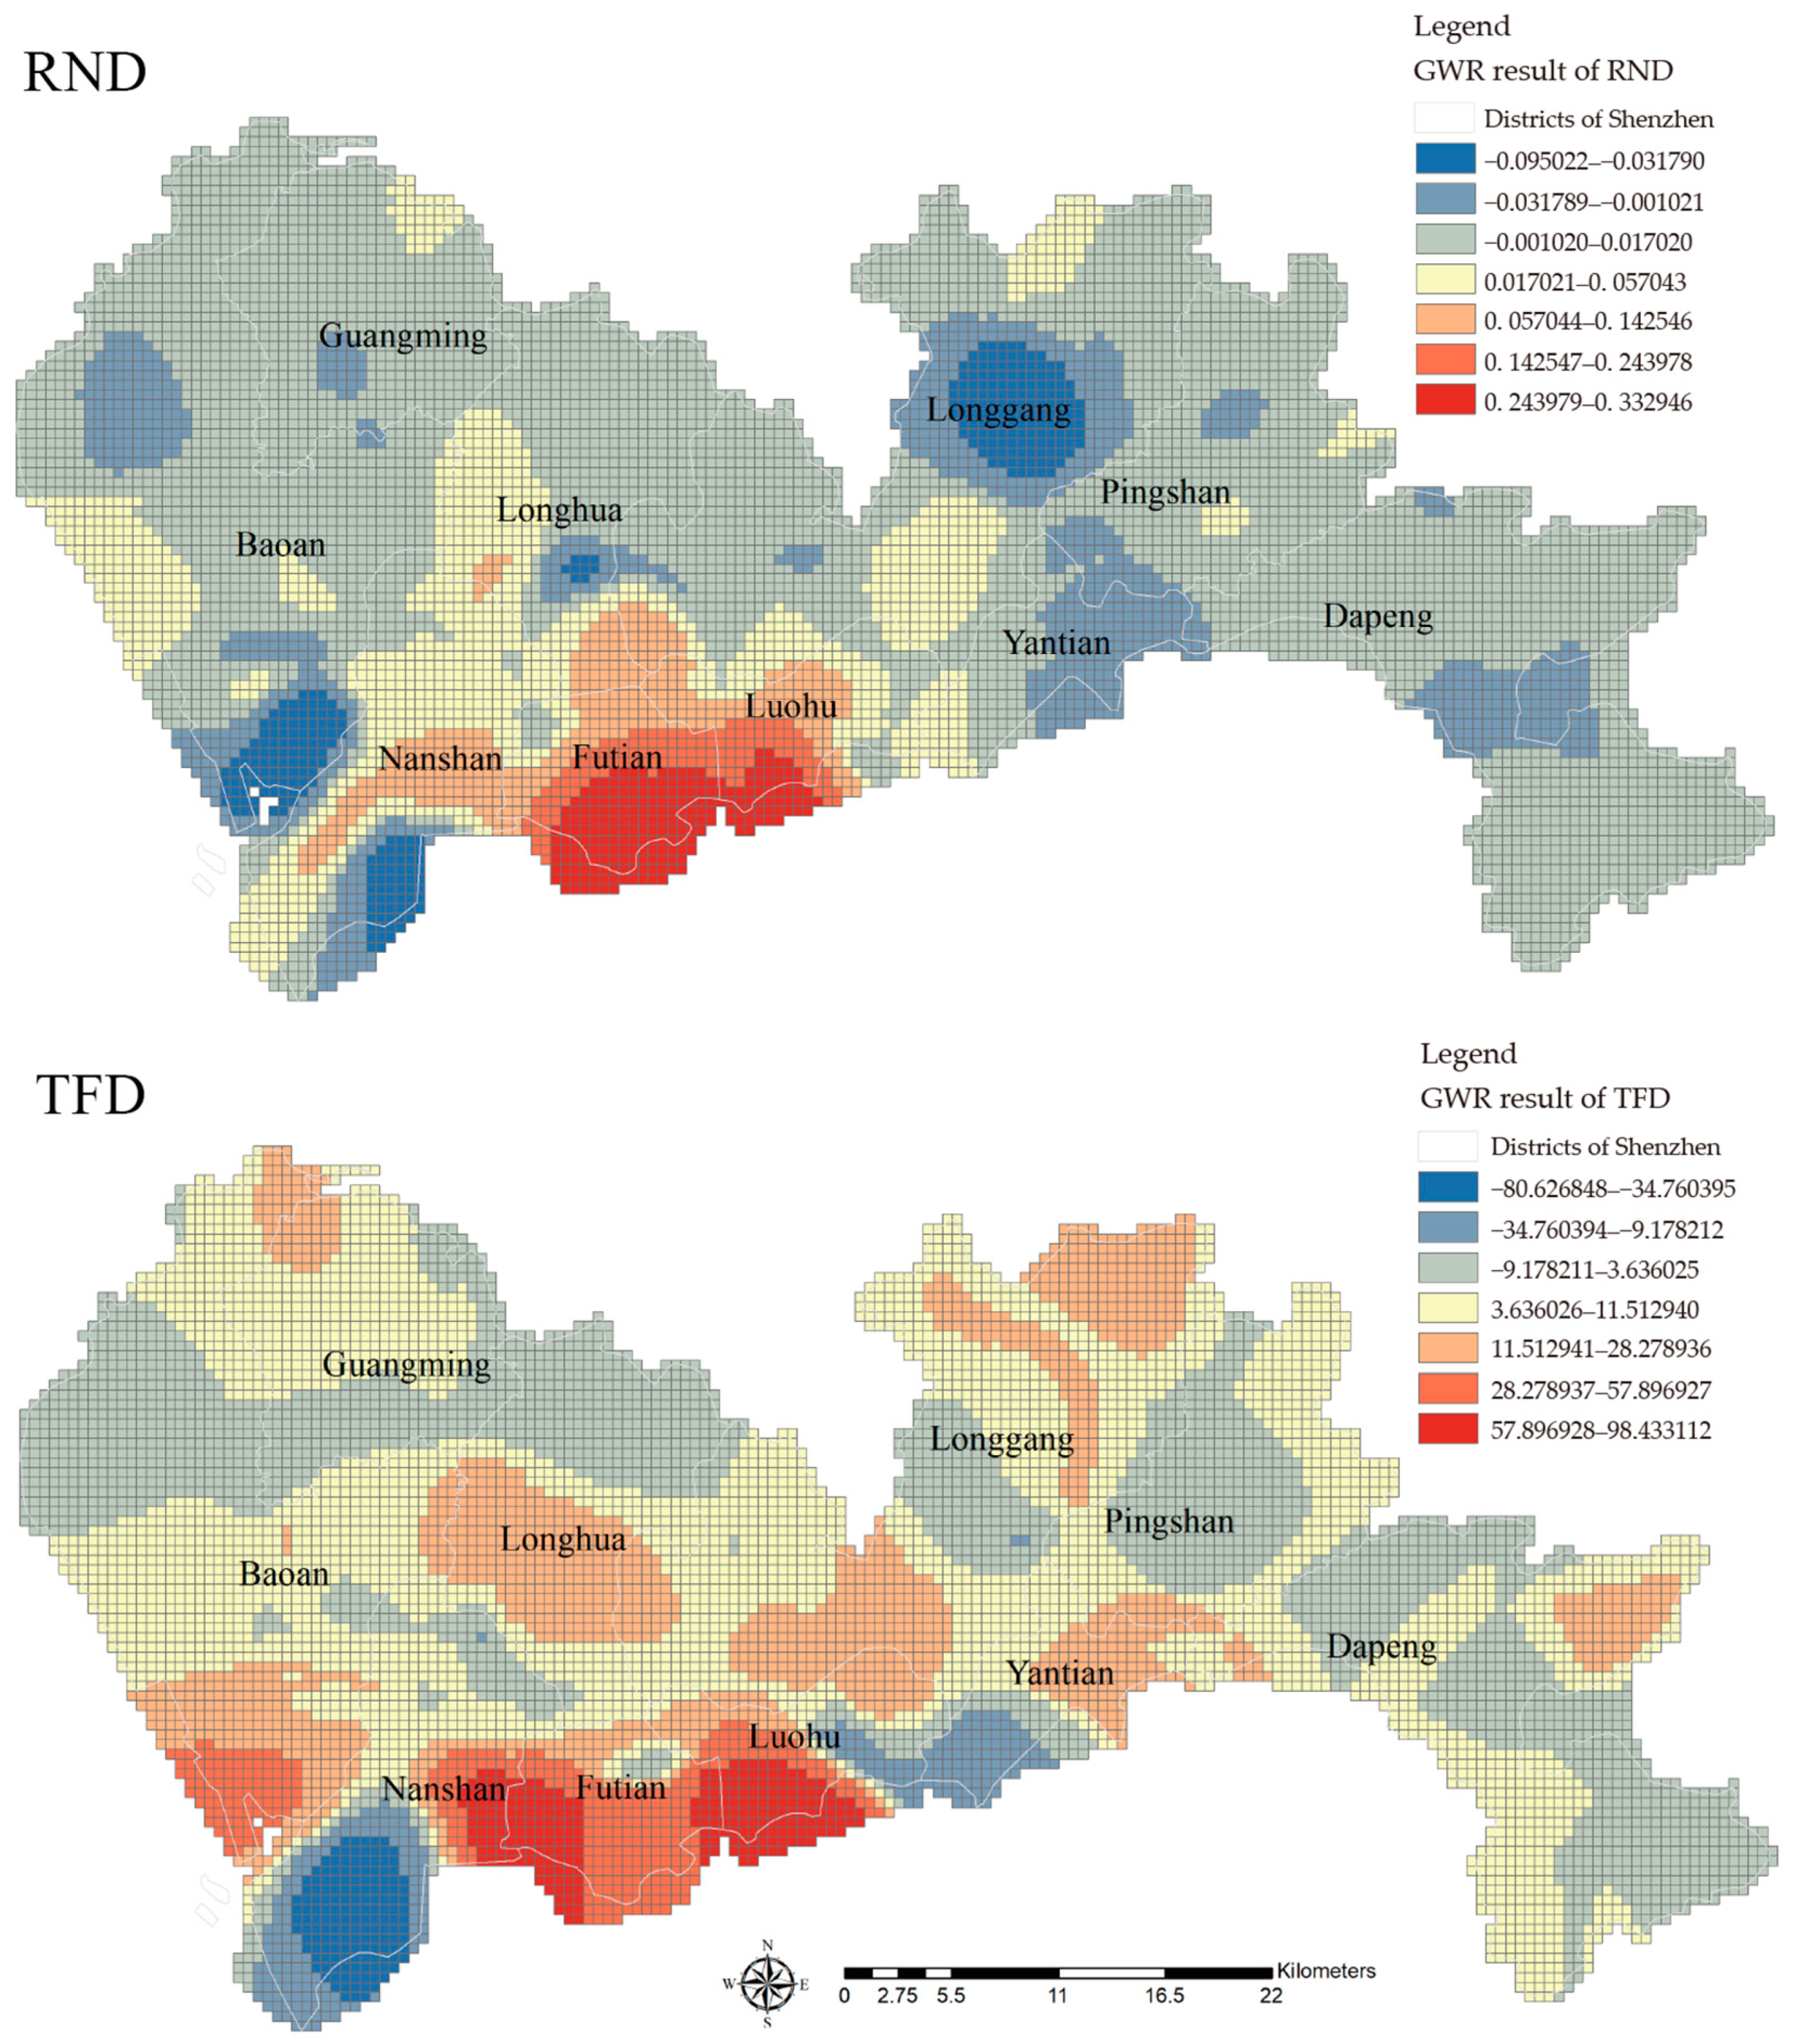
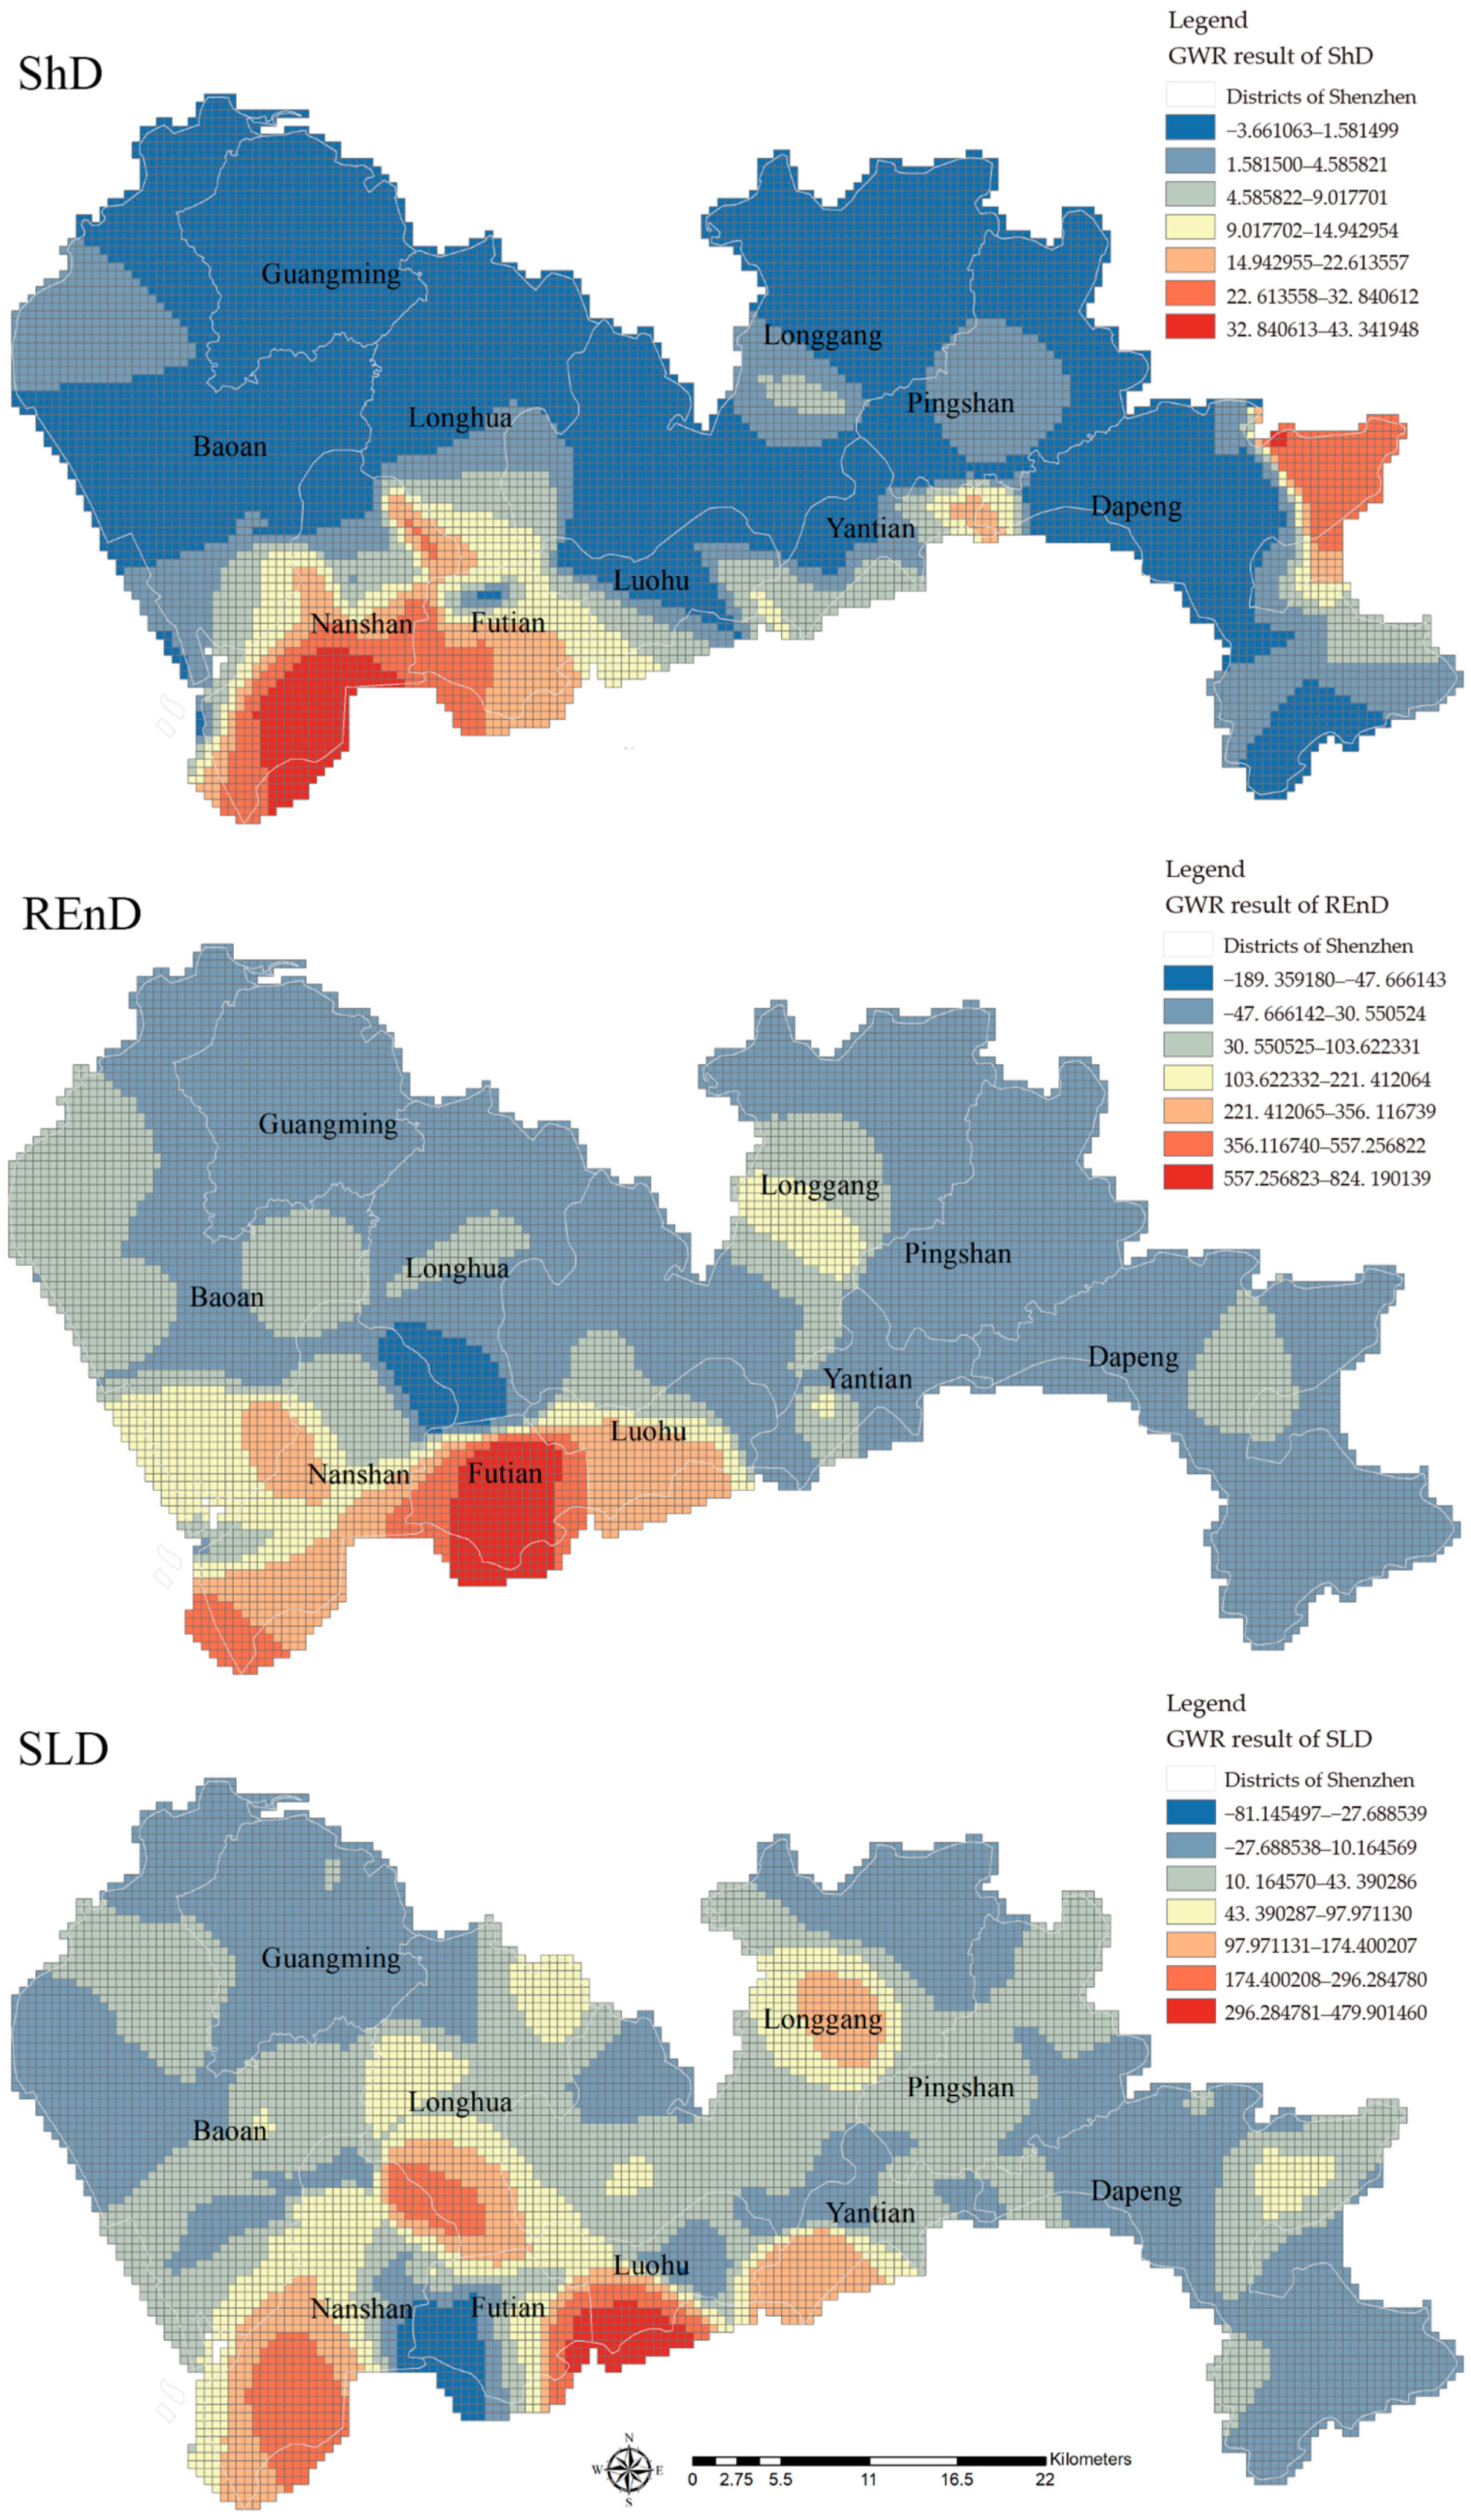
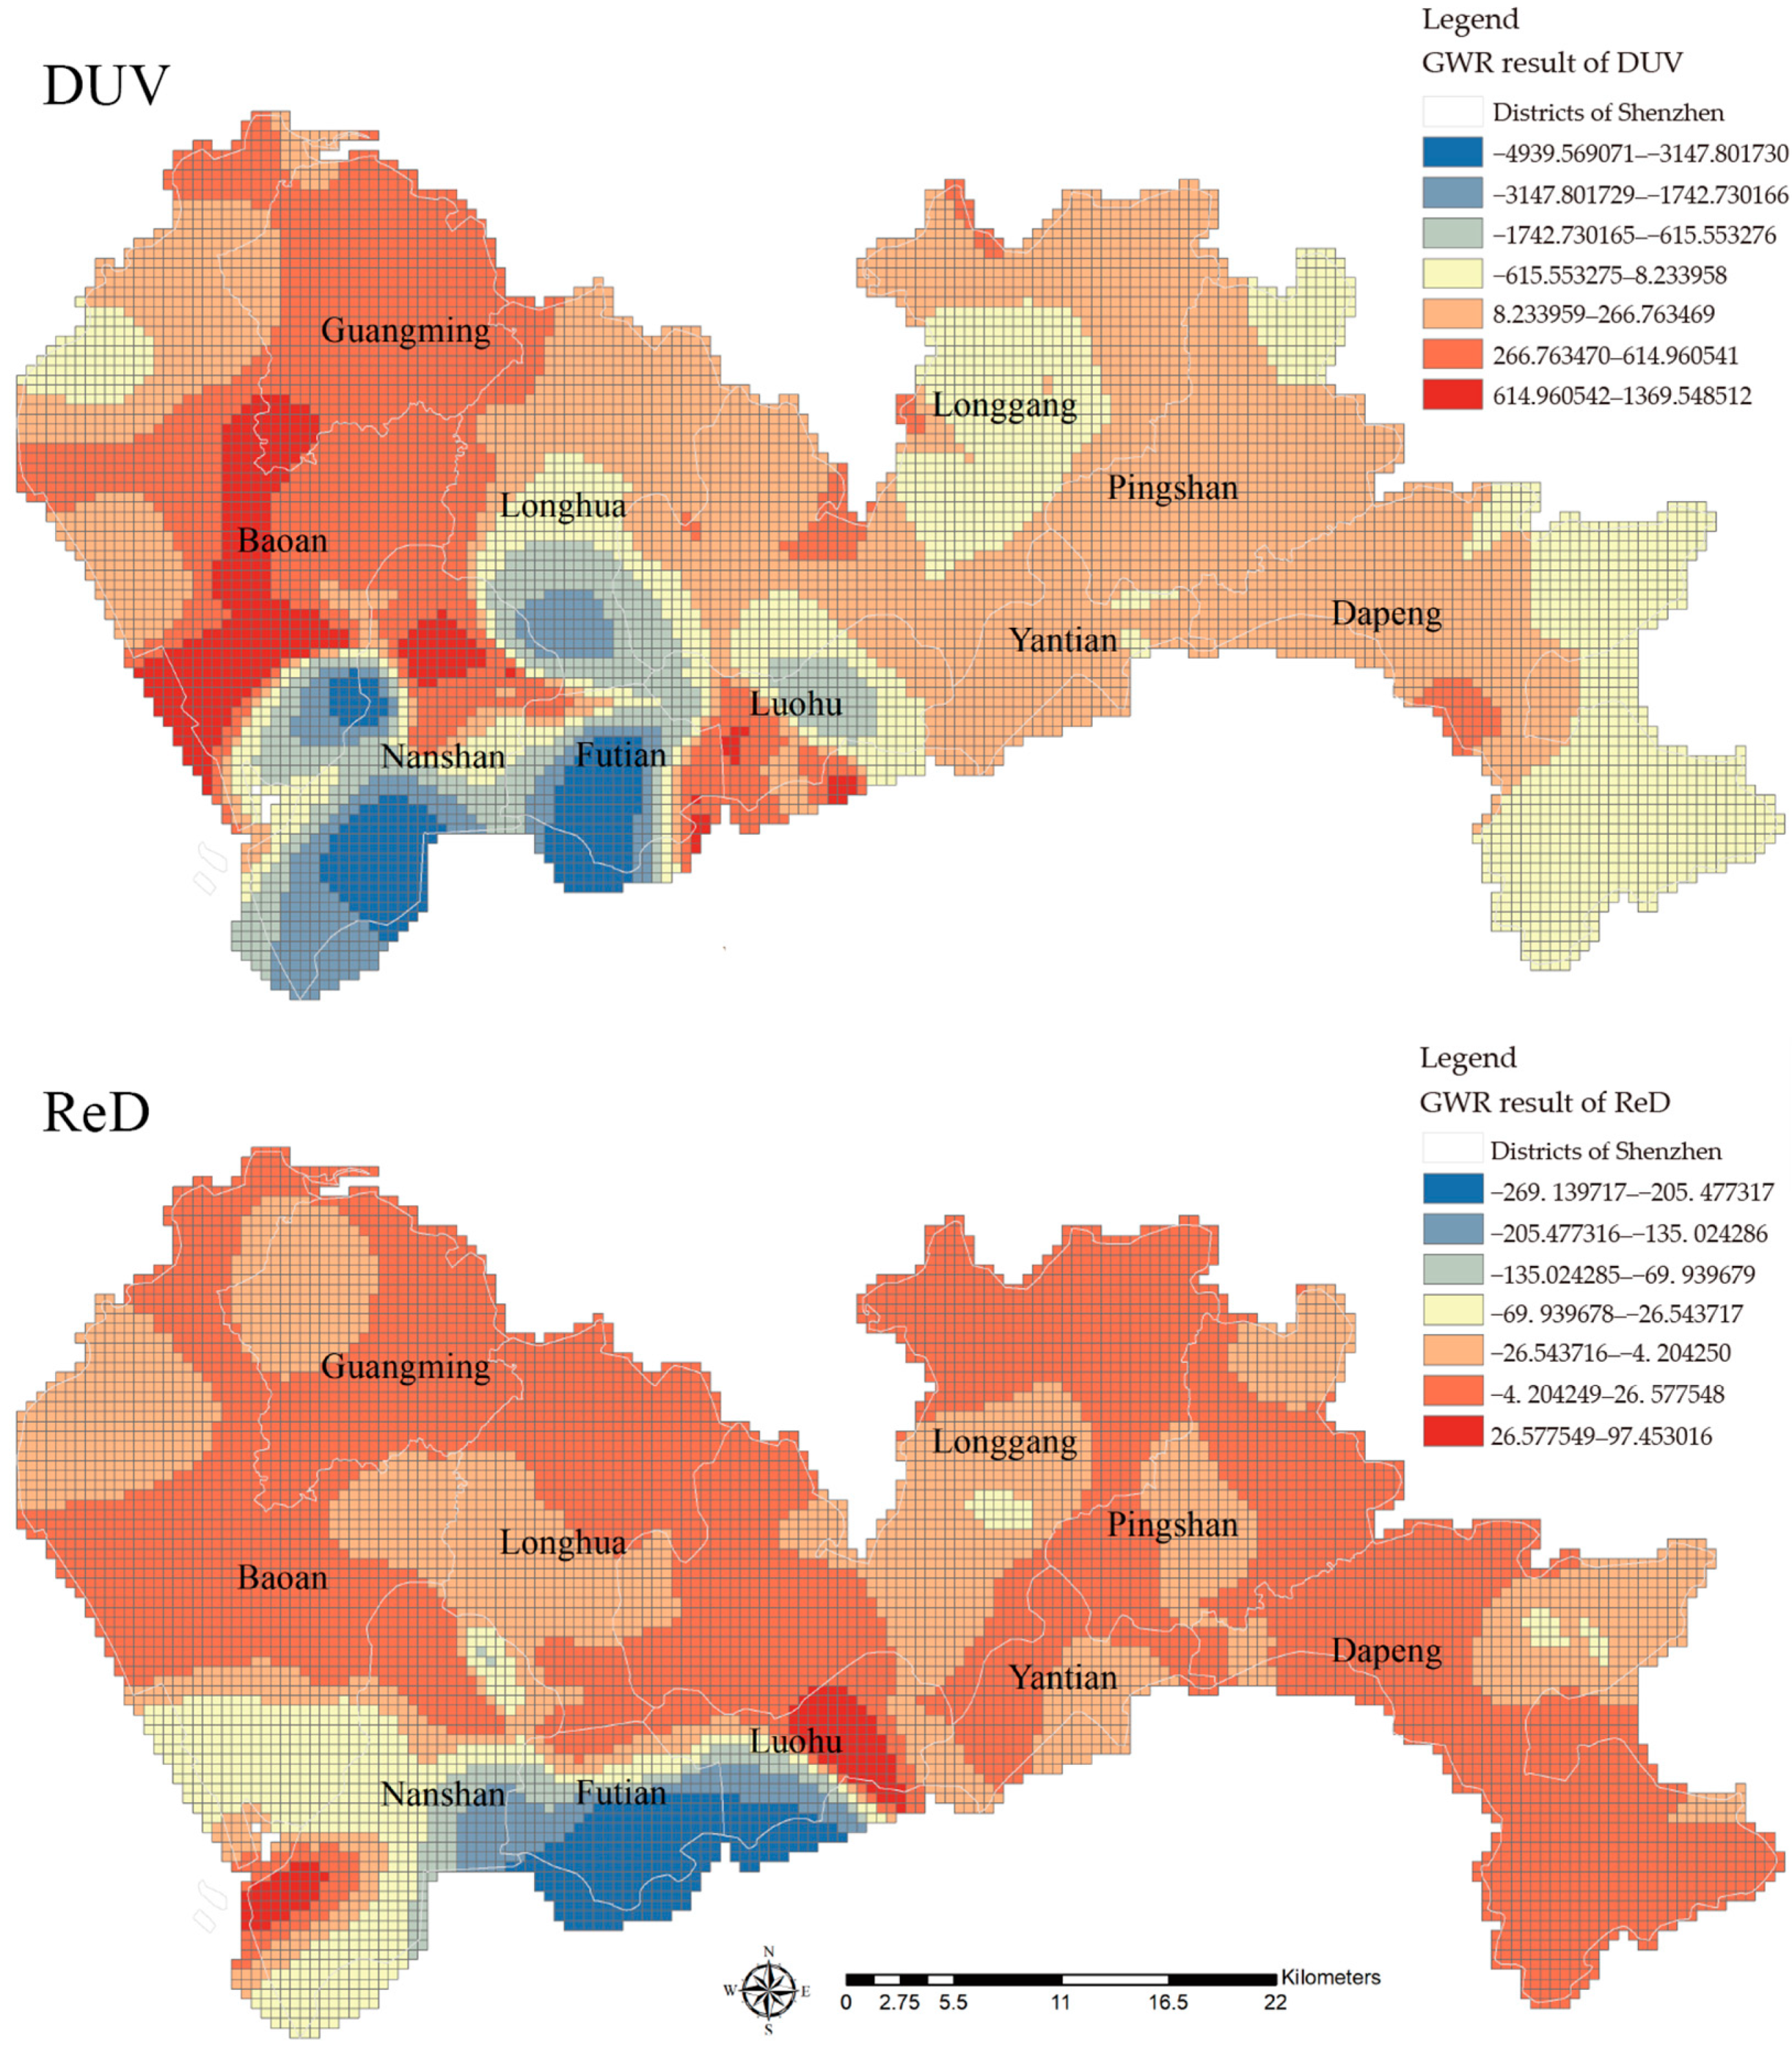
As shown in Figure 6, food (FoD), shopping (ShD), public services (PuSD), and health care (MeD) show a strong positive correlation (correlation coefficient r > 0.8). We, therefore, only selected the indicator shopping facilities (ShD) for modelling, reducing the problem of multicollinearity. Three aspects of other urban built environment factors were modelled and analyzed in relation to urban vitality; these aspects contained roads, transportation facilities, and building floor area in terms of form, were in proximity to urban villages in terms of urban village factors, and contained dining facilities, recreational facilities, housing, outdoor attractions, and sporting health in terms of function. Table 4 presents the results.
Table 4 displays the findings of a linear regression analysis with road network density (RND), transportation facilities (TFD), building density (BuD), distance from urban villages (DUV), shopping facilities (ShD), recreation and entertainment (REnD), residential (ReD), outdoor and recreation (ORD), and sports and leisure (SLD) as the independent variables and urban vitality as the dependent variable. The model R2 value of 0.334 implies that RND, TFD, BuD, DUV, ShD, REnD, ReD, ORD, and SLD can explain 33.4% of the variation in urban vitality. The regression model passed the F-test (F = 477.683, p < 0.05). P-values for the significance analysis of the eight explanatory variables of RND, TFD, BuD, DUV, ShD, REnD, ReD, and SLD on urban vitality were all less than 0.05, indicating that the indicators in three dimensions of urban form, urban village, and urban function had a significant impact on vitality. The regression coefficients of DUV and ReD were negative, indicating a negative effect of the variables on urban vitality, while RND, TFD, BuD, ShD, REnD, and SLD showed a significant positive effect on urban vitality. The ORD variable appeared non-significant (p = 0.7312) and was excluded.
The model was then optimized and further spatial regression models were used to lessen the influence of spatial autocorrelation [47]. The SLM model was selected because both the Robust LM (lag) and Robust LM (error) tests were significant; the Robust LM (lag) values were higher. This was determined via Lagrange multiplier tests for LM lag, LM error, Robust LM lag, and Robust LM error. Therefore, the SLM regression analysis was carried out with the dependent variable and urban vitality after excluding ORD. The results are shown in Table 5, where the model R2 value increased from 0.334 in Table 5 to 0.445, indicating a significant optimization of the SLM model compared to the OLS model. Seven variables—RND, TFD, DUV, ShD, REnD, ReD, and SLD—had a significant impact on vitality (p < 0.05), while building density had no significant effect on urban vitality (p = 0.6098). It is worth noting that road network density, transportation facilities, shopping facilities, recreation and entertainment, and sports and leisure facilities significantly increased urban vitality.

5.3. GWR Results

Geographically weighted regression (GWR) was used to estimate spatial heterogeneity using the factors strongly linked with urban dynamism in the SLM; the findings are reported in Table 6. An AIC of 141,859 and average adjusted R2 of 0.5899 indicate a high level of explanatory power. Compared to OLS and SLM, it displays a better model fit. The range of standardized residuals is [−18.14, 28.72], with approximately 95% at [−2, 2], indicating a good overall performance for GWR. The local R2 values ranged between 0.30 and 0.90, indicating that the GWR model effectively fit the data (Figure 7).

6. Discussion

6.1. Research Novelty: Reconstruct Definition of Urban Vitality and Establish Examine Model

There is not a single definition for urban vitality as groups from different social backgrounds have different understandings of this concept. The data sources of urban big data are rich and diverse and widely available for various economic social fields and sectors. With rich types and large quantities, big data can reflect the phenomena and problems in urban development in a more scientific way. By using urban big data in economic, social, and cultural aspects to describe urban vitality, it is found that the urban vitality in Shenzhen is distributed in multi-centered clusters. The central districts, such as Luohu, Futian, and Nanshan, have higher urban vitality indices; the vitality performance is also better in the central areas of some periphery districts, such as Bao’an, Longhua and Longgang, while the non-central areas of northern and eastern parts of Shenzhen show lower vitality areas, with an uneven distribution of urban vitality and a polycentric structure. This trend occurs because of the uneven development process of Shenzhen’s urban districts. On this basis, a system of factors influencing urban vitality in Shenzhen is constructed from three aspects: form, function, and atypical urban space. In order to understand the influencing factors of the regional differentiation of vitality in Shenzhen, the link between significant influencing factors and vitality is investigated using a geographically weighted regression (GWR) model.

6.2. Contribution: Finding of Positive and Negative Factor to Urban Vitality

The study obtained significant results for seven urban built environment factors (RND, TFD, DUV, ShD, REnD, ReD, and SLD) in three dimensions (urban form, urban village, and urban function). At the global level, Shenzhen’s urban vitality is strongly influenced by the accessible distance to urban villages (DUV) and the density of recreational facilities (REnD). A denser road network, public transportation stops, commercial facilities, entertainment/sports facilities, and leisure facilities attract more people. Resulting social activities can create more economic, social, and cultural vitality. On the other hand, distance to urban villages (DUV) and residential facilities density (ReD) shows a dampening effect on vitality.
Dense road networks (RND) are vital in promoting urban vitality; the small-scale neighborhoods formed by dense road networks are prone to promote human interaction on the streets [27]. This is consistent with previous research findings [63]. The possible reason for this is that as cities develop, roads not only function as commuting zones, but the U-shaped spaces of the streets are also increasingly converted into open spaces where people can rest and stay, increasing the vitality of the streets. This trend is aligned with China’s urban upper planning, which calls for the return of roads to pedestrians and promotes cities with small blocks and dense road networks. The impact of transportation facilities (TFD) suggests that more transportation facilities, such as subways and bus stops, can improve accessibility and promote urban vitality. This feature is more evident in Futian and Luohu districts (Figure 7).
The functional built environment indicators ShD, REnD, and SLD contribute significantly to the vitality of urban areas. The density of shopping facilities, leisure and recreation facilities, and sports and health facilities have a significant positive effect on urban vitality. This can be explained by the reality that individuals can more easily access these functional destinations to meet their daily needs, which aligned with the results of earlier research [64]. According to Figure 8, the increase in facilities in the central area of Shenzhen can result in a significant increase in urban vitality. A negative association between residential density and urban vitality is also shown in this study. Due to the mismatch between population and urban space, urban vitality is weaker in certain single-function residential areas [47]. This trend may occur because people expect more diverse and convenient services, such as shopping, transportation, leisure, and other facilities, to enrich their daily activities.
In addition, the study reveals a negative correlation between urban villages and urban vitality. It demonstrates that the closer a place is to the urban village, the more dynamic it will become. The reason for this trend is likely that urban villages usually have a poor living environment, high building and population density, and fewer supporting facilities. As a result, urban villages rarely become urban destinations and hardly generate urban dynamism. On this basis, GWR has expanded to explain the characteristics of spatial differentiation. The urban central area composed of Luohu, Nanshan, Futian, and Bao’an has lower vitality as it is closer to the urban village. On the contrary, in periphery districts such as Bao’an, Longhua, Guangming, and Longgang, villages often have a positive impact on urban vitality (Figure 9). Urban villages are significantly clustered and denser in these areas, providing possible spaces and places for various activities of urban development. Urban villages, as unique urban spaces, evoke a sense of identity related to place, which in turn enhances urban memory. Residential areas have a similarly negative impact on vitality in central districts; however, they have a positive effect on vitality in periphery districts (Figure 9).

6.3. Significance: Diverse Strategies to Develop Built Environment for Central Districts and Periphery Districts

The results of the spatial differentiation show clear boundaries between the highly developed urban centers and the less developed non-urban centers. The dynamism of the highly developed urban centers (Baoan, Luohu, Futian, and Nanshan) is dampened by the urban villages and residential areas, while the flourishing of other formal and functional elements of the built environment has a positive impact. The six underdeveloped non-central urban areas, however, have the opposite effect. Therefore, urban planners should avoid strategies of major demolition in urban regeneration construction in non-core areas, instead encouraging strategies that are more likely to stimulate urban vitality. This finding contributes to the achievement of more sustainable urban development goals.
Highly developed urban centers have a high level of vitality, which is depicted by the findings of some studies on the vitality of other cities [38]. For example, the study found that the high vitality areas in the main city of Xining are concentrated near shopping centers, pedestrian streets, rivers, and schools [65]. Due to their geographic advantages, metropolitan centers have more diverse urban design and regeneration policies when it comes to social, environmental, and economic variables. As an example, the city government of Kayseri proposes that in urban regeneration, a design quality standard approach should be developed according to the specific locational situation of the project, contributing to the revitalization of the city [66]. The case of Cairo proves the key role of changes in functional neighborhood on the perceived impact of people. Diverse activities stitch up the gaps between different urban forms [67], which explains the higher distribution of vitality in the city center.

7. Conclusions

One of the main goals of sustainable urban growth is to promote vitality, especially in the context of the gradual abandonment of rugged urbanization and increasing demand for quality urban space. As one of the first metropolises to undergo urbanization in China, the logic and phenotype behind Shenzhen’s urban development is worth studying. This study uses a multi-source urban dataset to give strong knowledge of urban vitality and analyses the results through an urban built environment dataset to validate the scientific validity of urban big data in perceiving urban space.
By merging economic, social, and cultural data, this research, using Shenzhen as a sample, re-evaluates the spatial patterning of urban vitality and its affecting elements and creates a comprehensive urban vitality indicator. A system is proposed by integrating urban built environment factors. The system consists of three dimensions (urban form, urban village, and urban function) including 12 indicators. The model and variables were progressively screened and, finally, a spatial lag model was used to explain the effects of built environment elements on vigor globally. The GWR model was then extended to analyze the factors influencing the spatial differentiation of vitality. The findings show that: (1) dense road networks, rich and diversified transportation facilities, dense commercial facilities, recreational facilities, and sports and leisure facilities are beneficial elements that promote urban liveliness. However, urban villages and residential compound have negative effects on urban liveliness, while building density has a minimal impact on a city’s vitality; (2) the built environment has a spatially heterogeneous impact on vitality. Thus, urban design strategies should be designed to maximize resource use for sustainable development in various places; and (3) the current urban form presents inhibiting influences between urban villages and vitality. The problem of urban villages deserves attention in terms of urban planning and design and there is an urgent need for scientific regeneration and development methods in both localized optimization and overall improvement.
As a conclusion, it is proposed that highly developed urban centers and underdeveloped urban peripheries should have different strategies for enhancing vitality in urban regeneration. A crude deconstruction of an urban village or an unplanned construction of a commercial facility will equally harm the heritage of the place and diminish its urban vitality. This paper focuses on environmental and sustainable development issues in society and has both academic and practical implications for sustainable urban development and planning. The findings give a better understanding of the current dynamics of China’s cities and identify and develop urban design strategies to optimize the allocation of resources for sustainable development in different regions. These insights can function as principles globally to support future urban planners, policymakers, and researchers interested in promoting sustainable urban development through vitality-based urban regeneration.

Author Contributions

Conceptualization, P.Z.; methodology, P.Z.; software, P.Z. and M.M.; validation, P.Z.; formal analysis, P.Z. and M.M.; investigation, P.Z.; resources, P.Z.; data curation, P.Z. and M.M.; writing—original draft preparation, P.Z.; writing—review and editing, P.Z.; visualization, P.Z.; supervision, H.F. and T.Z.; project administration, H.F. All authors have read and agreed to the published version of the manuscript.

Funding

This research received no external funding.

Institutional Review Board Statement

Not applicable.

Informed Consent Statement

Informed consent was obtained from all subjects involved in the study.

Data Availability Statement

The data presented in this study are available on request from the corresponding author. The data are not publicly available due to privacy concerns.

Acknowledgments

While writing of this article, I have received a great deal of support and assistance. I would first like to thank my supervisor, Hiroatsu Fukuda, whose expertise was invaluable in formulating the research questions and methodology. Fukuda’s insightful feedback pushed me to sharpen my thinking and improved the quality of my work. I would also like to acknowledge my teammate, Moheng Ma, for his wonderful data analysis capability and patient support. I would like to thank my tutors, Weijun Gao and Xindong Wei, for their valuable guidance throughout my studies, which helped me to choose the right direction and successfully complete this article. Finally, I would like to thank my parents and husband for their understanding and support.

Conflicts of Interest

The authors declare no conflict of interest.

References

  1. Li, S.; Wu, C.; Lin, Y.; Li, Z.; Du, Q. Urban Morphology Promotes Urban Vibrancy from the Spatiotemporal and Synergetic Perspectives: A Case Study Using Multisource Data in Shenzhen, China. Sustainability 2020, 12, 4829. [Google Scholar] [CrossRef]
  2. Chen, M.; Liu, W.; Lu, D.; Chen, H.; Ye, C. Progress of China’s new-type urbanization construction since 2014: A preliminary assessment. Cities 2018, 78, 180–193. [Google Scholar] [CrossRef]
  3. Bowen, K.J.; Cradock-Henry, N.A.; Koch, F.; Patterson, J.; Häyhä, T.; Vogt, J.; Barbi, F. Implementing the “Sustainable Development Goals”: Towards addressing three key governance challenges—Collective action, trade-offs, and accountability. Curr. Opin. Environ. Sustain. 2017, 26–27, 90–96. [Google Scholar] [CrossRef]
  4. Ye, Y.; Li, D.; Liu, X. How block density and typology affect urban vitality: An exploratory analysis in Shenzhen, China. Urban Geogr. 2017, 39, 631–652. [Google Scholar] [CrossRef]
  5. Xu, Y.; Chen, X. The spatial vitality and spatial environments of urban underground space (UUS) in metro area based on the spatiotemporal analysis. Tunn. Undergr. Space Technol. Inc. Trenchless Technol. Res. 2022, 123, 104401. [Google Scholar] [CrossRef]
  6. Xia, C.; Yeh, A.G.-O.; Zhang, A. Analyzing spatial relationships between urban land use intensity and urban vitality at street block level: A case study of five Chinese megacities. Landsc. Urban Plan. 2020, 193, 103669. [Google Scholar] [CrossRef]
  7. Jin, X.; Long, Y.; Sun, W.; Lu, Y.; Yang, X.; Tang, J. Evaluating cities’ vitality and identifying ghost cities in China with emerging geographical data. Cities 2017, 63, 98–109. [Google Scholar] [CrossRef]
  8. Chen, W.; Wu, A.N.; Biljecki, F. Classification of urban morphology with deep learning: Application on urban vitality. Comput. Environ. Urban Syst. 2021, 90, 101706. [Google Scholar] [CrossRef]
  9. Liu, K.; Yin, L.; Lu, F.; Mou, N. Visualizing and exploring POI configurations of urban regions on POI-type semantic space. Cities 2020, 99, 102610. [Google Scholar] [CrossRef]
  10. Yang, S.; van Oostrum, M. The self-governing redevelopment approach of Maquanying: Incremental socio-spatial transformation in one of Beijing’s urban villages. Habitat Int. 2020, 104, 102235. [Google Scholar] [CrossRef]
  11. Ramyar, R. Nudging spirituality in environmental behavior. Cities 2021, 109, 103030. [Google Scholar] [CrossRef]
  12. Liu, G.; Wei, L.; Gu, J.; Zhou, T.; Liu, Y. Benefit distribution in urban renewal from the perspectives of efficiency and fairness: A game theoretical model and the government’s role in China. Cities 2020, 96, 102422. [Google Scholar] [CrossRef]
  13. Figueiredo, Y.D.d.S.; Prim, M.A.; Dandolini, G.A. Urban regeneration in the light of social innovation: A systematic integrative literature review. Land Use Policy 2022, 113, 105873. [Google Scholar] [CrossRef]
  14. Sun, X.; Wang, L.; Wang, F.; Soltani, S. Behaviors of seniors and impact of spatial form in small-scale public spaces in Chinese old city zones. Cities 2020, 107, 102894. [Google Scholar] [CrossRef]
  15. Liu, R.; Guo, H.; Liu, R.; Wang, H.; Tang, D.; Deng, Z. Structural design and optimization of large cable–rib tension deployable antenna structure with dynamic constraint. Acta Astronaut. 2018, 151, 160–172. [Google Scholar] [CrossRef]
  16. Liu, R.; Wong, T.-C. Urban village redevelopment in Beijing: The state-dominated formalization of informal housing. Cities 2018, 72, 160–172. [Google Scholar] [CrossRef]
  17. van Oostrum, M. Urbanizing villages: Informal morphologies in Shenzhen’s urban periphery. J. Urban Des. 2018, 23, 732–748. [Google Scholar] [CrossRef]
  18. Davis, H.; Brown, M. Resilient Urban Morphologies and Grassroots Economic Development: Preliminary Results of Fieldwork in Guangzhou, China; International Seminar on Urban Form (ISUF): Belgrade, Serbia, 2011; 29p. [Google Scholar]
  19. Hao, P.; Geertman, S.; Hooimeijer, P.; Sliuzas, R. Spatial Analyses of the Urban Village Development Process in Shenzhen, China. Int. J. Urban Reg. Res. 2013, 37, 2177–2197. [Google Scholar] [CrossRef]
  20. Wu, F.; Li, L.-H.; Han, S. Social Sustainability and Redevelopment of Urban Villages in China: A Case Study of Guangzhou. Sustainability 2018, 10, 2116. [Google Scholar] [CrossRef]
  21. Pan, W.; Du, J. Towards sustainable urban transition: A critical review of strategies and policies of urban village renewal in Shenzhen, China. Land Use Policy 2021, 111, 105744. [Google Scholar] [CrossRef]
  22. Conzen, M.R.G. Alnwick, Northumberland: A Study in Town-Plan Analysis; Transactions and Papers (Institute of British Geographers); Wiley: Hoboken, NJ, USA, 1960; Volume 27, p. iii+ix-xi+1+3-122. [Google Scholar] [CrossRef]
  23. Paumier, C. Creating a Vibrant City Center; Urban Land Institute: Washington DC, USA, 2004. [Google Scholar]
  24. Yang, J.; Cao, J.; Zhou, Y. Elaborating non-linear associations and synergies of subway access and land uses with urban vitality in Shenzhen. Transp. Res. Part A Policy Pract. 2021, 144, 74–88. [Google Scholar] [CrossRef]
  25. Talpur, M.A.H.; Napiah, M.; Chandio, I.A.; Qureshi, T.A.; Khahro, S.H. Development of a Regional Transport Policy Support System for Rural Planning Agencies in Developing World. Procedia Eng. 2014, 77, 2–10. [Google Scholar] [CrossRef]
  26. Wirth, L. Urbanism as a Way of Life. Am. J. Sociol. 1938, 44, 217913. [Google Scholar] [CrossRef]
  27. Jacobs, J. The Death and Life of Great American Cities; Random House: New York, NY, USA, 1961. [Google Scholar]
  28. Montgomery, J. Making a city: Urbanity, vitality and urban design. J. Urban Des. 1998, 3, 93–116. [Google Scholar] [CrossRef]
  29. Delafons, J.J.C. The New Urbanism: Toward an Architecture of Community; McGraw-Hill: New York, NY, USA, 1994; Volume 11, pp. 342–343. [Google Scholar]
  30. Chung, H.; Lee, J. Community Cultural Resources as Sustainable Development Enablers: A Case Study on Bukjeong Village in Korea compared with Naoshima Island in Japan. Sustainability 2019, 11, 1401. [Google Scholar] [CrossRef]
  31. Gong, P.; Chen, B.; Li, X.; Liu, H.; Wang, J.; Bai, Y.; Chen, J.; Chen, X.; Fang, L.; Feng, S.; et al. Mapping essential urban land use categories in China (EULUC-China): Preliminary results for 2018. Sci. Bull. 2020, 65, 182–187. [Google Scholar] [CrossRef]
  32. Chen, B.; Tu, Y.; Song, Y.; Theobald, D.M.; Zhang, T.; Ren, Z.; Li, X.; Yang, J.; Wang, J.; Wang, X.; et al. Mapping essential urban land use categories with open big data: Results for five metropolitan areas in the United States of America. ISPRS J. Photogramm. Remote Sens. 2021, 178, 203–218. [Google Scholar] [CrossRef]
  33. Ying, L.; Kang, W. Simulating Block-Level Urban Expansion for National Wide Cities. Sustainability 2017, 9, 879. [Google Scholar] [CrossRef]
  34. Chen, Z.; Dong, B.; Pei, Q.; Zhang, Z. The impacts of urban vitality and urban density on innovation: Evidence from China’s Greater Bay Area. Habitat Int. 2022, 119, 102490. [Google Scholar] [CrossRef]
  35. Yue, W.; Chen, Y.; Thy, P.T.M.; Fan, P.; Liu, Y.; Zhang, W. Identifying urban vitality in metropolitan areas of developing countries from a comparative perspective: Ho Chi Minh City versus Shanghai. Sustain. Cities Soc. 2021, 65, 102609. [Google Scholar] [CrossRef]
  36. Williams, S.; Xu, W.; Tan, S.B.; Foster, M.J.; Chen, C. Ghost cities of China: Identifying urban vacancy through social media data. Cities 2019, 94, 275–285. [Google Scholar] [CrossRef]
  37. Meng, Y.; Xing, H. Exploring the relationship between landscape characteristics and urban vibrancy: A case study using morphology and review data. Cities 2019, 95, 102389. [Google Scholar] [CrossRef]
  38. Tu, W.; Zhu, T.; Xia, J.; Zhou, Y.; Lai, Y.; Jiang, J.; Li, Q. Portraying the spatial dynamics of urban vibrancy using multisource urban big data. Comput. Environ. Urban Syst. 2020, 80, 101428. [Google Scholar] [CrossRef]
  39. Lan, F.; Gong, X.; Da, H.; Wen, H. How do population inflow and social infrastructure affect urban vitality? Evidence from 35 large- and medium-sized cities in China. Cities 2020, 100, 102454. [Google Scholar] [CrossRef]
  40. Hu, S.; Xu, Y.; Wu, L.; Wu, X.; Wang, R.; Zhang, Z.; Lu, R.; Mao, W. A framework to detect and understand thematic places of a city using geospatial data. Cities 2021, 109, 103012. [Google Scholar] [CrossRef]
  41. Yue, Y.; Zhuang, Y.; Yeh, A.G.O.; Xie, J.-Y.; Ma, C.-L.; Li, Q.-Q. Measurements of POI-based mixed use and their relationships with neighbourhood vibrancy. Int. J. Geogr. Inf. Sci. 2016, 31, 658–675. [Google Scholar] [CrossRef]
  42. Wu, J.; Lu, Y.; Gao, H.; Wang, M. Cultivating historical heritage area vitality using urban morphology approach based on big data and machine learning. Comput. Environ. Urban Syst. 2022, 91, 101716. [Google Scholar] [CrossRef]
  43. Ferreira, J.; Ferreira, C.; Bos, E. Spaces of consumption, connection, and community: Exploring the role of the coffee shop in urban lives. Geoforum 2021, 119, 21–29. [Google Scholar] [CrossRef]
  44. Braun, L.M.; Malizia, E. Downtown vibrancy influences public health and safety outcomes in urban counties. J. Transp. Health 2015, 2, 540–548. [Google Scholar] [CrossRef]
  45. Zhang, A.; Li, W.; Wu, J.; Lin, J.; Chu, J.; Xia, C.J.E. How can the urban landscape affect urban vitality at the street block level? A case study of 15 metropolises in China. Environ. Plan. B 2021, 48, 1245–1262. [Google Scholar] [CrossRef]
  46. Pan, W.; Du, J. Impacts of urban morphological characteristics on nocturnal outdoor lighting environment in cities: An empirical investigation in Shenzhen. Build. Environ. 2021, 192, 107587. [Google Scholar] [CrossRef]
  47. Li, X.; Li, Y.; Jia, T.; Zhou, L.; Hijazi, I.H. The six dimensions of built environment on urban vitality: Fusion evidence from multi-source data. Cities 2022, 121, 103482. [Google Scholar] [CrossRef]
  48. Martino, N.; Girling, C.; Lu, Y. Urban form and livability: Socioeconomic and built environment indicators. Build. Cities 2021, 2, 220–243. [Google Scholar] [CrossRef]
  49. Dziauddin, M.F. Estimating land value uplift around light rail transit stations in Greater Kuala Lumpur: An empirical study based on geographically weighted regression (GWR). Res. Transp. Econ. 2019, 74, 10–20. [Google Scholar] [CrossRef]
  50. Delclòs-Alió, X.; Gutiérrez, A.; Miralles-Guasch, C. The urban vitality conditions of Jane Jacobs in Barcelona: Residential and smartphone-based tracking measurements of the built environment in a Mediterranean metropolis. Cities 2019, 86, 220–228. [Google Scholar] [CrossRef]
  51. Wu, C.; Ye, X.; Ren, F.; Du, Q. Check-in behaviour and spatio-temporal vibrancy: An exploratory analysis in Shenzhen, China. Cities 2018, 77, 104–116. [Google Scholar] [CrossRef]
  52. Wang, K.; Yuan, Y.; Chen, M.; Wang, D. A POIs based method for determining spatial distribution of urban fire risk. Process Saf. Environ. Prot. 2021, 154, 447–457. [Google Scholar] [CrossRef]
  53. Yuan, N.J.; Zhang, F.; Lian, D.; Zheng, K.; Yu, S.; Xie, X. We know how you live: Exploring the spectrum of urban lifestyles. In Proceedings of the COSN ’13, Boston, MA, USA, 7–8 October 2013. [Google Scholar]
  54. Sulis, P.; Manley, E.; Zhong, C.; Batty, M. Using mobility data as proxy for measuring urban vitality. J. Spat. Inf. Sci. 2018, 16, 384. [Google Scholar] [CrossRef]
  55. Chen, T.; Hui, E.C.M.; Wu, J.; Lang, W.; Li, X. Identifying urban spatial structure and urban vibrancy in highly dense cities using georeferenced social media data. Habitat Int. 2019, 89, 102005. [Google Scholar] [CrossRef]
  56. Guo, X.; Yang, Y.; Cheng, Z.; Wu, Q.; Li, C.; Lo, T.; Chen, F. Spatial social interaction: An explanatory framework of urban space vitality and its preliminary verification. Cities 2022, 121, 103487. [Google Scholar] [CrossRef]
  57. Currid, E. Symposium Introduction-Art and Economic Development: New Directions for the Growth of Cities and Regions. J. Plan. Educ. Res. 2010, 29, 257–261. [Google Scholar] [CrossRef]
  58. Montalto, V.; Tacao Moura, C.J.; Langedijk, S.; Saisana, M. Culture counts: An empirical approach to measure the cultural and creative vitality of European cities. Cities 2019, 89, 167–185. [Google Scholar] [CrossRef]
  59. Shannon, C.E. A mathematical theory of communication. Bell Syst. Tech. J. 1948, 27, 379–423. [Google Scholar] [CrossRef]
  60. Lai, Y.; Chan, E.H.W.; Choy, L. Village-led land development under state-led institutional arrangements in urbanising China: The case of Shenzhen. Urban Stud. 2016, 54, 1736–1759. [Google Scholar] [CrossRef]
  61. Wang, Y.P. Urban Villages, Their Redevelopment and Implications for Inequality and Integration. In Urban Inequality and Segregation in Europe and China: Towards a New Dialogue; Pryce, G., Wang, Y.P., Chen, Y., Shan, J., Wei, H., Eds.; Springer International Publishing: Cham, Stwitzerland, 2021; pp. 99–120. [Google Scholar]
  62. Talpur, M.A.H.; Khahro, S.H.; Ali, T.H.; Waseem, H.B.; Napiah, M. Computing travel impendences using trip generation regression model: A phenomenon of travel decision-making process of rural households. Environ. Dev. Sustain. 2022. [Google Scholar] [CrossRef]
  63. Wu, J.; Ta, N.; Song, Y.; Lin, J.; Chai, Y. Urban form breeds neighborhood vibrancy: A case study using a GPS-based activity survey in suburban Beijing. Cities 2018, 74, 100–108. [Google Scholar] [CrossRef]
  64. Im, H.N.; Choi, C.G. The hidden side of the entropy-based land-use mix index: Clarifying the relationship between pedestrian volume and land-use mix. Urban Stud. 2018, 56, 1865–1881. [Google Scholar] [CrossRef]
  65. Guo, X.; Chen, H.; Yang, X. An Evaluation of Street Dynamic Vitality and Its Influential Factors Based on Multi-Source Big Data. ISPRS Int. J. Geo-Inf. 2021, 10, 143. [Google Scholar] [CrossRef]
  66. Koçak Güngör, M.; Bostancı, B.; Yılmaz Bakır, N.; Doğan, U. Investigation of Urban Design Approaches in Renewal Areas with Hybrid Decision Model. Sustainability 2022, 14, 10543. [Google Scholar] [CrossRef]
  67. Elshater, A.; Abusaada, H.; Tarek, M.; Afifi, S. Designing the socio-spatial context: Urban infill, liveability, and conviviality. Built Environ. 2022, 48, 341–363. [Google Scholar] [CrossRef]
Figure 1. Shenzhen’s administrative divisions.
Sustainability 15 06869 g001
Figure 2. Spatial distribution of urban vitality (V value) in Shenzhen.
Sustainability 15 06869 g002
Figure 3. (a). Spatial distribution of built environment variables in Shenzhen. (b). Spatial distribution of built environment variables in Shenzhen.
Sustainability 15 06869 g003aSustainability 15 06869 g003b
Figure 4. Global Moran’s I of urban vitality value in Shenzhen.
Sustainability 15 06869 g004
Figure 5. Local indicator of spatial association (LISA) map of urban vitality.
Sustainability 15 06869 g005
Figure 6. Correlation matrix of dependent variable.
Sustainability 15 06869 g006
Figure 7. Spatial distribution of GWR model regression coefficients for road network density (RND) and transportation facility density (TFD).
Sustainability 15 06869 g007
Figure 8. Spatial distribution of GWR model regression coefficients for shopping facilities density (ShD), recreation and entertainment density (REnD), and sports and leisure density (SLD).
Sustainability 15 06869 g008
Figure 9. Spatial distribution of GWR model regression coefficients for distance from urban villages (DUV) and residential facility density (ReD).
Sustainability 15 06869 g009
Table 1. Sources of data used in this study.
DataData SourceData Period
POI dataAmap. Available at: https://lbs.amap.com/ (accessed on 26 January 2022)2021
Urban form dataOpenStreetMap. Available at: https://www.openstreetmap.org (accessed on 15 February 2022)2022
PopulationShenzhen Planning and Natural Resources Bureau2022
Comments dataDianping. Available at: https://www.dianping.com/ (accessed on 21 February 2022)2017
Shared bike dataShenzhen Government Data Open Platform. Available at: https://opendata.sz.gov.cn/ (accessed on 15 February 2022)2021
Landsat RS imageNational Earth System Science Data Center. Available at: http://www.geodata.cn/ (accessed on 21 February 2022)2022
Urban village dataAmap. Available at: https://lbs.amap.com/ (accessed on 26 January 2022)2021
Table 2. Description of indicators for urban vitality.
ComponentNameDescription
Economic vitalityCompany densityThe number of companies divided by the space unit area, reflecting the distribution of enterprises
Comments numberThe total comments number of amenities in the unit
Social vitalityPopulation densityPopulation divided by space unit area, reflecting population characteristics
Shared bike dataWeekly average density of shared bike arrivals per hour in the unit
Cultural vitalityCultural facilities density (science/culture & education services)Cultural facility POI density of space unit
Table 3. Description of indicators for built environment.
ComponentVariablesDescriptionMeanStd.MaxMin
Urban formRoad network density (RND)The total length of roads in the space unit divided by the area of the unit1541.971785.7015,639.500.00
Transportation facilities density (TFD)The total number of transportation facilities in a unit divided by the area of the unit4.659.14118.000.00
Building density (BuD)The total area of building footprints in a unit divided by the area of the unit363,834.56607,483.345,834,529.170.00
Urban villageDistance from urban villages (DUV)The straight-line distance from the centroid of the space unit to the nearest urban village0.110.130.750.00
POIFood facilities density (FoD)The total number of food facilities in a unit divided by the area of the unit14.6434.49415.000.00
Shopping facilities density (ShD)The total number of shopping facilities in a unit divided by the area of the unit19.7547.971112.000.00
Public service facilities density (PuSD)The total number of public service facilities in a unit divided by the area of the unit10.0721.14236.000.00
Recreation & Entertainment density (REnD)The total number of recreation & entertainment facilities in a unit divided by the area of the unit0.832.3472.000.00
Residential facilities density (ReD)The total number of residential facilities in a unit divided by the area of the unit3.596.99164.000.00
Medical facilities density (MeD)The total number of medical facilities in a unit divided by the area of the unit2.495.9862.000.00
Outdoor and recreation density (ORD)The total number of POIs in the outdoor and recreation category divided by the area of the unit0.472.0174.000.00
Sports and leisure density (SLD)The total number of sports and leisure in a unit divided by the area of the unit0.892.1629.000.00
Table 4. Result of OLS model.
VariableCoefficientStd. Errort-StatisticProbabilityModel Diagnosis
CONSTANT−74.071818.525−3.99850.0000R2 = 0.3340
Adjusted R2 = 0.3333
LogL = −72,861.6
AIC = 145,743
F = 477.683
p = 0
RND0.05950.00916.51490.0000
TFD36.47482.570314.19090.0000
BuD0.00010.00003.88820.0001
DUV−887.301126.55−7.01150.0000
ShD4.13200.42559.71030.0000
REnD195.6178.241423.7360.0000
ReD−45.63592.9904−15.26090.0000
ORD−2.21766.4593−0.34330.7312
SLD81.02219.01968.98290.0000
Table 5. Result of SLM model.
VariableCoefficientStd. Errort-StatisticProbabilityModel Diagnosis
CONSTANT−29.614516.9158−1.75070.0800R2 = 0.4451
LogL = −72,260.6
AIC = 144,541
p = 0
RND0.02140.00832.56250.0104
TFD14.72712.37136.21070.0000
BuD0.00000.00000.51040.6098
DUV−834.246115.517−7.22180.0000
ShD4.74880.389012.20790.0000
REnD161.5017.514421.49220.0000
ReD−38.3822.7266−14.07670.0000
SLD70.53868.24148.55910.0000
Table 6. Result of GWR model.
VariableMeanStdMinMaxModel Diagnosis
RND0.02030.0568−0.09500.3329R2 = 0.6146
Adjusted R2 = 0.5899
LogL = −72,260.6
AIC = 141,859
TFD8.360717.8053−80.626898.4331
DUV−130.8055921.8018−4939.56911369.5485
ShD4.62238.4785−3.661143.3419
REnD68.1365138.6568−189.3592824.1901
ReD−15.813049.0429−269.139797.4530
SLD34.805464.5109−81.1455479.9015
Disclaimer/Publisher’s Note: The statements, opinions and data contained in all publications are solely those of the individual author(s) and contributor(s) and not of MDPI and/or the editor(s). MDPI and/or the editor(s) disclaim responsibility for any injury to people or property resulting from any ideas, methods, instructions or products referred to in the content.

