Article

Research on Indoor Thermal Environment Analysis and Optimization Strategy of Rural Dwellings around Xi’an Based on PET Evaluation

School of Human Settlements and Civil Engineering, Xi’an Jiaotong University, Xi’an 710049, China
*
Author to whom correspondence should be addressed.
Sustainability 2023, 15(10), 7889; https://doi.org/10.3390/su15107889
Submission received: 22 March 2023 / Revised: 4 May 2023 / Accepted: 9 May 2023 / Published: 11 May 2023
(This article belongs to the Collection Urban Planning and Built Environment)

Abstract

:
Rural dwellings are an important group of residential buildings in China. With the continuous development of rural construction in China, the contradiction between the pursuit of a simple material space and the villagers’ demand for living quality, especially the indoor thermal comfort of rural dwellings, has become increasingly prominent. Therefore, it is particularly important to study the optimization strategies of the indoor thermal environment in rural dwellings. Current research on optimizing the indoor thermal environment of rural dwellings mainly focuses on analyzing the impact of individual factors, such as the envelope structures, building constructions, and building technology applications, but there is a lack of strategy development based on the comprehensive evaluation. This study aims to analyze the combined effects of multiple design elements on the indoor thermal environment and propose a comprehensive optimization strategy for rural dwellings. This study selects the rural dwellings around Xi’an as an example and establishes a basic model of the rural dwellings around Xi’an through field investigation and software simulation. Then, through univariate and compound-variable simulations, we analyze the influence of changes in passive architectural design indicators on the indoor physiological equivalent temperature (PET) of rural dwellings and obtain a comprehensive design indicator optimization strategy. This strategy can improve the indoor thermal comfort in winter and summer, especially in winter, achieving an average increase of 4.17 °C in the winter PET value and an average decrease of 0.66 °C in summer. This provides a reference for the design and renovation of rural dwellings in Xi’an and other rural areas in the cold regions of China.

1. Introduction

1.1. Overview of Rural Dwelling Development

Rural dwellings are the main body of rural settlements and an important group of residential buildings [1]. In 2020, the national rural residential area accounted for approximately 61.23% of the total rural construction area in China [2]. With China’s urbanization and new rural construction, the living standards in rural areas have been continuously improved [3], and rural residential construction has achieved good results. In 2020, the area of new and rebuilt rural residential buildings totaled 756 million square meters, the per capita residential building area reached 34.3 square meters [2], and the per capita disposable income reached 17,131.5 yuan [4]. However, the current rural construction process still focuses on the construction of the physical space [5], and pays less attention to the quality of the living space [6]. The contradiction between this situation and the villagers’ increasing pursuit of quality of life is becoming increasingly serious [7]. Most of the current rural dwellings are houses self-built by villagers, accounting for approximately 89% [8], and a few are new houses planned and constructed by local governments and design units in the process of new rural construction [9]. Due to the lack of design resources in the self-built houses of the villagers [10], the self-built houses pay more attention to the appearance and shape, while ignoring the comfort of the indoor environment [11]. Designers often give priority to economy in the process of planning and design, and do not pay sufficient attention to the regional environment and indoor comfort of the planned houses [12]. This has led to the neglect of thermal comfort factors in rural dwellings, especially the inability to scientifically grasp the changing relationship of the indoor thermal environment of rural dwellings under different design conditions, so that it is impossible to effectively formulate corresponding optimal design strategies for different conditions [13]. This is an urgent problem that needs to be solved in the current rural housing construction context, and it is also particularly important for the comprehensive realization of a beautiful and livable rural revitalization strategy [14].

1.2. Research on the Indoor Thermal Environment of Rural Dwellings

Aiming at the neglect of the indoor thermal environment in the development of rural dwellings, related research is also gradually being carried out [15]. China’s research on residential thermal environment-related issues is mainly focused on urban dwellings. The research on the thermal environment of urban dwellings has made a great deal of progress, and a large number of optimization strategies have been proposed [16]. Existing research mainly includes the following:
  • Optimization of the design of the spatial layout, material structure, and facilities of urban residential buildings [17,18].
  • Analysis of the influence of factors such as the scale, floor area ratio, and greening conditions of urban residential areas on the indoor thermal environment of residential buildings [19,20].
  • Research on passive low-energy houses and near-zero-energy houses in response to the national green building development plan [21,22].
With the development of new rural construction and the emergence of indoor thermal environment problems in rural dwellings, many scholars have also turned their research attention to rural areas, conceiving ideas and experimenting to apply the research and optimization methods of urban residences to rural residences [23]. However, rural dwellings are quite different from urban dwellings in terms of building site selection, orientation, spatial layout, building materials, and structure selection due to the strong regional characteristics and the fact that most of them are built independently by villagers. This leads to the inapplicability of many existing research methods, and the relatively shallow development of related research [24].
Research on the indoor thermal environment of rural dwellings can be roughly divided into two aspects: analyzing the influence of housing design elements on the indoor thermal environment and analyzing the design characteristics suitable for the climate environment of the rural area [25]. In terms of analyzing the influence of housing design elements on the indoor thermal environment, Shao et al. [26] conducted a study on the impact of parameterized changes in the thickness of insulation layers under multiple building envelope structures on the indoor thermal environment, energy-saving effects, and economic costs of rural dwellings throughout their lifecycle. They determined the optimal thickness of insulation layers for three different life spans of 10, 20, and 30 years. Chi et al. [27] compared the effects of different orientations and window-to-wall ratios on the indoor temperature and air velocity of rural dwellings, and determined the optimal window-to-wall ratio range for each orientation, with a span of 20°. Zhang et al. [28] studied the effects of various types of attached sunrooms on the indoor temperature, energy efficiency, and cost of rural dwellings, and selected the most suitable sunroom structure for the local climate environment. Compared with dwellings without sunrooms, the optimized indoor temperature increased by 2.38 °C, and the energy-saving rate was 44.8%. Zhang et al. [29] conducted an experimental study on the indoor air temperature and CO2 concentration of rural dwellings using six different mechanical ventilation methods, and determined the best air supply mode for improving the indoor thermal environment and air quality. Overall, current research mainly focuses on the analysis of single elements, such as the envelope structures, building constructions, and building technology applications, but there is a lack of strategy development based on the comprehensive evaluation.
In terms of analyzing the design characteristics of regional rural dwellings, the research regions are mainly divided into the cold and severely cold regions of Northern China and the hot summer and cold winter regions of Southern China [30]. Among them, the cold and severely cold regions not only occupy a large geographical area in China, but the main research focus is also on improving the indoor thermal environment in winter and optimizing heating energy consumption. This is closely related to China’s development of energy-efficient buildings and green architecture, and therefore receives great attention [31]. In the cold and severely cold regions, the northwest region is particularly affected due to its location deep inland and its high terrain, leading to arid climate conditions. Additionally, the low economic level limits its rural development, resulting in the poor thermal performance of residential buildings, and particularly severe indoor thermal environment problems in rural dwellings [32]. Xi’an, as the most economically developed city in the northwest region, has seen rapid growth in rural housing construction in recent years, resulting in a widespread phenomenon of new construction and renovation in surrounding rural areas. In 2020, the construction area of rural housing in Xi’an was approximately 4.0733 million square meters, an increase of approximately 27.87% compared to 2019 [33].
In summary, current research on the analysis and optimization of the indoor and outdoor environments of rural dwellings has focused more on the analysis of single design elements, but lacks a comprehensive analysis of multiple design elements, such as the floor space, building area, building form, and roof form. The optimization strategies derived from these studies are often one-sided and cannot form a complete set of design optimization strategies [34]. Therefore, further research is needed on how to identify and extract multiple design elements and analyze their degrees of influence on the indoor thermal environment of housing, in order to derive comprehensive optimization strategies for rural dwellings. In the research on the design characteristics of regional rural dwellings, the characteristics of rural dwellings in the northwest region and the surrounding rural areas of Xi’an have great research value. However, due to the constraints of economic development and other practical factors, relevant research is difficult to carry out, and research on optimization strategies for the indoor thermal environment is even scarcer [35].
Therefore, this study selected rural dwellings around Xi’an as the research object. By combining a field investigation and data analysis, the study analyzed the influence of design elements on the indoor thermal environment of houses, and proposed comprehensive design strategies that could optimize the indoor thermal environment, providing design references for future rural construction projects.

1.3. Current Situation of Rural Dwellings around Xi’an

The rural dwellings around Xi’an are mostly in the form of narrow courtyards of traditional Guanzhong houses. In terms of the spatial layout, the traditional homestead is a long and narrow rectangle with a length-to-width ratio of about 2:1 [36,37]. The short side of the homestead is located along the village road. The courtyard is composed of a gatehouse near the courtyard gate, flanking houses on both sides, and a main house on the inner side [37]. The main house is the primary living space and includes a living room and bedrooms. The interior of the main house has a three-bay layout, with the living room in the center and the bedrooms on both sides. The gatehouse and flanking houses are auxiliary rooms that include storerooms, kitchens, and washrooms [38]. With the development of rural areas in Xi’an, the dwellings have roughly retained the original spatial layout, while the gatehouse and flanking houses have gradually simplified and merged [39]. The common spatial form of existing dwellings is shown in Figure 1. In terms of spatial dimensions, the width of the existing residential homestead is mostly 9–10 m, and the length is about 20 m. The width of each bay of the main house is mostly 3 m, and some of the central bays are widened. The length of the main house is mostly 5–7 m. The width of the auxiliary rooms is mostly 3 m [37].
In terms of the building structure, traditional dwellings are made of raw soil and mostly have one floor. The roof of traditional dwellings is the pitched roof or semi-pitched roof unique to Guanzhong dwellings [40]. With the development of rural areas, the newly built dwellings are all brick–concrete structures. The traditional raw soil buildings have gradually disappeared. Based on the brick–concrete structures, many existing dwellings have added cladding materials such as cement and ceramic tiles to the exterior walls [39]. The number of floors in existing dwellings has increased to two, and the pitched roof and semi-pitched roof have been replaced by a flat roof [40]. This has resulted in some differences in the types of rural dwellings, as shown in Table 1. The common building structure of existing dwellings is shown in Figure 1.
There are also a large number of thermal environmental problems in rural dwellings in Xi’an. They are mainly reflected in the following:
  • Many traditional building practices that adapt to the local climate and can improve the indoor thermal environment are abandoned.
  • Due to insufficient construction technology, the heat insulation effect of rural dwellings is poor.
  • There is a lack of sustainable housing design, and there are a great deal of over-design phenomena in rural areas [41].
Due to the economic level and building conditions in rural areas around Xi’an, the heating and cooling equipment level of rural houses is relatively low [11]. For example, during winter, there is no centralized heating system for rural houses as there is in urban areas, and many villagers still use stoves as heating equipment. Due to the limitations of personal economic levels and mindsets, villagers usually try to minimize the use of heating and cooling equipment to save costs [13]. In this case, it is difficult to use heating and cooling equipment to solve the thermal environment problems of rural dwellings in Xi’an. Therefore, it is very urgent to improve the indoor thermal environment by optimizing the existing design features of rural dwellings [42].

1.4. Evaluation Methods for the Indoor Thermal Environment

The commonly used methods for evaluating thermal comfort include predicted mean vote (PMV), physiological equivalent temperature (PET) and standard effective temperature (SET) [43]. Among them, PET is a human biometeorological parameter that describes individual thermal perception. Its definition is the air temperature at which, in a typical indoor setting (without wind and solar radiation), the heat budget of the human body is balanced with the same core and skin temperature as under the complex outdoor conditions to be assessed [44]. In this study, the indoor thermal environment of rural residences is greatly influenced by outdoor conditions due to the lower level and less frequent use of heating and cooling equipment. In this case, PMV can only calculate the integrated index of human thermal perception of the indoor environment, rather than provide a real description of the human thermal status. SET can only express the influence of the indoor thermal environment on human heat dissipation and cannot directly represent the thermal sensation of individuals. PET, on the other hand, can directly represent the core and skin temperatures of the human body, providing a more realistic description of human thermal perception and a more intuitive reflection of the indoor thermal environment [45,46]. Therefore, this study is based on the PET evaluation method to analyze the indoor thermal environment of rural residences.

2. Materials and Methods

2.1. Field Investigation Method

A number of rural dwellings around Xi’an were selected for the field investigation, and their architectural status and spatial design indicators were measured, so as to obtain the spatial layout, design mode, and design parameters of the rural dwellings around Xi’an, which were then used for simulation modeling.

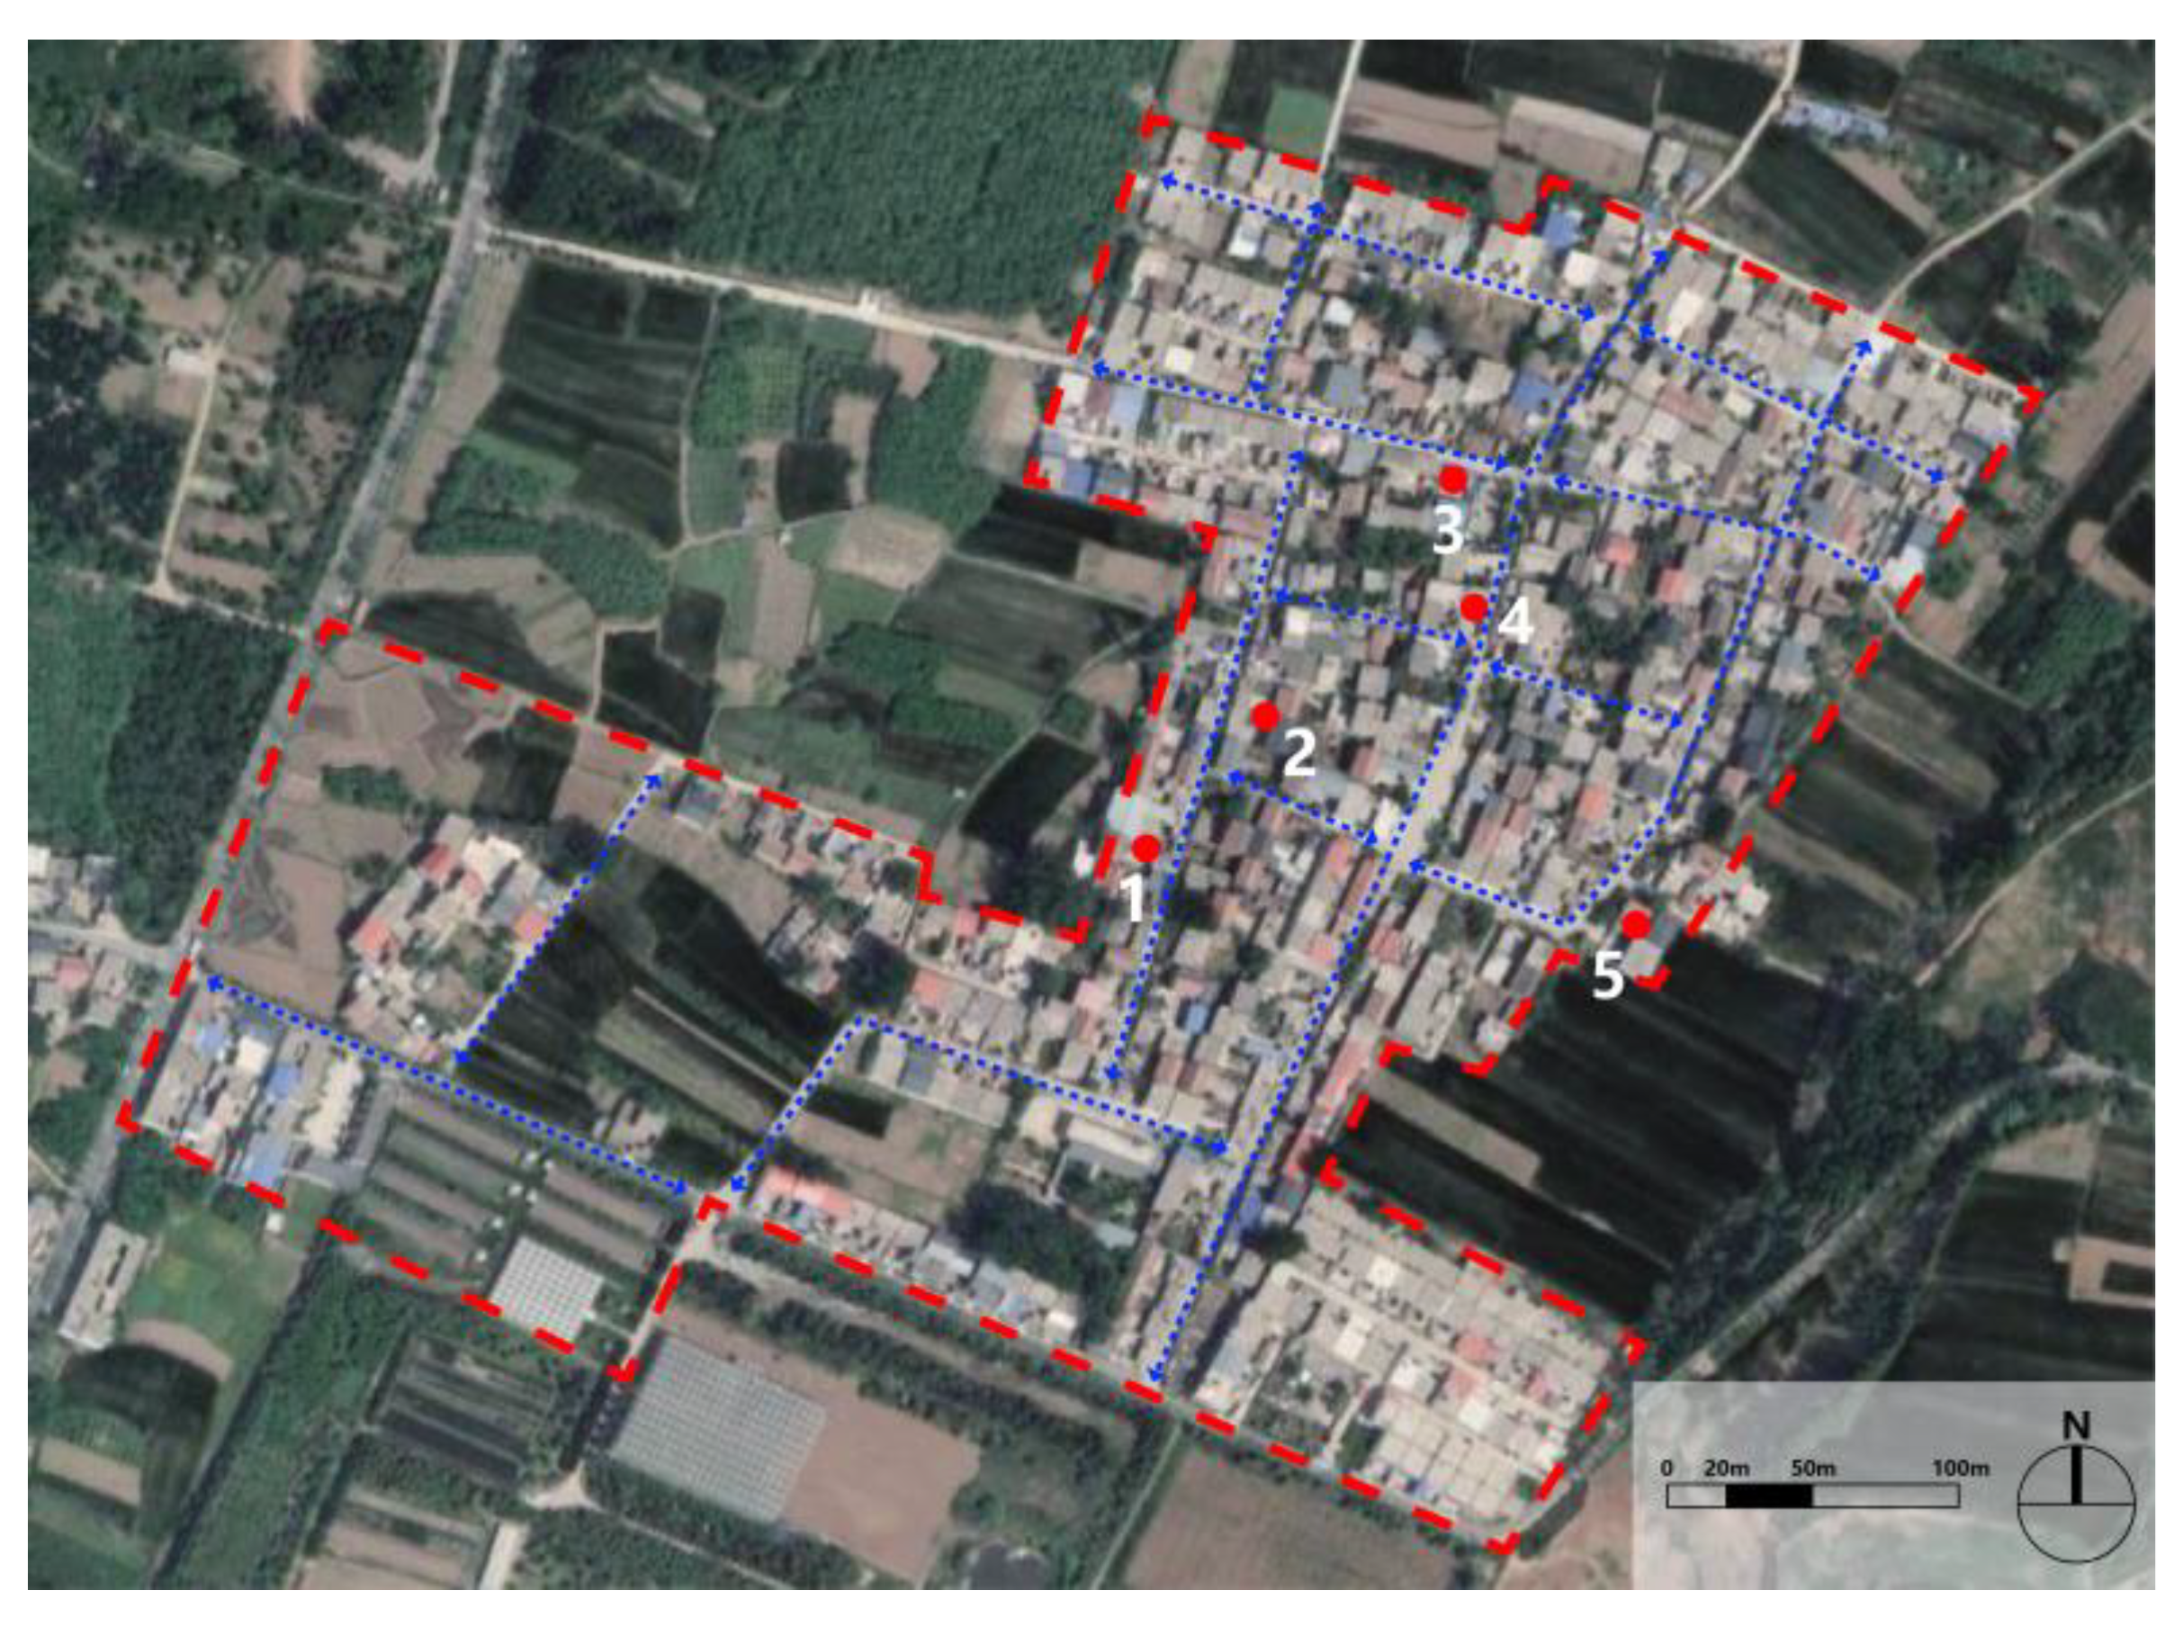
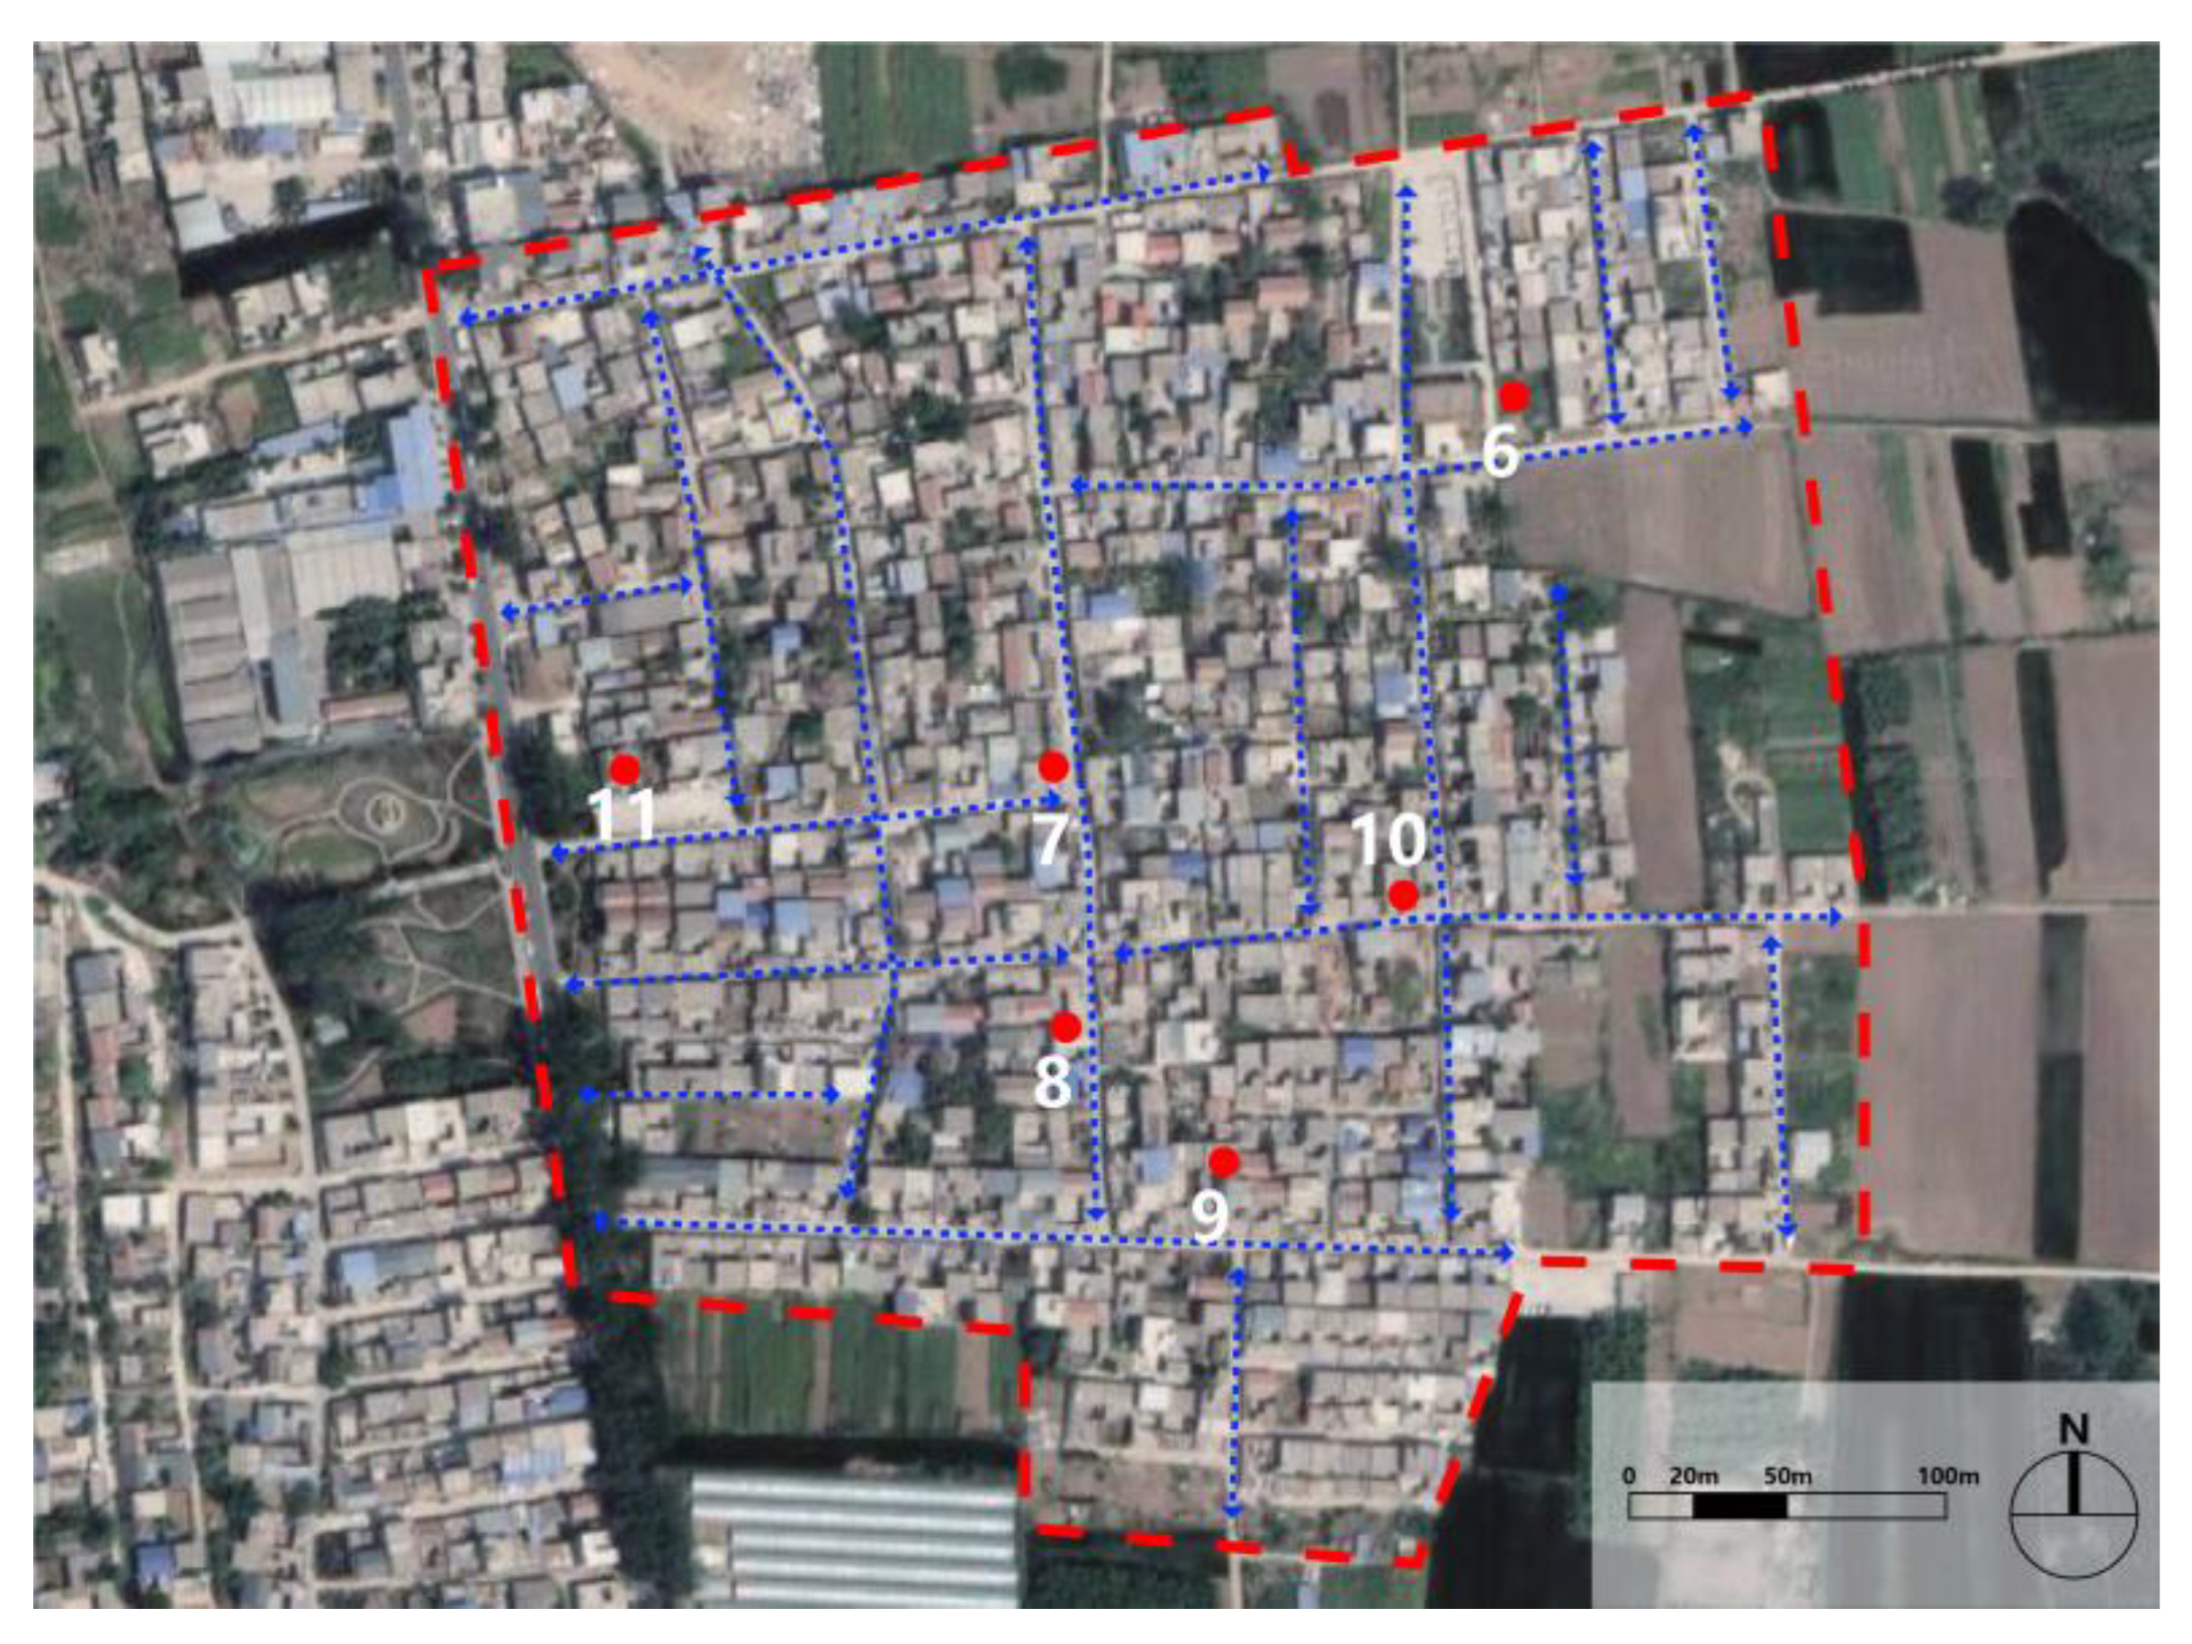
2.1.1. Selection of Investigation Objects

Several villages around Xi’an were selected for investigation based on factors such as location and development situation. All the dwellings in these villages were examined. According to the classification of existing rural dwellings around Xi’an in Table 1, the specific types of rural dwellings in terms of building structure, number of floors, roof type, and external wall cladding materials were identified through the examination. Several dwellings covering all types were selected as the investigation objects.

2.1.2. Investigation Method

  • Current Status Record of Architectural Design
We recorded the spatial layout, orientation, structure, door and window material, wall material, floor material, floor material, roof type, roof cladding material, and other building status indicators of the selected dwellings.
2.
Mapping of Architectural Space Dimensions
We measured the dimensions of courtyards and indoor rooms, the height of buildings, the thickness of walls and floors, the dimensions and thickness of doors and windows, etc., and drew plane sketches.

2.2. Software Simulation Method

Modeling and software simulation were carried out based on the measured results to determine the impact of various design indicators’ changes on the indoor thermal environment, and a comprehensive optimization strategy was established based on the optimal results.

2.2.1. Selection of Simulation Software

Common simulation software can be divided into two parts: the simulation engine that calculates indoor thermal environment indicators and the software platform for building modeling based on the simulation engine. In terms of simulation engines, commonly used engines include EnergyPlus, IESVE, and DeST [47]. Among them, IESVE and DeST can only handle linear and steady-state systems, that is, simulating the thermal performance of buildings under indoor thermal environment conditions that do not vary with time. EnergyPlus can handle various transient systems where multiple thermal parameters change over time, and simulate indoor thermal environments under the interference of equipment, personnel, and other factors [48]. DeST only supports the CAD modeling platform, IESVE supports SketchUp and Revit platforms, while EnergyPlus can support multiple platforms, such as CAD, SketchUp, Revit, and Rhino [49]. A summary of the differences between the simulation engines is shown in Table 2. Therefore, EnergyPlus was selected as the simulation engine in this study.
In terms of software platforms, compared to platforms such as SketchUp and Revit, Rhino can accurately create building design and thermal models through parametric modeling, and achieve real-time coordination between modeling and EnergyPlus engine calculations [47]. Therefore, this study selected Rhino as the modeling platform and used Rhino software based on the EnergyPlus engine for the simulation.

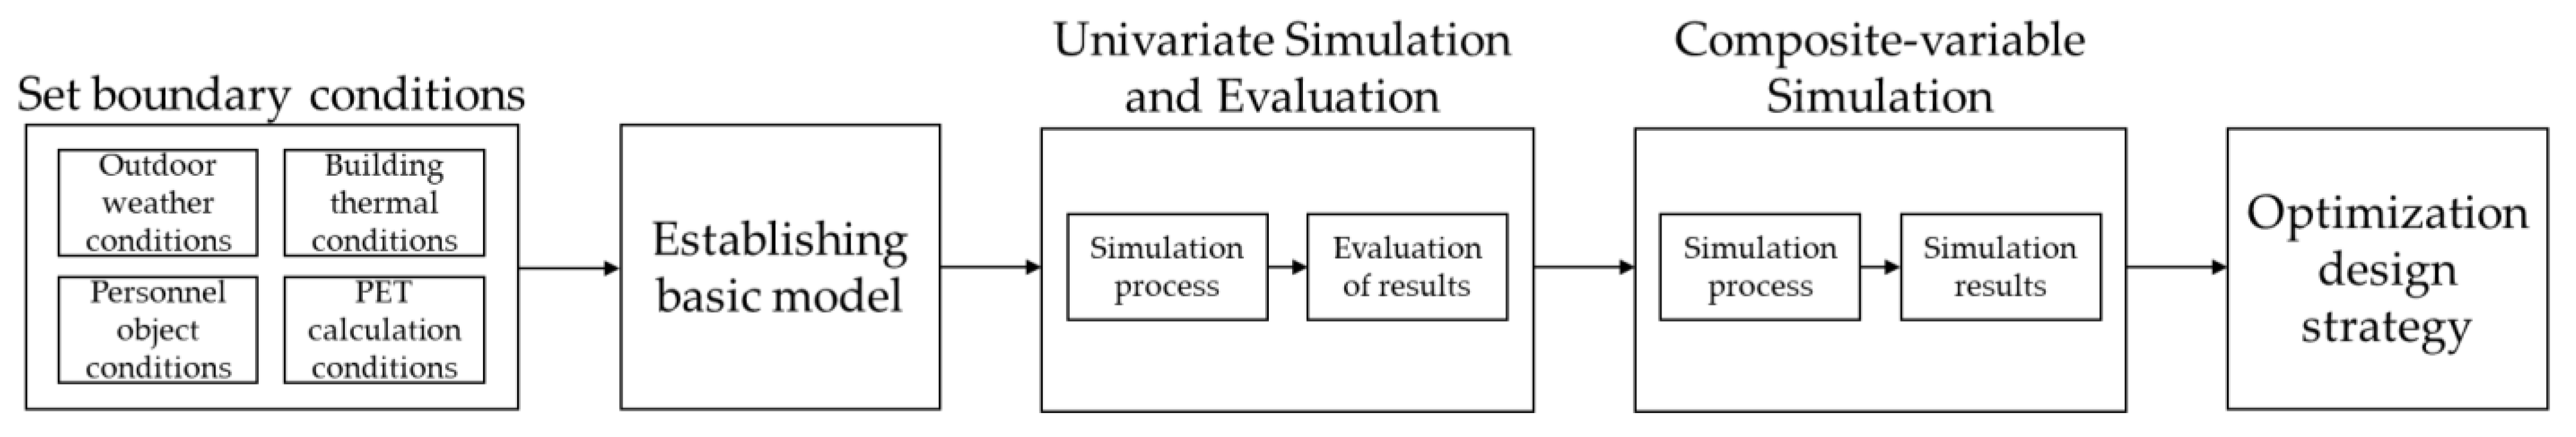
2.2.2. Simulation Method

  • Boundary Condition Settings
The simulation time was set to typical winter and summer days. The outdoor climate conditions were set according to the Xi’an meteorological data provided by EnergyPlus’s climate database. The building thermal conditions, personnel object conditions, and PET calculation conditions were set based on the design status of rural housing obtained through the field investigation, in combination with relevant standards, such as “GB/T 50176-2016 Technical Standard for Thermal Design of Civil Buildings” and “DB/J 61/T91-2014 Energy-Saving Technical Standard for Rural Residential Buildings in Xi’an Area” [50,51].
2.
Establishment of the Basic Model
The spatial layout and dimensions of the basic model were determined based on the results of the field investigation and the spatial layout of existing rural dwellings around Xi’an. The design values of each indicator of the basic model were determined based on the design status and dimension values of the investigation objects.
3.
Univariate Simulation and Evaluation
Based on the extraction of the design elements of the measured dwellings, some design elements that have an influence on the indoor thermal environment were selected as simulation indicators for the univariate simulation. The indoor PET values corresponding to the basic model were simulated under the variation of a single indicator. The influence of each variable indicator on the indoor thermal environment was evaluated based on the change in PET compared to the basic value. The optimal solution for each variable indicator was obtained, and the design indicators were evaluated based on their influence, thus determining the indicators that need further research on the compound impact on PET under mutual interference.
4.
Composite-Variable Simulation and Optimization Strategy
Based on the evaluation results, the indicators for the composite-variable simulation were obtained. The indicators were combined into multiple working conditions, and the indoor PET values corresponding to each working condition were simulated. Based on the change in PET compared to the basic value for each working condition, the compound working condition with the best PET optimization result was obtained, and thus the indoor thermal environment optimization strategy for the basic model was determined.
The flowchart of the software simulation method is shown in Figure 2.

3. Field Investigation Results

3.1. Investigation Objects

The rural areas in Xi’an are mainly under the jurisdiction of various towns in the city. In order to select the investigation objects, it is necessary to first select the towns around Xi’an [52]. After screening the towns around Xi’an, Taiyigong Street was selected. Taiyigong Street is one of the nine provincial-level demonstration towns for rural revitalization in Xi’an, which has strong representativeness for the current development status of rural areas in Xi’an. Taiyigong Street is located along the south ring road of Xi’an, about 27.2 km away from the city center. There are 11 villages under Taiyigong Street. Among them, Shachang Village and Guanjia Village were selected as the rural investigation objects.
After the investigation, it was found that the construction conditions of dwellings in the two villages were roughly the same, and the spatial layout was consistent with the overall characteristics of rural dwellings around Xi’an. In terms of dwelling type, the dwellings in both villages were brick–concrete structures. The main differences included the number of floors, roof type, and exterior wall cladding materials. In addition, due to the current situation of village road and homestead planning, there were also differences in the orientation of dwellings in the two villages. The specific types are shown in Table 3. Typical rural dwellings covering each type were selected as the investigation objects. Five households were selected from Shachang Village and six households were selected from Guanjia Village, totaling eleven households as investigation objects. The distribution and numbering of each household are shown in Figure 3 and Figure 4.

3.2. Architectural Design and Construction Element Measurement

According to the measured results, we sorted out the architectural form features and material structures of each household, as shown in Table A1 in Appendix A. All households were brick–concrete structures with no enclosure insulation layer. The main differences included orientations, exterior wall cladding materials, roof types, roof cladding materials, and window materials. Except for houses 7 and 8, the exterior wall cladding material of all households was ceramic tile. House 7 was cement, while house 8 had no exterior wall cladding material. The roof types and cladding materials can be simplified into three forms: traditional tile pitched roof, cement-covered flat roof, and color steel roofs added for shading on cement flat roofs. Houses 5, 8, and 11 had tile pitched roofs, while houses 3 and 7 had color steel roofs installed. Window materials were divided into window frame materials and window glass types. Window frame materials included wood and aluminum alloy, and window glass types were all single layers. Types of functional room were divided into five categories: living room, bedroom, kitchen, washroom, and storeroom. The numbers of the first four types were similar, while the number of storerooms greatly varied.

3.3. Measurement of Building Space Dimensions

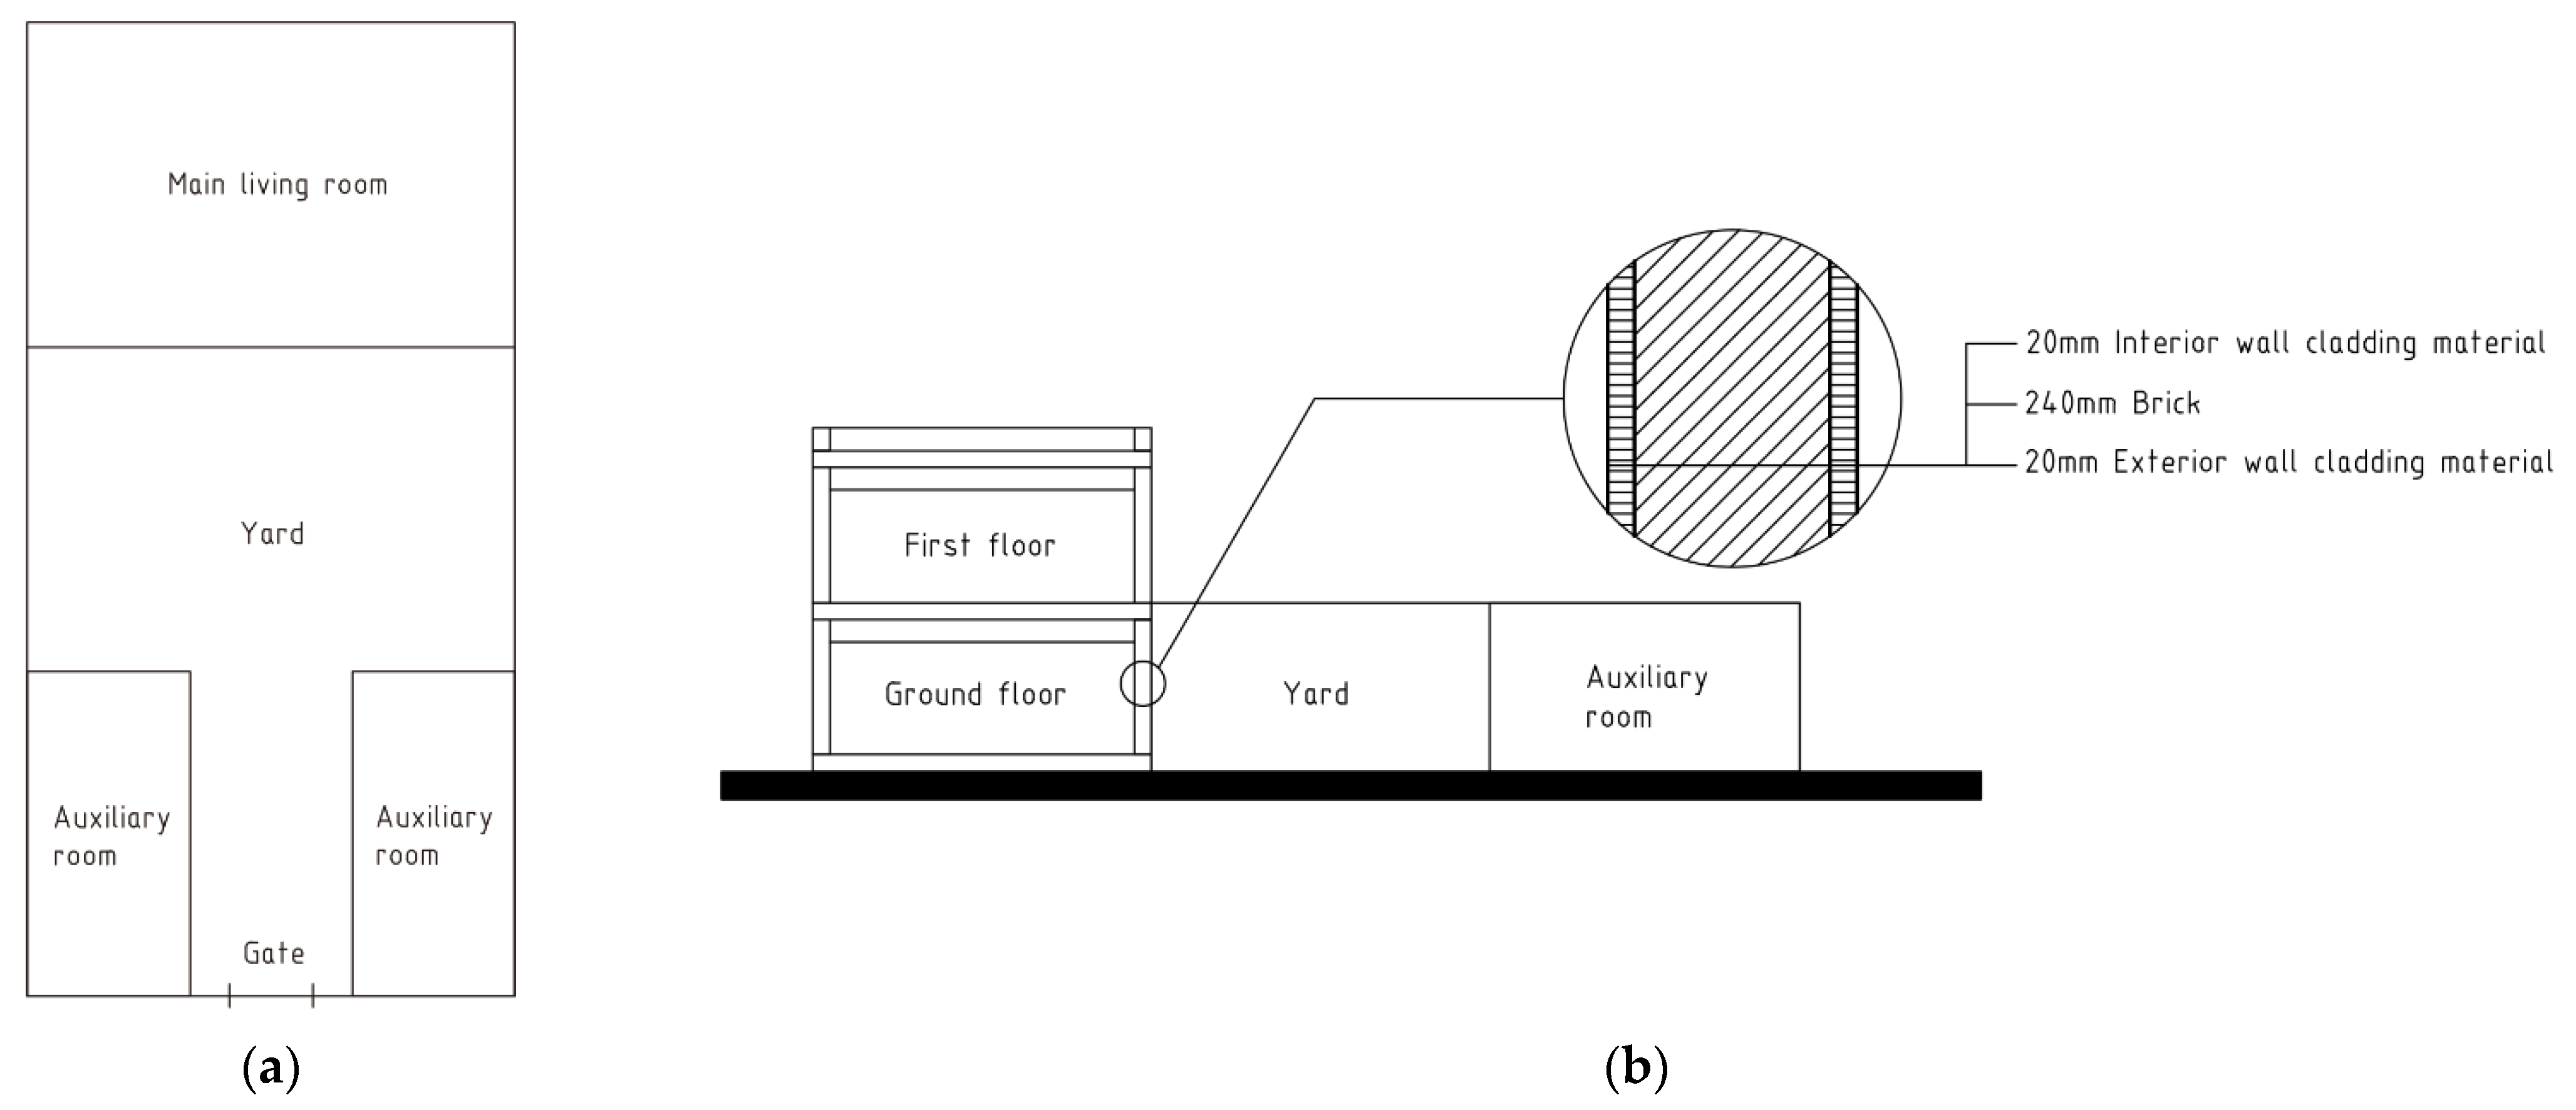
3.3.1. Building Space Dimensions

We calculated the dimensional data of each household’s building space and the window-to-wall ratio (WWR) of the main living room based on the measurement results, as shown in Table A2 in Appendix A. Except for houses 3, 5, 8, and 11, the length of the main living rooms was the same as the width of the homestead. The width and floor height of the main living rooms were generally similar. Most of the houses had a two-story main living room, while houses 4, 6, 8, and 10 had a one-story main living room. The windows of the main living rooms in each household faced the front and back of the building, and there were no windows on the sides. The window-to-wall ratio of each household significantly varied.

3.3.2. Building Plans

Based on the measurement results, we drew the floor plans of each household, as shown in Table 4. According to the floor plan, it can be seen that the spatial layout of each household generally conformed to the spatial layout of existing rural dwellings around Xi’an. Except for house 3, the main living room of each household was located near the short side of the homestead. The auxiliary rooms of each household consisted of one or more rooms and were all located near the entrance of the courtyard.

3.4. Extraction of Rural Dwellings’ Design Elements

Based on the results of the investigation into the current state of rural housing design, we identified the design elements that were decisive for the design of the main living rooms and extracted the numerical or typological ranges of each element, as shown in Table 5. This will be used for the establishment of the basic model and the setting of simulation indicators in the subsequent simulation process.

4. Software Simulation Results

4.1. Boundary Condition Settings

4.1.1. Outdoor Climate Conditions Setting

The simulation time was set to the winter solstice (21 December) and the summer solstice (21 June). Based on the meteorological data of Xi’an in the EnergyPlus climate database, we obtained the parameters for outdoor climate conditions used in the simulation. The main parameters’ average values during the simulation period are shown in Table 6.

4.1.2. Building Thermal Conditions Setting

The materials involved in the actual construction process and subsequent optimization process can be divided into structural materials and window materials. Their corresponding thermal parameters are shown in Table 7 and Table 8. To simulate the thermal environment without equipment use, the effects of heating, cooling, and other equipment on the indoor thermal environment were excluded in the modeling, as well as the impacts of other dwellings and facilities outdoors. According to the actual situation, the model assumes no shading devices for windows in winter and summer, and the average air change rate was 0.5 times/h.

4.1.3. Personnel Object Conditions Setting

The investigation found that the elderly were the main occupants of the investigation objects. Therefore, the simulation process took a 60-year-old male as the personnel object. The personnel object’s height was set to 175 cm, weight was 75 kg, and activity level was sitting. The clothing level was set according to the clothing worn by elderly residents during the investigation. The specific parameters are shown in Table 9.

4.1.4. PET Calculation Conditions Setting

The calculation method for PET simulation was to set a calculation grid that covers the entire area of each floor at a certain height from the floor level in the main living room. The length and width of each cell on the grid were both 0.5 m. The height from the floor level was set to 0.6 m, which is the measurement point height for sitting activity. The calculation period was 24 h, and the PET value of each cell on the grid was calculated every hour. The average PET value of all cells on the grid was taken as the indoor PET simulation result for every hour.

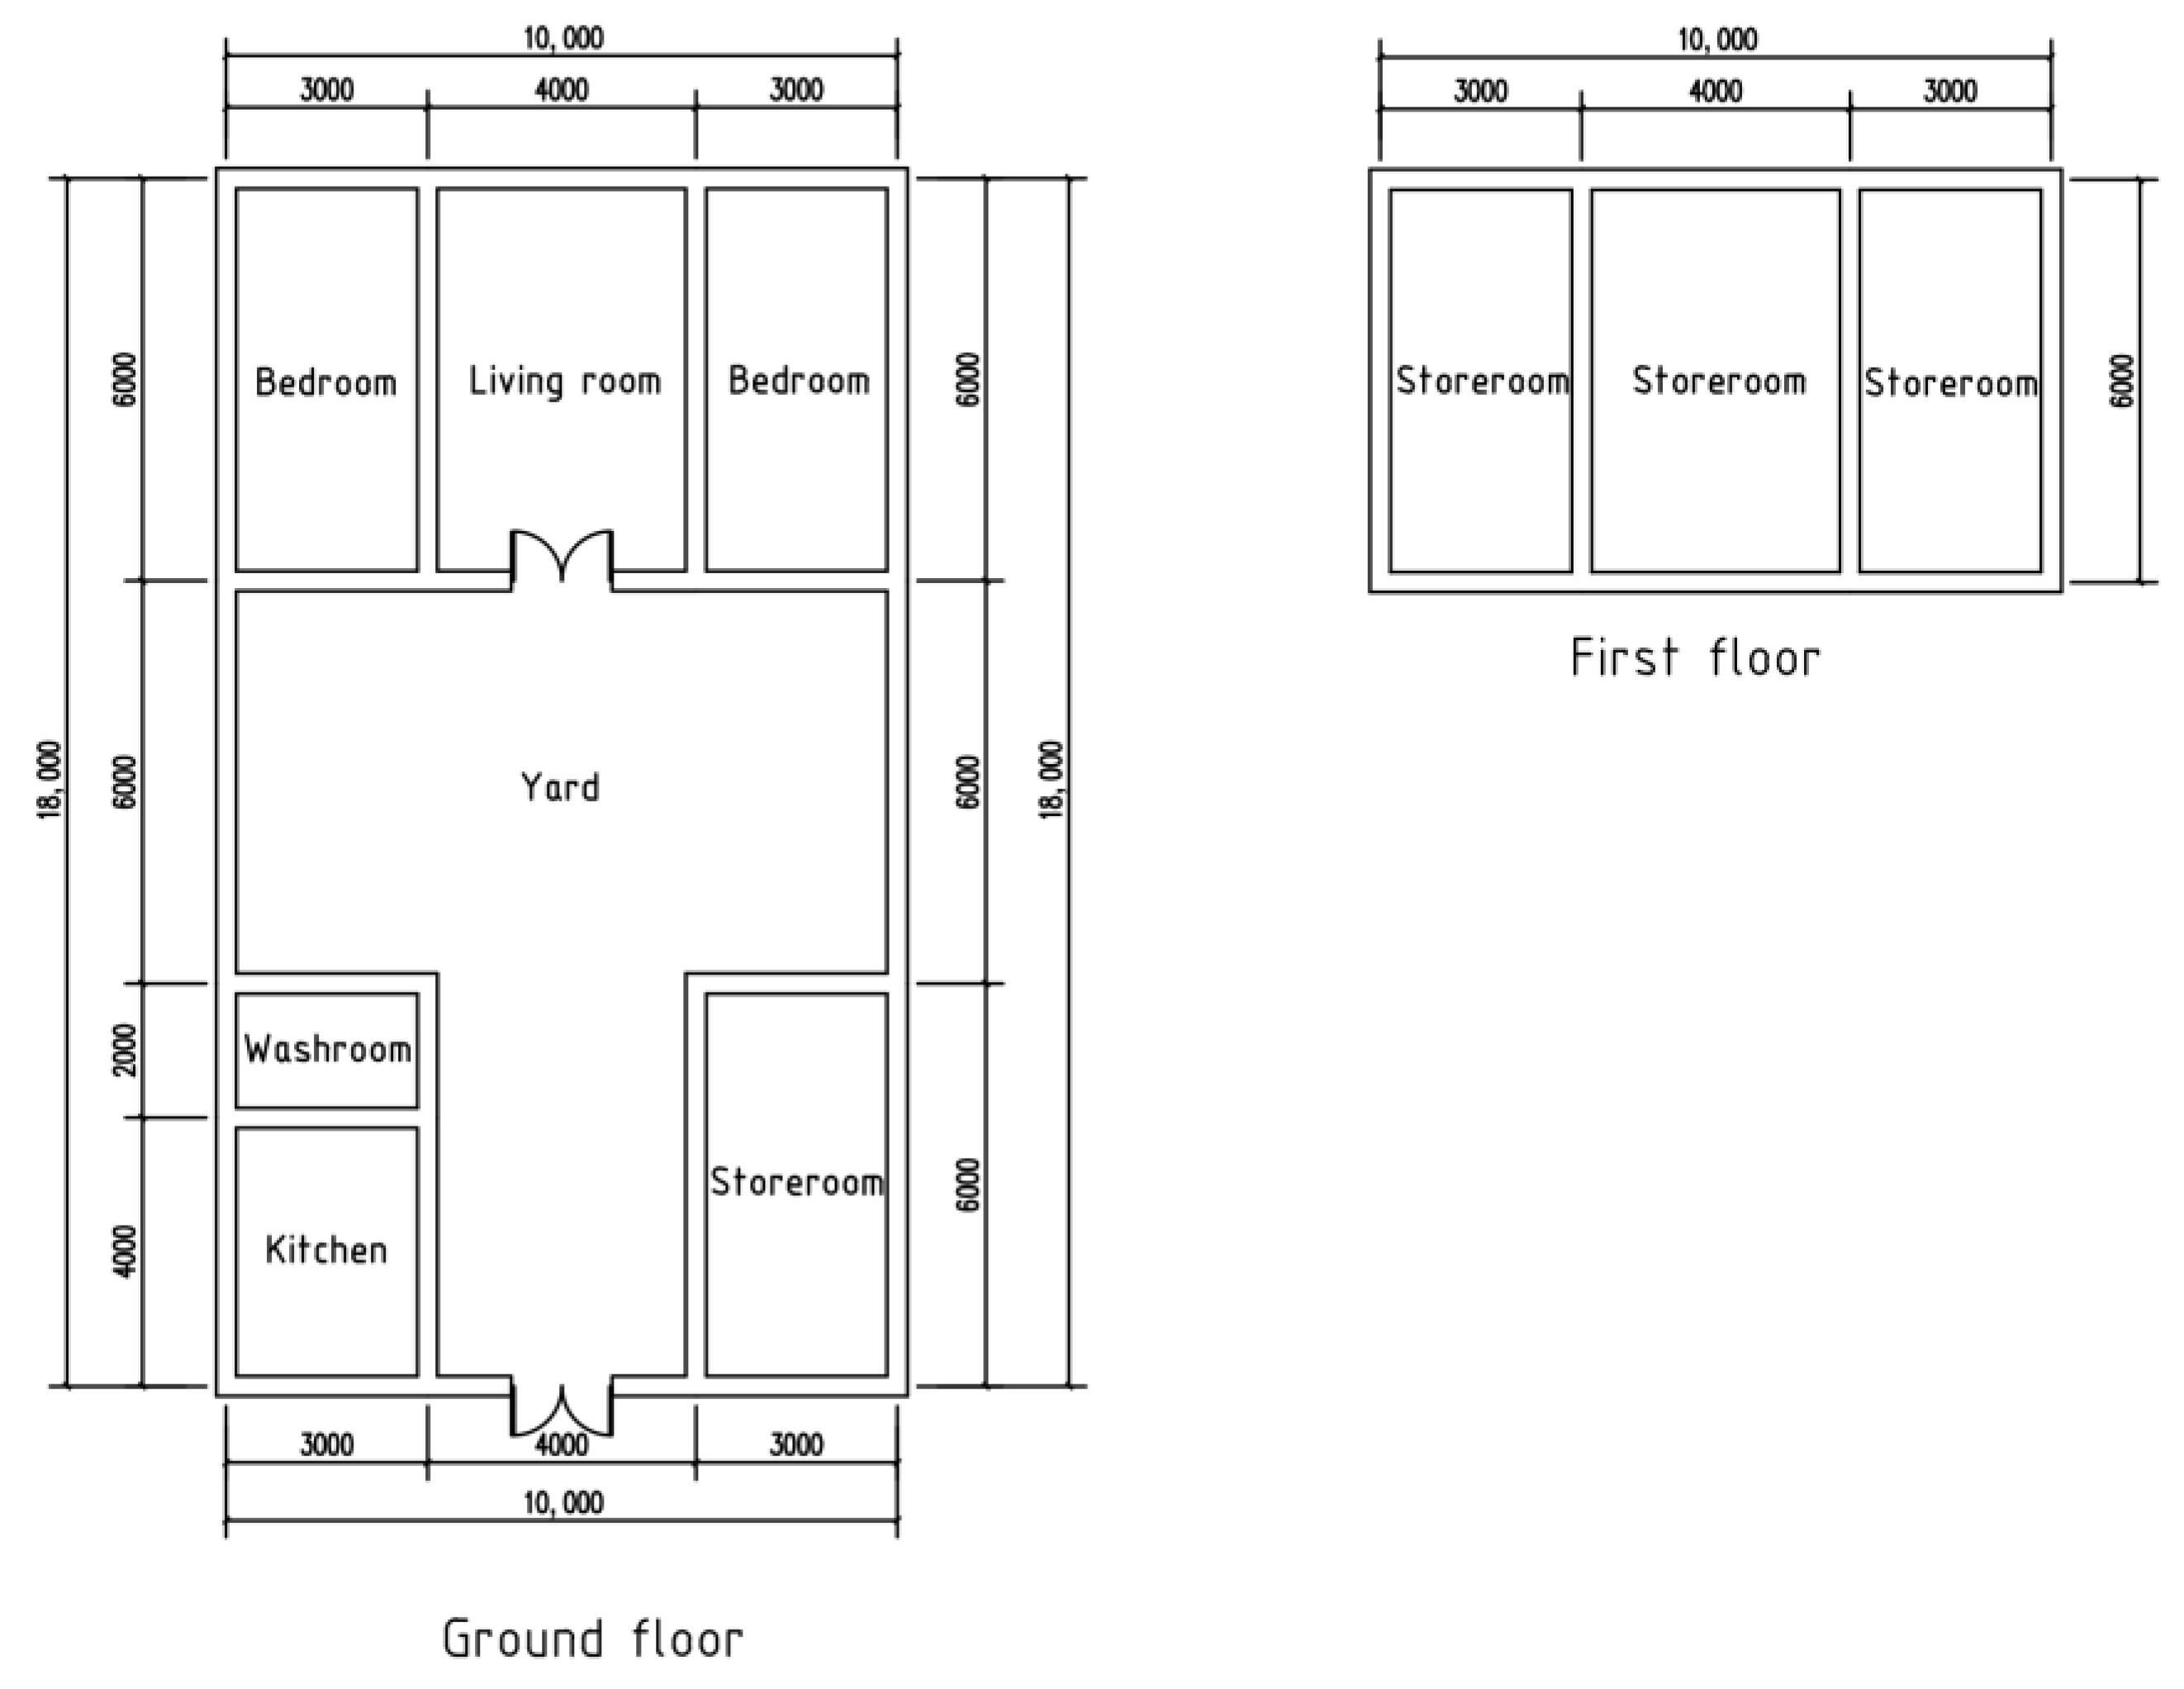
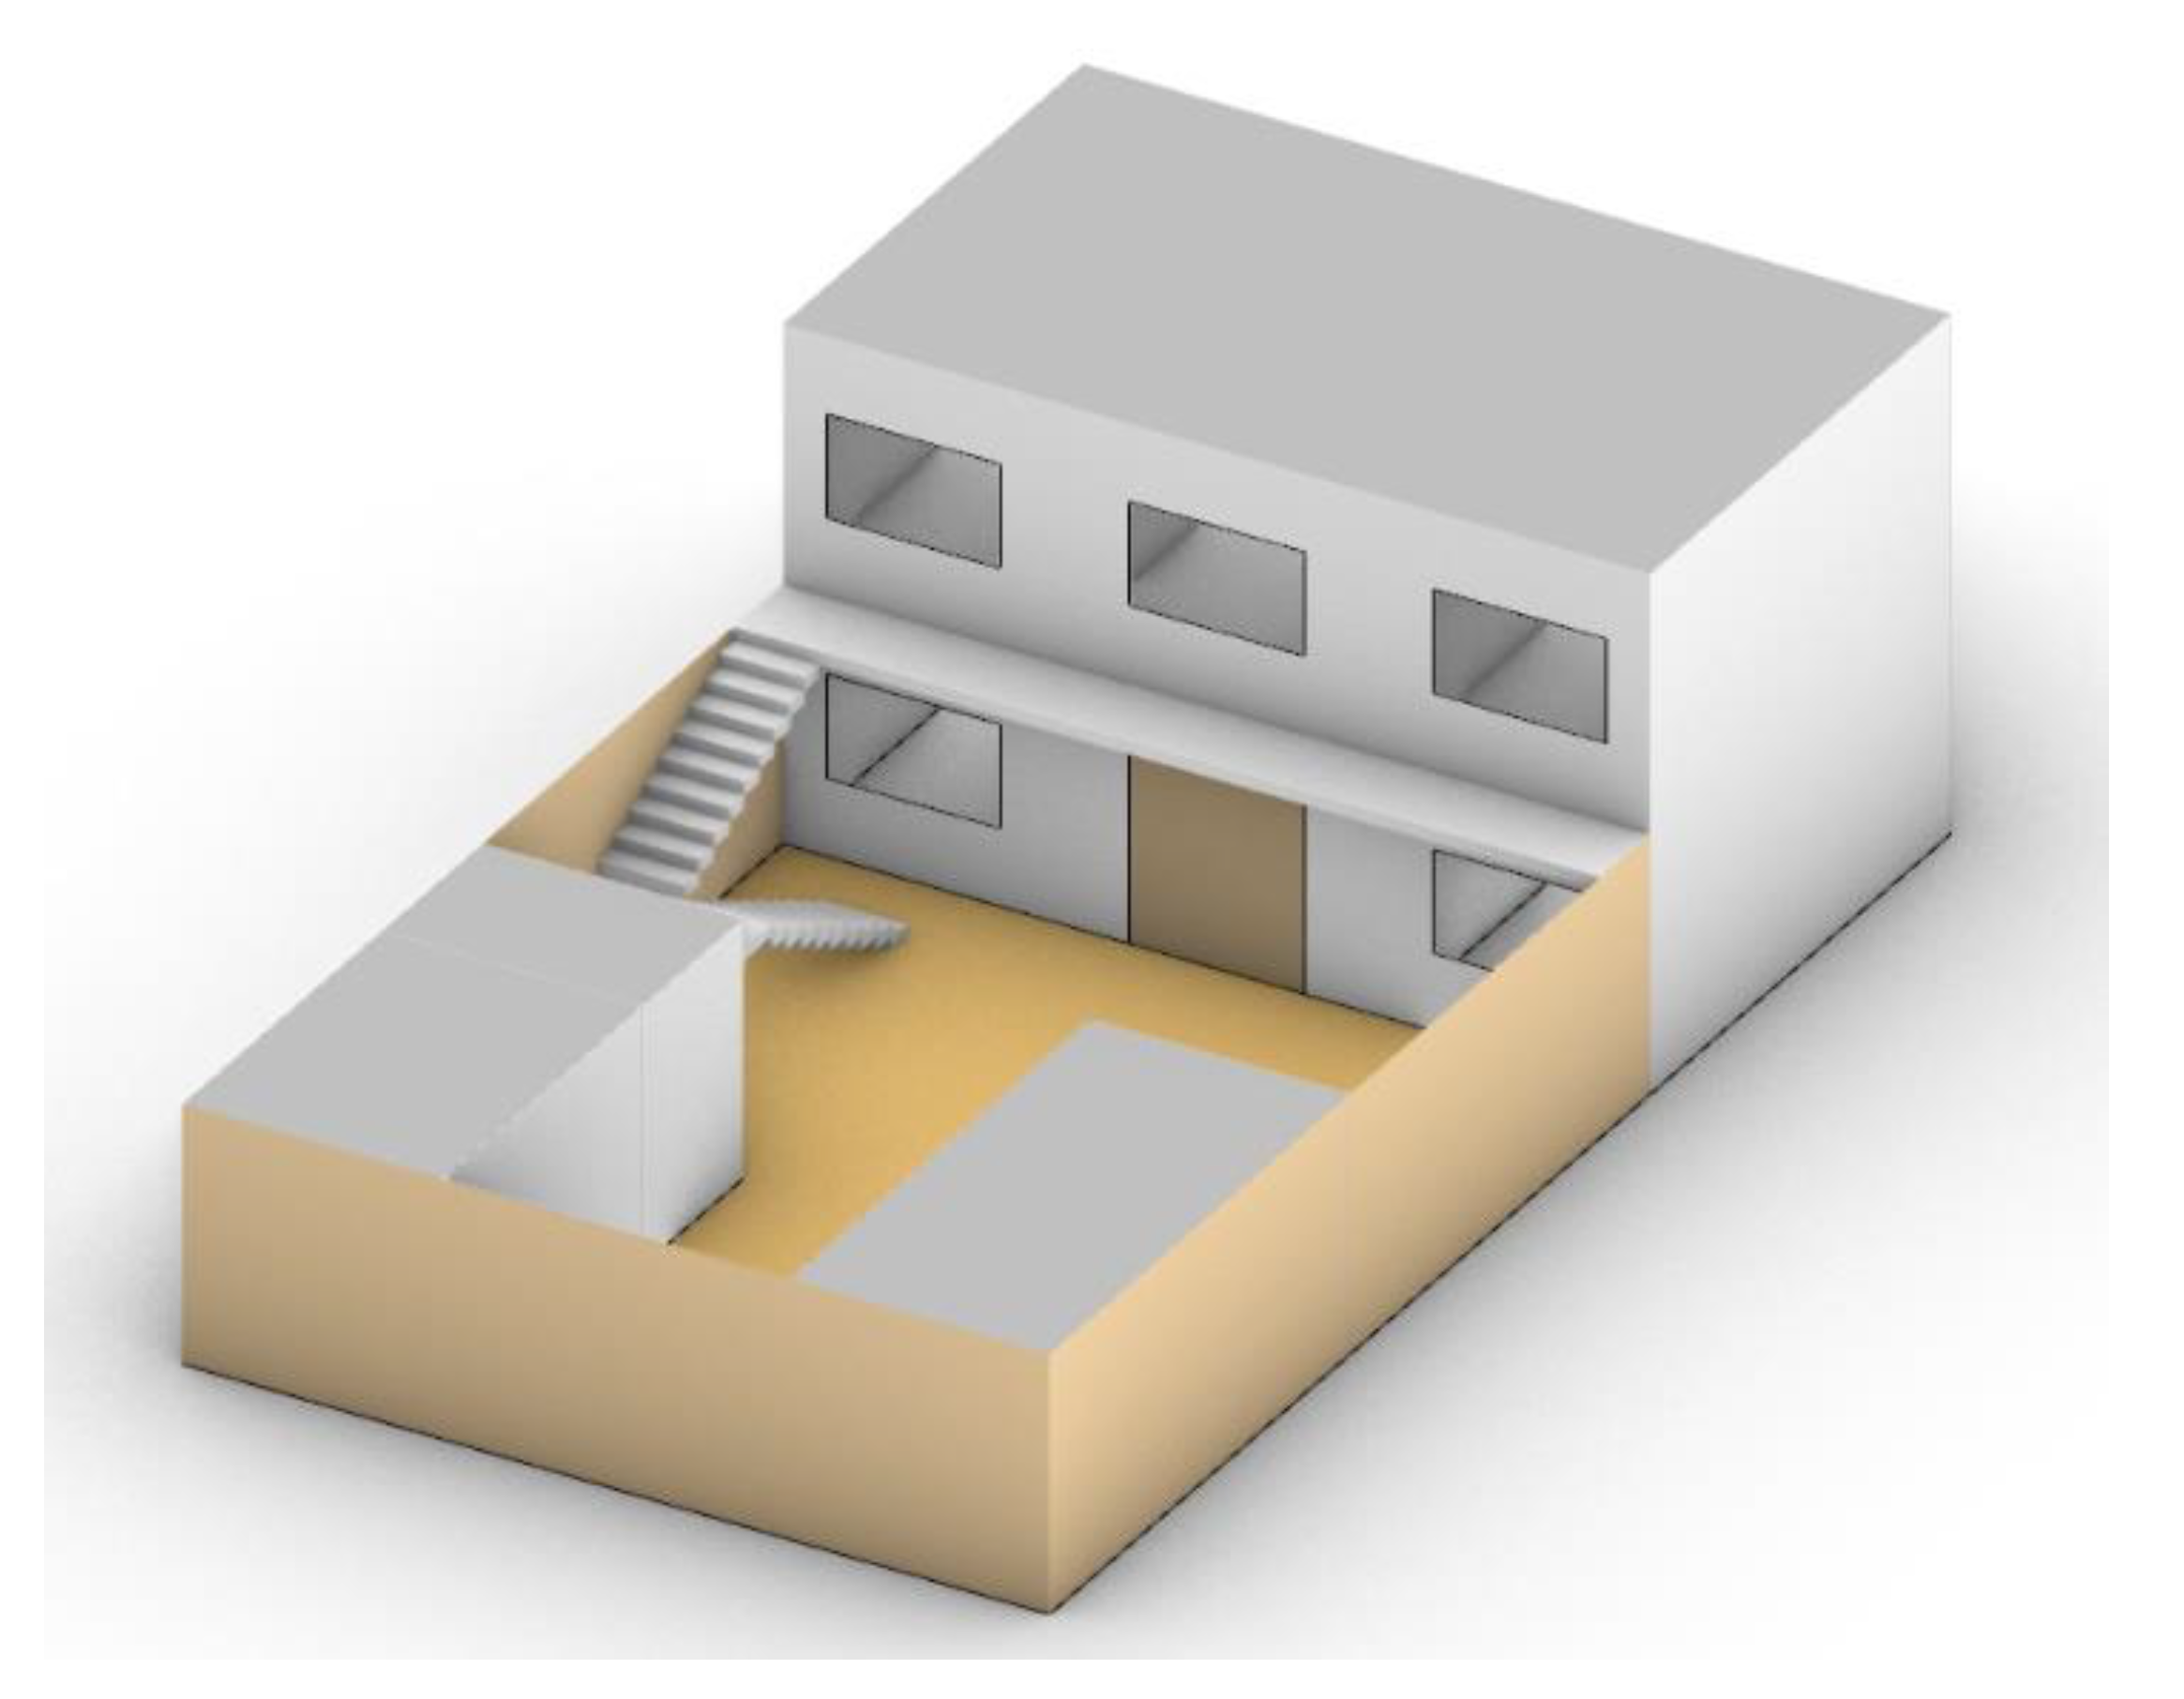
4.2. Basic Model Establishment

Based on the field investigation results, we established the basic model of the main living room of rural dwellings. Firstly, based on the measured plans, we simplified the spatial layout of the investigation objects. Combined with the spatial layout of existing rural dwellings around Xi’an, we developed the outdoor courtyard and indoor spatial layout of the basic model, as shown in Figure 5. Based on the spatial dimensions of existing rural dwellings around Xi’an and the measurement results of the investigation objects, we set the dimension values of the basic model that were approximate to the actual situation. The width of the homestead was 10 m, and the length was 18 m. The length of the main living space was 10 m, and the width was 6 m. The width of the central bay of the main living room was 4 m, and the width of bays on both sides was 3 m. The width of the auxiliary room was 3 m, and the length was 6 m. The detailed dimension values are shown in the dimension labeling of Figure 5. The other indicator design values of the basic model were also determined by values and types that were approximate to the actual situation, and the detailed values are shown in Table 10. The digital model of the basic model is shown in Figure 6.

4.3. Univariate Simulation Results and Evaluation

4.3.1. Univariate Simulation Process

We simulated the change in the PET value under the change in a single indicator, and then analyzed the influence of each indicator on the indoor thermal environment. The range of indicators that need to be simulated and compared is shown in Table 11.
We simulated the indoor PET values corresponding to the changes in various indicators of the basic model during the simulation period, as shown in Table A3 in Appendix A. According to the simulation results, the indicators with better optimization results in winter were as follows: south orientation, 3.0 m floor height, inner and outer insulation layers, and a 40% south-facing window-to-wall ratio. The indicators with better optimization results in summer were as follows: south orientation, color steel roof, and a 30% south-facing window-to-wall ratio.

4.3.2. Evaluation of Univariate Simulation Results

For the simulation results, we took the average value of the PET data of a single indicator after a change in winter as T w i (°C), the average value of the basic PET data of the corresponding indicator as T w b (°C), and the optimal value, T w (°C), of the indicator change relative to the basic indicator can be obtained, where:
T w = T w i T w b
In the same way, taking the average value of the PET data of a single indicator after a change in summer as T s i (°C), and the average value of the basic PET data of the corresponding indicator as T s b (°C), the optimal value, T s (°C), of the indicator change relative to the basic indicator can be obtained, where:
T s = T s i T s b
It is better to increase the PET value in winter, and to decrease it in summer. Therefore, for the optimal value of a certain indicator, its T w should be a positive number, and T s should be a negative number. From this, it can be seen that the value of its comprehensive optimal value, T (°C), should be:
T = T w T s
From this, the PET optimization results can be obtained, as shown in Table 12.
From analyzing and evaluating the single-variable simulation results, it can be concluded that the optimal solution variables for each indicator in the PET optimization results were as follows: south direction, 3.0 m floor height, color steel roof, cement exterior wall cladding material, external insulation, 40%S10%N window-to-wall ratio, and aluminum alloy double-glazed window material.

4.4. Composite-Variable Simulation Results and Optimization Strategy

4.4.1. Composite-Variable Simulation Results

Through the evaluation of the univariate simulation results, it can be seen that among the various indicators, the south direction, the addition of a color steel roof, and the addition of an external insulation layer had a clear improvement effect, the effect of changing the cladding material of the exterior wall and the window material was not obvious, and the effect of changing the floor height and the window-to-wall ratio requires further study. Therefore, in the original basic model, the orientation was determined to be south, the colored steel roof and external insulation layer were added, and the simulation indicators of the composite simulation were obtained as shown in Table 13.
A variety of indicator variables were combined to form 8400 working conditions for the simulation. Other conditions were the same as in the univariate simulation. The winter simulation results are shown in Table 14 and summer results are shown in Table 15.
It can be seen that the highest T w i in winter PET results was 11.04 °C, and the lowest T s i in summer PET results was 30.87 °C. Due to the changes in some conditions in the composite simulation of the basic model, the T w b of the composite simulation results was 6.88 °C, and the T s b was 31.62 °C. We also calculated the PET optimization values T w , T s , and T of the simulation results, and obtained the PET optimization results of the composite simulation, as shown in Table 16.
The indicator variables with the best optimization results were as follows: a building length of 12.6 m, width of 7.8 m, floor height of 2.7 m, insulation layer thickness of 60 mm, and a south and north window-to-wall ratio of 10%.

4.4.2. Optimization Strategy

According to the simulation results, we obtained the design indicators for the optimization strategy. Compared to the original basic model, the improved indicators of the optimization strategy included: building length of 12.6 m, width of 7.8 m, floor height of 2.7 m, a south window-to-wall ratio of 10%, a north window-to-wall ratio of 10%, a color steel roof, 60 mm-thick external insulation, a cement exterior wall cladding material, and an aluminum alloy double glass window material. As a result of the changes in length and width, the building area and room area of the optimized building also changed. A comparison between the detailed indicator values of the optimized building and the original values is shown in Table 17. Compared with the basic model before simulation, this strategy increased the average PET value by 4.17 °C in winter and decreased it by 0.66 °C in summer. Xi’an belongs to the cold regions, and the optimization results of the PET value in winter were better, which proved that the optimization strategy is more feasible.

5. Discussion

5.1. Comparison with Previous Studies

Through our research, we know that the typical rural residential space around Xi’an is three longitudinal rooms symmetrically arranged side-by-side, and the building form is a two-story, flat-roofed, brick–concrete building. The indicators that had a greater impact on the indoor thermal environment of rural dwellings around Xi’an were the building shape, enclosure structure, and window-to-wall ratio. These are the same conclusions as obtained in previous studies [27,39,53,54]. After this study, it can be further found that the indoor thermal environment performance is better when the length and width of the house are larger, the floor height is smaller, the insulation layer of the enclosure structure is thicker, and the windows facing the south and north are smaller.

5.2. Limitations of the Study

This study has some limitations in the field investigation and simulation process. In the field investigation part, due to the limitation of the number of people and time, the research objects were limited, and only 11 dwellings that could cover the rural dwelling types around Xi’an City were selected. It is impossible to obtain generalized measurement data through small-sample surveys. In terms of the simulation, there were some factors that affected the accuracy of the simulation results. For example, the external environmental parameters referred to in the simulation were the average environmental parameters of Xi’an City, which are somewhat different from the microclimate environment in the actual village. Hence, the simulation process was unable to express the influence of other users of the house on the simulated experience objects, etc. The limitations of the existing process will be improved in the subsequent research. Due to the current status of rural dwellings around Xi’an, this study mainly analyzed the influence of design elements on the indoor thermal environment, without calculating the building energy consumption. In the subsequent research, energy consumption can also be included as an evaluation indicator to derive multi-objective optimization strategies.

5.3. Economic Issues of Optimization Strategies

The optimization strategy proposed in this study has undergone a large number of modifications compared with the initial conditions of the basic model to ensure the maximum PET optimization results. In the actual construction process, due to the limited economic level in rural areas and the fact that most rural houses are self-built by villagers, there are many economic problems in the optimization and renovation of houses. The optimization strategy should consider the construction costs required for the transformation of various indicators, compare this with the PET optimization results, and choose the most cost-effective and economical optimization strategy according to the actual situation of the user. Subsequent research will also calculate the required material costs for all working conditions in the composite simulation and obtain the cost and the variation value of the basic model. At the same time, a coupling analysis will be carried out with the simulated PET value to obtain the coupling results and cost-effectiveness of the PET optimization value and the cost of each working condition and establish a dataset for obtaining a multi-objective optimization strategy.

5.4. Possible Future Research Directions

This study analyzed the influence of various design indicators on the indoor thermal environment of rural dwellings around Xi’an through field investigation and simulation. Based on the results, we developed a comprehensive optimization design strategy. In future studies, it is possible to actually construct the optimized rural dwellings based on the optimization strategy through practical methods. Through the post-occupancy evaluation of constructed dwellings, the actual influence and effectiveness of the optimization strategy on the indoor thermal environment of rural dwellings can be verified.
Furthermore, the indicator values of the optimization strategy can serve as a reference for setting or updating local energy-saving design standards in the future. For example, as mentioned in the “Energy-Saving Technical Standard for Rural Residential Buildings in Xi’an Area,” the length of a new rural residence should not exceed 18 m, and the floor height should not exceed 3 m [51]. The length of the optimization strategy is 12.6 m and the floor height is 2.7 m. Additionally, the thickness of the insulation layer for the external insulation structure in the standard is 20 mm, while the thickness of the optimization strategy is 60 mm [51]. These values can provide supplementary optimized values for the implementation of relevant standards in the future.
In the current composition of residents in rural areas of Xi’an, the majority of those who permanently reside in the countryside are elderly. Children and adults have higher mobility, as they work or study in urban areas during weekdays and only stay in the rural areas during weekends or holidays [41]. For this population of residents, it is relatively difficult to develop thermal adaptability to the indoor thermal environment of rural dwellings. In the future promotion of the rural revitalization work, a large number of people will return to rural areas, and many personnel engaged in revitalization work will reside in rural areas. These people also lack thermal adaptability to rural dwellings [55]. Therefore, after achieving further progress in the rural revitalization work and stabilizing the number of permanent residents in rural areas, the impact of thermal adaptability on the optimization design strategy for rural dwellings can be further considered.

6. Conclusions

This study took rural dwellings surrounding Xi’an City as an example, conducted field investigation on rural dwellings, simulated the influence of different design indicators on indoor PET during winter and summer, and obtained the composite effect of multiple design indicators on indoor PET. The study drew the following conclusions.
  • Through field investigation, it was found that the 11 rural dwellings in the study had similar characteristics in terms of homestead shape, courtyard spatial layout, building structure, building form, and functional room types, which was consistent with the current characteristics of rural dwellings around Xi’an. There were differences in the building orientation, number of floors, building materials, and building spatial dimensions. The value or type range of each design element was extracted through measurements. Based on the measurement results, the basic model of rural dwellings around Xi’an was established.
  • This study simulated the indoor PET of the basic model on the winter solstice and summer solstice days under the variation of single design indicators, including the building orientation, floor height, roof type, exterior wall cladding material, insulation layer setting method, window-to-wall ratio, and window material. The optimal values for each indicator that resulted in the best overall indoor thermal environment in winter and summer were as follows: south-facing orientation, 3.0 m floor height, color steel roof, cement exterior wall cladding material, external insulation, 40% south window-to-wall ratio, 10% north window-to-wall ratio, and aluminum alloy double glass window material.
  • Through composite-variable simulation, this study obtained the indoor PET simulation, resulting in 8400 working conditions corresponding to various building lengths, widths, heights, south window-to-wall ratios, north window-to-wall ratios, and insulation layer thicknesses. By comparing the results, a comprehensive design optimization strategy for rural dwellings was obtained. Compared to the basic model, this strategy optimized the building size, roof type, insulation layer setting method, window-to-wall ratio, and material. The optimized building had a length of 12.6 m, width of 7.8 m, floor height of 2.7 m, with a south window-to-wall ratio of 10%, and a north window-to-wall ratio of 10%. It used a color steel roof, a 60 mm-thick external insulation layer, a cement exterior wall cladding material, and an aluminum alloy double glass window material. By optimizing the design indicators, the indoor thermal environment in winter and summer can be improved, especially the PET value in winter. The optimization strategy can achieve an average increase of 4.17 °C in the winter PET value and an average decrease of 0.66 °C in summer. This study provides a reference for the design and renovation of rural dwellings in Xi’an and other rural areas in the cold regions of China and further provides assistance for the development of building energy conservation and green buildings in China.

Author Contributions

Conceptualization, Y.Q., Y.W. and X.L.; methodology, Y.W. and X.L.; investigation, Y.W. and X.L.; simulation, X.L.; writing—original draft preparation, Y.W., Y.Q. and X.L.; writing—review and editing, D.Z., Y.W., Y.Q. and X.L.; visualization, Y.W., Y.Q. and X.L.; supervision, D.Z., Y.W. and Y.Q. All authors have read and agreed to the published version of the manuscript.

Funding

This research was funded by the National Natural Science Foundation of China (No. 52108030), and the China National Key R&D Program (Grant No. 2018YFD110090504).

Institutional Review Board Statement

Not applicable.

Informed Consent Statement

Not applicable.

Data Availability Statement

The materials and the data that support the findings of this study are available from the corresponding author.

Conflicts of Interest

The authors declare no conflict of interest.

Appendix A. Results of the Field Investigation and Univariate Simulation

Table A1. Building design and construction elements.
Element1234567891011
OrientationEastNorthWestWestSouthWestWestEastSouthSouthNorth
Building structureBC 1BCBCBCBCBCBCBCBCBCBC
Insulation layer-----------
Exterior wall cladding materialCT 2CTCTCTCTCTC 3B 4CTCTCT
Roof typeFlat roofFlat roofPitched roofFlat roofPitched roofFlat roofPitched roofPitched roofFlat roofFlat roofPitched roof
Roof cladding materialCCCS 5CT 6CCSTCCT
Window frame materialW 7A 8AWWAWWWAW
Window glass typeSingle glassSingle glassSingle glassSingle glassSingle glassSingle glassSingle glassSingle glassSingle glassSingle glassSingle glass
Number of rooms911741371141579
Number of functional roomsLiving room11111111111
Bedroom54223322432
Kitchen11111110111
Washroom13102200201
Storeroom12200071724
Other------Shop1----
1 BC = Brick-concrete structure; 2 CT = Ceramic tile; 3 C = Cement; 4 B = Brick; 5 CS = Color steel; 6 T = Tile; 7 W = Wooden; 8 A = Aluminum alloy.
Table A2. Building space dimensions.
Element1234567891011
Homestead width (m)12.310.913.69.214.010.410.814.111.59.812.1
Homestead length (m)24.712.626.616.619.715.019.217.031.515.818.5
Homestead area (m2)303.8137.3361.8152.7247.7156207.4239.7362.3154.8223.9
Courtyard area (m2)144.732.9233.663.4105.551.955.8154.7203.753.4126.1
Main living room length (m)12.310.910.69.210.210.410.89.911.59.89.6
Main living room width (m)7.07.67.46.57.77.26.26.26.96.16.0
Gross floor area (m2)100.975.672.853.776.068.060.356.372.253.652.6
Number of floors22212121212
Floor height (m)Ground floor3.53.83.03.63.83.63.63.03.63.63.0
First floor2.73.83.9-3.5-3.6-3.6-3.0
Building height (m)6.78.87.94.27.74.18.23.67.74.96.7
Building area (m2)181.8151.2185.153.7152.068.0120.656.3164.253.6105.2
Main living room area (m2)Living room32.331.523.117.129.523.519.718.020.220.516.8
Bedroom121.88.023.117.110.810.919.118.012.917.116.8
Bedroom221.812.223.117.123.615.219.118.011.06.616.8
Bedroom321.823.0--13.715.2--12.96.6-
Bedroom432.323.0--13.7---11.0--
Bedroom521.8----------
Auxiliary room area (m2)Kitchen24.86.813.021.819.010.910.2-11.67.810.9
Washroom2.911.93.9-11.25.6--5.9-3.9
Storeroom16.822.841.7-72.3-126.011.2114.823.563.5
Window-to-wall ratioEast20%024%27%013%15%12%000
West24%024%27%031%22%7%000
South047%0032%00023%25%14%
North044%0024%00017%25%19%
Table A3. Univariate PET simulation results.
WinterSummer
OrientationSustainability 15 07889 i012Sustainability 15 07889 i013
Floor heightSustainability 15 07889 i014Sustainability 15 07889 i015
Roof formSustainability 15 07889 i016Sustainability 15 07889 i017
Exterior wall
cladding material
Sustainability 15 07889 i018Sustainability 15 07889 i019
Insulation layerSustainability 15 07889 i020Sustainability 15 07889 i021
Window-to-wall ratioSustainability 15 07889 i022Sustainability 15 07889 i023
Window materialSustainability 15 07889 i024Sustainability 15 07889 i025

References

  1. Li, H.B.; Yuan, Y.; Zhang, X.L.; Li, Z.; Wang, Y.H.; Hu, X.L. Evolution and transformation mechanism of the spatial structure of rural settlements from the perspective of long-term economic and social change: A case study of the Sunan region, China. J. Rural Stud. 2022, 93, 234–243. [Google Scholar] [CrossRef]
  2. Ministry of Housing and Urban-Rural Development of the People’s Republic of China. China Urban-Rural Construction Statistical Yearbook 2020; China Statistics Press: Beijing, China, 2021.
  3. Jiang, Q.; Li, Y.H.; Si, H.Y. Digital Economy Development and the Urban-Rural Income Gap: Intensifying or Reducing. Land 2022, 11, 1980. [Google Scholar] [CrossRef]
  4. National Bureau of Statistics of China. China Statistical Yearbook 2020; China Statistics Press: Beijing, China, 2021.
  5. Ao, Y.B.; Zhang, Y.T.; Wang, Y.; Chen, Y.F.; Yang, L.C. Influences of rural built environment on travel mode choice of rural residents: The case of rural Sichuan. J. Transp. Geogr. 2020, 85, 102708. [Google Scholar] [CrossRef]
  6. Xu, J.; Ma, H.T.; Luo, J.; Huo, X.P.; Yao, X.B.; Yang, S.M. Spatial optimization mode of China’s rural settlements based on quality-of-life theory. Environ. Sci. Pollut. Res. 2019, 26, 13854–13866. [Google Scholar] [CrossRef]
  7. Ma, L.B.; Liu, S.C.; Fang, F.; Che, X.L.; Chen, M.M. Evaluation of urban-rural difference and integration based on quality of life. Sustain. Cities Soc. 2020, 54, 101877. [Google Scholar] [CrossRef]
  8. Li, Y.X.; Xie, Z.F.; Li, B.; Mohiuddin, M. The Impacts of In Situ Urbanization on Housing, Mobility and Employment of Local Residents in China. Sustainability 2022, 14, 9058. [Google Scholar] [CrossRef]
  9. Zhao, Q.L.; Jiang, G.H.; Ma, W.Q.; Yang, Y.T.; Zhou, T. The production function socialization trend of rural housing land and its response to rural land planning in metropolitan suburbs from the perspective of rural space commodification. Front. Environ. Sci. 2022, 10, 979698. [Google Scholar] [CrossRef]
  10. Liu, Y. The basic theory and methodology of rural revitalization planning in China. Acta Geogr. Sin. 2020, 75, 1120–1133. [Google Scholar]
  11. Xiong, Y.; Liu, J.L.; Kim, J.S. Understanding differences in thermal comfort between urban and rural residents in hot summer and cold winter climate. Build. Environ. 2019, 165, 106393. [Google Scholar] [CrossRef]
  12. Zhang, X.C.; Zhang, X.Q. Comparison and sensitivity analysis of embodied carbon emissions and costs associated with rural house construction in China to identify sustainable structural forms. J. Clean. Prod. 2021, 293, 126190. [Google Scholar] [CrossRef]
  13. Cui, Y.Q.; Sun, N.H.; Cai, H.B.; Li, S.M. Indoor Temperature Improvement and Energy-Saving Renovations in Rural Houses of China’s Cold Region-A Case Study of Shandong Province. Energies 2020, 13, 870. [Google Scholar] [CrossRef]
  14. Gao, J.L.; Jiang, W.X.; Chen, J.L.; Liu, Y.S. Housing-industry symbiosis in rural China: A multi-scalar analysis through the lens of land use. Appl. Geogr. 2020, 124, 102281. [Google Scholar] [CrossRef]
  15. Dongyang, L.; Lei, Y.; Xiang, C.; Gaoju, S. The Visualization Study on Research Progress of Thermal Comfort for Indoor Environment Based on CiteSpace. IOP Conf. Ser. Earth Environ. Sci. 2020, 514, 032033. [Google Scholar] [CrossRef]
  16. Liu, Z.M.; Jin, Y.M.; Jin, H. The Effects of Different Space Forms in Residential Areas on Outdoor Thermal Comfort in Severe Cold Regions of China. Int. J. Environ. Res. Public Health 2019, 16, 3960. [Google Scholar] [CrossRef] [PubMed]
  17. Li, Z.X.; Tian, M.M.; Zhao, Y.F.; Zhang, Z.; Ying, Y.X. Development of an Integrated Performance Design Platform for Residential Buildings Based on Climate Adaptability. Energies 2021, 14, 8223. [Google Scholar] [CrossRef]
  18. Chen, J.H.; Lu, L.; Gong, Q.; Lau, W.Y.; Cheung, K.H. Techno-economic and environmental performance assessment of radiative sky cooling-based super-cool roof applications in China. Energy Convers. Manag. 2021, 245, 114621. [Google Scholar] [CrossRef]
  19. Ma, X.; Zhao, J. Simulation Study on The Influence of Greening Rate of Urban Residential Clusters on the Distribution of Suspended Particulate Matters. Appl. Ecol. Environ. Res. 2019, 17, 10335–10356. [Google Scholar] [CrossRef]
  20. Zhang, X.F.; Wang, Y.P.; Zhou, D.A.; Yang, C.; An, H.B.; Teng, T. Comparison of Summer Outdoor Thermal Environment Optimization Strategies in Different Residential Districts in Xi’an, China. Buildings 2022, 12, 1332. [Google Scholar] [CrossRef]
  21. Dauletbek, A.; Zhou, P.G. BIM-based LCA as a comprehensive method for the refurbishment of existing dwellings considering environmental compatibility, energy efficiency, and profitability: A case study in China. J. Build. Eng. 2022, 46, 103852. [Google Scholar] [CrossRef]
  22. Wang, Z.J.; Xue, Q.W.; Ji, Y.C.; Yu, Z.Y. Indoor environment quality in a low-energy residential building in winter in Harbin. Build. Environ. 2018, 135, 194–201. [Google Scholar] [CrossRef]
  23. Liu, M.; Zhang, B.G.; Ren, J.W.; Lian, C.L.; Yuan, J.; Hao, Q.L. Whole Life-Cycle Ecological Footprint of Rural Existing Houses in Northern China. Buildings 2018, 8, 92. [Google Scholar] [CrossRef]
  24. Shao, N.N.; Zhang, J.L.; Ma, L.D. Analysis on indoor thermal environment and optimization on design parameters of rural residence. J. Build. Eng. 2017, 12, 229–238. [Google Scholar] [CrossRef]
  25. Ren, Y.-C.; Liu, Q.-B. Green Performance of Rural Houses Based on Regional Adaptability. Build. Energy Effic. 2021, 2021, 26–33. [Google Scholar]
  26. Shao, T.; Jin, H.; Zheng, W.X. Optimization Research of Rural Houses Envelope Parameters in Severe Cold Regions of China. IOP Conf. Ser. Earth Environ. Sci. 2020, 581, 012037. [Google Scholar] [CrossRef]
  27. Chi, F.A.; Wang, Y.H.; Wang, R.N.; Li, G.M.; Peng, C.H. An investigation of optimal window-to-wall ratio based on changes in building orientations for traditional dwellings. Sol. Energy 2020, 195, 64–81. [Google Scholar] [CrossRef]
  28. Zhang, S.J.; Jiang, J.M.; Gao, W.J. Application evaluation and optimization of the sunroom in rural residential houses in Southeast Shandong Province, China. Sol. Energy 2023, 251, 208–222. [Google Scholar] [CrossRef]
  29. Zhang, B.G.; Cai, X.L.; Liu, M. Study on a New Type of Ventilation System for Rural Houses in Winter in the Severe Cold Regions of China. Buildings 2022, 12, 1010. [Google Scholar] [CrossRef]
  30. Fan, J.L.; Zeng, B.; Hu, J.W.; Zhang, X.; Wang, H. The impact of climate change on residential energy consumption in urban and rural divided southern and northern China. Environ. Geochem. Health 2020, 42, 969–985. [Google Scholar] [CrossRef]
  31. Pan, W.T.; Mei, H.Y. A Design Strategy for Energy-Efficient Rural Houses in Severe Cold Regions. Int. J. Environ. Res. Public Health 2020, 17, 6481. [Google Scholar] [CrossRef]
  32. Shao, T.; Zheng, W.X.; Cheng, Z. Passive Energy-Saving Optimal Design for Rural Residences of Hanzhong Region in Northwest China Based on Performance Simulation and Optimization Algorithm. Buildings 2021, 11, 421. [Google Scholar] [CrossRef]
  33. Xi’an Municipal Bureau of Statistics. Xi’an Statistical Yearbook 2020; China Statistics Press: Beijing, China, 2020.
  34. Shao, T.; Zheng, W.X.; Li, X.X.; Yang, W.L.; Wang, R.X. Multi-objective optimization design for rural houses in western zones of China. Archit. Sci. Rev. 2022, 65, 260–277. [Google Scholar] [CrossRef]
  35. Zhao, Q.; Fan, X.N.; Wang, Q.; Sang, G.C.; Zhu, Y.Y. Research on Energy-Saving Design of Rural Building Wall in Qinba Mountains Based on Uniform Radiation Field. Math. Probl. Eng. 2020, 2020, 9786895. [Google Scholar] [CrossRef]
  36. Cai, S.S. Research on the spatial form of traditional Guanzhong residential buildings in Shaanxi, China. Urban Archit. Space 2022, 29, 197–199+202. [Google Scholar]
  37. Zhang, B.T.; Liu, Z.Y. Shaanxi Residential Buildings; China Architecture & Building Press: Beijing, China, 2018. [Google Scholar]
  38. Yu, Z.C.; Liu, J.P. Research on vernacular dwelling of Guanzhong area. J. Northwest Univ. (Nat. Sci. Ed.) 2009, 39, 860–864. [Google Scholar]
  39. Liu, Y.D.; Ning, Q. Triple understanding of Guanzhong Narrow Courtyard and its house space. J. Hous. Built Environ. 2021, 36, 521–537. [Google Scholar] [CrossRef]
  40. Li, Y.; Lian, M. Analysis on the Layout of Traditional Residential Courtyards and Building Structures in Guanzhong Area, ShaanxiTaking Xiaojiapo Village in Lantian County as an example. IOP Conf. Ser. Earth Environ. Sci. 2021, 768, 012141. [Google Scholar] [CrossRef]
  41. He, W.; Chen, Y.; Wang, D.; Chen, G. Classification of Existing Residential Indoor Thermal Comfort in Cold Regions of China: A Case of Xi’an. Build. Sci. 2019, 35, 61. [Google Scholar]
  42. Chang, H.; Lee, I. A Study of Passive Design Strategy on Typical Village House in XiAn, Northwestern China. Korean Soc. Living Environ. Syst. 2019, 26, 400–414. [Google Scholar] [CrossRef]
  43. Morakinyo, T.E.; Dahanayake, K.W.D.K.C.; Adegun, O.B.; Balogun, A.A. Modelling the effect of tree-shading on summer indoor and outdoor thermal condition of two similar buildings in a Nigerian university. Energy Build. 2016, 130, 721–732. [Google Scholar] [CrossRef]
  44. Sharmin, T.; Steemers, K.; Humphreys, M. Outdoor thermal comfort and summer PET range: A field study in tropical city Dhaka. Energy Build. 2019, 198, 149–159. [Google Scholar] [CrossRef]
  45. Sulzer, M.; Christen, A.; Matzarakis, A. Predicting indoor air temperature and thermal comfort in occupational settings using weather forecasts, indoor sensors, and artificial neural networks. Build. Environ. 2023, 234, 110077. [Google Scholar] [CrossRef]
  46. Chen, Y.C.; Chen, W.N.; Chou, C.C.K.; Matzarakis, A. Concepts and New Implements for Modified Physiologically Equivalent Temperature. Atmosphere 2020, 11, 694. [Google Scholar] [CrossRef]
  47. Tian, Z.; Zhang, X.; Jin, X.; Zhou, X.; Si, B.; Shi, X. Towards adoption of building energy simulation and optimization for passive building design: A survey and a review. Energy Build. 2018, 158, 1306–1316. [Google Scholar] [CrossRef]
  48. Azar, E.; O’Brien, W.; Carlucci, S.; Hong, T.; Sonta, A.; Kim, J.; Andargie, M.S.; Abuimara, T.; El Asmar, M.; Jain, R.K.; et al. Simulation-aided occupant-centric building design: A critical review of tools, methods, and applications. Energy Build. 2020, 224, 110292. [Google Scholar] [CrossRef]
  49. Ostergard, T.; Jensen, R.L.; Maagaard, S.E. Building simulations supporting decision making in early design—A review. Renew. Sustain. Energy Rev. 2016, 61, 187–201. [Google Scholar] [CrossRef]
  50. Ministry of Housing and Urban-Rural Development of the People’s Republic of China. GB/T 50176-2016 Technical Standard for Thermal Design of Civil Buildings; China Architecture & Building Press: Beijing, China, 2016.
  51. Department of Housing and Urban-Rural Development of Shaanxi Province. DB/J 61/T91-2014 Energy Saving Technical Standard for Rural Residential Buildings in Xi’an Area; China Architecture & Building Press: Beijing, China, 2014.
  52. Xi’an Municipal People’s Government. Xi’an “14th Five-Year” Agricultural and Rural Modernization Plan; General Office of Xi’an Municipal People’s Government: Xi’an, China, 2022.
  53. Zhang, T.; Hu, Q.N.; Ding, Q.; Zhou, D.; Gao, W.J.; Fukuda, H. Towards a Rural Revitalization Strategy for the Courtyard Layout of Vernacular Dwellings Based on Regional Adaptability and Outdoor Thermal Performance in the Gully Regions of the Loess Plateau, China. Sustainability 2021, 13, 13074. [Google Scholar] [CrossRef]
  54. Cheng, T.; Wang, N.; Liu, C.H.; Iop. Research on Energy Consumption of Building Layout and Envelope for Rural Housing in the Cold Region of China. In Proceedings of the 4th Asia Conference of International-Building-Performance-Simulation-Association (ASIM), Hong Kong, China, 3–5 December 2018. [Google Scholar]
  55. Zhang, T.; Duan, Y.C.; Jiao, Z.Q.; Ye, X.; Hu, Q.N.; Fukuda, H.; Gao, W.J. Towards Improving Rural Living Environment for Chinese Cold Region Based on Investigation of Thermal Environment and Space Usage Status. Buildings 2022, 12, 2139. [Google Scholar] [CrossRef]
Figure 1. Design characteristics of existing rural dwellings around Xi’an (self-made by the author based on [36,37]). (a) Spatial layout. (b) Building construction.
Sustainability 15 07889 g001
Figure 2. Flowchart of the software simulation method.
Sustainability 15 07889 g002
Figure 3. General plan and household selection of Shachang Village (Numbers are the serial number of each household).
Sustainability 15 07889 g003
Figure 4. General plan and household selection of Guanjia Village (Numbers are the serial number of each household).
Sustainability 15 07889 g004
Figure 5. Spatial layout of the basic model.
Sustainability 15 07889 g005
Figure 6. Digital model of the basic model.
Sustainability 15 07889 g006
Table 1. Types of rural dwellings around Xi’an (self-made by the author based on [37,39]).
TypeClassification
StructureRaw soil structure, brick–concrete structure
Number of floors1, 2
Roof formFlat roof, pitched roof, semi-pitched roof
Exterior wall cladding materialCeramic tile, cement, brick, raw soil
Table 2. Comparison of different simulation engines.
Simulation EnginesComputing SceneMulti-Platform Support
EnergyPlusVarious transient systemsAble
IESVELinear and steady-state systemsAble
DeSTLinear and steady-state systemsNot able
Table 3. Main classification of rural dwellings’ design types.
TypeClassification
OrientationSouth, North, East, West
Number of floors1, 2
Roof formFlat roof, pitched roof
Exterior wall cladding materialCeramic tile, cement, brick
Table 4. Building plans.
Number123
PlanSustainability 15 07889 i001Sustainability 15 07889 i002Sustainability 15 07889 i003
Number456
PlanSustainability 15 07889 i004Sustainability 15 07889 i005Sustainability 15 07889 i006
Number789
PlanSustainability 15 07889 i007Sustainability 15 07889 i008Sustainability 15 07889 i009
Number1011
PlanSustainability 15 07889 i010Sustainability 15 07889 i011
Table 5. Main living room design elements and ranges.
ElementRange
Length (m)9.2–12.3
Width (m)6.0–7.7
Floor height (m)2.7–3.9
WWR Front12–47%
WWR Rear7–44%
OrientationEast, West, South, North
Number of floors1, 2
Exterior wall cladding materialCeramic tile, cement, brick
Roof typePitched roof, flat roof, color steel roof
Window materialWooden single glass, aluminum alloy single glass
Table 6. The main parameters’ average values of outdoor climate conditions.
TimeAir Temperature (°C)Relative
Humidity (%)
Wind
Speed (m/s)
Global
Radiation (W/m2)
Mean Radiant
Temperature (°C)
23 December1.7671.721.2123.871.76
23 June26.5654.421.79250.9326.56
Table 7. Thermal parameters of structural materials.
MaterialThickness (mm)Thermal Conductivity (W/mK)Density (kg/m3)Specific Heat Capacity (J/kgK)
Brick2400.51014401050
Concrete1000.7702000960
Steel-58.2007850480
Ceramic tile201.99027002600
Cement200.87017001050
EPS (Insulation board)200.039201380
Table 8. Thermal parameters of window materials.
MaterialThermal Conductivity (W/mK)Total Solar TransmittanceVisible Light Transmittance
Wooden single glass4.6000.820.77
Aluminum alloy single glass4.3000.820.77
Wooden double glass2.8000.750.71
Aluminum alloy double glass2.4000.750.71
Table 9. Personnel object condition settings.
FeatureParameter
Age60
GenderMale
Height (cm)175
Weight (kg)75
Metabolic rate (met)1.2
Clothing thermal resistance (Clo)Winter1.51
Summer0.36
Table 10. Design values of the basic model.
IndicatorValue
Number of rooms9
Number of main roomsLiving room1
Bedroom2
Number of auxiliary roomsKitchen1
Washroom1
Storeroom4
Length (m)10.0
Width (m)6.0
Homestead area (m2)180.0
Building area (m2)120.0
Gross floor area (m2)60.0
Courtyard area (m2)84.0
Main room area (m2)Living room24.0
Bedroom 118.0
Bedroom 218.0
Auxiliary room area (m2)Kitchen12.0
Washroom6.0
Storeroom78.0
Building floors2
Floor height (m)3.0
Building height (m)6.0
Roof formFlat roof
Building orientationSouth
Window-to-wall ratioEast0
West0
South20%
North10%
Building structureBrick–concrete structure
Exterior wall cladding materialCeramic tile
Window materialWooden single glass
Insulation-
Table 11. Univariate simulation indicator settings.
IndicatorsVariables
OrientationSouth, North, East, West
Floor height (m)3.0, 3.6
Roof formFlat roof, color steel roof
Exterior wall cladding materialCeramic tile, cement
Insulation layerNone, internal insulation, external insulation
Window-to-wall ratio20%S10%N, 30%S10%N, 40%S10%N, 20%S20%N, 30%S20%N, 40%S20%N
Window materialWooden single glass, aluminum alloy single glass, wooden double glass, aluminum alloy double glass
Table 12. Univariate PET optimization results.
IndicatorsVariablesTwi (°C)Tsi (°C)ΔTw (°C)ΔTs (°C)ΔT (°C)
OrientationSouth3.8931.500.000.000.00
North3.7431.35−0.16−0.14−0.01
East3.7632.24−0.130.74−0.87
West3.8933.350.001.85−1.85
Floor height3.0 m3.8931.500.000.000.00
3.6 m3.4231.30−0.47−0.19−0.28
Roof formFlat roof3.8931.500.000.000.00
Color steel roof4.0930.870.20−0.620.82
Exterior wall cladding materialCeramic tile3.8931.500.000.000.00
Cement4.1331.730.240.230.01
Insulation layerNone3.8931.500.000.000.00
Internal insulation5.4532.241.550.750.81
External insulation5.8031.721.910.221.69
Window-to-wall ratio20%S10%N3.8931.500.000.000.00
30%S10%N4.0231.680.130.18−0.05
40%S10%N4.5631.850.660.360.31
20%S20%N3.8831.41−0.01−0.080.07
30%S20%N3.9731.620.080.12−0.04
40%S20%N4.5031.880.610.380.23
Window materialWooden single glass3.8931.500.000.000.00
Aluminum alloy
single glass
3.9231.530.030.020.01
Wooden double glass3.9831.470.09−0.030.11
Aluminum alloy double glass4.0231.500.130.000.13
Table 13. Composite-variable simulation indicator settings.
IndicatorsVariables
Length (m)9.0, 9.9, 10.8, 11.7, 12.6
Width (m)6.0, 6.3, 6.6, 6.9, 7.2, 7.5, 7.8
Floor height (m)2.7, 3.0, 3.3, 3.6, 3.9
Insulation layer thickness (mm)20, 40, 60
WWR South10%, 20%, 30%, 40%
WWR North10%, 20%, 30%, 40%
Table 14. Composite-variable winter PET simulation results (top ten items after sorting).
Length (m)Width (m)Floor Height (m)Insulation Layer Thickness (mm)WWR SouthWWR NorthTwi (°C)
12.67.82.76010%10%11.04
12.67.82.76040%10%10.97
12.67.82.76020%10%10.94
12.67.52.76010%10%10.94
11.77.82.76010%10%10.94
12.67.82.76030%10%10.85
12.67.52.76020%10%10.84
11.77.82.76020%10%10.84
11.77.52.76010%10%10.83
10.87.82.76010%10%10.83
Table 15. Composite-variable summer PET simulation results (top ten items after sorting).
Length (m)Width (m)Floor Height (m)Insulation Layer Thickness (mm)WWR SouthWWR NorthTsi (°C)
97.83.96010%10%30.87
97.53.96010%10%30.87
963.36010%10%30.87
963.96010%10%30.87
97.23.96010%10%30.87
963.66010%10%30.87
97.83.66010%10%30.87
96.93.96010%10%30.87
97.53.66010%10%30.87
97.83.36010%10%30.87
Table 16. Compound-variable PET optimization results (top ten items after sorting).
Length
(m)
Width
(m)
Floor Height
(m)
Insulation Layer
Thickness
(mm)
WWR SouthWWR NorthTwi (°C)Tsi (°C)ΔTw (°C)ΔTs (°C)ΔT (°C)
12.67.82.76010%10%11.0430.974.17−0.664.82
11.77.82.76010%10%10.9430.954.06−0.674.73
12.67.52.76010%10%10.9430.964.06−0.664.72
10.87.82.76010%10%10.8330.943.95−0.684.63
11.77.52.76010%10%10.8330.953.96−0.674.63
12.67.22.76010%10%10.8230.963.95−0.664.61
10.87.52.76010%10%10.7230.943.85−0.694.53
9.97.82.76010%10%10.7130.923.83−0.704.53
11.77.22.76010%10%10.7330.953.85−0.674.52
12.66.92.76010%10%10.7030.963.83−0.664.49
Table 17. Optimization strategy design indicators.
IndicatorOriginal ValueOptimization Value
Number of rooms99
Number of main roomsLiving room11
Bedroom22
Number of auxiliary roomsKitchen11
Washroom11
Storeroom44
Length (m)10.012.6
Width (m)6.07.8
Homestead area (m2)180.0249.5
Building area (m2)120.0196.6
Gross floor area (m2)60.098.3
Courtyard area (m2)84.0115.7
Main room area (m2)Living room32.824.0
Bedroom 132.818.0
Bedroom 232.818.0
Auxiliary room area (m2)Kitchen12.012.0
Washroom6.06.0
Storeroom116.378.0
Building floors22
Floor height (m)3.02.7
Building height (m)6.05.4
Roof formFlat roofColor steel roof
Building orientationSouthSouth
Window-to-wall ratioEast00
West00
South20%10%
North10%10%
Building structureBrick–concrete structureBrick–concrete structure
Exterior wall cladding materialCeramic tileCement
Window materialWooden single glassAluminum alloy double glass
Insulation-External insulation (60 mm)
Disclaimer/Publisher’s Note: The statements, opinions and data contained in all publications are solely those of the individual author(s) and contributor(s) and not of MDPI and/or the editor(s). MDPI and/or the editor(s) disclaim responsibility for any injury to people or property resulting from any ideas, methods, instructions or products referred to in the content.

