Article

Presence and Flow as Moderators in XR-Based Sustainability Education

by
Miriam Mulders
* and
Kristian Heinrich Träg
*
Chair of Educational Technology and Instructional Design, University of Duisburg-Essen, 45141 Essen, Germany
*
Authors to whom correspondence should be addressed.
Sustainability 2023, 15(23), 16496; https://doi.org/10.3390/su152316496
Submission received: 29 September 2023 / Revised: 28 November 2023 / Accepted: 29 November 2023 / Published: 1 December 2023
(This article belongs to the Special Issue The Use of Digital Technology for Sustainable Teaching and Learning)

Abstract

:
Virtual reality (VR) and augmented reality (AR) are emerging technologies with a variety of potential benefits for sustainability education. Here, learning processes such as flow and presence seem to determine the learning experience. Therefore, this paper presents the results of a mixed-methods study investigating a VR- and AR-based learning application on biodiversity developed by greenpeace. A total of 156 students tested the application addressing the Amazon rainforest and rated its efficacy in terms of effects on knowledge, interest, and attitude. Pre- and post-questionnaires as well as focus groups were used to uncover within-subject effects. The study results revealed that flow and presence had a moderating effect on knowledge and that this effect is strongest in learners with little prior knowledge. Presence also showed a moderating effect on one of three attitude measures. In general, the learning application was able to increase knowledge and improve attitude in this sample. The focus groups also revealed that the students engaged with environmental topics even after the experience. They also formed ideas for more environmentally friendly behavioral change. Moreover, the students described the application as impressive, captivating, and realistic. It can be concluded that presence and flow are crucial processes for learning with VR and AR technologies.

1. Introduction

Virtual and augmented reality (VR/AR) technologies have increasingly gained attention in educational settings over the recent years. They are expected to be widely used in classrooms, but investigation of their educational potential has only just begun [1,2,3]. However, the nomenclature surrounding VR and AR technologies is somewhat disputed. On one hand, VR and AR could be viewed as end points on the same spectrum, where the distinguishing feature is the degree of immersion [4]. On the other hand, AR and VR could be construed as two different qualities of experience, where AR applications address a form of physical presence augmented by virtual features while VR aims at a form of telepresence, or feeling present within the virtual space [5]. Hence, Rauschnabel et al. [5] use the umbrella term xReality or XR to describe both AR and VR technologies, where the X denotes a placeholder. Here, it is not appropriate to equate XR with extended reality [6]. In this paper, the term XR will be utilized to describe an application that incorporates both AR and VR elements.
The learning application investigated in this study is called On Biodiversity’s Tracks. It is a virtual XR environment developed by greenpeace, a non-profit organization that is active in the field of environmentalism. It allows students to visit places like the Great Barrier Reef or the Amazon rainforest to learn about the people, animals, and environment there. The goal of the greenpeace XR application is to foster knowledge on environmental sustainability and biodiversity while also increasing students’ interest and possibly leading to a more positive attitude towards the environment and sustainable behavior [7]. The general effectiveness of the XR application concerning knowledge, interest, and attitude is reported in another paper [8]. This paper focuses on examining the learning processes that occur during the exploration of the application (e.g., experiencing presence in a virtual world) and their moderating effects. A mixed-methods approach is implemented to make use of the advantages of both quantitative and qualitative data analysis. Overall, this study serves to deepen our understanding of how the learning processes of presence and flow that take place when learning with XR, affect knowledge, interest, and attitude, all while evaluating a ready-made XR application for classroom use. This is important because educational XR applications, especially those in the German language, are relatively sparse [9].

2. Literature Review

2.1. Classification of VR/AR Technology

VR is understood as a computer-generated simulation that is three-dimensional (3D), multisensory, and interactive. The user can inhabit and act within an external environment [10,11]. VR enables unique learning scenarios, as simulations allow students to act as if they were in a real environment while interacting with otherwise intangible or inaccessible objects [12,13]. VR provides users with the experience of a different world that may otherwise be too dangerous, expensive, or impossible in the real world [14,15]. AR, in contrast, is used to enhance and enrich the real-world learning experience. It involves overlaying digital information, such as images, videos, 3D models, or text, onto the real-world environment to provide users with additional context, interactivity, and engagement [16].
In everyday language, the terms VR and AR are often used as umbrella-terms including a variety of heterogenous technologies [17,18]. Thus, VR and AR are presented to users through different technological approaches and devices, each offering distinct experiences. Whereas head-mounted displays (HMDs) completely immerse users in a computer-generated virtual world by covering their field of vision with screens [19], mobile devices’ cameras are commonly used for AR learning scenarios by embedding digital content into the real world [20]. Further technologies are also utilized, for example HoloLens for AR, and various mobile devices (e.g., tablets) for VR. It has been demonstrated that many researchers face challenges when categorizing the technology they utilize. In many cases, a distinction is also made between immersive technologies (e.g., HMDs) and non-immersive technologies (e.g., tablets). However, often, a single technology combines features of both AR and VR [1], as is the case for the application investigated in the present study. Rauschnabel et al. provide a suitable alternative by introducing the term XR, with the X serving as a placeholder [5]. In this context, XR is not to be equated with extended reality [6,21] but is rather used in this paper to denote a single application comprising multiple VR and AR elements.

2.2. Learning with VR/AR

VR and AR technologies are considered to have great potential for designing teaching and learning scenarios. They open a range of multifaceted applications for schools, universities, and other educational institutions [1,2,3,22]. The Cognitive Affective Model of Immersive Learning (CAMIL) addresses two facets of immersion that improve learning through XR technology: agency and presence [23]. A higher degree of interactivity as well as the feeling of actually being in the virtual environment and interacting with seemingly real social agents are beneficial for the learning process, especially for procedural learning [23,24].
In recent years, there has been increasing effort to make use of the multiple possibilities of VR and AR to enhance and diversify learning processes in educational settings. In this context, the unique characteristics of VR and AR have been associated with several learning affordances such as improved spatial knowledge representation, enhanced empathy, increased motivation and student engagement, higher contextualization of learning, and experiential learning scenarios [14,25]. Thus, VR and AR are particularly relevant for learning content that cannot easily be studied in a traditional classroom setting [26,27], such as exploring the universe and planetary constellations or visiting the Amazon rainforest, which is investigated in this study.
Recently, VR and AR technologies are increasingly being used for environmental subjects, i.e., climate change or biodiversity loss, as a tool to inform and engage the public with current and future environmental issues [28,29]. The potential to influence the affective experience through VR or AR appears promising. According to Mayer and Frantz [30], a feeling of connectedness to nature leads to a stronger concern for nature and can invoke tangible actions such as pro-environmental behavior. VR and AR technologies can indeed evoke such feelings of connectedness. They offer increasing engagement and provide interactive, action-oriented, affective, and empathetic experiences [16]. Individuals can take on someone else’s perspective, get interactively involved, see consequences, foresee future climate change scenarios, and experience sensory stimulations that can have a strong impact on affections [31]. However, there are still only limited numbers of VR and AR learning applications dealing with sustainability topics. Valid research results for the use of these applications in the various fields of the Sustainable Development Goals (SDGs) are still in early stages [32].

2.3. Determinants of VR/AR Learning

With VR and AR technologies becoming increasingly prevalent and popular in classroom use—outside of sustainability education—several determinants of successful learning in VR and AR have already been examined. Ease of use seems to be one relevant factor, since many students find VR and AR technologies difficult to use [33,34]. Prior experiences with the technology and amount of practice also influence learning outcomes [35]. With these determining factors set, finding more relevant correlating variables could enhance our understanding of VR and AR learning even further. Specifically, exploring moderating factors could help explain how the affording mechanisms of technology, agency, and presence [23] influence learning.
Multiple previous studies present possible moderators. Johnson–Glenberg et al. [36] outline embodiment, collaboration, presence, and possibly novelty as key contributing factors. In addition, the experience of flow seems to be correlated with the success of a VR learning activity [37,38]. According to Zhang et al. [35], discipline plays an additional role, with overall large effect sizes for science, language, and health and medicine, and insignificant effect sizes for engineering. In that study, grade level, input as well as output devices, and pedagogy and instructional function did not play a role as moderators. In contrast, usability seems to be another relevant factor for feeling present in VR and AR applications [39]. In addition, it should be noted that contextual variables (e.g., the prior knowledge, prior interest, and prior attitude of users) may also have an influence on the learning outcomes [40].

2.4. Experiencing Presence and Flow in VR/AR

Presence has frequently been named as one of the underlying affordances of VR and AR technologies [23,40,41,42]. It is often understood as the feeling of being there, captured in three dimensions: Social presence describes the feeling of interacting with actual people, or with digital agents seeming real [43,44]. Physical presence refers to the sensation of being spatially inside the virtual environment, whereas self-presence refers to the feeling of being represented or the avatar feeling representative of oneself inside the virtual landscape [43,44]. Typically, 3D applications are associated with higher physical and social presence than 2D environments, while physical presence is frequently perceived stronger than social presence [45,46]. Given that the greenpeace XR application does not use player avatars, self-presence will not be examined further in this paper.
Generally, some research results suggest that presence influences learning in virtual environments. However, opposite research findings are detectable. Whereas some results indicate that the experience of presence has a positive effect on the learning outcomes to the extent that a higher level of presence experience requires a stronger focus of attention on learning-relevant stimuli [47,48], Makransky et al. [49] found a negative correlation between learning and presence experience. The authors concluded that higher presence could lead to distraction by many irrelevant details or high arousal.
Flow experience has also been associated with VR and AR learning technologies [50]. Flow is often characterized by perceiving an activity as highly satisfying, with a minimal or even complete absence of a sense of separation between the individual and the activity itself [51]. During such experiences, the actions become almost automated, leading to more efficient and faster performance. Another notable aspect of the flow state is the subjective loss of awareness of time passing [50]. Rheinberg and colleagues have conceptualized flow as a multidimensional construct, consisting of two key facets: absorbedness and smooth automated progression. The former represents complete engagement in an activity, while the latter refers to the seamless flow of consecutive actions [52].
In general, there remains a limited body of empirical research on the relationship between flow experiences in VR and AR and various learning parameters. The present study aims to contribute to the understanding of this relationship.
In game-based learning, engagement was linked to presence and flow, and had a positive effect on learning [53]. Kye and Kim [54] also found that presence and flow positively impact student satisfaction and learning outcomes. Likewise, in a game-based study, Janssen et al. [55] assumed that greater feelings of presence in VR leads to better user experiences and affords student interaction with the virtual environment. In their exploratory experiment, flow correlated positively with presence.
Overall, presence and flow seem to be related to a positive game experience, and by extension, to better task performance [55].
Our literature review found that utilizing VR and AR technology in learning environments usually increases learning achievement [33,34,56,57]. However, within this paper, we do not aim to investigate the effectiveness of the XR learning application itself. Rather, we seek to understand the underlying mechanisms. The literature suggests that certain characteristics of VR and AR lead to a stronger perception of presence and flow, which in turn influences learning outcomes. Therefore, this study attempts to explore determinants of learning using an XR learning application focused on sustainability topics (i.e., biodiversity in the Amazon rainforest).

3. Hypotheses and Key Questions

There is a growing body of research suggesting that basic comparisons between different types of media are neither methodologically nor substantially sound. Buchner and Kerres [58] as well as Mulders [40] pointed out that bare media comparisons between experimental and control groups neglect pedagogical idiosyncrasies of each of the respective mediums. Apart from that, the comparability of different media that provide different affordances is generally questionable [40]. For these reasons, the present study aims at expanding the common media comparison model by illuminating the mechanisms behind the effects. Specifically, flow and presence are being investigated as possible moderators [39,54,55] affecting change in knowledge, interest, and attitude [14,23,41]. To examine these effects, data were obtained from both a quantitative and a qualitative study.
We quantitatively examine the moderating effects of flow (Hypotheses 1) and presence (Hypotheses 2) on learning outcomes and test the following assumptions:
H1a. 
A higher perception of flow positively influences knowledge gained.
H1b. 
A higher perception of flow positively influences interest gained.
H1c. 
A higher perception of flow positively influences attitude improved.
H2a. 
A higher perception of presence positively influences knowledge gained.
H2b. 
A higher perception of presence positively influences interest gained.
H2c. 
A higher perception of presence positively influences attitude improved.
In these instances, knowledge is to be understood as the self-ascribed degree of declarative knowledge on the subject. Interest describes interest elicited by the presented topic, or topic interest [59]. Attitude is defined as the degree to which a person finds a psychological object favorable or unfavorable [60].
In addition to hypotheses testing, we will delve deeper into the relationships between flow, presence, and potential additional moderators through a qualitative investigation. We will examine the following key questions:
Q1:
To what degree did the students perceive long-term effects regarding their knowledge on, interest in, and attitude towards the Amazon rainforest?
Q2:
Which cognitive and/or affective processes did the students experience while learning with the XR application?

4. Materials and Methods

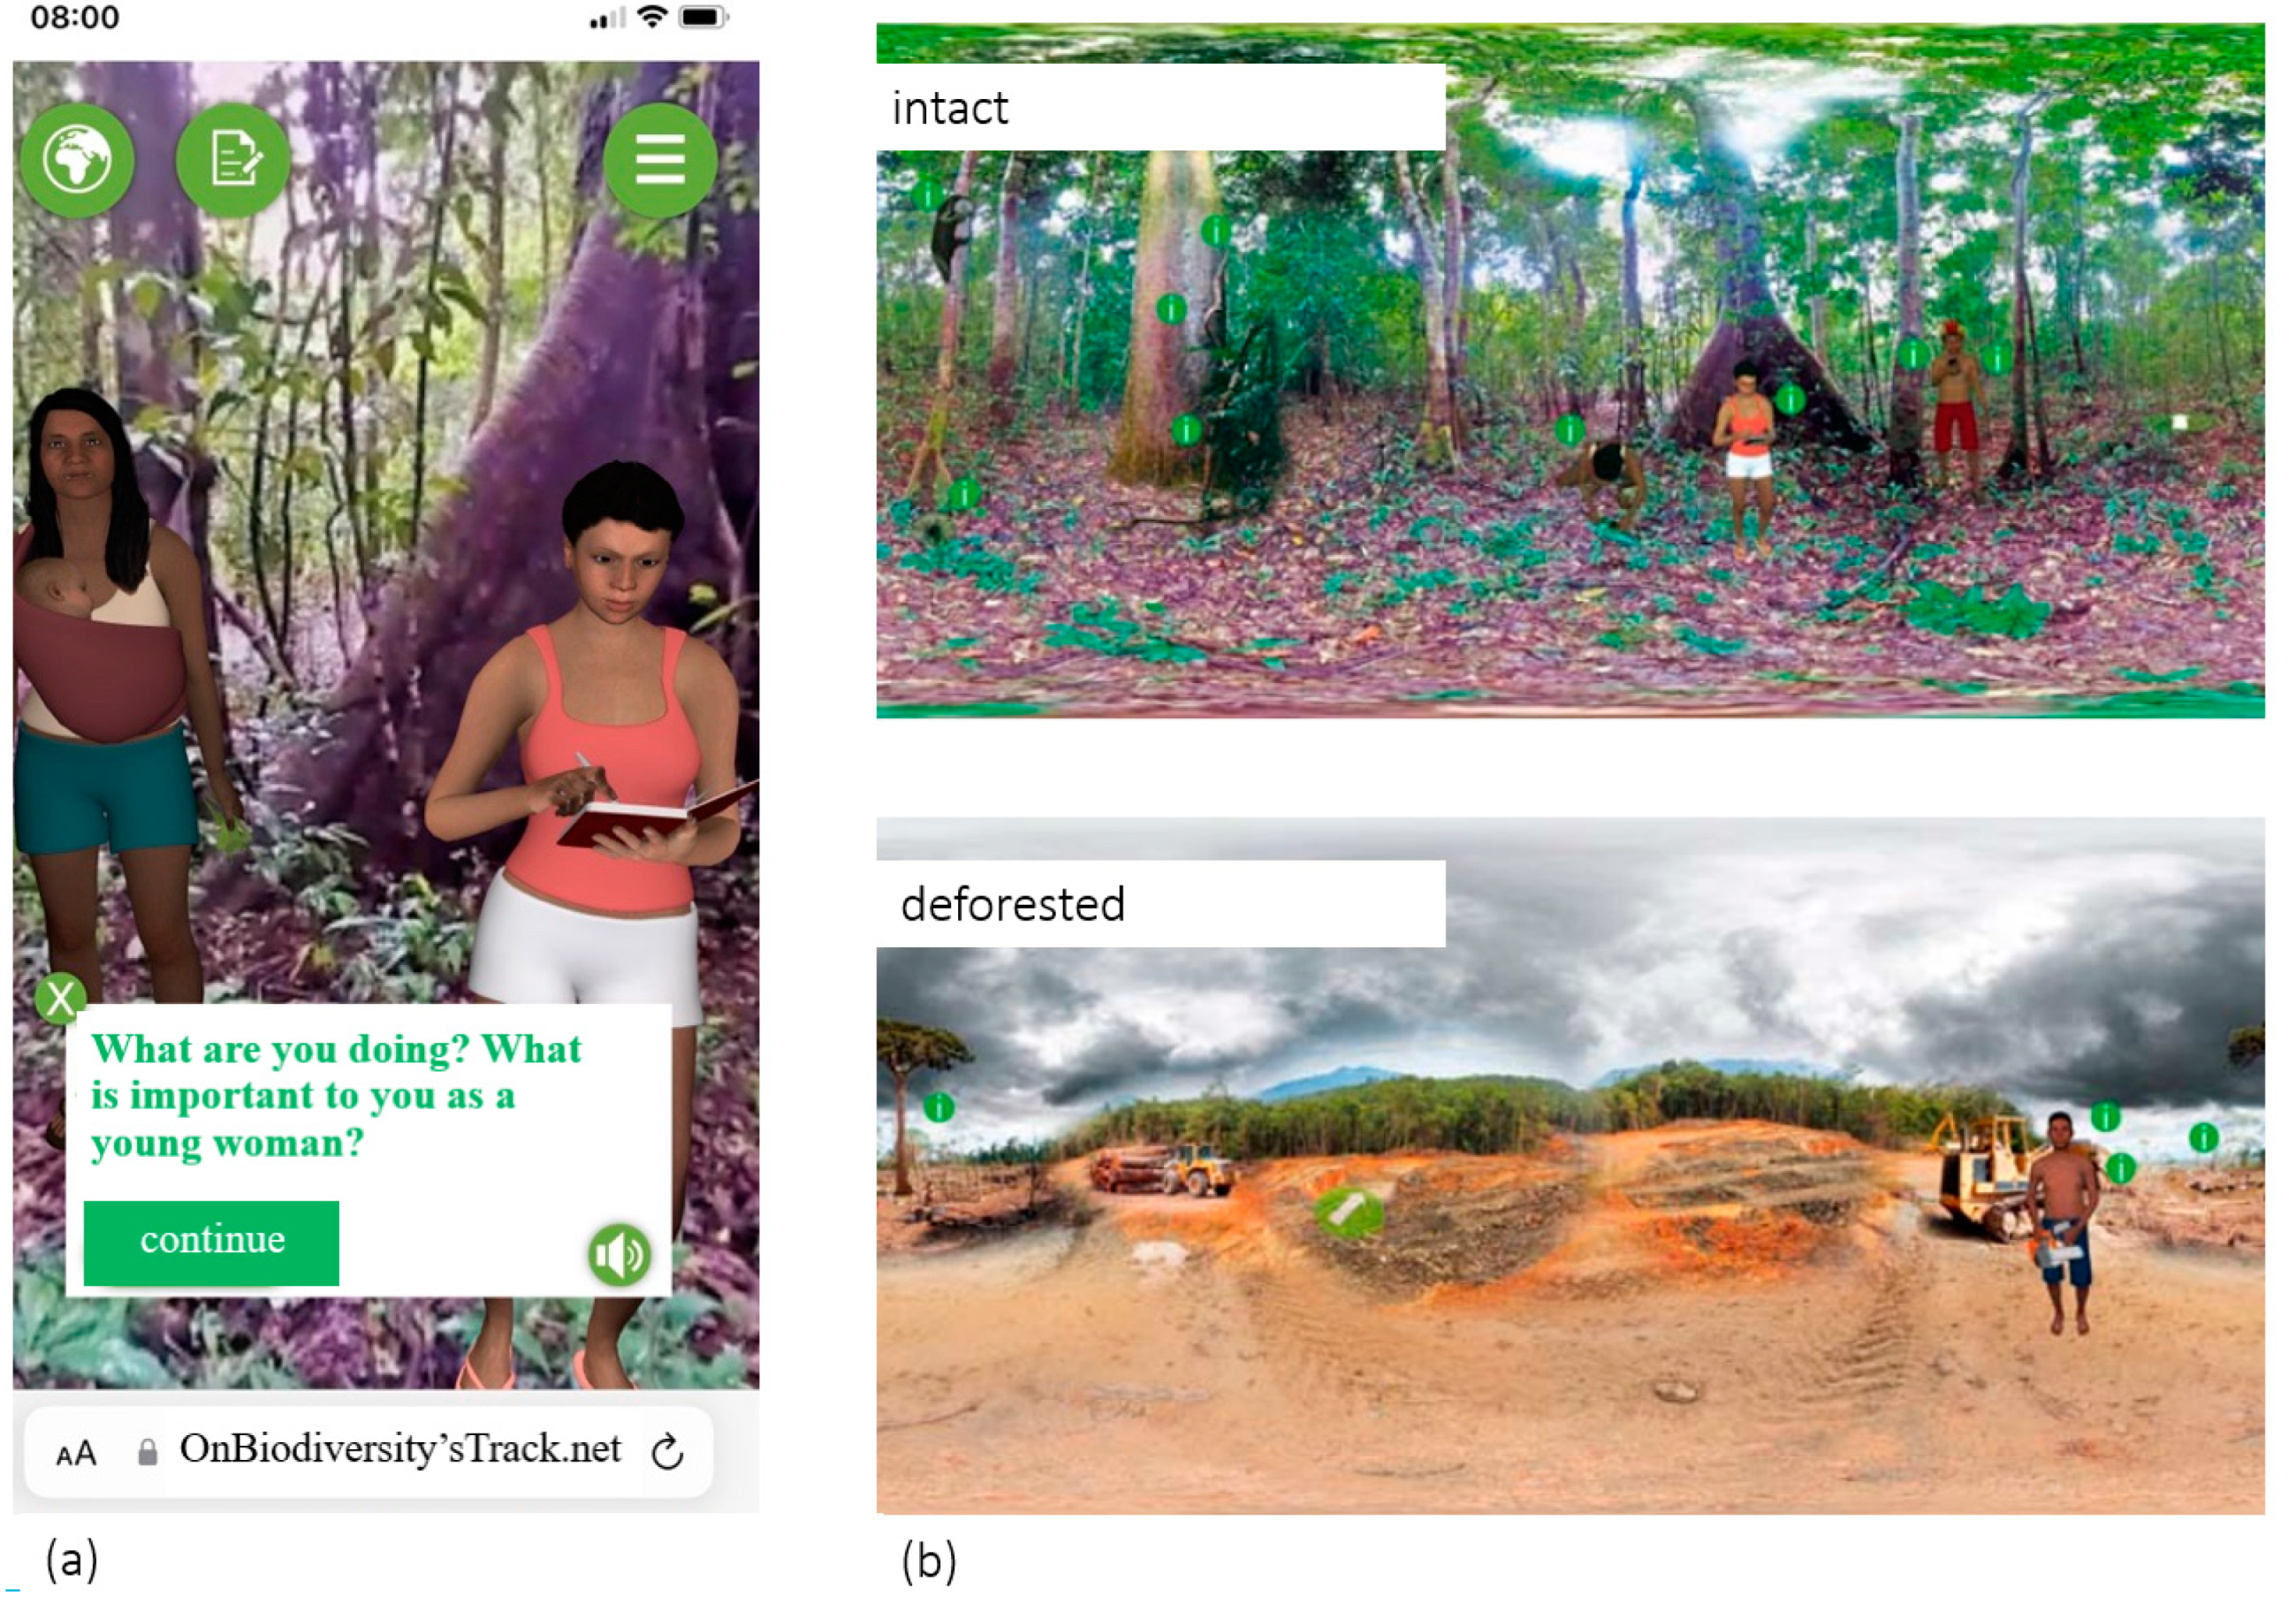
4.1. The Greenpeace XR Application

The greenpeace XR learning application On Biodiversity’s Tracks was developed by greenpeace, a transnational non-profit organization whose goals include environmental and climate protection. The application was developed for several mobile devices and has not yet been evaluated scientifically. It is a web-based solution, meaning students do not need to download the application and give up personal data, and is accompanied by Supplementary Materials providing technical and instructional guidance. The application is designed for supervised use in classrooms for students in grades seven to nine. Its purpose is to convey knowledge and emphasize the importance of SDGs. After scanning a QR code with a mobile device (e.g., tablet), students can virtually travel to various locations around the globe, which would have been challenging to experience in a typical classroom setting. The app consists of a combination of AR and VR elements. At the beginning, reality is augmented through the camera lens of the mobile device with a 3D model of a globe, which is used to pick a destination. Subsequently, these travel destinations (e.g., Great Barrier Reef, Amazon rainforest) are exclusively presented virtually on the screens of the devices. This study primarily focuses on one of the travel destinations of the greenpeace XR application, namely the virtual representation of the Amazon rainforest. This virtual world is characterized by auditory elements (e.g., rainforest sounds) and visual content (e.g., intact vs. non-intact rainforest) and can be freely explored by students. Information about the rainforest’s reality is integrated within the environment. Various interactions with virtual agents (e.g., native animals such as ants) are possible. Figure 1 provides an overview.

4.2. Design and Participants

Our mixed-methods study examined the influence of the greenpeace XR application on its ability to foster students’ knowledge, interest, and attitude regarding sustainability and biodiversity. Special attention has been paid to presence and flow as moderating factors.
The greenpeace XR application was used in a standard lesson at eight German secondary education facilities. For the quantitative part of the study, online questionnaires were administered directly before and after the lesson. For the qualitative portion, focus groups with students were conducted, to gain insight into their experiences during the XR application use.
Teachers as well as parents and students received information about the experiment, giving parents the option to opt their children out of the study. Datasets of 274 students were usable. Out of those, 159 completed the experimental XR condition. After checking for outliers, three participants were determined to have used patterns for answering their posttest questionnaires and were removed, leaving a final sample of 156 participants. Students were roughly 13 years old on average (M = 13.30; SD = 1.02). Over half identified as male (61.3%), with 37.4% identifying as female and 1.3% identifying as non-binary. One of the participating schools was an all-boys school, leading to a higher proportion of male students in this sample. For the eight focus groups, a total of 84 out of the 156 students participated. Group size varied widely between 2 participants for the smallest and 25 for the largest group (M = 10.5, Md = 9). While the quantitative portion of this study was conducted during and as a part of the regularly scheduled classes, the focus groups were opt-in and (depending on the school) had to take place outside of regular lessons, leading to lower participation and a higher deviation in group sizes.

4.3. Procedure

After receiving confirmation from eight secondary schools in Germany, detailed information about the study was sent to the teachers and parents of the students in January 2023 requesting their parental agreement (see Supplementary Materials). Subsequently, teachers started implementing the greenpeace XR application no longer than two weeks after a briefing on 15 February 2023. Participation in the study was voluntary for the students. During the lesson (held in the 90 min time slots that are standard in German secondary schools), teachers introduced the lesson on the topic of sustainable development before the students tested the application on their own mobile devices with a focus on the Amazon rainforest topic. Before and after exploring the app, the students individually filled out online questionnaires. The questionnaires were created using Sosci Survey. The anonymity of the students was ensured through participant codes, and the data cannot be traced back to individual students. At the end of the lesson, the students discussed the experience under the guidance of their teacher. Within two weeks after the lessons, students from the sample who volunteered to participate in the focus groups were sent a link to an online meeting via Zoom. Students were greeted by a moderator and two transcribers. Teachers were absent. The focus groups did not exceed 60 min in duration. The focus groups followed an interview guide tailored to the key questions and were divided into blocks (e.g., experiencing presence). Each focus group was visually supported through a miro board. A screenshot of the miro board slides can be found in the Supplementary Materials online. The final interview was conducted on 27 March 2023. The audios of the focus groups were recorded; transcripts without the names of the students, schools, etc., were created; and subsequently, the audio files were deleted. The qualitative data material was examined according to the focused content analysis [61,62]. To form categories, we used a mixed form of inductive–deductive coding. Based on our hypotheses, we pre-formed categories for flow and presence and further divided them into subcategories according to their facets (e.g., physical presence). The interview guide was aligned with these pre-formed categories but also included many open-ended questions. New categories and subcategories were derived from the responses to the open-ended questions. Subsequently, the frequencies of categories and the relations to one another were analyzed. The qualitative data material was coded by a project team member, frequencies were counted, and quotes were extracted. The project leader coded the same material randomly to ensure data reliability. The analysis of qualitative data, based on derived categories and quotations, is intended to provide initial insights into how the two key questions can be answered.

4.4. Instruments

The online questionnaire was developed by the project team. Where possible, we used already validated questionnaires. Preliminary versions of the questionnaires were tested with seven students. Following that, some of the items were adapted for legibility and easier-to-understand language. In total, the pre- and the post- questionnaire included one item for self-appraised knowledge (“How substantial would you rate your knowledge on the Amazon rainforest?”), two items for interest (e.g., “To what degree are you interested in the Amazon rainforest?”) and three items for general attitudes towards the development in the Amazon rainforest (e.g., “To what degree do you think that the situation in the Amazon rainforest affects us and our environment in Europe?”). Since these are newly formulated items by us, we checked their validity in several discussions with experts from greenpeace and asked the seven students who tested the preliminary version how they understood the items. Minor linguistic adjustments were made. To further assess attitude, the six items of the Green Scale [63,64] (e.g., “My purchase habits are affected by my concern for our environment.”) as well as the ten items of the scale for Common Attitudes Towards Environmental Protection and Sustainable Development (Environmental Protection Scale, EPS, [65,66]; e.g., “I am concerned when I think about the environmental and social conditions under which we and future generations will likely have to live.”) were included. Flow was measured with the ten Flow Short Scale (FSS) items [67,68] (e.g., “I had no difficulty concentrating.”). Sense of presence was measured with a translation [46] of the physical presence (e.g., “The virtual environment seemed real to me.”) and social presence (e.g., “I had a sense that I was interacting with other people in the virtual environment, rather than a computer simulation.”) subscales (five items each) of the Multimodal Presence Scale (MPS, [69]). Knowledge, green consumer values, environmental protection attitude, and presence were measured on 5-point Likert-scales, while interest, general attitude, and flow were measured on 7-point Likert-scales. Furthermore, demographic data (here gender and age) of the students were collected. For the quantitative data analysis, a Python [70] script was created for data cleaning, while the data analysis was conducted in R version 4.2.2 [71], specifically using parts of the R packages car [72], careless [73], DescTools [74], interactions [75], lsr [76], moments [77], and psych [78].
For the focus groups, methodology was shifted from a quantitative to more of a qualitative approach. Students were asked about their opinions on and perception of learning through the XR application. Interviewers roughly followed manuals that included questions on knowledge retention, interest, attitudes, and sense of presence.
All questionnaires as well as the manual for the teachers and an interview guide for the focus groups can be found in the Supplementary Materials online.

5. Results

5.1. Quantitative Data Analysis

The presentation of the statistical analyses of the data from the online questionnaires is divided into three main sections. First, descriptive statistics are reported. This includes internal consistencies, means, standard deviations, and missing values of the items or scales. Before the moderating effects of the learning process variables are inferentially tested, Pearson correlations between the learning processes and the learning objectives are provided in the second section. Finally, several moderator analyses testing hypotheses one and two can be found in the third section.

5.1.1. Descriptive Statistics

Table 1 shows overall good reliability for the moderator scales, with Cronbach’s α consistently above 0.80 [79]. In Table 2 means, standard deviations, and missing values for all key variables are presented. There were slight increases in knowledge and general attitude from the pre- to the post- measurement point, whereas interest, green consumer values and attitudes toward environmental protection remained roughly the same. Values for the Green Scale and EPS were considerably lower than they were for the norm samples in their respective studies [63,66]. For the Green Scale, this might be due to the comparably younger age of the students in the present study, where consumer values are possibly not as developed yet. Meanwhile, the original sample for the EPS consisted of teachers, who are generally considered very environmentally conscious [66]. Flow among the students in the present study was comparable to mid-lecture students in the norm sample [67]. Social presence was comparable to the German language norm sample, while physical presence seemed lower in the present sample [46]. Lower social than physical presence is congruent with previous findings [45].

5.1.2. Correlations

To check the prerequisite for moderator analysis of low multicollinearity and to gauge whether the assumptions stated above are plausible, Pearson correlations between all key variables were computed (see Table 3). No correlation above 0.80 was detected. Therefore, lack of multicollinearity can be assumed [80]. The pretest scores of all learning indicators generally showed medium to high correlations with their respective posttest scores. Flow correlated highly with presence. Upon further investigation, this correlation was significant, r = 0.565, p < 0.001. Correlations between flow, presence, and the difference between pretest and posttest scores were calculated. Table 4 shows significant correlations between flow and gain (as in, the difference between pre- and posttest) in every variable except for general attitude, which was not statistically significant. Regarding presence, the only significant correlation was found for change in knowledge.

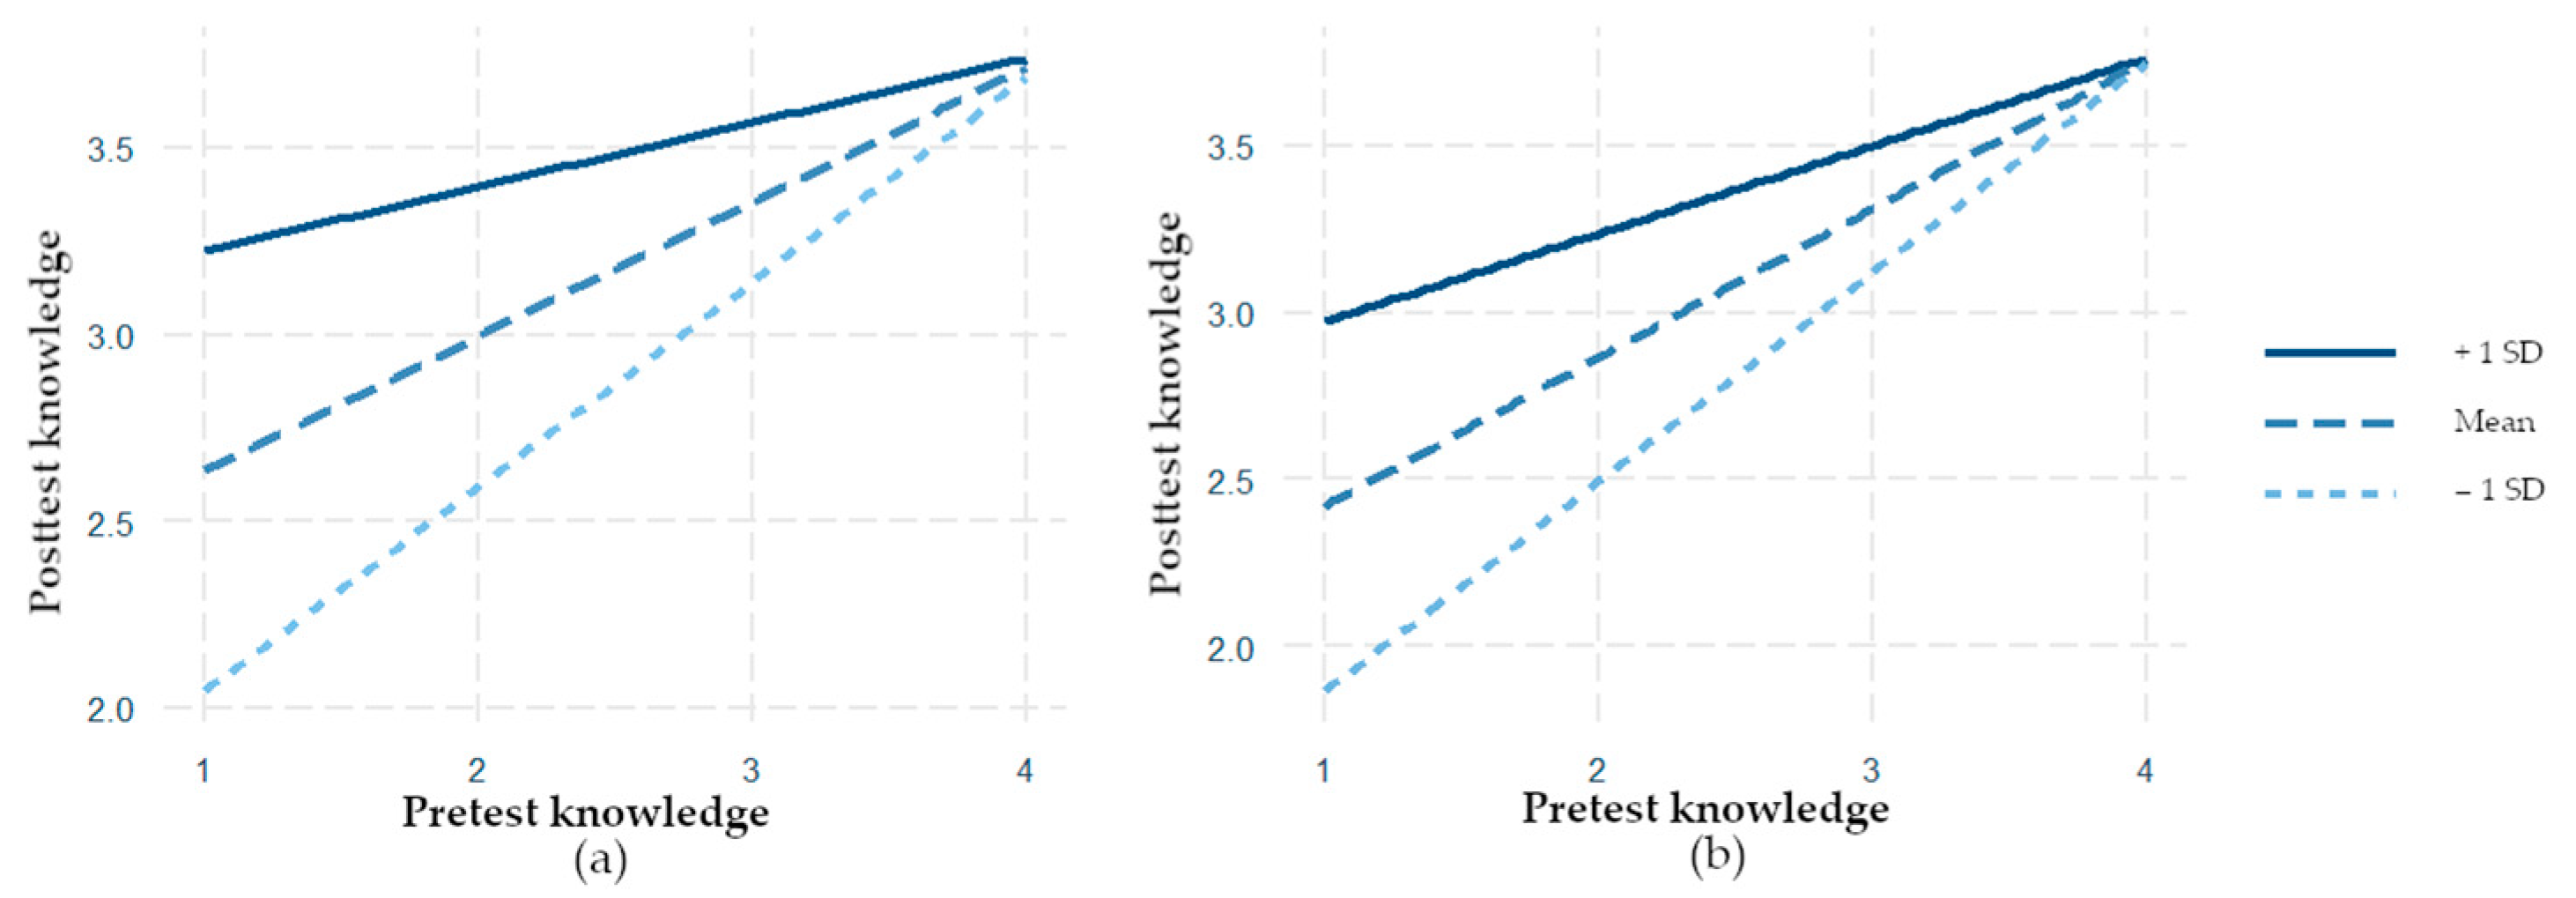
5.1.3. Moderator Analyses

Other prerequisites for moderations analysis were also assessed. A Shapiro–Wilk test revealed no relevant deviation from normal distribution regarding error terms (see Supplementary Materials). Graphical analyses showed homoscedasticity for all dependent variables. Assuming linear regression, ten interaction models were proposed, where flow or presence moderate the relationship between a variable’s pretest and posttest score, i.e., flow moderating the relationship between pretest knowledge and posttest knowledge. Table 5 shows that all ten moderator models significantly explain variance in the dependent variable However, the interaction between the independent variable and the moderator is only significant in three cases: knowledge–flow, knowledge–presence, and EPS–presence. Pretest interest (t = 3.92, p < 0.001) and presence (t = 2.24, p = 0.027) as well as pretest general attitude (t = 3.57, p < 0.001) and flow (t = 2.15, p = 0.034) influence the posttest value in their respective models independently, without an interaction. For general attitude and the Green Scale, only the pretest score and not presence affected the dependent variable. The same is true for flow on the Green Scale and EPS. The interest–flow model showed no effect at all.
Figure 2 shows the interaction of flow and presence with knowledge, the only variable with which both moderators interacted. For both flow (Figure 2a) and presence (Figure 2b), the following applies: The higher the pretest knowledge, the less relevant were the moderating effects. Conversely, this means that flow and presence have a stronger moderating effect for individuals with little prior knowledge.
Regarding our hypotheses, based on the moderator analyses, it can be stated that these results support Hypothesis 1a (higher perception of flow positively influences knowledge gained), while Hypotheses 1b (higher perception of flow positively influences interest gained) and 1c (higher perception of flow positively influences attitude improved) are not supported. It should, however, be noted that we found significant correlations between flow and interest gain as well as between flow and gain in two of the three attitude measures.
Similarly, Hypothesis 2a (higher perception of presence positively influences knowledge gained) is supported by these findings. Hypothesis 2b (higher perception of presence positively influences interest gained) is not supported. Hypothesis 2c (higher perception of presence positively influences attitude improved) can only be partially supported, since a moderation effect could only be found for one of the three attitude measures, namely the EPS.

5.2. Qualitative Data Analysis

In addition to the quantitative data, qualitative data were collected during the focus groups. This provided us with a deeper insight into the students’ lsearning experiences. Further, it allowed us to identify additional learning-related factors beyond the moderating effects of flow and presence that we initially assumed. An exhaustive analysis of the qualitative data can be found in another paper [81]. A selection of relevant results will be presented in the following two sections along with the two key questions. Categories and the number of focus groups that mentioned each respective category (N) will be reported. There were eight focus groups in total, resulting in a maximum mention of eight.

5.2.1. Key Question 1: Learning Effects

Most of the focus groups reported that the XR application was informative and that they have learned a lot (e.g., deforestation (N = 6), structure of an anthill (N = 2)). However, the students said they were already interested in environmental topics before, but that the XR application provided the opportunity to travel to distant places and experience firsthand the threat of climate change to animal and human species. They described that the application had emotionally impacted them, and they had to think a lot about it. For example, a student from focus group 8 expressed: “[...] You always hear a bit about it in the news, what’s going on, but now through last week, where we could experience the changes in the rainforest up close ourselves, you think a lot more about it than you did before [...].”
Across all groups, it was reported that the students extensively reflected on the virtual experience in the one or two weeks following. Many students recognized the relevance of environmental protection for their own lives and those of future generations (N = 5). These reflective processes seem to persist and remain a topic of discussion within the respective classes. The engagement with the experience occurred individually, among peers, within families, and at school. Many of the students seem to have developed an awareness of environmental issues during this post-experience period. They began to form initial ideas on how they, their friends, families, and their schools can contribute to environmental protection over an extended period (N = 4). Among these ideas are (1) the purchase of sustainable food items, (2) reduction of plastic items, (3) avoidance of palm oil, and (4) reduction of printed materials in school. In summary, the XR application seems to have triggered something in the students on an affective level, especially in the days following the virtual experience. It appears that the primary focus is not so much on the increase in knowledge or heightened interest, but rather on initial changes at the level of attitudes and behaviors, similar to previous findings [82].

5.2.2. Key Question 2: Cognitive and Affective Processes

The students were asked to describe the cognitive and affective processes that took place during the virtual experience. Within the focus groups, the students reported that they felt focused, captured, and motivated while using the XR application. Additionally, they perceived the application as exciting and realistic. Learning was enjoyable for them. Furthermore, they reported that they gained a “better impression” (focus group 6) of the rainforest and the life on-site, allowing them to easily empathize with the local circumstances. One student describes it as follows: “Because you could experience it directly in the virtual world, and you could almost sneak in and feel the life, just like they actually feel there.” (focus group 4). This is somewhat in accordance with another study, where nursing students, while a major point of criticism was a lack of realism, also lauded a high degree of interactivity in the VR application used [83].
Considering the statements from all focus groups, three processes can be identified that made learning with the greenpeace XR application unique and special for all students: (1) authentic audio–visual stimulation, (2) interactions with virtual actors, and (3) physical and social presence experiences. It is noteworthy that while presence or a description of the feeling of presence were mentioned multiple times by the students, the term flow and its synonyms were not named. However, the three processes listed above were increasingly associated with the assessment of the XR learning application. When students reported on processes that occurred during their learning, an evaluation of the application often followed directly or in close temporal proximity (i.e., within two sentences). This is how one of the students attempts to summarize the experience: “[...] I think it stayed better in my memory. [...] I was apparently really on-site and could understand the life of animals and people in the Amazon rainforest more easily. [...] Even now, when I think about it, I still have all the images in my mind. For example, with the deforestation, how the boy was standing there and the single tree with the bulldozer and all that [...]” (focus group 6).

6. Discussion

6.1. Interpretation of Results

The results of the mixed-methods study reveal several implications. First, both data sets, qualitative and quantitative, showed that the greenpeace XR application can impart knowledge about biodiversity and influence environmentally relevant attitudes of the students. However, while the quantitative data revealed only few differences from the pre to post measurement points (e.g., knowledge, general attitude), students in the subsequent focus groups reported more on attitude and even behavior changes (albeit mainly for change in individual behavior as opposed to systemic change). This can be interpreted as the students not having sufficiently processed the content shortly after the lesson and using the days leading up to the focus groups to reflect on these contents alone or with others. The lack of change in interest may be explained by the students stating that they were already very interested in environmental issues before the lesson, making a further increase unlikely.
Second, correlation analyses showed several significant relationships between flow, presence, and the differences between pretest and posttest scores, congruent with a large corpus of previous research [33,34,54,55,56,57]. Many of the learning gains are particularly associated with flow. The subsequent moderator analyses revealed only a few significant interactions. The interaction of flow and presence with knowledge appears especially interesting. For both flow and presence, higher pretest knowledge seems to mitigate the effect of the moderator. In turn, this implies that flow and presence exert a more significant moderating effect on individuals with little prior knowledge.
Third, qualitative data revealed a strong relationship between learning processes (e.g., presence) and the evaluation of the application. This finding indicates optimization potential for developers. By promoting the experience of flow, presence, audio–visual stimulation, and interactions with virtual actors, the learning experience can be made more engaging to students, thus supporting learning in general. Overall, this seems to be in line with previous findings. Bodzin et al. [37] found that experiencing flow in an immersive VR game is linked to positive attitudes towards learning with VR. Focus groups also mentioned a sense of presence and interactivity as contributing factors for enjoyment, and that this form of presentation provides new perspectives [37]. Another study found that flow and presence enhanced satisfaction in VR [40]. However, those studies did not report effects on knowledge-based learning outcomes, as opposed to Tai et al., where flow predicted both the procedural accuracy and executive quality of car detailing [38]. Comparability to the present study might, however, be somewhat limited, considering that those are both procedural learning outcomes.

6.2. Implications

The present results partially corroborate the assumptions of the theoretical frameworks that propose presence and flow as background processes during learning with XR technologies [23,50,51]. However, the link between flow, presence, and some of the learning outcomes, especially interest and some attitude measures, seems somewhat weak. This might be due to the methodological limitations of the present study, which will be discussed in the following chapter. Future research could look into more complex models that incorporate flow and presence. For example, serial mechanisms between presence and flow could be investigated. A hypothesis worth exploring could be that experiencing presence is a necessary condition for experiencing flow in virtual environments.
The lack of findings regarding interest impedes drawing theoretical conclusions. Results do however support the notion that attitude, and behavior are inherently linked [60]. Students’ statements from the focus group show a somewhat clear timeline were willingness to change their own behavior follows the intervention after phases of reflection and attitudinal change. It can be concluded that the app alone is unlikely to generate significant changes at the level of attitudes and behavior. Teachers using the app in the classroom must create reflective activities that allow students to relate the content to their own real-life experiences. Based on the positive correlations between flow, presence, and learning outcomes we found in our study, it seems advisable for teachers to look back on the feelings of the students when they used the app. These feelings seem to persist in the minds of the students, as the focus groups revealed. Therefore, if a teacher connects to the feelings experienced in the virtual space during subsequent reflection, it may be possible to generate sustainable changes at the level of attitudes and behavior. This assumption should be tested in follow-up investigations.

6.3. Limitations

The present study is limited by its design. Regarding the quantitative part of our study, an adequate control group is missing. The comparison to a control group that learned about biodiversity in a traditional classroom setting (without XR) does not seem appropriate for the question regarding the moderating effect of affective and cognitive processes that were experienced while being in a virtual environment. In another yet-to-be-published paper [8], we will report the results of a control group study (XR vs. traditional classroom setting) with a focus on the general learning effects. To analyze the moderating effects of, for example, presence, other control groups (e.g., comparing different mobile devices) would be more suitable.
Additionally, regarding the qualitative portion of our study, it is debatable whether the questions in the interview guide were suggestive or at least formulated with a positive expectation. This may have contributed to the students predominantly making positive statements about the XR application. In turn, this could have deterred classmates from giving negative responses due to social pressure, even when the moderators explicitly asked for them. It should also be noted that most contributions came from male students, while female students were shy and reserved. This could negatively impact the generalizability of the results. Moreover, the results may be biased by the fact that students with a large knowledge base participated more actively in the focus group than those who are not interested in the topic or have little knowledge about it. Also, the size of the focus groups could have influenced the students’ response behavior. The willingness to participate in the focus group discussion might have been lower in larger groups compared to smaller ones, which could be attributed to diffusion of responsibility [84,85].
Furthermore, methodological concerns could be raised. The knowledge test for this part of the project consists of a singular item measuring self-reported knowledge on the domain of the Amazon rainforest. This means that students who overestimated their knowledge in the pretest may have gained knowledge during the intervention but may have rated their knowledge lower in the posttest, after getting a better perspective on what they do and do not know. Therefore, actual knowledge gain may not be reflected in the difference between pre- and posttest. Our interpretations regarding knowledge gain and the adjacent effects should be treated cautiously. It should, however, be noted that students in the focus groups were still able to reproduce information gathered in the XR-based lesson, implying that learning about the topic did, in fact, take place.
Relating to the above-mentioned lack of time for critical reflection, the short duration of our study is a further notable limitation. The development of more sustainable attitudes in young people is significant for the future of our world. This study only examined a period from immediately after using the application to a maximum of two weeks afterward. To achieve long-term attitude changes, a more prolonged engagement of students with environmental issues is required, accompanied by scientifically guided long-term studies.

6.4. Future Perspectives

This study assumed that the students had sufficient skills in dealing with new technologies. The study paid little attention to technical issues. Some students who were still inexperienced with such technologies may have been disadvantaged. Furthermore, the lesson did not include systematic follow-up and critical reflection on the virtual experience. The discussion around the need for emersion after immersive experiences [86,87,88] posits the ontological question of to what degree virtual worlds are being perceived as genuine realities [89]. Nevertheless, the focus groups indicated that students discussed the XR application in their free time. However, from a research perspective, it would be interesting to examine students’ metacognitive processes when learning with such technologies.
Students in the focus groups showed emotional involvement in the content presented in the XR experience. Long-term changes in attitude and behavior might be achieved by teachers who try to capture the students’ emotions in discussions after using the XR application. Future research could address the specific learning emotions [90] elicited by the application and their possible benefit for learning outcomes.

7. Conclusions

Overall, this paper shows that presence and flow are in fact relevant moderators that can affect learning outcomes in XR applications. An interesting conclusion we draw from the study is that these experiential learning processes are pivots for the lever that is XR technology: These processes can help facilitate the VR and/orAR experience. Technical advancements could further support the learning outcomes. Hence, care should be taken to improve the perception of presence and flow by users when implementing AR and VR technology, especially for learners with little prior knowledge.
In general, the greenpeace XR application On Biodiversity’s Tracks can be classified as an effective application that achieves a reflective and affective engagement with environmental issues such as the threat to biodiversity. Its use in class was perceived very positively by the students. The application can therefore assist teachers in designing lessons on sustainability topics for middle school students. Thus, the application seems to be one method to communicate SDGs appropriately.

Supplementary Materials

A screenshot of the miro board slides used within the focus groups can be found here: https://rb.gy/4zcnr (accessed on 30 November 2023). All questionnaires as well as the manual for the teachers and an interview guide for the focus groups can be found here: https://shorturl.at/bcgmI (accessed on 30 November 2023). The material containing extended statistics can be found here: https://shorturl.at/aoK26 (accessed on 30 November 2023).

Author Contributions

M.M. led the study. In collaboration with K.H.T., she was responsible for the conceptualization of the study design, the selection of methods, and the creation of the research materials. K.H.T. took charge of analyzing the quantitative data. In collaboration with a research assistant, K.H.T. and M.M. supported the analysis of qualitative data and the creation of research materials. The interpretation of the data and their documentation in this article was a collaborative effort between K.H.T. and M.M. All authors have read and agreed to the published version of the manuscript.

Funding

This research was funded by greenpeace e.V. Germany (January 2023–June 2023). Furthermore, we acknowledge support by the Open Access Publication Fund of the University of Duisburg-Essen.

Institutional Review Board Statement

Ethical review and approval were waived for this study because all subjects participated in the study voluntarily and without further constraints.

Informed Consent Statement

Before the students participated in the study, teachers as well as parents and students received information about the experiment, giving parents the option to opt their children out of the study.

Data Availability Statement

Data can be downloaded at: https://shorturl.at/vzGQZ (accessed on 30 November 2023).

Conflicts of Interest

The authors declare no conflict of interest.

References

  1. Elmqaddem, N. Augmented Reality and Virtual Reality in Education. Myth or Reality? Int. J. Emerg. Technol. Learn. iJET 2019, 14, 234–242. [Google Scholar] [CrossRef]
  2. Garzón, J. An Overview of Twenty-Five Years of Augmented Reality in Education. Multimodal Technol. Interact. 2021, 5, 37. [Google Scholar] [CrossRef]
  3. Kavanagh, S.; Luxton-Reilly, A.; Wuensche, B.; Plimmer, B. A Systematic Review of Virtual Reality in Education. Themes Sci. Technol. Educ. 2017, 10, 85–119. [Google Scholar]
  4. Milgram, P.; Kishino, F. A Taxonomy of Mixed Reality Visual Displays. IEICE Trans. Inf. Syst. 1994, E77-D, 1321–1329. [Google Scholar]
  5. Rauschnabel, P.A.; Felix, R.; Hinsch, C.; Shahab, H.; Alt, F. What Is XR? Towards a Framework for Augmented and Virtual Reality. Comput. Hum. Behav. 2022, 133, 107289. [Google Scholar] [CrossRef]
  6. Chuah, S.H.-W. Why and Who Will Adopt Extended Reality Technology? Literature Review, Synthesis, and Future Research Agenda. 2018. Available online: https://papers.ssrn.com/sol3/papers.cfm?abstract_id=3300469 (accessed on 28 September 2023).
  7. Greenpeace. Augmented Reality-Anwendung: Der Artenvielfalt auf der Spur. Available online: https://www.greenpeace.de/ueber-uns/umweltbildung/augmented-reality-anwendung-artenvielfalt-spur (accessed on 5 June 2023).
  8. Mulders, M.; Träg, K.H.; Kirner, L. Go Green: Evaluating an XR Application on Biodiversity in German Secondary School Classrooms. Instr. Sci. 2023. submitted. [Google Scholar]
  9. Smutny, P. Learning with Virtual Reality: A Market Analysis of Educational and Training Applications. Interact. Learn. Environ. 2022, 1–14. [Google Scholar] [CrossRef]
  10. Burbules, N.C. Rethinking the Virtual. In The International Handbook of Virtual Learning Environments; Weiss, J., Nolan, J., Hunsinger, J., Trifonas, P., Eds.; Springer: Dordrecht, The Netherlands, 2006; pp. 37–58. ISBN 978-1-40203-803-7. [Google Scholar]
  11. Sherman, W.R.; Craig, A.B. Understanding Virtual Reality: Interface, Application, and Design; Morgan Kaufmann Series in Computer Graphics and Geometric Modeling; Morgan Kaufmann: San Francisco, CA, USA, 2003; ISBN 978-1-55860-353-0. [Google Scholar]
  12. Bower, M. Design of Technology-Enhanced Learning—Integrating Research and Practice; Emerald Publishing: Leeds, UK, 2017; ISBN 978-1-78714-183-4. [Google Scholar]
  13. Mikropoulos, T.A.; Natsis, A. Educational Virtual Environments: A Ten-Year Review of Empirical Research (1999–2009). Comput. Educ. 2011, 56, 769–780. [Google Scholar] [CrossRef]
  14. Dalgarno, B.; Lee, M.J.W. What Are the Learning Affordances of 3-D Virtual Environments? Br. J. Educ. Technol. 2010, 41, 10–32. [Google Scholar] [CrossRef]
  15. Freina, L.; Ott, M. A Literature Review on Immersive Virtual Reality in Education: State Of The Art and Perspectives. In Proceedings of the eLearning and Software for Education (eLSE), Bucharest, Romania, 23–24 April 2015; Volume 1, pp. 133–141. [Google Scholar]
  16. Dunleavy, M.; Dede, C. Augmented Reality Teaching and Learning. In Handbook of Research on Educational Communications and Technology; Spector, J.M., Merrill, M.D., Elen, J., Bishop, M.J., Eds.; Springer: New York, NY, USA, 2014; pp. 735–745. ISBN 978-1-46143-185-5. [Google Scholar]
  17. Bekele, M.K.; Champion, E. Redefining Mixed Reality: User-Reality-Virtuality and Virtual Heritage Perspectives. In Intelligent & Informed—Proceedings of the 24th CAADRIA Conference—Volume 2, Wellington, New Zealand, 15–18 April 2019; Haeusler, M., Schnabel, M.A., Fukuda, T., Eds.; CUMINCAD: Wellington, New Zealand, 2019; pp. 675–684. [Google Scholar]
  18. Fast-Berglund, Å.; Gong, L.; Li, D. Testing and Validating Extended Reality (xR) Technologies in Manufacturing. Procedia Manuf. 2018, 25, 31–38. [Google Scholar] [CrossRef]
  19. Wu, B.; Yu, X.; Gu, X. Effectiveness of Immersive Virtual Reality Using Head-mounted Displays on Learning Performance: A Meta-analysis. Br. J. Educ. Technol. 2020, 51, 1991–2005. [Google Scholar] [CrossRef]
  20. Buchner, J.; Buntins, K.; Kerres, M. The Impact of Augmented Reality on Cognitive Load and Performance: A Systematic Review. J. Comput. Assist. Learn. 2022, 38, 285–303. [Google Scholar] [CrossRef]
  21. Rauschnabel, P.; Babin, B.; Tom Dieck, M.C.; Krey, N.; Jung, T. What Is Augmented Reality Marketing? Its Definition, Complexity, and Future. J. Bus. Res. 2022, 142, 1140–1150. [Google Scholar] [CrossRef]
  22. Fowler, C. Virtual Reality and Learning: Where Is the Pedagogy? Br. J. Educ. Technol. 2015, 46, 412–422. [Google Scholar] [CrossRef]
  23. Makransky, G.; Petersen, G.B. The Cognitive Affective Model of Immersive Learning (CAMIL): A Theoretical Research-Based Model of Learning in Immersive Virtual Reality. Educ. Psychol. Rev. 2021, 33, 937–958. [Google Scholar] [CrossRef]
  24. Mulders, M.; Weise, M.; Schmitz, A.; Zender, R.; Kerres, M.; Lucke, U. Handwerkliches Lackieren Mit Virtual Reality (HandLeVR): VR-Basierter Kompetenzerwerb in Der Beruflichen Ausbildung. MedienPädagogik. Z. Theor. Prax. Medien 2023, 51, 214–245. [Google Scholar] [CrossRef]
  25. Steffen, W.; Richardson, K.; Rockström, J.; Cornell, S.E.; Fetzer, I.; Bennett, E.M.; Biggs, R.; Carpenter, S.R.; de Vries, W.; de Wit, C.A.; et al. Planetary Boundaries: Guiding Human Development on a Changing Planet. Science 2015, 347, 1259855. [Google Scholar] [CrossRef]
  26. Bailenson, J. Experience on Demand: What Virtual Reality Is, How It Works, and What It Can Do; W. W. Norton & Company: New York, NY, USA, 2018; p. 290. ISBN 978-0-39325-369-6. [Google Scholar]
  27. Saidin, N.; Halim, N.A.; Yahaya, N. A Review of Research on Augmented Reality in Education: Advantages and Applications. Int. Educ. Stud. 2015, 8, 1–8. [Google Scholar] [CrossRef]
  28. Cosio, L.D.; Buruk, O.; Fernández Galeote, D.; Bosman, I.D.V.; Hamari, J. Virtual and Augmented Reality for Environmental Sustainability: A Systematic Review. In Proceedings of the 2023 CHI Conference on Human Factors in Computing Systems, Hamburg, Germany, 23–28 April 2023; Association for Computing Machinery: New York, NY, USA, 2023; pp. 1–23. [Google Scholar]
  29. Spangenberger, P.; Geiger, S.M.; Freytag, S.-C. Becoming Nature: Effects of Embodying a Tree in Immersive Virtual Reality on Nature Relatedness. Sci. Rep. 2022, 12, 1311. [Google Scholar] [CrossRef]
  30. Mayer, F.S.; Frantz, C.M. The Connectedness to Nature Scale: A Measure of Individuals’ Feeling in Community with Nature. J. Environ. Psychol. 2004, 24, 503–515. [Google Scholar] [CrossRef]
  31. Hu-Au, E.; Lee, J.J. Virtual Reality in Education: A Tool for Learning in the Experience Age. Int. J. Innov. Educ. 2017, 4, 215–226. [Google Scholar] [CrossRef]
  32. Spangenberger, P.; Matthes, N.; Geiger, S.; Draeger, I.; Kybart, M.; Schmidt, K.; Kruse, L.; Kapp, F. How to Bring Immersive VR into the Classroom: German Vocational Teachers’ Perception of Immersive VR Technology. J. Tech. Educ. 2023, 11, 91–106. [Google Scholar] [CrossRef]
  33. Akçayır, M.; Akçayır, G. Advantages and Challenges Associated with Augmented Reality for Education: A Systematic Review of the Literature. Educ. Res. Rev. 2017, 20, 1–11. [Google Scholar] [CrossRef]
  34. Pellas, N.; Kazanidis, I.; Palaigeorgiou, G. A Systematic Literature Review of Mixed Reality Environments in K-12 Education. Educ. Inf. Technol. 2020, 25, 2481–2520. [Google Scholar] [CrossRef]
  35. Zhang, J.; Li, G.; Huang, Q.; Feng, Q.; Luo, H. Augmented Reality in K–12 Education: A Systematic Review and Meta-Analysis of the Literature from 2000 to 2020. Sustainability 2022, 14, 9725. [Google Scholar] [CrossRef]
  36. Johnson-Glenberg, M.C.; Birchfield, D.A.; Tolentino, L.; Koziupa, T. Collaborative Embodied Learning in Mixed Reality Motion-Capture Environments: Two Science Studies. J. Educ. Psychol. 2014, 106, 86–104. [Google Scholar] [CrossRef]
  37. Bodzin, A.; Araujo-Junior, R.; Hammond, T.; Anastasio, D. Investigating Engagement and Flow with a Placed-Based Immersive Virtual Reality Game. J. Sci. Educ. Technol. 2021, 30, 347–360. [Google Scholar] [CrossRef]
  38. Tai, K.H.; Hong, J.C.; Tsai, C.R.; Lin, C.Z.; Hung, Y.H. Virtual Reality for Car-Detailing Skill Development: Learning Outcomes of Procedural Accuracy and Performance Quality Predicted by VR Self-Efficacy, VR Using Anxiety, VR Learning Interest and Flow Experience. Comput. Educ. 2022, 182, 104458. [Google Scholar] [CrossRef]
  39. Choi, H.; Kim, Y.R.; Kim, G.J. Presence, Immersion and Usability of Mobile Augmented Reality. In Proceedings of the Virtual, Augmented and Mixed Reality—Multimodal Interaction, Orlando, FL, USA, 26–31 July 2019; Chen, J.Y.C., Fragomeni, G., Eds.; Springer International Publishing: Cham, Switzerland, 2019; pp. 3–15. [Google Scholar]
  40. Mulders, M. Learning about Victims of Holocaust in Virtual Reality: The Main, Mediating and Moderating Effects of Technology, Instructional Method, Flow, Presence, and Prior Knowledge. Multimodal Technol. Interact. 2023, 7, 28. [Google Scholar] [CrossRef]
  41. Dengel, A.; Mägdefrau, J. Immersive Learning Explored: Subjective and Objective Factors Influencing Learning Outcomes in Immersive Educational Virtual Environments. In Proceedings of the 2018 IEEE International Conference on Teaching, Assessment, and Learning for Engineering (TALE), Wollongong, Australia, 4–7 December 2018; pp. 608–615. [Google Scholar]
  42. Buchner, J.; Kerres, M. Students as Designers of Augmented Reality: Impact on Learning and Motivation in Computer Science. Multimodal Technol. Interact. 2021, 5, 41. [Google Scholar] [CrossRef]
  43. Biocca, F. The Cyborg’s Dilemma: Progressive Embodiment in Virtual Environments. J. Comput.-Mediat. Commun. 1997, 3, JCMC324. [Google Scholar] [CrossRef]
  44. Dengel, A. Effects of Immersion and Presence on Learning Outcomes in Immersive Educational Virtual Environments for Computer Science Education. Ph.D. Thesis, Universität Passau, Passau, Germany, 2020. [Google Scholar]
  45. Campo, A.; Michałko, A.; Van Kerrebroeck, B.; Stajic, B.; Pokric, M.; Leman, M. The Assessment of Presence and Performance in an AR Environment for Motor Imitation Learning: A Case-Study on Violinists. Comput. Hum. Behav. 2023, 146, 107810. [Google Scholar] [CrossRef] [PubMed]
  46. Volkmann, T.; Wessel, D.; Jochems, N.; Franke, T. German Translation of the Multimodal Presence Scale. In Proceedings of the Mensch und Computer 2018—Tagungsband, Dresden, Germany, 2–5 September 2018. [Google Scholar] [CrossRef]
  47. Dengel, A.; Mägdefrau, J. Immersive Learning Predicted: Presence, Prior Knowledge, and School Performance Influence Learning Outcomes in Immersive Educational Virtual Environments. In Proceedings of the 2020 6th International Conference of the Immersive Learning Research Network (iLRN), San Luis Obispo, CA, USA, 21–25 June 2020; pp. 163–170. [Google Scholar]
  48. Steed, A.; Friston, S.; Lopez, M.M.; Drummond, J.; Pan, Y.; Swapp, D. An ‘In the Wild’ Experiment on Presence and Embodiment Using Consumer Virtual Reality Equipment. IEEE Trans. Vis. Comput. Graph. 2016, 22, 1406–1414. [Google Scholar] [CrossRef] [PubMed]
  49. Makransky, G.; Terkildsen, T.S.; Mayer, R.E. Adding Immersive Virtual Reality to a Science Lab Simulation Causes More Presence but Less Learning. Learn. Instr. 2019, 60, 225–236. [Google Scholar] [CrossRef]
  50. Rutrecht, H.; Wittmann, M.; Khoshnoud, S.; Igarzábal, F.A. Time Speeds Up During Flow States: A Study in Virtual Reality with the Video Game Thumper. Timing Time Percept. 2021, 9, 353–376. [Google Scholar] [CrossRef]
  51. Csikszentmihalyi, M. Flow and Education. NAMTA J. 1997, 22, 2–35. [Google Scholar]
  52. Rheinberg, F.; Vollmeyer, R.; Engeser, S. Die Erfassung Des Flow-Erlebens. In Diagnostik von Selbstkonzept, Lernmotivation und Selbstregulation; Stiensmeier-Pelster, J., Rheinberg, F., Eds.; Hogrefe: Göttingen, Germany, 2003; pp. 261–279. [Google Scholar]
  53. Hamari, J.; Shernoff, D.J.; Rowe, E.; Coller, B.; Asbell-Clarke, J.; Edwards, T. Challenging Games Help Students Learn: An Empirical Study on Engagement, Flow and Immersion in Game-Based Learning. Comput. Hum. Behav. 2016, 54, 170–179. [Google Scholar] [CrossRef]
  54. Kye, B.; Kim, Y. Investigation of the Relationships between Media Characteristics, Presence, Flow, and Learning Effects in Augmented Reality Based Learning. Int. J. Educ. Media Technol. 2008, 2, 4–14. [Google Scholar]
  55. Janssen, D.; Tummel, C.; Richert, A.; Isenhardt, I. Virtual Environments in Higher Education—Immersion as a Key Construct for Learning 4.0. Int. J. Adv. Corp. Learn. 2016, 9, 20. [Google Scholar] [CrossRef]
  56. Wahyu, Y.; Suastra, I.W.; Sadia, I.W.; Suarni, N.K. The Effectiveness of Mobile Augmented Reality Assisted STEM-Based Learning on Scientific Literacy and Students’ Achievement. Int. J. Instr. 2020, 13, 343–356. [Google Scholar] [CrossRef]
  57. Yoon, S.A.; Elinich, K.; Wang, J.; Steinmeier, C.; Tucker, S. Using Augmented Reality and Knowledge-Building Scaffolds to Improve Learning in a Science Museum. Int. J. Comput.-Support. Collab. Learn. 2012, 7, 519–541. [Google Scholar] [CrossRef]
  58. Buchner, J.; Kerres, M. Media Comparison Studies Dominate Comparative Research on Augmented Reality in Education. Comput. Educ. 2023, 195, 104711. [Google Scholar] [CrossRef]
  59. Ainley, M.; Hidi, S.; Berndorff, D. Interest, Learning, and the Psychological Processes That Mediate Their Relationship. J. Educ. Psychol. 2002, 94, 545–561. [Google Scholar] [CrossRef]
  60. Ajzen, I.; Fishbein, M. Attitudes and the Attitude-Behavior Relation: Reasoned and Automatic Processes. Eur. Rev. Soc. Psychol. 2000, 11, 1–33. [Google Scholar] [CrossRef]
  61. Mayring, P.; Fenzl, T. Qualitative Inhaltsanalyse. In Handbuch Methoden der Empirischen Sozialforschung; Baur, N., Blasius, J., Eds.; Springer Fachmedien: Wiesbaden, Germany, 2019; pp. 633–648. ISBN 978-3-65821-308-4. [Google Scholar]
  62. Kuckartz, U.; Rädiker, S. Fokussierte Interviewanalyse mit MAXQDA: Schritt für Schritt; Springer Fachmedien: Wiesbaden, Germany, 2020; ISBN 978-3-65831-467-5. [Google Scholar]
  63. Haws, K.L.; Winterich, K.P.; Naylor, R.W. Seeing the World through GREEN-Tinted Glasses: Green Consumption Values and Responses to Environmentally Friendly Products. J. Consum. Psychol. 2014, 24, 336–354. [Google Scholar] [CrossRef]
  64. Spangenberger, P. Erfassung von Nachhaltigkeit Für Die Berufswahlmotivation Im Beruflichen Lehramt. In Praxisbezogene Lerngelegenheiten und Berufswahlmotivation im beruflichen Lehramtsstudium; Pfetsch, J., Stellmacher, A., Eds.; Waxmann: Kornwestheim, Germany, 2021; pp. 133–145. ISBN 978-3-83094-087-6. [Google Scholar]
  65. Rieß, W.; Mischo, C. Evaluationsbericht “Bildung Für Nachhaltige Entwicklung (BNE) an Weiterführenden Schulen in Baden-Württemberg”; Maßnahme Lfd. 15 Im Aktionsplan Baden-Württemberg; Umweltministerium Baden-Württemberg: Stuttgart, Germany, 2008. [Google Scholar]
  66. Waltner, E.-M.; Rieß, W.; Mischo, C.; Hörsch, C.; Scharenberg, K. Abschlussbericht: Bildung für Nachhaltige Entwicklung—Umsetzung Eines Neuen Leitprinzips und Seine Effekte auf Schüler/-Innenseite; Freiburg University of Education: Freiburg im Breisgau, Germany, 2021. [Google Scholar]
  67. Rheinberg, F.; Vollmeyer, R.; Engster, S.; Sreeramoju, R.R. FSS—Flow Short Scale (English Version). In The Acquisition of the Flow Experience; Stiensmeier-Pelster, J., Rheinberg, F., Eds.; Hogrefe: Göttingen, Germany, 2002; pp. 261–279. [Google Scholar]
  68. Rheinberg, F.; Vollmeyer, R.; Engeser, S. FKS—Flow-Kurzskala. Leibniz-Zent. Psychol. Inf. Dok. ZPID 2019. [Google Scholar] [CrossRef]
  69. Makransky, G.; Lilleholt, L.; Aaby, A. Development and Validation of the Multimodal Presence Scale for Virtual Reality Environments: A Confirmatory Factor Analysis and Item Response Theory Approach. Comput. Hum. Behav. 2017, 72, 276–285. [Google Scholar] [CrossRef]
  70. McKinney, W. Python for Data Analysis: Data Wrangling with Pandas, NumPy, and Jupyter, 3rd ed.; O’Reilly Media: Beijing, China; Boston, MA, USA; Farnham, UK; Sebastopol, Russia; Tokyo, Japan, 2022; ISBN 978-1-09810-403-0. [Google Scholar]
  71. R Core Team. R: A Language and Environment for Statistical Computing; R Foundation for Statistical Computing: Vienna, Austria, 2022. [Google Scholar]
  72. Fox, J.; Weisberg, S.; Price, B.; Adler, D.; Bates, D.; Baud-Bovy, G.; Bolker, B.; Ellison, S.; Firth, D.; Friendly, M.; et al. Car: Companion to Applied Regression; R Foundation for Statistical Computing: Vienna, Austria, 2023. [Google Scholar]
  73. Yentes, R.; Wilhelm, F. Careless: Procedures for Computing Indices of Careless Responding; R Foundation for Statistical Computing: Vienna, Austria, 2021. [Google Scholar]
  74. Signorell, A.; Aho, K.; Alfons, A.; Anderegg, N.; Aragon, T.; Arachchige, C.; Arppe, A.; Baddeley, A.; Barton, K.; Bolker, B.; et al. DescTools: Tools for Descriptive Statistics; R Foundation for Statistical Computing: Vienna, Austria, 2023. [Google Scholar]
  75. Long, J.A. Interactions: Comprehensive, User-Friendly Toolkit for Probing Interactions; R Foundation for Statistical Computing: Vienna, Austria, 2021. [Google Scholar]
  76. Navarro, D. Lsr: Companion to “Learning Statistics with R”; R Foundation for Statistical Computing: Vienna, Austria, 2021. [Google Scholar]
  77. Komsta, L.; Novomestky, F. Moments: Moments, Cumulants, Skewness, Kurtosis and Related Tests; R Foundation for Statistical Computing: Vienna, Austria, 2022. [Google Scholar]
  78. Revelle, W. Psych: Procedures for Psychological, Psychometric, and Personality Research; R Foundation for Statistical Computing: Vienna, Austria, 2023. [Google Scholar]
  79. Cronbach, L.J. Coefficient Alpha and the Internal Structure of Tests. Psychometrika 1951, 16, 297–334. [Google Scholar] [CrossRef]
  80. Field, Z.; Miley, J.; Field, A. Discovering Statistics Using R; Sage: Thousand Oaks, CA, USA, 2012; ISBN 978-1-44625-846-0. [Google Scholar]
  81. Mulders, M.; Träg, K.; Kirner, L. Artenvielfalt im Unterricht—Ergebnisse qualitativer Befragungen von Schüler:innen zum Einsatz von XR [Manuscript submitted for publication]. 2023. [Google Scholar]
  82. Jung, T.; tom Dieck, M.C.; Moorhouse, N.; tom Dieck, D. Tourists’ Experience of Virtual Reality Applications. In Proceedings of the 2017 IEEE International Conference on Consumer Electronics (ICCE), Las Vegas, NV, USA, 8–10 January 2017; pp. 208–210. [Google Scholar]
  83. Chang, Y.M.; Lai, C.L. Exploring the Experiences of Nursing Students in Using Immersive Virtual Reality to Learn Nursing Skills. Nurse Educ. Today 2021, 97, 104670. [Google Scholar] [CrossRef] [PubMed]
  84. Forsyth, D.R.; Zyzniewski, L.E.; Giammanco, C.A. Responsibility Diffusion in Cooperative Collectives. Pers. Soc. Psychol. Bull. 2002, 28, 54–65. [Google Scholar] [CrossRef]
  85. Alnuaimi, O.A.; Robert, L.P.; Maruping, L.M. Team Size, Dispersion, and Social Loafing in Technology-Supported Teams: A Perspective on the Theory of Moral Disengagement. J. Manag. Inf. Syst. 2010, 27, 203–230. [Google Scholar] [CrossRef]
  86. Spagnolli, A.; Gamberini, L. Immersion/Emersion: Presence in Hybrid Environments. In Proceedings of the Fifth Annual International Workshop Presence, Porto, Portugal, 9–11 October 2002. [Google Scholar]
  87. Bunnenberg, C. Mittendrin Im Historischen Geschehen? Gesch. Heute 2020, 13, 45–59. [Google Scholar] [CrossRef]
  88. Lewers, E. Durch Raum und Zeit?: Medienkritische Auseinandersetzung mit Virtual Reality im Geschichtsunterricht. Medienimpulse 2022, 60, 41. [Google Scholar] [CrossRef]
  89. Engel, J.; Karpowitz, L. Global forms of digitality intersect with local visual cultures—Zu einer postdigitalen Relationalität von Bildungsprozessen. In Jahrbuch Dokumentarische Methode. Heft 4/2021; Geimer, A., Klinge, D., Rundel, S., Thomsen, S., Eds.; JDM—Jahrbuch Dokumentarische Methode; Centrum für Qualitative Evaluations- und Sozialforschung e.V. (ces): Berlin, Germany, 2021; Volume 4, pp. 185–210. [Google Scholar]
  90. Astleitner, H. Designing Emotionally Sound Instruction: The FEASP-Approach. Instr. Sci. 2000, 28, 169–198. [Google Scholar] [CrossRef]
Figure 1. The greenpeace XR application: (a) communication with locals; (b) views of the rainforest.
Sustainability 15 16496 g001
Figure 2. Interaction between (a) flow and knowledge and (b) presence and knowledge.
Sustainability 15 16496 g002
Table 1. Internal consistencies.
ScaleCronbach’s α
Flow Short Scale0.92
Multimodal Presence Scale0.92
Multimodal Presence Scale—physical0.85
Multimodal Presence Scale—social 0.88
Table 2. Means, standard deviations, and missing values of all key variables.
PretestMSDNAPosttestMSDNA
K *3.060.810 3.370.8525
I *4.581.290 4.601.4328
A *5.001.261 5.261.3542
G *3.240.690 3.290.8143
E *3.570.580 3.580.6845
FlowXXX 4.311.2346
MPS *XXX 2.750.8345
MPS ph *XXX 2.800.8345
MPS so *XXX 2.720.8946
* K—knowledge, I—interest, A—attitude, G—Green Scale, E—Environmental Protection Scale, MPS—Multimodal Presence Scale (ph—physical subscale, so—social subscale). Skewness and kurtosis measures are provided in the Supplementary Materials.
Table 3. Correlations between the key variables.
PretestPosttest
PretestKIAGEKIAGEFlow
K *1
I *0.381
A *0.220.431
G *−0.010.430.361
E *0.120.380.450.571
Posttest
K0.380.330.200.130.301
I0.200.570.370.450.480.451
A0.180.280.580.420.570.230.441
G0.040.290.320.760.590.240.430.521
E−0.070.260.390.550.760.200.420.570.731
Flow0.130.280.280.400.340.340.470.390.550.421
MPS−0.030.17−0.030.300.110.170.200.010.380.100.58
* K—knowledge, I—interest, A—attitude, G—Green Scale, E—Environmental Protection Scale, MPS—Multimodal Presence Scale.
Table 4. Correlations between flow, presence, and gain in knowledge, interest, general attitude, Green Scale attitude, and Environmental Protection attitude.
K *I *A *G *E *
Flowr0.2140.2410.1640.2760.197
p0.0260.0110.0920.0040.042
Presencer0.1940.0580.0280.101−0.001
p0.0430.5450.7720.2970.989
* K—knowledge, I—interest, A—attitude, G—Green Scale, E—Environmental Protection Scale.
Table 5. Moderator analyses.
ModelInteraction
F (df)ptp
K *: Flow13.00 (3, 104)<0.0010.252−2.190.031
I *: Flow26.43 (3, 106)<0.0010.4120.410.682
A *: Flow25.09 (3, 103)<0.0010.405−1.530.128
G *: Flow56.76 (3, 104)<0.0010.610−0.590.557
E *: Flow53.49 (3, 103)<0.0010.598−0.370.711
K: Presence10.10 (3, 105)<0.0010.202−2.190.031
I: Presence18.75 (3, 107)<0.0010.326−1.870.064
A: Presence19.69 (3, 104)<0.0010.344−0.470.641
G: Presence44.93 (3, 105)<0.0010.550−0.650.515
E: Presence52.39 (3, 104)<0.0010.590−2.560.012
* K—knowledge, I—interest, A—attitude, G—Green Scale, E—Environmental Protection Scale, R²—adjusted R².
Disclaimer/Publisher’s Note: The statements, opinions and data contained in all publications are solely those of the individual author(s) and contributor(s) and not of MDPI and/or the editor(s). MDPI and/or the editor(s) disclaim responsibility for any injury to people or property resulting from any ideas, methods, instructions or products referred to in the content.

