Article

Potential Impact of Urban Land Use on Microplastic Atmospheric Deposition: A Case Study in Pristina City, Kosovo

1
Department of Ecology and Environmental Protection, Faculty of Environmental and Mechanical Engineering, Poznań University of Life Sciences, Piątkowska 94C, 60-649 Poznań, Poland
2
Department of Chemistry, Faculty of Forestry and Wood Technology, Poznań University of Life Sciences, Wojska Polskiego 75, 60-625 Poznań, Poland
3
Department of Construction and Geoengineering, Faculty of Environmental and Mechanical Engineering, Poznań University of Life Sciences, Wojska Polskiego 28, 60-637 Poznań, Poland
4
Department of Wood Science, Faculty of Forestry and Wood Technology, Poznań University of Life Sciences, Wojska Polskiego 75, 60-625 Poznań, Poland
5
Department of Plant Taxonomy, Faculty of Biology, Adam Mickiewicz University, Uniwersytetu Poznańskiego 8, 61-614 Poznań, Poland
*
Author to whom correspondence should be addressed.
Sustainability 2023, 15(23), 16464; https://doi.org/10.3390/su152316464
Submission received: 13 October 2023 / Revised: 17 November 2023 / Accepted: 27 November 2023 / Published: 30 November 2023
(This article belongs to the Special Issue A Multidisciplinary Approach to Sustainability)

Abstract

:
Microplastics (MPs) pervade various ecosystems, including urban landscapes. The aim of this study was to determine whether the presence of MPs in atmospheric deposition samples is related to land use. For this purpose, atmospheric deposition was collected from 15 to 25 March 2021 at seven research sites in the city of Pristina (Kosovo). Each research site was characterized by different land use. Collected atmospheric deposition samples were analyzed in the laboratory, and then the filtered samples were assessed using a light microscope. The type and size of microplastics in the samples were defined and statistically analyzed. The highest number of total MPs was noted on the highway, while the lowest one was near to the park. A positive relationship was observed between the number of total MPs and the proportion of areas classified as “roads and associated areas” in the land use of the analyzed research sites. Furthermore, a negative relationship was found between the number of total MPs and the proportion of areas classified as “green urban areas”. Based on our preliminary research, it can be observed that the type of land use may have a key role in MPs’ atmospheric deposition.

Graphical Abstract

1. Introduction

Plastic particles smaller than 5 mm, known as microplastics (MPs), have become one of the most critical and conspicuous environmental issues in the world. The general term microplastic includes a complex heterogeneous mixture of plastic particles smaller than <5 mm [1,2,3], which are characterized by a wide range of chemical (polymer structure and supplement chemical profile) and physical (e.g., density, size, shape) features [4]. MPs comprise a large and continual spectrum of sizes and shapes, including 3D spherules, 2D fragments (flat particles) and 1D fibers (with one larger dimension) [5].
A large and growing body of research describes the presence of microplastics in water ecosystems, especially for the marine environment [6,7,8,9,10,11,12,13,14,15]. So far, research has focused on the content of MPs in the marine environment and on the injury and death of marine birds, mammals, fish and reptiles resulting from plastic entanglement and ingestion. Research into potential sources of microplastics in this environment is also growing in interest [5,6]. In contrast with the marine environment, less attention has been paid to microplastics in different compartments of terrestrial ecosystems. The main research in this area concerns the microplastic contamination of soils, and it has been estimated that between 63,000 and 430,000 tons of microplastics from various sources are released annually into Europe’s agricultural fields [6]. The knowledge of microplastics in other ecosystems, such as forests, wetlands or drylands, where the microplastic dynamics might by quite different, is still limited. Urban environments are of particular interest [15] because they can be characterized by expected microplastic sources such as construction activities, transport of plastic garbage or abrasion of vehicles (mainly tire treads). Furthermore, street channelizing devices (traffic cones, barrels and drums) and speed bumps, which are produced by the use of recycled PVC bottles, increase the pollution of urban ecosystems with MPs [15]. Even though microplastics originate from activities that take place in the terrestrial ecosystem, little research exists regarding this ecosystem [16].
Additionally, the atmosphere plays a crucial role in the regional or global transportation of a wide range of suspended materials [17]. Research into atmospheric microplastics has only recently started to garner attention. As of now, there remains a paucity of studies dedicated to this subject, with research efforts emerging only within the past 8 years [16]. Furthermore, most of the studies conducted thus far have been of a short-term nature, being performed over a couple of few weeks or involving intermittent sampling at various locations. Additionally, these studies have often been constrained by a limited number of samples [18]. Despite the fact that extensive research on the identification, segregation and toxicity of microplastics has been conducted, there are still many problems to be solved because microplastic pollution is a long-term process that requires systematic and in-depth research [19]. Additionally, due to their widespread distribution and increasing presence in the environment, MPs are among the most obvious environmental issues facing government agencies worldwide [20,21]. Research regarding microplastics in urban areas and their connection to land use is notably limited. As assumed, the release of microplastic particles may have a linkage to specific land-use categories like roads, waste areas and others.
Consequently, the aim of this study was to investigate the potential association between microplastics and various land-use patterns driven by the multifaceted origins of these particles. Moreover, it is worth noting that this is the first research conducted in southeastern Europe regarding the presence of microplastics in the atmospheric deposition in the urban area. It is a fast-developing economical region focused more on economic aspects than ecological effects of this growth, hence there is a huge necessary to prioritize environmental effects such as emissions of various substances. The present study might be the first step in establishing a simple tool for the identification of the distribution of microplastic pollution based only on the land-use type in urban areas. By studying microplastic sources and distribution in urban areas, we can provide information for regional strategies for sustainable development and future pollution control. Moreover, it emphasizes the need for continuous comprehensive research to understand the long-term implications of microplastic pollution.

2. Materials and Methods
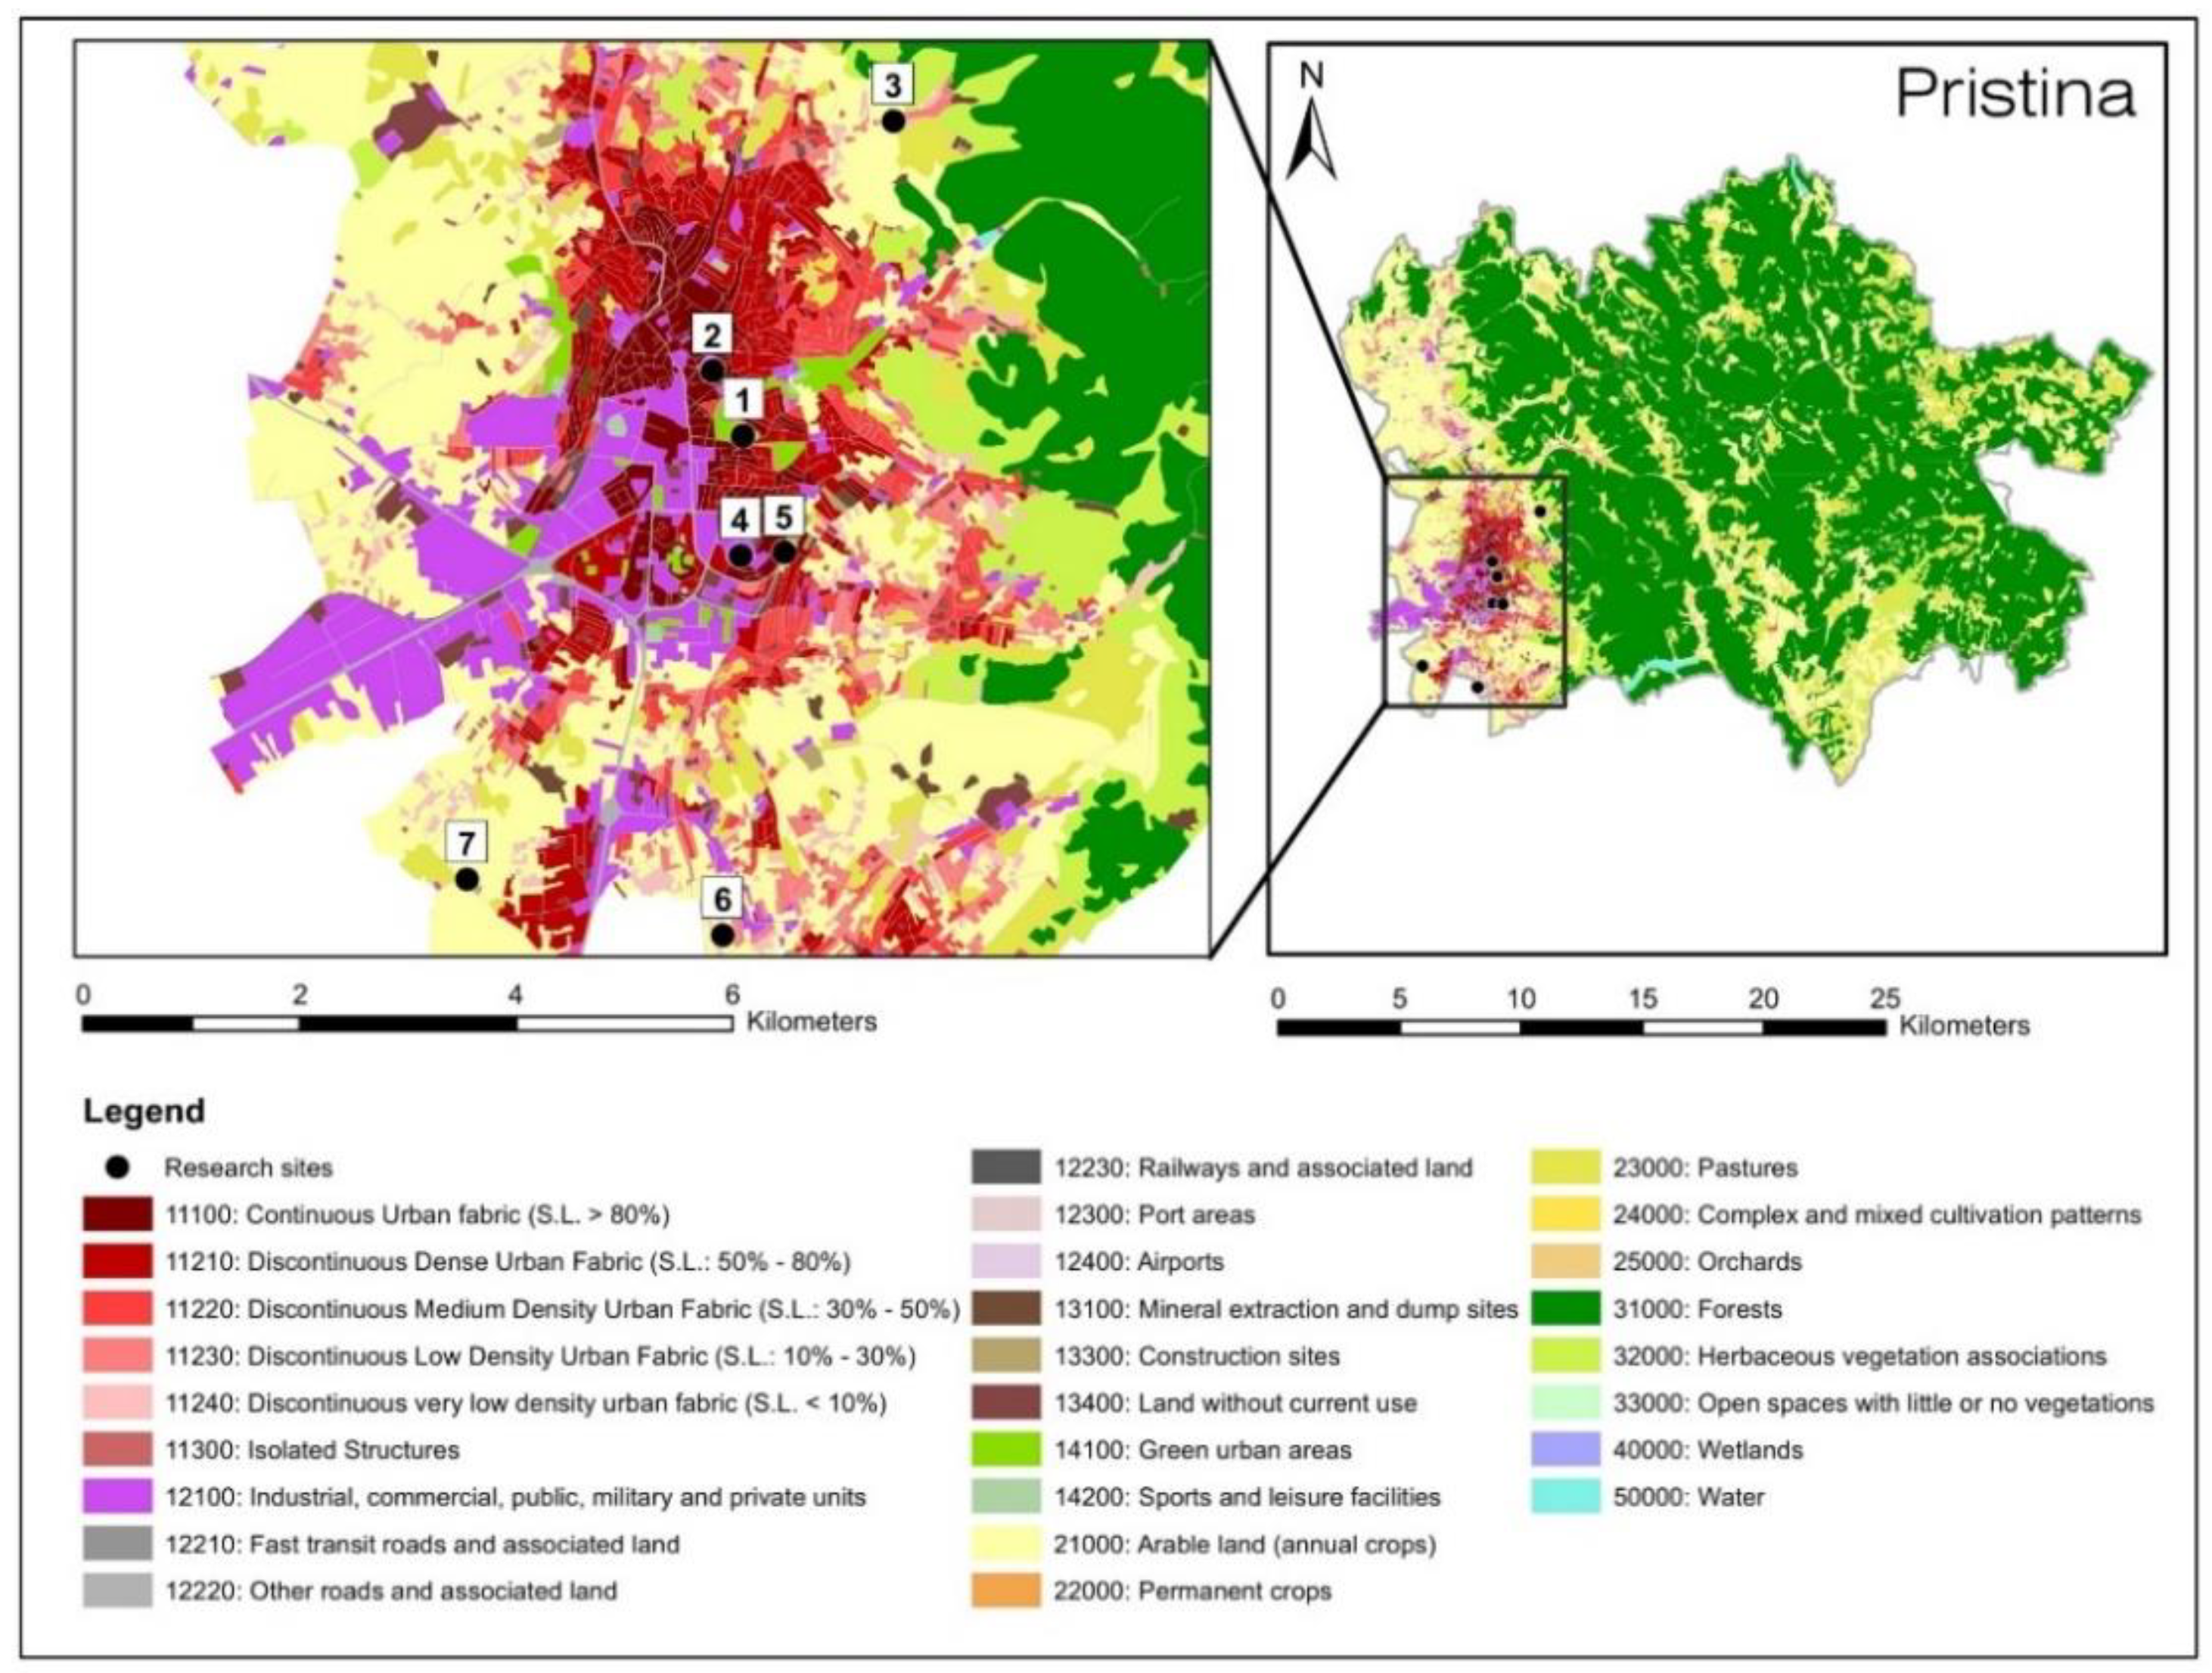
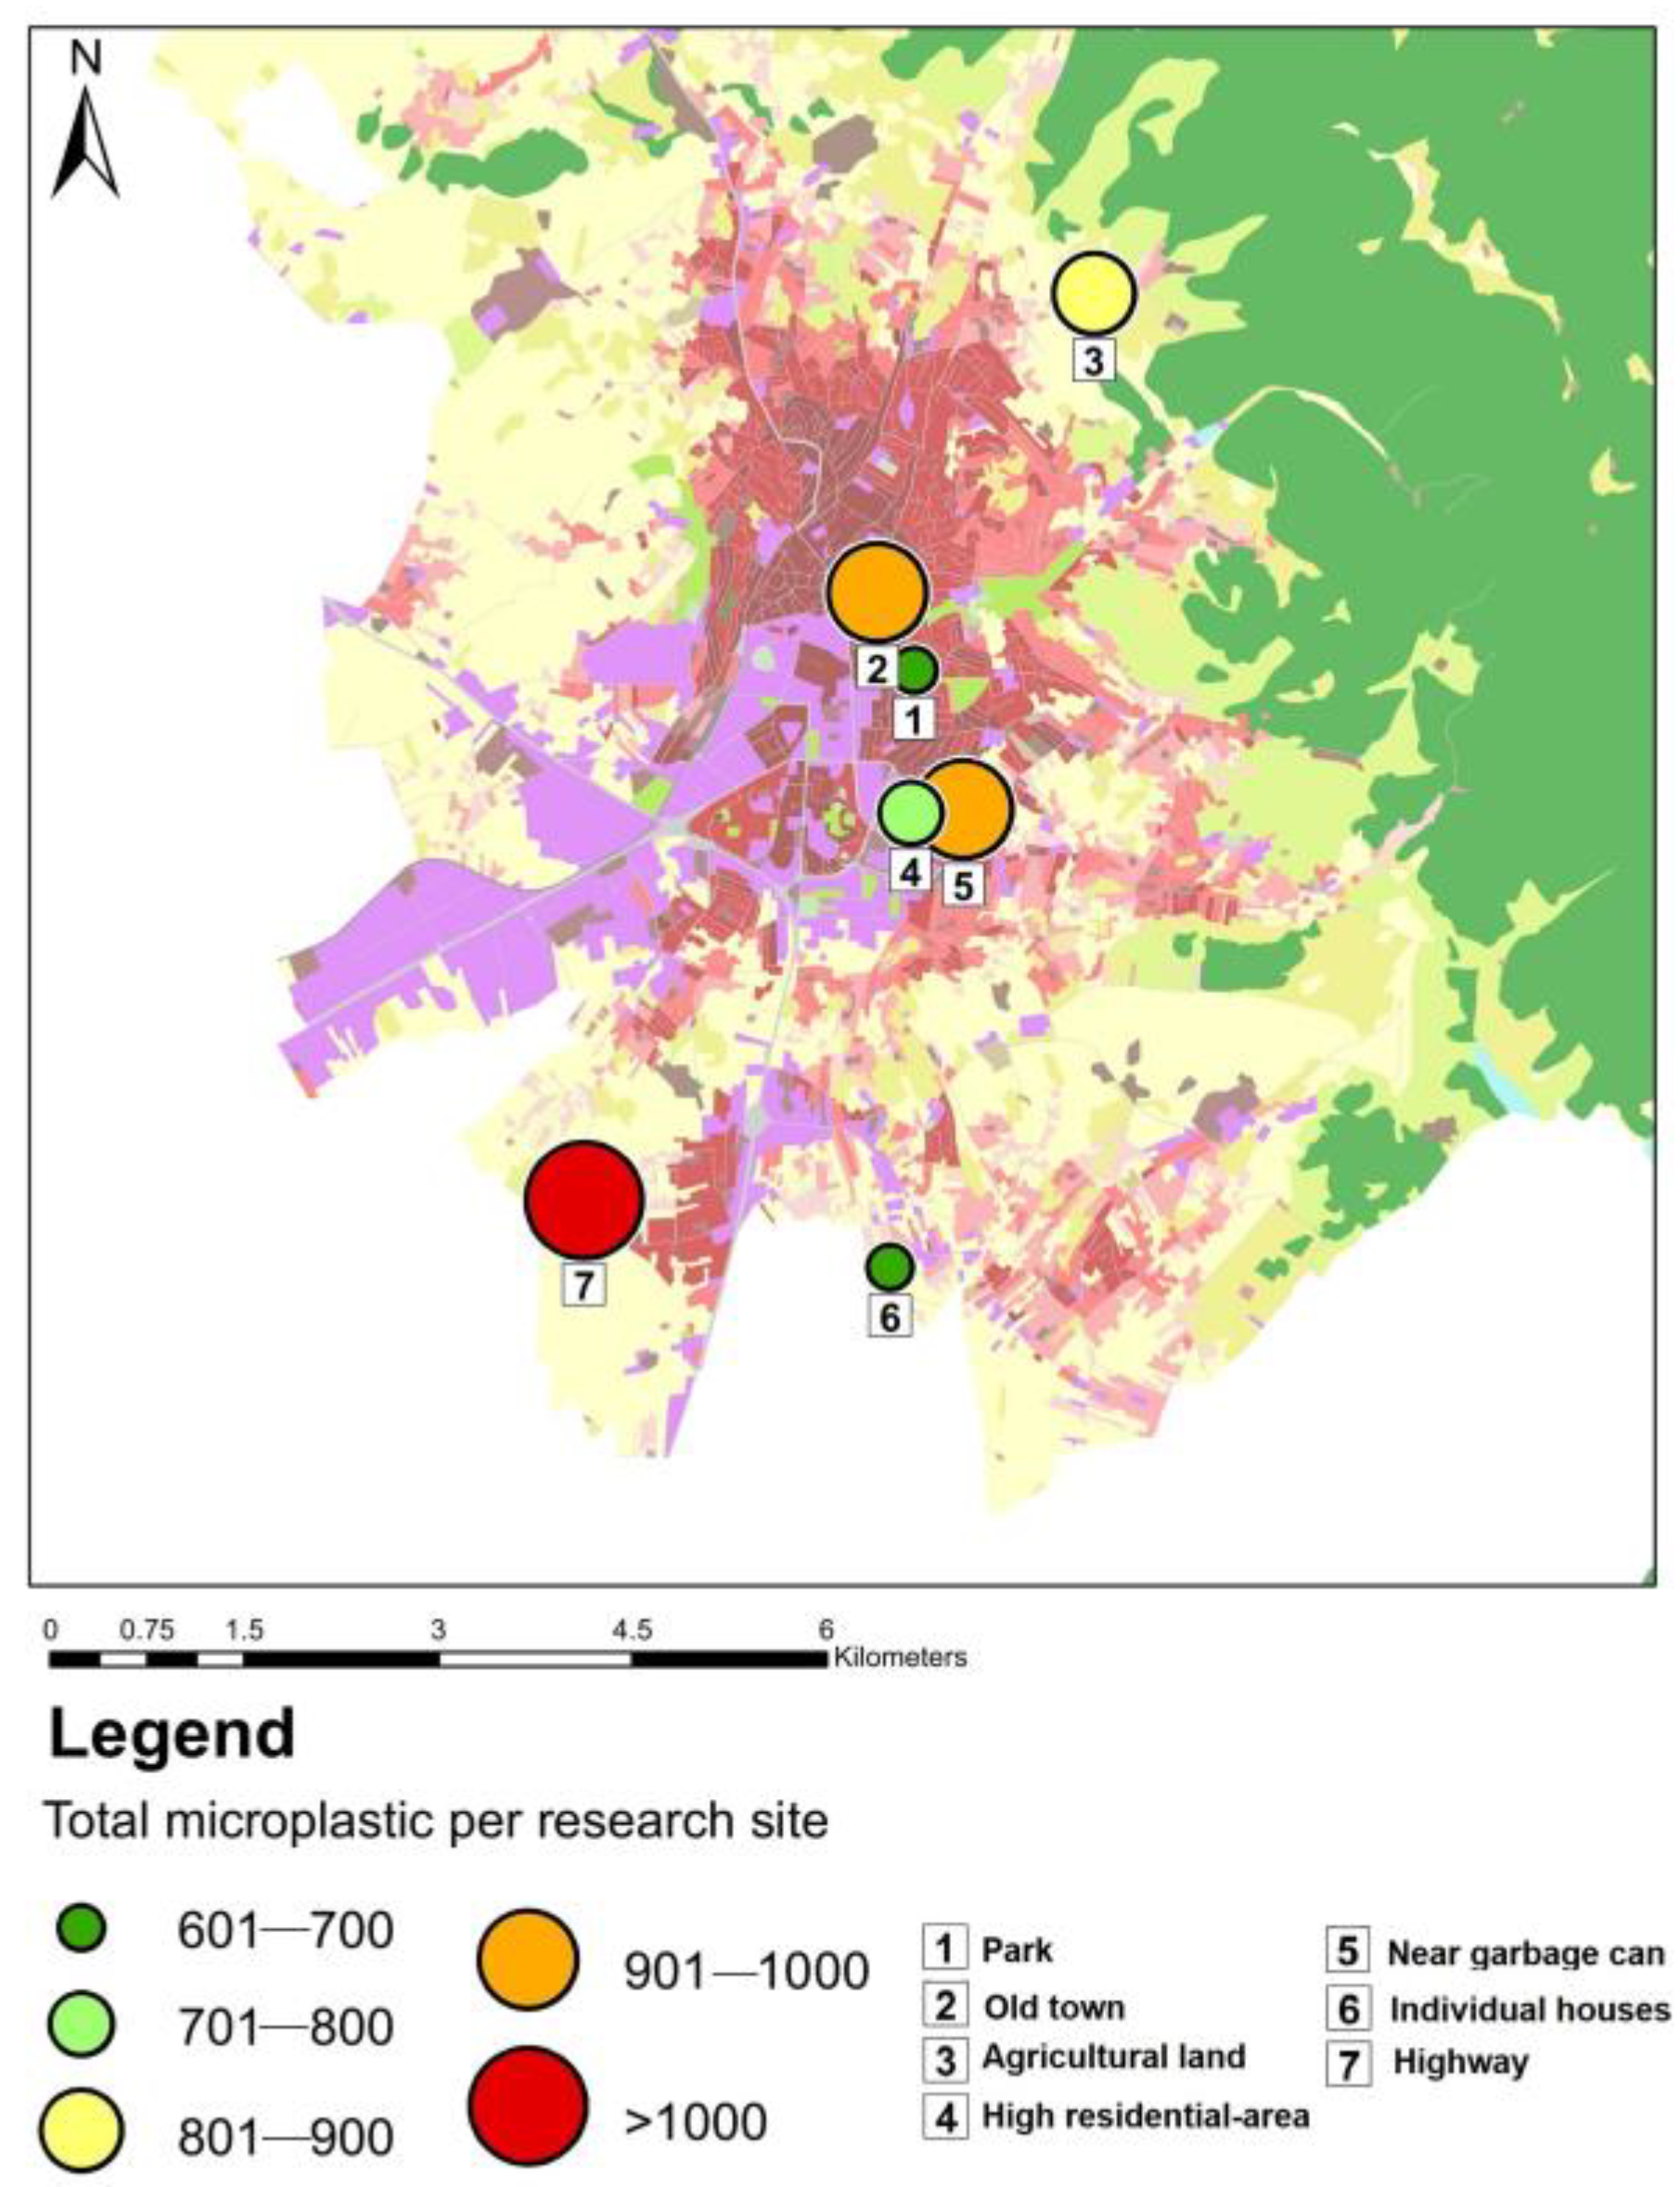
2.1. Study Area

The research was conducted in the city of Pristina, the capital and largest city in the Republic of Kosovo. Pristina is the most densely populated municipality in Kosovo. It covers an area of approximately 572 km2. Geographically, it is located in the northeastern part of Kosovo, at a geographic latitude of 42°40′00″ and geographic longitude of 21°20′15″. Pristina is characterized by a continental climate, with hot summers and cold winters and with an average rainfall of 600 mm per year. In Pristina, for instance, the prevailing wind direction is from the north [22,23], and the wind speeds ranged from 7 to 15 miles per hour (mph) during the sampling period. It is the economic, administrative, political and cultural center of Kosovo. In recent years, the territory of Pristina has undergone an extraordinary physical and social transformation. These transformations are most pronounced by the expansion of the urban area, often due to unplanned construction in many areas of the city [24].
For this study, samples of atmospheric deposition were collected from 7 different research sites in the city of Pristina. The sites were chosen to represent different elements of the urban and suburban landscape. Hence, the research sites were located in a park, the old town, agricultural land, a high-density residential area, near a garbage can, a low-density residential area and a highway (Table 1 and Figure 1). During the selection of the locations of the research sites, every effort was made to ensure that the research sites were at a similar distance from the road, as well as from buildings and other objects that could affect wind speed and direction. Sites located near industrial areas were omitted due to the low representativeness of these areas compared with the rest of Europe. In addition, it has already been shown in the literature [25] that industry can be a source of MPs.

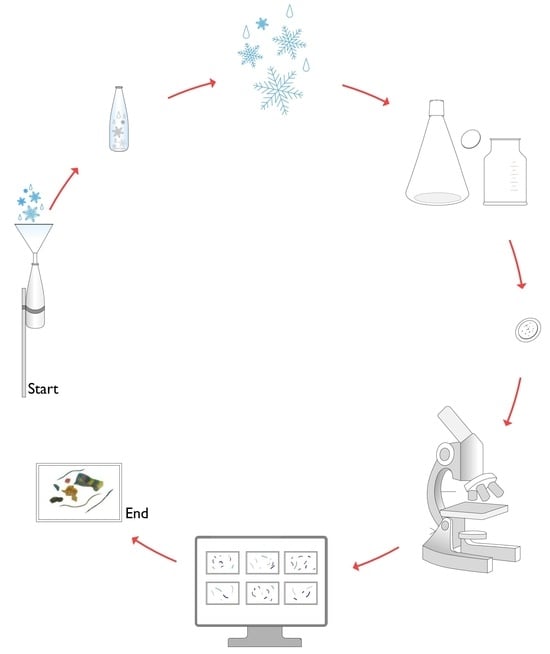
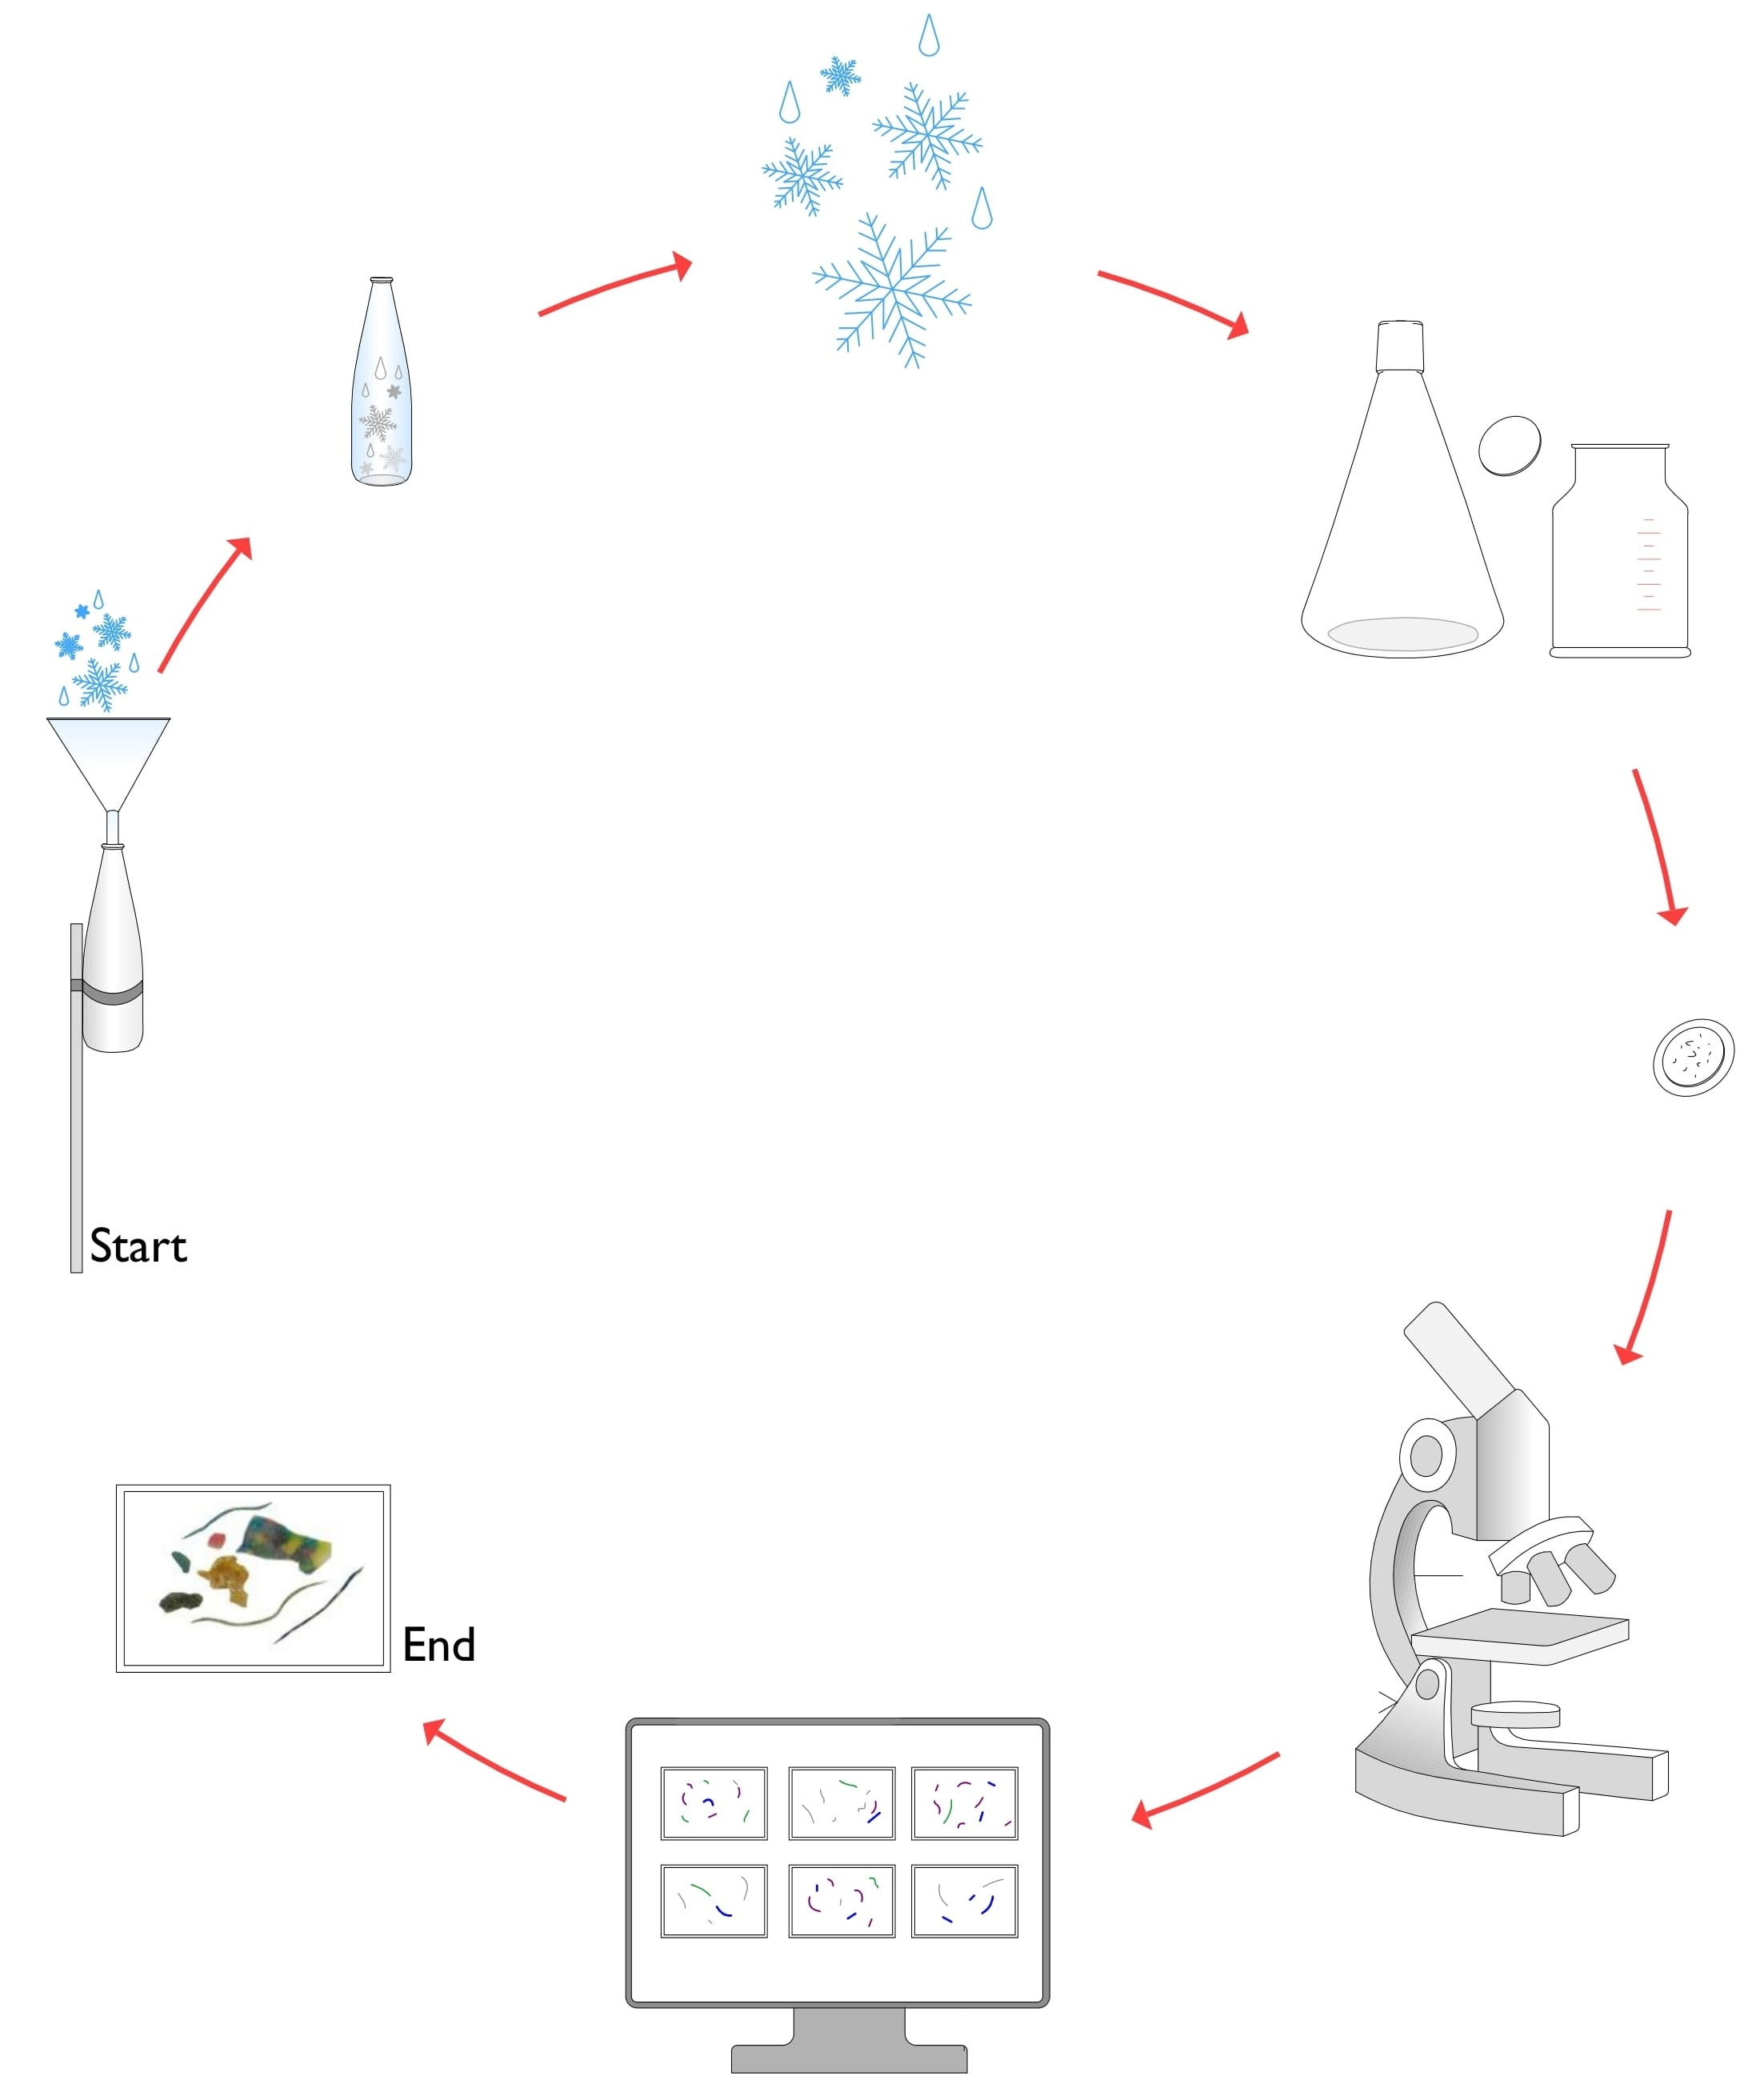
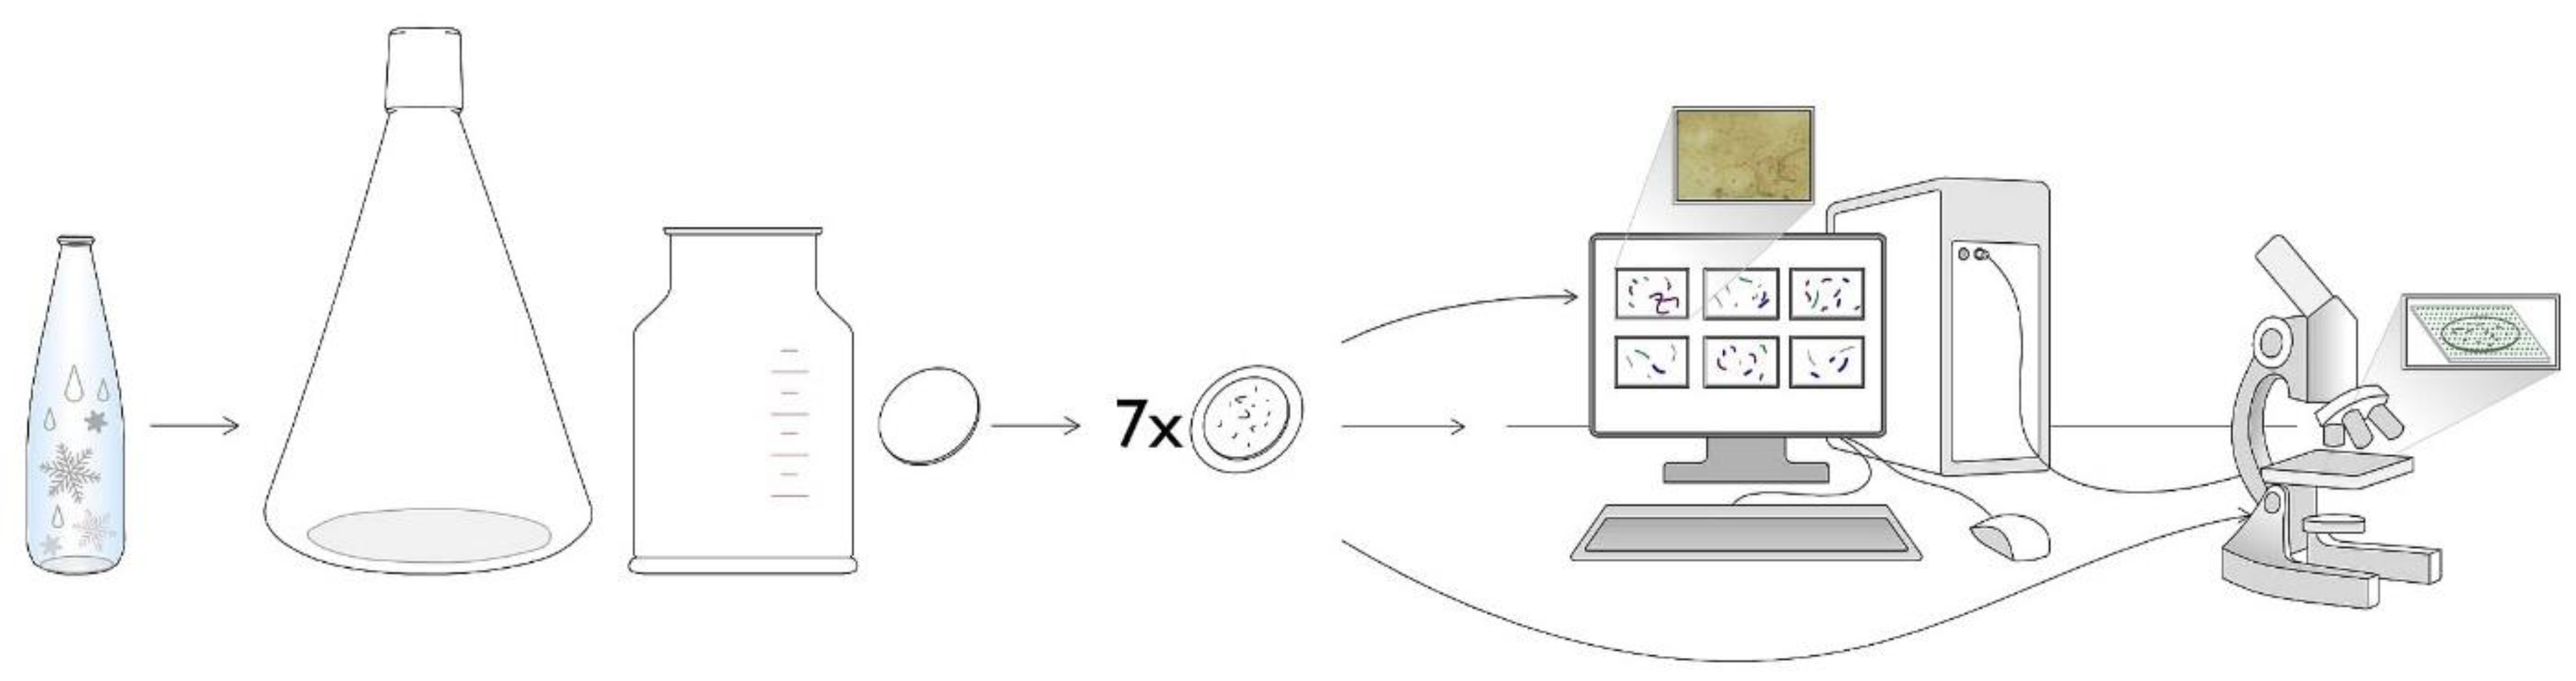
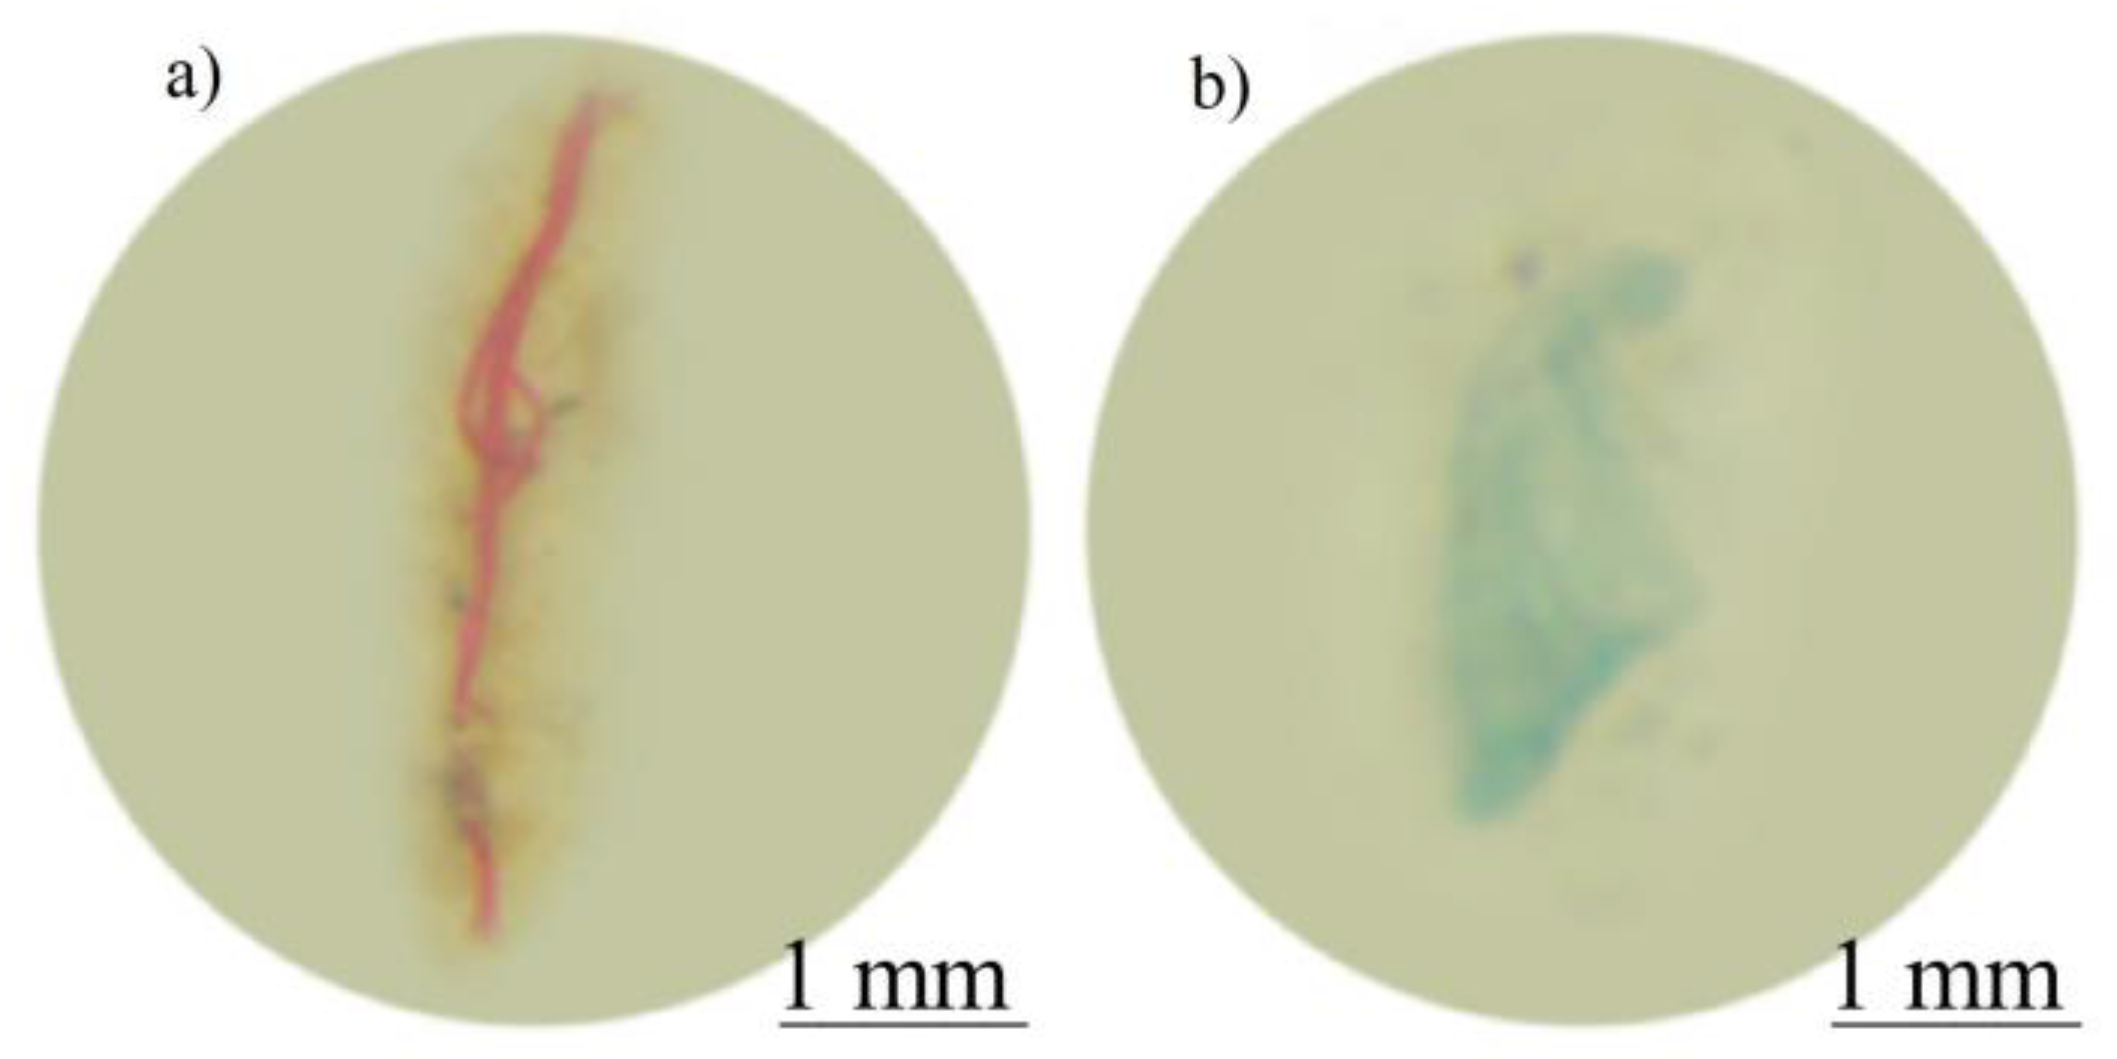
2.2. Sample Collection, Preparation and Visual Identification of Microplastics

In Pristina, atmospheric deposition (dry and wet) samples were collected from 15 to 25 March 2021 from the research sites (Table 1). To collect atmospheric depositions, a modified method according to Klein and Fischer [26] was performed. Unlike typical atmospheric deposition samplers, our unique design prioritized sample purity by using stainless steel, aluminum and cork to prevent contamination. At all research sites, glass bottles (500 mL) were placed at the height of 1 m above ground level and were well-perforated in metal pipes. Furthermore, these glass bottles were wrapped in aluminum foil to avoid negative effects of solar radiation on the collected samples. In addition, to enable the collection of atmospheric deposition, the bottles were equipped with funnels. After collecting the atmospheric deposition samples, the bottles were stored in a refrigerator at + 4 °C (in the dark).
The procedure of preparing samples in the laboratory used only glass materials initially cleaned with ultra-pure water Milli-Q (18.2 MΩ × cm). At each step, the samples were covered with aluminum foil to prevent sample contamination with dust particles. Collected samples were filtered with microfiber glass filters (Whatman Grade GF/A, 1.6 µm) using a vacuum pump (Waters Corp., Milford, MA, USA) and the vacuum filtration assembly (Sigma-Aldrich, St. Louis, MO, USA). The collection bottles were rinsed several times with pre-filtered ultra-pure water in a total volume of 100 mL. The filters were then washed with 15 mL of ultra-pure pre-filtered water in a glass beaker (ca. 50 mL), and 15 mL of 30% pre-filtered hydrogen peroxide (H2O2) was added to obtain a final concentration of 15%. Beakers were tightly covered with aluminum foil, and filters were left for digestion for eight days at room temperature [27]. The dispersions were then filtered using glass filters as described above, and the glasses were washed with ultra-pure water in a total volume of 30 mL, followed by 10 mL of 80% pre-filtered methanol. The dry filters were placed between two Petri dishes, wrapped in aluminum foil and stored in the refrigerator until visual identification of the microplastics. Then, the filters were investigated for MPs’ occurrence using a light microscope.
The filters were placed in the microscope (Olympus SZX 16) equipped with a camera (Olympus DP 74). The microscope was connected to a computer equipped with CellSens 2.1 software. Mostly, the filters were analyzed with 4× magnification. In order to make the microplastics’ photos more accessible for counting and classification based on the size, an ultra-thin glass with a dot grid at a distance of 3 mm was placed above the filter to create a dot planimeter. From each filter, approximately 95 photos were taken for the microplastic counting and classification. MPs were categorized morphologically as fibers or fragments and classified into two size groups, i.e., small (≤2.5 mm) or big (>2.5 mm).
In order to distinguish microplastics from other types of particles, several criteria were used (5), such as:
  • The colors of the microplastics were homogeneous and clear;
  • Organic and cellular structures were not visible;
  • The fibers were of the same thickness along their length, not narrowed at the end and not completely straight;
  • The transparent red and green particles were viewed carefully and with higher magnification;
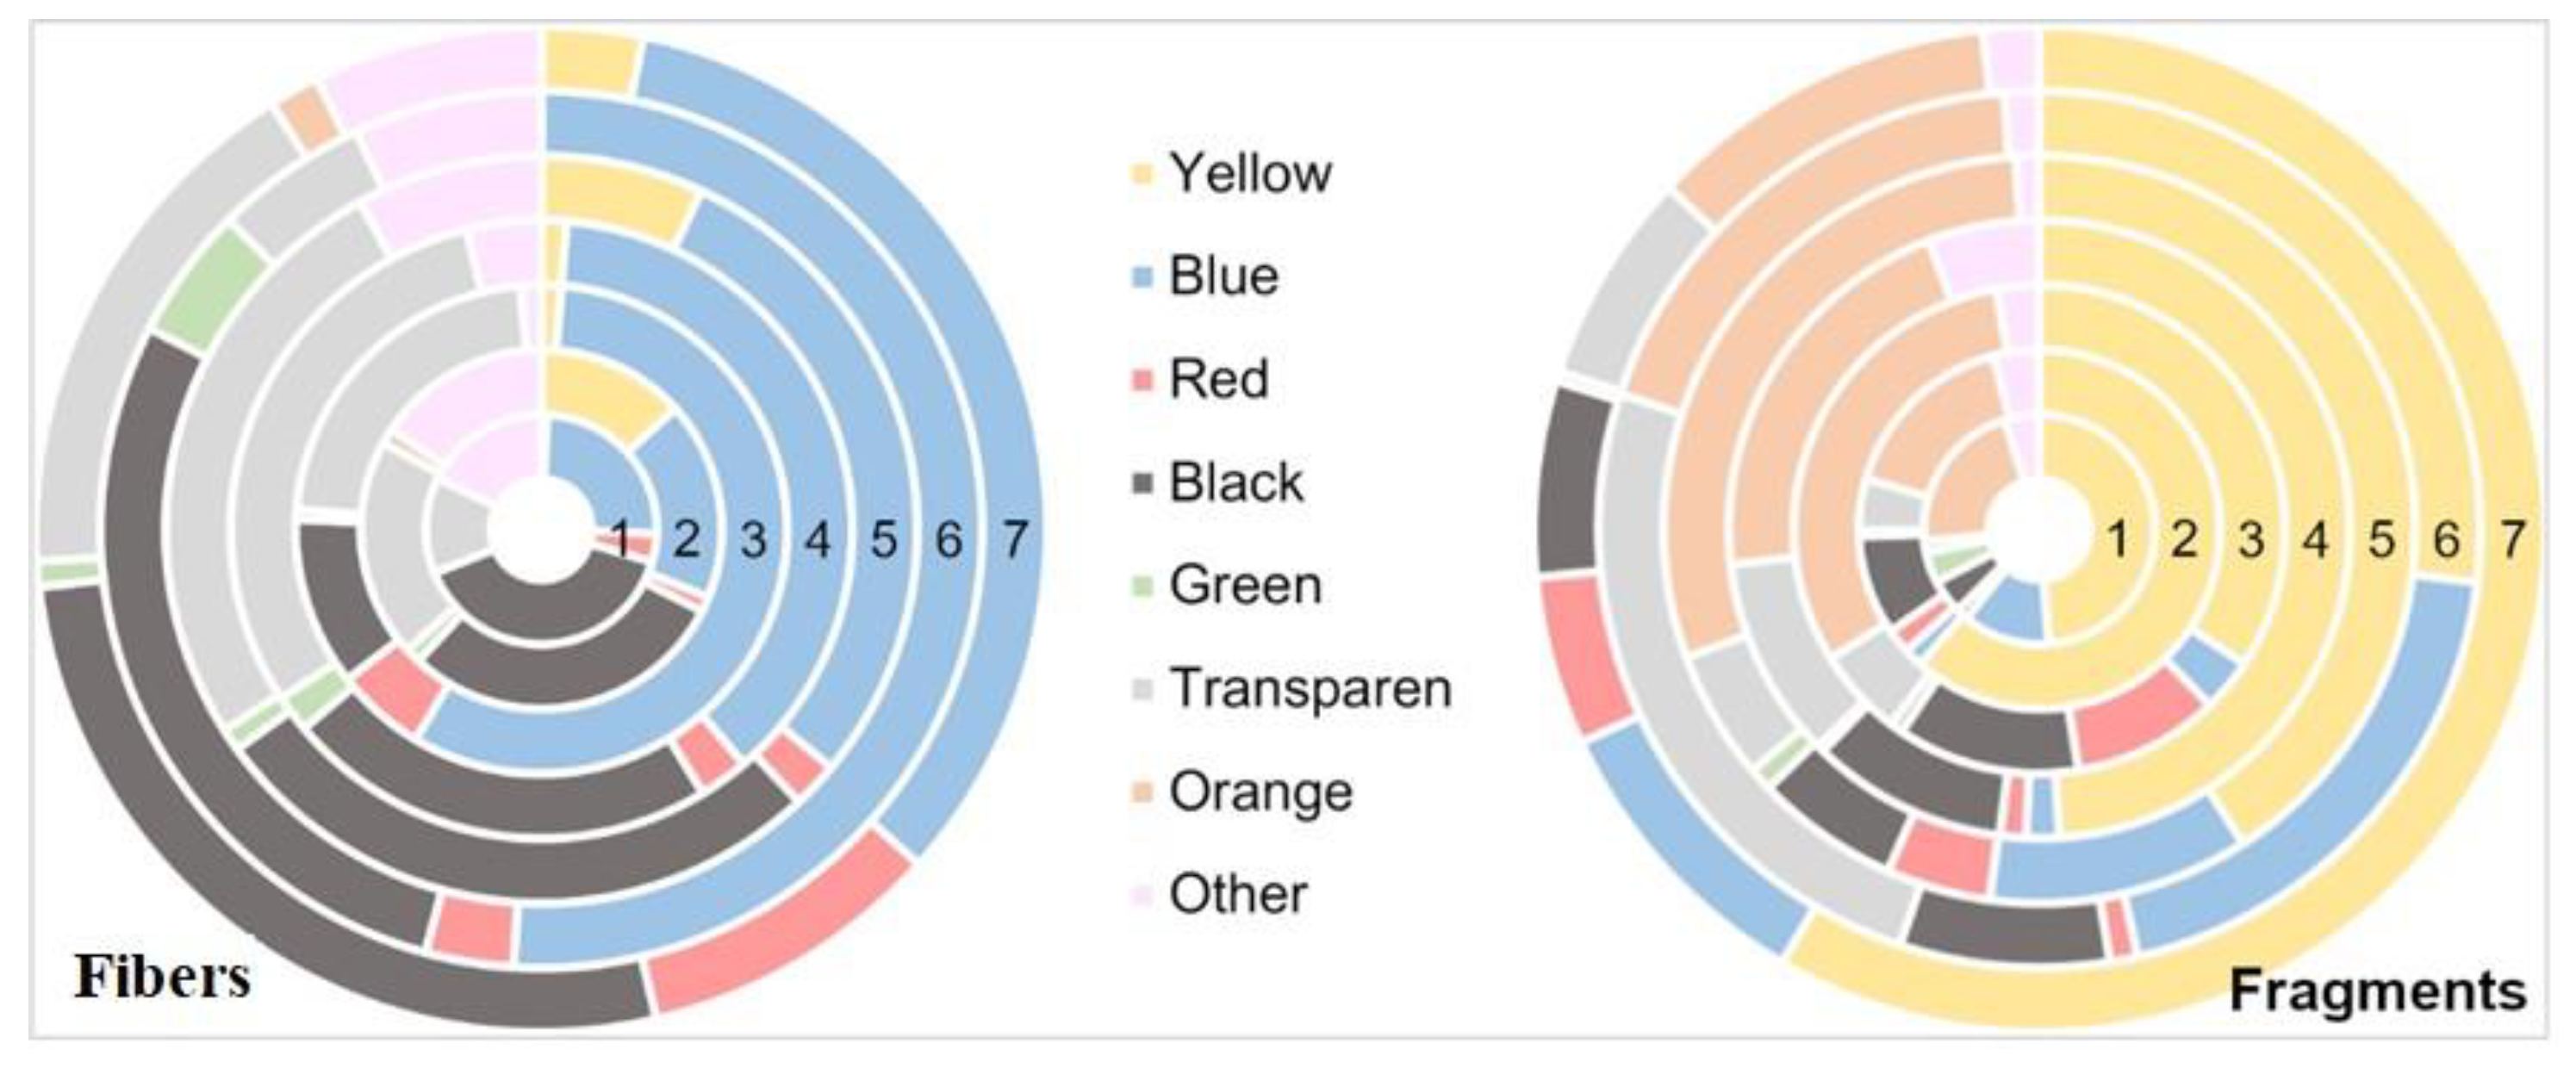
  • Color can serve as a unique identifying of plastic materials, ranging from transparency and variations of white to striking colors such as orange, blue, green and purple through to black.
A bias existed for the results obtained with this method of observation: there was a tendency to overestimate light-colored MPS (blue, red) compared with other particles; hence, to avoid errors, the following procedures were used:
  • Observations were repeated by two independent people;
  • One person carried out the observation throughout the study;
  • Particles of uncertain nature or an image with insufficient quality were ignored;
  • Microplastics smaller than 0.5 mm were not considered [28,29,30].
To enhance clarity, Figure 2 illustrates the procedure for microplastic identification.

2.3. Statistical Analysis

Statistical analyses were performed using the computational platform R (R Core, 2014). Data were illustrated with the aid of a heatmap in order to compare the number of microplastics (fragments or fibers) in the research sites concerning land-use purposes. In addition, two-dimensional variables (research location and microplastics’ number/quantity) were represented by color. A heatmap was also performed to identify similarities/differences between research sites and types of microplastics.
In addition, for the evaluation of relations between land-use structure and microplastics, principal component analysis (PCA) was performed. The relation between MPs and land use was evaluated concerning all land-use types near all research sites. Based on previous research [31,32], a 100 m wide buffer for all research sites was used to determine the land-use structure. Land-use structure was based on land-use classification from Urban Atlas 2018 (European Environment Agency, 2018). However, to avoid redundancy, only selected land-use types were considered for PCA analysis (Table 2).

3. Results

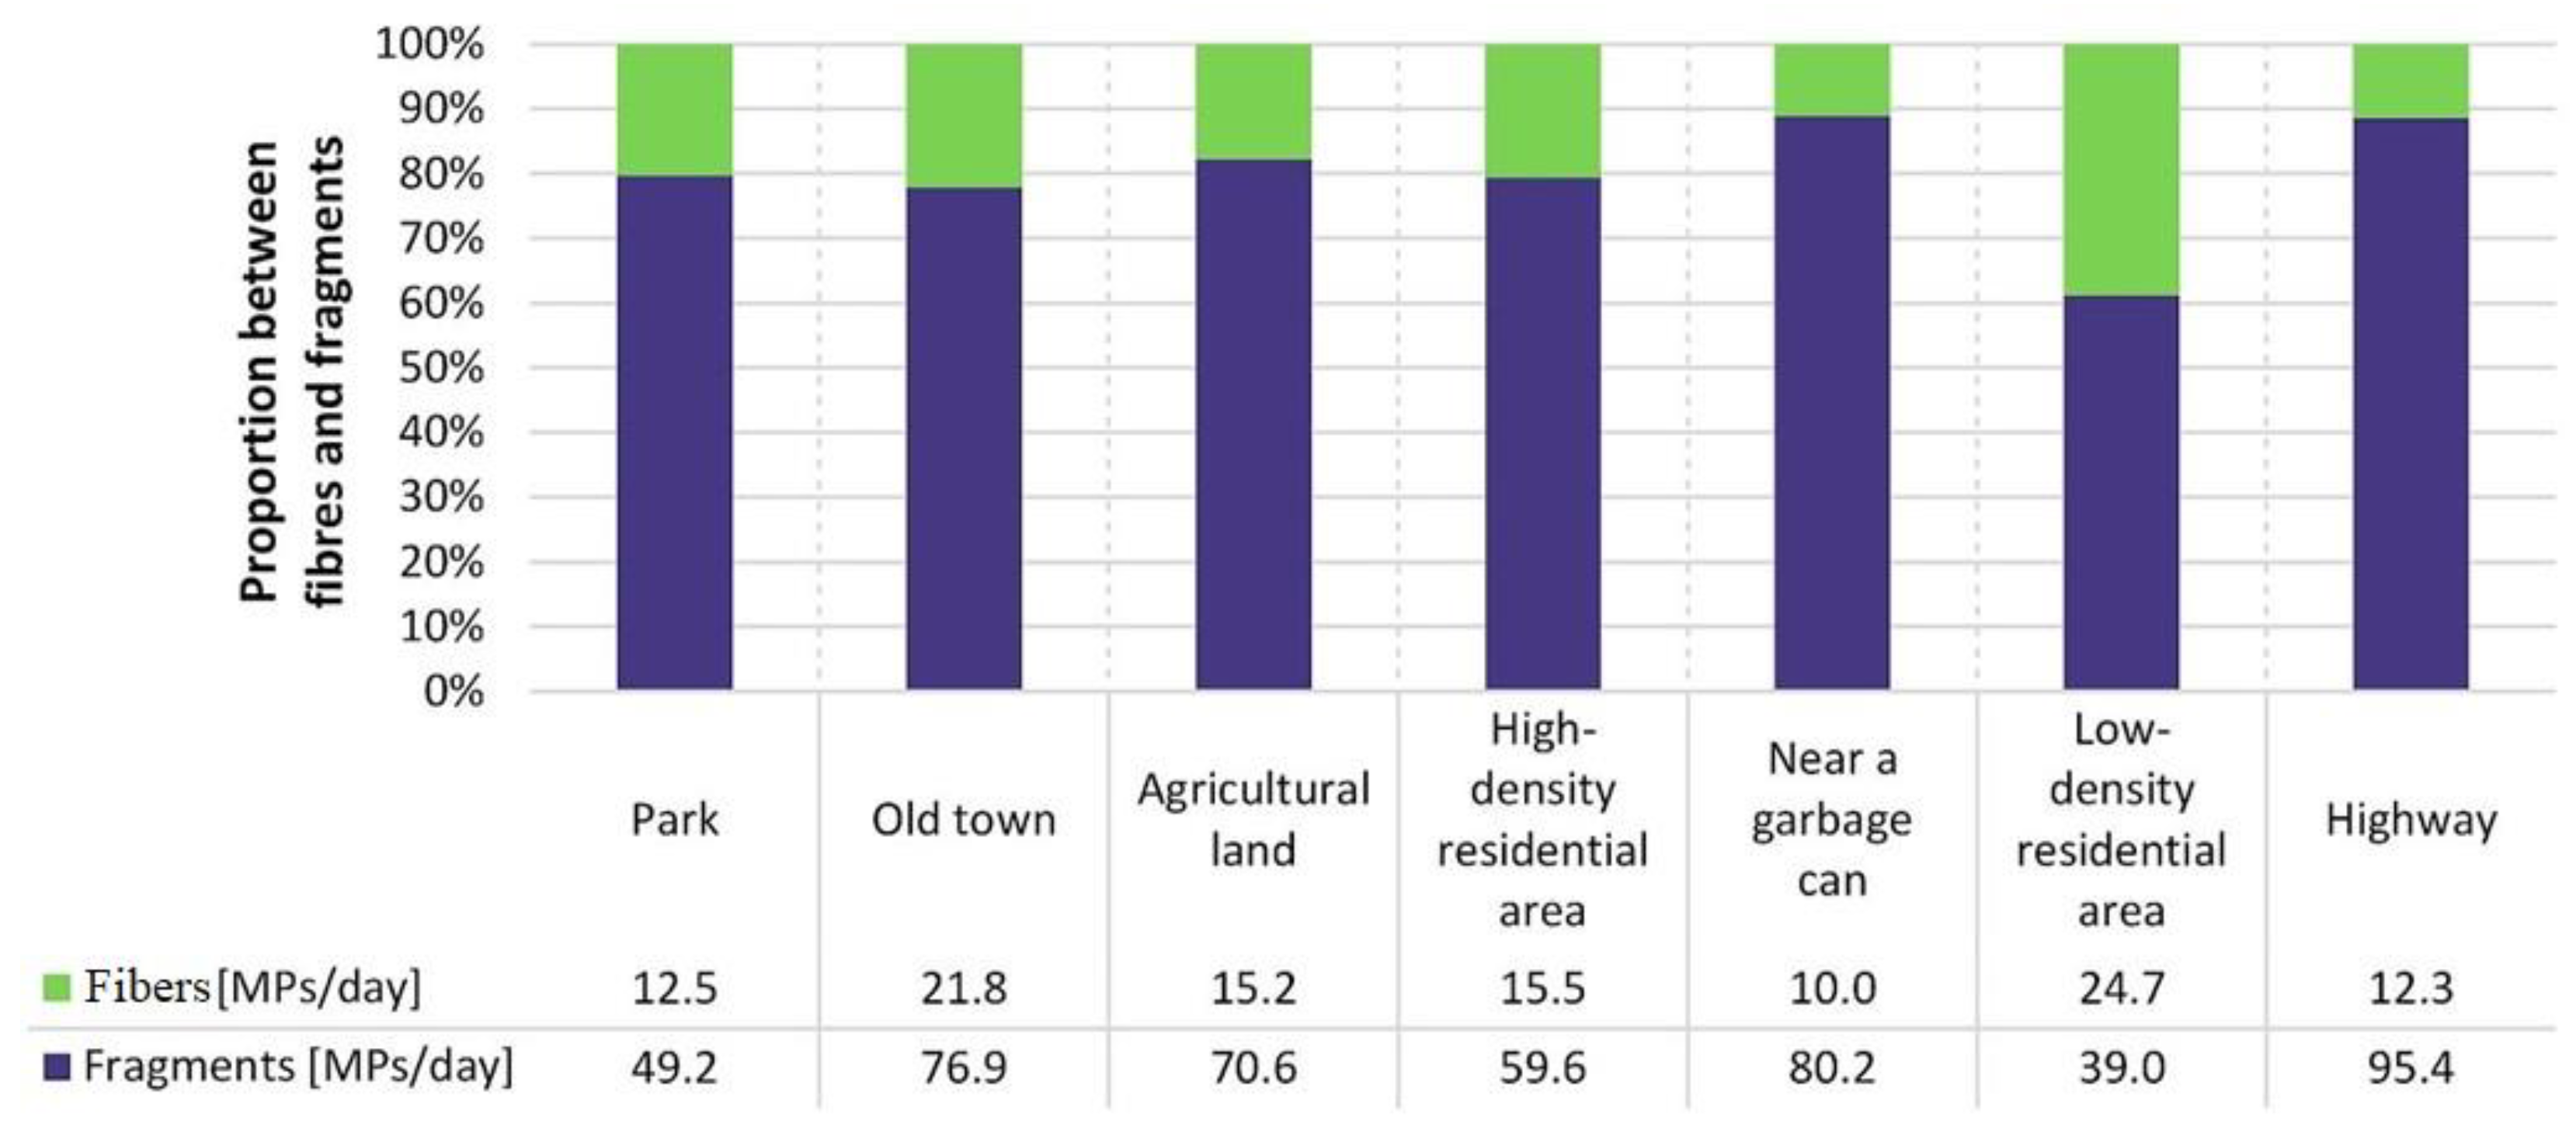
3.1. MPs’ Characteristics

Microplastics were recorded at all research sites. The highest number of MPs was noted on the highway (No. 7) (Figure 3). In addition, a high level of MPs was noted in the old town (No. 2) and near the garbage can (No. 5). On the agricultural land (No. 3), a moderate number of MPs compared with other research sites was observed. In the high-density residential area (No. 4), a higher number of MPs was observed compared with the park (No.1) and the low-density residential area (No. 6). The park (No.1) and the low-density residential area (No. 6) were characterized by the lowest number of microplastics among the research sites (Figure 3).
Regarding the color of microplastics in all research sites, the most frequently noted fibers were blue, black and transparent. Their participation in a total count ranged from 67% (No. 2) to 91% (No. 3). The least-frequently observed colors of fibers were orange and green. The highest color variation in the case of fibers was observed in the old town (No. 2) and near the garbage can (No. 5). For fragments, the most frequently noted colors were yellow and orange. The dominance of these two colors ranged from 46% (No. 8) to 78% (No. 2). The least frequently observed color of microplastic was green. The most varied color range of fragments was found in the low-density residential area (No. 6) (Figure 4).
Microplastic fibers and fragments were the sole types observed at all research sites (Figure 5). In general, concerning the size of fibers and fragments, microplastics were characterized by being less than 2.5 mm in most cases (Figure 5). In the old town (No. 2), the low-density residential area (No. 6) and in the sample collected near the garbage can (No. 5), a small number of microplastic particles were characterized by being more than 2.5 mm. In the park of Pristina (No. 1), only one microplastic particle was noted to be bigger than 2.5 mm. However, more microplastic particles bigger than 2.5 mm were noted near the highway (No. 7).
The largest number of fragments was observed near the highway (No. 7), near the garbage can (No. 5) and in the old town (No. 2) (Figure 6). In these three research sites, in the old town (No. 2), a larger number of fibers was found than on the highway (No. 7) or near the garbage can (No. 5). Moreover, a similar number of fibers was observed on the agricultural land (No. 3) and in the high-density residential area (No. 4). On the agricultural land (No. 3), a larger number of fragments was observed in contrast with the high-density residential area (No. 4). Lower numbers of both fibers and fragments were found in the park (No. 1) and the low-density residential area (No. 6) (Figure 6).
The abundance of MPs per day varied between 61.7 and 107.7 MPs/day considering all research sites (Figure 6). The lowest abundance was observed in the park of Pristina (61.7 MPs/day), while the highest abundance was found on the highway (107.7 MPs/day), in the old town (98.7 MPs/day), on the agricultural land (85.8 MPs/day) and near the garbage can (90.2 MPs/day). In addition, a moderate abundance was observed in the low-density residential area (63.7 MPs/day) and the high-density residential area (75.1 MPs/day) (Figure 6).

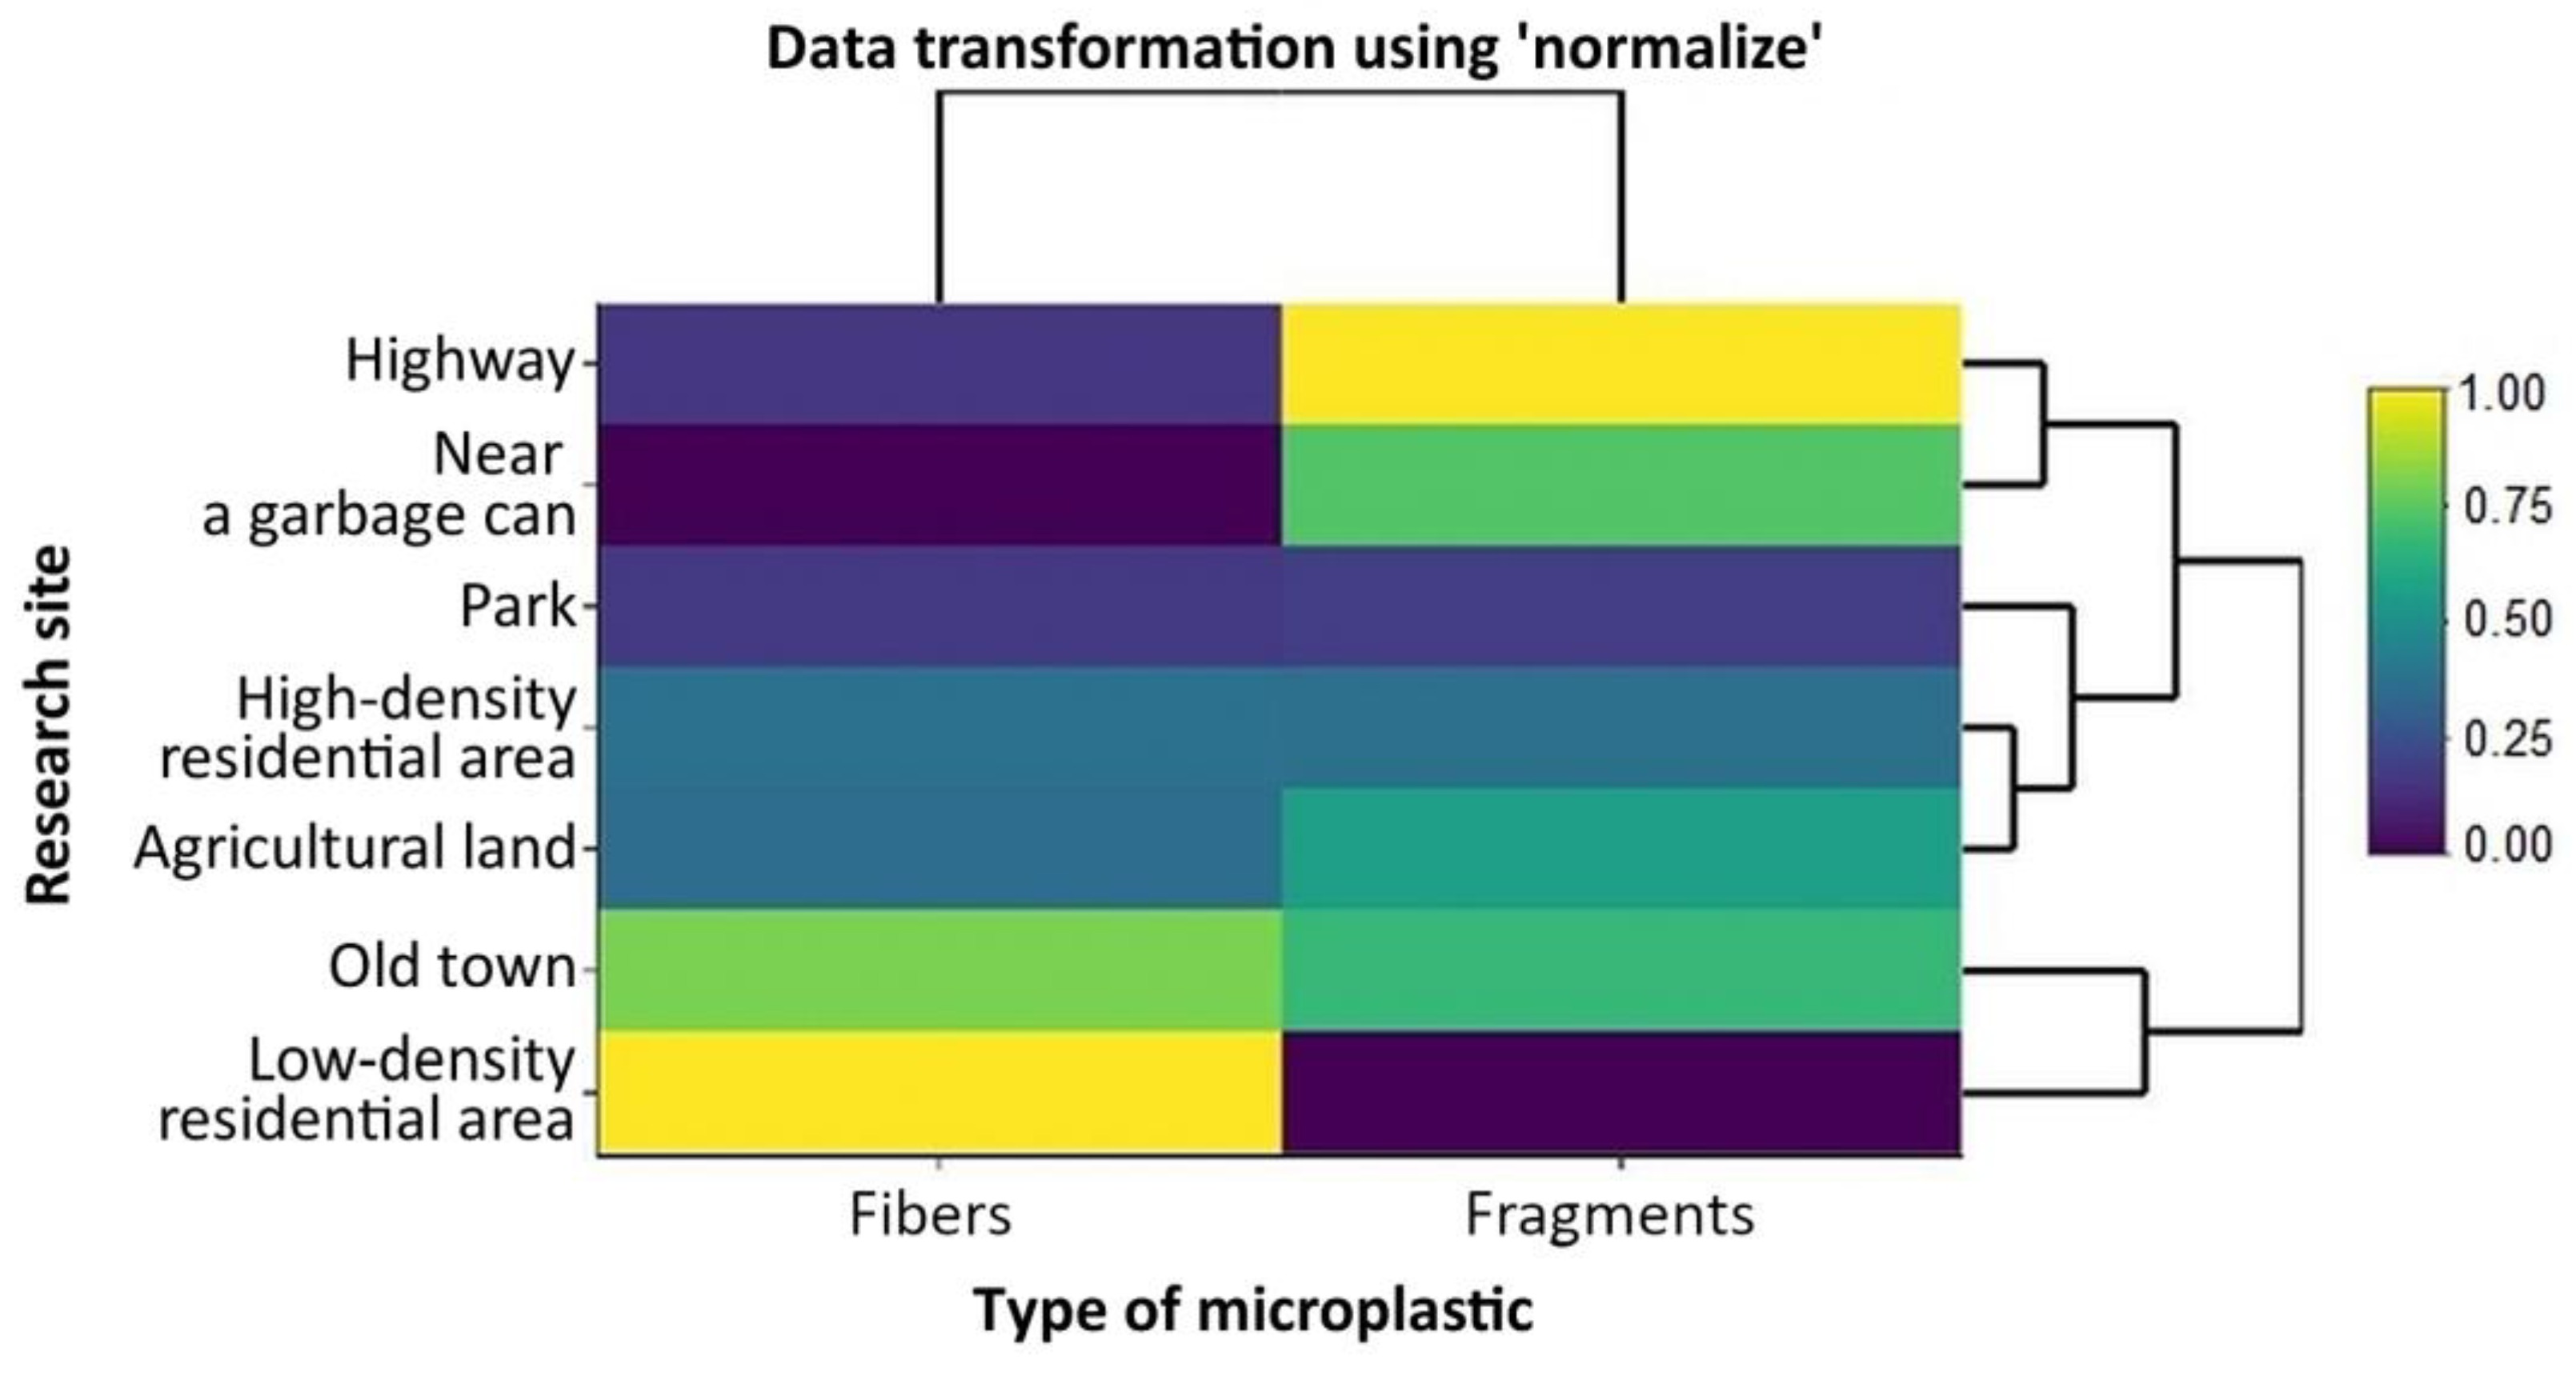
3.2. Heatmap and Cluster Analysis of MPs

The cluster analysis of fibers and fragments made it possible to indicate two main groups within the research sites. The first main group included the highway (No. 4), near the garbage can (No. 5), the park (No. 1), the high-density residential area (No. 4) and the agricultural land (No. 3). The second main group included the old town (No. 2) and the low-density residential area (No. 6). The first group consisted of two subgroups. The first subgroup included the highway (No. 7) and the research site near the garbage can (No. 5), while the second subgroup included the high-density residential area (No. 4), the agricultural land (No. 3) and the park (No. 1). A heatmap revealed that fiber MPs had an elevated level in the low-density residential area (No. 6) and the old town (No. 2) compared with fragments. On the other hand, the highway (No. 7), near the garbage can (No. 5) and the park (No. 1) were characterized by a low level of fibers. Also, based on the heatmap, it can be noted that the values of fibers and fragments in the park (No. 1) and the high-density residential area (No. 4) were similar. In addition, some different patterns of elevated MPs’ levels were observed on the highway (No. 7) and in the low-density residential area (No. 6) regarding fragments. Moreover, on the highway (No. 7), the level of fragments dominated, while, in the low-density residential area, the number of fragments was lower. Also, compared with fiber microplastics dominating in the low-density residential area (No. 6), fragments were noted at a low number (Figure 7).

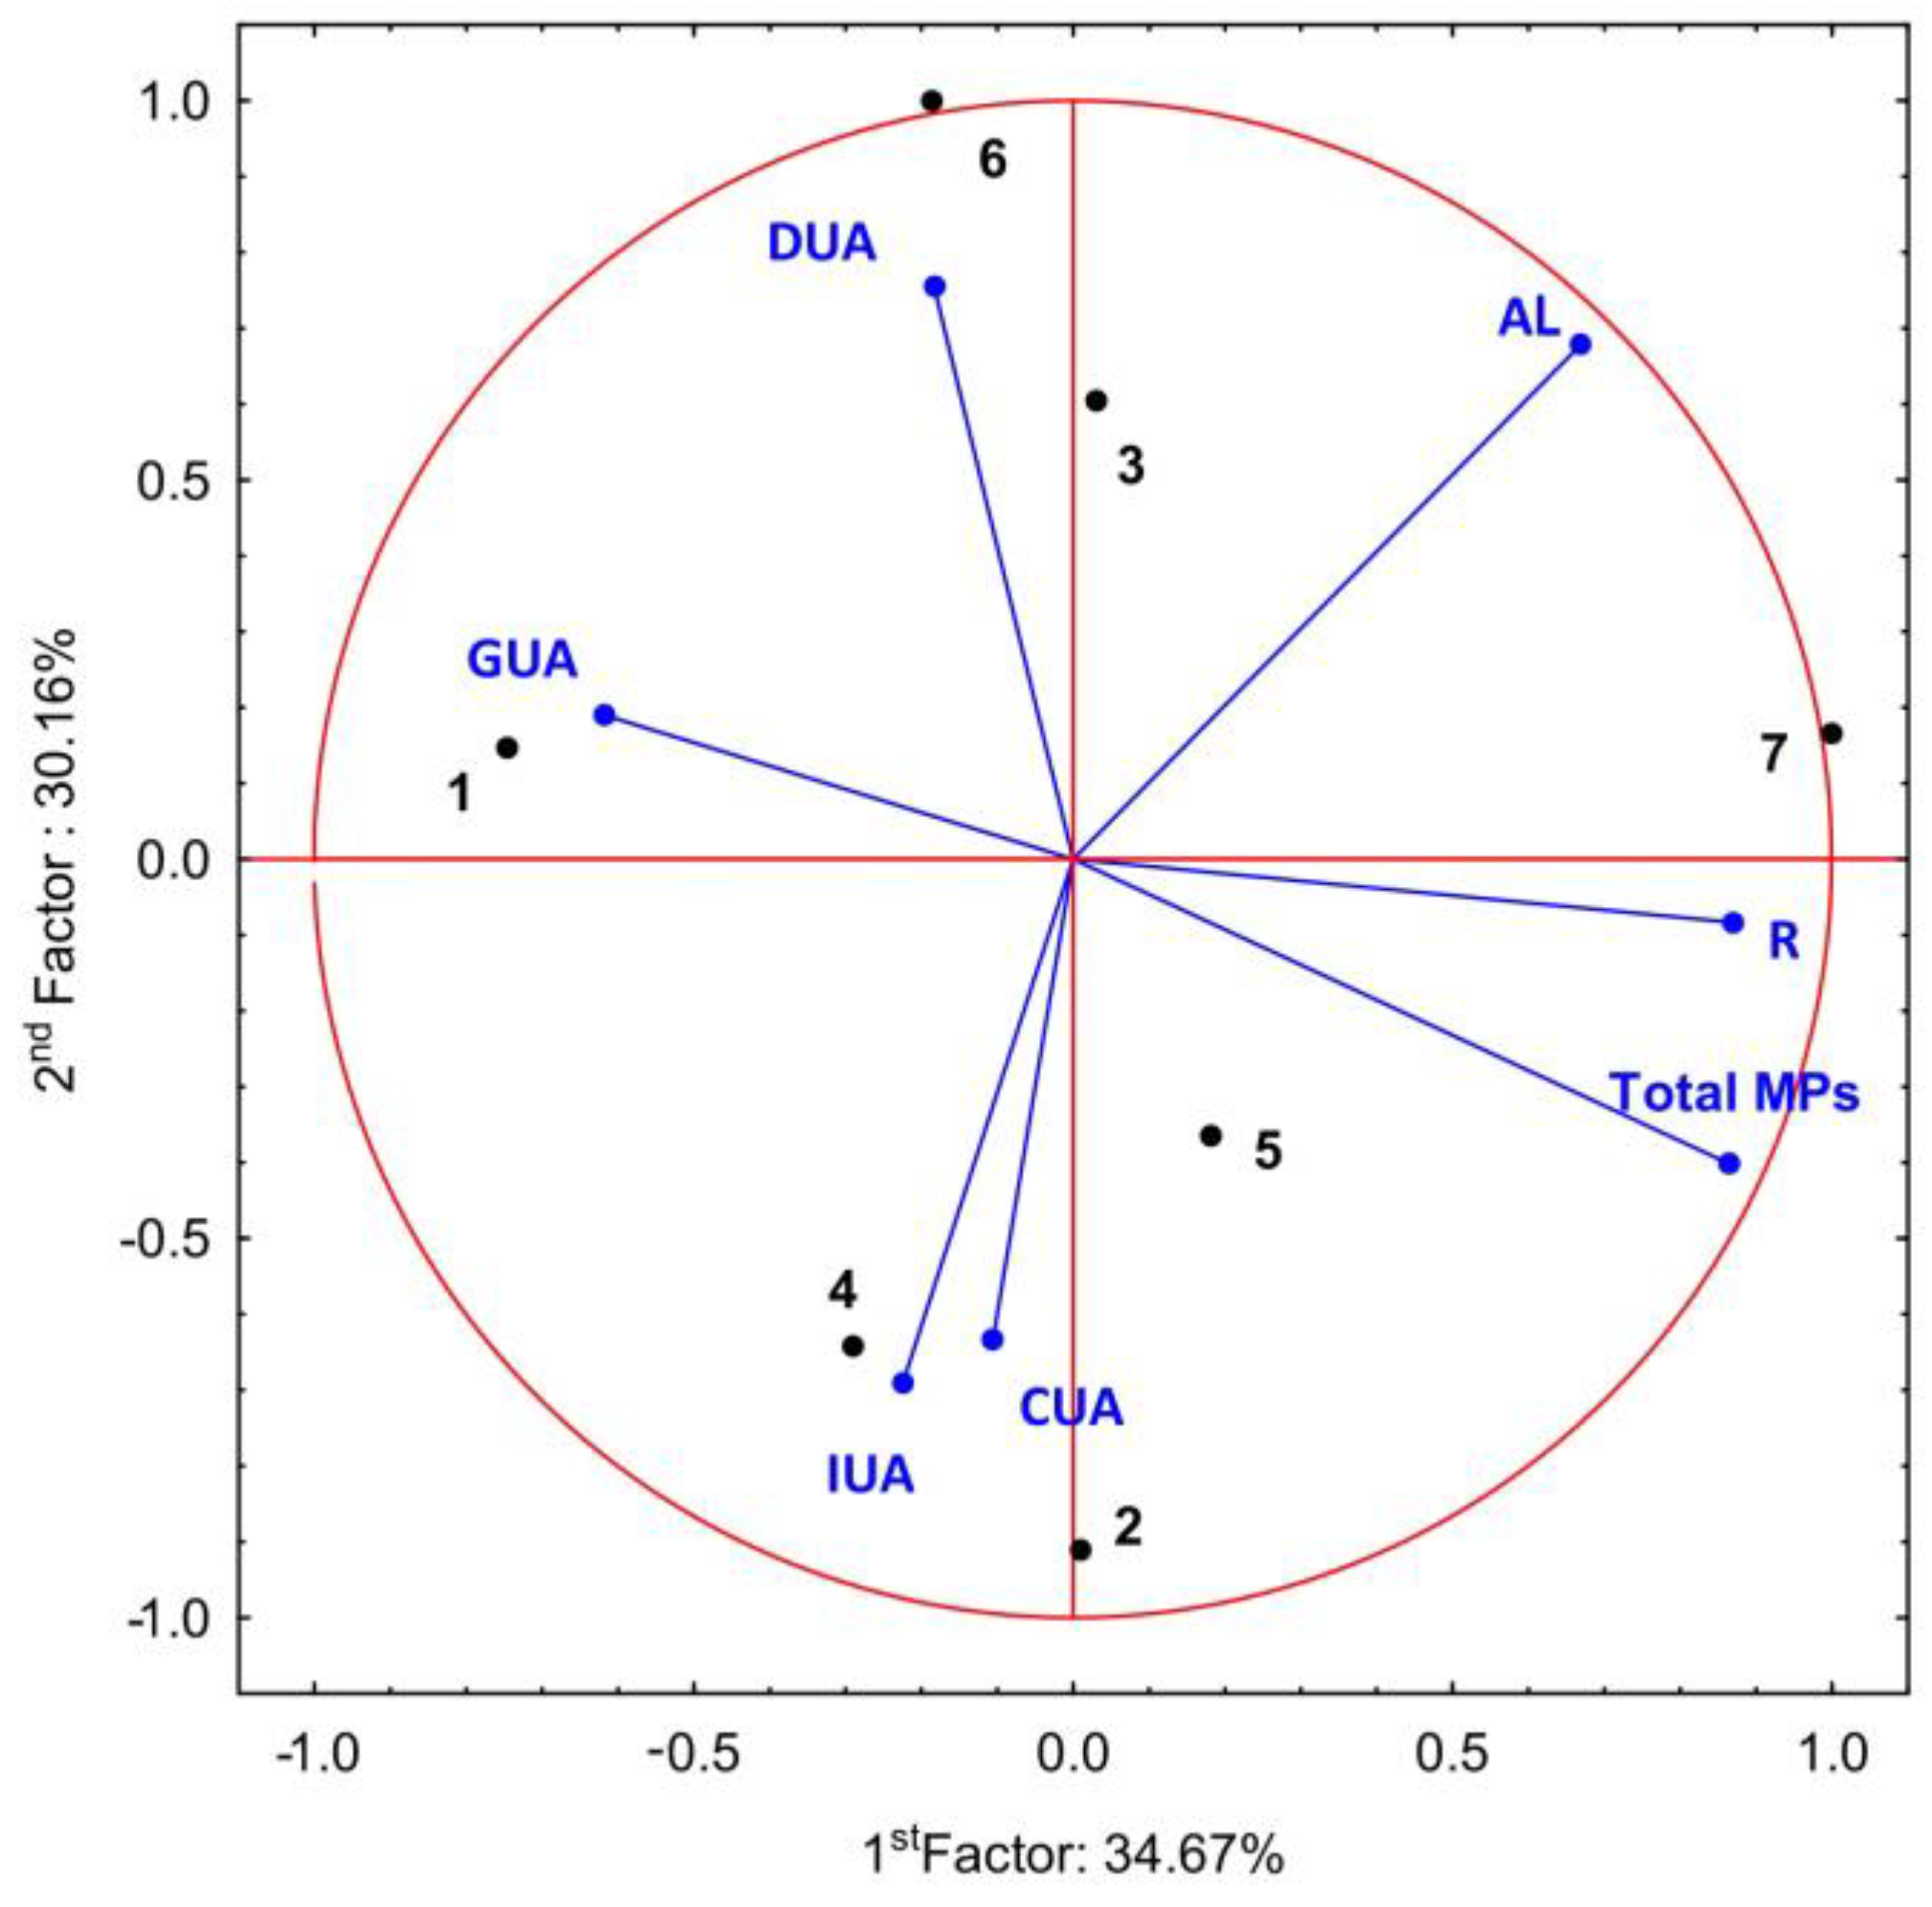
3.3. Relationship between MPs and Land Use

The graphical presentation of the number of total MPs and land use using principal component analysis for all research sites explained a total of 64.83% of the variance in the two first primary factors. Based on the analysis, it was confirmed that the selected research sites (No. 1–7) reflected the land use typical for the site, e.g., for study site No. 1 (park), the dominant land use type was “green urban areas (GUA)”, while, for site No. 7 (highway), it was “roads and associated areas (R)”. Moreover, a positive relationship was observed between the total number of MPs and the share of areas classified as “roads and associated areas (R)” in the land use of the analyzed research sites. A negative relationship was found between the number of total MPs and the proportion of areas classified as “green urban areas (GUA)”. Interestingly, there was no correlation between the number of total MPs and the proportion of “industrial urban areas (IUA)” in the land use. In addition, it was observed that the following research sites were associated with MPs: No. 2 (old town), No. 5 (near garbage can) and No. 7 (highway). Research sites No. 1 (park) and No. 6 (individual houses) were negatively associated with the number of total MPs (Figure 8).

4. Discussion

Various studies on microplastics have revealed their occurrence in different ecosystems. Considering where plastic is manufactured, used and disposed of, it can be predicted to be emitted and present on land in the immediate environment [16]. In the present research, in all atmospheric deposition samples of all research sites of the Pristina urban area, microplastics were noted, but the number of MPs showed considerable variation. Other researchers investigating MPs in atmospheric deposition have also found them in every sample. Rigorous laboratory procedures, clear visual identification criteria and comprehensive image documentation significantly bolstered result reliability. The observed microplastic counts displayed significant variability. Furthermore, similar findings have been reported by other researchers examining microplastics in atmospheric deposition, where microplastics were consistently present in every sample studied [5,16,25,33].
In general, MPs are characterized by high heterogeneity in color, shape and diameter. Regarding the diameter of MPs, since 2008, the National Oceanic and Atmospheric Administration (NOAA) has defined plastic particles smaller than 5 mm as MPs [34]. In contrast, Browne et al. [35] suggested that, for plastic particles to be considered as MPs, they must be smaller than 1 mm, while Hartmann et al. [3] recommend redefining MPs as particles with a size ≤1 mm. In the present study, the majority of microplastics were less than 5 mm in size, and only 17 microplastics from all research sites had a size bigger than 2.5 mm. In the present research, in the park of Pristina, only one microplastic above 2.5 mm was found, while, in the old town and the low-density residential area, three MPs were above 2.5 mm. On the other hand, only two microplastics >2.5 mm were observed in the sample collected near the garbage can. However, in terms of the highway, three microplastics >2.5 mm were noted.
Other than particle size, color and shape are also characteristic of microplastics. The color of MPs can help to identify plastic and range from transparent and variations of white, blue, bright orange, purple and green to black. Color for the initial visual evaluation of MPs in atmospheric samples is considered to be useful but, due to possible weathering and small size, color analysis is less valuable than spectral or chemical identification of MPs [36]. In terms of color in the present research, bright yellow, blue, dark blue, pink, bright red, black, green, transparent and bright orange were noted. Of these, transparent, black, bright yellow and bright orange were most frequent. Also, atmospheric microplastics were variously colored in Shanghai city, including transparent, black, red, yellow, blue, brown and grey [37]. In addition, in the research of Cai et al. [33], images of optical microscopy showed that MPs were characterized by transparent, blue, red and grey colors. Meanwhile, regarding the shape of MPs, typical shape descriptors of MPs are fragments, films, fibers, spheres, flakes, beads, foams and pellets/nurdles [3,38]. Spheres, pellets and beads are often used synonymously [3]. Globally, the most common forms of plastic debris in the environment are fibers, fragments and films [39].
A heatmap analysis of MPs’ count revealed that fiber MPs had an elevated level in the low-density residential area (No. 6) and the old town (No. 2). On the other hand, the highway (No. 7), near the garbage can (No. 5) and the park (No. 1) were characterized by a low number of fibers. Also, based on the heatmap, it was observed that the number of fibers and fragments in the park (No. 1) and the high-density residential area (No. 4) was similar. In addition, some different patterns of elevated levels of MPs were observed on the highway (No. 7) and near the individual houses (No. 6) regarding fragments. The presence of fragmented MPs may be the result of exposure of large plastic parts to strain, fatigue or UV light [37]. Compared to our research, Dris et al. [38,39] revealed a significant number of fibers in atmospheric fallout. In addition, in the investigation of Szewc et al. [40] on the atmospheric deposition of microplastics in the coastal zone, the number of fibers prevailed over fragments and films. On the other hand, Klein and Fischer [23], in the metropolitan region of Hamburg, found that the dominant microplastics were fragments. Furthermore, Townsend et al. [41] observed that plastic fragments were the most common type of microplastic in sediments of urban wetlands. In our investigation, we observed a larger microplastics’ count on the highway (No. 7) and in the old town (No. 2) than in the other research sites. Based on PCA analysis, a positive relationship was observed between total microplastic number and the share of areas classified as roads and associated areas (R) in the land use of the analyzed research sites. The obtained results from the current investigation corroborate findings from other investigations [16]. Considering the origin of MPs in our research, these microplastics had different possible origins, such as from waste incineration or landfills, synthetic fibers from clothes and houses, plastic litter, cosmetics, rubbers and car tires, toothpaste and other sources [38,42]. In the old town (No. 2) and on the highway (No. 7), the highest number of microplastics was noted. The large presence of MPs in these two areas was supposed to be due to the circulation of cars that had a role in the spread of microplastics. The contribution of cars and other types of transport to this pollution has also been proven by Kole et al. [43]. They concluded that wear and tear constitutes a significant global source of microplastics in the environment. Furthermore, in the research of Sommer et al. [44], it was concluded that tire abrasion contributes considerably to the pollution of the environment by microplastics. Ziajahromi et al. [45] also came to such a conclusion following their research, wherein the suspected vehicular source was detected across both water and sediment samples. Their research was one of the preliminary studies to detect the presence of synthetic rubber in sediment with a possible car/truck origin in wetland stormwater treatment, suggesting that sediment acts as a sink for these particles.
Furthermore, soil pollution can also contribute to the atmospheric fallout of plastic particles [5]. Soil ecosystems, especially agricultural lands, have been recognized as major microplastic sinks [46]. In our research, regarding agricultural land (No. 3), microplastics were also found [47]. Various authors have concluded on several possible sources of MPs in agricultural land (No. 2) based on how land is used and how microplastics sources vary. In the case of agricultural land, the direct sources of MPs consist mainly of municipal waste (compost and solid waste), atmospheric deposition, plastic mulch films and plastic-coated fertilizers [20,48,49,50,51]. In addition, an important source of microplastics in agricultural land may be the application of sewage sludge as a fertilizer [52], where MPs can be released from wind-driven transport into the atmosphere from dried sludge by-products applied to agricultural soils [53]. Also, this pollution may result from agricultural drainage and runoff from farmland to agricultural land, which may result in the contribution of agricultural plastics or fibers and microbeads derived from sewage sludge [52]. Moreover, it is worth noting that this presence of MPs on agricultural land may result from the irrigation of crops, with some microplastics that bypass the treatment process in wastewater treatment [54]. Similarly, in our investigation, the presence of MPs near the garbage can (No. 5) was noted. In this case, it was not possible to know exactly whether it was the result of the transport of microplastics from another place or from the proximity to the container because, regarding the mode of transport, MPs are likely to become airborne and transported by wind deflation [16]. Such transport was also confirmed by Brahney et al. [55]. Therefore, it is important to consider the role of wind patterns in the distribution of microplastics. In Pristina, for instance, the prevailing wind direction is from the north [22,23] and the wind speeds ranged from 7 to 15 miles per hour (mph) during the sampling period from 15 to 25 March 2021. This particular wind pattern could have a significant influence on the dispersion of microplastics within the urban environment [16,53]. The role of the wind in microplastic transport is significant, as studies in the United States have shown that even remote areas, such as national desert areas and national parks, can accumulate microplastic particles transported by wind and rain [56,57,58]. Additionally, microplastic transportation is influenced by various physical properties of these particles, including their chemical structure, which affects their bioavailability and distribution in the environment [57]. Furthermore, our research revealed that the presence of microplastics was greater in a high-density residential area in contrast with a low-density residential area. We assume that this difference may be attributed to the population density of the area, which serves as an indicator of local activity [38]. The density of population and space occupation affects microplastic deposition flows, as concluded by Strady et al. [59]. Nevertheless, it needs to be verified through investigations in other countries [39]. This phenomenon related to the number of inhabitants was also observed in our research, as research sites characterized by a high population had more microplastics. This can be supported by the fact that, in the park, the number of MPs, unlike in other research sites, was smaller. Therefore, it is important to examine MP pollution in major population centers [16]. Urban areas with high population density are recognized as significant sources of atmospheric microplastics [60]. Therefore, to assess the potential impact of the global plastic cycle on ecosystem health and environmental sustainability, it is crucial to gain a comprehensive understanding of the complete environmental journey of plastics. This involves their movement and ultimate destiny within the atmospheric system, an aspect that has received relatively less attention when compared with their behavior in aquatic environments [61].
Hence, it is important to carry out even more research in urban areas in terms of land use in order to confirm whether the transport of MPs in a particular area or the purpose of the area has a greater impact. In order to minimize emissions of MPs, key contributors need to be identified. Therefore, studies that identify point sources of emissions are needed [16].

5. Conclusions

In the present research, our study found microplastics, mainly in fragment form, at all research sites. These microplastics came in various colors, with transparent, black, bright yellow and bright orange being the most common. Most microplastics were smaller than 2.5 mm. The highest microplastic count was found near the highway, in the old town and next to the garbage can. Our preliminary findings suggested that land use significantly influences microplastic deposition. More microplastics were found in areas classified as “roads and associated areas”, while fewer were present in “green urban areas”. This highlights the link between land use and microplastic pollution, emphasizing the need for further research and potential solutions in different urban settings.
The influence of wind patterns and wind speed on microplastic distribution in urban areas like Pristina is a critical area for future research. Understanding these dynamics will contribute to a more comprehensive assessment of the environmental transport of microplastics and their potential impact on ecosystems and sustainability. In addition, understanding these patterns can guide future efforts to mitigate the impact of microplastics on our environment.
Additionally, this research holds significant relevance for the Republic of Kosovo and the burgeoning city of Pristina, which is currently prioritizing economic growth over environmental considerations. The results can also be a resource for other developing countries. Moreover, this study serves as a foundational platform for subsequent more in-depth investigations. Urgent attention is needed to delve into the specific sources of emissions of various substances, thereby paving the way for targeted interventions. Ultimately, this research imparts valuable insights into the urgency of proactive measures needed to address and mitigate the presence of microplastics in urban environments.

Author Contributions

Conceptualization, A.C. (Arlinda Cakaj), M.L.-Z., K.B. and K.D.; methodology, A.C. (Arlinda Cakaj), K.D., M.L.-Z., P.S. and K.B.; software, P.S., E.Q. and A.B.; investigation, A.C. (Arlinda Cakaj); data curation, A.C. (Arlinda Cakaj); writing—original draft preparation, A.C. (Arlinda Cakaj), K.D. and M.L.-Z.; writing—review and editing, A.C. (Arlinda Cakaj), K.D., M.L.-Z., K.B. and M.D.; visualization, A.C. (Arbnore Cakaj); supervision, M.D. All authors have read and agreed to the published version of the manuscript.

Funding

This work received partial support from the Faculty of Environmental and Mechanical Engineering at Poznań University of Life Sciences (Poland). The publication was co-financed within the framework of the Ministry of Science and Higher Education program as “Regional Initiative Excellence” in the years 2019–2022, Project No. 005/RID/2018/19.

Institutional Review Board Statement

Not applicable.

Informed Consent Statement

Not applicable.

Data Availability Statement

All data included in this study are available upon request by contact with the corresponding author.

Acknowledgments

We would like to extend our heartfelt gratitude to the late Adhurim Bublica, whose invaluable contributions to this work were significant. His memory will always be honored as part of this project. We also wish to express our sincere appreciation to Skender Cakaj for his support and contributions to this work.

Conflicts of Interest

The authors declare no conflict of interest.

References

  1. Crawford, C.B.; Quinn, B. Microplastic Pollutants; Elsevier: Amsterdam, The Netherlands, 2016. [Google Scholar]
  2. Andrady, A.L. The plastic in microplastics: A review. Mar. Pollut Bull. 2017, 119, 12–22. [Google Scholar] [CrossRef] [PubMed]
  3. Hartmann, N.B.; Hüffer, T.; Thompson, R.C.; Hassellöv, M.; Verschoor, A.; Daugaard, A.E.; Rist, S.; Karlsson, T.; Brennholt, N.; Cole, M.; et al. Are we speaking the same language? Recommendations for a definition and categorization framework for plastic debris. Environ. Sci. Technol. 2019, 53, 1039–1047. [Google Scholar] [CrossRef] [PubMed]
  4. Gregory, M.R.; Andrady, A.L. Plastics in the marine environment. Plast. Environ. 2003, 379–401. [Google Scholar] [CrossRef]
  5. Dris, R.; Gasperi, J.; Rocher, V.; Saad, M.; Renault, N.; Tassin, B. Microplastic contamination in an urban area: A case study in Greater Paris. Environ. Chem. 2015, 12, 592–599. [Google Scholar] [CrossRef]
  6. Cole, M.; Lindeque, P.; Halsband, C.; Galloway, T.S. Microplastics as contaminants in the marine environment: A review. Mar. Pollut. Bull. 2011, 62, 2588–2597. [Google Scholar] [CrossRef] [PubMed]
  7. Eriksen, M.; Mason, S.; Wilson, S.; Box, C.; Zellers, A.; Edwards, W.; Farley, H.; Amato, S. Microplastic pollution in the surface waters of the Laurentian Great Lakes. Mar. Pollut. Bull. 2013, 77, 177–182. [Google Scholar] [CrossRef] [PubMed]
  8. Dubaish, F.; Liebezeit, G. Suspended microplastics and black carbon particles in the Jade system, southern North Sea. Water Air Soil Pollut. 2013, 224, 1352. [Google Scholar] [CrossRef]
  9. Lusher, A.L.; Burke, A.; O’Connor, I.; Officer, R. Microplastic pollution in the Northeast Atlantic Ocean: Validated and opportunistic sampling. Mar. Pollut. Bull. 2014, 88, 325–333. [Google Scholar] [CrossRef]
  10. Lusher, A. Microplastics in the Marine Environment: Distribution, Interactions and Effects. In Marine Anthropogenic Litter; Springer: Berlin/Heidelberg, Germany, 2015; pp. 245–307. [Google Scholar] [CrossRef]
  11. Fok, L.; Cheung, P.K. Hong Kong at the Pearl River Estuary: A hotspot of microplastic pollution. Mar. Pollut. Bull. 2015, 99, 112–118. [Google Scholar] [CrossRef]
  12. Courtene-Jones, W.; Quinn, B.; Gary, S.F.; Mogg, A.O.; Narayanaswamy, B.E. Microplastic pollution identified in deep-sea water and ingested by benthic invertebrates in the Rockall Trough, North Atlantic Ocean. Environ. Pollut. 2017, 231, 271–280. [Google Scholar] [CrossRef]
  13. Jiang, C.; Yin, L.; Li, Z.; Wen, X.; Luo, X.; Hu, S.; Yang, H.; Long, Y.; Deng, B.; Huang, L.; et al. Microplastic pollution in the rivers of the Tibet Plateau. Environ. Pollut. 2019, 249, 91–98. [Google Scholar] [CrossRef] [PubMed]
  14. Egessa, R.; Nankabirwa, A.; Ocaya, H.; Pabire, W.G. Microplastic pollution in surface water of Lake Victoria. Sci. Total Environ. 2020, 741, 140201. [Google Scholar] [CrossRef] [PubMed]
  15. Dehghani, S.; Moore, F.; Akhbarizadeh, R. Microplastic pollution in deposited urban dust, Tehran metropolis, Iran. Environ. Sci. Pollut. Res. 2017, 24, 20360–20371. [Google Scholar] [CrossRef] [PubMed]
  16. Wright, S.L.; Ulke, J.; Font, A.; Chan, K.L.A.; Kelly, F.J. Atmospheric microplastic deposition in an urban environment and an evaluation of transport. Environ. Int. 2020, 136, 105411. [Google Scholar] [CrossRef] [PubMed]
  17. Camarero, L.; Bacardit, M.; de Diego, A.; Arana, G. Decadal trends in atmospheric deposition in a high elevation station: Effects of climate and pollution on the long-range flux of metals and trace elements over SW Europe. Atmos. Environ. 2017, 167, 542–552. [Google Scholar] [CrossRef]
  18. Klein, M.; Bechtel, B.; Brecht, T.; Fischer, E.K. Spatial distribution of atmospheric microplastics in bulk-deposition of urban and rural environments—A one-year follow-up study in northern Germany. Sci. Total Environ. 2023, 901, 165923. [Google Scholar] [CrossRef] [PubMed]
  19. Bin, Z.; Yongqiang, C.; Cuilian, G.; Maoke, L.; Puyu, Y.; Yang, Z. Outlook and overview of microplastics pollution in ecological environment. E3S Web Conf. 2020, 143, 02027. [Google Scholar] [CrossRef]
  20. Nizzetto, L.; Futter, M.; Langaas, S. Are agricultural soils dumps for microplastics of urban origin? Environ. Sci. Technol. 2016, 50, 10777–10779. [Google Scholar] [CrossRef]
  21. Catarino, A.I.; Macchia, V.; Sanderson, W.G.; Thompson, R.C.; Henry, T.B. Low levels of microplastics (MP) in wild mussels indicate that MP ingestion by humans is minimal compared to exposure via household fibres fallout during a meal. Environ. Pollut. 2018, 237, 675–684. [Google Scholar] [CrossRef]
  22. Prebreza, B.; Krasniqi, I.; Kabashi, G.; Pula, G. Disturbances of the normal operation of Kosovo power system regarding atmospheric discharges. Int. J. Electr. Eng. World Acad. Sci. Eng. Technol. 2013, 1, 711–717. [Google Scholar]
  23. Krasniqi, G.; Lajqi, S.; Đurin, B.; Kranjčić, N. Impact of Installing Small Wind Turbines in Urban Areas on Reducing Pollution—A Case Study. Int. Energy J. 2022, 22, 49–60. [Google Scholar]
  24. Berila, A.; Isufi, F. Two decades (2000–2020) measuring urban sprawl using GIS, RS and landscape metrics: A case study of municipality of Prishtina (Kosovo). J. Ecol. Eng. 2021, 22, 114–125. [Google Scholar] [CrossRef]
  25. Xu, C.; Zhang, B.; Gu, C.; Shen, C.; Yin, S.; Aamir, M.; Li, F. Are we underestimating the sources of microplastic pollution in terrestrial environment? J. Hazard. Mater. 2020, 400, 123228. [Google Scholar] [CrossRef] [PubMed]
  26. Klein, M.; Fischer, E.K. Microplastic abundance in atmospheric deposition within the Metropolitan area of Hamburg, Germany. Sci. Total Environ. 2019, 685, 96–103. [Google Scholar] [CrossRef] [PubMed]
  27. Munno, K.; Helm, P.A.; Jackson, D.A.; Rochman, C.; Sims, A. Impacts of temperature and selected chemical digestion methods on microplastic particles. Environ. Toxicol. Chem. 2018, 37, 91–98. [Google Scholar] [CrossRef] [PubMed]
  28. Hidalgo-Ruz, V.; Gutow, L.; Thompson, R.C.; Thiel, M. Microplastics in the marine environment: A review of the methods used for identification and quantification. Environ. Sci. Technol. 2012, 46, 3060–3075. [Google Scholar] [CrossRef] [PubMed]
  29. Löder, M.G.; Gerdts, G. Methodology used for the detection and identification of microplastics—A critical appraisal. In Marine Anthropogenic Litter; Springer: Berlin/Heidelberg, Germany, 2015; pp. 201–227. [Google Scholar]
  30. Nguyen, B.; Claveau-Mallet, D.; Hernandez, L.M.; Xu, E.G.; Farner, J.M.; Tufenkji, N. Separation and analysis of microplastics and nanoplastics in complex environmental samples. Acc. Chem. Res. 2019, 52, 858–866. [Google Scholar] [CrossRef]
  31. Łowicki, D. Landscape pattern as an indicator of urban air pollution of particulate matter in Poland. Ecol. Indic. 2019, 97, 17–24. [Google Scholar] [CrossRef]
  32. Lei, Y.; Duan, Y.; He, D.; Zhang, X.; Chen, L.; Li, Y.; Zheng, J. Effects of urban greenspace patterns on particulate matter pollution in metropolitan Zhengzhou in Henan, China. Atmosphere 2018, 9, 199. [Google Scholar] [CrossRef]
  33. Cai, L.; Wang, J.; Peng, J.; Tan, Z.; Zhan, Z.; Tan, X.; Chen, Q. Characteristic of microplastics in the atmospheric fallout from Dongguan city, China: Preliminary research and first evidence. Environ. Sci. Pollut. R 2017, 24, 24928–24935. [Google Scholar] [CrossRef]
  34. Arthur, C.; Baker, J.E.; Bamford, H.A. Summary of the International Research Workshop on the Occurrence, Effects, and Fate of Microplastic Marine Debris. In Proceedings of the International Research Workshop on the Occurrence, Effects, and Fate of Microplastic Marine Debris, Tacoma, WA, USA, 9–11 September 2008; National Oceanic and Atmospheric Administration: Washington, DC, USA, 2009. [Google Scholar]
  35. Browne, M.A.; Dissanayake, A.; Galloway, T.S.; Lowe, D.M.; Thompson, R.C. Ingested microscopic plastic translocates to the circulatory system of the mussel, Mytilus edulis (L.). Environ. Sci. Technol. 2008, 42, 5026–5031. [Google Scholar] [CrossRef]
  36. Zhang, Y.; Kang, S.; Allen, S.; Allen, D.; Gao, T.; Sillanpää, M. Atmospheric microplastics: A review on current status and perspectives. Earth-Sci. Rev. 2020, 203, 103118. [Google Scholar] [CrossRef]
  37. Liu, K.; Wang, X.; Fang, T.; Xu, P.; Zhu, L.; Li, D. Source and potential risk assessment of suspended atmospheric microplastics in Shanghai. Sci. Total Environ. 2019, 675, 462–471. [Google Scholar] [CrossRef]
  38. Dris, R.; Gasperi, J.; Saad, M.; Mirande, C.; Tassin, B. Synthetic fibers in atmospheric fallout: A source of microplastics in the environment? Mar. Pollut. Bull. 2016, 104, 290–293. [Google Scholar] [CrossRef] [PubMed]
  39. Dris, R.; Gasperi, J.; Tassin, B. Sources and fate of microplastics in urban areas: A focus on Paris megacity. In Freshwater Microplastics; Wagner, M., Lambert, S., Eds.; Springer: Berlin/Heidelberg, Germany, 2018; pp. 69–83. [Google Scholar]
  40. Szewc, K.; Graca, B.; Dołęga, A. Atmospheric deposition of microplastics in the coastal zone: Characteristics and relationship with meteorological factors. Sci. Total Environ. 2021, 761, 143272. [Google Scholar] [CrossRef] [PubMed]
  41. Townsend, K.R.; Lu, H.C.; Sharley, D.J.; Pettigrove, V. Associations between microplastic pollution and land use in urban wetland sediments. Environ. Sci. Pollut. Res. 2019, 26, 22551–22561. [Google Scholar] [CrossRef] [PubMed]
  42. Laskar, N.; Kumar, U. Plastics and microplastics: A threat to environment. Environ. Technol. Innov. 2019, 14, 100352. [Google Scholar] [CrossRef]
  43. Kole, P.J.; Löhr, A.J.; Van Belleghem, F.G.; Ragas, A.M. Wear and tear of tyres: A stealthy source of microplastics in the environment. Int. J. Environ. Res. Public Health 2017, 14, 1265. [Google Scholar] [CrossRef] [PubMed]
  44. Sommer, F.; Dietze, V.; Baum, A.; Sauer, J.; Gilge, S.; Maschowski, C.; Gieré, R. Tire abrasion as a major source of microplastics in the environment. Aerosol Air Qual. Res. 2018, 18, 2014–2028. [Google Scholar] [CrossRef]
  45. Ziajahromi, S.; Drapper, D.; Hornbuckle, A.; Rintoul, L.; Leusch, F.D. Microplastic pollution in a stormwater floating treatment wetland: Detection of tyre particles in sediment. Sci. Total Environ. 2020, 713, 136356. [Google Scholar] [CrossRef]
  46. Boots, B.; Russell, C.W.; Green, D.S. Effects of microplastics in soil ecosystems: Above and below ground. Environ. Sci. Technol. 2019, 53, 11496–11506. [Google Scholar] [CrossRef] [PubMed]
  47. Rezaei, M.; Riksen, M.J.; Sirjani, E.; Sameni, A.; Geissen, V. Wind erosion as a driver for transport of light density microplastics. Sci. Total Environ. 2019, 669, 273–281. [Google Scholar] [CrossRef] [PubMed]
  48. McCormick, A.; Hoellein, T.J.; Mason, S.A.; Schluep, J.; Kelly, J.J. Microplastic is an abundant and distinct microbial habitat in an urban river. Environ. Sci. Technol. 2014, 48, 11863–11871. [Google Scholar] [CrossRef] [PubMed]
  49. Liu, M.; Lu, S.; Song, Y.; Lei, L.; Hu, J.; Lv, W.; Zhou, W.; Cao, C.; Shi, H.; Yang, X.; et al. Microplastic and mesoplastic pollution in farmland soils in suburbs of Shanghai, China. Environ. Pollut. 2018, 242, 855–862. [Google Scholar] [CrossRef] [PubMed]
  50. Bläsing, M.; Amelung, W. Plastics in soil: Analytical methods and possible sources. Sci. Total Environ. 2018, 612, 422–435. [Google Scholar] [CrossRef] [PubMed]
  51. Petersen, F.; Hubbart, J.A. The occurrence and transport of microplastics: The state of the science. Sci. Total Environ. 2021, 758, 143936. [Google Scholar] [CrossRef] [PubMed]
  52. Horton, A.A.; Dixon, S.J. Microplastics: An introduction to environmental transport processes. WIRES Water 2018, 5, e1268. [Google Scholar] [CrossRef]
  53. Kasirajan, S.; Ngouajio, M. Polyethylene and biodegradable mulches for agricultural applications: A review. Agron. Sustain. Dev. 2012, 32, 501–529. [Google Scholar] [CrossRef]
  54. Corradini, F.; Meza, P.; Eguiluz, R.; Casado, F.; Huerta-Lwanga, E.; Geissen, V. Evidence of microplastic accumulation in agricultural soils from sewage sludge disposal. Sci. Total Environ. 2019, 671, 411–420. [Google Scholar] [CrossRef]
  55. Brahney, J.; Hallerud, M.; Heim, E.; Hahnenberger, M.; Sukumaran, S. Plastic rain in protected areas of the United States. Science 2020, 368, 1257–1260. [Google Scholar] [CrossRef]
  56. Ballent, A.; Pando, S.; Purser, A.; Juliano, M.F.; Thomsen, L. Modelled transport of benthic marine microplastic pollution in the Nazaré Canyon. Biogeosciences 2013, 10, 7957–7970. [Google Scholar] [CrossRef]
  57. Kowalski, N.; Reichardt, A.M.; Waniek, J.J. Sinking rates of microplastics and potential implications of their alteration by physical, biological, and chemical factors. Mar. Pollut. Bull. 2016, 109, 310–319. [Google Scholar] [CrossRef] [PubMed]
  58. Ryan, P.G. Does size and buoyancy affect the long-distance transport of floating debris? Environ. Res. Lett. 2015, 10, 84019. [Google Scholar] [CrossRef]
  59. Strady, E.; Kieu-Le, T.C.; Tran, Q.V.; Thuong, Q.T. Microplastic in atmospheric fallouts of a developing Southeast Asian megacity under tropical climate. Chemosphere 2021, 272, 129874. [Google Scholar] [CrossRef]
  60. Allen, D.; Allen, S.; Abbasi, S.; Baker, A.; Bergmann, M.; Brahney, J.; Butler, T.; Duce, R.A.; Eckhardt, S.; Evangeliou, N.; et al. Microplastics and nanoplastics in the marine-atmosphere environment. Nat. Rev. Earth Environ. 2022, 3, 393–405. [Google Scholar] [CrossRef]
  61. Xiao, S.; Cui, Y.; Brahney, J.; Mahowald, N.M.; Li, Q. Long-distance atmospheric transport of microplastic fibres influenced by their shapes. Nat. Geosci. 2023, 16, 863–870. [Google Scholar] [CrossRef]
Figure 1. Location of research sites in Pristina (Kosovo) based on the Urban Atlas Map (source: own study based on data from the European Union, Copernicus Land Monitoring Service 2018, European Environment Agency).
Sustainability 15 16464 g001
Figure 2. Sample preparation and MPs’ visual identification (with the aid of an Olympus SZX 16 microscope with an Olympus DP 74 camera).
Sustainability 15 16464 g002
Figure 3. Total microplastics in all research sites in Pristina, summarized count for analyzed period.
Sustainability 15 16464 g003
Figure 4. Relative distribution of color of microplastics at all research sites in Pristina (1—park, 2—old town, 3—agricultural land, 4—high-density residential area, 5—near a garbage can, 6—low-density residential area and 7—highway).
Sustainability 15 16464 g004
Figure 5. Selected microplastics observed in all research sites: (a) fibers and (b) fragments.
Sustainability 15 16464 g005
Figure 6. Proportion between average number of fragments and fibers (MPs/day) in all research sites of Pristina.
Sustainability 15 16464 g006
Figure 7. Heatmap and cluster analyses of microplastics (fragments and fibers) in all research sites of Pristina.
Sustainability 15 16464 g007
Figure 8. PCA of the total number of MPs in relation to land use in all research sites of Pristina (CUA—continuous urban areas, DUA—discontinuous urban areas, IUA—industrial urban areas, R—roads and associated land, GUA—green urban areas and AL—arable land).
Sustainability 15 16464 g008
Table 1. Research sites in Pristina (Kosovo).
Research Site No.Name of Research SitesGeographic Coordinates
1Park42°39′40.9″ N; 21°10′10.7″ E
2Old town42°40′02.0″ N; 21°10′00.6″ E
3Agricultural land42°41′04.7″ N; 21°11′34.4″ E
4High-density housing area42°41′04.7″ N; 21°11′34.4″ E
5Near a garbage can42°38′58.3″ N; 21°10′13.4″ E
6Individual houses42°37′00.2″ N; 21°09′15.3″ E
7Highway42°37′37.6″ N; 21°07′59.0″ E
Table 2. Land-use classification used in research.
Classification from Urban AtlasClassification Adopted in This ArticleAbbreviation
11100: Continuous urban fabricContinuous urban areasDUA
11210: Discontinuous dense urban fabricDiscontinuous urban areasDUA
11220: Discontinuous medium urban fabricDiscontinuous urban areasDUA
11230: Discontinuous low urban fabricDiscontinuous urban areasDUA
11240: Discontinuous very low urban fabricDiscontinuous urban areasDUA
12100: Industrial, commercial, public,
military and private units
Industrial urban areasIUA
12210: Fast transit roads and associated landRoads and associated landR
12220: Other roads and associated landRoads and associated landR
14100: Green urban areasGreen urban areasGUA
21000: Arable landArable landAL
Disclaimer/Publisher’s Note: The statements, opinions and data contained in all publications are solely those of the individual author(s) and contributor(s) and not of MDPI and/or the editor(s). MDPI and/or the editor(s) disclaim responsibility for any injury to people or property resulting from any ideas, methods, instructions or products referred to in the content.

