
Causality in the Relationship between Economic Growth and Compensation

Abstract
:1. Introduction
2. Literature Review
3. Research Methodology
- mean and standard deviation,
- minimum and maximum.
| d(Compensation/GDP) (t) ↔ GDP growth (t) | this relationship concerns the relationship between the simultaneous change in economic growth and employees’ compensations; |
| d(Compensation/GDP) (t) → GDP growth (t + 1) | this relationship concerns the impact of changes in employees’ compensations on future economic growth; |
| GDP growth (t) → d(Compensation/GDP) (t + 1) | this relationship concerns the impact of economic growth on future employees’ compensations. |
- The long-running relationship called the cointegrating regression is estimated using OLS:
- 2.
- The residuals from this regression are retained:
- 3.
- The PP test is applied to the residual as follows:
4. Results
4.1. Descriptive Statistics
4.2. Correlation Analysis
- (a)
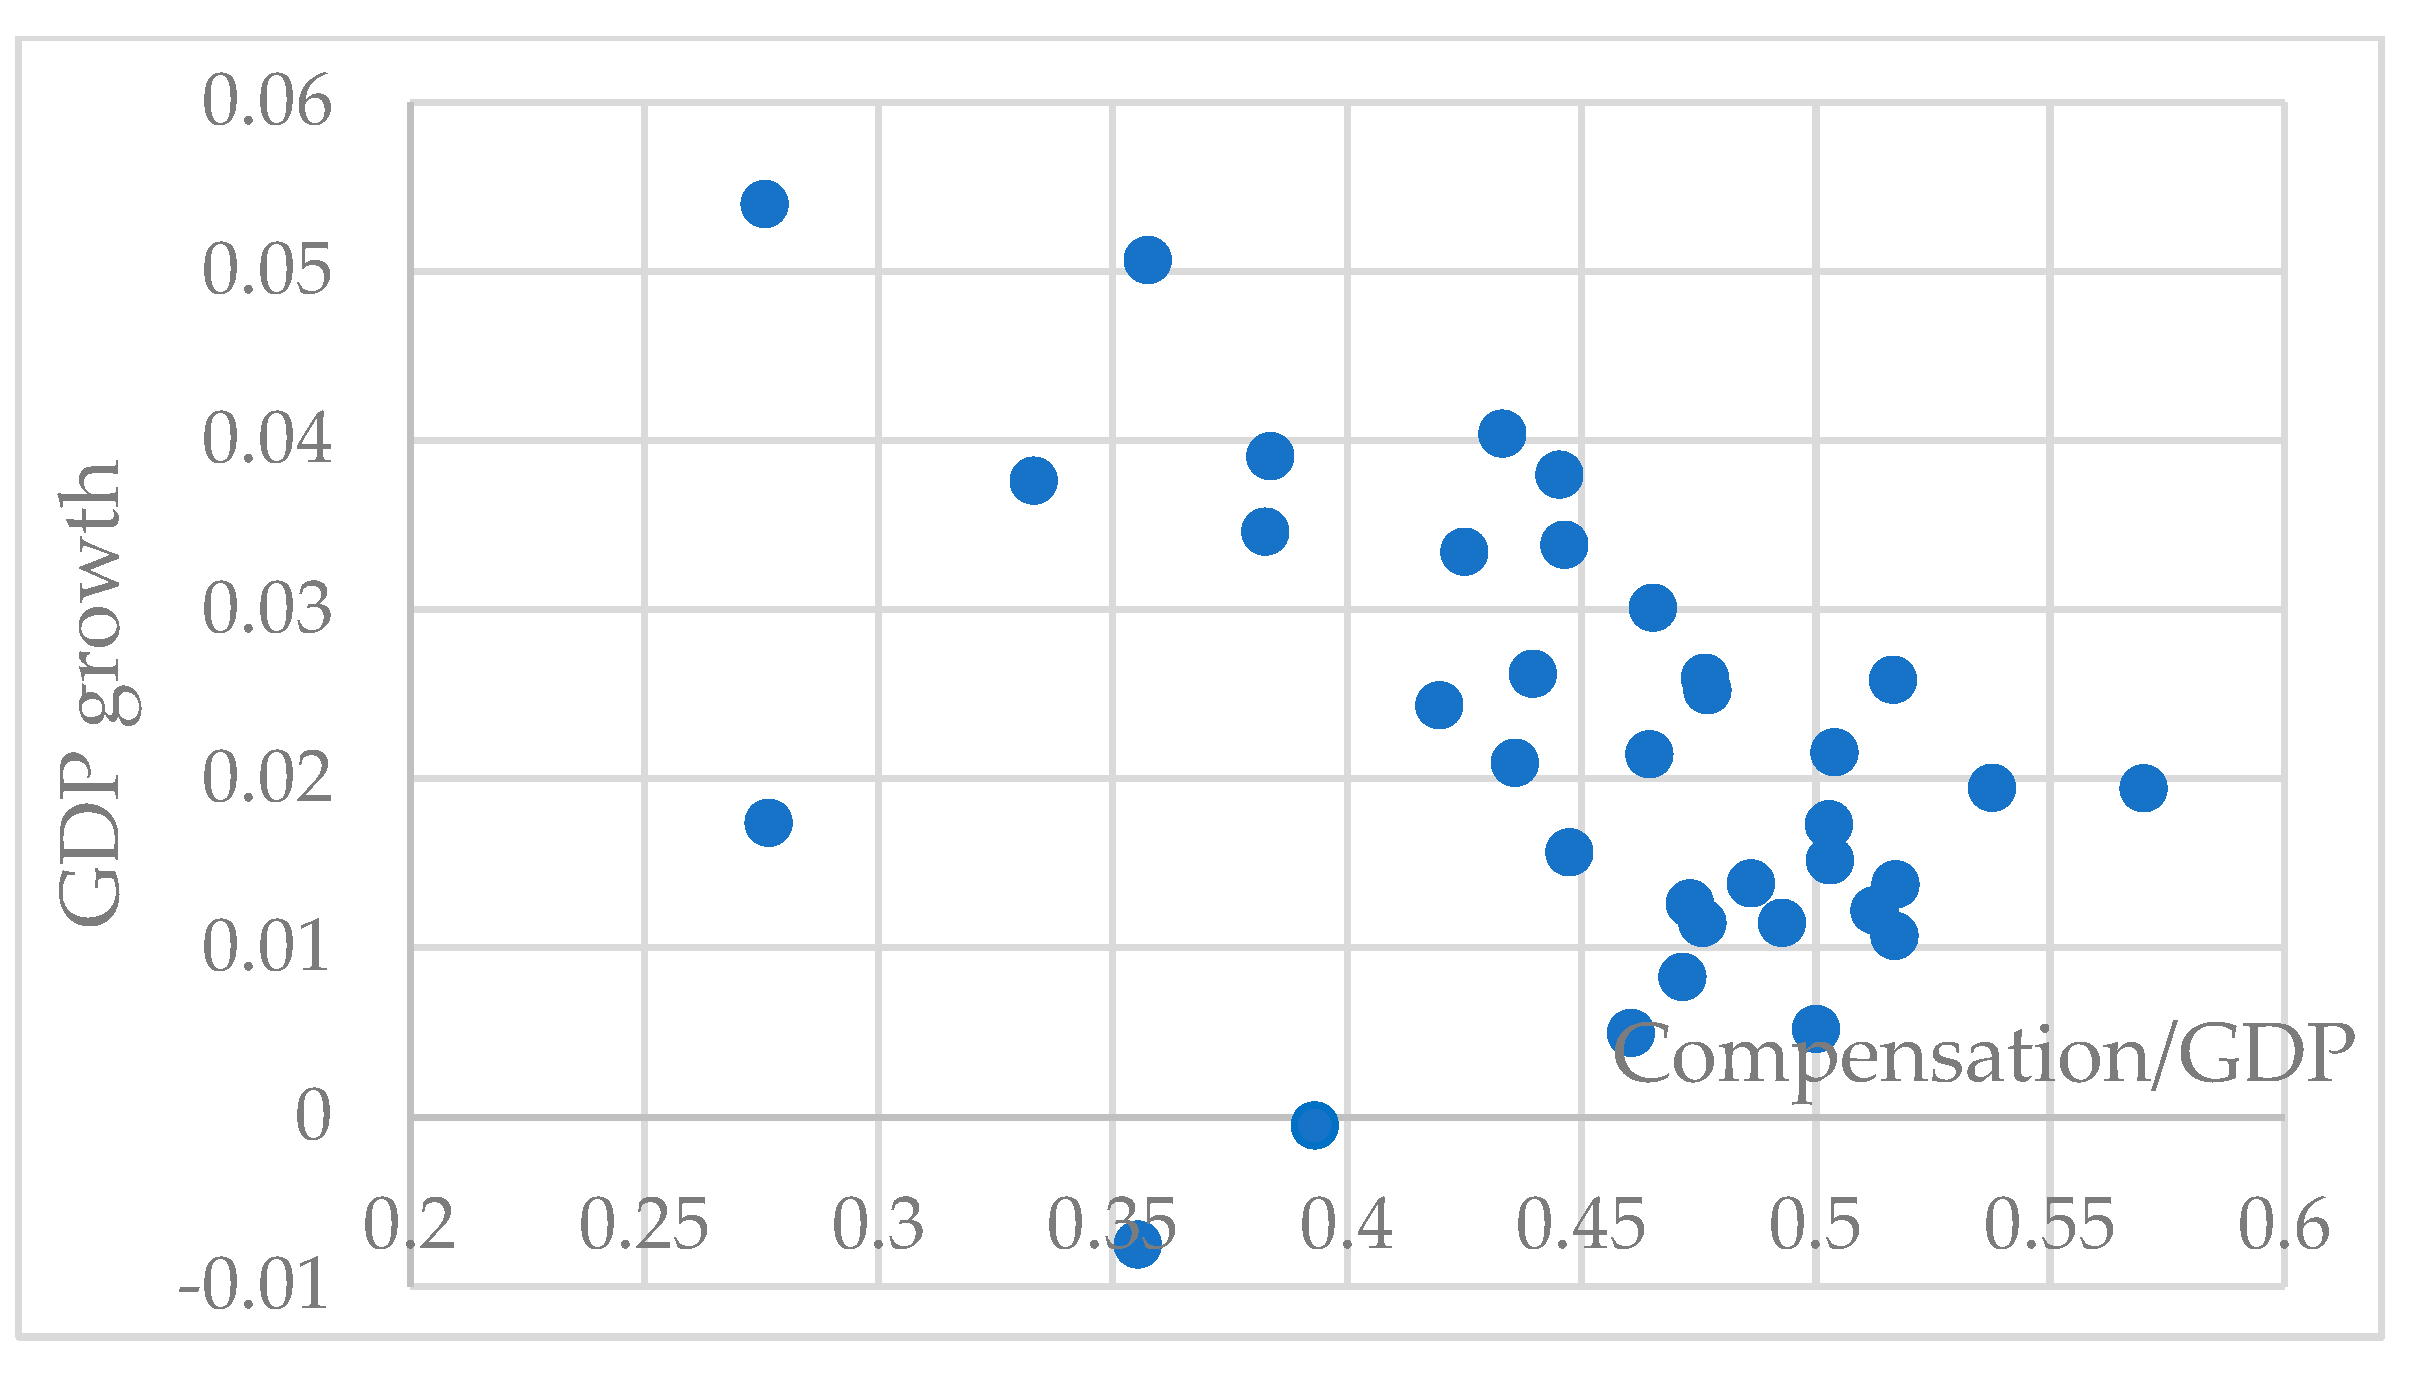
- Relating GDP growth to the increase in d(Compensation/GDP) without time shifts. The dependence obtained for the vast majority of countries is negative. Out of 36 countries, only 3 countries obtained positive values of the correlation coefficient, while for 33 countries, it was negative, of which as many as 29 countries have a relationship of at least medium strength (r < −0.3), including 22 countries with r < −0.5. It can therefore be concluded that wage growth generally has a negative impact on current GDP growth.
- (b)
- Impact of wage growth d(Compensation/GDP)(t) on future GDP growth(t + 1). The results vary widely, from quite clearly negative to clearly positive. The lack of a clear regularity does not allow for the claim that wage increases affect future economic growth.
- (c)
- Impact of GDP growth(t) on future wage growth d(Compensation/GDP)(t + 1). Here, we see that the dependencies obtained are positive for the vast majority of countries. Thus, the higher the economic growth, the faster the future wage growth can be expected, and this is confirmed for 35 out of 36 countries, 24 of which have at least an average relationship (r > 0.3).

4.3. Cointegration Analysis
| Pearson’s r coefficient | Cointegration β coefficient | β—p value | PP conintegration test statistics | PP—p value |
| Cointegration α coefficient | α—p value | Log likelihood statistics | Hannan–Quinn criter. statistics |

| Country | M1 GDPg.(t) ↔ d(Compen./GDP)(t) | M2 d(Compen./GDP)(t) → GDPg.(t + 1) | M3 GDPg.(t) → d(Compen./GDP)(t + 1) | ||||||||||||
|---|---|---|---|---|---|---|---|---|---|---|---|---|---|---|---|
| Australia | −0.2109 | −0.2253 | 0.4008 | −3.3942 | 0.0021 | −0.0822 | −0.1114 | 0.7538 | −2.9850 | 0.0055 | 0.0101 | 0.0098 | 0.9692 | −3.1336 | 0.0039 |
| 0.0257 | 0.0000 | 60.1173 | −6.4438 | 0.0257 | 0.0000 | 56.1643 | −6.3625 | −0.0017 | 0.7989 | 57.1191 | −6.4749 | ||||
| Austria | −0.8658 | −3.0225 | 0.0000 | −4.1378 | 0.0004 | −0.1612 | −0.5918 | 0.5365 | −7.6553 | 0.0000 | 0.3745 | 0.1061 | 0.1386 | −4.3915 | 0.0002 |
| 0.0165 | 0.0001 | 52.8906 | −5.6409 | 0.0131 | 0.0744 | 38.0799 | −4.2350 | 0.0006 | 0.7410 | 61.2769 | −6.9640 | ||||
| Belgium | −0.7280 | −1.9703 | 0.0006 | −4.0141 | 0.0005 | −0.0057 | −0.0165 | 0.9826 | −7.4217 | 0.0000 | 0.5930 | 0.2384 | 0.0121 | −3.2073 | 0.0033 |
| 0.0122 | 0.0088 | 48.8168 | −5.1882 | 0.0142 | 0.0344 | 39.5832 | −4.4118 | −0.0040 | 0.0705 | 60.7115 | −6.8975 | ||||
| Canada | −0.7816 | −1.7198 | 0.0001 | −4.3184 | 0.0002 | 0.0672 | 0.1655 | 0.7978 | −6.0773 | 0.0000 | 0.5861 | 0.2826 | 0.0134 | −6.3853 | 0.0000 |
| 0.0186 | 0.0001 | 50.9488 | −5.4251 | 0.0165 | 0.0167 | 39.8182 | −4.4395 | −0.0036 | 0.2104 | 56.6658 | −6.4215 | ||||
| Colombia | −0.8438 | −2.4588 | 0.0000 | −3.0371 | 0.0047 | 0.2651 | 1.0280 | 0.3038 | −3.9075 | 0.0007 | 0.5408 | 0.2107 | 0.0250 | −4.2314 | 0.0003 |
| 0.0390 | 0.0000 | 45.7811 | −4.8509 | 0.0350 | 0.0018 | 32.8822 | −3.6235 | −0.0064 | 0.1237 | 53.4933 | −6.0483 | ||||
| Costa Rica | −0.6069 | −1.9607 | 0.0076 | −3.1570 | 0.0036 | 0.0369 | 0.1313 | 0.8883 | −3.8559 | 0.0008 | 0.3200 | 0.0947 | 0.2106 | −2.9406 | 0.0061 |
| 0.0385 | 0.0000 | 42.6817 | −4.5065 | 0.0379 | 0.0002 | 35.9531 | −3.9847 | −0.0024 | 0.4755 | 58.5662 | −6.6451 | ||||
| Czech Republic | −0.2306 | −1.2072 | 0.3572 | −3.1498 | 0.0036 | −0.2117 | −1.1267 | 0.4147 | −3.7240 | 0.0010 | 0.3080 | 0.0579 | 0.2290 | −3.5565 | 0.0015 |
| 0.0283 | 0.0057 | 36.1557 | −3.7814 | 0.0271 | 0.0124 | 33.8327 | −3.7353 | 0.0017 | 0.3937 | 62.5112 | −7.1092 | ||||
| Denmark | −0.6363 | −1.4636 | 0.0045 | −2.5995 | 0.0128 | −0.2118 | −0.5003 | 0.4144 | −4.0086 | 0.0005 | 0.5032 | 0.2309 | 0.0395 | −3.3320 | 0.0025 |
| 0.0136 | 0.0050 | 48.1081 | −5.1095 | 0.0134 | 0.0295 | 41.1022 | −4.5905 | −0.0025 | 0.3228 | 57.6424 | −6.5364 | ||||
| Estonia | −0.4243 | −1.4340 | 0.0793 | −2.2782 | 0.0258 | −0.6384 | −2.2814 | 0.0058 | −2.4255 | 0.0190 | 0.5760 | 0.1735 | 0.0155 | −2.7278 | 0.0098 |
| 0.0354 | 0.0142 | 28.0552 | −2.8814 | 0.0388 | 0.0048 | 28.9850 | −3.1650 | −0.0021 | 0.6174 | 48.5251 | −5.4638 | ||||
| Finland | −0.6645 | −2.1361 | 0.0026 | −3.2970 | 0.0026 | −0.1790 | −0.5664 | 0.4918 | −5.6044 | 0.0000 | 0.2283 | 0.0717 | 0.3780 | −3.5095 | 0.0017 |
| 0.0124 | 0.0422 | 42.7274 | −4.5116 | 0.0102 | 0.2024 | 35.6337 | −3.9472 | −0.0004 | 0.8765 | 55.2490 | −6.2548 | ||||
| France | −0.6847 | −3.3685 | 0.0017 | −3.8717 | 0.0007 | 0.5403 | 2.6764 | 0.0252 | −4.4493 | 0.0002 | 0.1182 | 0.0271 | 0.6515 | −4.9662 | 0.0001 |
| 0.0106 | 0.0545 | 44.5592 | −4.7152 | 0.0098 | 0.1328 | 39.3466 | −4.3840 | −0.0001 | 0.9555 | 63.7889 | −7.2595 | ||||
| Germany | −0.7798 | −2.0502 | 0.0001 | −3.4811 | 0.0017 | −0.1995 | −0.5540 | 0.4426 | −8.6703 | 0.0000 | 0.3808 | 0.1402 | 0.1316 | −3.4221 | 0.0020 |
| 0.0139 | 0.0022 | 49.8507 | −5.3031 | 0.0133 | 0.0545 | 38.9791 | −4.3407 | −0.0003 | 0.8881 | 57.1110 | −6.4739 | ||||
| Greece | −0.5076 | −2.4090 | 0.0315 | −1.8155 | 0.0671 | 0.2493 | 1.2724 | 0.3345 | −2.4697 | 0.0173 | 0.5483 | 0.1288 | 0.0227 | −4.8049 | 0.0001 |
| 0.0003 | 0.9770 | 31.4766 | −3.2615 | −0.0146 | 0.2792 | 27.9629 | −3.0447 | 0.0045 | 0.0748 | 56.3005 | −6.3785 | ||||
| Hungary | −0.2900 | −1.3478 | 0.2431 | −3.2754 | 0.0027 | 0.1947 | 0.9823 | 0.4539 | −3.8933 | 0.0007 | 0.5145 | 0.1182 | 0.0346 | −3.6844 | 0.0011 |
| 0.0172 | 0.0717 | 36.0586 | −3.7706 | 0.0222 | 0.0295 | 33.5087 | −3.6972 | −0.0056 | 0.0109 | 61.6145 | −7.0037 | ||||
| Iceland | 0.4115 | 0.8736 | 0.0897 | −3.4580 | 0.0018 | 0.7064 | 1.4506 | 0.0015 | −3.7258 | 0.0010 | −0.1010 | −0.0477 | 0.6997 | −2.4334 | 0.0187 |
| 0.0274 | 0.0156 | 32.1759 | −3.3392 | 0.0239 | 0.0094 | 34.8910 | −3.8598 | 0.0009 | 0.8920 | 41.2399 | −4.6067 | ||||
| Ireland | −0.7461 | −2.2298 | 0.0004 | −1.3624 | 0.1541 | −0.1615 | −0.4825 | 0.5358 | −3.2593 | 0.0029 | 0.1025 | 0.0358 | 0.6955 | −3.3408 | 0.0024 |
| 0.0384 | 0.0037 | 30.9362 | −3.2015 | 0.0487 | 0.0147 | 22.0697 | −2.3514 | −0.0087 | 0.2409 | 40.6454 | −4.5368 | ||||
| Israel | 0.0435 | 0.1431 | 0.8639 | −6.2309 | 0.0000 | −0.0459 | −0.1607 | 0.8613 | −6.6409 | 0.0000 | 0.4501 | 0.1503 | 0.0699 | −4.4839 | 0.0002 |
| 0.0406 | 0.0000 | 43.5993 | −4.6085 | 0.0402 | 0.0000 | 40.7500 | −4.5491 | −0.0053 | 0.1247 | 63.8439 | −7.2660 | ||||
| Italy | −0.5545 | −4.2601 | 0.0169 | −3.9213 | 0.0006 | 0.1356 | 1.0415 | 0.6038 | −5.1899 | 0.0000 | 0.2821 | 0.0422 | 0.2726 | −3.0687 | 0.0045 |
| 0.0075 | 0.3195 | 39.5329 | −4.1567 | −0.0028 | 0.7688 | 33.9832 | −3.7530 | 0.0021 | 0.0628 | 69.4511 | −7.9257 | ||||
| Japan | −0.6201 | −1.7865 | 0.0060 | −3.8171 | 0.0008 | −0.1660 | −0.4715 | 0.5244 | −5.6558 | 0.0000 | 0.5067 | 0.1757 | 0.0379 | −2.6635 | 0.0113 |
| 0.0093 | 0.0613 | 46.9645 | −4.9824 | 0.0056 | 0.3753 | 40.2470 | −4.4899 | 0.0017 | 0.3673 | 60.5187 | −6.8748 | ||||
| Korea | −0.4606 | −1.2770 | 0.0544 | −3.6503 | 0.0011 | −0.3476 | −0.9563 | 0.1716 | −4.1999 | 0.0003 | 0.3183 | 0.1145 | 0.2131 | −2.4017 | 0.0200 |
| 0.0376 | 0.0000 | 49.8415 | −5.3021 | 0.0359 | 0.0000 | 46.2274 | −5.1935 | −0.0008 | 0.8087 | 62.9405 | −7.1597 | ||||
| Latvia | 0.3166 | 1.0568 | 0.2006 | −2.3446 | 0.0224 | −0.3079 | −1.0353 | 0.2293 | −2.2247 | 0.0292 | 0.9048 | 0.2699 | 0.0000 | −2.9782 | 0.0056 |
| 0.0220 | 0.1636 | 25.9209 | −2.6442 | 0.0319 | 0.0638 | 24.3655 | −2.6215 | −0.0012 | 0.6122 | 58.1938 | −6.6013 | ||||
| Lithuania | −0.0299 | −0.1114 | 0.9061 | −3.2808 | 0.0027 | −0.1102 | −0.4062 | 0.6737 | −3.5112 | 0.0017 | 0.7226 | 0.1931 | 0.0010 | −2.5392 | 0.0148 |
| 0.0354 | 0.0198 | 27.9720 | −2.8721 | 0.0352 | 0.0266 | 26.2127 | −2.8388 | −0.0018 | 0.5554 | 54.7580 | −6.1971 | ||||
| Luxembourg | −0.6635 | −1.4976 | 0.0027 | −4.1533 | 0.0003 | −0.2868 | −0.6549 | 0.2645 | −5.2746 | 0.0000 | 0.2635 | 0.1192 | 0.3068 | −3.7149 | 0.0010 |
| 0.0253 | 0.0001 | 45.5578 | −4.8261 | 0.0248 | 0.0016 | 38.5529 | −4.2906 | −0.0026 | 0.5144 | 52.2202 | −5.8985 | ||||
| Mexico | −0.8905 | −3.9984 | 0.0000 | −4.3180 | 0.0002 | −0.0605 | −0.2696 | 0.8175 | −4.3209 | 0.0003 | 0.0772 | 0.0164 | 0.7684 | −3.4616 | 0.0019 |
| 0.0136 | 0.0023 | 50.1493 | −5.3363 | 0.0164 | 0.0770 | 33.7345 | −3.7237 | −0.0007 | 0.7370 | 60.3194 | −6.8514 | ||||
| Netherlands | −0.8104 | −1.6041 | 0.0000 | −2.9507 | 0.0058 | −0.0654 | −0.1357 | 0.8031 | −4.3296 | 0.0003 | 0.4489 | 0.2412 | 0.0707 | −3.6379 | 0.0012 |
| 0.0130 | 0.0011 | 52.5315 | −5.6010 | 0.0137 | 0.0345 | 40.1103 | −4.4738 | −0.0031 | 0.3212 | 53.8113 | −6.0857 | ||||
| Norway | −0.6546 | −0.4319 | 0.0032 | −3.7365 | 0.0009 | −0.1851 | −0.1509 | 0.4769 | −3.9945 | 0.0005 | 0.2308 | 0.3680 | 0.3727 | −4.0766 | 0.0005 |
| 0.0155 | 0.0001 | 54.9059 | −5.8648 | 0.0148 | 0.0012 | 48.3158 | −5.4392 | −0.0047 | 0.5711 | 40.4173 | −4.5099 | ||||
| Poland | −0.3782 | −0.8589 | 0.1217 | −3.5294 | 0.0015 | 0.1126 | 0.2828 | 0.6669 | −3.8984 | 0.0007 | 0.5973 | 0.2352 | 0.0113 | −7.2922 | 0.0000 |
| 0.0393 | 0.0000 | 44.6686 | −4.7273 | 0.0384 | 0.0000 | 40.6144 | −4.5331 | −0.0075 | 0.0495 | 60.9883 | −6.9301 | ||||
| Portugal | −0.4343 | −1.3552 | 0.0717 | −3.0544 | 0.0045 | 0.2882 | 0.9018 | 0.2620 | −4.0324 | 0.0005 | 0.3992 | 0.1383 | 0.1124 | −2.7501 | 0.0093 |
| 0.0055 | 0.4413 | 38.7554 | −4.0703 | 0.0044 | 0.5875 | 35.1568 | −3.8911 | −0.0001 | 0.9652 | 55.2025 | −6.2494 | ||||
| Slovak Republic | −0.6956 | −2.6274 | 0.0013 | −3.2287 | 0.0030 | −0.1478 | −0.5692 | 0.5713 | −4.0344 | 0.0005 | 0.2292 | 0.0506 | 0.3762 | −3.1892 | 0.0035 |
| 0.0427 | 0.0000 | 39.4070 | −4.1427 | 0.0362 | 0.0034 | 31.4061 | −3.4498 | 0.0024 | 0.4085 | 57.3188 | −6.4101 | ||||
| Slovenia | −0.5111 | −1.8902 | 0.0302 | −2.3735 | 0.0210 | 0.0914 | 0.3450 | 0.7272 | −3.3993 | 0.0021 | 0.3356 | 0.0979 | 0.1878 | −3.3122 | 0.0026 |
| 0.0254 | 0.0081 | 35.7306 | −3.7342 | 0.0203 | 0.0694 | 30.9107 | −3.3915 | −0.0002 | 0.9402 | 53.9385 | −6.1007 | ||||
| Spain | −0.4979 | −1.7686 | 0.0355 | −2.9351 | 0.0060 | −0.0449 | −0.1648 | 0.8643 | −4.1071 | 0.0004 | 0.4628 | 0.1359 | 0.0614 | −2.5992 | 0.0130 |
| 0.0102 | 0.2421 | 35.6386 | −3.7240 | 0.0080 | 0.4465 | 30.9358 | −3.3945 | −0.0001 | 0.9712 | 54.3735 | −6.1518 | ||||
| Sweden | −0.7725 | −2.3818 | 0.0002 | −4.3270 | 0.0002 | −0.2022 | −0.6461 | 0.4365 | −9.3931 | 0.0000 | 0.5425 | 0.1807 | 0.0244 | −3.7025 | 0.0011 |
| 0.0236 | 0.0000 | 48.3600 | −5.1375 | 0.0214 | 0.0061 | 38.1773 | −4.2464 | −0.0024 | 0.3200 | 59.9234 | −6.8048 | ||||
| Switzerland | −0.8122 | −1.4927 | 0.0000 | −5.8779 | 0.0000 | −0.1529 | −0.2829 | 0.5579 | −5.3407 | 0.0000 | 0.4018 | 0.2179 | 0.1099 | −3.4842 | 0.0018 |
| 0.0211 | 0.0000 | 56.7349 | −6.0680 | 0.0195 | 0.0008 | 44.2268 | −4.9581 | −0.0022 | 0.4999 | 56.6941 | −6.4249 | ||||
| Turkey | −0.4287 | −1.3962 | 0.0759 | −2.9328 | 0.0060 | −0.0202 | −0.0729 | 0.9386 | −3.2811 | 0.0028 | 0.2723 | 0.0891 | 0.2904 | −3.8800 | 0.0007 |
| 0.0561 | 0.0000 | 33.9530 | −3.5367 | 0.0524 | 0.0002 | 30.4438 | −3.3366 | −0.0034 | 0.5272 | 50.6265 | −5.7110 | ||||
| United Kingdom | −0.7867 | −3.1523 | 0.0001 | −3.5337 | 0.0015 | 0.3323 | 1.3702 | 0.1925 | −3.8690 | 0.0007 | 0.2542 | 0.0689 | 0.3249 | −3.7765 | 0.0009 |
| 0.0169 | 0.0095 | 42.6645 | −4.5046 | 0.0087 | 0.3673 | 32.6519 | −3.5964 | 0.0005 | 0.8302 | 56.0454 | −6.3485 | ||||
| United States | −0.4529 | −1.4539 | 0.0591 | −3.3752 | 0.0021 | 0.1209 | 0.4237 | 0.6440 | −4.8128 | 0.0001 | 0.5726 | 0.2018 | 0.0163 | −4.9666 | 0.0001 |
| 0.0183 | 0.0009 | 46.9735 | −4.9834 | 0.0186 | 0.0025 | 42.5113 | −4.7563 | −0.0042 | 0.0382 | 65.2993 | −7.4372 | ||||
- M1
- The relationship between GDP growth and d(Compensation/GDP) is usually negative and statistically significant (p < 0.05 for the regression coefficient β for 23 countries, and 0.1 < p < 0.05 for 5 countries, making a total of 28 countries out of a total of 36).
- M2
- The impact of d(Compensation/GDP)(t) on future GDP growth(t + 1) is sometimes positive and sometimes negative, and usually statistically insignificant (p > 0.05 for the regression coefficient β for 33 countries from 36 countries).
- M3
- The impact of GDP growth(t) on future growth d(Compensation/GDP)(t + 1) is positive (except one), but sometimes statistically significant (p < 0.1 for the regression coefficient β for 16 countries) and sometimes statistically insignificant (p > 0.1 for the regression coefficient β for 20 countries).
5. Discussion
6. Conclusions
Author Contributions
Funding
Institutional Review Board Statement
Informed Consent Statement
Data Availability Statement
Conflicts of Interest
References
- Atkinson, R.D.; Court, R.H.; Ward, J.M. Benchmarking Economic Transformation in the Sates, Progressive Policy Institute Technology and New Economy Project. In The State New Economy Index; Information Technology and Innovation Foundation: Washington, DC, USA, 2002; pp. 2–4. [Google Scholar]
- Landefeld, J.S.; Fraumeni, B.M. Survey of Current Business. In Measuring the New Economy; Economic and Social Council: Geneva, Switzerland, 2001; p. 24. [Google Scholar]
- Jones, C.I. The past and future of economic growth: A semi-endogenous perspective. Annu. Rev. Econ. 2022, 14, 125–152. [Google Scholar] [CrossRef]
- Tokarski, T. Ekonomia Matematyczna. Modele Makroekonomiczne; Polskie Wydawnictwo Ekonomiczne: Warsaw, Poland, 2011. [Google Scholar]
- Marshall, A. Principles of Economics, 1st ed.; Macmillan: London, UK, 1890; Volume 1. [Google Scholar]
- Hicks, J.R. The Theory of Wages, 2nd ed.; Macmillan: London, UK, 1963. [Google Scholar] [CrossRef]
- Dullien, S.; Tober, S. A monetary Keynesian view of modern monetary theory. Eur. J. Econ. Econ. Policies Interv. 2022, 19, 227–237. [Google Scholar]
- Keynes, J.M. The General Theory of Employment, Interest, and Money; Palgrave Macmillan: London, UK, 1936. [Google Scholar]
- Robinson, J.V. Essays in the Theory of Economic Growth; Macmillan: London, UK, 1962. [Google Scholar] [CrossRef]
- Perroux, F. Politique du developpement et lacunes du calcul economique. Mondes En Dev. 1975, 10, 191–202. [Google Scholar]
- Atkinson, R.D. The Post and Future of America’s Economy: Long Waves of Innovation That Power Cycles of Growth; Edward Elgar: Washington, DC, USA, 2005; pp. 4–5. [Google Scholar]
- Beardley, S.C.; Farrell, D. Regulation That’s Good for Competition. McKinsey Q. 2005, 5, 50. [Google Scholar]
- Cibulka, S.; Giljum, S. Towards a comprehensive framework of the relationships between resource footprints, quality of life, and economic development. Sustainability 2020, 12, 4734. [Google Scholar] [CrossRef]
- Card, D.; Krueger, A. Minimum wages and employment: A case study of the fast-food industry in New Jersey and Pennsylvania. Am. Econ. Rev. 1994, 84, 772–793. [Google Scholar] [CrossRef]
- Neumark, D.; Wascher, W.L. Minimum Wages; The MIT Press: Cambridge, MA, USA, 2008. [Google Scholar] [CrossRef]
- Dube, A.; Lester, W.; Reich, M. Minimum wage effects across state borders: Estimates using contiguous counties. In The Review of Economics and Statistics; The MIT Press: Cambridge, MA, USA, 2010; Volume 92. [Google Scholar] [CrossRef]
- Stewart, M. The employment effects of the national minimum wage. Econ. J. 2004, 114, C110–C116. [Google Scholar] [CrossRef]
- Manning, A. Minimum Wage: Maximum Impact. The Resolution Foundation 2012. Available online: http://www.resolutionfoundation.org/app/uploads/2014/08/Final-Minimum-wage-paper_vFinal.pdf (accessed on 3 November 2023).
- Neumark, D.; Cunningham, W.; Siga, L. The effects of the minimum wage in Brazil on the distribution of family incomes: 1996–2001. J. Dev. Econ. 2006, 80, 136–159. [Google Scholar] [CrossRef]
- Lemos, S. Minimum wage effects in a developing country. Labour Econ. 2009, 16, 224–237. [Google Scholar] [CrossRef]
- Gindling, T.H.; Terrell, K. Minimum wages, wages and employment in various sectors in Honduras. Labour Econ. 2009, 16, 291–303. [Google Scholar] [CrossRef]
- Bosch, M.; Manacorda, M. Minimum wages and earnings inequality in urban Mexico. Am. Econ. J. Appl. Econ. 2010, 2, 128–149. [Google Scholar] [CrossRef]
- Kaplan, D.; Pérez Arce, F. El efecto de los salarios mínimos en los ingresos laborales de México. In El Trimestre Económico; Fondo de Cultura Económica: Mexico City, Mexico, 2006; Volume 73. [Google Scholar] [CrossRef]
- Campos Vázquez, R.M. El minimum wage y el empleo: Evidencia internacional y posibles impactos para el caso mexicano. In Economía UNAM; National Autonomous University of Mexico: Mexico City, Mexico, 2015; Volume 12. [Google Scholar] [CrossRef]
- Elwell, C. Inflation and the Real Minimum Wage: A Fact Sheet. Congressional Research Service. Available online: https://fas.org/sgp/crs/misc/R42973.pdf (accessed on 8 January 2014).
- Vázquez, R.M.; Esquivel, G.; Hernández, A.S.S. The Impact of the Minimum Wage on Income and Employment in Mexico. CEPAL Rev. 2018, 122, 189–216. [Google Scholar] [CrossRef]
- Zhang, M.A.; Lu, S.; Zhang, S.; Bai, Y. The unintended consequence of minimum wage hikes: Evidence based on firms’ pollution emission. Energy Econ. 2023, 125, 106857. [Google Scholar] [CrossRef]
- Hilbert, L.P.; Suessmair, A. The Effects of Social Interaction and Social Norm Compliance in Pay-What-You-Want Situations. Am. J. Ind. Bus. Manag. 2015, 5, 548–556. [Google Scholar] [CrossRef]
- Regner, T. Why Consumers Pay Voluntarily: Evidence from Online Music. J. Behav. Exp. Econ. 2015, 57, 205–214. [Google Scholar] [CrossRef]
- Konings, J.; Marcolin, L. Do Wages Reflect Labor Productivity? The Case of Belgian Regions. IZA J. Eur. Labor Stud. 2014, 3, 11. [Google Scholar] [CrossRef]
- Autor, D.; Salomons, A. Is Automation Labor-Displacing? Productivity Growth, Employment, and the Labor Share; NBER Working Paper No. 24871; National Bureau of Economic Research: Cambridge, MA, USA, 2018. [Google Scholar] [CrossRef]
- Vandekerckhove, S.; Goos, M.; Van Gyes, G. The Effect of Minimum Wage Spillovers on Wage Dispersion in a Strongly Institutionalized Wage Bargaining System; Ipswich Working Paper 5; Research Institute for Work and Society: Leuven, Belgium, 2018. [Google Scholar]
- Manning, C. Labor Market Adjustment to Indonesia’s Economic Crisis: Contex, Trend and Implication. Bull. Indones. Econ. Stud. 2000, 36, 105–136. [Google Scholar] [CrossRef]
- Nurfiat, N.; Rustariyuni, S. Effect of Wages and Technology on Productivity and Absorption of Labor in the Furniture Industry in the City of Denpasar. Piramida 2018, 1, 34–48. [Google Scholar]
- Cucino, V.; Del Sarto, N.; Ferrigno, G.; Piccaluga, A.M.C.; Di Minin, A. Not just numbers! Improving TTO performance by balancing the soft sides of the TQM. TQM J. 2022. ahead-of-print. [Google Scholar] [CrossRef]
- Farah, A.; Sari, P. Human Capital and Productivity. J. Econ. Policy 2014, 7, 22–28. [Google Scholar]
- Blaga, P.; Jozsef, B. Human Resources, Quality Circles, and Innovation. Procedia Econ. Financ. 2014, 15, 1458–1462. [Google Scholar] [CrossRef]
- Batrancea, L.M.; Balcı, M.A.; Akgüller, Ö.; Gaban, L. What drives economic growth across European countries? A multimodal approach. Mathematics 2022, 10, 3660. [Google Scholar] [CrossRef]
- Mankiw, N.G.; Taylor, M.P. Makroekonomia; PWE: Warsaw, Poland, 2016. [Google Scholar]
- Haldane, A.G. Work, Wages and Monetary Policy. Speech at the National Science and Media Museum, Bradford, 20 June 2017. Available online: https://www.bankofengland.co.uk/-/media/boe/files/speech/2017/work-wages-and-monetary-policy.pdf (accessed on 3 November 2023).
- Brouillette, D.; Ketcheson, J.; Kostyshyna, O.; Lachaine, J. Bank of Canada Staff Analytical Note 2017-8. In Wage Growth in Canada and the United States: Factors Behind Recent Weakness; Bank of Canada: Ottawa, ON, Canada, 2017. [Google Scholar]
- Danninger, S. IMF Working Paper WP/16/122. In What’s Up with U.S. Wage Growth and Job Mobility; International Monetary Fund: Washington, DC, USA, 2016. [Google Scholar] [CrossRef]
- Jacobs, D.; Rush, A. Why Is Wage Growth So Low; RBA Bulletin: Sydney, Australia, 2015; pp. 9–18. [Google Scholar]
- Foster, J.; Guttmann, R. Perceptions of Job Security in Australia; RBA Bulletin: Sydney, Australia, 2018. [Google Scholar]
- Abel, W.; Burnham, R.; Corder, M. Wages, Productivity and the Changing Composition of the UK Workforce; Bank of England Quarterly Bulletin: London, UK, 2016. [Google Scholar]
- Manning, L.M.; Adriacanos, D. Dollar movements and inflation: A Cointegration analysis. Appl. Econ. 1993, 25, 1483–1488. [Google Scholar] [CrossRef]
- Engle, R.T.; Granger, C.W.J. Cointegration and error correction: Representation, estimation and testing. Econometrica 1987, 55, 251–276. [Google Scholar] [CrossRef]
- Filippetti, A.; Peyrache, A. Is the Convergence Party Over? Labour Productivity and the Technology Gap in Europe. JCMS J. Common Mark. Stud. 2013, 51, 1006–1022. [Google Scholar] [CrossRef]
- Krugman, P. The Age of Diminishing Expectations; MIT Press: Cambridge, MA, USA, 1994. [Google Scholar]
- Porter, M.E. The Competitive Advantage of Nations; Free Press: New York, NY, USA, 1990. [Google Scholar] [CrossRef]
- Ahmad, N.; Naveed, A.; Naz, A. A hierarchical analysis of structural change and labour productivity convergence across regions, countries and industries within the EU. Labour Ind. A J. Soc. Econ. Relat. Work. 2019, 29, 181–198. [Google Scholar] [CrossRef]
- Gumerov, A.; Ismagilov, R.; Akhmedzyanova, F.; Akhmetov, M. Increasing labour productivity at industrial enterprises. Eur. Proc. Soc. Behav. Sci. 2020, 90, 304–316. [Google Scholar] [CrossRef]
- Kocourek, A.; Nedomlelova, I. Three levels of education and the economic growth. Int. Rev. Appl. Econ. 2018, 50, 2103–2116. [Google Scholar] [CrossRef]
- Yuen, B.; Kumssa, A. Africa and Asia: Two of the World’s Fastest Growing Regions. In Climate Change and Sustainable Urban Development in Africa and Asia; Springer: Dordrecht, The Netherlands, 2010; pp. 3–18. [Google Scholar]
- Dahlman, C. Technology, globalization, and international competitiveness: Challenges for developing countries. In Industrial Development for the 21st Century: Sustainable Development Perspectives; Department of Economic and Social Affairs: New York, NY, USA, 2007; pp. 29–83. [Google Scholar]
- Mitchell, W.; Muysken, J.; Van Veen, T. Growth and Cohesion in the European Union: The Impact of Macroeconomic Policy; Edward Elgar: Cheltenham, UK, 2006. [Google Scholar] [CrossRef]
- Turner, L.; Boulhol, H. Recent trends and structural breaks in the US and EU15 labor productivity growth. Int. Rev. Appl. Econ. 2011, 43, 4769–4784. [Google Scholar] [CrossRef]
- Arnold, J.M.; Wörgötter, A. Structural reforms and the benefits of the enlarged EU internal market: Still much to be gained. Appl. Econ. Lett. 2011, 18, 1231–1235. [Google Scholar] [CrossRef]
- Calvo-Sotomayor, I.; Laka, J.P.; Aguado, R. Workforce ageing and labour productivity in Europe. Sustainability 2019, 11, 5851. [Google Scholar] [CrossRef]
- Cristea, M.; Noja, G.G.; Danacica, D.E.; Stefea, P. Population ageing, labour productivity and economic welfare in the European Union. Econ. Res.-Ekon. Istraz. 2020, 33, 1354–1376. [Google Scholar] [CrossRef]
- Feyrer, J. Demographics and Productivity. Rev. Econ. Stat. 2007, 89, 100–109. [Google Scholar] [CrossRef]
- Kelley, A.C.; Schmidt, R.M. Evolution of Recent Economic-Demographic Modeling: A Synthesis. J. Popul. Econ. 2005, 18, 275–300. [Google Scholar] [CrossRef]
- Sarel, M. Demographic Dynamics and the Empirics of Economic Growth. IMF Staff Pap. 1995, 42, 398–410. [Google Scholar] [CrossRef]
- Atkinson, A.B. Economics as a Moral Science. Economica 2009, 76, 791–804. [Google Scholar] [CrossRef]
- Bivens, J.; Mishel, L. Understanding the Historic Divergence between Productivity and a Typical Worker’s Pay: Why It Matters and Why It’s Real; Economic Policy Institute: Washington, DC, USA, 2015. [Google Scholar]
- Du, Y.; Qu, Y. Labor Compensation, Labour productivity and Labor Cost Advantage. China Econ. 2009, 16, 58–65. [Google Scholar]
- Pasimeni, P. The Relation between Productivity and Compensation in Europe; European Economy—Discussion Papers 079; Directorate General Economic and Financial Affairs (DG ECFIN), European Commission: Luxembourg, 2018. [Google Scholar]
- Lupu, D.; Cărăusu, D.N.; Ifrim, M. Wage share and economic growth: Evidence from Eastern Europe. Appl. Econ. Lett. 2023, 30, 772–779. [Google Scholar] [CrossRef]
- Afonso, O. The impact of institutions on economic growth in OECD countries. Appl. Econ. Lett. 2022, 29, 63–67. [Google Scholar] [CrossRef]
- Zhu, S.; Yu, G. The impact of economic policy uncertainty on industrial output: The regulatory role of technological progress. Sustainability 2022, 14, 10428. [Google Scholar] [CrossRef]


| Country | GDP Growth | Compensation/GDP | ||||||
|---|---|---|---|---|---|---|---|---|
| Mean | St. Dev. | Min | Max | Mean | St. Dev. | Min | Max | |
| Turkey | 5.40% | 0.0406 | −4.82% | 11.35% | 27.6% | 0.0221 | 24.7% | 32.0% |
| Ireland | 5.06% | 0.0652 | −5.10% | 24.37% | 35.7% | 0.0580 | 26.1% | 43.9% |
| Israel | 4.04% | 0.0215 | −1.86% | 8.61% | 43.3% | 0.0073 | 42.4% | 44.8% |
| Poland | 3.91% | 0.0219 | −2.02% | 7.06% | 38.4% | 0.0114 | 36.5% | 41.0% |
| Costa Rica | 3.80% | 0.0284 | −4.27% | 8.22% | 44.5% | 0.0146 | 41.8% | 46.4% |
| Colombia | 3.76% | 0.0354 | −7.25% | 11.02% | 33.3% | 0.0123 | 31.4% | 37.3% |
| Slovakia | 3.46% | 0.0377 | −5.46% | 10.83% | 38.3% | 0.0272 | 35.2% | 43.9% |
| Korea | 3.38% | 0.0171 | −0.71% | 6.80% | 44.6% | 0.0164 | 42.5% | 48.2% |
| Lithuania | 3.34% | 0.0512 | −14.84% | 11.11% | 42.5% | 0.0288 | 38.7% | 48.0% |
| Estonia | 3.01% | 0.0562 | −14.63% | 9.77% | 46.5% | 0.0228 | 43.4% | 50.9% |
| Latvia | 2.62% | 0.0604 | −14.26% | 11.97% | 44.0% | 0.0365 | 38.2% | 50.0% |
| Australia | 2.60% | 0.0088 | −0.05% | 3.90% | 47.6% | 0.0071 | 45.6% | 49.0% |
| Iceland | 2.58% | 0.0444 | −7.66% | 8.45% | 51.7% | 0.0303 | 45.2% | 55.8% |
| Luxembourg | 2.52% | 0.0257 | −3.24% | 8.10% | 47.7% | 0.0134 | 45.8% | 50.3% |
| Czechia | 2.43% | 0.0334 | −5.50% | 6.77% | 42.0% | 0.0178 | 40.2% | 46.0% |
| Slovenia | 2.16% | 0.0387 | −7.55% | 8.21% | 50.4% | 0.0133 | 48.7% | 53.6% |
| Sweden | 2.14% | 0.0260 | −4.34% | 5.95% | 46.5% | 0.0120 | 44.2% | 48.0% |
| Hungary | 2.09% | 0.0341 | −6.60% | 7.20% | 43.6% | 0.0176 | 39.7% | 46.1% |
| U. States | 1.94% | 0.0200 | −2.77% | 5.95% | 53.8% | 0.0088 | 52.5% | 55.5% |
| Switzerland | 1.94% | 0.0177 | −2.38% | 4.22% | 57.0% | 0.0155 | 54.1% | 59.7% |
| Mexico | 1.74% | 0.0328 | −7.99% | 5.12% | 27.7% | 0.0094 | 26.0% | 29.9% |
| Canada | 1.73% | 0.0229 | −5.07% | 5.01% | 50.3% | 0.0091 | 48.8% | 52.5% |
| Norway | 1.56% | 0.0152 | −1.94% | 4.01% | 44.8% | 0.0268 | 40.0% | 50.2% |
| Belgium | 1.52% | 0.0234 | −5.36% | 6.29% | 50.3% | 0.0108 | 48.5% | 52.2% |
| Netherlands | 1.38% | 0.0223 | −3.89% | 4.86% | 48.6% | 0.0104 | 46.9% | 50.6% |
| Denmark | 1.37% | 0.0217 | −4.91% | 4.86% | 51.7% | 0.0098 | 50.5% | 54.9% |
| Austria | 1.26% | 0.0256 | −6.45% | 4.56% | 47.3% | 0.0128 | 45.1% | 50.5% |
| Germany | 1.22% | 0.0242 | −5.69% | 4.18% | 51.3% | 0.0149 | 48.2% | 54.3% |
| U. Kingdom | 1.15% | 0.0366 | −11.03% | 7.60% | 49.3% | 0.0110 | 47.8% | 51.9% |
| Finland | 1.15% | 0.0302 | −8.07% | 5.30% | 47.6% | 0.0123 | 45.9% | 49.8% |
| France | 1.07% | 0.0279 | −7.78% | 6.82% | 51.7% | 0.0060 | 50.5% | 52.4% |
| Spain | 0.83% | 0.0385 | −11.33% | 5.52% | 47.2% | 0.0146 | 45.0% | 49.7% |
| Japan | 0.52% | 0.0227 | −5.69% | 4.10% | 50.0% | 0.0121 | 48.3% | 52.5% |
| Portugal | 0.50% | 0.0312 | −8.30% | 5.50% | 46.1% | 0.0161 | 43.5% | 48.4% |
| Italy | −0.05% | 0.0323 | −8.98% | 6.99% | 39.3% | 0.0094 | 37.6% | 40.9% |
| Greece | −0.76% | 0.0489 | −10.15% | 8.43% | 35.5% | 0.0169 | 33.1% | 39.9% |
Disclaimer/Publisher’s Note: The statements, opinions and data contained in all publications are solely those of the individual author(s) and contributor(s) and not of MDPI and/or the editor(s). MDPI and/or the editor(s) disclaim responsibility for any injury to people or property resulting from any ideas, methods, instructions or products referred to in the content. |
© 2023 by the authors. Licensee MDPI, Basel, Switzerland. This article is an open access article distributed under the terms and conditions of the Creative Commons Attribution (CC BY) license (https://creativecommons.org/licenses/by/4.0/).
Share and Cite
Przekota, G.; Janowski, A.; Szczepanska-Przekota, A. Causality in the Relationship between Economic Growth and Compensation. Sustainability 2023, 15, 16465. https://doi.org/10.3390/su152316465
Przekota G, Janowski A, Szczepanska-Przekota A. Causality in the Relationship between Economic Growth and Compensation. Sustainability. 2023; 15(23):16465. https://doi.org/10.3390/su152316465
Chicago/Turabian StylePrzekota, Grzegorz, Andrzej Janowski, and Anna Szczepanska-Przekota. 2023. "Causality in the Relationship between Economic Growth and Compensation" Sustainability 15, no. 23: 16465. https://doi.org/10.3390/su152316465