Article

Comparative Life Cycle Assessment of Reusable and Disposable Distribution Packaging for Fresh Food

1
Department of Biotechnology, College of Life Sciences and Biotechnology, Korea University, 145 Anam-ro, Seongbuk-gu, Seoul 02841, Republic of Korea
2
Korea Packaging Center, Korea Institute of Industrial Technology, Bucheon 14449, Republic of Korea
3
AIMT Co., Ltd., Daegu 43020, Republic of Korea
*
Authors to whom correspondence should be addressed.
These authors contributed equally to this work.
Sustainability 2023, 15(23), 16448; https://doi.org/10.3390/su152316448
Submission received: 19 October 2023 / Revised: 8 November 2023 / Accepted: 21 November 2023 / Published: 30 November 2023
(This article belongs to the Section Sustainable Products and Services)

Abstract

:
In this study, a comparative life cycle assessment of three different products with reusable and single-use packaging for fresh food distribution was conducted. For the reusable packaging, one utilized a vacuum insulation panel (VIP) box made of recycled polyethylene terephthalate (r-PET), while the other employed expanded polyethylene (EPE). For comparison, a disposable box made of widely used expanded polystyrene (EPS) was selected. We analyzed the environmental impacts of production, transportation, reprocessing (reused boxes), and disposal in 18 impact categories. As a result of analyzing the actual reuse of 300 rounds of fresh food, the cumulative global warming potential (GWP) values of the VIP and EPE box were 136.58 kg carbon dioxide (CO2) eq and 281.72 kg CO2 eq, respectively, 87% and 74% lower than those of the EPS box. Additionally, the GWP values were the same as those of the EPS boxes when the VIP and EPE boxes were reused 7 and 12 times, respectively. The best-case scenario was revealed when the reusable packaging with the r-PET VIP was compared with the EPE and EPS boxes. In conclusion, reusable packaging is expected to contribute to the reduction in the environmental burden and better suit global environmental requirements for sustainable food distribution and related industries. In addition, our findings can inform policy and industry decisions to promote more sustainable practices in the food industry, contributing to the advancement of sustainability in this field.

1. Introduction

In many countries, including Korea, disposable expanded polystyrene (EPS) is the most widely used packaging material for distributing fresh foods [1]. However, the significant increase in the use of disposable packaging materials, especially because of no face-to-face delivery services during the Coronavirus disease 2019 pandemic, has raised concerns about waste disposal and the associated social issues [2,3]. According to statistics from the Korea Environment Corporation in 2021, the annual production volume of EPS has been continuously increasing, reaching 25,334 tons in 2015; 36,792 tons in 2018; 50,148 tons in 2020; and 59,952 tons in 2021 [4,5].
Currently, in domestic fresh food distribution in Korea, reusable logistics containers that can be washed and repaired are being used as alternatives to disposable containers such as EPS or cardboard boxes [6,7,8]. Among the materials, fiber insulation materials are considered promising for their high developmental efficiency due to not requiring separate molds, like EPS boxes [9,10,11]. Moreover, since producing fibers from waste plastics is relatively easy, this material displays the potential to contribute significantly to the social resource circulation ecosystem [12,13]. In this study, packaging containing vacuum insulation panels (VIPs) made from recycled polyethylene terephthalate (r-PET) bottles was developed, which can be reused after a transportation process involving cleaning and repair [14].
Previous research on the environmental impact of conventional cooling packaging materials compared and analyzed disposable packaging materials for fish packaging, including EPS, cardboard, and (polypropylene) boxes, through a life cycle assessment (LCA) [15]. Life cycle assessment (LCA) is a methodology used to evaluate the environmental impacts of a product or process throughout its entire life cycle, from raw material extraction to disposal. The core components of an LCA include four stages: goal and scope definition, life cycle inventory (LCI), life cycle impact assessment (LCIA), and interpretation. The goal and scope definition stage involves defining the purpose of the study, the system boundaries, and the functional unit. The functional unit is the unit of measurement for the environmental impacts, such as per kilogram of product or per year of operation. The life cycle inventory (LCI) stage involves compiling a detailed inventory of all the inputs and outputs associated with the product or process, including raw materials, energy, water, emissions, and waste. The life cycle impact assessment (LCIA) stage involves assessing the potential environmental impacts of the LCI data, using a set of impact categories such as climate change, acidification, eutrophication, and human toxicity. The interpretation stage involves analyzing and interpreting the results of the LCIA, identifying the key sources of environmental impact, and drawing conclusions and recommendations for improvement. In summary, when comparing EPS packaging with other packaging systems on the French market, EPS performed similarly to or better than corrugated polypropylene (PP) and cardboard, except for the formation of photochemical oxidants. However, in the Spanish market, the results were similar, with PP outperforming EPS in terms of photochemical oxidant formation and water consumption. In the Scandinavian market, EPS and PP performed similarly for several indicators, but EPS proved to be better than PP in terms of waste production, and worse in terms of greenhouse gas emissions and photochemical oxidants. Furthermore, EPS outperformed cardboard in waste production, water consumption, and water eutrophication, but lagged in energy consumption, greenhouse gas emissions, and photochemical oxidants, whereas both materials performed similarly in acidification.
Another study presented an LCA of conventional pyrogenic silica VIPs [16]. The findings demonstrated that the pyrogenic silica core made the most significant contribution, accounting for more than 60% of the selected impact categories. A comparative environmental assessment of various VIP core materials was conducted, and EPS demonstrated higher environmental benefits in eight out of the nine impact categories because of its low density and independence of service life. However, the most commonly used core material, pyrogenic silica, had the highest impact among the seven impact categories, primarily because of the use of tetrachlorosilane in the manufacturing process. In a previous study, a life cycle assessment focusing on EPS packaging for TV sets and a closed-loop recycling scheme was conducted [17]. Another study considered the flow of fresh fruits and vegetables through a food catering chain, from suppliers to end customers. It compared a multi-use system to traditional single-use packaging, such as wooden boxes, disposable plastic crates, and cardboard boxes, to assess the economic benefits and environmental impacts of reusable plastic containers (RPCs) [18]. In other paper, “Life Cycle Assessment of Reusable Plastic Crates (RPCs)”, an evaluation of the environmental impact of fruit and vegetable distribution using RPCs was conducted. The study applied these findings to 36% of fruit and vegetable distribution in Italy to investigate the relationship between the number of times RPCs are used and their environmental impact [19]. Previous research on the environmental impact of cooling packaging materials has primarily focused on single-use packaging materials using LCA. Studies on reusable food containers have primarily evaluated the environmental impacts of plastic containers in isolation [20,21,22,23,24].
In this study, we compared the environmental impact of disposable EPS distribution packaging and two different reusable distribution packages, mainly composed of VIP made from r-PET and expanded polyethylene (EPE), using an LCA. While reusable packaging options such as EPE and VIP have been developed, their relatively heavier weight has led to questions about their actual environmental friendliness. Therefore, this study aims to verify the environmental impacts of different packaging options through a comprehensive evaluation of the entire distribution process under real-world conditions. Three different distribution packaging systems were evaluated from cradle to cradle, that is, from raw material acquisition to reuse and waste management. The study also includes environmental performance measures to improve the manufacturing process of a VIP reusable box, including the installation of tension pullers, fans, smoke deflectors, hot plates, and dust collectors to reduce the environmental burden. The findings of our study have important implications for sustainability in the food industry, addressing key challenges such as reducing waste and greenhouse gas emissions. Our research contributes to sustainable development by promoting more sustainable packaging practices and providing a foundation for future studies.
The purpose of this study is as follows:
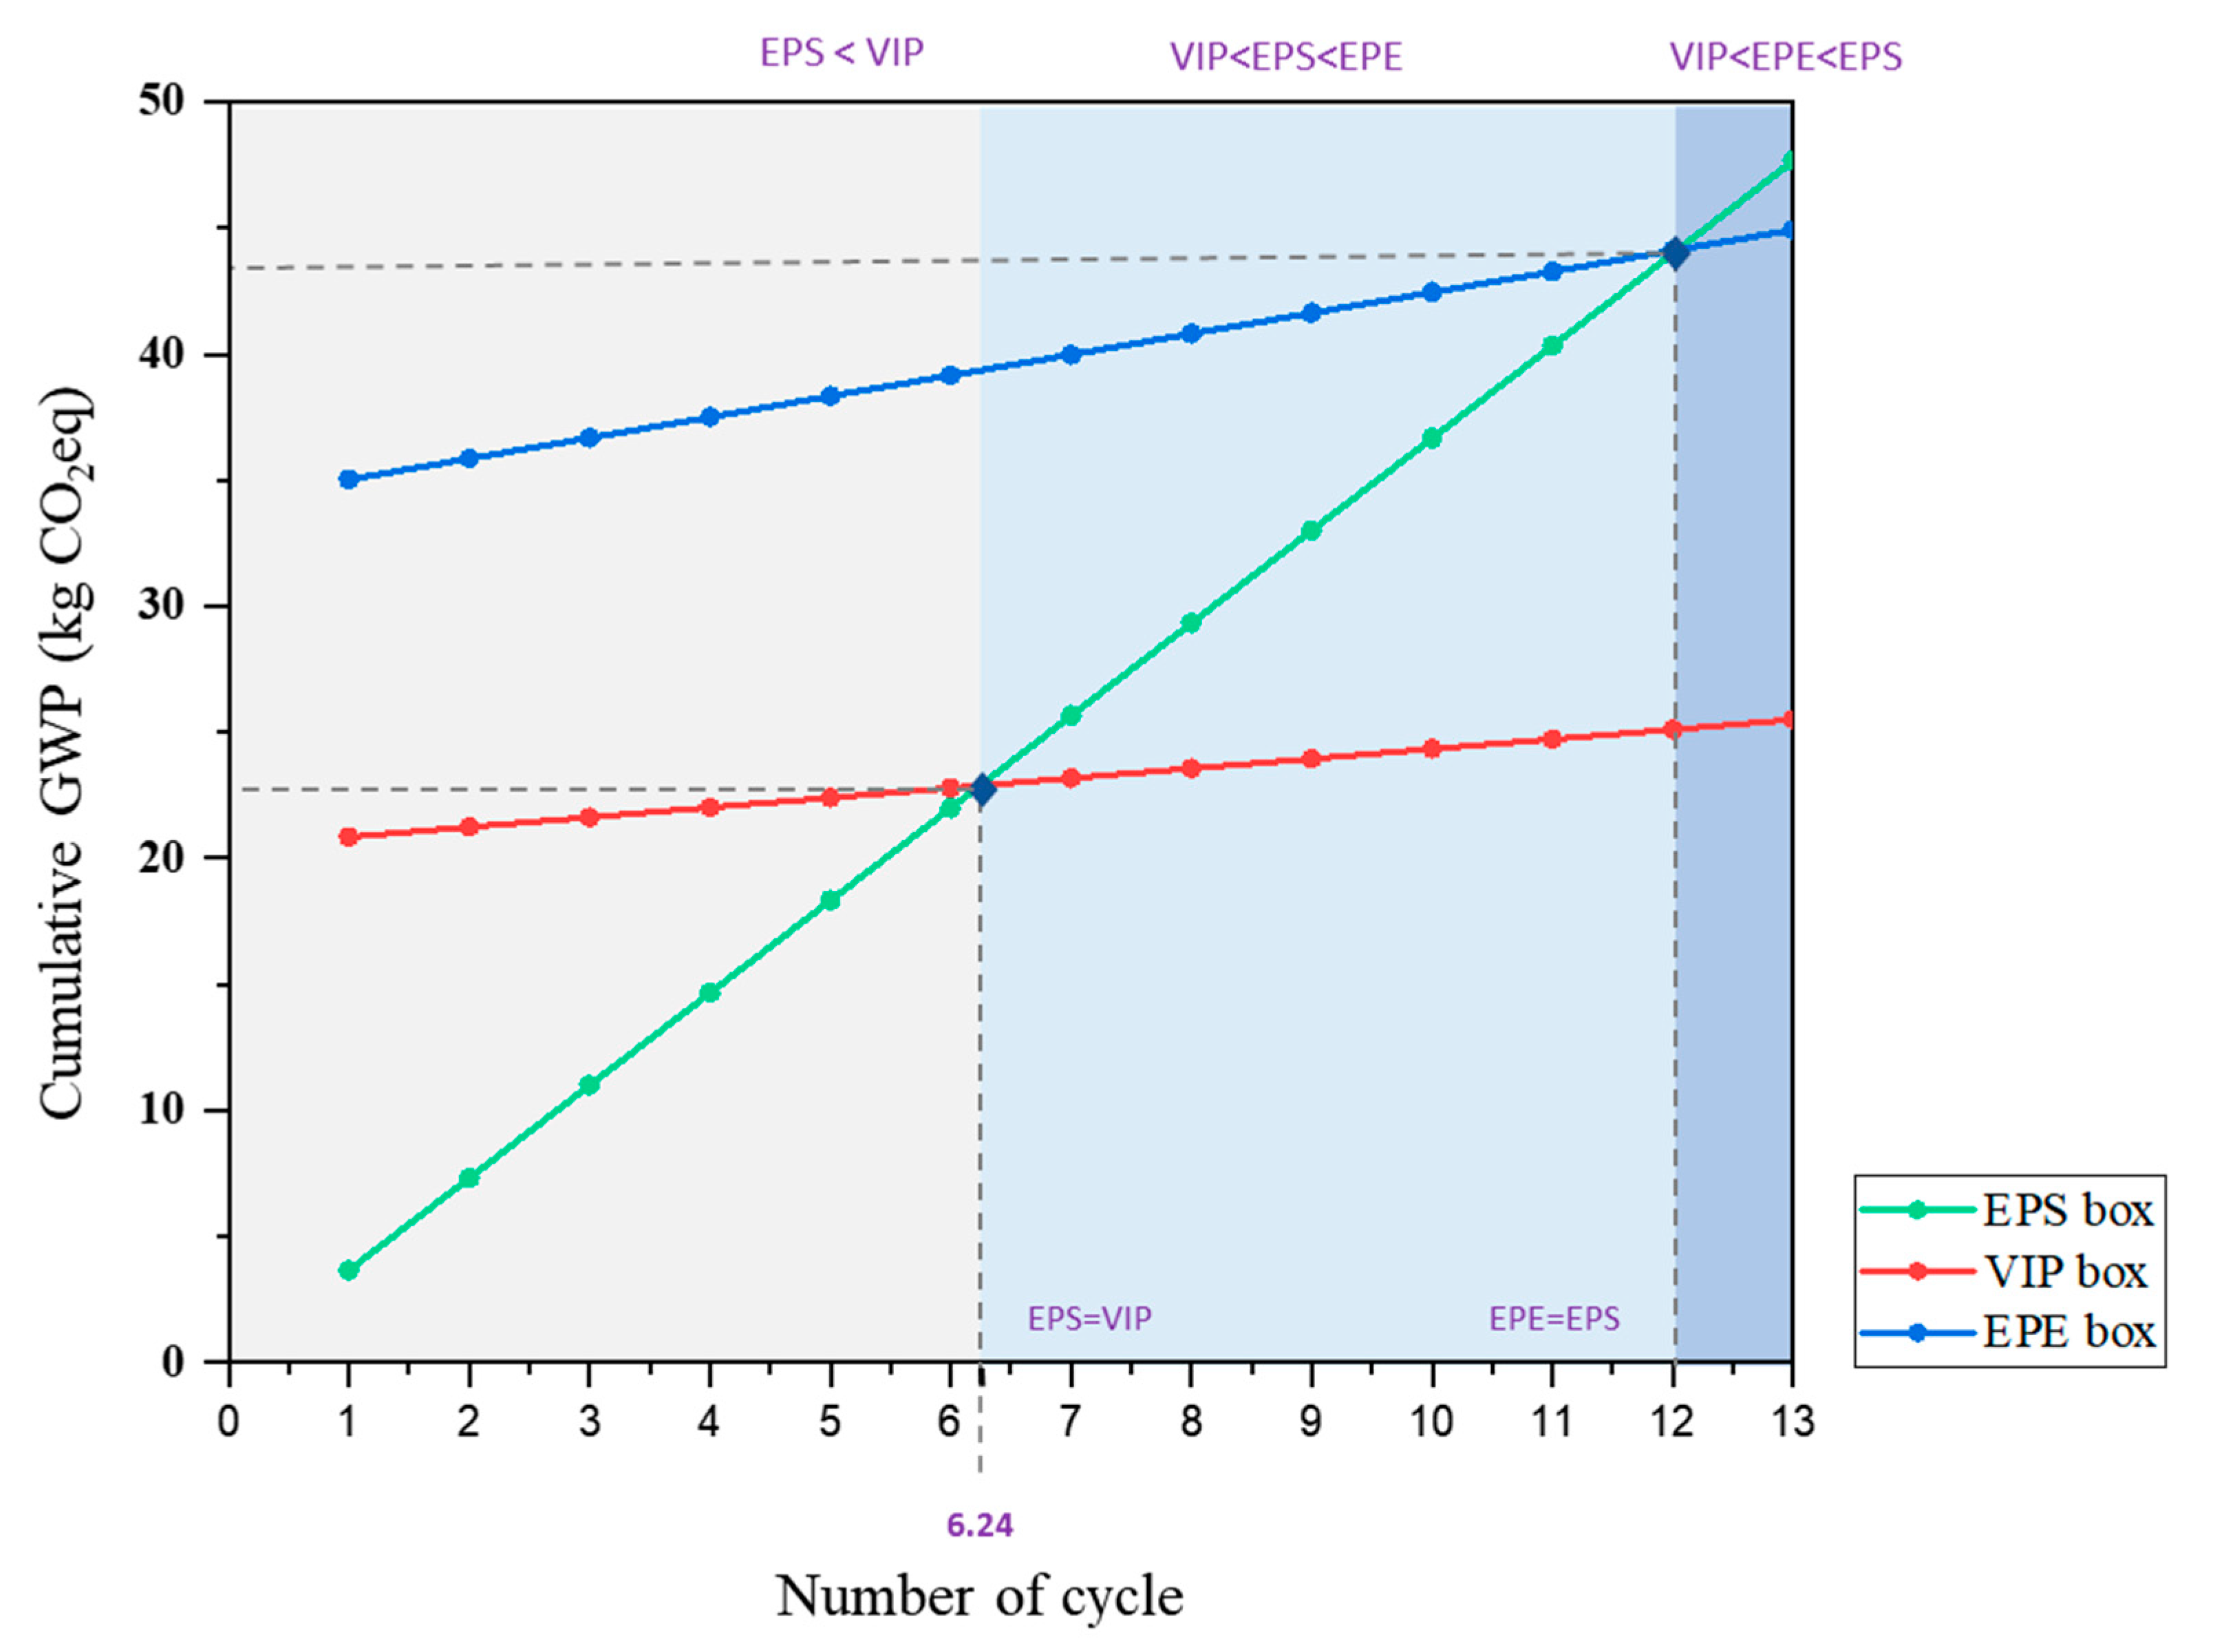
  • To evaluate the environmental and energy performance of reusable insulated packaging materials for fresh food delivery as a function of the number of deliveries.
  • Identify the contribution of the transportation stage to overall environmental indicators.
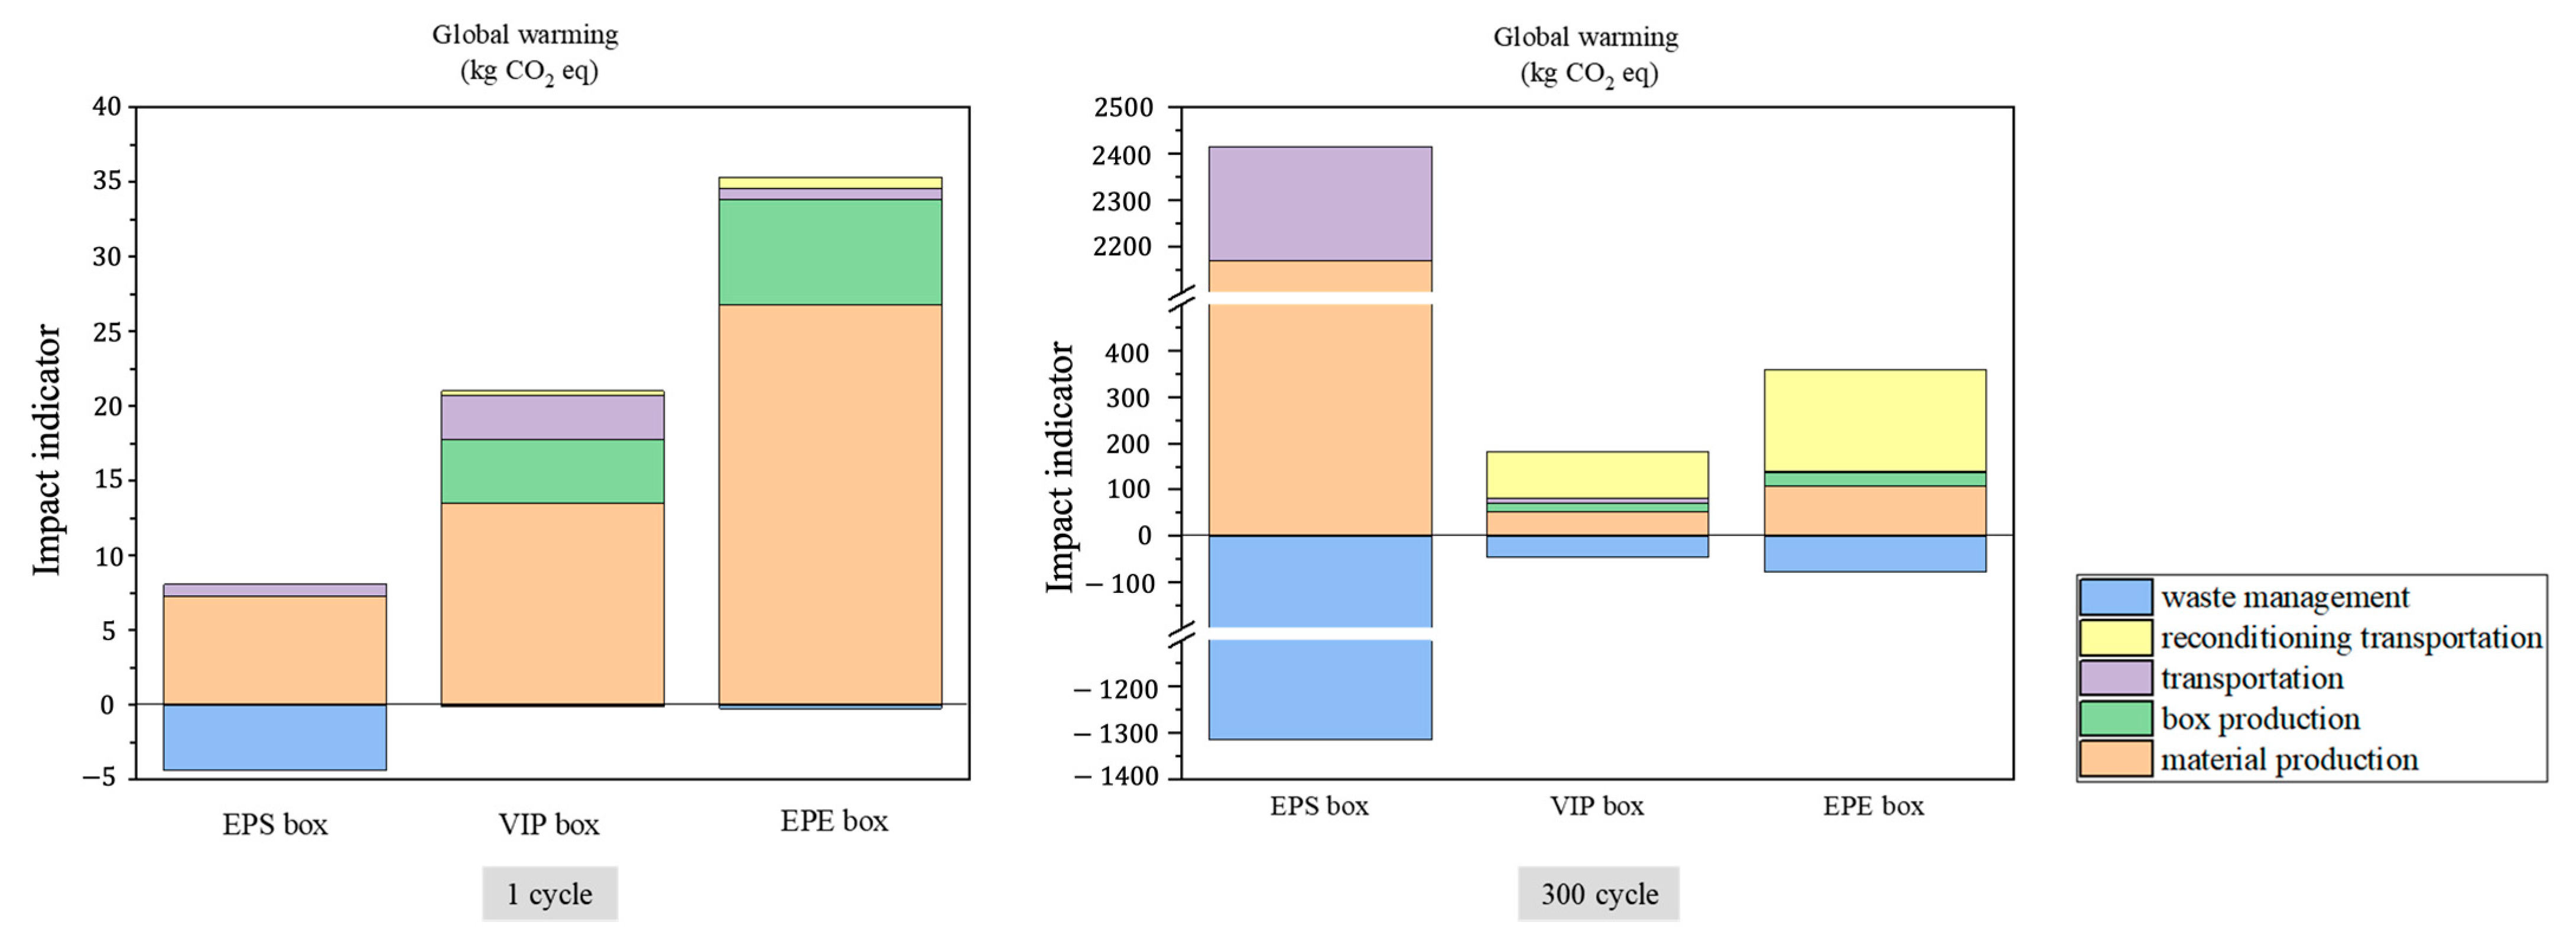
  • The comparison of the environmental impacts of three types of boxes: disposable EPS boxes, reusable insulated packaging materials made from r-PET fabric and VIP, and reusable insulated packaging materials with reusable EPE materials throughout their life cycle.

2. Materials and Methods

2.1. Functional Unit and System Boundary

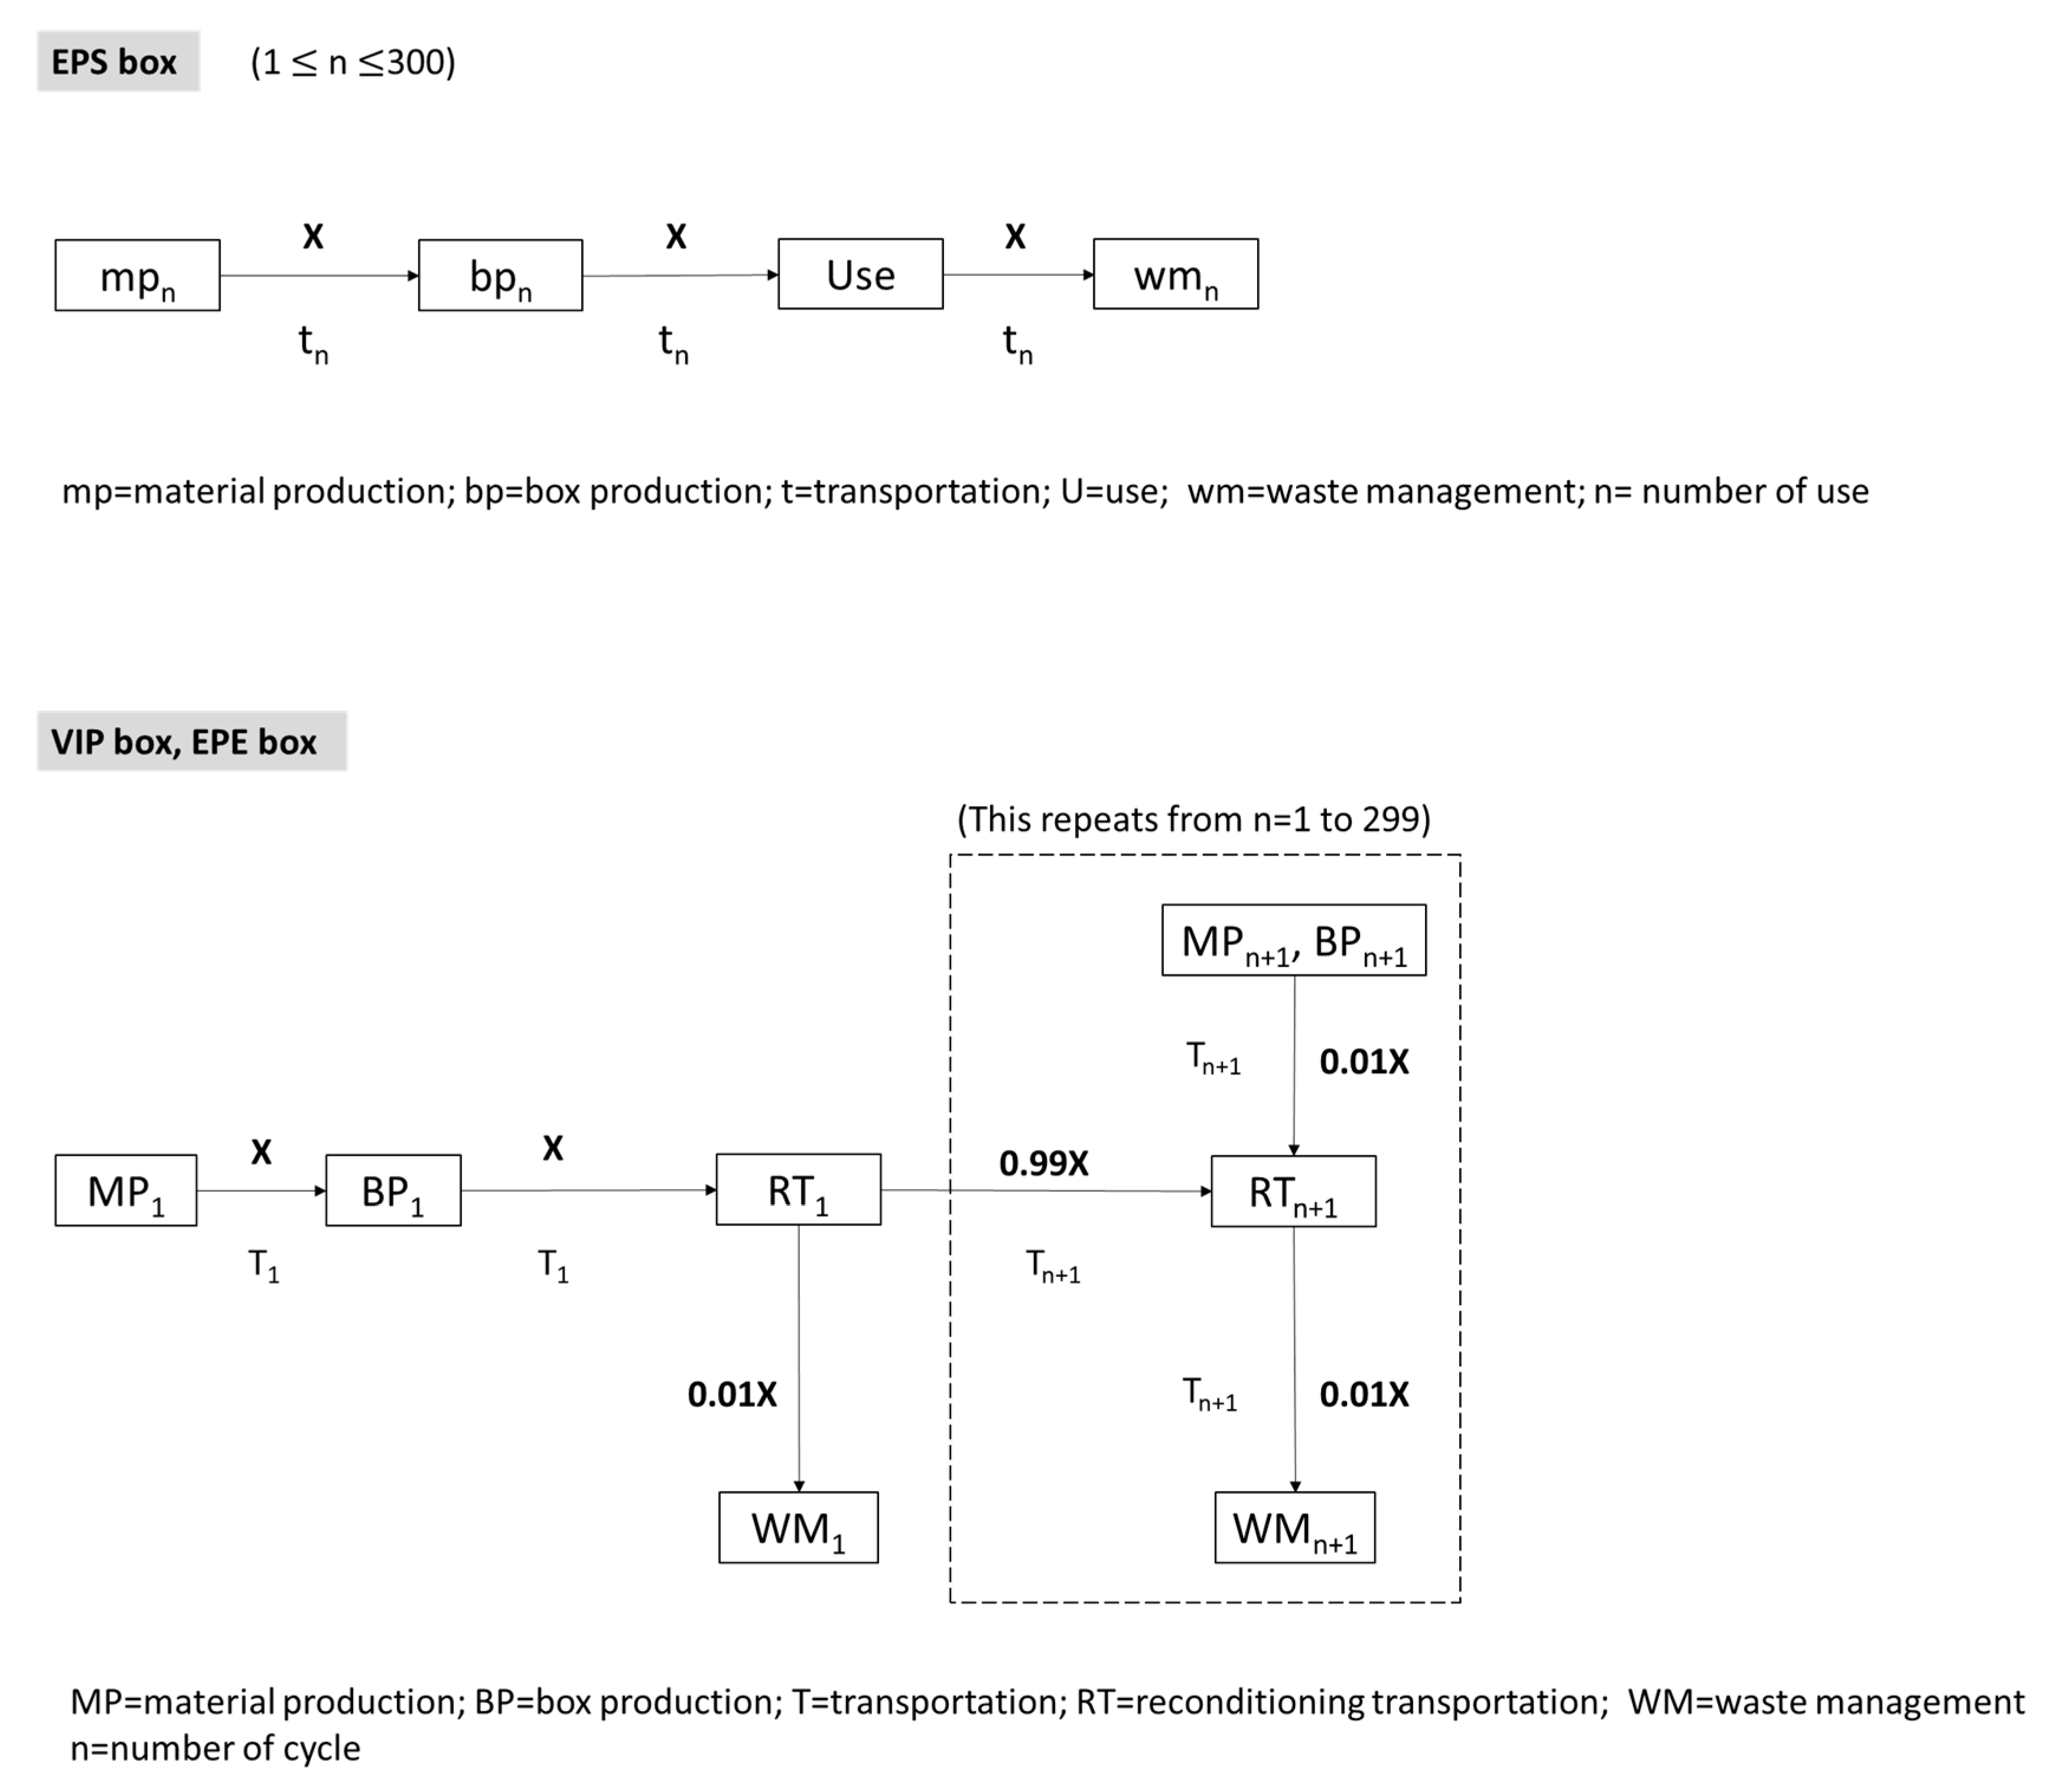
2.1.1. Functional Unit

In this study, the EPS boxes were selected as the most commonly used packaging for domestic fresh food delivery and were produced by a company specializing in EPS box manufacturing. Additionally, VIP boxes containing rPET were designed to deliver fresh food domestically. Transportation logistics containers containing EPE materials were selected from a major domestic food logistics company. The boxes are displayed in Figure 1. The research team fabricated a VIP box by impregnating r-PET fibers into the box to improve the thickness. Furthermore, the inability of existing silica fibers to bend caused the heat bridge problem [25,26,27]. EPE boxes were foamed with virgin PE to produce reusable insulated packaging for fresh food shipments.
In this study, we performed an environmental assessment of the input and output materials generated during the processing of boxes using a functional unit. The functional unit considered for this assessment included EPS, reusable VIP, and EPE boxes, all of which were designed to maintain refrigeration for transporting 3 kg of refrigerated fresh food and three 0.52 kg ice packs at temperatures below 10 °C for more than 24 h during cold chain distribution. These boxes were selected based on their similar cooling capabilities, specifically, their thermal conductivity [28,29].
The weight per unit of each box was as follows: EPS box 0.26 kg, r-PET VIP box 4.54 kg, EPE reusable box 1 kg. The thickness of each box was as follows: EPS box 24.7 mm, VIP box 33.12 mm, EPE box 20.54 mm. The dimensions of the boxes used in the study were as follows: EPS box, 452 × 360 × 336 mm; VIP Reusable Box, 495 × 385 × 310 mm; and EPE reusable box, 445 × 330 × 200 mm. In this study, assuming that the thermal insulation properties of the EPS, r-PET VIP, and EPE boxes were the same, we first determined the thermal insulation performance of each box by measuring their thermal conductivities. The thermal insulation performance of a box is closely related to its thermal conductivity. Generally, a low thermal conductivity allows for more effective heat insulation, resulting in improved thermal insulation performance of the box [30,31].
The EPS, rPET VIP, and EPE reusable boxes were cut to a size of 420 mm × 290 mm, and their thermal conductivities were measured using a Heat Flow Meter (HFM436 lambda, Netzsch). The measured thermal conductivities were as follows: EPS box, 40 K [mW/mK]; rPET VIP box, 11.44 K [mW/mK]; and EPE reusable box, 57.89 K [mW/mK]. Based on the formula for thermal transmittance, each box was calculated to have the same thermal transmittance, and the corresponding changes in mass owing to variations in thickness were determined. The formulas for the thermal transmittance, thermal conductivity, and thickness are as follows [32]:
U = λ/D
In the aforementioned formula, U represents the thermal transmittance and is measured in units of W/m²·K. λ stands for the thermal conductivity of the material and is expressed in units of W/K·m. This varies according to the material used. D refers to the material thickness, which is measured in meters (m).
In this study, a functional unit was defined to assess the entire life cycle, including manufacturing, distribution, use, and disposal, for three types of boxes: EPS box with a weight of 1.22 kg, thickness of 115.8 mm, and dimensions of 684 × 592 × 568 mm; r-PET VIP reusable box with a weight of 4.54 kg, thickness of 33.12 mm, and dimensions of 561 × 451 × 376 mm; and EPE reusable box with a weight of 8.16 kg, thickness of 167.59 mm, and dimensions of 781 × 666 × 536 mm. The weight, thickness, and specifications of each box at the functional unit level are listed in Table 1.

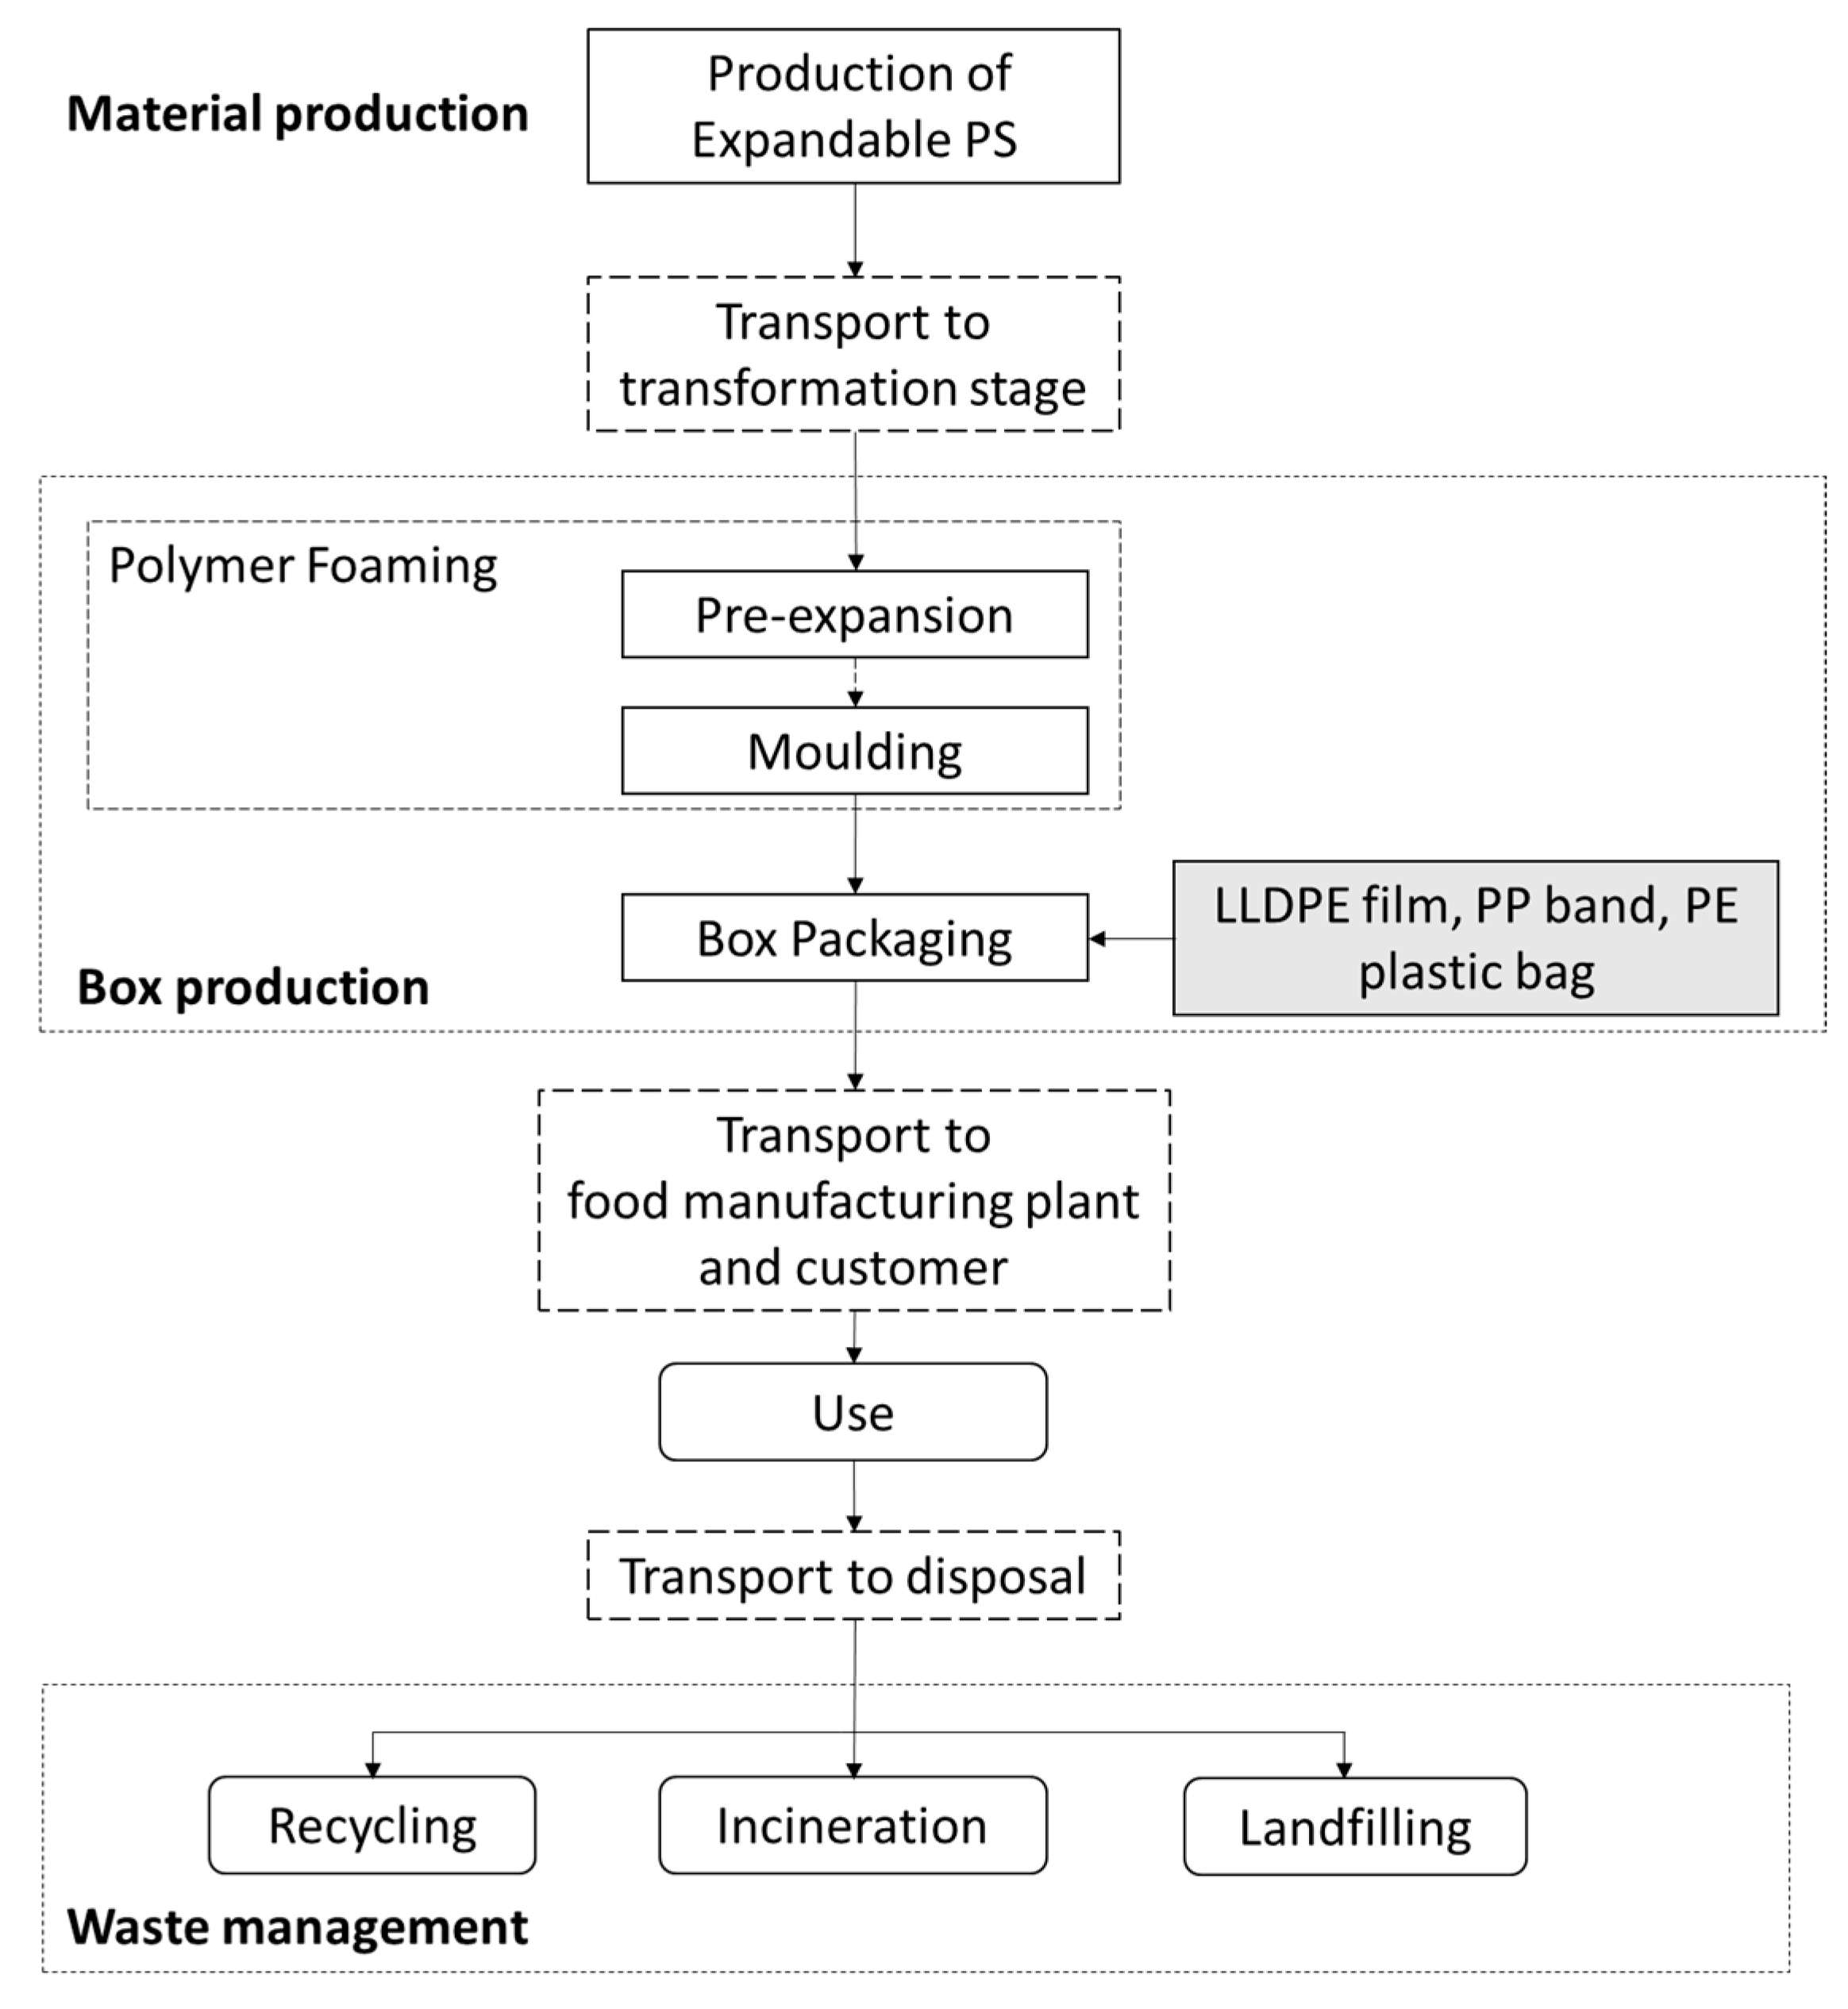
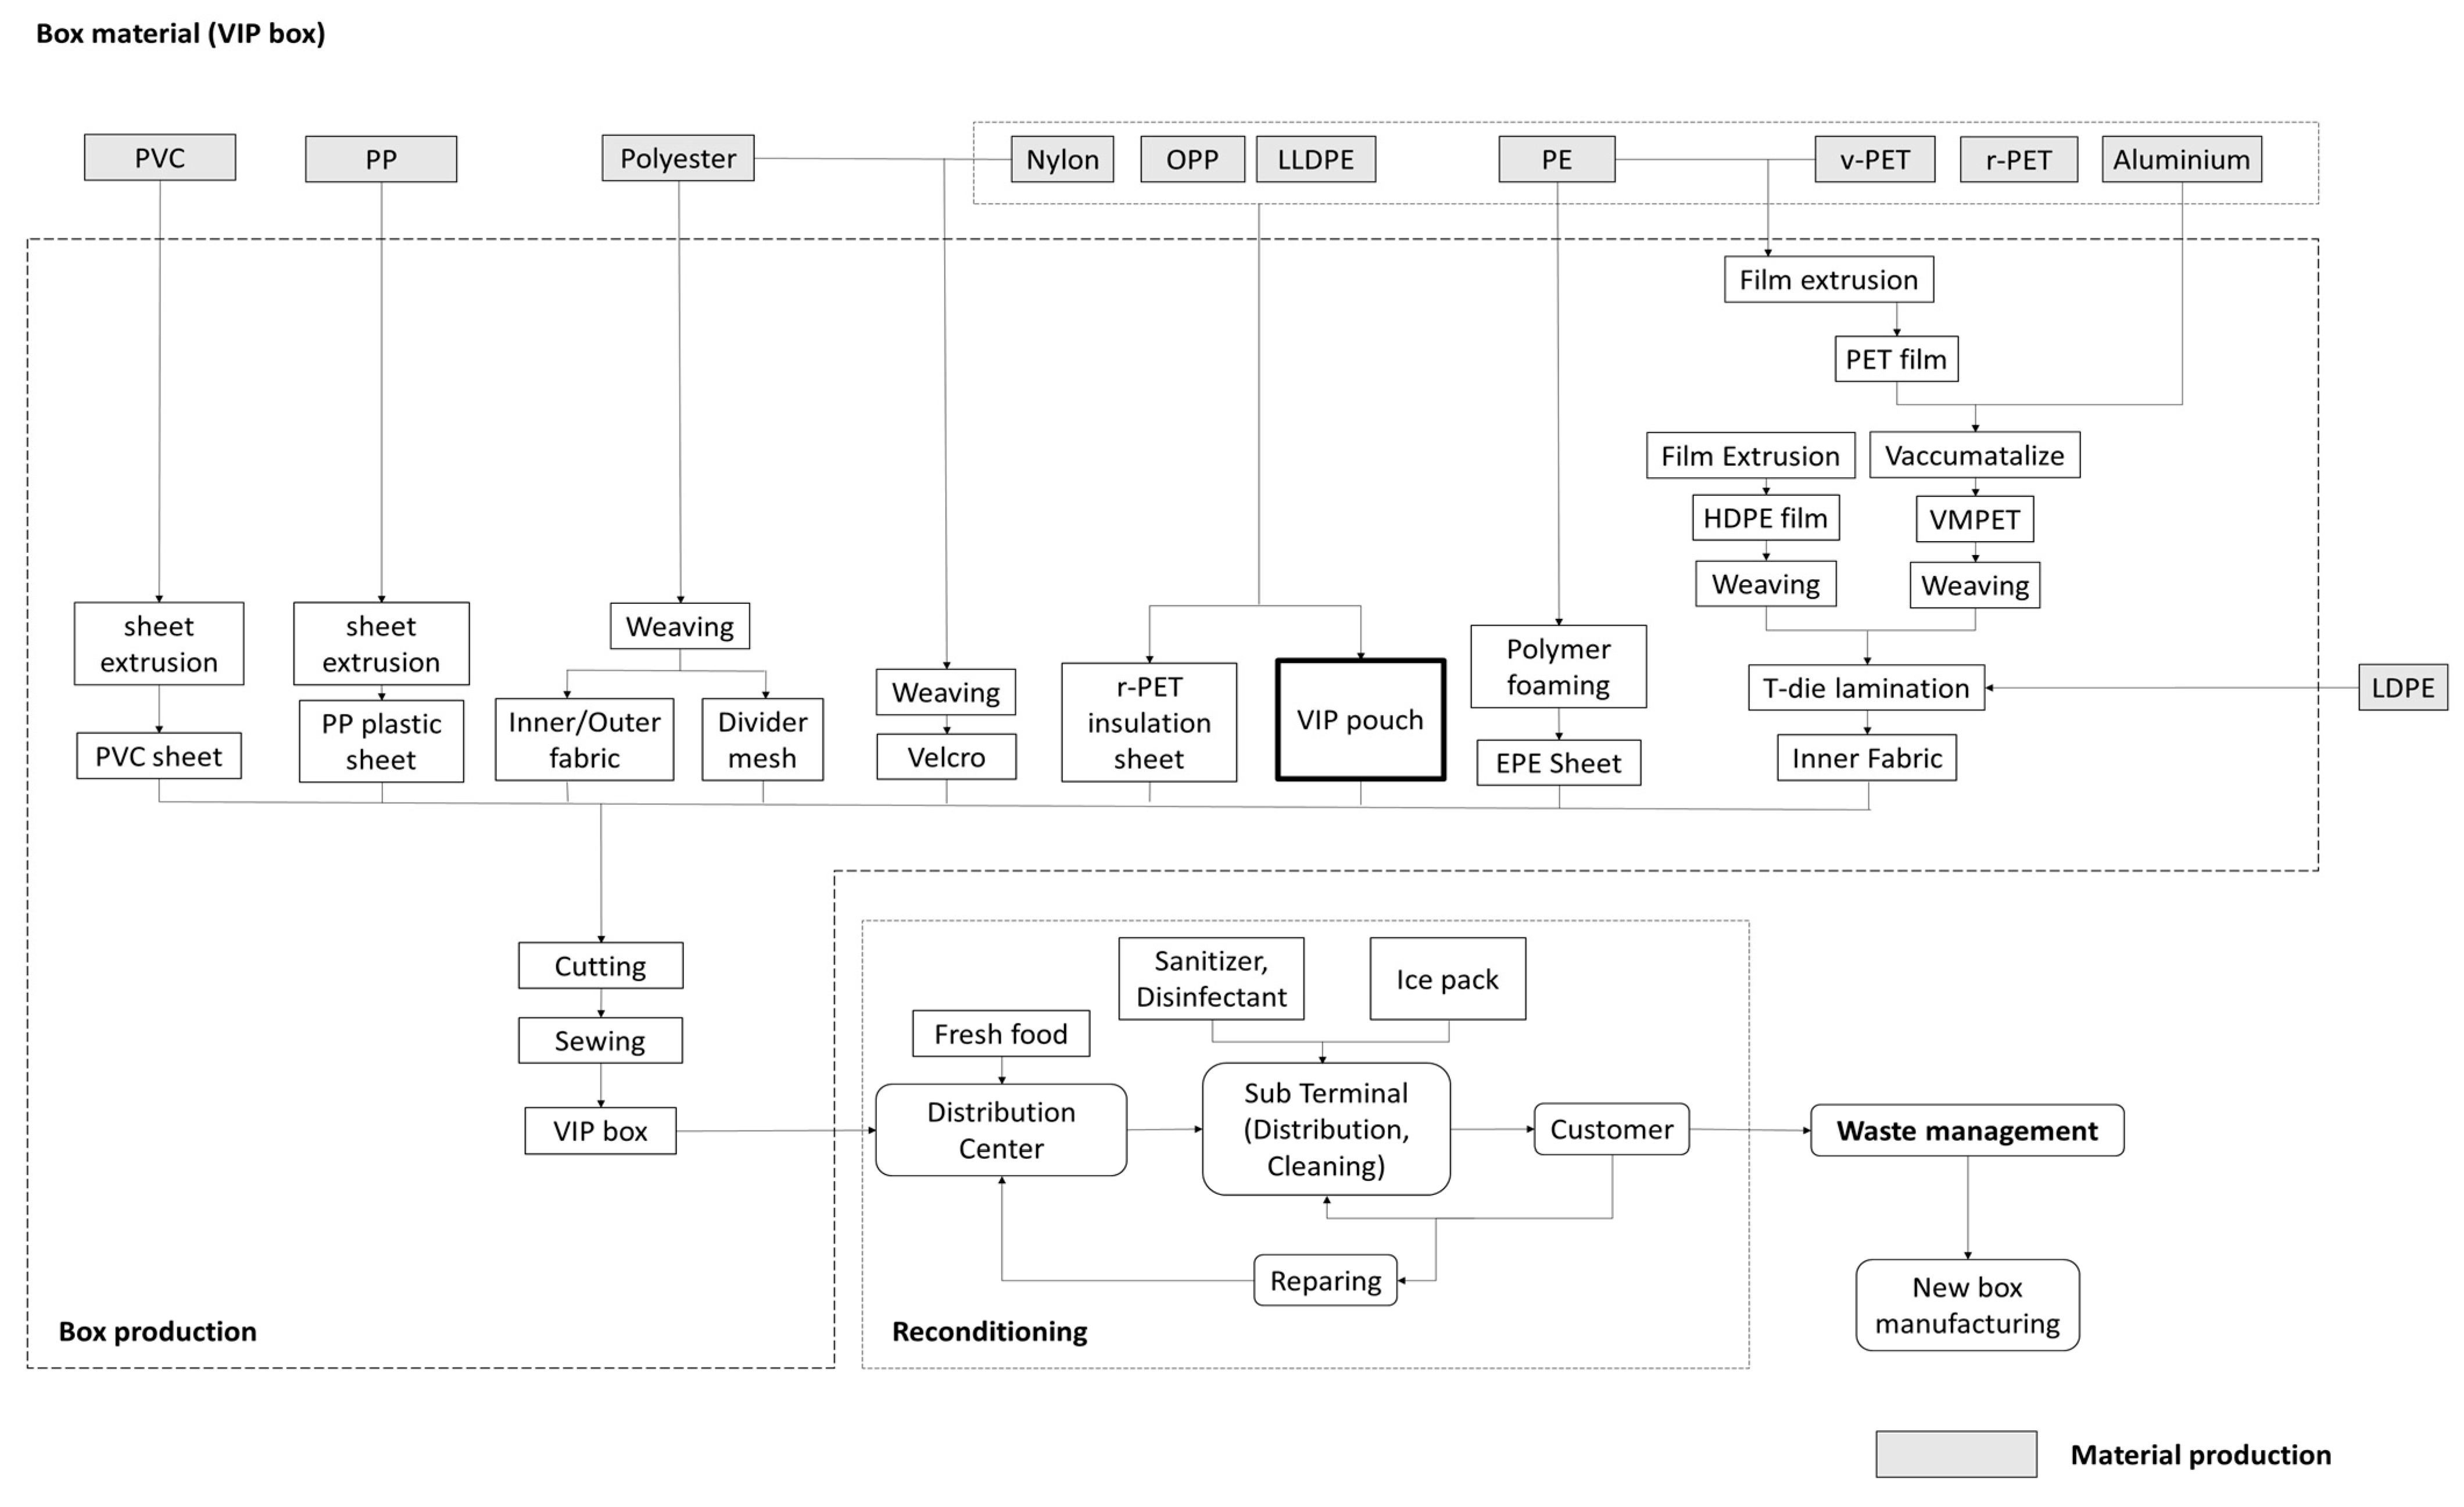
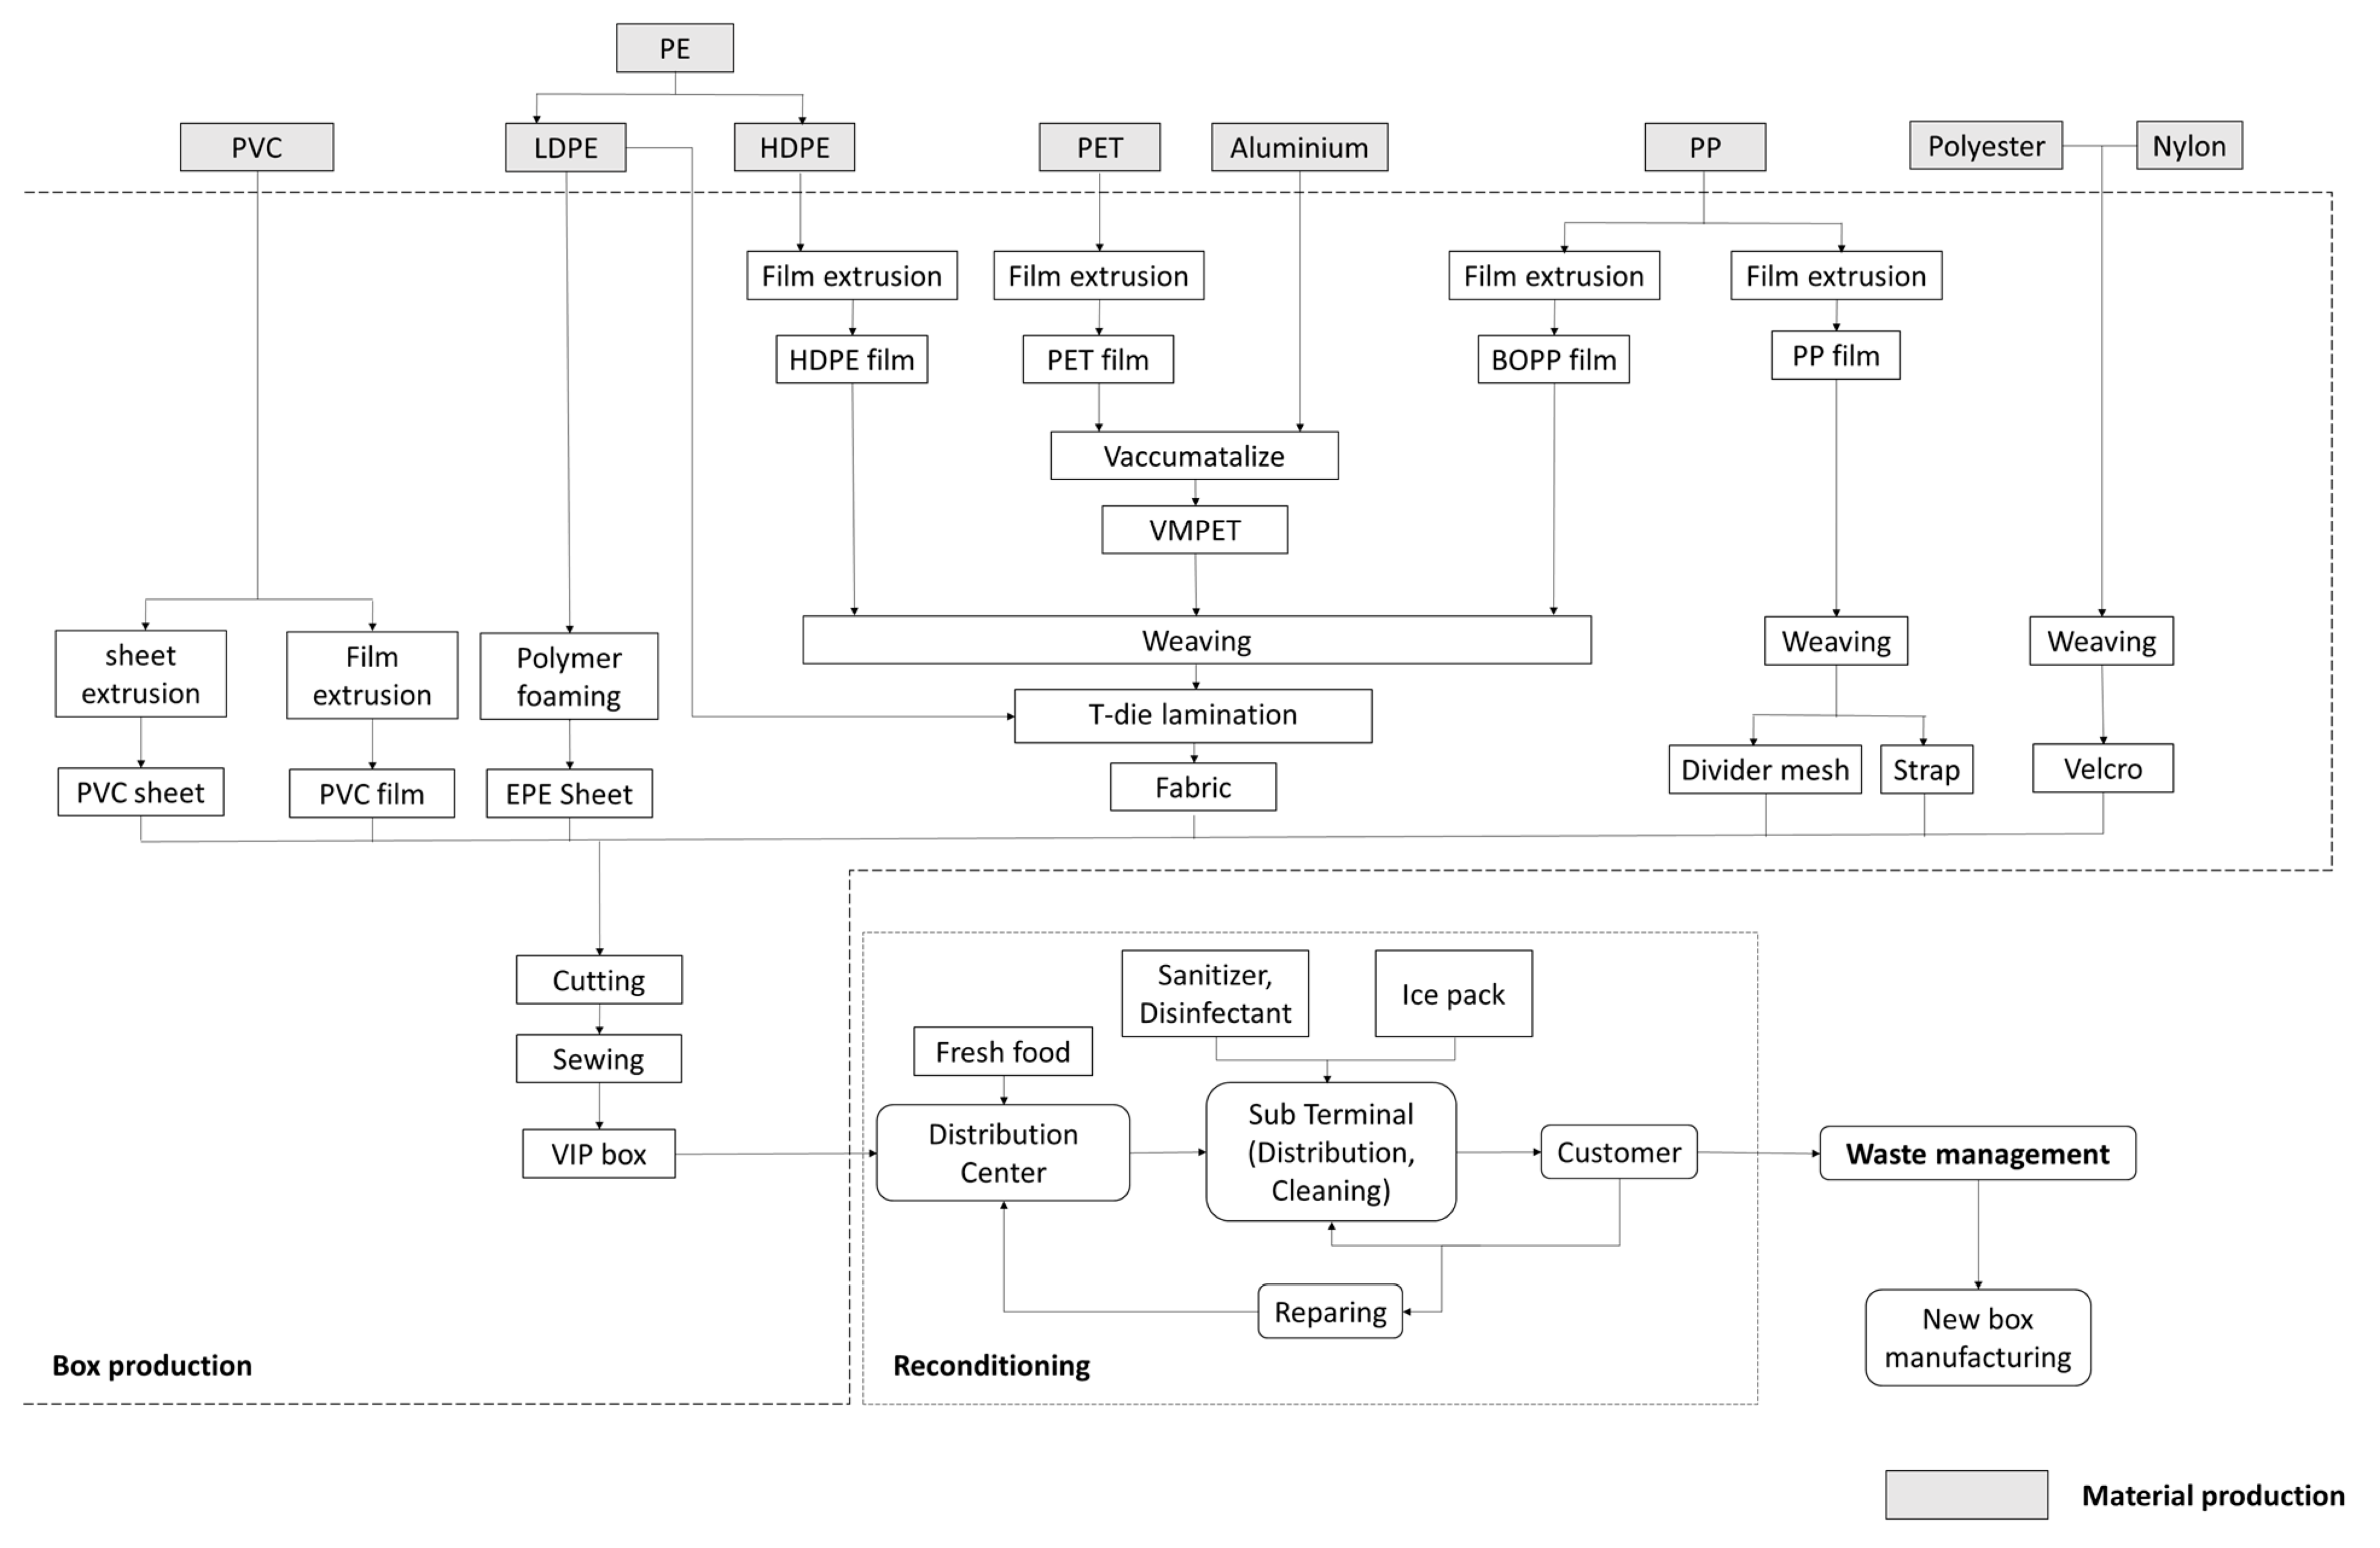
2.1.2. System Boundary

In this study, the entire life cycle stages of r-PET VIP and EPE reusable boxes were considered, including raw material acquisition, box manufacturing, distribution, reuse (repairing and cleaning), and disposal through the transportation system of reusable distribution packaging. This study analyzed the effects of reusability by comparing the flow of returnable packaging resulting from the transportation system with the flow of EPS boxes discarded after a single use. For the EPS boxes, the raw material production stage involved the manufacturing of polystyrene and box packaging materials. The box production stage included polymer foaming and box packaging. The transportation stage included distribution data from the source of the box’s raw material production to box manufacturers, fresh food manufacturers, consumers, and EPS box recycling companies. The waste management stage included recycling, incineration, and box landfilling (Figure 2). For VIP boxes, the material production stage included the production of raw materials necessary for manufacturing boxes containing VIP pouches and rPET sheets Figure S1. The box production stage involved processing raw materials to produce PVC sheets, PP plastic sheets, fabrics, divider meshes, Velcro, rPET insulation sheets, VIP pouches, EPE sheets, and the materials and energy required for transportation. The reconditioning transportation stage included processes for transporting boxes with fresh food and refrigerants to consumers, repairing boxes after transportation, and sanitizing and disinfecting boxes at the subterminals before transporting them back to consumers, all of which required additional materials and energy. The waste management stage encompasses recycling, incineration, and landfill processes after the boxes are used and disposed of, as displayed in Figure 3. For EPE boxes, the material production stage included the materials and energy required for the production and transportation of raw materials for box manufacturing. The box production stage included PVC sheets and films, EPE sheets, fabrics, divider meshes, straps, Velcro, and invoice pockets. The scope of the transportation, disposal, and reconditioning transportation systems was assumed to be the same as that for the VIP boxes (Figure 4).
The circulation flows during the distribution stage for the EPS boxes, VIP reusable boxes, and EPE reusable boxes are illustrated in Figure 5. EPS boxes were disposed of without any transportation processes after use. For reusable boxes, in one cycle (n = 1), 1% of the X boxes were discarded after use and 99% were collected, cleaned, or repaired. In two cycles (n = 2), the boxes discarded in the first cycle were newly manufactured, and the newly manufactured boxes along with the boxes collected in cycle one were used, with 1% being discarded, and 99% being collected, cleaned, or repaired. The process continued for 2–300 cycles.
The cumulative GWP values based on the usage frequency of each box were generalized using these equations. The equation for the EPS boxes is as follows:
  y = n = 1 300 ( m p n + b p n + t n + w m n )
where n is the number of boxes used, m p n corresponds to the GWP environmental impact value generated in the material production stage for n uses, b p n corresponds to the GWP environmental impact value generated in the box production stage for n uses, t p n corresponds to the GWP environmental impact value generated in the transportation stage for n uses, and w m n corresponds to the GWP environmental impact value generated in the waste management stage for n uses. For a single use of an EPS box, the GWP environmental impact value y can be expressed as m p 1 + b p 1 + t p 1 + w m 1 . For two uses of an EPS box, the GWP environmental impact value y can be expressed as m p 1 + b p 1 + t p 1 + w m 1 + m p 2 + b p 2 + t p 2 + w m 2 . As the environmental impact values for each reuse of the EPS box are the same, m p 1 = m p 2 = m p 3 = = m p 300 , and the values for b p 1 , t p 1 , w m 1 are also the same.
For VIP and EPE boxes, when considering 300 reuse cycles, the entire process, including material production, box production, transportation, reconditioning transportation, and waste management stage, can be represented by a single formula as follows (3).
y = MP 1 + BP 1 + T 1 + WM 1 + n = 1 300 RT n + n = 2 300 ( MP n + BP n + T n + WM n )
where n represents the number of box rotations, MP1 signifies the GWP value (in kg CO2 eq) generated during material production for a single rotation of VIP and EPE boxes, BP1 corresponds to the GWP value during box production, T1 signifies the GWP value during transportation, WM1 relates to the GWP value from waste management, and RT1 denotes the environmental impact arising from the reconditioning process. ‘MPn’, ‘BPn’, ‘Tn’, ‘RTn’, and ‘WMn’ indicate the cumulative environmental impact in the GWP category during material production, box production, transportation, reconditioning transportation, and waste management processes for n rotations of the box. For a single reuse cycle, the GWP environmental impact value y of a reusable box can be expressed as MP1+ BP1 + T1 + WM1 + RT1, where WM1 represents the environmental impact value generated when 1% of the boxes are discarded, and RT1 represents the environmental impact value associated with the transportation, cleaning, and repair processes of the remaining 99% of the boxes. For a second reuse cycle, the GWP environmental impact value y of the reusable box can be represented as MP1 + BP1 + WM1 + RC1 + MP2 + BP2 + WM2 + RC2. Here, MP2 and BP2 represent the environmental impact values incurred when 1% of the boxes discarded in the first cycle are newly manufactured. For reuse cycles beyond the second, the disposal and reconditioning flow of the boxes remains the same as in the first cycle, therefore, WM2 and RT2 values are equivalent to WM1 and RT1 values.

2.2. Life Cycle Inventory Analysis

2.2.1. Raw Material Acquisition Stage

Domestically produced EPS beads were used as raw materials for the EPS boxes. The materials for the VIP boxes, including the rPET bales used in the insulation sheet for the VIP pouches and the raw material for the rPET flakes used in the rPET bales, were also produced domestically. The average transportation distance between the rPET flake plant and the rPET bale manufacturing facility was 75 km, and the transportation distance between the rPET bale manufacturing facility and the VIP pouch manufacturing facility was 5 km. The raw materials for the EPE boxes were produced overseas, and the transportation distance between the raw material source and the box manufacturing facility was 108 km. The defect rate during the production of rPET bales was identified to be 2%, based on an investigation of the rate of defective items to total production.

2.2.2. Box Manufacturing Stage

Foaming, shaping, and packaging of the EPS boxes were performed by a domestic EPS box manufacturer. Data on water, electricity, gas consumption, and packaging materials (linear low-density polyethylene [LLDPE] film, PP band) used during the box manufacturing stage were obtained from a leading domestic EPS box manufacturer in 2021. Data for materials (PE plastic bag) used in box packaging were referenced from the European EPS Industry Association’s (EUMEPS) “Life Cycle Assessment of the Industrial Use of Expanded Polystyrene Packaging in Europe Case Study Packaging System for TV sets” report [17].
VIP pouches were produced through a conversion process in which film pouches produced in overseas factories were vacuum-packed with rPET insulation sheets and virgin PET in a domestic factory. Materials other than VIP pouches and VIP boxes were assumed to be produced overseas, and data from overseas manufacturers were used for the analysis. The transportation distance between the overseas film pouch factory producing PE tape and film pouch materials (aluminum, nylon, PET, and LLDPE) and the domestic VIP pouch manufacturing facility was 2838 km. The transportation distance between the domestic VIP pouch manufacturing facility and the overseas VIP box manufacturing facility was 4084 km. The transportation distance between the overseas VIP box manufacturing facility and the domestic distribution center was 3936 km. The defect rate during the laser cutting process for manufacturing rPET insulation sheets was observed to be 5% based on an investigation of the rate of defective items compared with the total production. Raw material production and box manufacturing for EPE boxes were performed in an overseas factory, and the transportation distance between the overseas factory and the domestic distribution center was 1798 km.

2.2.3. EPS Box Distribution Stage

The distance between the raw material production facility and the box manufacturing facility for the EPS boxes was 500 km, whereas the transportation distance between the box manufacturing facility and the fresh food manufacturing plant was 120 km. Fresh food and refrigerants were packed for transportation to fresh food manufacturing plants. The transportation distance between the fresh food manufacturing plant and the customer was 41 km (averaged based on distribution ratios by distributors). The transportation distance from the consumer to the EPS box recycling company was 15 km. For transportation, a total of 1.56 kg comprising three ice packs (each weighing 0.52 kg), was used as a refrigerant. The ice packs contained water, and the packaging material used was low-density polyethylene. Approximately, 3 kg of fresh food was transported.

2.2.4. Reuse Stage of VIP Boxes and EPE Boxes

For the VIP and EPE boxes, a recovery route that included the distribution, cleaning, and repair of the boxes was created based on data from a large food distribution company. The domestic distribution and reuse routes were assumed to be the same each time. The average transportation distance between the investigated domestic distribution center and the subterminal was 44 km, and transportation was carried out using an 11-ton truck. The distribution center was in charge of transporting fresh food, and the subterminal was in charge of transporting refrigerants (ice bags) and cleaning boxes recovered after use. The average transportation distance between domestic subterminals and customers was 8.7 km, and transportation was carried out using 1-ton trucks. The average transportation distance between customers and the domestic recovery center was 60 km, and transportation was carried out using 1-ton trucks. The average transportation distance between the recovery and fulfillment centers was 65 km, and transportation was carried out using 1-ton trucks. In addition, 99% of the boxes after use were reused, and 1% were newly produced to replace the boxes discarded after disposal, which indicates that 99% of the boxes were collected for reuse and 1% were discarded in this study [19]. In the case of VIP and EPE boxes, the number of reuses was determined based on the average number obtained by distributing 500 reused containers from major domestic reusable logistics container companies from October 2021 to May 2023. The average number of usable reuse cycles was set to 300.

2.2.5. Disposal Stage

The amount of electricity used for the processes of grinding and compression during the recycling stage of the boxes was obtained from data provided by a domestic EPS waste processing company. The heat generation value (CV) during the incineration of EPS and reusable boxes was assumed to be 40 MJ [33]. The disposal rates were set according to the 2020 statistics for packaging waste generation and recycling in South Korea by the Korea Environmental Corporation, with 88% recycling, 9% incineration, and 3% landfilling [34]. For the VIP and EPE boxes, the disposal rates were set based on 2021 statistical data from the Ministry of Environment, with recycling at 56.7%, incineration at 24.9%, and landfill at 12.9% [35]. The average transportation distance between customers and the EPS, VIP, and EPE box recycling companies was 60 km, and transportation was carried out using 1-ton trucks. The distance data for the manufacturing, transportation, disposal, and reconditioning processes are presented in Table S1.

2.3. Life Cycle Impact Assessment

The Simapro v9.4.0.2 program, together with the Ecoinvent v3 database, was employed in this investigation. Furthermore, the ReCiPe 2016 Midpoint (H) V1.05 was employed as the comprehensive process effect evaluation methodology in the present investigation. The environmental impacts were subjected to analysis and evaluation through a process of classification into a total of 18 distinct impact categories: global warming; stratospheric ozone depletion; ionizing radiation; ozone formation; human health; fine particulate matter; terrestrial ecosystems and acidification; freshwater and marine eutrophication; terrestrial, freshwater, and marine ecotoxicity; human carcinogenic (and non-carcinogenic) toxicity; land use; mineral resource and fossil resource scarcity; and water consumption.

3. Results and Discussion

Based on the results of the environmental impact assessment, when comparing the environmental impact values in the global warming potential (GWP) category for each box, the total environmental burden of an EPS box throughout its life cycle was 3.67 kg carbon dioxide (CO2) eq. In one cycle, the VIP boxes were identified to have an environmental burden of 20.86 kg CO2 eq, while the EPE boxes had an environmental burden of 35.03 kg CO2 eq. Furthermore, when used once, all three boxes indicated that the most significant environmental impact occurred during the material production phase. The environmental impact values for each box in each life-cycle stage for a single use are listed in Table 2, Table 3 and Table 4. When considering two cycles, the VIP boxes had an environmental burden of 0.39 kg CO2 eq, and the EPE boxes, 0.82 kg CO2 eq. From the analysis based on the EPE boxes’ average annual rotation count of 85 times, the results indicated that the EPS boxes had an environmental burden of 311.71 kg CO2 eq; the VIP boxes, 53.37 kg CO2 eq; and EPE boxes, 104.34 kg CO2 eq. The VIP boxes demonstrated an 83% lower environmental burden than the EPS boxes, whereas the EPE boxes exhibited a 66% lower environmental burden compared to the other boxes. Considering the average reuse count of 300 rotations for reusable logistics containers with VIP, the analysis revealed that the EPS boxes had an environmental burden of 1100.15 kg CO2 eq; the VIP boxes, 136.58 kg CO2 eq; and the EPE boxes, 281.72 kg CO2 eq. The VIP boxes displayed an 87% lower environmental burden than the EPS boxes, whereas the EPE boxes exhibited a 74% lower environmental burden in comparison to the other boxes. The environmental impact values for each box in each lifecycle stage for 300 cycles are listed in Table 5, Table 6 and Table 7. The GWP values for each box in each life-cycle stage for one cycle and 300 cycles are displayed in Figure 6.
When the environmental impact values for EPS were equivalent, the number of rotations for the VIP boxes and EPE boxes was analyzed to be seven rotations for the VIP boxes and 12 rotations for the EPE boxes. When the environmental impact values for EPS were low, at 30%, the number of rotations was 10 for the VIP boxes and 20 for the EPE boxes. The cumulative GWP values based on the usage frequency of each box are displayed in Figure 7.

4. Conclusions

In this study, all life cycle stages of the r-PET VIP and EPE-reusable boxes were quantitatively assessed and compared with the life cycle environmental impacts of single-use EPS boxes. The effects of the repeated use of reusable boxes were also analyzed.
According to the LCA, for single use, the VIP boxes exhibited a 5.7 times higher GWP environmental impact than the EPS boxes, and the EPE boxes demonstrated a 9.5 times higher impact compared to the other boxes. However, as the number of rotations of the reusable boxes increased, the GWP values for one additional rotation were lower than the impact of using an EPS box for one rotation. Consequently, with increasing rotations, the GWP impact of the VIP boxes became equivalent to that of the EPS boxes at seven rotations and for the EPE boxes at 12 rotations. Furthermore, using 300 rotations as a benchmark, the VIP boxes demonstrated an 87% reduction in the environmental impact compared to the EPS boxes, whereas the EPE boxes displayed a 74% reduction. This suggests that the use of reusable boxes in industrial settings can significantly reduce plastic resource consumption and enhance resource circularity. In this study, the use of the reusable logistics packaging, including rPET, was observed to have a higher value than the environmental impact of the reusable EPE materials. This indicates that employing VIP boxes for reuse in Korea can generate substantial added value. In addition, our findings can inform policy and industry decisions to promote more sustainable practices in the food industry. We believe that our research contributes to the advancement of sustainability by providing a comprehensive analysis of the environmental impacts of different packaging options and highlighting the importance of considering the entire life cycle of packaging.

Supplementary Materials

The following supporting information can be downloaded at https://www.mdpi.com/article/10.3390/su152316448/s1: Figure S1: System boundary of r-PET insulation sheet and VIP pouch; Figure S2. Potential impact results for scenario 1 (one cycle); Figure S3. Potential impact results for scenario 2 (one cycle); Figure S4. Potential impact results for Scenario 3 (one cycle); Figure S5. Potential impact results for scenario 4 (one cycle); Figure S6. Potential impact results for scenario 1 (300 cycles); Figure S7. Potential impact results for scenario 2 (300 cycles); Figure S8. Potential impact results for scenario 3 (300 cycles); Figure S9. Potential impact results for scenario 4 (300 cycles); Figure S10. The fine particulate matter formation results for the scenarios are listed in Table S1. Transportation distance of EPS box; Table S2. Transportation and Reconditioning transportation distance of VIP box; Table S3. Transportation and Reconditioning transportation distance of the EPE box.

Author Contributions

Conceptualization, S.Y.K. and D.H.K.; methodology, S.Y.K. and Y.J.S.; validation, S.Y.K. and Y.J.S.; investigation, S.Y.K., K.C. and Y.J.S.; formal analysis, S.Y.K. and Y.J.S.; data curation, S.Y.K. and J.R.R.; writing—original draft, S.Y.K.; visualization, S.Y.K.; review and editing, Y.J.S. and D.H.K.; supervision, H.J.P. All authors have read and agreed to the published version of the manuscript.

Funding

This research was funded by the Ministry of Trade, Industry & Energy (MOTIE, Republic of Korea): 20015687.

Institutional Review Board Statement

Not applicable.

Data Availability Statement

Data are contained within the article and Supplementary Materials.

Acknowledgments

This work was supported by the Technology Innovation Program (or Industrial Strategic Technology Development Program–Clean Factory Technology Development Project) (20015687, Development of thermal packaging box using eco-friendly insulation material for environmental load reduction) funded by the Ministry of Trade, Industry & Energy (MOTIE, Republic of Korea).

Conflicts of Interest

Jae-Ryeong Ryu is affiliated with AIMT Corporation. The authors declare no conflicts of interest. The funders had no role in the study design; collection, analyses, or interpretation of data; writing of the manuscript; or decision to publish the results.

References

  1. Kim, S.-H.; Lee, M.-A.; Jung, H.-M. Packaging Design of EPS Cooling Box by Theoretical Heat Flow and Random Vibration Analysis. Korean J. Packag. Sci. Technol. 2021, 27, 175–180. [Google Scholar] [CrossRef]
  2. Lee, G.-I.; Kim, S.-H.; Shin, S.-Y. Report on Agricultural Household Activity, 16–2021 Research Data-2; Korea Rural Economic Institute: Naju, Republic of Korea, 2021; pp. 7–32. [Google Scholar]
  3. Strand, J.; Feld, L.; Bach, L. Survey of Polystyrene Foam (EPS and XPS) in the Baltic Sea; Aarhus University: Aarhus, Denmark, 2019. [Google Scholar]
  4. Korea Environment Corporation. Generation and Recycling Amounts of Packaging Waste for EPR (Extended Producer Responsibility) Target in 2021; Korea Resource Recirculation Information System: Seoul, Republic of Korea, 2021. [Google Scholar]
  5. Fischer, C.L.J.H.E. EPS Post-Consumer Waste Generation and Management in European Countries; EUMEPS-European Association of EPS: Brussels, Belgium, 2017. [Google Scholar]
  6. Choi, J.S. Trends in EPS Production and Recycling in the Packaging Industry; Korea Styrene Foam Recycling Association: Seoul, Republic of Korea, 2013. [Google Scholar]
  7. Choi, J.S. Consumption Trends of EPS in the Packaging Industry; Korea Styrene Foam Recycling Association: Seoul, Republic of Korea, 2006. [Google Scholar]
  8. Kim, D.S. Supply Trends and Prospects of EPS Packaging Materials from a Recycling Perspective; Korea Styrene Foam Recycling Association: Seoul, Republic of Korea, 2014. [Google Scholar]
  9. Resalati, S.; Kendrick, C.C.; Hill, C. Embodied energy data implications for optimal specification of building envelopes. Build. Res. Inf. 2019, 48, 429–445. [Google Scholar] [CrossRef]
  10. Alam, M.; Singh, H.; Limbachiya, M. Vacuum Insulation Panels (VIPs) for building construction industry—A review of the contemporary developments and future directions. Appl. Energy 2011, 88, 3592–3602. [Google Scholar] [CrossRef]
  11. Kalnæs, S.E.; Jelle, B.P. Vacuum insulation panel products: A state-of-the-art review and future research pathways. Appl. Energy 2014, 116, 355–375. [Google Scholar] [CrossRef]
  12. Baetens, R.; Jelle, B.P.; Thue, J.V.; Tenpierik, M.J.; Grynning, S.; Uvsløkk, S.; Gustavsen, A. Vacuum insulation panels for building applications: A review and beyond. Energy Build. 2010, 42, 147–172. [Google Scholar] [CrossRef]
  13. Fantucci, S.; Lorenzati, A.; Capozzoli, A.; Perino, M. Analysis of the temperature dependence of the thermal conductivity in Vacuum Insulation Panels. Energy Build. 2018, 183, 64–74. [Google Scholar] [CrossRef]
  14. Gonçalves, M.; Simões, N.; Serra, C.; Flores-Colen, I. A review of the challenges posed by the use of vacuum panels in external insulation finishing systems. Appl. Energy 2019, 257, 114028. [Google Scholar] [CrossRef]
  15. The European Manufacturers of Expanded Polystyrene (EUMEPS) Association. P. s. Life Cycle Assessment of the Industrial Use of Expanded Polystyrene Packaging in Europe. Case Study: Comparison of Three Fishbox Solutions; PWC Sustainable Business Solutions: Neuilly sur Seine, France, 2011. [Google Scholar]
  16. Resalati, S.; Okoroafor, T.; Henshall, P.; Simões, N.; Gonçalves, M.; Alam, M. Comparative life cycle assessment of different vacuum insulation panel core materials using a cradle to gate approach. J. Affect. Disord. 2020, 188, 107501. [Google Scholar] [CrossRef]
  17. Life Cycle Assessment of the Industrial Use of Expanded Polystyrene Packaging in Europe Case Study Packaging System for TV Sets; PWC Sustainable Business Solutions: Neuilly sur Seine, France, 2011.
  18. Accorsi, R.; Cascini, A.; Cholette, S.; Manzini, R.; Mora, C. Economic and environmental assessment of reusable plastic containers: A food catering supply chain case study. Int. J. Prod. Econ. 2014, 152, 88–101. [Google Scholar] [CrossRef]
  19. Tua, C.; Biganzoli, L.; Grosso, M.; Rigamonti, L. Life Cycle Assessment of Reusable Plastic Crates (RPCs). Resources 2019, 8, 110. [Google Scholar] [CrossRef]
  20. Coopers, P.W. Life Cycle Assessment of the Industrial Use of Expanded Polystyrene Packaging in Europe. Case Study: Packaging System for TV sets. Prepared for the European Manufacturers of Expanded Polystyrene; PWC: London, UK, 2001; Volume 2, pp. 1–4. [Google Scholar]
  21. Ross, S.; Evans, D. The environmental effect of reusing and recycling a plastic-based packaging system. J. Clean. Prod. 2003, 11, 561–571. [Google Scholar] [CrossRef]
  22. Tan, R.B.; Khoo, H.H. Life cycle assessment of EPS and CPB inserts: Design considerations and end of life scenarios. J. Environ. Manag. 2005, 74, 195–205. [Google Scholar] [CrossRef] [PubMed]
  23. Bishop, G.; Styles, D.; Lens, P.N. Environmental performance of bioplastic packaging on fresh food produce: A consequential life cycle assessment. J. Clean. Prod. 2021, 317, 128377. [Google Scholar] [CrossRef]
  24. Guangnian, X.; Qiongwen, L.; Anning, N.; Zhang, C. Research on carbon emissions of public bikes based on the life cycle theory. Transp. Lett. 2022, 15, 278–295. [Google Scholar] [CrossRef]
  25. Alam, M.; Singh, H.; Brunner, S.; Naziris, C. Experimental characterisation and evaluation of the thermo-physical properties of expanded perlite—Fumed silica composite for effective vacuum insulation panel (VIP) core. Energy Build. 2014, 69, 442–450. [Google Scholar] [CrossRef]
  26. Singh, H.; Geisler, M.; Menzel, F. Experimental investigations into thermal transport phenomena in vacuum insulation panels (VIPs) using fumed silica cores. Energy Build. 2015, 107, 76–83. [Google Scholar] [CrossRef]
  27. Kim, J.; Lee, J.-H.; Song, T.-H. Vacuum insulation properties of phenolic foam. Int. J. Heat Mass Transf. 2012, 55, 5343–5349. [Google Scholar] [CrossRef]
  28. Saleh, Y. Comparative life cycle assessment of beverages packages in Palestine. J. Clean. Prod. 2016, 131, 28–42. [Google Scholar] [CrossRef]
  29. Almeida, C.; Rodrigues, A.; Bonilla, S.; Giannetti, B. Emergy as a tool for Ecodesign: Evaluating materials selection for beverage packages in Brazil. J. Clean. Prod. 2010, 18, 32–43. [Google Scholar] [CrossRef]
  30. Fan, L.; Khodadadi, J.M. Thermal conductivity enhancement of phase change materials for thermal energy storage: A review. Renew. Sustain. Energy Rev. 2011, 15, 24–46. [Google Scholar] [CrossRef]
  31. Buratti, C.; Belloni, E.; Lunghi, L.; Barbanera, M. Thermal conductivity measurements by means of a new ‘Small Hot-Box’apparatus: Manufacturing, calibration and preliminary experimental tests on different materials. Int. J. Thermophys. 2016, 37, 1–23. [Google Scholar] [CrossRef]
  32. Archdaily. Available online: https://www.archdaily.com/898843/how-to-calculate-the-thermal-transmittance-u-value-in-the-envelope-of-a-building (accessed on 29 July 2023).
  33. Das, P.; Tiwari, P. Valorization of packaging plastic waste by slow pyrolysis. Resour. Conserv. Recycl. 2018, 128, 69–77. [Google Scholar] [CrossRef]
  34. 2020 Packaging Waste Generation and Recycling Amount Subject to Extended Producer Responsibility (EPR). Available online: https://www.recycling-info.or.kr/rrs/stat/envStatDetail.do;jsessionid=tifAGY8No10CWAfoB1c4fflPWI3R7soQ93GQe8W67BeZFr5v70ryedksSYeNYPwr.RCIS-WAS_servlet_engine1?bbsId=BBSMSTR_000000000002&nttId=1211&s_nttSj=KEC013 (accessed on 2 March 2023).
  35. National Waste Generation and Disposal Status. 2021. Available online: https://www.recycling-info.or.kr/rrs/stat/envStatDetail.do?menuNo=M13020201&pageIndex=1&bbsId=BBSMSTR_000000000002&s_nttSj=KEC005&nttId=1296&searchBgnDe=&searchEndDe= (accessed on 30 December 2022).
Figure 1. Picture of EPS box, VIP box, EPE box.
Sustainability 15 16448 g001
Figure 2. System boundary of EPS box.
Sustainability 15 16448 g002
Figure 3. System boundary of VIP box.
Sustainability 15 16448 g003
Figure 4. System boundary of EPE box.
Sustainability 15 16448 g004
Figure 5. Simplified chart of the life cycle of EPS boxes, VIP boxes, and EPE boxes as the number of rotations changes.
Sustainability 15 16448 g005
Figure 6. Global warming potential results for scenarios.
Sustainability 15 16448 g006
Figure 7. Potential impact results for scenarios (cumulative GWP).
Sustainability 15 16448 g007
Table 1. Weight, thickness, and specifications of each box at functional unit.
EPS BoxVIP Box EPE Box
Weight (kg)1.224.548.16
Thickness (mm)115.833.12167.59
Specification (mm)684 × 592 × 568561 × 451 × 376781 × 666 × 536
Table 2. Potential impact results for EPS box scenarios (1 cycle).
EPS Box
Impact CategoryUnitMaterial ProductionBox ProductionTransportationWaste Management
Global warmingkg CO2 eq7.23 × 10⁺⁰7.43 × 10⁻⁴8.18 × 10⁻¹−4.38 × 10⁺⁰
Stratospheric ozone depletionkg CFC11 eq1.02 × 10⁻⁶2.99 × 10⁻¹⁰2.78 × 10⁻⁷−1.71 × 10⁻⁷
Ionizing radiationkBq Co-60 eq3.15 × 10⁻¹8.93 × 10⁻⁵1.52 × 10⁻²−1.77 × 10⁻¹
Ozone formation, Human healthkg NOx eq1.52 × 10⁻²1.59 × 10⁻⁶4.84 × 10⁻³−7.81 × 10⁻³
Fine particulate matter formationkg PM2.5 eq5.51 × 10⁻³1.61 × 10⁻⁶1.21 × 10⁻³−3.97 × 10⁻³
Ozone formation, Terrestrial ecosystemskg NOx eq1.80 × 10⁻²1.60 × 10⁻⁶4.92 × 10⁻³−8.19 × 10⁻³
Terrestrial acidificationkg SO2 eq1.48 × 10⁻²2.43 × 10⁻⁶2.90 × 10⁻³−1.12 × 10⁻²
Freshwater eutrophicationkg P eq9.95 × 10⁻⁴3.56 × 10⁻⁷8.30 × 10⁻⁵−5.09 × 10⁻⁴
Marine eutrophicationkg N eq9.72 × 10⁻⁵3.09 × 10⁻⁸8.00 × 10⁻⁶−3.60 × 10⁻⁵
Terrestrial ecotoxicitykg 1,4-DCB3.99 × 10⁺⁰5.19 × 10⁻⁴8.46 × 10⁺⁰−1.29 × 10⁺⁰
Freshwater ecotoxicitykg 1,4-DCB6.68 × 10⁻²1.55 × 10⁻⁵2.39 × 10⁻²−1.70 × 10⁻²
Marine ecotoxicitykg 1,4-DCB9.19 × 10⁻²2.16 × 10⁻⁵3.67 × 10⁻²−2.30 × 10⁻²
Human carcinogenic toxicitykg 1,4-DCB1.90 × 10⁻¹3.35 × 10⁻⁵6.94 × 10⁻²−9.72 × 10⁻²
Human non-carcinogenic toxicitykg 1,4-DCB1.87 × 10⁺⁰5.80 × 10⁻⁴7.37 × 10⁻¹−5.99 × 10⁻¹
Land usem2a crop eq5.81 × 10⁻²2.74 × 10⁻⁵2.89 × 10⁻²−2.46 × 10⁻²
Mineral resource scarcitykg Cu eq2.90 × 10⁻³3.43 × 10⁻⁷2.24 × 10⁻³−1.22 × 10⁻³
Fossil resource scarcitykg oil eq3.20 × 10⁺⁰1.84 × 10⁻⁴2.69 × 10⁻¹−2.14 × 10⁺⁰
Water consumptionm38.99 × 10⁻²5.69 × 10⁻⁶1.66 × 10⁻³−5.94 × 10⁻²
Table 3. Potential impact results for VIP box scenarios (1 cycle).
VIP Box
Impact CategoryUnitMaterial ProductionBox ProductionTransportationReconditioning
Transportation
Waste Management
Global warmingkg CO2 eq1.35 × 10⁺¹4.29 × 10⁺⁰2.92 × 10⁺⁰3.30 × 10⁻¹−1.50 × 10⁻¹
Stratospheric ozone depletionkg CFC11 eq4.31 × 10⁻⁵1.38 × 10⁻⁶1.09 × 10⁻⁶2.20 × 10⁻⁷−5.67 × 10⁻⁷
Ionizing radiationkBq Co-60 eq3.24 × 10⁻¹1.08 × 10⁺⁰5.39 × 10⁻²1.97 × 10⁻²−2.60 × 10⁻²
Ozone formation, Human healthkg NOx eq3.01 × 10⁻²1.03 × 10⁻²2.03 × 10⁻²9.95 × 10⁻⁴−3.57 × 10⁻⁴
Fine particulate matter formationkg PM2.5 eq1.83 × 10⁻²6.20 × 10⁻³5.22 × 10⁻³6.24 × 10⁻⁴−1.99 × 10⁻⁴
Ozone formation, Terrestrial ecosystemskg NOx eq3.17 × 10⁻²1.04 × 10⁻²2.06 × 10⁻²1.02 × 10⁻³−3.67 × 10⁻⁴
Terrestrial acidificationkg SO2 eq4.99 × 10⁻²1.01 × 10⁻²1.27 × 10⁻²1.12 × 10⁻³−3.80 × 10⁻⁴
Freshwater eutrophicationkg P eq1.79 × 10⁻³2.97 × 10⁻³2.37 × 10⁻⁴1.10 × 10⁻⁴−7.73 × 10⁻⁵
Marine eutrophicationkg N eq3.40 × 10⁻⁴2.34 × 10⁻⁴2.17 × 10⁻⁵1.02 × 10⁻⁵−1.67 × 10⁻⁶
Terrestrial ecotoxicitykg 1,4-DCB1.60 × 10⁺¹3.19 × 10⁺⁰5.12 × 10⁺¹1.20 × 10⁺⁰−2.18 × 10⁻¹
Freshwater ecotoxicitykg 1,4-DCB3.02 × 10⁻¹1.29 × 10⁻¹5.49 × 10⁻²1.36 × 10⁻²−1.18 × 10⁻⁴
Marine ecotoxicitykg 1,4-DCB3.95 × 10⁻¹1.74 × 10⁻¹1.01 × 10⁻¹1.82 × 10⁻²−2.81 × 10⁻⁴
Human carcinogenic toxicitykg 1,4-DCB8.33 × 10⁻¹2.67 × 10⁻¹1.75 × 10⁻¹2.28 × 10⁻²−9.88 × 10⁻³
Human non-carcinogenic toxicitykg 1,4-DCB6.88 × 10⁺⁰4.36 × 10⁺⁰2.02 × 10⁺⁰3.03 × 10⁻¹−5.85 × 10⁻²
Land usem2a crop eq2.85 × 10⁻¹2.06 × 10⁻¹1.60 × 10⁻¹1.51 × 10⁻²−6.14 × 10⁻³
Mineral resource scarcitykg Cu eq2.56 × 10⁻²4.85 × 10⁻³5.08 × 10⁻³8.56 × 10⁻⁴−3.86 × 10⁻⁴
Fossil resource scarcitykg oil eq5.74 × 10⁺⁰1.12 × 10⁺⁰9.97 × 10⁻¹1.26 × 10⁻¹−6.33 × 10⁻²
Water consumptionm35.75 × 10⁺⁰3.36 × 10⁻²5.36 × 10⁻³8.83 × 10⁻³−1.43 × 10⁻³
Table 4. Potential impact results for EPE box scenarios (1 cycle).
EPE Box
Impact CategoryUnitMaterial ProductionBox ProductionTransportationReconditioning
Transportation
Waste Management
Global warmingkg CO2 eq2.68 × 10⁺¹7.76 × 10⁺⁰7.45 × 10⁻¹7.38 × 10⁻¹−2.59 × 10⁻¹
Stratospheric ozone depletionkg CFC11 eq2.71 × 10⁻⁵2.74 × 10⁻⁶2.83 × 10⁻⁷4.49 × 10⁻⁷−9.42 × 10⁻⁷
Ionizing radiationkBq Co-60 eq2.91 × 10⁻¹7.51 × 10⁻¹1.62 × 10⁻²3.79 × 10⁻²−4.65 × 10⁻²
Ozone formation, Human healthkg NOx eq5.36 × 10⁻²2.34 × 10⁻²5.38 × 10⁻³2.69 × 10⁻³−6.20 × 10⁻⁴
Fine particulate matter formationkg PM2.5 eq2.74 × 10⁻²1.64 × 10⁻²1.66 × 10⁻³1.34 × 10⁻³−3.45 × 10⁻⁴
Ozone formation, Terrestrial ecosystemskg NOx eq5.55 × 10⁻²2.49 × 10⁻²5.46 × 10⁻³2.75 × 10⁻³−6.37 × 10⁻⁴
Terrestrial acidificationkg SO2 eq8.21 × 10⁻²2.81 × 10⁻²4.50 × 10⁻³2.52 × 10⁻³−6.53 × 10⁻⁴
Freshwater eutrophicationkg P eq2.07 × 10⁻³2.99 × 10⁻³7.44 × 10⁻⁵2.11 × 10⁻⁴−1.37 × 10⁻⁴
Marine eutrophicationkg N eq3.01 × 10⁻⁴5.30 × 10⁻⁴6.84 × 10⁻⁶1.94 × 10⁻⁵−2.71 × 10⁻⁶
Terrestrial ecotoxicitykg 1,4-DCB1.29 × 10⁺¹1.44 × 10⁺¹7.57 × 10⁺⁰4.22 × 10⁺⁰−3.67 × 10⁻¹
Freshwater ecotoxicitykg 1,4-DCB2.38 × 10⁻¹2.14 × 10⁻¹1.75 × 10⁻²2.78 × 10⁻²3.02 × 10⁻⁴
Marine ecotoxicitykg 1,4-DCB3.12 × 10⁻¹2.94 × 10⁻¹2.76 × 10⁻²3.82 × 10⁻²1.59 × 10⁻⁴
Human carcinogenic toxicitykg 1,4-DCB5.86 × 10⁺⁰4.52 × 10⁻¹5.53 × 10⁻²5.08 × 10⁻²−1.71 × 10⁻²
Human non-carcinogenic toxicitykg 1,4-DCB5.03 × 10⁺⁰6.97 × 10⁺⁰5.49 × 10⁻¹6.54 × 10⁻¹−9.40 × 10⁻²
Land usem2a crop eq2.56 × 10⁻¹8.01 × 10⁻¹2.64 × 10⁻²3.33 × 10⁻²−1.06 × 10⁻²
Mineral resource scarcitykg Cu eq2.01 × 10⁻²1.02 × 10⁻²1.67 × 10⁻³1.84 × 10⁻³−6.52 × 10⁻⁴
Fossil resource scarcitykg oil eq1.30 × 10⁺¹2.01 × 10⁺⁰2.41 × 10⁻¹2.75 × 10⁻¹−1.08 × 10⁻¹
Water consumptionm37.67 × 10⁻¹1.71 × 10⁻¹1.45 × 10⁻³1.61 × 10⁻²−2.43 × 10⁻³
Table 5. Potential impact results for EPS box scenarios (300 cycle).
EPS Box
Impact CategoryUnitMaterial ProductionBox ProductionTransportationWaste Management
Global warmingkg CO2 eq2.17 × 10⁺³2.23 × 10⁻¹2.46 × 10⁺²−1.32 × 10³
Stratospheric ozone depletionkg CFC11 eq3.05 × 10⁻⁴8.97 × 10⁻⁸8.33 × 10⁻⁵ 5.12 × 10⁻⁵
Ionizing radiationkBq Co-60 eq9.46 × 10⁺¹2.68 × 10⁻²4.55 × 10⁺⁰−5.31 × 10⁺¹
Ozone formation, Human healthkg NOx eq4.55 × 10⁺⁰4.78 × 10⁻⁴1.45 × 10⁺⁰−2.34 × 10⁺⁰
Fine particulate matter formationkg PM2.5 eq1.65 × 10⁺⁰4.83 × 10⁻⁴3.62 × 10⁻¹−1.19 × 10⁺⁰
Ozone formation, Terrestrial ecosystemskg NOx eq5.39 × 10⁺⁰4.81 × 10⁻⁴1.48 × 10⁺⁰−2.46 × 10⁺⁰
Terrestrial acidificationkg SO2 eq4.44 × 10⁺⁰7.30 × 10⁻⁴8.69 × 10⁻¹−3.37 × 10⁺⁰
Freshwater eutrophicationkg P eq2.99 × 10⁻¹1.07 × 10⁻⁴2.49 × 10⁻²−1.53 × 10⁻¹
Marine eutrophicationkg N eq2.92 × 10⁻²9.26 × 10⁻⁶2.40 × 10⁻³−1.08 × 10⁻²
Terrestrial ecotoxicitykg 1,4-DCB1.20 × 10⁺³1.56 × 10⁻¹2.54 × 10⁺³−3.86 × 10⁺²
Freshwater ecotoxicitykg 1,4-DCB2.00 × 10⁺¹4.66 × 10⁻³7.18 × 10⁺⁰−5.09 × 10⁺⁰
Marine ecotoxicitykg 1,4-DCB2.76 × 10⁺¹6.47 × 10⁻³1.10 × 10⁺¹−6.90 × 10⁺⁰
Human carcinogenic toxicitykg 1,4-DCB5.69 × 10⁺¹1.00 × 10⁻²2.08 × 10⁺¹−2.92 × 10⁺¹
Human non-carcinogenic toxicitykg 1,4-DCB5.61 × 10⁺²1.74 × 10⁻¹2.21 × 10⁺²−1.80 × 10⁺²
Land usem2a crop eq1.74 × 10⁺¹8.22 × 10⁻³8.68 × 10⁺⁰−7.37 × 10⁺⁰
Mineral resource scarcitykg Cu eq8.71 × 10⁻¹1.03 × 10⁻⁴6.71 × 10⁻¹−3.67 × 10⁻¹
Fossil resource scarcitykg oil eq9.61 × 10⁺²5.51 × 10⁻²8.06 × 10⁺¹−6.41 × 10⁺²
Water consumptionm32.70 × 10⁺¹1.71 × 10⁻³4.99 × 10⁻¹−1.78 × 10⁺¹
Table 6. Potential impact results for VIP box scenarios (300 cycle).
VIP Box
Impact CategoryUnitMaterial ProductionBox ProductionTransportationReconditioning
Transportation
Waste Management
Global warmingkg CO2 eq5.37 × 10⁺¹1.71 × 10⁺¹1.17 × 10⁺¹9.90 × 10⁺¹−4.50 × 10⁺¹
Stratospheric ozone depletionkg CFC11 eq1.72 × 10⁻⁴5.52 × 10⁻⁶4.38 × 10⁻⁶6.60 × 10⁻⁵−1.70 × 10⁻⁴
Ionizing radiationkBq Co-60 eq1.29 × 10⁺⁰4.32 × 10⁺⁰2.16 × 10⁻¹5.91 × 10⁺⁰−7.79 × 10⁺⁰
Ozone formation, Human healthkg NOx eq1.20 × 10⁻¹4.11 × 10⁻²8.14 × 10⁻²2.98 × 10⁻¹−1.07 × 10⁻¹
Fine particulate matter formationkg PM2.5 eq7.31 × 10⁻²2.47 × 10⁻²2.09 × 10⁻²1.87 × 10⁻¹−5.97 × 10⁻²
Ozone formation, Terrestrial ecosystemskg NOx eq1.26 × 10⁻¹4.15 × 10⁻²8.27 × 10⁻²3.07 × 10⁻¹−1.10 × 10⁻¹
Terrestrial acidificationkg SO2 eq1.99 × 10⁻¹4.05 × 10⁻²5.09 × 10⁻²3.35 × 10⁻¹−1.14 × 10⁻¹
Freshwater eutrophicationkg P eq7.15 × 10⁻³1.19 × 10⁻²9.51 × 10⁻⁴3.31 × 10⁻²−2.32 × 10⁻²
Marine eutrophicationkg N eq1.36 × 10⁻³9.35 × 10⁻⁴8.71 × 10⁻⁵3.05 × 10⁻³−5.02 × 10⁻⁴
Terrestrial ecotoxicitykg 1,4-DCB6.37 × 10⁺¹1.27 × 10⁺¹2.05 × 10⁺²3.59 × 10⁺²−6.54 × 10⁺¹
Freshwater ecotoxicitykg 1,4-DCB1.21 × 10⁺⁰5.13 × 10⁻¹2.21 × 10⁻¹4.09 × 10⁺⁰−3.53 × 10⁻²
Marine ecotoxicitykg 1,4-DCB1.58 × 10⁺⁰6.93 × 10⁻¹4.05 × 10⁻¹5.47 × 10⁺⁰−8.43 × 10⁻²
Human carcinogenic toxicitykg 1,4-DCB3.32 × 10⁺⁰1.07 × 10⁺⁰7.05 × 10⁻¹6.85 × 10⁺⁰−2.96 × 10⁺⁰
Human non-carcinogenic toxicitykg 1,4-DCB2.74 × 10⁺¹1.74 × 10⁺¹8.12 × 10⁺⁰9.08 × 10⁺¹−1.76 × 10⁺¹
Land usem2a crop eq1.14 × 10⁺⁰8.21 × 10⁻¹6.42 × 10⁻¹4.52 × 10⁺⁰−1.84 × 10⁺⁰
Mineral resource scarcitykg Cu eq1.02 × 10⁻¹1.94 × 10⁻²2.05 × 10⁻²2.57 × 10⁻¹−1.16 × 10⁻¹
Fossil resource scarcitykg oil eq2.29 × 10⁺¹4.48 × 10⁺⁰4.00 × 10⁺⁰3.78 × 10⁺¹−1.90 × 10⁺¹
Water consumptionm32.29 × 10⁺¹1.34 × 10⁻¹2.15 × 10⁻²2.65 × 10⁺⁰−4.28 × 10⁻¹
Table 7. Potential impact results for EPE box scenarios (300 cycle).
EPE Box
Impact CategoryUnitMaterial ProductionBox ProductionTransportationReconditioning
Transportation
Waste Management
Global warmingkg CO2 eq1.07 × 10⁺²2.87 × 10⁺¹3.10 × 10⁺⁰2.21 × 10⁺²−7.76 × 10⁺¹
Stratospheric ozone depletionkg CFC11 eq1.08 × 10⁻⁴1.01 × 10⁻⁵1.17 × 10⁻⁶1.35 × 10⁻⁴−2.82 × 10⁻⁴
Ionizing radiationkBq Co-60 eq1.16 × 10⁺⁰2.95 × 10⁺⁰6.71 × 10⁻²1.14 × 10⁺¹−1.39 × 10⁺¹
Ozone formation, Human healthkg NOx eq2.14 × 10⁻¹7.72 × 10⁻²2.22 × 10⁻²8.06 × 10⁻¹−1.86 × 10⁻¹
Fine particulate matter formationkg PM2.5 eq1.09 × 10⁻¹6.06 × 10⁻²6.82 × 10⁻³4.02 × 10⁻¹−1.03 × 10⁻¹
Ozone formation, Terrestrial ecosystemskg NOx eq2.21 × 10⁻¹8.32 × 10⁻²2.25 × 10⁻²8.25 × 10⁻¹−1.91 × 10⁻¹
Terrestrial acidificationkg SO2 eq3.28 × 10⁻¹9.89 × 10⁻²1.84 × 10⁻²7.56 × 10⁻¹−1.96 × 10⁻¹
Freshwater eutrophicationkg P eq8.24 × 10⁻³1.17 × 10⁻²3.09 × 10⁻⁴6.32 × 10⁻²−4.11 × 10⁻²
Marine eutrophicationkg N eq1.20 × 10⁻³2.09 × 10⁻³2.85 × 10⁻⁵5.82 × 10⁻³−8.13 × 10⁻⁴
Terrestrial ecotoxicitykg 1,4-DCB5.14 × 10⁺¹3.49 × 10⁺¹3.15 × 10⁺¹1.27 × 10⁺³−1.10 × 10⁺²
Freshwater ecotoxicitykg 1,4-DCB9.48 × 10⁻¹8.02 × 10⁻¹7.36 × 10⁻²8.34 × 10⁺⁰9.06 × 10⁻²
Marine ecotoxicitykg 1,4-DCB1.25 × 10⁺⁰1.09 × 10⁺⁰1.16 × 10⁻¹1.15 × 10⁺¹4.78 × 10⁻²
Human carcinogenic toxicitykg 1,4-DCB2.34 × 10⁺¹1.64 × 10⁺⁰2.31 × 10⁻¹1.52 × 10⁺¹−5.12 × 10⁺⁰
Human non-carcinogenic toxicitykg 1,4-DCB2.01 × 10⁺¹2.62 × 10⁺¹2.30 × 10⁺⁰1.96 × 10⁺²−2.82 × 10⁺¹
Land usem2a crop eq1.02 × 10⁺⁰3.12 × 10⁺⁰1.10 × 10⁻¹1.00 × 10⁺¹−3.19 × 10⁺⁰
Mineral resource scarcitykg Cu eq8.02 × 10⁻²3.56 × 10⁻²6.99 × 10⁻³5.52 × 10⁻¹−1.96 × 10⁻¹
Fossil resource scarcitykg oil eq5.19 × 10⁺¹7.29 × 10⁺⁰1.00 × 10⁺⁰8.25 × 10⁺¹−3.24 × 10⁺¹
Water consumptionm33.06 × 10⁺⁰6.77 × 10⁻¹6.06 × 10⁻³4.84 × 10⁺⁰−7.28 × 10⁻¹
Disclaimer/Publisher’s Note: The statements, opinions and data contained in all publications are solely those of the individual author(s) and contributor(s) and not of MDPI and/or the editor(s). MDPI and/or the editor(s) disclaim responsibility for any injury to people or property resulting from any ideas, methods, instructions or products referred to in the content.

