Article

Exploring the Success Factors of Smart City Adoption via Structural Equation Modeling

1
Department of Computer Networks, College of Computer Sciences and Information Technology, King Faisal University, Al Hofuf 31982, Saudi Arabia
2
Department of Computer Science, Aqaba University of Technology, Aqaba 11947, Jordan
3
Management Department, College of Business Administration, Ajman University, Ajman 346, United Arab Emirates
4
School of Business, King Faisal University, Al-Ahsa 31982, Saudi Arabia
*
Authors to whom correspondence should be addressed.
Sustainability 2023, 15(22), 15915; https://doi.org/10.3390/su152215915
Submission received: 19 September 2023 / Revised: 14 October 2023 / Accepted: 23 October 2023 / Published: 14 November 2023
(This article belongs to the Special Issue Sustainable Smart Cities and Societies Using Emerging Technologies)

Abstract

:
This study investigated the roles of security and technological factors in the adoption of smart cities, with the aim of developing a deeper understanding of the key aspects of the successful adoption of smart cities in Jordanian traditional cities. This study developed a conceptual model to investigate the importance of security and technological factors in the adoption of smart cities. The proposed model was tested using the structural equation modeling method after collecting data from ICT experts. The findings of the study revealed that perceived security, perceived trust, and service quality play pivotal roles in enhancing the adoption of smart city services. Moreover, the results indicated that information security and information privacy positively impact intentions toward adopting smart city services. These research findings provide valuable insights into the critical factors that can drive the adoption of smart city services. Policymakers and academics could utilize this knowledge to devise and implement new strategies aimed at increasing the adoption of smart city services.

1. Introduction

In recent years, the majority of countries around the world have sought to improve the lives of their citizens by transforming traditional cities into smart cities [1]. This transformation makes the newest information and communication technologies available to citizens, improving sustainability and quality of life [2]. Although smart cities have many benefits, their adoption still faces critical challenges related to security and privacy issues, trust, and reliability [3]. In recent years, major advancements have been made in the field of information and communications technology, such as smart city technologies, the IoT, and mobile computing [3]. This has prompted a shift in many sectors concerning the delivery of these intelligent services via various technologies [4,5,6,7]. Smart city technologies are examples of such technologies, offering a number of significant opportunities for citizens to enhance their livability, productivity, and sustainability. Smart cities provide intelligent living that is delivered through various intelligent devices [8,9,10], and they have received increasing attention due to their efficiency, convenience, and flexibility [11,12,13].
The adoption of smart cities is considered a vital step in making life easier and more convenient for citizens. The adoption of smart city technologies among citizens is considered the most important step in ensuring the success of smart cities [14]. In addition, factors related to security and privacy are considered very important for the successful adoption of smart cities to address the risks that arise from their vulnerabilities. These factors also increase citizens’ trust. Ullah and Al-Turjman [15] revealed that these security- and trust-related factors are interrelated in the adoption of smart cities as citizens’ beliefs about privacy and security may affect their adoption of smart city technologies. Prior studies considered security and privacy as primary factors in predicting the adoption of new technologies [16]. A limited number of studies have addressed the roles of security- and privacy-related factors in the adoption of smart cities through conceptual models; these studies were focused on factors related to environmental, behavioral, and organizational issues and were missing critical factors such as security, risk, and privacy [17,18,19,20].
Despite the benefits that smart cities provide for citizens, the rate of the adoption of these technologies around the world is still low [21,22,23,24,25]. According to a study conducted by Cao et al. [26], the adoption percentage of smart cities is only 33%. There is a need to understand the factors associated with the adoption of smart cities to ensure their successful implementation. Regarding smart city adoption, there have been limited studies conducted in the literature [27,28,29,30] aimed at understanding the security factors related to the adoption of smart cities.
The objective of this research was to investigate the key security and technological factors that influence the adoption of smart cities by developing and validating a conceptual model using structural equation modeling (SEM). A study conducted by Alshuwaikhat [31] mainly focused on Saudi Arabia, a Middle Eastern country of the Arab world. They found that despite the technical support and infrastructure technologies in Saudi Arabia, its smart city adoption rate is still unsatisfactory [31]. Given this finding, this study aimed to answer the following question:
What are the primary critical success factors that could lead to the adoption of smart cities?

2. Literature Review

2.1. Related Works on Smart City Adoption Models

Various models have been developed to study the adoption of smart cities [32,33,34,35,36,37,38,39]. The majority of these studies [39,40,41,42,43,44,45] extended technology adoption theories, such as TAM, UTAUT, TBP, and TOE, to investigate the adoption of smart cities. The TAM explains the adoption of technology in terms of two main constructs: perceived ease of use and perceived usefulness [46,47,48,49,50,51,52]. The TAM has been widely applied in measuring the adoption of many types of technologies, such as cloud computing, the IoT, and smart cities [53,54,55,56,57,58]. Many researchers have demonstrated that the original version of the TAM can be used to understand adoption behavior with respect to new technologies [59,60,61,62,63,64]. The TAM could be useful in predicting the most important factors related to the adoption of smart cities.
A study used the TAM to predict the most important factors in the adoption of the Internet of Things [65]. Researchers [66] proposed a framework which used the TAM to investigate the primary determinants of smart city adoption. Although several models have provided a basis for studying smart city adoption, they have not included several important factors, such as security, privacy, and trust factors [67]. The majority of these models have focused on studying the adoption of smart cities in terms of organizational, environmental, and technological dimensions [68,69,70,71,72,73,74,75].
Several researchers have focused on understanding the most important technological factors that could improve the adoption of smart cities [76,77,78,79,80,81]. For instance, a study [82] indicated that technological factors have a significant impact on the successful adoption of IoT technologies. Another study [83] confirmed that technological factors are fundamental factors that ensure the success of smart city technology. Researchers [84] proved that there is a strong relationship between technological factors and the adoption of smart cities. Several previous studies [85,86,87,88] indicated that technological factors explain the adoption of new technologies in terms of functionality, facilitating conditions, and perceived usefulness.
Based on the above, this study aimed to address the identified research gap by proposing a security- and technological-factors-based model for the adoption of smart cities. This research aimed to help decision makers better understand the primary security and technological requirements for the successful adoption of smart cities.

2.2. Technology Adoption Models

Several technology adoption models have been used to provide structured frameworks for understanding how individuals, organizations, or societies adopt and integrate new technologies [89]. These models are powerful tools for researchers, policymakers, and businesses seeking to understand the factors that influence technology adoption decisions [90]. The Unified Theory of Acceptance and Use of Technology (UTAUT), proposed by Saprikis et al., offers a comprehensive framework by integrating elements from various prior models [91]. The UTAUT identifies four core constructs: Performance Expectancy, Effort Expectancy, Social Influence, and Facilitating Conditions. It also incorporates moderating factors such as gender, age, and experience [92]. This model is particularly useful for understanding the adoption of individual technologies in various contexts, and it has gained popularity for its ability to capture both performance-based and social factors that influence adoption decisions [93].
The Technology–Organization–Environment (TOE) Framework, developed by Tornatzky and Fleischer, focuses on technology adoption within organizational settings [94]. It identifies three key dimensions: technological factors, organizational factors, and environmental factors. By considering these dimensions, researchers can assess how the interplay between technology, an organization’s structure and culture, and external environmental factors influence technology adoption processes within businesses and institutions [95]. The Theory of Planned Behavior (TBP) is a widely recognized and influential model in the fields of social psychology and behavioral science [96]. It was originally developed by Ajzen in 1985 as an extension of his earlier work on the Theory of Reasoned Action (TRA). The TBP provides a structured framework for understanding and predicting human behavior, including technology adoption. The TBP model assumes that attitudes, subjective norms, and perceived behavioral control collectively influence an individual’s behavioral intentions which, in turn, predict their actual behavior. The predictive power of the model has been supported by extensive empirical research across various domains, including technology adoption [97]. The Technology Acceptance Model (TAM), developed by Fred Davis, centers on the adoption of individual technologies. The TAM suggests that users’ behavioral intentions and actual usage are influenced by two primary factors: the perceived ease of use (PEOU) and perceived usefulness (PU) of a technology [98]. This model highlights the importance of users’ perceptions in shaping their acceptance of new technologies. Its simplicity and applicability have made it widely used in studies concerning user interfaces, software, and other technology adoption scenarios [99].
Based on the above, the TAM, compared with other models, offers valuable insights into the important factors in the adoption of technology at the individual, organizational, or societal level. The TAM can help us understand the motivations, barriers, and success factors that shape the adoption of new technologies [100]. Researchers and practitioners can leverage this model to design more effective strategies for promoting technology adoption, whether it involves individuals embracing new gadgets or organizations implementing advanced systems [101]. The TAM was selected as a theoretical foundation for our proposed model in this study in order to explain the factors influencing the adoption of smart cities.

2.3. Smart Cities

The concept of a smart city represents a major transformation in urban cities driven by the use of smart technologies. The main goal of smart cities is to leverage cutting-edge technologies to create a more efficient, sustainable, and livable urban environment [102]. Smart cities represent a visionary approach to urban development that embraces technology and data as tools for addressing urban challenges and enhancing the quality of life of inhabitants [103]. By integrating key smart city elements such as infrastructure, data, mobility, sustainability, public services, resilience, inclusivity, and innovation, smart cities aspire to create urban environments that are not only efficient and sustainable but also more responsive to the evolving needs of a rapidly urbanizing world [104].
Smart cities have several important elements, including (1) infrastructure and connectivity: smart cities should have a robust and interconnected infrastructure. This includes high-speed broadband networks, sensor systems, and IoT (Internet of Things) devices that collect and transmit data [105]. These technologies serve as the core system of a city, enabling real-time monitoring and control over various functions ranging from transportation and utilities to public safety. (2) Data and information: smart cities thrive on data. They collect vast amounts of data from sensors, public records, and other sources. These data are then analyzed to gain insights into operations, helping city officials make informed decisions [106]. For example, data-driven solutions can optimize traffic flow, energy consumption, waste management, and more, ultimately leading to resource efficiency and cost savings. (3) Sustainability and environmental management: environmental sustainability is a central element of smart cities. Green infrastructure, energy-efficient buildings, and waste recycling programs are common features of smart urban planning [107]. They aim to reduce carbon emissions, minimize energy consumption, and promote the use of renewable energy sources. (4) Public services and governance: smart cities aim to make public services more accessible and responsive to citizens’ needs. This includes digitizing government services, enabling online citizen engagement, and enhancing public safety through technologies like surveillance cameras and predictive policing [108]. (5) Quality of life and inclusivity: the primary goal of smart cities is to improve the quality of life of all residents. This means ensuring inclusivity and accessibility for people of all backgrounds and abilities. Initiatives may include accessible public transportation, digital literacy programs, and affordable housing solutions [109]. (6) Safety and security: smart cities invest in advanced security systems to ensure the safety of their residents. This includes surveillance cameras, smart lighting, and data-driven policing to prevent and respond to criminal activities effectively [110].

2.4. The Role of Security Factors in Smart City Adoption

In recent years, smart city adoption research has gained an increasing amount of attention [111]. Some of these studies [112] extended technology adoption theories such as the TAM, UTAUT, and TBP to investigate decisions to adopt smart cities. Prior studies considered security and privacy the primary factors in predicting the adoption of new technologies [113]. A limited number of studies have addressed the role of security and technological factors in the adoption of smart cities; these studies focused on environmental, behavioral, and organizational factors, missing critical factors such as security, risk, privacy, and technology [114].
According to previous studies [115], the security and privacy dimensions are strongly associated with the adoption of new technologies. For instance, a study [116] revealed that security and privacy issues are critical aspects in the adoption of IoT technologies, which are considered a main component of smart cities. Another study [117] confirmed that security and privacy are primary issues in the adoption of smart cities. Smart cities rely on IoT devices, sensors, and smart devices, which have weaknesses that can allow an attacker to breach their systems.
In the context of a smart city, security refers to protecting the sensitive information of organizations and people from threats such as malicious attacks that could lead to data theft or damaged infrastructure [118]. In our research, the security factor was the main criterion in the proposed model, including information security, information privacy, perceived risk, and trust.
  • Information security
Information security is defined as the degree to which users feel that they will be secured against risks when using their devices in a smart city [119]. Providing security defense techniques to guarantee the security of users’ information, privacy, and transactions is a top priority for the successful adoption of smart cities. A study [120] indicated that users’ perceptions of information security are supported by providing robust security defense techniques such as multi-factor authentication, encryption, and validation. Another study [121] confirmed that the security of online services is considered the primary factor determining the success of smart cities. Therefore, we hypothesized that providing security procedures would increase the successful adoption of smart cities.
H1. 
Information security has a strong impact on the successful adoption of smart cities.
  • Information privacy
Information privacy is defined as the degree to which users can control their personal information in terms of how their information is used or shared with other parties. Smart city projects should guarantee the protection of users’ privacy and personal information. A study [122] indicated that privacy issues in smart systems are a primary concern in smart city projects. Another study [123] found that information privacy should be considered during the implementation of smart city infrastructure. Therefore, we proposed the following hypothesis:
H2. 
Information privacy has a strong impact on the successful adoption of smart cities.
  • Perceived security risk
In the context of smart cities, perceived risk refers to the degree to which prospective users perceive potential dangers to their personal information and devices [48]. This perceived risk has been identified as a significant hindrance to the adoption and utilization of new technologies. In the process of adopting a technology, users conduct a comparative assessment between the perceived risks associated with a particular technology and the benefits it offers in terms of convenience and utility. This perceived risk plays a pivotal role in influencing the final decision of whether to adopt the technology or not. Previous research [49,50,51,52] consistently demonstrated a negative correlation between perceived risk and the adoption of new technologies. Moreover, other studies [53,54,55] emphasized the vital link between perceived risk and technology adoption, suggesting that successful adoption is more likely when perceived risk levels are minimized. In light of these findings, our proposed model incorporates perceived risk as a key determinant of the successful adoption of smart cities. Thus, we hypothesized the following:
H3. 
Perceived risk exerts a significant impact on the successful adoption of smart cities.
  • Perceived trust
The trust placed by users in any new technology plays a pivotal role in determining its successful adoption [56]. In the context of smart cities, trust emerges as a primary determinant for their widespread usage and acceptance among users. The services offered by smart cities instill a sense of trust among users given the perceived absence of risks in their transactions and the associated benefits they receive. Notably, this trust factor also significantly influences users’ loyalty, especially when they place high levels of trust in the services provided by smart cities [57]. Conversely, a lack of trust in smart city systems can lead to reduced consumer loyalty and diminished trust in the overall ecosystem. With these considerations in mind, our study incorporated the trust factor into the proposed model to assess its impact on the successful adoption of smart cities. Thus, we posited the following hypothesis:
H4. 
Perceived trust exerts a substantial impact on the successful adoption of smart cities.

2.5. The Role of Technological Factors in Smart City Adoption

In the context of smart cities, technological aspects provide the required technical components, such hardware, software, technical support, and internet networks, to effectively build smart cities [44]. Technological aspects are related to the intelligent services that should be included in smart cities [45]. Several researchers have focused on identifying the most important technological factors that could improve the adoption of smart cities [46]. For instance, a study [47] indicated that technological factors have a significant impact on the successful adoption of IoT technologies. Another study [48] confirmed that technological factors are fundamental factors in ensuring the success of smart city technology. Researchers [49] proved that there is a strong relationship between technological factors and the adoption of smart cities. Several previous studies [50,51,52,53] indicated that technological factors explain the adoption of new technologies in terms of functionality, facilitating conditions, and perceived usefulness. Hence, in our research, technological factors were the main component of the proposed model and included five main factors: functionality, perceived ease of use, facilitating conditions, perceived usefulness, and service quality.

3. A Security- and Technological-Factors-Based Model for the Adoption of Smart Cities

To explore which user-perspective factors explain smart city adoption in higher education, a conceptual model was developed based on the TAM’s theory. The proposed framework incorporated constructs of the TAM to explain the possible acceptance or rejection of smart cities, as well as cognitive factors supporting the adoption of smart cities, in universities.
The TAM is one of several technology adoption models that has been widely applied to measure the adoption, acceptance, and use of smart cities [44,45,46,47]. The original version of the TAM can be used to understand usage behavior with respect to new technologies [48,49,50,51]. The TAM is an extended version of the original UTAUT model and represents a combination of constructs from several models, including the TPB, the TRA, and the TPB [52].
The TAM includes five constructs: perceived ease of use, perceived usefulness, attitude toward use, intention to use, and actual use [53]. Previous studies found that the TAM was better than other technology acceptance models at explaining the variance (R2) in usage behaviors (from 40% to 52%) and intention behavior (from 56% to 74%) [54]. In addition, the TAM was successfully used to predict users’ behavioral intentions and teachers’ attitudes toward online learning systems [55]. The TAM was selected as a theoretical foundation for our proposed model in this study in order to explain the factors influencing users’ continuous intention to use smart cities. 
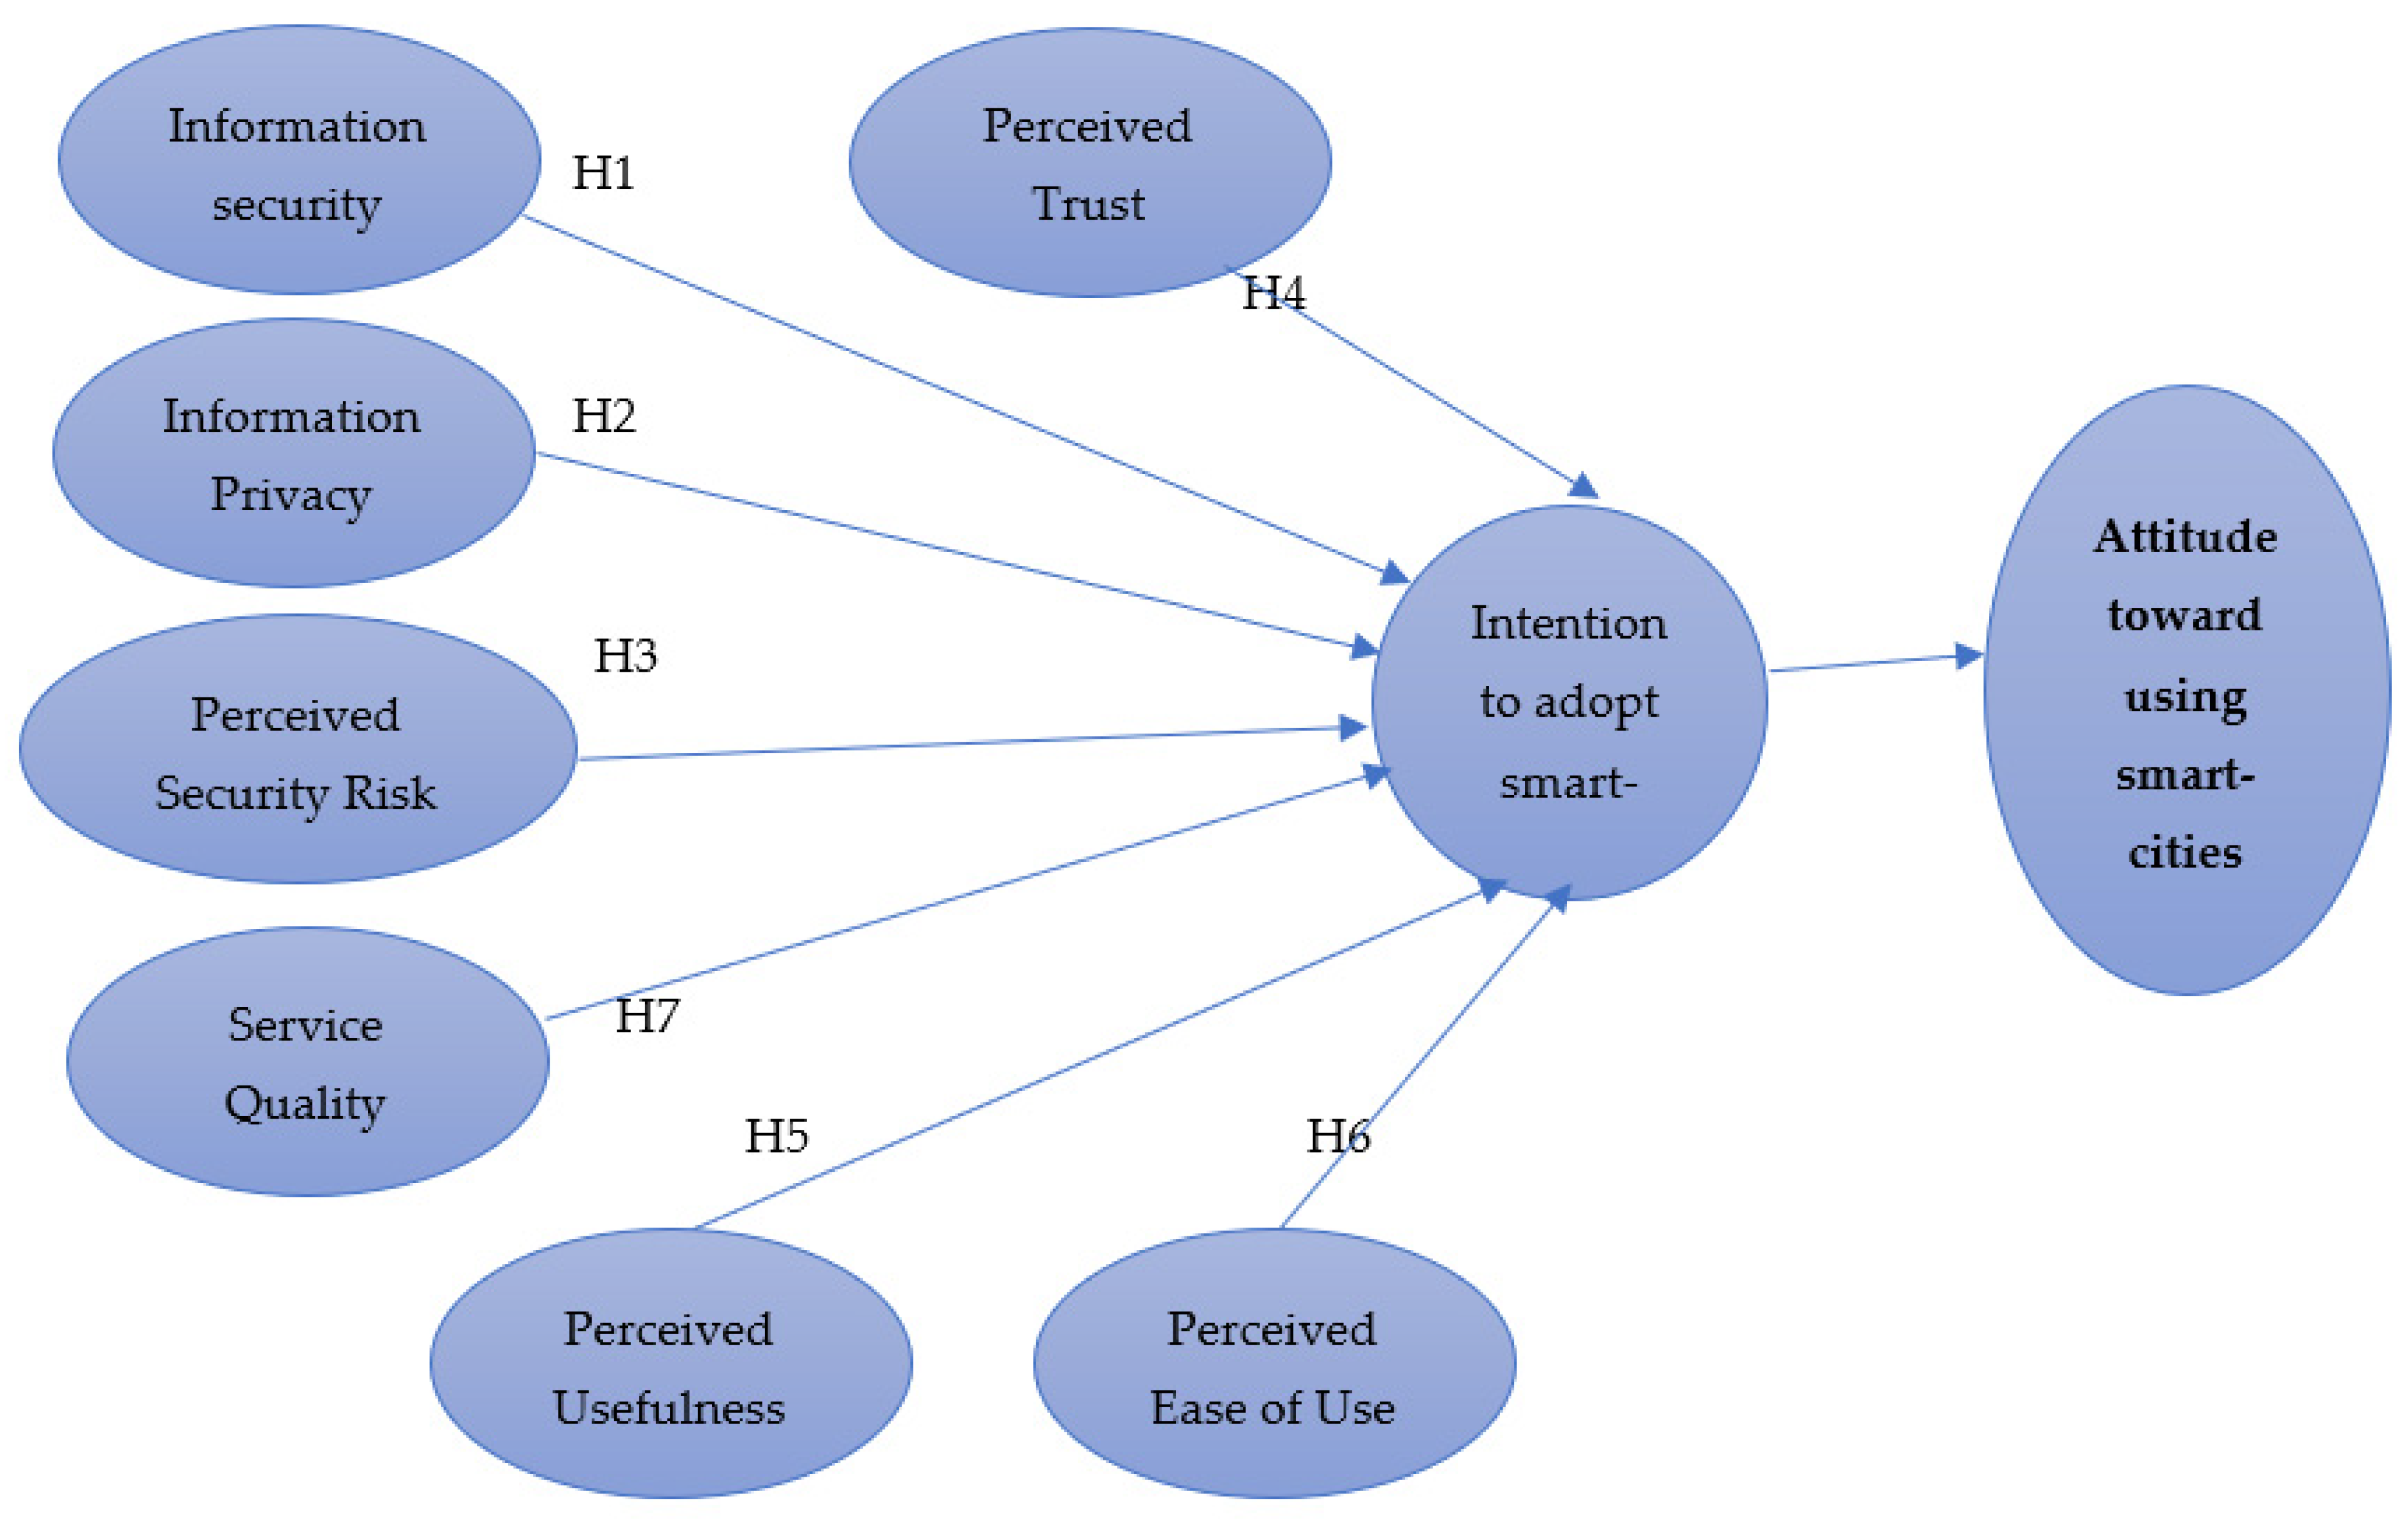
Figure 1 presents the proposed model of this research.

3.1. Perceived Usefulness

Within the scope of this study, perceived usefulness was defined as the extent to which the utilization of a smart city application offers tangible benefits to clients when conducting financial transactions [59]. Extensive prior research [60,61,62,63] established perceived usefulness as a potent predictor within the Technology Acceptance Model (TAM), exerting a positive influence on the attitude toward using technology. In the realm of e-banking, studies [64,65] have further corroborated this by demonstrating a positive correlation between perceived usefulness and users’ intentions to adopt e-banking systems. Given this background, we anticipated that perceived usefulness would assume a pivotal role in encouraging bank clients to embrace and utilize smart city applications, particularly if they perceived tangible benefits from adopting this novel technology. Consequently, we formulated the following hypothesis:
H5. 
Perceived usefulness exerts a positive effect on the attitude toward adopting smart city services.

3.2. Perceived Ease of Use

Perceived ease of use was the second predictor within the Technology Acceptance Model (TAM). In the context of this study, it pertains to the level of ease associated with utilizing a smart city application. We assumed that when bank clients perceived a smart city application to be user-friendly and easy to navigate, it would enhance the likelihood of its adoption. Furthermore, if interactions with a smart city application were characterized by simplicity, clarity, and ease of understanding, it would foster positive attitudes toward using the technology. Existing research [66,67,68] points toward perceived ease of use as the most influential predictor in the TAM, positively impacting the attitude toward using technology. This observation has been substantiated in studies focusing on e-banking [69,70] which demonstrated a positive relationship between perceived ease of use and users’ intentions to adopt e-banking systems. Hence, in our study, perceived ease of use was assumed to play a crucial role in motivating users to adopt and utilize smart city applications, particularly if they expected a seamless experience with this technology. Thus, we proposed the following hypothesis:
H6. 
The perceived ease of use exerts a positive effect on the attitude toward using smart city services.

3.3. Service Quality

The paramount importance of excellent service quality in the success of smart city applications cannot be overstated. Users assess the quality of smart city services based on their experiences with an application and the perceived value it offers them. Prior research [74,75,76,77] has consistently shown that higher service quality results in higher perceived value, leading to more positive attitudes toward using the technology. As service quality serves as a metric for evaluating the benefits of an application or product’s services, a higher value of a smart city application would be perceived if it offered superior service quality. When users perceive a smart city application as providing high-quality services that meet their expectations, it will significantly increase the likelihood of their adoption of the application. Previous studies [78,79,80] highlighted service quality as a potent predictor in the Delone and Mclean model which positively influences the actual usage of technology. Similar findings have been observed in studies focusing on e-banking [81,82,83,84] in which service quality demonstrated a positive relationship with users’ intentions to use e-banking systems. Hence, in our study, service quality was assumed to play a critical role in encouraging users to adopt and utilize smart city applications, particularly if they expected high-quality services from the technology. Consequently, we proposed the following hypothesis:
H7. 
Service quality exerts a positive effect on the attitude toward using smart city services.

3.4. Intention to Adopt Smart City Applications

As per the Technology Acceptance Model (TAM), intention to use refers to the subjective probability of a user adopting a smart city application. Among the various predictors in the TAM and other technology acceptance models such as the UTAUT and TRA, the attitude toward using a technology stands out as significant. Studies focused on e-banking [85,86,87] have consistently demonstrated a positive relationship between users’ attitudes toward use and their intentions to use e-banking systems. Drawing from this understanding, our study emphasized the pivotal role of attitude toward use in predicting users’ adoption and utilization of smart city applications. Thus, we proposed the following hypothesis:
H8. 
The intention to adopt exerts a positive effect on the attitude toward using smart city services.

4. Methodology

4.1. Data Collection Method

This study used a quantitative research methodology appropriate for studying users’ reactions to smart city acceptance or rejection, as well as cognitive factors which may support the adoption of smart cities, in Jordanian universities [78]. The use of a quantitative method included all proposed factors in the research model.

4.2. Participants

We selected research participants who used a smart city system during COVID-19. Data were collected from 445 university users from three Jordanian universities who used Blackboard on their mobile devices to attend courses during the pandemic. The participants were approached directly by course instructors at the three Jordanian universities. The author discussed the research with the course instructors directly prior to the selection of participants. Online questionnaires were distributed for data collection, using an online link delivered to the participants’ email addresses. Most of the invited participants agreed to participate in the study.

4.3. Measurement Instrument

We established a strong survey instrument to adequately measure smart city adoption among users which was based on an extensive literature review of articles and conference papers published on the TAM between 2020 and 2022. We adopted TAM items from previous studies (Appendix A). The items of perceived ease of use and perceived usefulness were extended from the study conducted by researchers [80]. The constructs of perceived risk, trust, and perceived security were adopted from [66]. The items of social influence, service quality, and attitude were adopted from a study performed by Palos-Sanchez et al. [81]. This research focused on university users; therefore, items from the TAM research and smart city adoption research were considered for modification in the Jordanian context. The study questionnaire used a five-point Likert scale [82] (strongly disagree, disagree, neutral, agree, and strongly agree) [82].
The questionnaire included three sections: demographic questions, smart city use, and users’ opinions on smart city adoption attributes in the proposed model. As Arabic is the native language of Jordan, the questionnaire was translated from English into Arabic by three English experts from the University of Jordan. Then, the questionnaire was validated by three professors and master users. The final questionnaire had seven constructs and a total of twenty-one items. Table 1 shows the pilot study results.

5. Results and Analysis

In the analysis of the Structure Model (Inner Model), the assessment of the structural equation model via Partial Least Squares (PLS) path modeling involved the application of the R-squared (R2) test and the relevance test, employing correlation and path estimations. The R-squared (R2) value was utilized to gauge the impact of a latent variable on a dependent latent variable. As reported by [92], the R2 results ranged from 0.487 to 0.762, indicating the model’s suitability and appropriateness for the given data. The dependability and validity of the variables were evaluated using structural equation modeling (SEM). The data analysis was conducted using SPSS 23.0 and clever PLS 2.0.

5.1. The Reliability and Validity of Measures

To assess the validity and reliability of each factor’s measurement, we employed alpha coefficients, composite reliabilities, and average variances (AVEs). Cronbach’s alpha, a widely used reliability statistic, was initially utilized to evaluate the internal consistency. The results of a Confirmatory Factor Analysis (CFA), as reported by [93], were highly favorable, with all 30 item loadings surpassing the 0.70 threshold and a convergent validity value ranging from 0.862 to 0.953. The validity of the findings was further confirmed via Cronbach’s alpha values, which ranged from 0.824 to 0.927. The R-squared values varied between 0.487 and 0.762, while the AVE values ranged from 0.675 to 0.872. The findings are summarized in Table 2.

5.2. Measurement Construct Validity

Construct validity, as defined by [93], refers to the degree to which products accurately represent the underlying idea for which they were developed. This aspect was scrutinized by considering various research factors that have garnered substantial confirmation. The components that were required to be encompassed in the customized structure, along with their corresponding loadings, are presented in Table 3 [93].

5.3. Convergent Measurement Validity

Discriminant validity pertains to the distinctions between a set of concepts and their corresponding measurements. This study posited that values greater than 0.50 with a significance level of p = 0.001 would affirm the discriminant validity of both concepts [93]. Following the guidelines provided by colleagues and Hair [93], Table 4 shows that correlations among the elements within the constructs should be lower than the square root of the Average Variance Extracted (AVE) value shared by the items representing a single notion.

5.4. Model Measurement Fit

Based on the findings, the successful retrieval of five external factors, three mediator variables, and two endogenous variables was achieved. To ensure the reliability, concurrent validity, and divergent validity of the multi-item scales, a Confirmatory Factor Analysis (CFA) and Exploratory Factor Analysis (EFA) were employed, following the recommendations in [94]. While the chi-square value has relevance, it is worth noting that these statistics can be influenced by the sample size and the model’s complexity (2.55). To evaluate the model’s fit, other statistics such as the Goodness-of-Fit Index (GFI = 0.943), Comparative Fit Index (CFI = 0.964), Incremental Fit Index (IFI = 0.966), Normed Fit Index (NFI = 0.972), and Root Mean Square Error of Approximation (RMSEA = 0.051) are preferable [94].

5.5. Analysis of the Structural Model

The adequacy of the structural model employed in this study was evaluated using global fit measurements. The absolute fit measurements, including the GFI (0.934), CFI (0.955), IFI (0.951), NFI (0.959), RMSEA (0.959), and RMR (0.048), exhibited appropriate values during the progressive model estimation, indicating a good fit according to the existing literature [94]. To assess the study’s assumptions and establish correlations, Smart PLS 2.0 was utilized. The results of the path coefficients and their corresponding T-values are presented in Table 5.
Based on the findings presented in Table 5, the analysis indicated that all hypotheses can be accepted. The study’s model encompassed eight primary factors and twenty-four research items. The first factor examined the relationships between information security and intention to adopt (0.221) and information privacy and intention to adopt (0.201), leading to the acceptance of both hypotheses H1 and H2. Furthermore, the correlations between perceived security risk and intention to adopt (0.229) and perceived trust and intention to adopt (0.320) supported the acceptance of the hypotheses H3 and H4. Regarding the fifth and sixth hypotheses, the correlations between perceived usefulness and intention to adopt (0.310) and between perceived ease of use and intention to adopt (0.291) were confirmed. Additionally, the associations between service quality and intention to adopt (0.109) provided further confirmation of H7. Finally, the relationship between intention to adopt and actual adoption (0.365) was accepted, concluding the successful validation of these hypotheses.

6. Discussion

The primary objective of this study was to develop a conceptual model that integrated constructs of the Technology Acceptance Model (TAM) with four external factors: perceived risk, perceived trust, perceived security, and service quality. This comprehensive model sought to investigate the key drivers influencing users’ decisions to exclusively use or not use smart city services. Through this method, this research aimed to gain a deeper understanding of users and ultimately increase the adoption of smart city services offered to them. We aimed to address the research gap pertaining to the limited exploration of smart city acceptance. Specifically, we examined the impact of information security, information privacy, perceived trust, perceived security risk, perceived ease of use, perceived usefulness, and service quality on the intention to adopt smart city services. Our findings will provide valuable insights to policymakers and academic researchers regarding the critical factors that may encourage users to embrace smart city services, especially in the aftermath of the COVID-19 pandemic.
We found that the security of information and online services is considered the primary factor for success of the adoption of smart cities. The results indicated that information security had a positive impact on intention to adopt. Providing security defense techniques to guarantee the security of users’ information and transactions should be considered a top priority. We recommend that information technology providers consistently provide security mechanisms for smart cities, such as multi-factor authentication and transaction encryption. These results were consistent with previous studies on smart city systems [113,114,115]. In addition, the results indicated that information privacy had a positive impact on intention to adopt. Smart city projects should consider the information privacy factor during the creation of infrastructure [113,114,115].
The findings unveiled a positive impact of perceived security risk on intention to adopt smart city services. This can be attributed to the inherent risks associated with these applications as they may be vulnerable to attacks by hackers, impacting users’ trust. These results aligned with the findings of previous studies [100,101,102,103,104,105,106,107]. Moreover, this study established a significant link between perceived risk and user trust. When deciding whether to adopt a technology, users often assess the perceived danger against the convenience it offers. Prior studies [108,109,110,111,112] also suggested a strong association between perceived risk and perceived trust, indicating that users are more likely to trust a technology when perceived risk levels are minimized.
Furthermore, our findings indicated a positive impact of perceived trust on the intention to adopt smart city services. This can be attributed to user trust being bolstered by the perceived absence of risks in their transactions and activities, coupled with the benefits they receive from smart city applications. Additionally, our study established a significant relationship between perceived trust and user loyalty, especially when smart city services are highly trusted. These results were also consistent with previous studies [113,114,115], which emphasized the pivotal role of user trust in the successful adoption and utilization of smart city services.
The study’s findings revealed a positive impact of perceived security on intention to adopt smart city services. This can be attributed to the implementation of robust security defense techniques, ensuring the safety and confidentiality of users’ services, activities, privacy, and data. The prioritization of users’ information security is crucial for fostering successful adoption and usage of smart city services. Moreover, the study established a significant link between perceived security and user trust. Investing in advanced security mechanisms for smart city applications is recommended. Previous studies in this area [116] emphasized that the provision of high-quality security procedures leads to increased user trust, subsequently positively influencing user attitudes toward smart city services.
This study also found that perceived ease of use and perceived usefulness positively impact the intention to adopt smart city services. Emphasizing the simplicity of smart city applications is critical for the successful adoption of these services. However, it is important to note that perceived ease of use alone, without a strong sense of usefulness, may not be sufficient. When students find the interaction with smart city applications to be simple, understandable, and clear, it enhances their willingness to use the application. Prior studies [66,67,68] also highlighted perceived ease of use as the strongest predictor in the TAM, positively influencing the attitude toward using technology. In the context of smart cities, other studies [69,70] have also confirmed the positive relationship between perceived ease of use and users’ intention to use smart city services.
The findings of this study highlight that service quality significantly and directly influences the intention to adopt smart city services. This underscores the critical importance of focusing on the development of smart city applications with high-quality services. Moreover, this study establishes that the development of smart city applications lacking high-quality features and services may be insufficient. When users perceive that an application offers high-quality services that meet their needs, it enhances the likelihood of their adoption of the application. These results were consistent with prior studies [78,79,80] which emphasized service quality as one of the strongest predictors in the Delone and McLean model which positively affects the actual usage of technology. Additionally, studies in the context of smart cities [81,82,83,84] have also confirmed the positive relationship between service quality and users’ intention to adopt smart city services. Furthermore, our findings indicated that the intention to adopt had a positive impact on the actual adoption of smart city services. Previous related studies [85,86,87] also confirmed a positive relationship between the intention to adopt and the actual adoption of smart city services.

6.1. Research Implications

This study contributes to the literature by offering both theoretical insights and practical implications for the adoption and utilization of smart city platforms in the post-COVID-19 era. It represents a pioneering effort in extending the Technology Acceptance Model (TAM) to predict the actual usage of smart city platforms in the post-COVID-19 context. This extension was particularly relevant as it anticipated an increase in the adoption of technology among users, thereby enhancing their transactional and lifestyle activities. The study also found empirical evidence for the factors that substantially increase the actual utilization of smart city platforms. The results provide valuable insights into users’ attitudes and their ongoing intention to use smart city platforms in the post-COVID-19 period. The research offers recommendations to gain a deeper understanding of the security and technological considerations that are necessary when adopting smart city platforms. We confirmed the significance of optimizing technological resources within smart city platforms to address technical challenges, such as internet connectivity issues. Adequate infrastructure support, encompassing hardware, software, and internet connectivity, is integral to fostering continuous user engagement. This research also underscored the importance of smart city developers aligning their platforms with user requirements and needs. Finally, this study highlights the role of governments in encouraging users to embrace smart city services as a primary tool for enhancing quality of life.

6.2. Limitations and Future Work

While this research offers valuable insights, certain limitations may serve as guidance for future investigations. Firstly, the model proposed in this study could be improved by the inclusion of additional factors regarding system quality, content quality, and technological aspects, with the aim of providing more comprehensive and robust research solutions for addressing the issue of smart city adoption. Secondly, the study’s scope was confined to the Jordanian population. To ascertain the generalizability of our findings, it is necessary to replicate the study in diverse geographical contexts. Such cross-cultural comparisons could illuminate the cultural dimensions pertinent to the acceptability of smart city initiatives. Finally, our study only focused on users’ perceptions. Future research endeavors could also explore the perspectives and insights of experts in the field regarding the successful adoption of smart city applications. By considering these limitations and potential solutions, this research could further contribute to increasing the adoption of smart city services.

7. Conclusions

The utility of smart city services and applications has become increasingly paramount for the facilitation of transactions and activities. Despite the benefits of smart cities for citizens, the rates of the adoption of these technologies remain low. There is a need to understand the factors associated with the adoption of smart cities in order to ensure their successful implementation.
The primary objective of this study was to understand users’ perspectives and the adoption of smart city services. We used the Technology Acceptance Model (TAM) and incorporated external factors, including information security, information privacy, perceived security risk, perceived trust, perceived ease of use, perceived usefulness, and service quality. The proposed model measured users’ adoption of smart city services. The analytical framework employed in this study to assess the proposed hypotheses was SEM. This study identified the pivotal roles played by perceived security risk, perceived trust, and service quality in motivating the adoption of smart city services. Additionally, the results confirmed the positive influence of information security and information privacy on the intention to adopt smart city services. These research findings offer valuable insights into the critical factors that drive users’ adoption of smart city services. Policymakers and academics could leverage these findings to formulate and implement strategies aimed at increasing the rates of the adoption of smart city services.

Author Contributions

Conceptualization, M.A.; Methodology, M.A.A. and A.L.; Software, T.A.; Validation, M.A.A.; Formal analysis, T.A., R.S. and M.A.; Investigation, T.A.; Resources, R.S. and M.A.; Data curation, M.A.A.; Writing—original draft, R.S. and A.L.; Writing—review & editing, A.L. All authors have read and agreed to the published version of the manuscript.

Funding

The authors extend their appreciation to the Deputyship for Research & Innovation, Ministry of Education in Saudi Arabia for funding this research work through the project number INST194.

Data Availability Statement

No new data were created or analyzed in this study. Data sharing is not applicable to this article.

Conflicts of Interest

The authors declare no conflict of interest.

Appendix A

FactorsItems
Information SecurityIS1: Smart-cities services have mechanisms to ensure the safe transmission of its users’ information
SR2: Smart-cities providers show great concern for the security of any transactions and services.
SR3: When I send data via smart-cities applications, I am sure that they will not be intercepted by unauthorized third parties.
Information PrivacyIP1: My information privacy by using smart-cities services is protected.
IP2: I think that smart-cities providers will not provide my personal information to other companies without my consent.
IP3: I think smart-cities providers respect the user’s rights when obtaining personal information.
Perceived Security RiskPSR1: Providing user information through smart-cities services is safe.
PSR2: I think it is not risky to provide user information to smart-cities providers.
PSR3: I would not hesitate to provide my user information (such as name, address, health condition, bank information, and phone number, etc.) to smart-cities providers.
Perceived TrustPT1: The services of Smart-cities are very adequate.
PT2: The services of Smart-cities are very appropriate.
PT3: The services of Smart-cities full meet my needs.
Perceived UsefulnessPEU1: Smart-cities services will be useful in my daily life.
PEU2: Using Smart-cities applications will increase my chances of doing tasks.
PEU3: Using Smart-cities applications will help me to accomplish tasks more quickly.
Perceived Ease of UsePES1: Smart-cities applications easy to use.
PES2: My interaction with Smart-cities applications is clear and understandable.
PES3: Learning how to use Smart-cities applications is easy for me.
Service QualitySQ1: The service provider of smart-cities provide attention when I face problems with the use smart-cities applications.
SQ2: The service provider of smart-cities provide services related to me at the promised time.
SEQ3: The service provider of smart-cities have sufficient knowledge to answer my questions regarding the smart-cities applications.
Intention to Adopt INA1: I intend to use smart-cities services to accomplish my tasks in the future.
INA2: I will always try to use smart-cities services in my daily life.
INA3: I plan to use smart-cities services in the future.

References

  1. Ali, A.; Hameed, A.; Moin, M.F.; Khan, N.A. Exploring factors affecting mobile-banking app adoption: A perspective from adaptive structuration theory. Aslib J. Inf. Manag. 2022, 75, 773–795. [Google Scholar] [CrossRef]
  2. Ali, M.; Amir, H.; Ahmed, M. The role of university switching costs, perceived service quality, perceived university image and student satisfaction in shaping student loyalty. J. Mark. High. Educ. 2021, 20, 1–22. [Google Scholar] [CrossRef]
  3. Alshurideh, M.T.; Al Kurdi, B.; Salloum, S.A. The moderation effect of gender on accepting electronic payment technology: A study on United Arab Emirates consumers. Rev. Int. Bus. Strategy 2021, 31, 375–396. [Google Scholar] [CrossRef]
  4. Zhou, Q.; Lim, F.J.; Yu, H.; Xu, G.; Ren, X.; Liu, D.; Wang, X.; Mai, X.; Xu, H. A study on factors affecting service quality and loyalty intention in smart-cities. J. Retail. Consum. Serv. 2021, 60, 102424. [Google Scholar] [CrossRef]
  5. Zhu, Q.; Lyu, Z.; Long, Y.; Wachenheim, C.J. Adoption of smart-citiesin rural China: Impact of information dissemination channel. Socio-Econ. Plan. Sci. 2021, 101011. [Google Scholar]
  6. Ariansyah, K. Minat masyarakat terhadap layanan Near Field Communication (NFC) komersial di Indonesia. Bul. Pos Dan Telekomun. 2012, 10, 125–136. [Google Scholar] [CrossRef]
  7. Achsan, W.; Achsani, N.A.; Bandono, B. The Demographic and Behavior Determinant of Credit Card Default in Indonesia. Signifikan J. Ilmu Ekon. 2022, 11, 43–56. [Google Scholar] [CrossRef]
  8. Afandi, A.; Fadhillah, A.; Sari, D.P. Pengaruh Persepsi Kegunaan, Persepsi Kemudahan dan Persepsi Kepercayaan Terhadap Niat Menggunakan E-Wallet Dengan Sikap Sebagai Variabel Intervening. Innov. J. Soc. Sci. Res. 2021, 1, 568–577. [Google Scholar]
  9. Ahmed, W.; Rasool, A.; Javed, A.R.; Kumar, N.; Gadekallu, T.R.; Jalil, Z.; Kryvinska, N. Security in next generation mobile payment systems: A comprehensive survey. IEEE Access 2021, 9, 115932–115950. [Google Scholar] [CrossRef]
  10. Ajzen, I. The theory of planned behavior. Organ. Behav. Hum. Decis. Process. 1991, 50, 179–211. [Google Scholar] [CrossRef]
  11. Alam, M.Z.; Alam, M.M.D.; Uddin, M.A.; Mohd Noor, N.A. Do mobile health (mHealth) services ensure the quality of health life? An integrated approach from a developing country context. J. Mark. Commun. 2022, 28, 152–182. [Google Scholar] [CrossRef]
  12. Alamoudi, H. Examining Retailing Sustainability in the QR Code-Enabled Mobile Payments Context During the COVID-19 Pandemic. Int. J. Cust. Relatsh. Mark. Manag. (IJCRMM) 2022, 13, 1–22. [Google Scholar] [CrossRef]
  13. Asravor, R.K.; Boakye, A.N.; Essuman, J. Adoption and intensity of use of mobile money among smallholder farmers in rural Ghana. Inf. Dev. 2021, 38, 204–217. [Google Scholar] [CrossRef]
  14. Baabdullah, A.M.; Alalwan, A.A.; Rana, N.P.; Kizgin, H.; Patil, P. Consumer use of smart-cities(M-Banking) in Saudi Arabia: Towards an integrated model. Int. J. Inf. Manag. 2019, 44, 38–52. [Google Scholar] [CrossRef]
  15. Zaib, U.; Al-Turjman, F.; Mostarda, L.; Gagliardi, R. Applications of artificial intelligence and machine learning in smart cities. Comput. Commun. 2020, 154, 313–323. [Google Scholar]
  16. Bagozzi, R.P.; Yi, Y. On the evaluation of structural equation models. J. Acad. Mark. Sci. 1988, 16, 74–94. [Google Scholar] [CrossRef]
  17. Balakrishnan, V.; Shuib, N.L.M. Drivers and inhibitors for digital payment adoption using the Cashless Society Readiness-Adoption model in Malaysia. Technol. Soc. 2021, 65, 101554. [Google Scholar] [CrossRef]
  18. Shishakly, R.; Almaiah, M.; Lutfi, A.; Alrawad, M. The influence of using smart technologies for sustainable development in higher education institutions. Int. J. Data Netw. Sci. 2023, 8, 77–90. [Google Scholar] [CrossRef]
  19. Beke, F.T.; Eggers, F.; Verhoef, P.C.; Wieringa, J.E. Consumers’ privacy calculus: The PRICAL index development and validation. Int. J. Res. Mark. 2022, 39, 20–41. [Google Scholar] [CrossRef]
  20. Belanche, D.; Casaló, L.V.; Flavián, M.; Ibáñez-Sánchez, S. Understanding influencer marketing: The role of congruence between influencers, products and consumers. J. Bus. Res. 2021, 132, 186–195. [Google Scholar] [CrossRef]
  21. Biswas, A.; Jaiswal, D.; Kant, R. Augmenting bank service quality dimensions: Moderation of perceived trust and perceived risk. Int. J. Product. Perform. Manag. 2021, 72, 469–490. [Google Scholar] [CrossRef]
  22. Bojjagani, S.; Sastry, V.N.; Chen, C.M.; Kumari, S.; Khan, M.K. Systematic survey of mobile payments, protocols, and security infrastructure. J. Ambient. Intell. Humaniz. Comput. 2021, 14, 609–654. [Google Scholar] [CrossRef]
  23. Bulutoding, L.; Bidin, C.R.K.; Syariati, A.; Qarina, Q. Antecedents and Consequence of Murabaha Funding in Islamic Banks of Indonesia. J. Asian Financ. Econ. Bus. (JAFEB) 2021, 8, 487–495. [Google Scholar]
  24. Caldeira, T.A.; Ferreira, J.B.; Freitas, A.; Falcão, R.P.D.Q. Adoption of Mobile Payments in Brazil: Technology Readiness, Trust and Perceived Quality. BBR Braz. Bus. Rev. 2021, 18, 415–432. [Google Scholar]
  25. Cao, T. The study of factors on the small and medium enterprises’ adoption of mobile payment: Implications for the COVID-19 Era. Front. Public Health 2021, 9, 646592. [Google Scholar] [CrossRef] [PubMed]
  26. Cao, X.; Yu, L.; Liu, Z.; Gong, M.; Adeel, L. Understanding mobile payment users’ continuance intention: A trust transfer perspective. Internet Res. 2018, 28, 456–476. [Google Scholar] [CrossRef]
  27. Merino, C.; Guillermo, R. Diseño e Implementación de un Sistema de Inventario Usando la Tecnología NFC para la Unidad Educativa Particular Virgen del Cisne en la Ciudad de Machala Mediante una Aplicación con Sistema Operativo IOS 2021. Master’s Thesis, Universidad Católica de Santiago de Guayaquil, Guayaquil, Ecuador, 2021. [Google Scholar]
  28. Coskun, E.; Ferman, M. Factors Encouraging and Hindering a Wider Acceptance and More Frequent Utilization of Mobile Payment Systems: An Empirical Study among Mobile Phone Subscribers in Turkey. J. Manag. Mark. Logist. 2021, 8, 164–183. [Google Scholar] [CrossRef]
  29. Davis, F.D. Perceived usefulness, perceived ease of use, and user acceptance of information technology. MIS Q. 1989, 319–340. [Google Scholar] [CrossRef]
  30. Dirsehan, T.; Cankat, E. Role of mobile food-ordering applications in developing restaurants’ brand satisfaction and loyalty in the pandemic period. J. Retail. Consum. Serv. 2021, 62, 102608. [Google Scholar] [CrossRef]
  31. Alshuwaikhat, H.M.; Aina, Y.A.; Binsaedan, L. Analysis of the implementation of urban computing in smart cities: A framework for the transformation of Saudi cities. Heliyon 2022, 8, e11138. [Google Scholar] [CrossRef]
  32. Dospinescu, O.; Anastasiei, B.; Dospinescu, N. Key factors determining the expected benefit of customers when using bank cards: An analysis on millennials and generation Z in Romania. Symmetry 2019, 11, 1449. [Google Scholar] [CrossRef]
  33. Duggal, E.; Verma, H.V. Offline to online shopping: Shift in volition or escape from violation. J. Indian Bus. Res. 2022, 14, 339–357. [Google Scholar] [CrossRef]
  34. El-Chaarani, H.; El-Abiad, Z. The Impact of Technological Innovation on Bank Performance. J. Internet Bank. Commer. 2018, 23. [Google Scholar]
  35. Fan, L.; Zhang, X.; Rai, L.; Du, Y. Mobile payment: The next frontier of payment systems?-an empirical study based on push-pull-mooring framework. J. Theor. Appl. Electron. Commer. Res. 2021, 16, 155–169. [Google Scholar] [CrossRef]
  36. Alwahaishi, S. Student Use of Smart-cities During the Coronavirus Pandemic: An Extension of UTAUT to Trust and Perceived Risk. Int. J. Distance Educ. Technol. (IJDET) 2021, 19, 1–19. [Google Scholar]
  37. Farhadi, M.; Fooladi, M. Performance of Islamic E-Banking: Case of Iran. Iran. J. Account. Audit. Financ. 2021, 5, 31–39. [Google Scholar]
  38. Gbongli, K.; Xu, Y.; Amedjonekou, K.M. Extended technology acceptance model to predict mobile-based money acceptance and sustainability: A multi-analytical structural equation modeling and neural network approach. Sustainability 2019, 11, 3639. [Google Scholar] [CrossRef]
  39. Geebren, A.; Jabbar, A.; Luo, M. Examining the role of consumer satisfaction within mobile eco-systems: Evidence from smart-citiesservices. Comput. Hum. Behav. 2021, 114, 106584. [Google Scholar] [CrossRef]
  40. Girish, V.G.; Kim, M.Y.; Sharma, I.; Lee, C.K. Examining the structural relationships among smart-cities interactivity, uncertainty avoidance, and perceived risks of COVID-19: Applying extended technology acceptance model. Int. J. Hum.–Comput. Interact. 2022, 38, 742–752. [Google Scholar] [CrossRef]
  41. Ashwin, K. The challenges of IoT addressing security, ethics, privacy, and laws. Internet Things 2021, 15, 100420. [Google Scholar] [CrossRef]
  42. Castiblanco Jimenez, I.A.; Cepeda García, L.C.; Violante, M.G.; Marcolin, F.; Vezzetti, E. Commonly used external TAM variables in smart-cities, agriculture and virtual reality applications. Future Internet 2020, 13, 7. [Google Scholar] [CrossRef]
  43. Weerathunga, P.R.; Samarathunga, W.H.M.S.; Rathnayake, H.N.; Agampodi, S.B.; Nurunnabi, M.; Madhunimasha, M.M.S.C. The COVID-19 pandemic and the acceptance of Smart-cities among university Users: The Role of Precipitating Events. Educ. Sci. 2021, 11, 436. [Google Scholar] [CrossRef]
  44. Gerbing, D.W.; Anderson, J.C. Monte Carlo evaluations of goodness of fit indices for structural equation models. Sociol. Methods Res. 1992, 21, 132–160. [Google Scholar] [CrossRef]
  45. Gupta, B.B.; Narayan, S. A survey on contactless smart cards and payment system: Technologies, policies, attacks and countermeasures. J. Glob. Inf. Manag. (JGIM) 2020, 28, 135–159. [Google Scholar] [CrossRef]
  46. Gupta, S.; Dhingra, S. Modeling the key factors influencing the adoption of mobile financial services: An interpretive structural modeling approach. J. Financ. Serv. Mark. 2021, 27, 96–110. [Google Scholar] [CrossRef]
  47. Hair, J.F., Jr.; Howard, M.C.; Nitzl, C. Assessing measurement model quality in PLS-SEM using confirmatory composite analysis. J. Bus. Res. 2020, 109, 101–110. [Google Scholar] [CrossRef]
  48. Hidayat-ur-Rehman, I.; Alzahrani, S.; Rehman, M.Z.; Akhter, F. Determining the factors of m-wallets adoption. A Twofold SEM-ANN Approach. PLoS ONE 2022, 17, e0262954. [Google Scholar] [CrossRef] [PubMed]
  49. Ho, J.C.; Wu, C.G.; Lee, C.S.; Pham, T.T.T. Factors affecting the behavioral intention to adopt smart-cities: An international comparison. Technol. Soc. 2020, 63, 101360. [Google Scholar] [CrossRef]
  50. Hoang, V.H.; Nguyen, P.M.; Luu, T.M.N.; Vu, T.M.H. Determinants of Intention to Borrow Consumer Credit in Vietnam: Application and Extension of Technology Acceptance Model. J. Asian Financ. Econ. Bus. 2021, 8, 885–895. [Google Scholar]
  51. Hossain, M.A. Security perception in the adoption of mobile payment and the moderating effect of gender. PSU Res. Rev. 2019, 3, 179–190. [Google Scholar] [CrossRef]
  52. Idrees, A.; Lodhi, R.N.; Rabbani, S.; Ahmad, S. Exploring Stimuli Affecting Behavioral Intention and Actual Credit Card Usage: Application of Updated Technology Acceptance Model. KASBIT Bus. J. 2021, 14, 155–175. [Google Scholar]
  53. Jadil, Y.; Rana, N.P.; Dwivedi, Y.K. A meta-analysis of the UTAUT model in the smart-citiesliterature: The moderating role of sample size and culture. J. Bus. Res. 2021, 132, 354–372. [Google Scholar] [CrossRef]
  54. Kamdjoug, J.R.K.; Wamba-Taguimdje, S.L.; Wamba, S.F.; Kake, I.B.E. Determining factors and impacts of the intention to adopt smart-citiesapp in Cameroon: Case of SARA by afriland First Bank. J. Retail. Consum. Serv. 2021, 61, 102509. [Google Scholar] [CrossRef]
  55. Kar, A.K. What affects usage satisfaction in mobile payments? Modelling user generated content to develop the “digital service usage satisfaction model”. Inf. Syst. Front. 2021, 23, 1341–1361. [Google Scholar] [CrossRef] [PubMed]
  56. Kasemsap, K. Investigating the roles of mobile commerce and mobile payment in global business. In Securing Transactions and Payment Systems for m-Commerce; IGI Global: Hershey, PA, USA, 2016; pp. 1–23. [Google Scholar]
  57. Khanra, S.; Dhir, A.; Kaur, P.; Joseph, R.P. Factors influencing the adoption postponement of mobile payment services in the hospitality sector during a pandemic. J. Hosp. Tour. Manag. 2021, 46, 26–39. [Google Scholar] [CrossRef]
  58. Khedmatgozar, H.R. The impact of perceived risks on internet banking adoption in Iran: A longitudinal survey. Electron. Commer. Res. 2021, 21, 147–167. [Google Scholar] [CrossRef]
  59. Kimiagari, S.; Baei, F. Promoting e-banking actual usage: Mix of technology acceptance model and technology-organisation-environment framework. Enterp. Inf. Syst. 2021, 16, 1894356. [Google Scholar] [CrossRef]
  60. Kimiagari, S.; Malafe, N.S.A. The role of cognitive and affective responses in the relationship between internal and external stimuli on online impulse buying behavior. J. Retail. Consum. Serv. 2021, 61, 102567. [Google Scholar] [CrossRef]
  61. Kratschmann, M.; Dütschke, E. Selling the sun: A critical review of the sustainability of solar energy marketing and advertising in Germany. Energy Res. Soc. Sci. 2021, 73, 101919. [Google Scholar] [CrossRef]
  62. Lathiya, P.; Wang, J. Near-Field Communications (NFC) for Wireless Power Transfer (WPT): An Overview. In Wireless Power Transfer–Recent Development, Applications and New Perspectives; Books on Demand: Norderstedt, Germany, 2021. [Google Scholar]
  63. Lew, S.; Tan, G.W.H.; Loh, X.M.; Hew, J.J.; Ooi, K.B. The disruptive mobile wallet in the hospitality industry: An extended mobile technology acceptance model. Technol. Soc. 2020, 63, 101430. [Google Scholar] [CrossRef]
  64. Liébana-Cabanillas, F.; Molinillo, S.; Japutra, A. Exploring the determinants of intention to use P2P mobile payment in Spain. Inf. Syst. Manag. 2021, 38, 165–180. [Google Scholar] [CrossRef]
  65. Liébana-Cabanillas, F.; Singh, N.; Kalinic, Z.; Carvajal-Trujillo, E. Examining the determinants of continuance intention to use and the moderating effect of the gender and age of users of NFC mobile payments: A multi-analytical approach. Inf. Technol. Manag. 2021, 22, 133–161. [Google Scholar] [CrossRef]
  66. Luna, I.R.D.; Montoro-Ríos, F.; Liébana-Cabanillas, F.; Luna, J.G.D. NFC technology acceptance for mobile payments: A Brazilian Perspective. Rev. Bras. Gestão Negócios 2017, 19, 82–103. [Google Scholar]
  67. Malaquias, R.F.; Hwang, Y. Smart-citiesuse: A comparative study with Brazilian and US participants. Int. J. Inf. Manag. 2019, 44, 132–140. [Google Scholar] [CrossRef]
  68. Meghisan-Toma, G.M.; Puiu, S.; Florea, N.M.; Meghisan, F.; Doran, D. Generation Z’young adults and M-commerce use in Romania. J. Theor. Appl. Electron. Commer. Res. 2021, 16, 1458–1471. [Google Scholar] [CrossRef]
  69. Migliore, G.; Wagner, R.; Cechella, F.S.; Liébana-Cabanillas, F. Antecedents to the Adoption of Mobile Payment in China and Italy: An Integration of UTAUT2 and Innovation Resistance Theory. Inf. Syst. Front. 2022, 24, 2099–2122. [Google Scholar] [CrossRef]
  70. Mills, D.; Pudney, S.; Pevcin, P.; Dvorak, J. Evidence-based public policy decision-making in smart cities: Does extant theory support achievement of city sustainability objectives? Sustainability 2021, 14, 3. [Google Scholar] [CrossRef]
  71. Alqudah, H.; Amran, N.A.; Hassan, H.; Lutfi, A.; Alessa, N.; Almaiah, M.A. Examining the critical factors of internal audit effectiveness from internal auditors’ perspective: Moderating role of extrinsic rewards. Heliyon 2023. [Google Scholar] [CrossRef] [PubMed]
  72. Mohd Thas Thaker, H.; Mohd Thas Thaker, M.A.; Khaliq, A.; Allah Pitchay, A.; Iqbal Hussain, H. Behavioural intention and adoption of internet banking among clients’ of Islamic banks in Malaysia: An analysis using UTAUT2. J. Islam. Mark. 2021, 13, 1171–1197. [Google Scholar] [CrossRef]
  73. Mombeuil, C.; Uhde, H. Relative convenience, relative advantage, perceived security, perceived privacy, and continuous use intention of China’s WeChat Pay: A mixed-method two-phase design study. J. Retail. Consum. Serv. 2021, 59, 102384. [Google Scholar] [CrossRef]
  74. Alrawad, M.; Lutfi, A.; Almaiah, M.A.; Alsyouf, A.; Al-Khasawneh, A.L.; Arafa, H.M.; Ahmed, N.A.; AboAlkhair, A.M.; Tork, M. Managers’ perception and attitude toward financial risks associated with SMEs: Analytic hierarchy process approach. J. Risk Financ. Manag. 2023, 16, 86. [Google Scholar] [CrossRef]
  75. Moore, G.C.; Benbasat, I. Development of an instrument to measure the perceptions of adopting an information technology innovation. Inf. Syst. Res. 1991, 2, 192–222. [Google Scholar] [CrossRef]
  76. Museli, A.; Navimipour, N.J. A model for examining the factors impacting the near field communication technology adoption in the organizations. Kybernetes 2018, 47, 1378–1400. [Google Scholar] [CrossRef]
  77. Nam, T.H.; Quan, V.D.H. Multi-dimensional analysis of perceived risk on credit card adoption. In International Econometric Conference of Vietnam; Springer: Cham, Switzerland, 2019; pp. 606–620. [Google Scholar]
  78. Omar, S.; Mohsen, K.; Tsimonis, G.; Oozeerally, A.; Hsu, J.H. M-commerce: The nexus between mobile shopping service quality and loyalty. J. Retail. Consum. Serv. 2021, 60, 102468. [Google Scholar] [CrossRef]
  79. Ou, C.X.; Zhang, X.; Angelopoulos, S.; Davison, R.M.; Janse, N. Security breaches and organization response strategy: Exploring consumers’ threat and coping appraisals. Int. J. Inf. Manag. 2022, 65, 102498. [Google Scholar] [CrossRef]
  80. Pal, A.; Herath, T.; De’, R.; Rao, H.R. Contextual facilitators and barriers influencing the continued use of mobile payment services in a developing country: Insights from adopters in India. Inf. Technol. Dev. 2020, 26, 394–420. [Google Scholar] [CrossRef]
  81. Palos-Sanchez, P.; Saura, J.R.; Velicia-Martin, F.; Cepeda-Carrion, G. A business model adoption based on tourism innovation: Applying a gratification theory to mobile applications. Eur. Res. Manag. Bus. Econ. 2021, 27, 100149. [Google Scholar] [CrossRef]
  82. Patil, P.; Tamilmani, K.; Rana, N.P.; Raghavan, V. Understanding consumer adoption of mobile payment in India: Extending Meta-UTAUT model with personal innovativeness, anxiety, trust, and grievance redressal. Int. J. Inf. Manag. 2020, 54, 102144. [Google Scholar] [CrossRef]
  83. Pelaez, A.; Chen, C.W.; Chen, Y.X. Effects of perceived risk on intention to purchase: A meta-analysis. J. Comput. Inf. Syst. 2019, 59, 73–84. [Google Scholar] [CrossRef]
  84. Purwanto, A.; Juliana, J. The effect of supplier performance and transformational supply chain leadership style on supply chain performance in manufacturing companies. Uncertain Supply Chain Manag. 2021, 10, 511–516. [Google Scholar] [CrossRef]
  85. Purwanto, A.; Asbari, M.; Santoso, T.I.; Paramarta, V.; Sunarsi, D. Social and Management Research Quantitative Analysis for Medium Sample: Comparing of Lisrel, Tetrad, GSCA, Amos, SmartPLS, WarpPLS, and SPSS. J. Ilm. Ilmu Adm. Publik 2020, 10, 518–532. [Google Scholar]
  86. Qureshi, J.A.; Rehman, S.; Qureshi, M.A. Consumers’ attitude towards usage of debit and credit cards: Evidences from the digital economy of Pakistan. Int. J. Econ. Financ. Issues 2018, 8, 220–228. [Google Scholar]
  87. Rabaa’i, A.A.; AlMaati, S. Exploring the determinants of users’ continuance intention to use smart-citiesservices in Kuwait: Extending the expectation-confirmation model. Asia Pac. J. Inf. Syst. 2021, 31, 141–184. [Google Scholar]
  88. Ramos-de-Luna, I.; Montoro-Ríos, F.; Liébana-Cabanillas, F. Determinants of the intention to use NFC technology as a payment system: An acceptance model approach. Inf. Syst. E-Bus. Manag. 2016, 14, 293–314. [Google Scholar] [CrossRef]
  89. Rodrick, S.S.; Islam, H.; Sarker, S.A.; Tisha, F.F. Prospects and Challenges of using Credit Card Services: A Study on the users in Dhaka City. AIUB J. Bus. Econ. 2021, 18, 161–186. [Google Scholar]
  90. Sahi, A.M.; Khalid, H.; Abbas, A.F.; Khatib, S.F. The Evolving Research of Customer Adoption of Digital Payment: Learning from Content and Statistical Analysis of the Literature. J. Open Innov. Technol. Mark. Complex. 2021, 7, 230. [Google Scholar] [CrossRef]
  91. Saprikis, V.; Avlogiaris, G.; Katarachia, A. A Comparative Study of Users versus Non-Users’ Behavioral Intention towards M-Banking Apps’ Adoption. Information 2022, 13, 30. [Google Scholar] [CrossRef]
  92. Mohammed Amin, A.; Hajjej, F.; Shishakly, R.; Lutfi, A.; Amin, A.; Bani Awad, A. The role of quality measurements in enhancing the usability of mobile learning applications during COVID-19. Electronics 2022, 11, 1951. [Google Scholar]
  93. Hair, J.F.; Risher, J.J.; Sarstedt, M.; Ringle, C.M. When to use and how to report the results of PLS-SEM. Eur. Bus. Rev. 2019, 31, 2–24. [Google Scholar] [CrossRef]
  94. Shin, S.; Lee, W.J. Factors affecting user acceptance for NFC mobile wallets in the US and Korea. Innov. Manag. Rev. 2021, 18, 417–433. [Google Scholar] [CrossRef]
  95. Singh, N.; Sinha, N.; Liébana-Cabanillas, F.J. Determining factors in the adoption and recommendation of mobile wallet services in India: Analysis of the effect of innovativeness, stress to use and social influence. Int. J. Inf. Manag. 2020, 50, 191–205. [Google Scholar] [CrossRef]
  96. Sreelakshmi, C.C.; Prathap, S.K. Continuance adoption of mobile-based payments in COVID-19 context: An integrated framework of health belief model and expectation confirmation model. Int. J. Pervasive Comput. Commun. 2020, 16, 351–369. [Google Scholar]
  97. Sulaiman, S.N.A.; Almunawar, M.N. The adoption of biometric point-of-sale terminal for payments. J. Sci. Technol. Policy Manag. 2021, 13, 585–609. [Google Scholar] [CrossRef]
  98. Sun, S.; Law, R.; Schuckert, M.; Hyun, S.S. Impacts of mobile payment-related attributes on consumers’ repurchase intention. Int. J. Tour. Res. 2022, 24, 44–57. [Google Scholar] [CrossRef]
  99. Taylor, S.; Todd, P.A. Understanding information technology usage: A test of competing models. Inf. Syst. Res. 1995, 6, 144–176. [Google Scholar] [CrossRef]
  100. Teng, S.; Khong, K.W. Examining actual consumer usage of E-wallet: A case study of big data analytics. Comput. Hum. Behav. 2021, 121, 106778. [Google Scholar] [CrossRef]
  101. Tew, H.T.; Tan, G.W.H.; Loh, X.M.; Lee, V.H.; Lim, W.L.; Ooi, K.B. Tapping the next purchase: Embracing the wave of mobile payment. J. Comput. Inf. Syst. 2021, 62, 527–535. [Google Scholar] [CrossRef]
  102. Trinh, H.N.; Tran, H.H.; Vuong, D.H.Q. Determinants of consumers’ intention to use credit card: A perspective of multifaceted perceived risk. Asian J. Econ. Bank. 2020, 4, 105–120. [Google Scholar] [CrossRef]
  103. Trinh, N.H.; Tran, H.H.; Vuong, Q.D.H. Perceived risk and intention to use credit cards: A case study in Vietnam. J. Asian Financ. Econ. Bus. 2021, 8, 949–958. [Google Scholar]
  104. Usman, H.; Projo, N.W.K.; Chairy, C.; Haque, M.G. The exploration role of Sharia compliance in technology acceptance model for e-banking (case: Islamic bank in Indonesia). J. Islam. Mark. 2021, 13, 1089–1110. [Google Scholar] [CrossRef]
  105. Venkatesh, V.; Bala, H. Technology acceptance model 3 and a research agenda on interventions. Decis. Sci. 2008, 39, 273–315. [Google Scholar] [CrossRef]
  106. Venkatesh, V.; Morris, M.G.; Davis, G.B.; Davis, F.D. User acceptance of information technology: Toward a unified view. MIS Q. 2003, 425–478. [Google Scholar] [CrossRef]
  107. Vladimirovich Platov, A.; Kazbekovich Tarchokov, S.; Sobirovna Zikirova, S.; Igorevna Litvinova, O.; Eduardovich Udalov, D. NFC Technology Acceptance Factors in Tourism. In Proceedings of the IV International Scientific and Practical Conference, Tokyo, Japan, 12–15 October 2021; pp. 1–7. [Google Scholar]
  108. Wamba, S.F.; Queiroz, M.M.; Blome, C.; Sivarajah, U. Fostering financial inclusion in a developing country: Predicting user acceptance of mobile wallets in Cameroon. J. Glob. Inf. Manag. (JGIM) 2021, 29, 195–220. [Google Scholar] [CrossRef]
  109. Wang, E.S.T. Influences of Innovation Attributes on Value Perceptions and Usage Intentions of Mobile Payment. J. Electron. Commer. Res. 2022, 23, 45–58. [Google Scholar]
  110. Wei, M.F.; Luh, Y.H.; Huang, Y.H.; Chang, Y.C. Young generation’s mobile payment adoption behavior: Analysis based on an extended UTAUT model. J. Theor. Appl. Electron. Commer. Res. 2021, 16, 618–637. [Google Scholar] [CrossRef]
  111. Widagdo, B.; Roz, K. Hedonic shopping motivation and impulse buying: The effect of website quality on customer satisfaction. J. Asian Financ. Econ. Bus. 2021, 8, 395–405. [Google Scholar]
  112. Widyanto, H.A.; Kusumawardani, K.A.; Yohanes, H. Safety first: Extending UTAUT to better predict mobile payment adoption by incorporating perceived security, perceived risk and trust. J. Sci. Technol. Policy Manag. 2021, 13, 952–973. [Google Scholar] [CrossRef]
  113. Wu, R.Z.; Lee, J.H.; Tian, X.F. Determinants of the intention to use cross-border mobile payments in Korea among Chinese tourists: An integrated perspective of UTAUT2 with TTF and ITM. J. Theor. Appl. Electron. Commer. Res. 2021, 16, 1537–1556. [Google Scholar] [CrossRef]
  114. Yuan, T.; Honglei, Z.; Xiao, X.; Ge, W.; Xianting, C. Measuring perceived risk in sharing economy: A classical test theory and item response theory approach. Int. J. Hosp. Manag. 2021, 96, 102980. [Google Scholar] [CrossRef]
  115. Yuen, T.W. Factors influencing foreign consumers to adopt mobile payment extensions offered by multinational mobile messaging applications. Int. J. Multinatl. Corp. Strategy 2020, 3, 130–152. [Google Scholar] [CrossRef]
  116. Zhang, B.; Peng, G.; Xing, F.; Chen, S. Mobile Applications in China’s Smart Cities: State-of-the-Art and Lessons Learned. J. Glob. Inf. Manag. (JGIM) 2021, 29, 1–18. [Google Scholar] [CrossRef]
  117. Zhang, R.; Zhang, Y.; Xia, J. Impact of mobile payment on physical health: Evidence from the 2017 China household finance survey. Front. Public Health 2022, 10, 963234. [Google Scholar] [CrossRef]
  118. Zhao, H.; Anong, S.T.; Zhang, L. Understanding the impact of financial incentives on NFC mobile payment adoption: An experimental analysis. Int. J. Bank Mark. 2019, 37, 1296–1312. [Google Scholar] [CrossRef]
  119. Zhao, Y.; Bacao, F. How does the pandemic facilitate mobile payment? An investigation on users’ perspective under the COVID-19 pandemic. Int. J. Environ. Res. Public Health 2021, 18, 1016. [Google Scholar] [CrossRef]
  120. Zhong, Y.; Oh, S.; Moon, H.C. Service transformation under industry 4.0: Investigating acceptance of facial recognition payment through an extended technology acceptance model. Technol. Soc. 2021, 64, 101515. [Google Scholar] [CrossRef]
  121. Lopez-Carreiro, I.; Monzon, A.; Lopez, E. MaaS Implications in the Smart City: A Multi-Stakeholder Approach. Sustainability 2023, 15, 10832. [Google Scholar] [CrossRef]
  122. Beck, D. Stakeholder Theory for Sustainable Cities and Society: A Humanist and Environmental approach for integrating People, Institutions, and Environmental Ecosystems. Stud. Ecol. Bioethicae 2023, 21, 59–67. [Google Scholar] [CrossRef]
  123. Hamamurad, Q.H.; Jusoh, N.M.; Ujang, U. Factors Affecting Stakeholder Acceptance of a Malaysian Smart City. Smart Cities 2022, 5, 1508–1535. [Google Scholar] [CrossRef]
Figure 1. The proposed model.
Sustainability 15 15915 g001
Table 1. Pilot study findings.
NoFactorsCodePilot TestFinal Test
1Information SecurityIS0.8810.841
2Information PrivacyIP0.8070.835
3Perceived Security RiskPSR0.8740.821
4Service QualitySQ0.7920.828
5Perceived TrustPT0.9210.911
6Perceived UsefulnessPEU0.8240.843
7Perceived Ease of UsePES0.7770.792
8Intention to AdoptINA0.8900.881
Table 2. Reliability and validity analysis.
FactorsItemsFactor LoadingsComposite ReliabilityCronbach’s AlphaAVER-Squared
Intention to AdoptINA10.8810.8920.8220.7510.652
INA20.922
INA30.795
Information SecurityIS10.8940.9150.8490.7790.661
IS20.879
IS30.871
Information PrivacyIP10.8890.9200.8690.7900.480
IP 20.881
IP 30.900
Perceived Security RiskPSR10.9090.9310.8900.8110.510
PSR20.894
PSR30.895
Perceived Ease of UsePES10.8500.8810.8910.7070.521
PES20.872
PES30.801
Perceived UsefulnessPEU10.8720.8860.8090.7250.594
PEU20.911
PEU30.781
Perceived TrustPT10.8650.8700.8710.6800.741
PT20.798
PT30.822
Service qualitySQ10.9420.9600.9330.8790.770
SQ20.940
SQ30.932
Table 3. Loading factors analysis.
FactorsItemsINAISIPPSRPESPEUPTSQ
Intention to AdoptINA10.8710.5600.6200.5250.5440.6310.7190.659
INA20.9210.6150.6040.5390.6090.5610.6990.691
INA30.7610.4510.5100.3750.4400.3700.5510.589
Information SecurityIS10.5900.8890.6520.5600.6000.6190.5800.522
IS20.5390.8810.5500.5040.5280.5290.5190.551
IS30.6200.9010.6790.5280.6190.5390.6000.590
Information PrivacyIP10.6350.6700.9070.5400.6110.6300.7690.655
IP 20.5710.6250.8990.5420.5900.6000.7120.670
IP 30.6150.6300.8980.5220.5600.5750.6690.589
Perceived Security RiskPSR10.4110.5200.4370.8650.5130.4740.4410.409
PSR20.5170.5400.5410.8740.6130.6410.6270.525
PSR30.4890.4600.5110.8740.6510.4390.4980.437
Perceived Ease of UsePES10.5090.5020.5330.5190.6020.8700.6600.480
PES20.5970.6110.5800.5770.6200.9050.6690.505
PES30.4740.4950.5590.4740.5990.7700.5630.390
Perceived UsefulnessPEU10.8220.6280.7040.5110.5760.8540.8570.824
PEU20.5130.4820.6090.4920.5650.8210.7920.464
PEU30.4900.4400.6320.5500.4830.8360.8160.529
Perceived TrustPT10.6960.6050.6330.4840.5480.4940.7990.939
PT20.7300.5800.7020.5660.6080.5230.7920.938
PT30.6800.5760.6450.4670.5810.5030.7960.924
Service qualitySQ10.6490.5450.5550.3740.4720.4260.6990.855
SQ20.6970.6110.5640.5270.5690.5030.7410.849
SQ30.6810.5430.6380.5960.6580.5800.7440.852
Table 4. Discriminant validity.
No Factors12345678
1Intention to Adopt 1.000
2Information Security0.6941.000
3Information Privacy0.7640.6331.000
4Perceived Security Risk0.5710.5950.5391.000
5Perceived Ease of Use0.6790.7150.7170.5921.000
6Perceived Usefulness0.7660.6440.7750.6400.7961.000
7Perceived Trust0.7620.6440.8510.5700.6650.7441.000
8Service Quality0.6330.6410.5450.6220.6620.7500.5711.000
Table 5. Testing of hypotheses.
NoHypotheses LinksPath CoefficientMeanS.DS.ET-ValuesResults
1IS → INA0.2210.0840.0910.0910.682Accepted
2IP → INA0.2010.1800.1200.1201.655Accepted
3PSR → INA0.2290.3410.1020.1022.988Accepted
4PT → INA0.3200.0850.1190.1190.598Accepted
5PES → INA0.2910.0900.1090.1090.665Accepted
6PEU → INA0.3100.0880.1100.1100.441Accepted
7SQ → INA0.1090.0840.1010.1014.170Accepted
8INA → ATU0.3650.0750.1100.1100.662Accepted
Disclaimer/Publisher’s Note: The statements, opinions and data contained in all publications are solely those of the individual author(s) and contributor(s) and not of MDPI and/or the editor(s). MDPI and/or the editor(s) disclaim responsibility for any injury to people or property resulting from any ideas, methods, instructions or products referred to in the content.

