1. Introduction
The existing traffic networks of the city centers are generally not designed for the current traffic demand, while the search for a parking space additionally increases the traffic volume, which has a negative impact on traffic congestion, safety, and the impact on the environment [
1]. Extensions of the existing infrastructure are mostly not possible due to lack of space until all difficulties can be solved with certain procedures or improvements to the existing infrastructure, ensuring better urban sustainability. Therefore, an innovative approach within the framework of the cooperative system aims to reduce the traffic volume sampled by searching for parking.
The cooperative approach includes the use of information and communication technologies such as smart parking systems [
2]. The demand for an available parking place affects the increase in the total travel time and is negatively reflected in the increase in fuel consumption, harmful gas emissions, noise production, and traffic accidents [
3]. The creation of intelligent parking systems is essential to minimize the time taken to find parking and decrease greenhouse gas emissions [
4].
The use of a system for informing or directing vehicles to parking spaces significantly improves the parking process in terms of efficiency [
5]. Therefore, with further technological development [
6,
7] systems have been upgraded to provide real-time information.
The study underscores the integration of Intelligent Cooperative Sensing for Improved Traffic Efficiency (ICSI) with a parking guidance system, emphasizing its potential to enhance traffic efficiency and parking guidance in urban environments. ICSI integrates advanced sensing technologies, cooperative communication, and intelligent data analysis to collect real-time data from connected vehicles, infrastructure sensors, and parking facilities. This enables the system to dynamically adapt routing strategies, offer dynamic parking guidance, and optimize the allocation of resources. Key features of ICSI include real-time data collection, cooperative communication protocols, intelligent data analysis, and the overall improvement of traffic efficiency and parking availability. As a transformative solution, ICSI holds significant promise in revolutionizing urban mobility and effectively addressing the challenges posed by congestion and parking difficulties [
8].
One way to reduce travel time and cost is to use a dynamic parking and route guidance system. Previous research [
9] has proposed a model that integrates the change of parking destination and route traffic in real time. Based on test simulations, the system was found to improve the coordination of parking resources, thereby increasing the optimal use of parking spaces. Similar solutions to this issue can be found in several research papers [
10,
11,
12,
13,
14,
15,
16,
17,
18,
19,
20]. In the study by [
16], the approach to integrate parking search behavior through the methodology of underground replanning was analyzed, and the test area is located in the city of Berlin. The study concludes that vehicles actively searching for parking contribute to approximately 20% of the total traffic within residential areas.
In modern society, where the paradigm of a smart city is being promoted, there is an escalating need for the personalization of services to enhance the efficiency of each individual. Within the context of mobility, whether for drivers or public transport users, it is important to develop route-planning services that reflect the real needs and preferences of end users. On the one hand, the service will assist users in daily and ad hoc mobility, while cities will benefit in terms of better traffic distribution, congestion reduction, and optimization of traffic flows, thereby achieving greater throughput and reducing the burden on key traffic nodes. The traditional survey method, known as the “on-the-spot” method, which served as a precursor to the examination/discovery of the needs of transportation system users, is no longer sufficient due to its static nature, limited reach, and inability to adapt to dynamic changes in the traffic environment. Identifying and collecting data on passenger mobility, habits, inclinations, and patterns of drivers and passengers is an integral step in urban traffic planning [
21,
22].
Generally, consumer preference identification/discovery is based on the economic principle of stated preferences (explicitly, the classic “on-the-spot” method) and revealed/discovered preferences [
23]. Mobility has become unpredictable in a dynamic and changing environment, and people’s habits and needs are becoming more sophisticated. It is best to identify appropriate preferences for each user (driver) individually, as opposed to certain approaches based on the preferences of the respective population. Indeed, preferences vary from driver to driver. In this regard, different routes will be proposed, benefiting both the driver (who will receive a route recommendation in line with their needs) and urban environments, as such an approach is considered beneficial in reducing traffic congestion in urban areas [
24].
Because in urban areas it is difficult to find an available parking space, this is also a problem that this paper deals with. The objective of this paper is to develop a model in which vehicles are directed to the parking lot with an innovative approach using advanced information and communication systems.
The formulation of several research questions gave rise to the research problem in this paper.
Research Question 1: What is the effect of using a cooperative approach to guiding vehicles to available parking spaces compared to a standard model of searching for an available parking space?
Research Question 2: How can real-time parking availability information be used to improve the efficiency of parking guidance systems?
Research Question 3: How can parking guidance systems be integrated with other traffic management systems to improve traffic flow in urban areas?
Research Question 4: How can the use of parking guidance systems be promoted to encourage drivers to use them more frequently?
In accordance with research questions, the following hypothesis is established:
A model that guides vehicles to available parking spaces using advanced information and communication systems will be more efficient than traditional parking guidance systems.
The research methodology is designed to comprehensively address the complexities of guiding vehicles to available parking spaces in urban settings. Beginning with a thorough background exploration, the study identifies gaps in existing knowledge on parking guidance systems, intelligent transportation systems (ITS), and route optimization algorithms. Subsequently, the problem is precisely defined, paving the way for the design of a novel model that integrates real-time parking availability data, driver preferences, and dynamic traffic information. Utilizing the PTV Vissim simulation tool, a simulation model is developed to assess the model’s performance in terms of reducing parking search time, optimizing travel time, and minimizing traffic congestion.
2. Driver-Centric Personalizing Route Guidance in Urban Contexts (Background)
The fundamental idea of revealed preferences in microeconomics is to find out what consumers prefer. The theory of revealed preferences (TRP) was introduced by economist Paul Samuelson, who posited that a set of preferences that can be discovered underlies each choice. It is important to note that preferences, which are revealed after completed activities, most closely describe consumer behavior [
25,
26]. Today, this is a special area of research and application in microeconomics (e-commerce, internet advertising, etc.). Examples include personalized ads on social networks, recommended products on e-commerce platforms, and personalized playlists on music streaming services.
When it comes to advanced digital solutions that support the end user (drivers, passengers) personalization is more necessary today than ever. In delivering personalized services/products (based on the discovery of preferences, tendencies, and patterns of user behavior) recommendation systems play a significant role. Today, the most common implementations of recommendation systems are based on the following methods [
22,
27]:
Collaborative filtering—Most widespread in the application, generates recommendations based on a group of users with similar previous choices (explicitly—rating, sliding scale, ranking), implicitly—behavior tracking. This is a relational method, not with numerical but with qualitative linking.
Knowledge-based systems—Recommendations based on acquired knowledge about the user (past experiences), rules restrictions, based on one person, using artificial intelligence technology (e.g., artificial neural networks, as artificial intelligence technology are capable of “learning” from previous user interactions and adapting to their changing preferences).
Preference discovery based on optimization methods—One of the popular recommendation algorithms is based on a model that optimizes a certain goal to improve recommendation giving. The most common goal is minimizing the errors of predicting user desires/preferences (through preference discovery procedures) or, for example, maximizing the quality of recommendation ranking. With this approach, the system can more accurately predict what the user wants and provide more relevant recommendations.
One of the key factors in establishing smart cities is data openness. The development of technologies such as the Internet of Things, crowd sensing, geolocation services, sensor networks, etc., now allows for the collection of a large amount of data, which benefits the development of passenger and driver information/planning services that will be “tailored to the modern” user. Without openness and availability of traffic data, travel planning systems cannot be fully useful, and therefore attractive to the end user. According to EU directives, each member state establishes a National Access Point (NAP) that will represent a single access point for accessing travel data (static and real-time) of various modes of transport [
28,
29]. To provide a recommendation aligned with the preferences of the end user (in this case—drivers), the recommendation system requires information about user preferences in two ways: explicitly (through posed queries, service/product ratings; the so-called setup profile) and implicitly, i.e., by tracking user behavior and discovering and recording preferences [
30]. In this regard, the user profile is a key element of such systems because it records preferences, interests, and other relevant attributes during interaction with the user, which is upgraded over time (and with more interaction). More and more recommendation systems are approaching the real needs of users, thus providing a personalized experience [
31,
32].
The needs of drivers for recommended routes, which are in line with their needs, are growing increasingly. The same applies to multimodal (cooperative) travel guides [
33]. The limitation of existing (traditional) route guidance systems is evident in the limited possibilities for personalization. This is particularly important when planning routes (including guidance to parking spaces, as well as guidance in parking lots and garages) in a complex environment like urban areas. For instance, drivers of larger vehicles (with more passengers or small children; for example, “family parking”) may seek parking with larger parking spaces to park more easily, while drivers of small city cars are looking for any available spaces due to the smaller size of the vehicle. Similarly, people with disabilities are looking for accessible parking with special spaces for people with disabilities. Furthermore, attributes like the shortest or fastest route, including distance, driving time, and the number of signalized intersections, are no longer sufficient for the modern driver. Wang et al. [
24] introduced a Personalized Route Planning System Based on Driver Preferences model (DPRP) in their article, which can propose the optimal route considering a more comprehensive set of driver preferences. The authors note that there are various attributes that can influence a driver’s choice when planning a route, such as scenery, the radius of curvature, the number of lanes, lane width, distance, congestion, traffic flow, the number of pedestrians and cyclists, congestion rate, time cost, fuel consumption, tolls, the number of traffic lights, the number of intersections, the number of turns, and the separation of motor vehicles from non-motor vehicles. The model uses preference matrices to discover the driver’s inclinations towards certain road segments (in the study, the route is divided into segments). These preferences are then used to adapt the route to the driver, considering various factors such as traffic congestion, closed roads, and other traffic situations. The authors delve deeply into the importance of weights in the DPRP model. Weight values are crucial for quantifying the driver’s preferences towards different road segments. Through the process of associating weights with different road segments, the model can more accurately reflect the driver’s inclinations and provide routes that align with his or her preferences. Weights are, therefore, an integral part of the Personalized Route Planning System, allowing for fine-tuning of the route according to the individual affinities of the driver. Weights are assigned to individual attributes in their research by analyzing large data sets and by directly questioning drivers where the values of each option are, as follows: “Most important”, “Very important”, “Important”, “Slightly important”, “Least important”, and “No importance at all”. In cases where the driver cannot fully articulate their desires, the model is equipped to assist with recommendations. Through optimization methods (reducing the complexity of the road network, eliminating invalid sub-routes, and considering the weights assigned to attributes by users), it is possible to recommend a route that best matches the driver’s preferences.
3. Traffic Modeling for Parking Application
In the traffic modeling for parking application, a detailed exploration of the road traffic system using microsimulation tools is undertaken, emphasizing its relevance to the implementation of Smart Search for Parking in urban areas. The objective is to establish a precise and realistic model of the infrastructure, contributing to an enhanced understanding of traffic dynamics for the optimization of intelligent parking solutions [
3]. The results of microsimulation analysis were obtained within a certain time interval that evaluates output indicators such as queue length, travel time, travel cost, average vehicle speed, and exhaust emissions.
The simulation created is based on a traffic model where a certain percentage of vehicles are equipped with a parking guidance system. The system makes real-time decisions about the route from the current location (origin) to the parking lot (destination). In addition, guidance information is dynamically updated and route selection is suggested based on various criteria, such as parking lot occupancy, travel time, travel duration, cost, etc.
3.1. Route Choice Models
Optimal route selection models help considerably in analyzing and understanding passenger behavior. They also form an essential element in the application of the traffic distribution method. The modeling problem can be deterministic or stochastic in nature. The user equilibrium problem with determinism is shown by the fact that the route choice model assumes that the traveler has all the information about the cost of the trip and therefore chooses the route with the lowest cost. The user equilibrium with the stochastic problem assumes that the traveler does not have the necessary information about the cost of the trip, so the model chooses the route that minimizes the cost. In the dynamic traffic assignment model, the route choice is already predetermined when the network structure is loaded [
3].
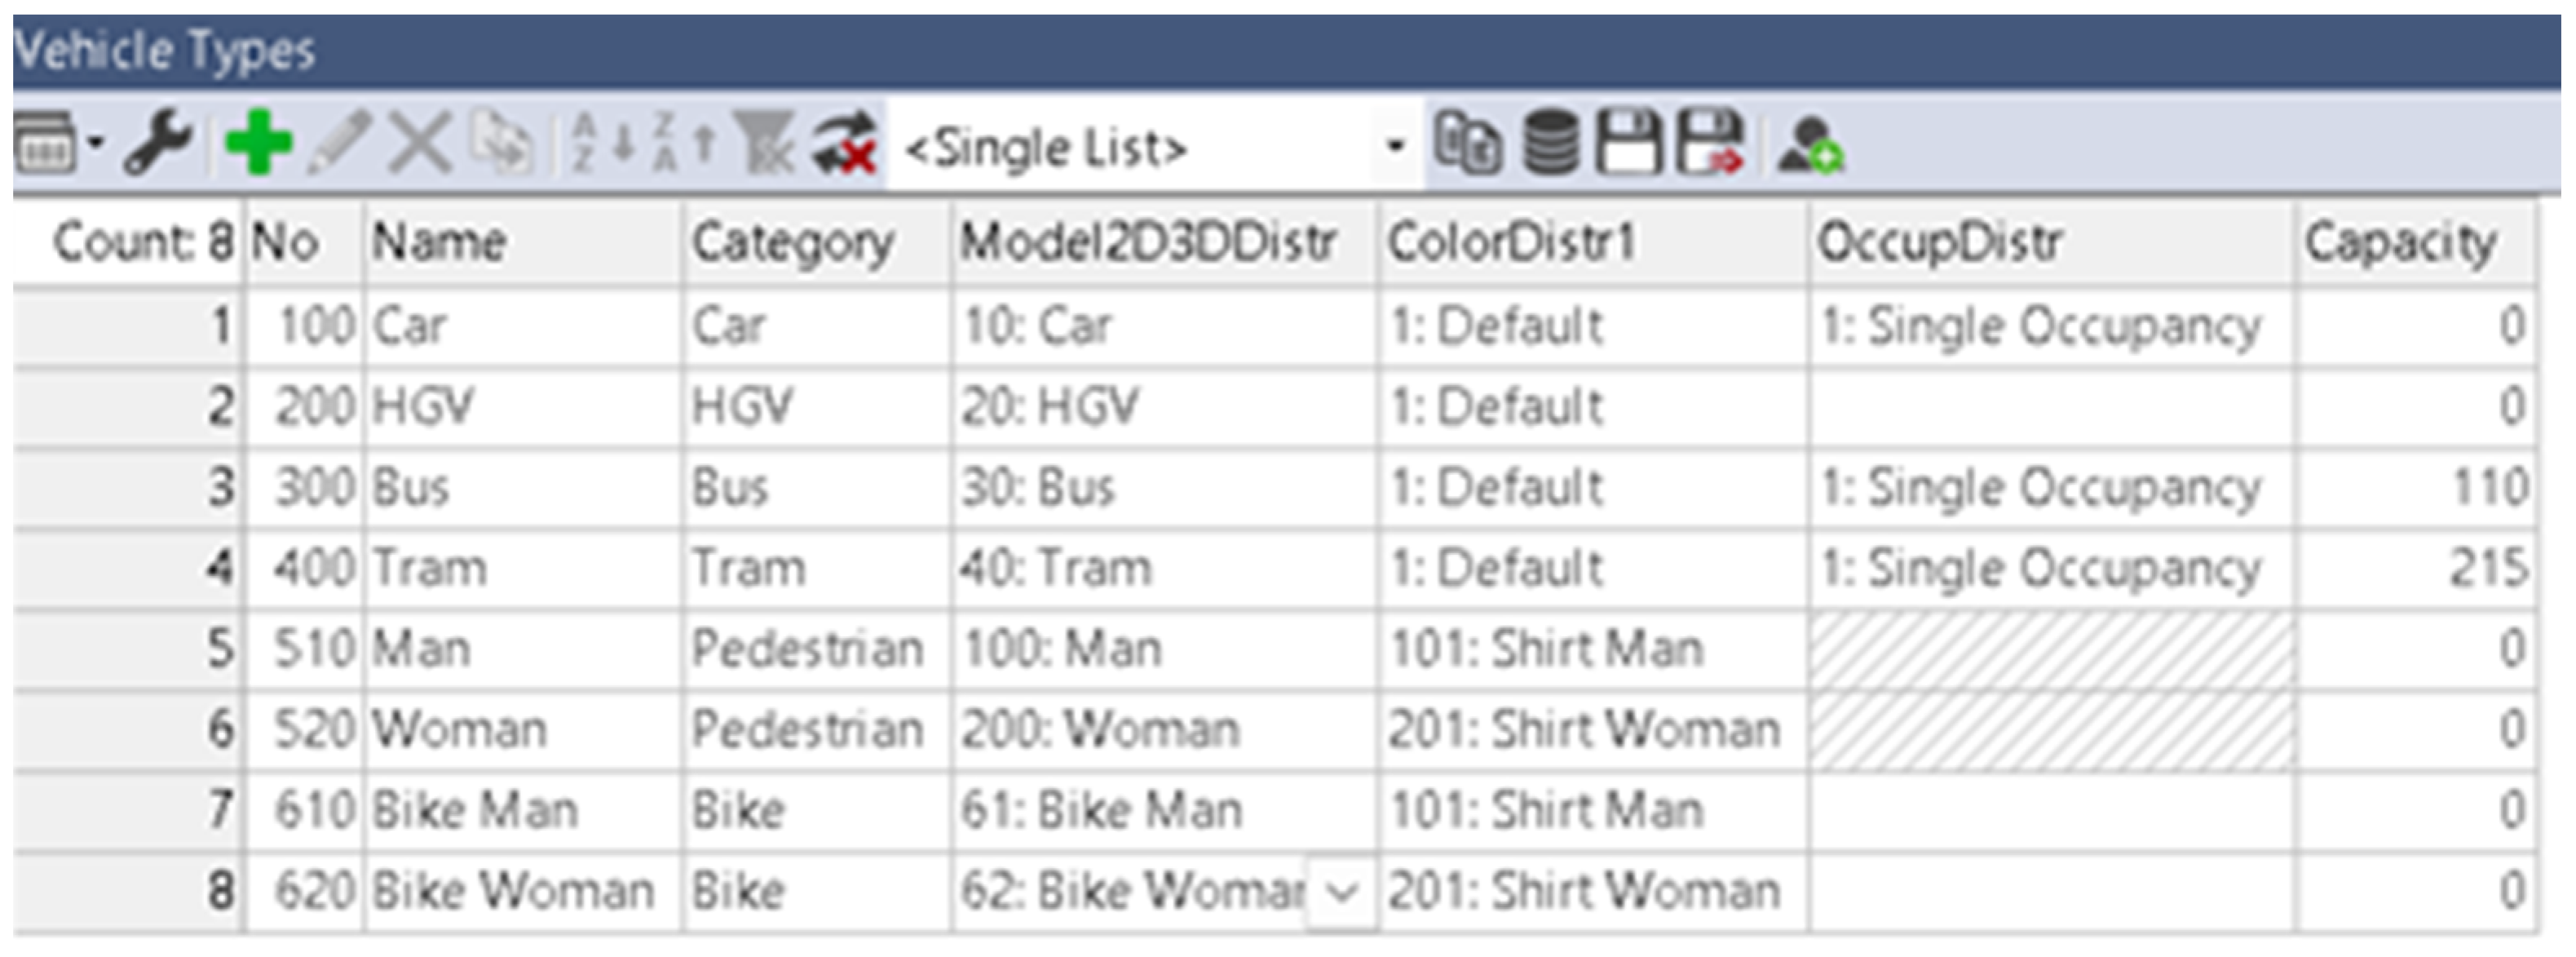
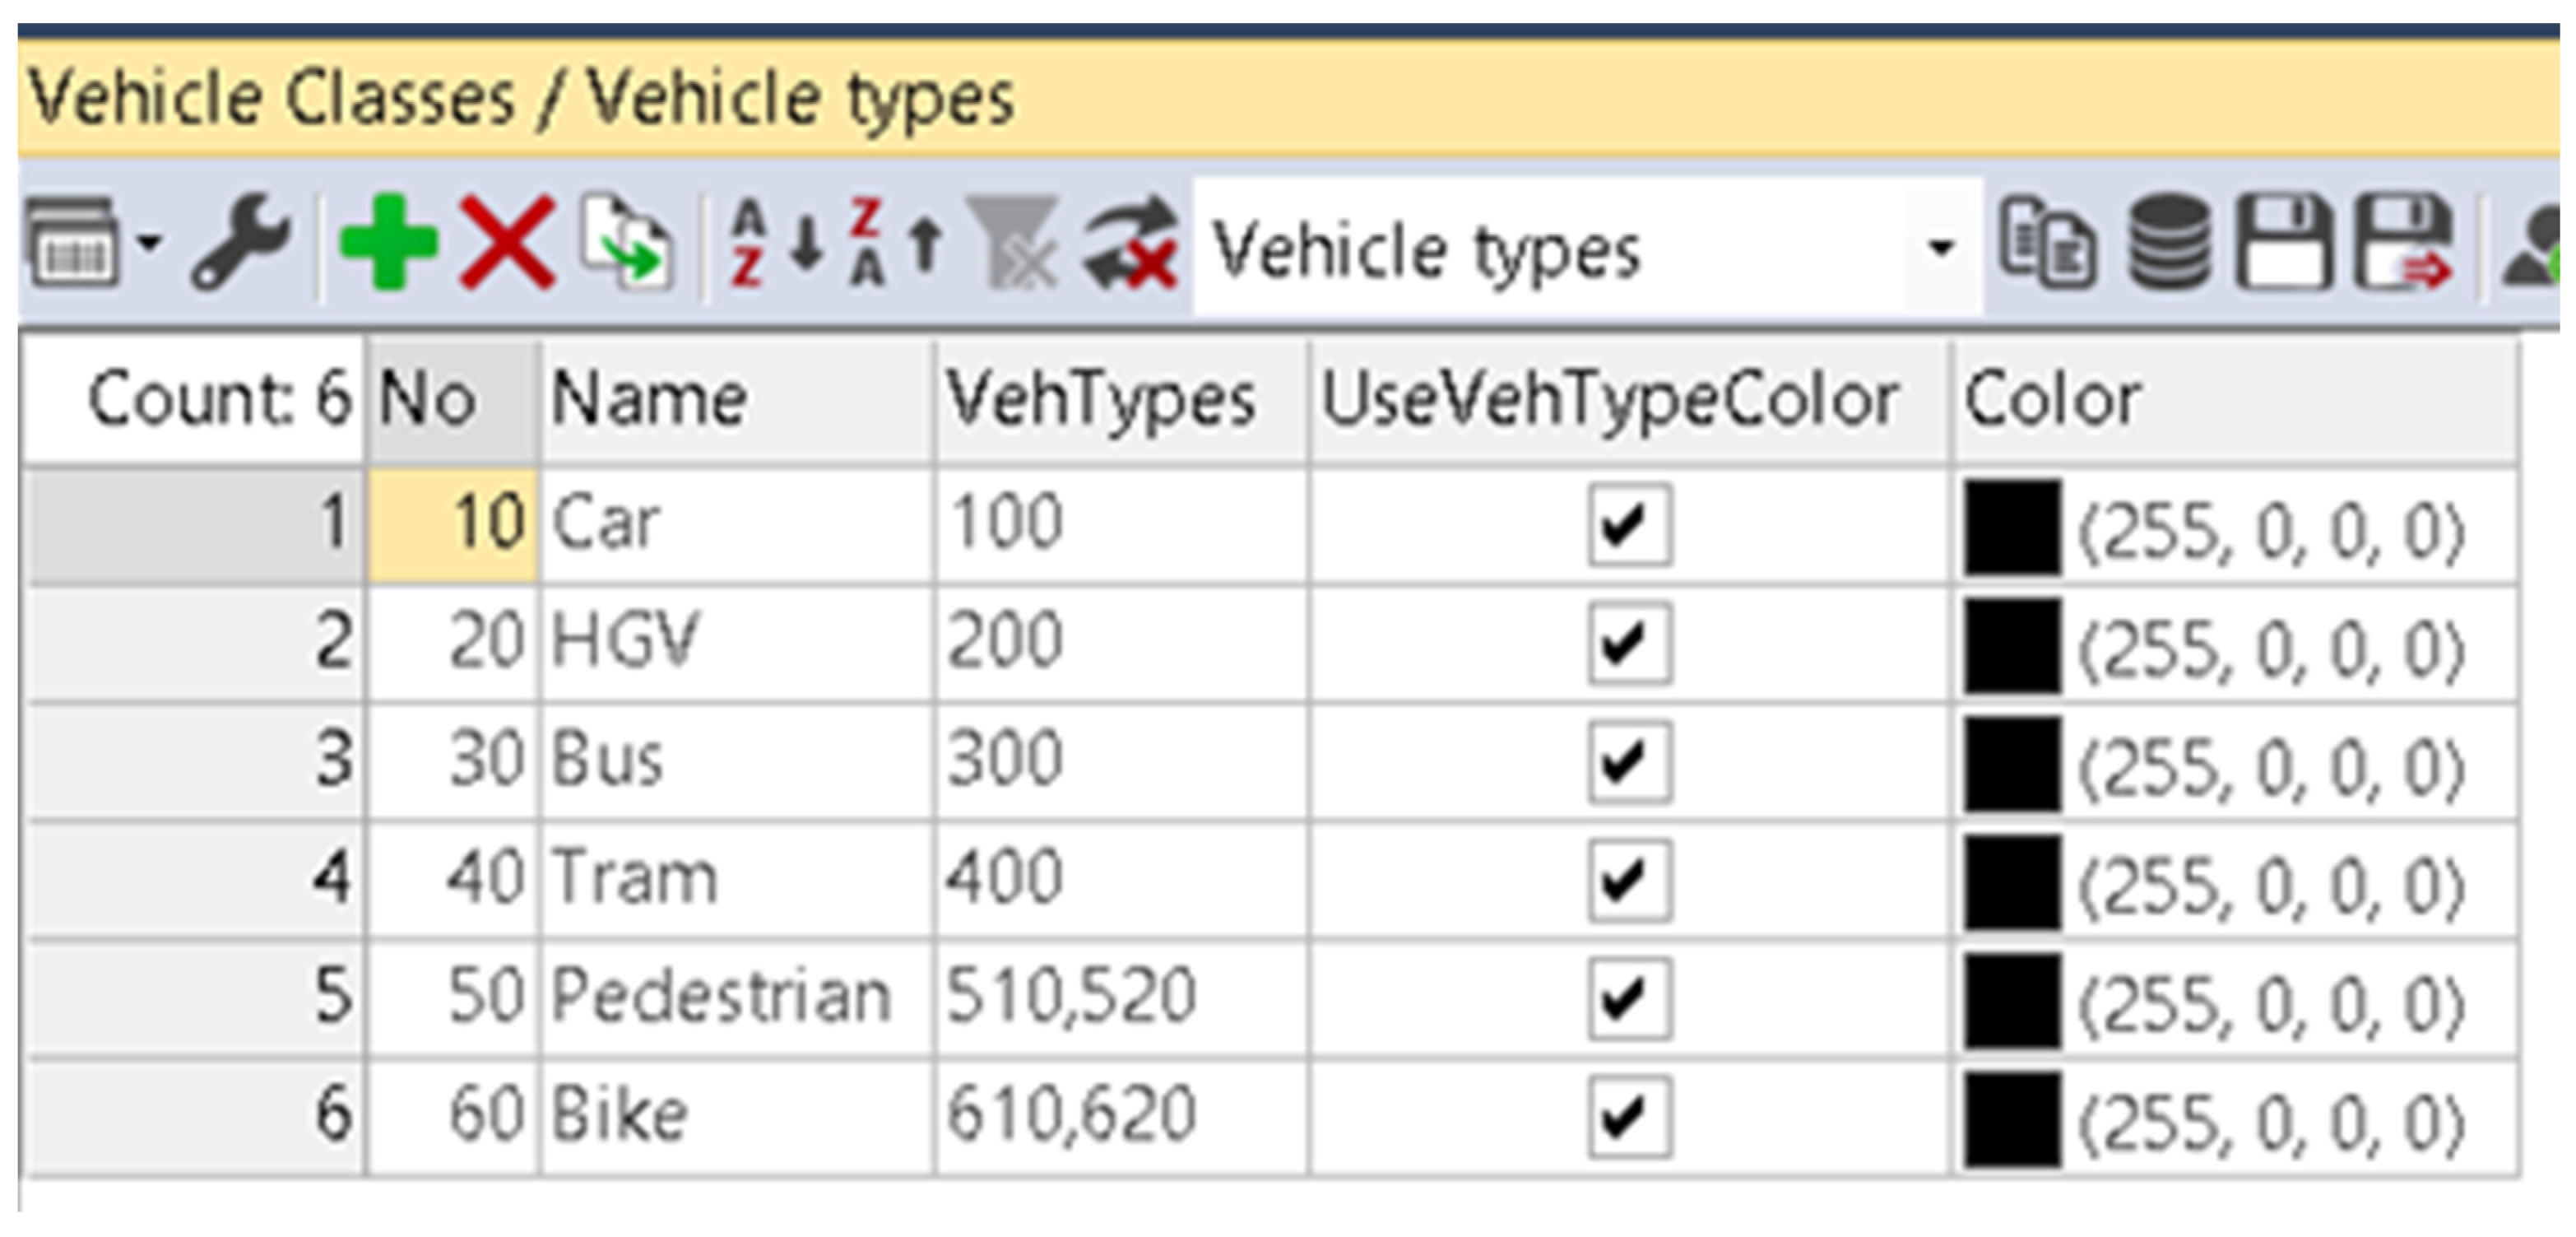
In this research, an abstract model of the city center was created at the microscopic level. The values of the measured parameters were obtained using the PTV Vissim simulation tool. The PTV Vissim simulation tool is based on the C++ programming language and object-oriented programming. Due to the available application programming interface, it is also suitable for the use of independent control or another algorithm. When defining the direction of the vehicle’s movement, it is possible to choose between static routes with predefined loading points for the vehicle and dynamic routes. In a dynamic assignment, traffic demand is specified in the form of one or more origin–destination matrices, which allows the road network to be simulated without having to manually define routes and enter vehicles [
34]. Vehicles entering the traffic network should have a specific type, class, and category of traffic units (
Figure 1).
Vehicle composition refers to the distribution and characteristics of different vehicle types in a traffic simulation. It is created by specifying the proportions of vehicles in the model. To better assess the impact of different vehicle types, it is possible to place them in the same vehicle class if they share similar characteristics.
3.2. Driver Behavior
Since driving styles are not the same for every driver, specific features are combined to create representative parameters for driving behavior when building a traffic flow model. The types of driving behaviors are identified according to the value of the attribute on [
34]:
- -
Urban (motorized);
- -
Slow lane rule (motorized);
- -
Outside the city (free choice of lane);
- -
Footpath (no interaction);
- -
Cycle path (free overtaking).
The behavior of drivers in traffic flow changes according to algorithms based on the behavioral rules established according to the versions of the psychophysical model of traffic flow Wiedemann 74 and Wiedemann 99. The versions are based on the assumption that motorists can be in four states [
3]:
- -
Free driving—reaching the desired speed with a tendency to maintain it constant;
- -
Approaching—adjusting the speed of the vehicle concerning the movement of the vehicle in front;
- -
Following—following the vehicle in front, maintaining a safe distance without sudden acceleration and deceleration;
- -
Braking—when reducing the safety distance, the vehicle slows down with the intention of re-matching the driving speed.
During driving, the stated states change when crossing a threshold that is a function of the difference in speed and distance. The Wiedemann 74 version mainly defines the maximum acceleration and deceleration functions for passenger vehicles. The driver and the vehicle can have different attributes, which are divided into three groups [
3]:
- -
Technical specification of the vehicle;
- -
The behavior that describes the entity;
- -
The mutual dependence of driver and vehicle.
The Wiedemann 99 model is more often used for calculations within cities or in more complex urban environments. This is because the Wiedemann 99 model has an improved formulation that considers various factors of driver behavior such as overtaking, lane changes, and anticipation. Therefore, this model better simulates the complexities of traffic flow in an urban environment, while the Wiedemann 74 model is often used for calculations outside cities or in simpler rural environments. Since the Wiedemann 74 model is older and has a simpler formulation, it may be more suitable for simulating traffic on open roads and highways where interactions between vehicles are less complex.
3.3. Traffic Assignment
Traffic assignment is considered as a model based on which drivers choose a route. The first step in traffic assignment is to identify all possible routes and then evaluate them. The final step is to describe the way drivers make a decision based on previous evaluations.
Dynamic traffic assignment is based on iterative simulations using collected data on the total cost of the chosen route from previous iterations. Since it involves dynamic stochastic user balancing, dynamic traffic assignment is much more efficient in abstract traffic networks. Therefore, in contrast to the classical representation of the network with links and connections, an abstract representation is used where the links are represented by nodes. In dynamic traffic demand assignment using OD matrices, the observed area is divided into zones, while the matrix contains the number of trips in a given time interval. Moreover, the designated parking spaces in the model are not exclusively used as parking spaces but are considered entry and exit points of the traffic network depending on the usage zone. In other words, each parking is defined for a specific zone.
Another way to assign traffic is to use files containing trip chains. A trip chain is defined as the result of a trip with much more detail and requires more coding compared to the OD matrix. It is also possible to use trip chains in combination with the OD matrix in the simulation model to generate the traffic volume and achieve the predicted travel demand.
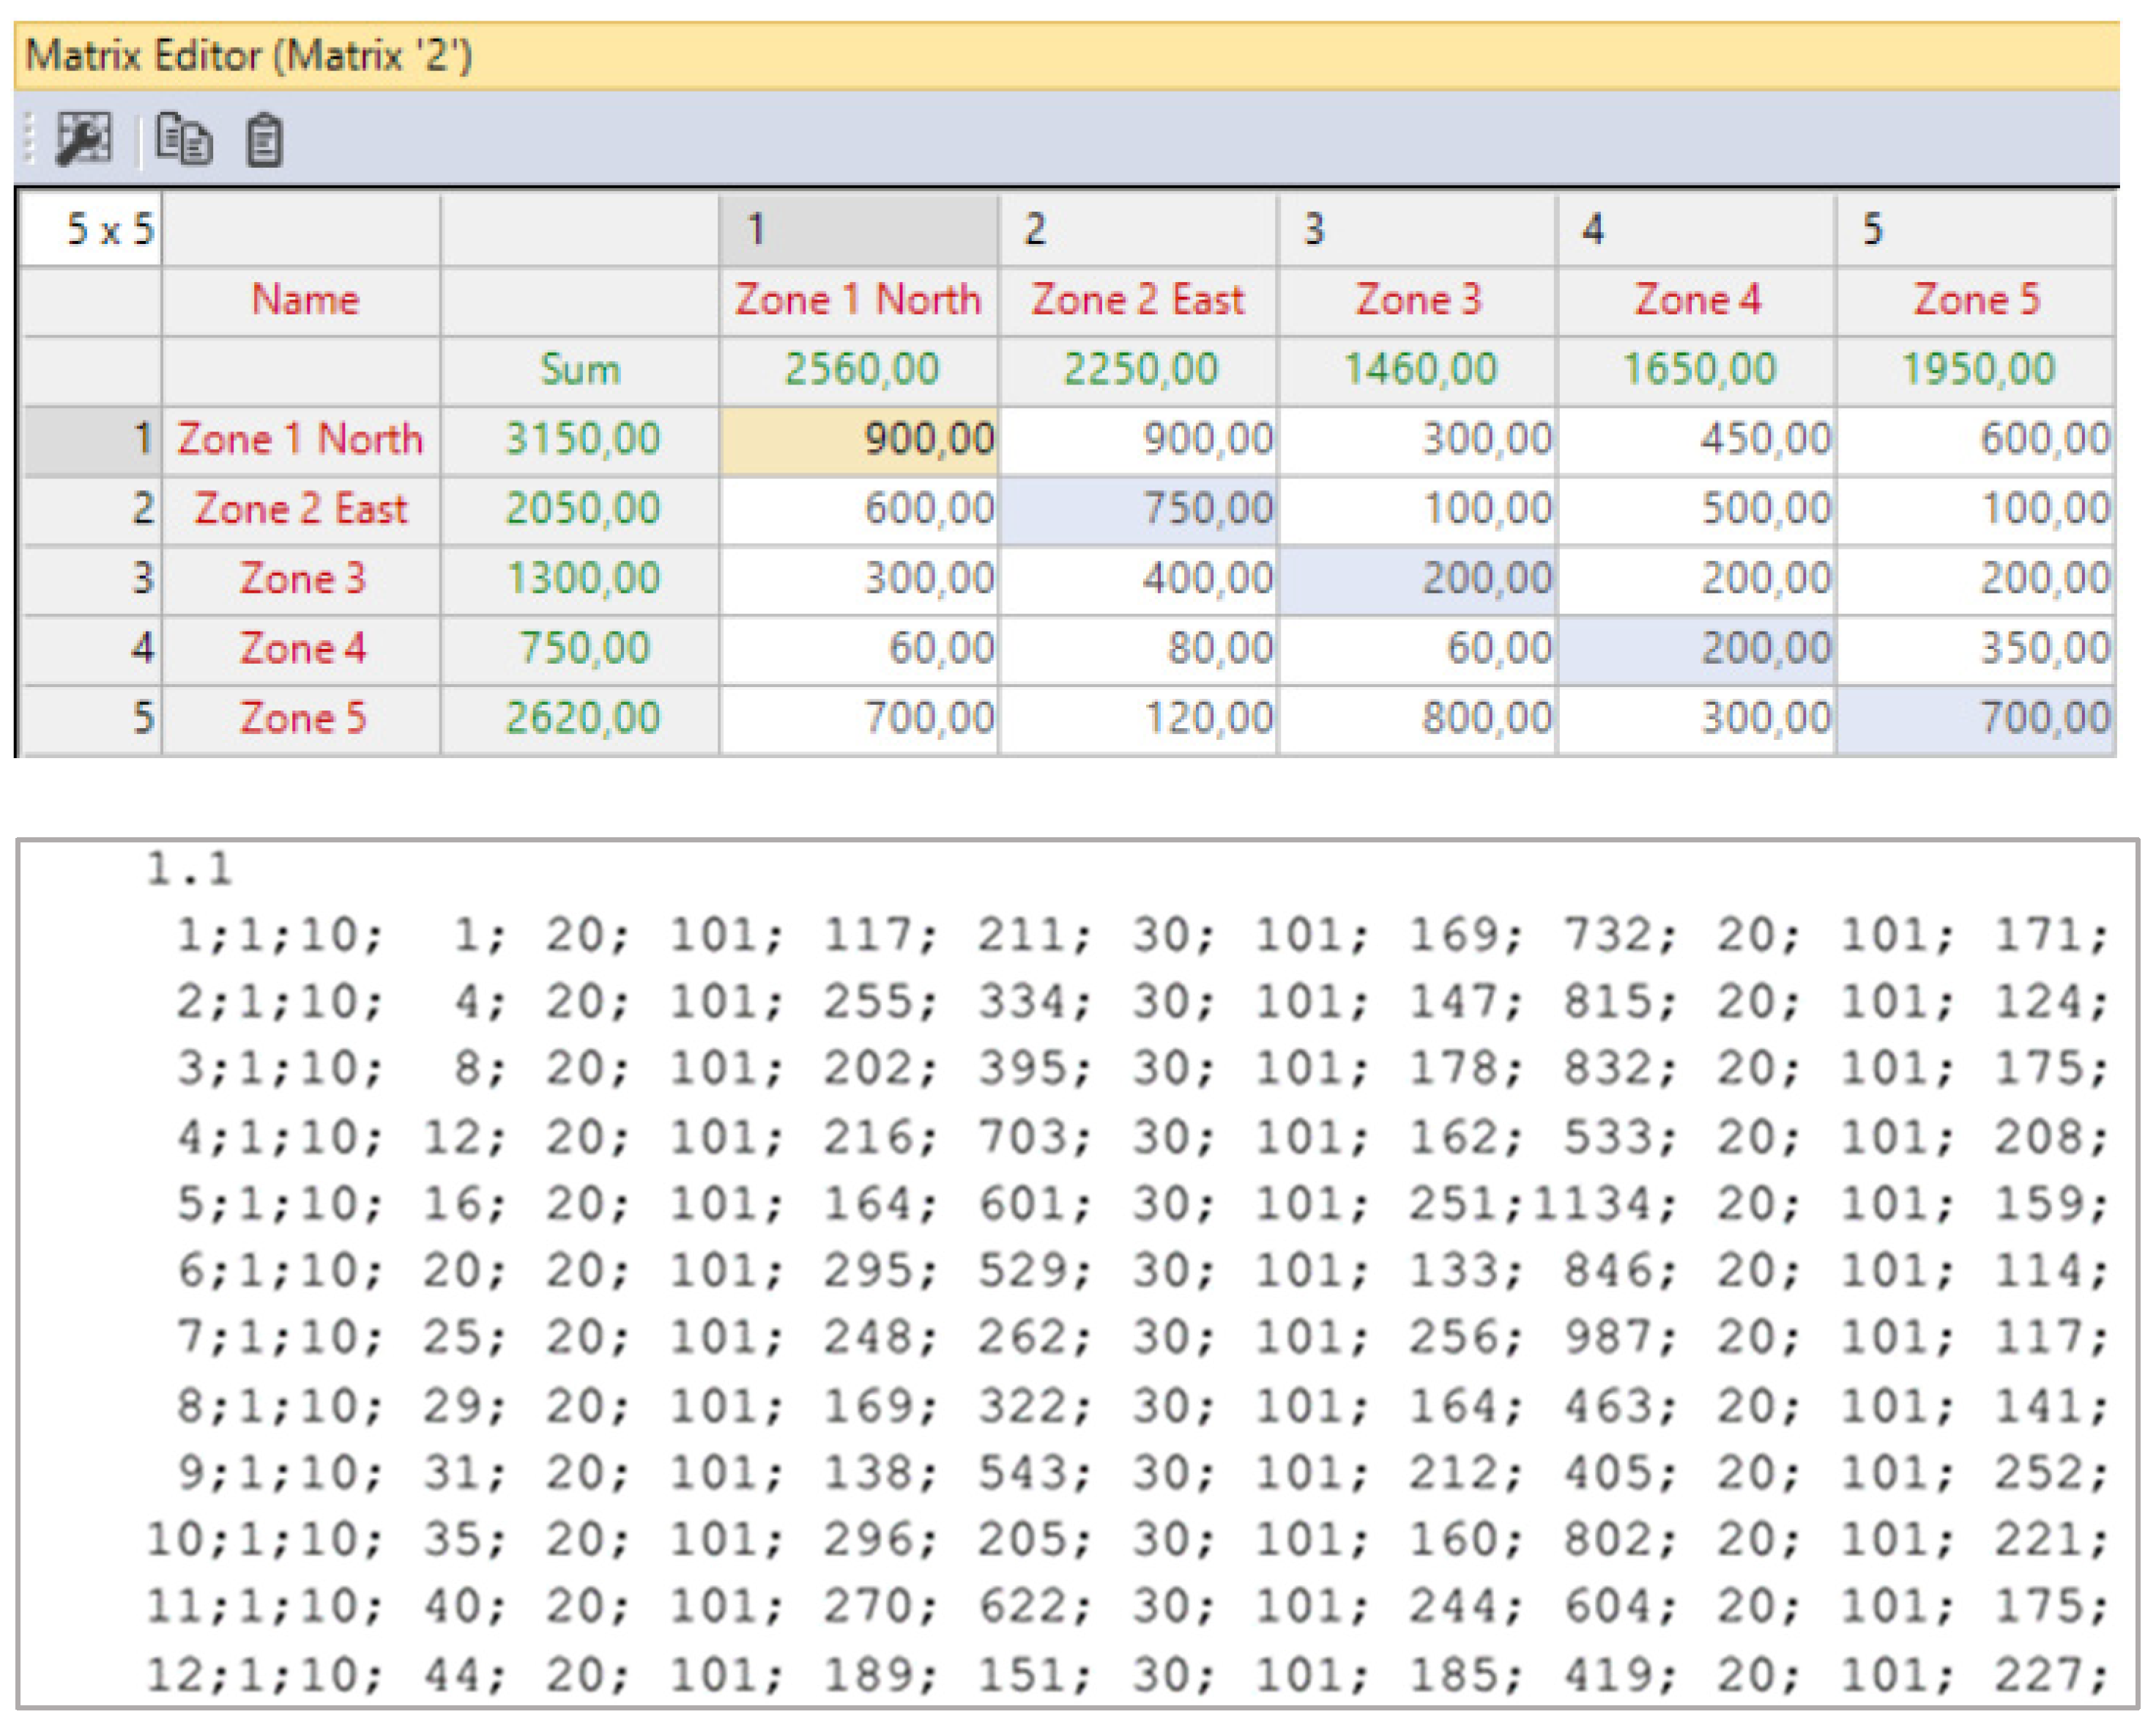
Figure 2 shows an example of an OD matrix and a travel chain:
The use of the trip chain file is a detailed description of a vehicle’s trip within the traffic network. Within the file, the first three columns refer to the vehicle number, the vehicle type, and the departure zone. The following columns refer to the time of leaving the previous zone, the number of the destination zone, the number of activities, and the minimum stay in the destination zone [
34].
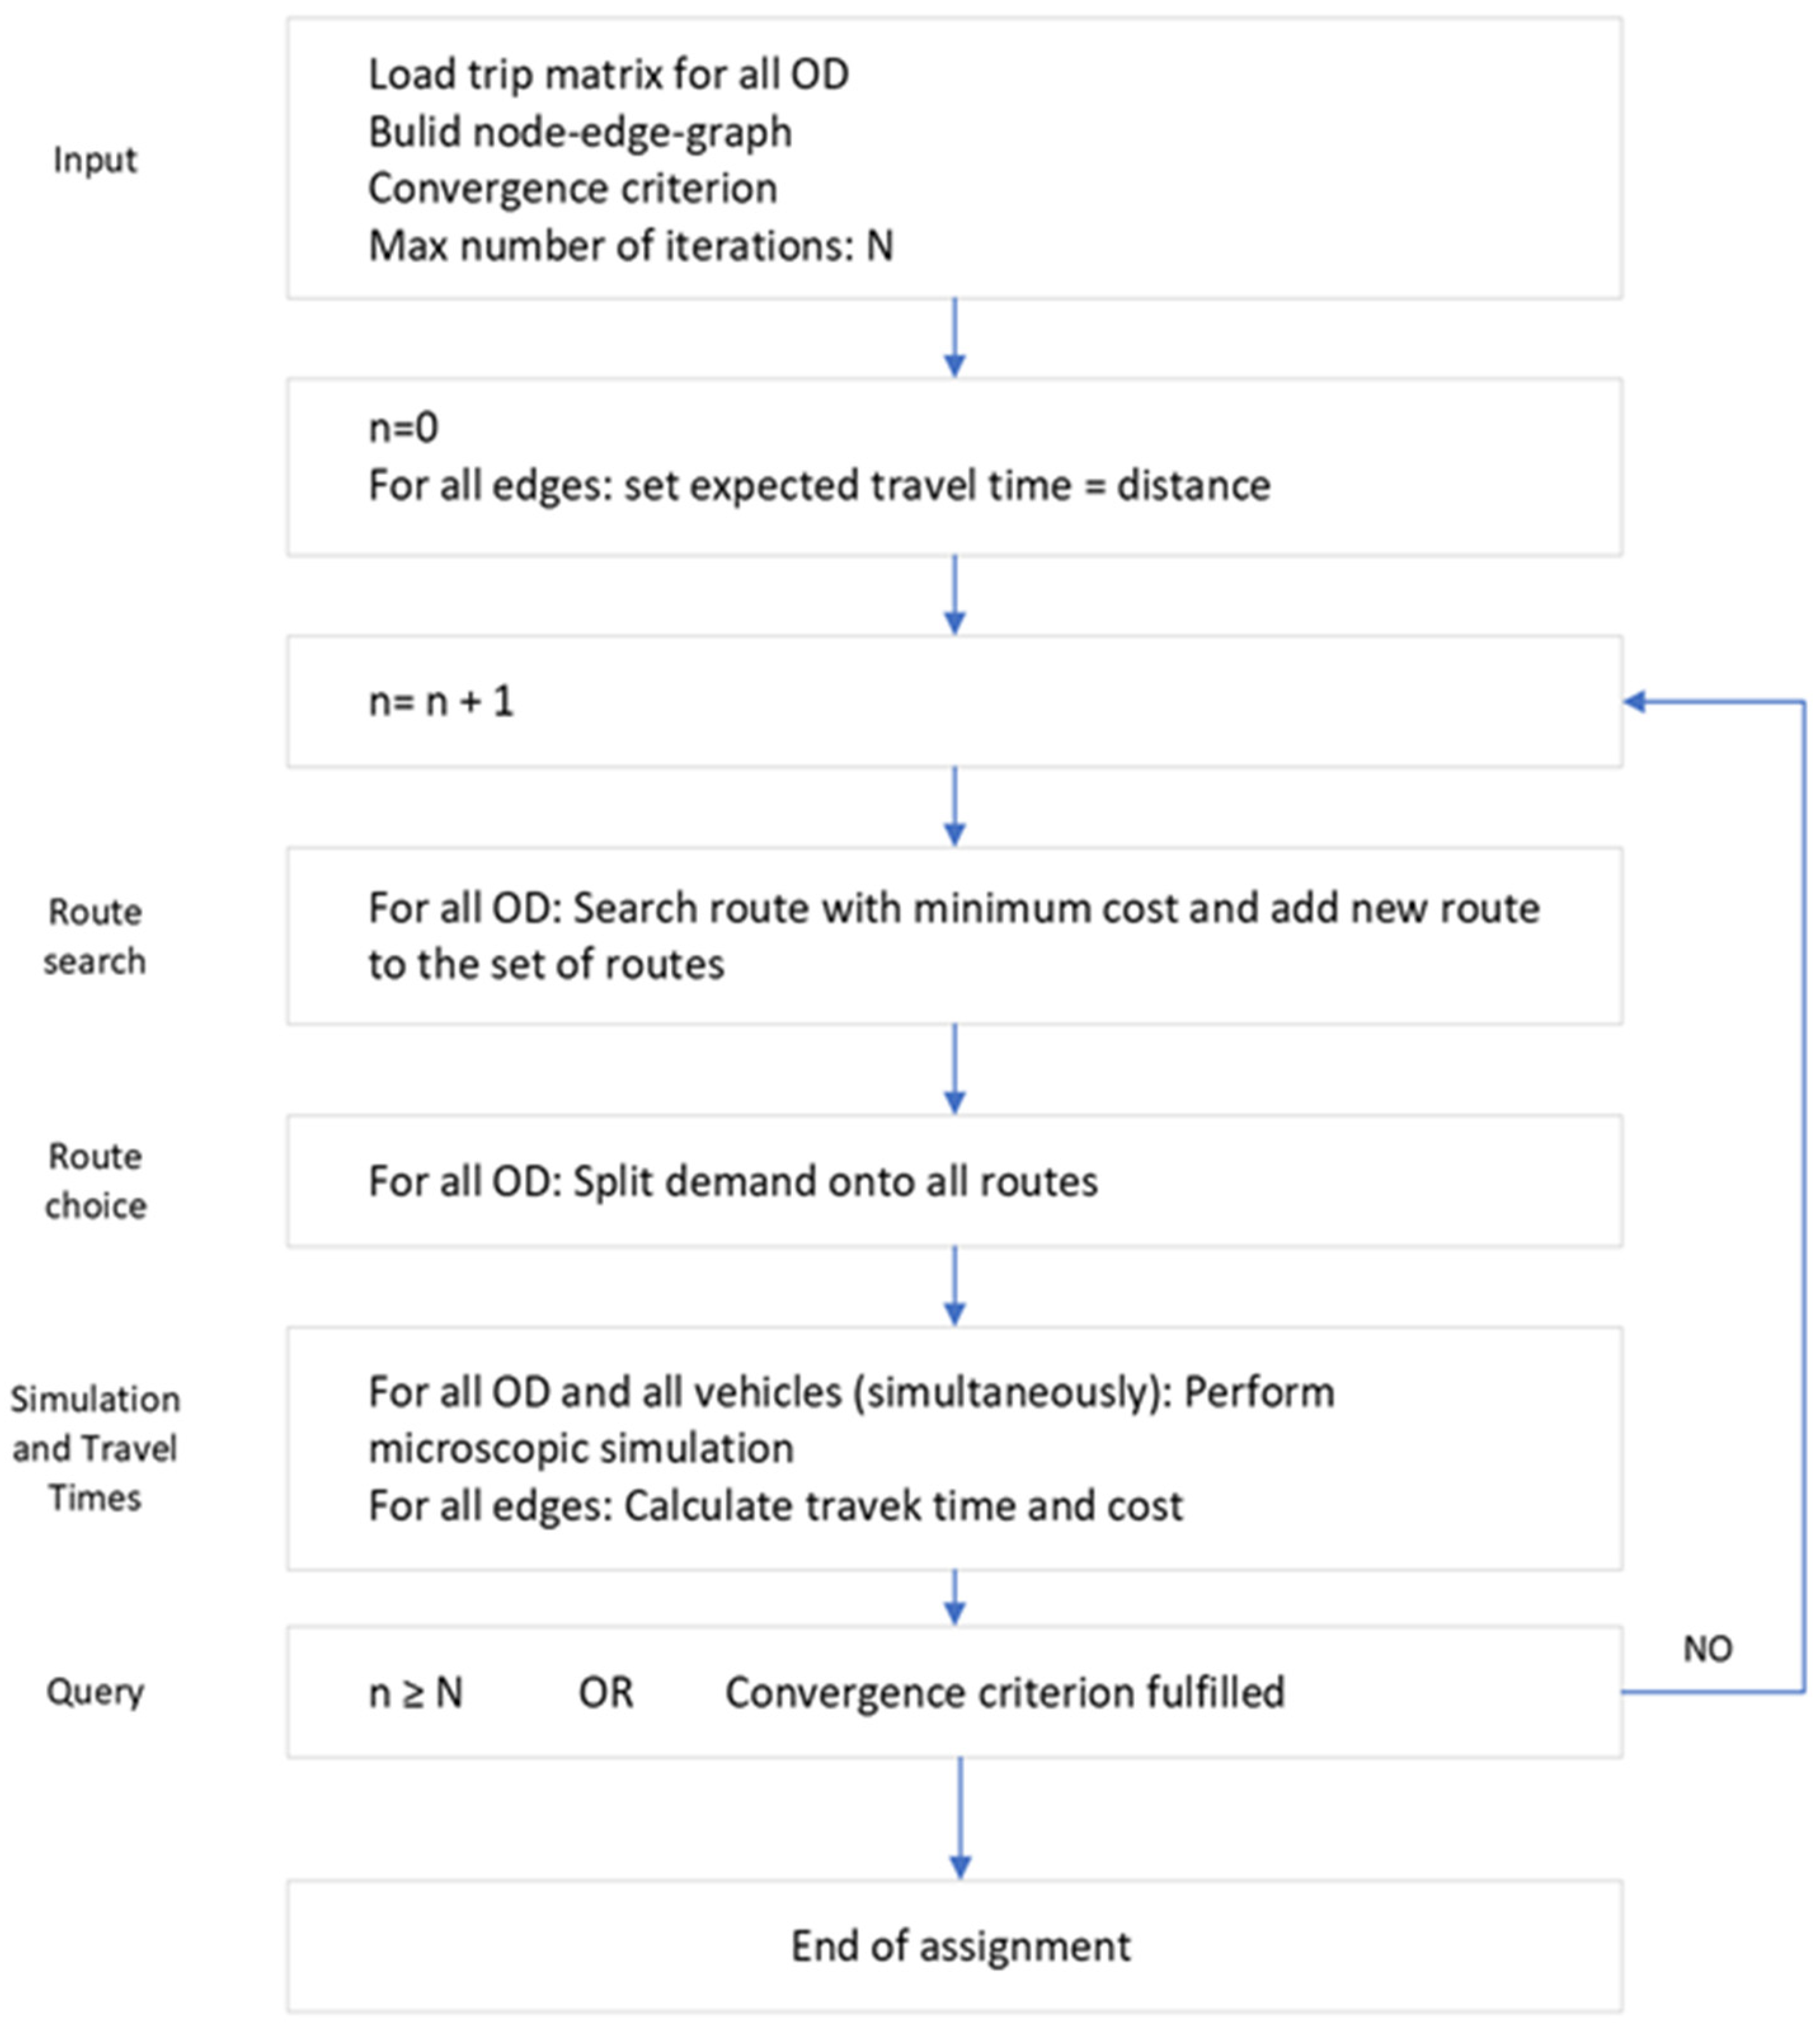
Figure 3 shows the principle of traffic assignment using the PTV Vissim simulation tool. The allocation method is based on parameter values that describe the behavior of the model. Moreover, depending on the state of the first simulation, the results can be saved for the next iteration.
4. Model of Guidance Vehicles to Available Parking Spaces
With the introduction of a broader set of attributes (which are further divided into specific sets) and the ability to assign weights by drivers (and experts), it is possible to achieve user satisfaction and influence congestion in urban areas. However, neuralgic points (from the driver’s perspective) in urban traffic are also parking lots and garages. By integrating attributes related to parking lots and garages, a more comprehensive solution could be achieved, enhancing the quality of user experience. In this context, the attributes can be divided into two sets:
- (A).
Guidance to the parking/garage:
- -
Selection or elimination of on-street parking spaces;
- -
Real-time traffic congestion assessment on the proposed route;
- -
Road condition (information on road works, closed lanes or other obstacles);
- -
Weather conditions (current weather information);
- -
Estimated time of arrival (ETA considering current conditions on the route);
- -
Alternative routes (suggested alternative routes in case of jams or obstacles);
- -
Low emissions zone—LEZ (information on restricted access zones or special tariffs);
- -
Parking pricing (information on parking prices at different locations);
- -
Parking space availability (real-time information on the number of free spaces in specific garages or parking lots).
- (B).
Guidance at the parking lot/garage:
- -
Real-time availability of parking spaces (dynamic updates on the locations of free parking spaces within the parking/garage lot);
- -
Reservation capability;
- -
Parking space size (information on the size and type of parking space (e.g., for small and family cars, disabled persons);
- -
Digital signposts (directing drivers to free spaces or exits);
- -
Parking pricing (details on parking tariffs, special offers, discounts);
- -
Parking time (ability to track parking time and notifications about time expiration);
- -
Security cameras (information on the presence of security cameras or security personnel);
- -
Access points (locations and directions to elevators, stairs, exits or other important points within the parking lot);
- -
Electric charging stations (information on the locations and availability of charging stations for electric vehicles).
By dividing the attributes into two sets, the system is focused and efficient. The attributes in Set A can be used to provide drivers with information and recommendations that will help them find the most convenient and efficient route to the parking lot or garage. The attributes in Set B can be used to provide drivers with information and assistance once they have arrived at the parking lot or garage.
This is a more efficient way to use the system because the system does not need to collect and process all the attributes for every driver. Instead, the system can just focus on the attributes that are relevant to the driver’s current situation.
In addition, dividing the attributes into two sets makes the system more adaptable. The system can be easily modified to add or remove attributes as needed. For example, the system could be modified to add attributes that are specific to a particular type of parking lot or garage.
Overall, dividing the attributes into two sets is a more efficient and adaptable way to design a personalized navigation system for guiding vehicles to available parking spaces.
Considering the attributes for guidance to parking lots and garages, the personalized navigation system would be designed as follows: at the beginning of its use, the user would create their profile during which specific queries would be posed. The goal of these queries would be to explicitly collect weights for individual attributes, using ranking methods and rating scales, all including attributes related to parking lots and garages. In previous research, it has been observed that preferences revealed after completed activities most accurately describe user behavior. It has been concluded that it is best to identify appropriate preferences (expressed, for example, through numerical values of corresponding criteria) for each user individually, as opposed to certain approaches based on the preferences of the respective population to which the user belongs (based on some principle). To ensure continuous relevance and precision of the system in relation to user preferences, a dynamic model is proposed that would periodically update information on user preferences, based on their previous choices, thus allowing for a finer adaptation of the user profile.
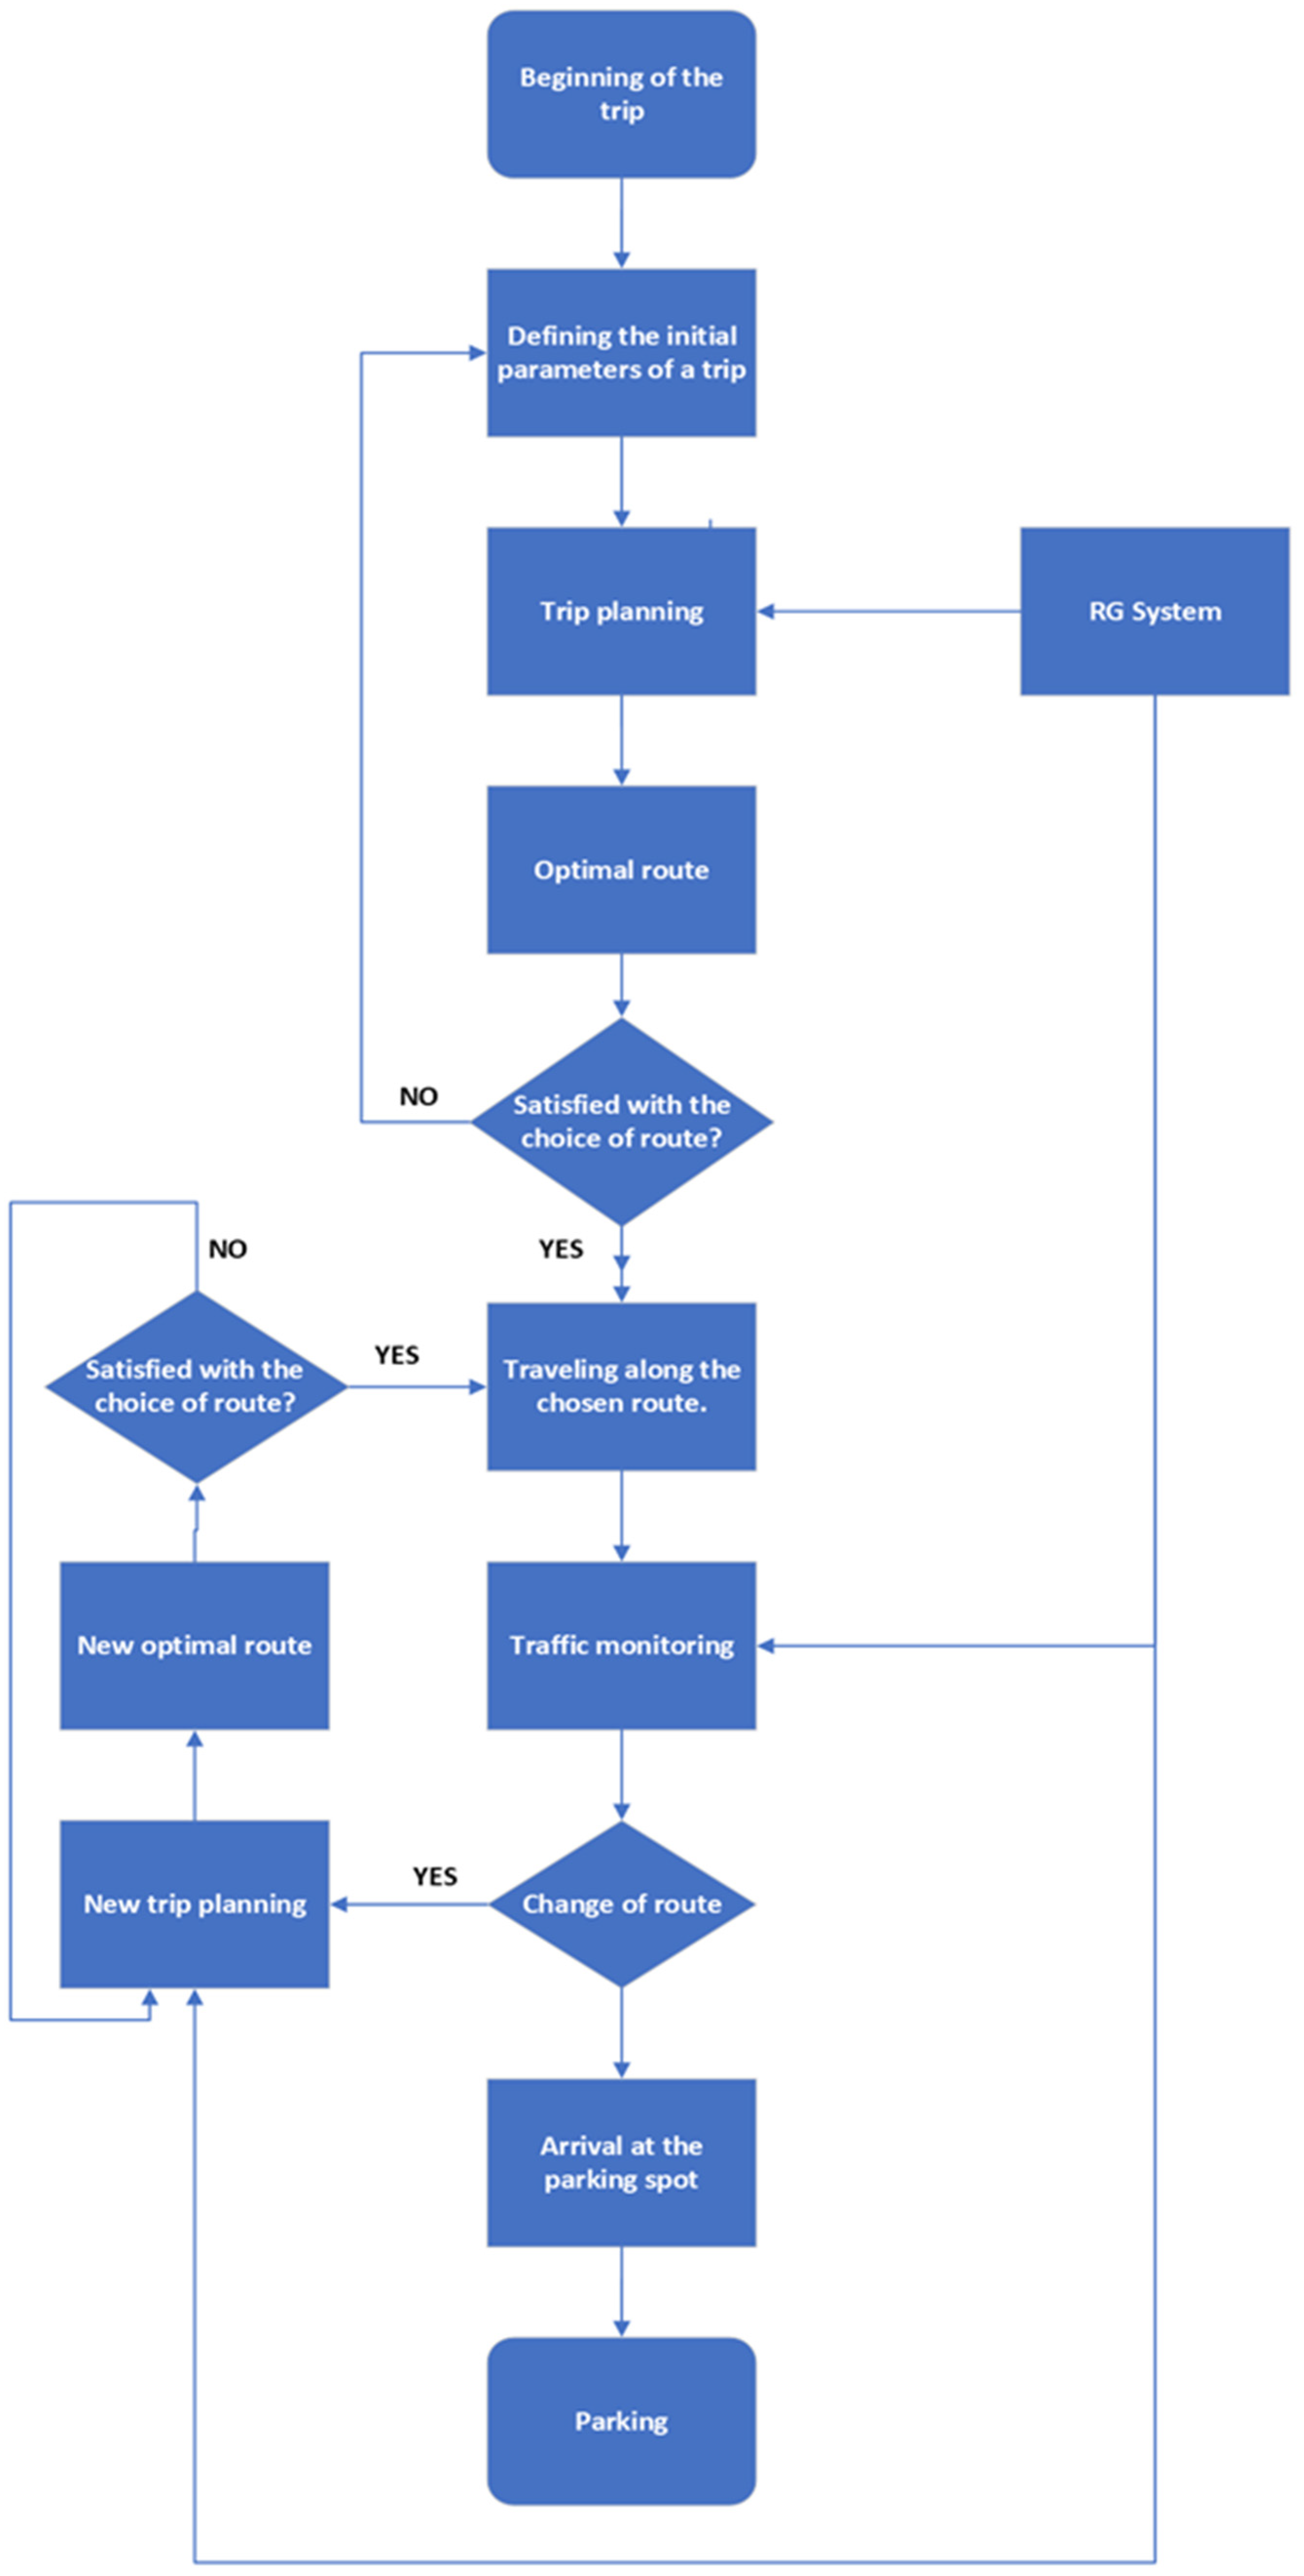
When utilizing the system to direct the vehicle to an available parking space, the driver obtains insights about the best path (based on prevailing circumstances, traffic, and established parameters) starting from their current location to their endpoint, which is the nearest available parking to their desired destination. If the driver modifies their route, such as incorporating a new location of interest, the system recalculates to find the most suitable path based on the updated requirements. Throughout the journey, the system continuously monitors the ongoing traffic conditions and alerts the driver of any significant changes. If, based on the gathered data, the system identifies a more fitting route in alignment with the set parameters, it timely notifies the driver. There can be many reasons for changing the route, for example, if there are no free parking spaces, the system changes the travel route and directs the driver to the nearest available parking space. Of course, this situation is also possible in parking lots that do not offer the possibility of reserving a parking space. The operation of the simulation model with the system for guiding vehicles to an available parking space is shown in
Figure 4.
4.1. Travel Time
Travel time depends on factors such as traffic volume and road infrastructure, so travel time varies depending on the time of day. To simplify the consideration of travel time, the total simulation time is divided into evaluation intervals, which usually have a duration from 5 min to half of the time interval of the OD matrix.
Travel time during the simulation is measured on each edge or path between two nodes. For each vehicle traveling between two nodes, the program records the time taken. Thus, the travel time is the average of all travel times spent on that edge and is considered the resulting travel time at that point. If the vehicles stay longer than the duration of the evaluation interval, it means that the level of service has decreased due to traffic congestion. In addition, if the vehicles remain stationary (due to congestion), the travel time does not refer to the route search in the current iteration, but to the next one.
The simulation tool, which uses MSA (Method of Successive Averages) and the exponential smoothing method, uses data from the current and all previous iterations. MSA is used to calculate the arithmetic mean of all iterations and use this calculation to determine the weighting factor. As the number of previous iterations in the calculation increases, the influence of each subsequent iteration decreases [
34].
In the above Formula (1), N represents a user-defined value, Kei represents the index of the evaluation interval in the simulation period, n represents the index of the assignation iteration, ir represents edge index, represents measured edge travel time for a period to iteration n, represents expected edge travel time and for period K to iteration n, and represents variable smoothing factor dependent on parameter N and assignment iteration index.
In the exponential smoothing method, the influence of previous iterations is calculated using a user-defined smoothing factor. The first iterations have the least impact. The smoothed travel time is calculated by summing the old, smoothed values of the previous iteration and the new values of the current iteration [
34].
In this Equation (2), N denotes a value set by the user, Kei refers to the evaluation interval’s index during the simulation, n is the allocation iteration’s index, ar stands for the edge’s index, indicates the observed travel time on edge a during iteration n, signifies the anticipated travel time on edge a for period k in iteration n, and represents smoothing parameters.
Selecting the best route involves more than just travel time; costs are also a factor. Travel costs are viewed as a mix of travel time, distance, and other fees, such as tolls. The cost components for vehicles are set based on their class. The overall cost (
C) for each edge is computed using [
34]:
In the mentioned Formula (3), α, β, γ represent weighting factors that can be used to determine the different behavior of a group of drivers when choosing a route, s represents a factor determined by the geometry of traffic sections, represents the sum of the costs of all traffic sections that make up one edge, and represents the additional cost of a traffic section.
4.2. Determining the Optimal Route
The optimal route is searched in each iteration of the dynamic assignment as the times change until the convergence criterion is met. The program writes the optimal routes obtained through iterations to a file (.weg). Records from the specified file are used in future iterations.
Choosing the appropriate route defines the overall cost. Given that the first iteration cannot use records from previous iterations, it therefore uses the length of the path. To speed up the finding of new paths in the following iterations, a travel time of 0.1 s is added to those vehicles that did not pass the edges to increase their attractiveness when searching for a route.
The route is defined as a series of edges that describe the path through the network, while the beginning and end of the route are considered parking spaces. The route cost is defined according to the general costs of all edges, which can be expressed as Formula (4) [
34]:
In the given Formula (4), C represents the general cost, R represents the route, and r represents the border.
By leaving the place of origin, drivers choose a route and use all known roads in such a way that a greater proportion of vehicles will be distributed along better roads. The utility (2) of roads is evaluated using the reciprocal of overhead costs.
In the mentioned Formula (5) [
34],
Uj represents the utility of road
j, while
Cj represents general travel expenses
j.
The Logit function is used to determine the behavior of vehicles in the traffic network.
In the above formula [
34],
Uj represents the utility of road
j,
p(
Rj) represents the probability of choosing path
j, and
μ indicates the sensitivity parameter of the model (>0).
The values of the sensitivity parameter determine whether the drivers will use the best route or if there will be no impact on the utility of the routes. If the default value of the sensitivity parameter is low, the distribution will not have a great impact on utility, while a high value determines that vehicles mostly use the best route.
For approximating the estimation and distribution of traffic demand along all known routes of a set of OD pairs, the Kirchhoff distribution formula is used.
In the given Formula (7) [
34],
Uj represents the utility of path
j, then
p(
Rj) represents the probability of choosing path
j, and
ko indicates the sensitivity parameter of the model.
4.3. Choice of Parking Lot
The traffic demand in the OD matrices refers to the identified zones. In the traffic network, zones are determined by parking spaces. Before choosing a route, the driver selects a parking space using discrete choice theory. Also in this situation, the logit formula and the utility function with the attributes of the parking lot are used.
Parking lots can be used for three purposes in the transportation model. In the first method, parking lots can be used as connector zones, i.e., they represent entry and exit points in the traffic network. The second method refers to an abstract parking lot, where vehicles slow down when approaching the parking lot and are deleted from the traffic network after stopping. In the third method, the parking lot refers to a “real parking lot” where the decision to park at a certain distance is made before the simulation begins.
There are several options for choosing a parking space. Vehicles can start their journey from the original parking lot. There is also an option to choose a parking space after a decision about dynamic assignment has been made. In addition, the selection of a parking space can be determined using the vehicle guidance system.
The utility for a parking space is expressed using Formula (8) [
34]:
In the above formula, represents the price of parking in the zone, Z presents the attractiveness of the characteristics of the observed zone, represents the air distance between the center of the destination zone and the parking space, represents the general costs of the cheapest route from the current position of the vehicle, fs represents the availability of parking spaces, ktv represents the vehicle type index, and ks represents the scenario index. Positive () and negative ( coefficients are determined by the user.
5. Simulation Model Development
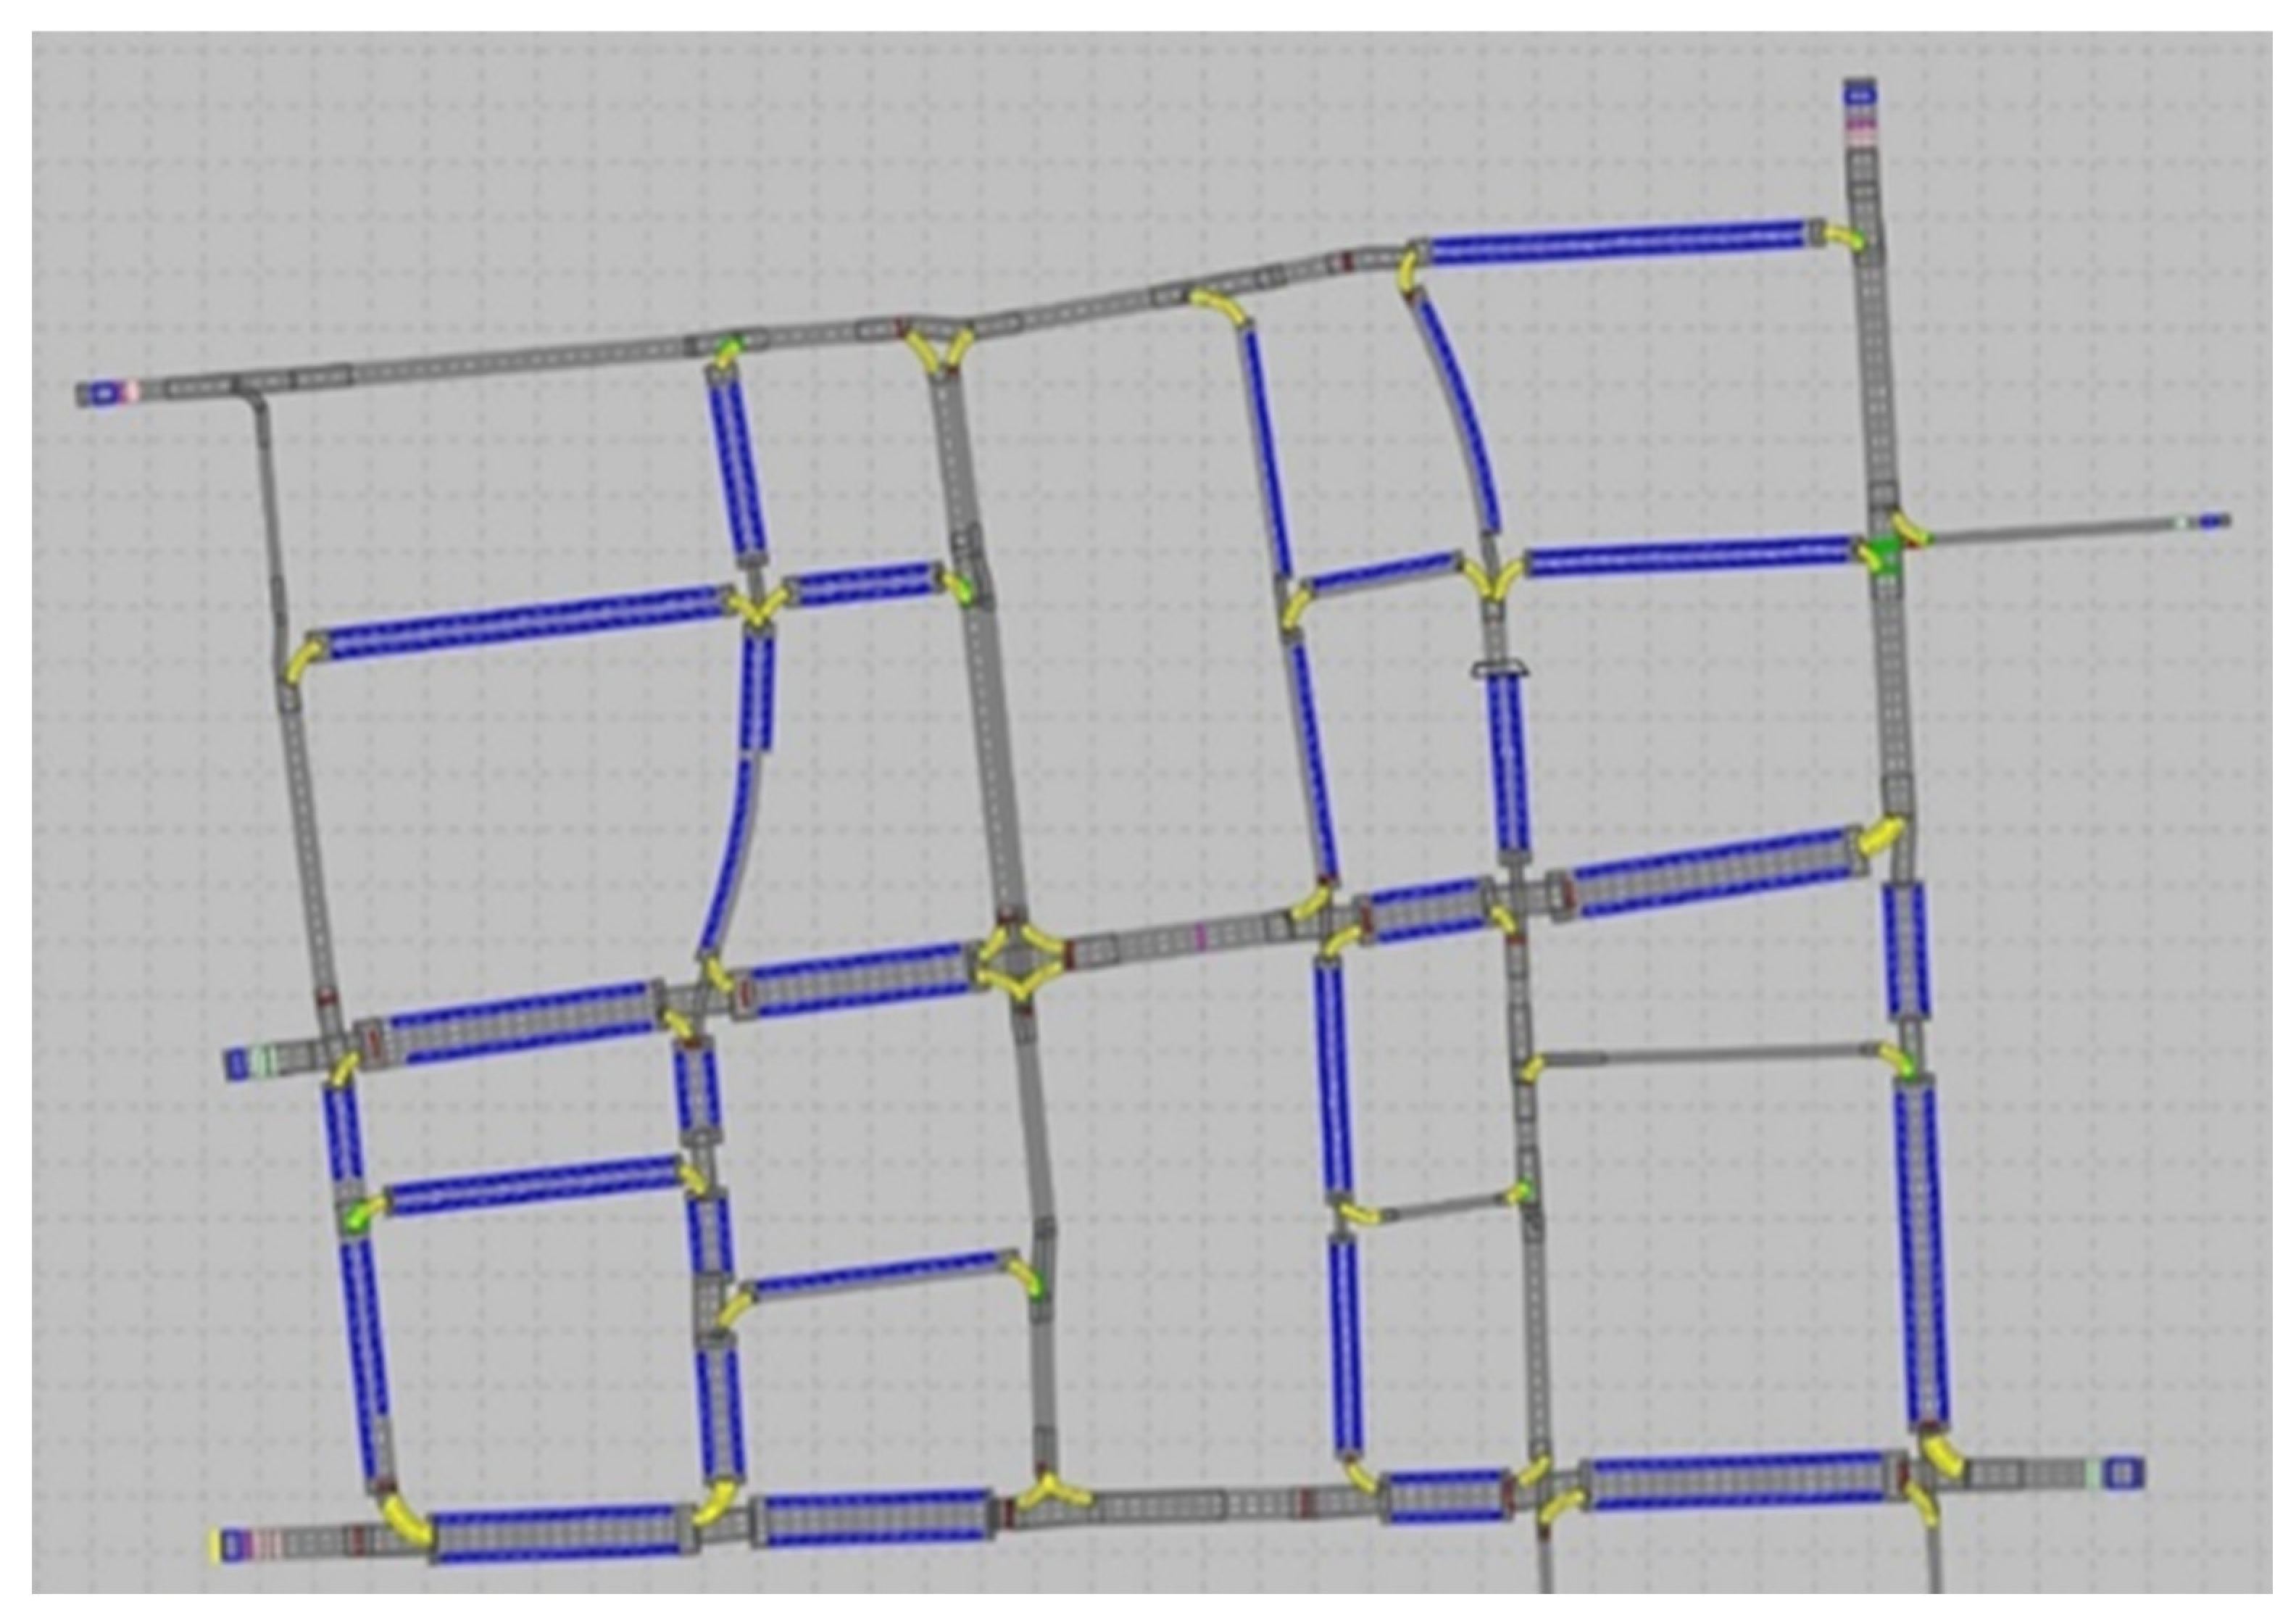
This study examines a linearized generalized model of an urban center, focusing on the city of Zagreb and the corresponding descriptive parameters. The city of Zagreb is characterized by a complex road network and heavy traffic flow. By accurately modeling this network in PTV Vissim, traffic conditions are simulated, and the parking scenario is evaluated (
Figure 5).
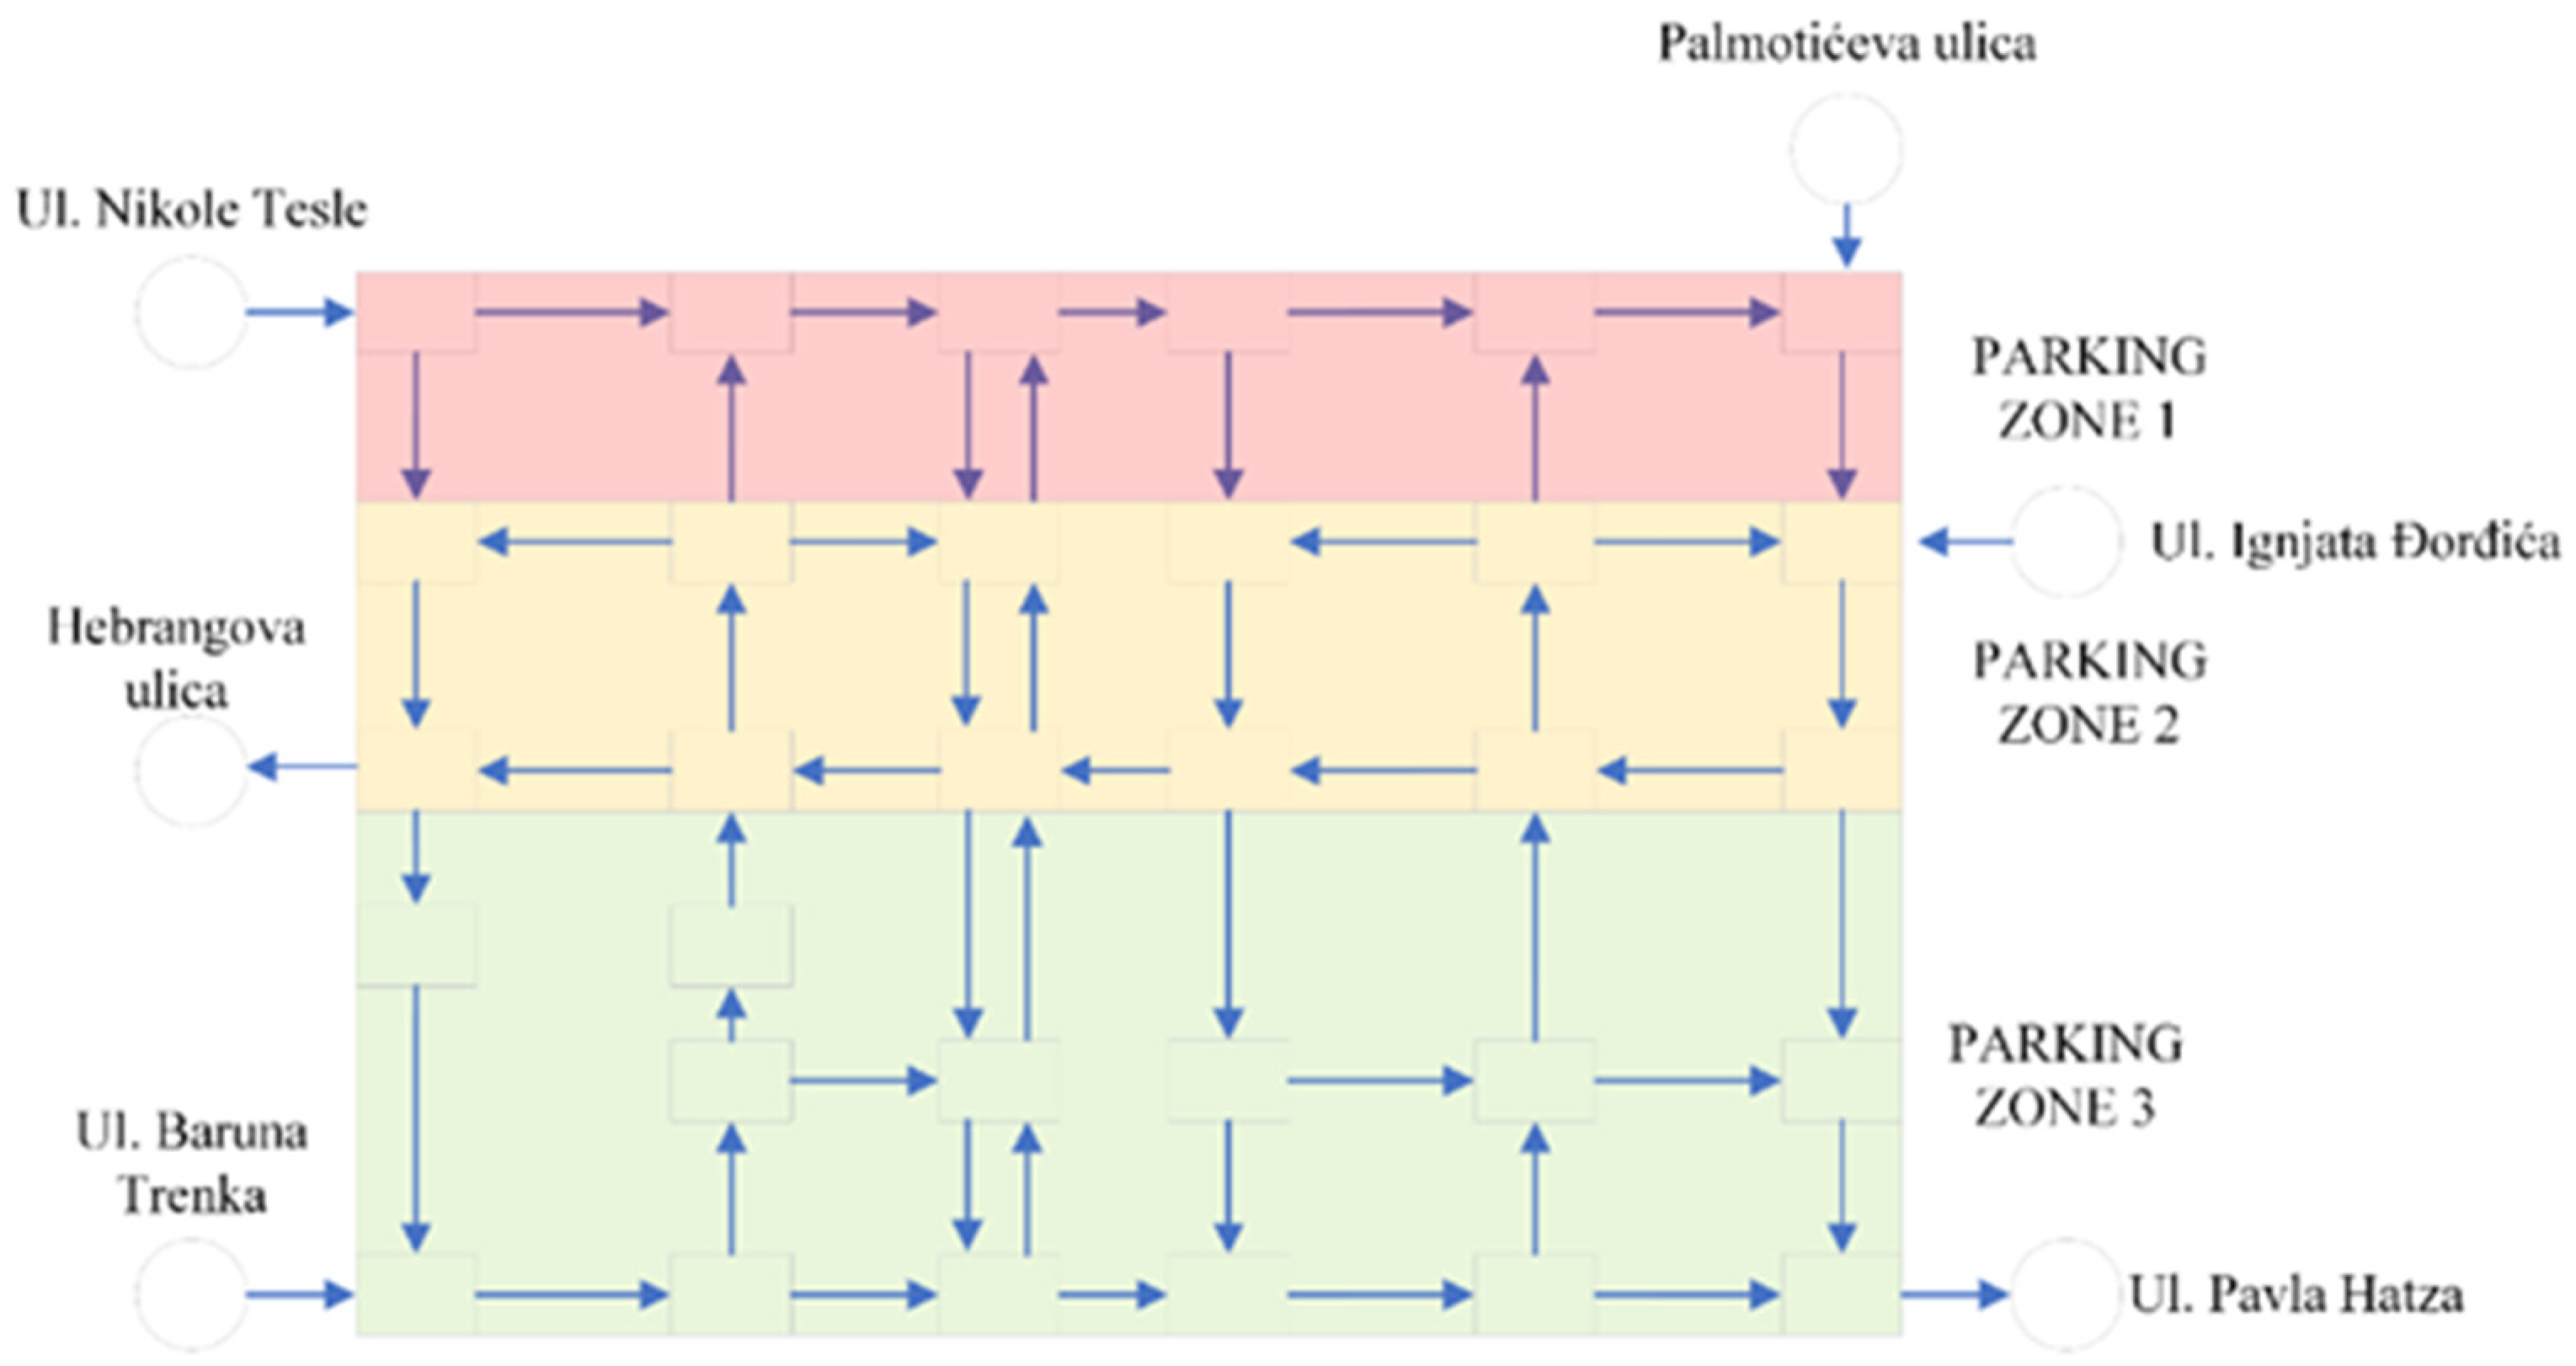
The traffic network in the study area consists of an extensive network of roads and intersections. It includes major thoroughfares, arterial roads, and local roads serving both residential and commercial areas. The network is designed to accommodate a significant volume of vehicles, including cars, buses, and motorbikes. Several major roads in the city center serve as important transport corridors. These roads connect different neighborhoods and major landmarks. There are several of them in the study area, such as Nikola Tesla, Hebrangova, and Branka Tenta streets (
Figure 6). They have several lanes, controlled intersections, and a high volume of traffic.
Routing with dynamic traffic assignment depends on certain conditions being met. For example, if all parking spaces in the destination parking lot are occupied, the system assigns a new parking space with an available parking lot with a new route. The effectiveness of this model is reflected in total travel time and total distance traveled.
Traffic volume is determined by the number of vehicles traveling the traffic section in a period of one hour according to the Poisson distribution. Considering the scope and method of the research in this work, the traffic distribution was made by using the dynamic routes option.
The duration of the simulation was set to 60 min to simulate the traffic load in an abstract city center. For vehicle types with a route guidance system, a route guidance interval of 60 s with an information arrival delay of 8 s was set. When creating the model, pedestrian traffic and traffic of other units were not considered, but only 2 vehicle compositions were set. The first composition was the basic traffic flow, while the second composition consisted of vehicles with a system to indicate available parking spaces. The basic traffic flow consisted of 98% cars, while trucks accounted for 2%. The Wiedemann 74 simulation model for directing vehicles to available parking spaces is used to better describe the behavior of drivers in inner cities.
Calibration was used to bring the model to the maximum traffic load to illustrate the negative effects of unnecessary circling in search of a parking space. Once the model was brought to an equilibrium state, the simulation was run for four scenarios. The first scenario refers to parking vehicles without a wayfinding system. The other scenarios refer to the parking of vehicles with a traffic guidance system with a percentage of 10%, 25%, and 50%.
The results of the first half-hour were not considered because the traffic network was not filled with vehicles. As a result, the network was unbalanced and could not provide reliable data. The percentage of vehicles that wanted to park in the designated zones was 25% of the total traffic. The traffic intersections are equipped with traffic signals and speed reduction when turning, while the right-of-way rule is applied at certain intersections. The reference speed is set at 50 km/h.
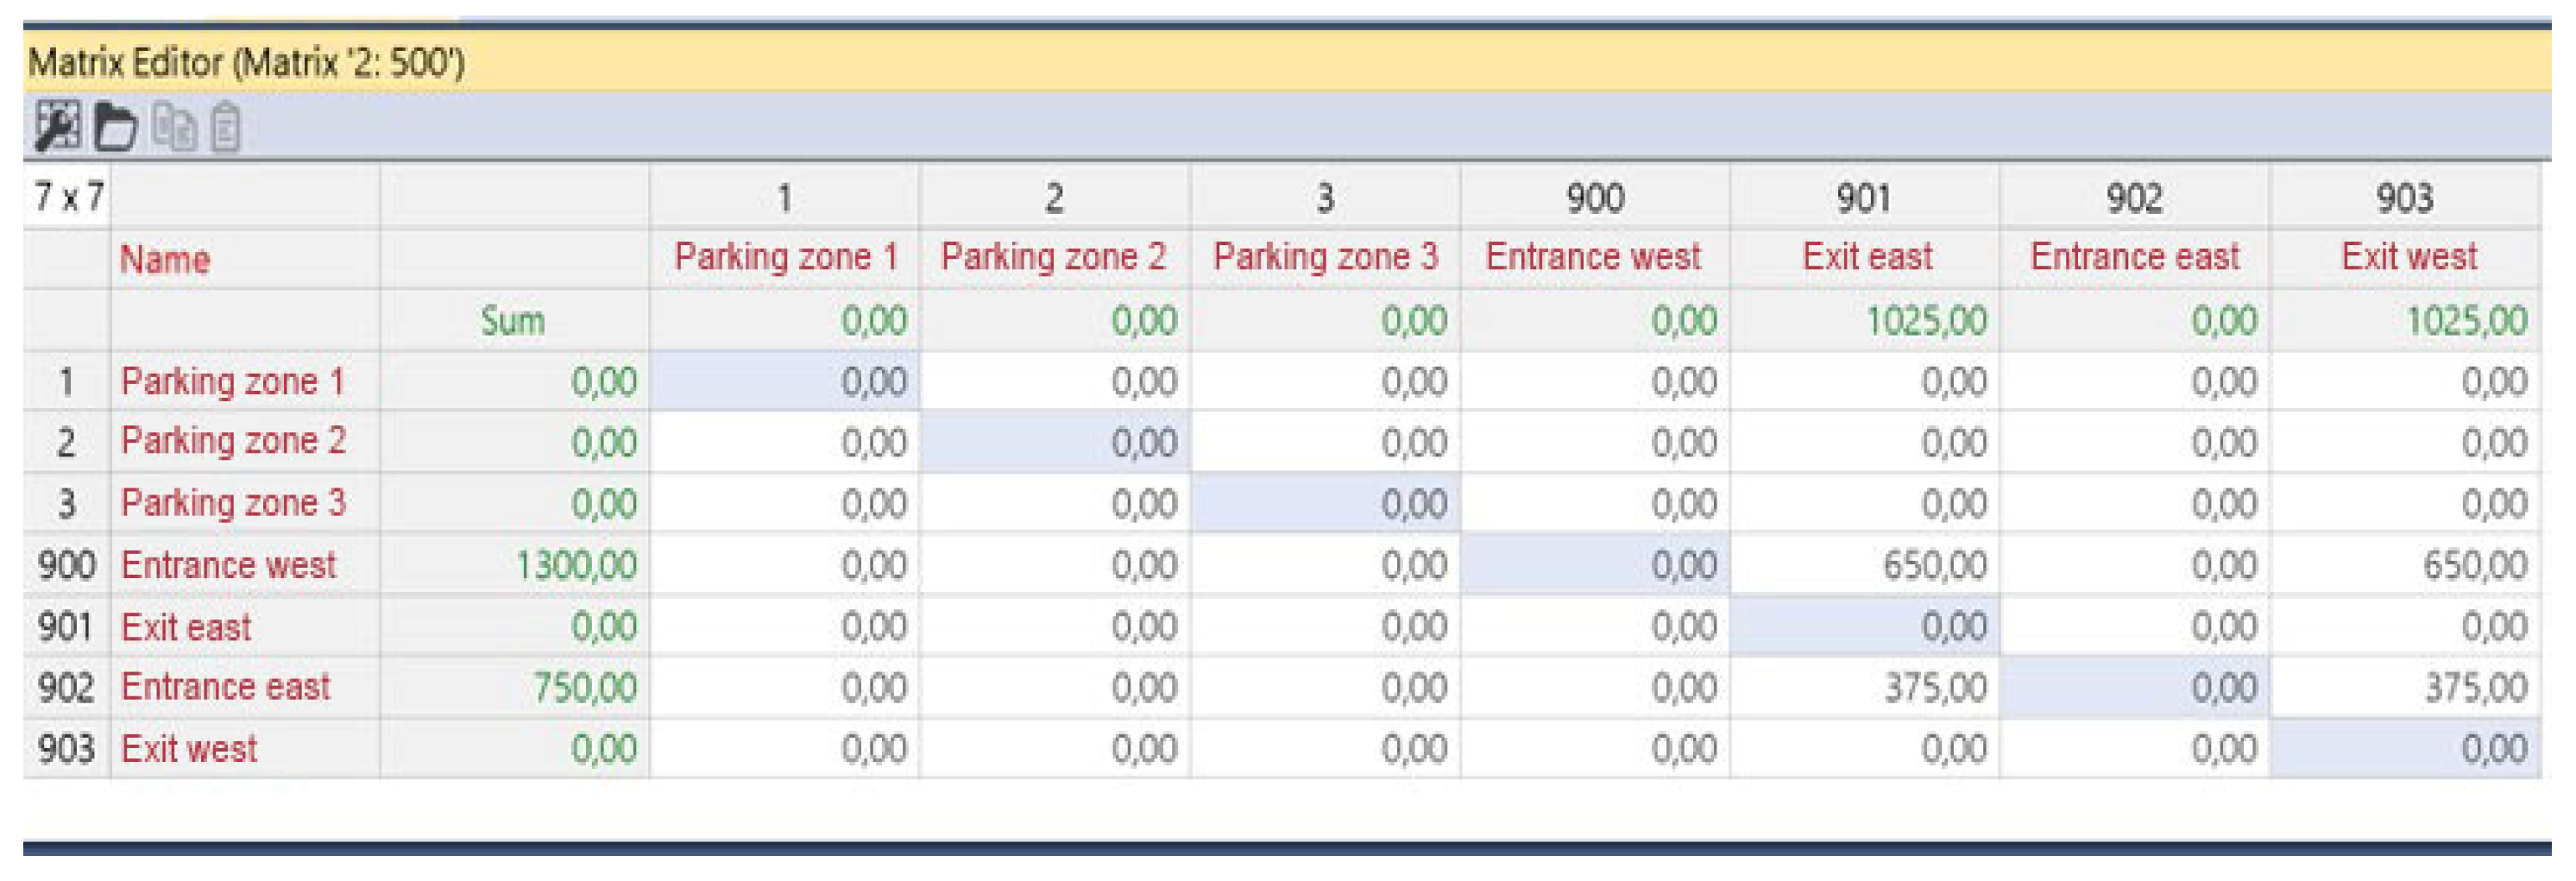
The OD matrix consists of three entries, exit, and parking zones. The access zone from the west has 1400 vehicles, while the access zone to the network from the east is set at 800 vehicles (
Figure 7). The time interval is set at 1 h. Considering the number of entries and exits from the traffic network, nine combinations of vehicle movements were considered in the analysis.
The parking zone has a total of 645 parking spaces, of which 89 parking spaces are located in the first zone, 254 parking spaces in the second zone, and 302 parking spaces in the third zone.
The point of interest was placed on the northern part of the traffic network, and the parking zones and the attractiveness of the parking lot were determined accordingly. The length of the parking spaces is 6 m. Moreover, there are no restrictions on the parking lots in terms of the price of collection, working hours, or parking duration.
In addition to creating the traffic network and determining the traffic behavior and vehicle type, it was necessary to define the key parameters of the dynamic mapping. The evaluation interval is set to 600 s. The costs are stored using exponential smoothing with a smoothing factor of 0.2. The maximum number of routes per parking lot route is 999. Routes whose total cost is higher than 75% of the best route are discarded. The destination parking decision is made with a logit scaling factor of 1.5, while the route selection is determined with a stochastic assignment (Kirchhoff exponent) of 0.2. In addition, the option of correcting for overlapping paths was used, while bypass paths that were 2.5 times larger than the best path were discarded. The percentage of paths that must converge to meet the convergence criterion was set to 95%.
6. Evaluation of the Simulation Results
The evaluation of the simulation results includes 9 observed routes on which criteria tests were performed: travel time and distance traveled.
Table 1 shows the statistical indicators of total travel time for vehicles without route guidance systems.
Table 2,
Table 3 and
Table 4 present statistical indicators for vehicles equipped with guidance systems at different percentages (10%, 25%, and 50%) of the total number of vehicles in the search for parking. The tables contain data for nine different directions (labeled 1 through 9) with the associated number of vehicles, time spent in the network, minimum and maximum travel time, and standard deviation. The last row of each table shows the total number of vehicles and the time spent in the network in seconds.
A comparison of the data in
Table 1,
Table 2,
Table 3 and
Table 4 shows that the total time spent in the simulation model network varied depending on the proportion of vehicles with a navigation system. Vehicles without navigation systems spent the most time online, as shown in
Table 1, while vehicles with 50% navigation systems spent the least time online, as shown in
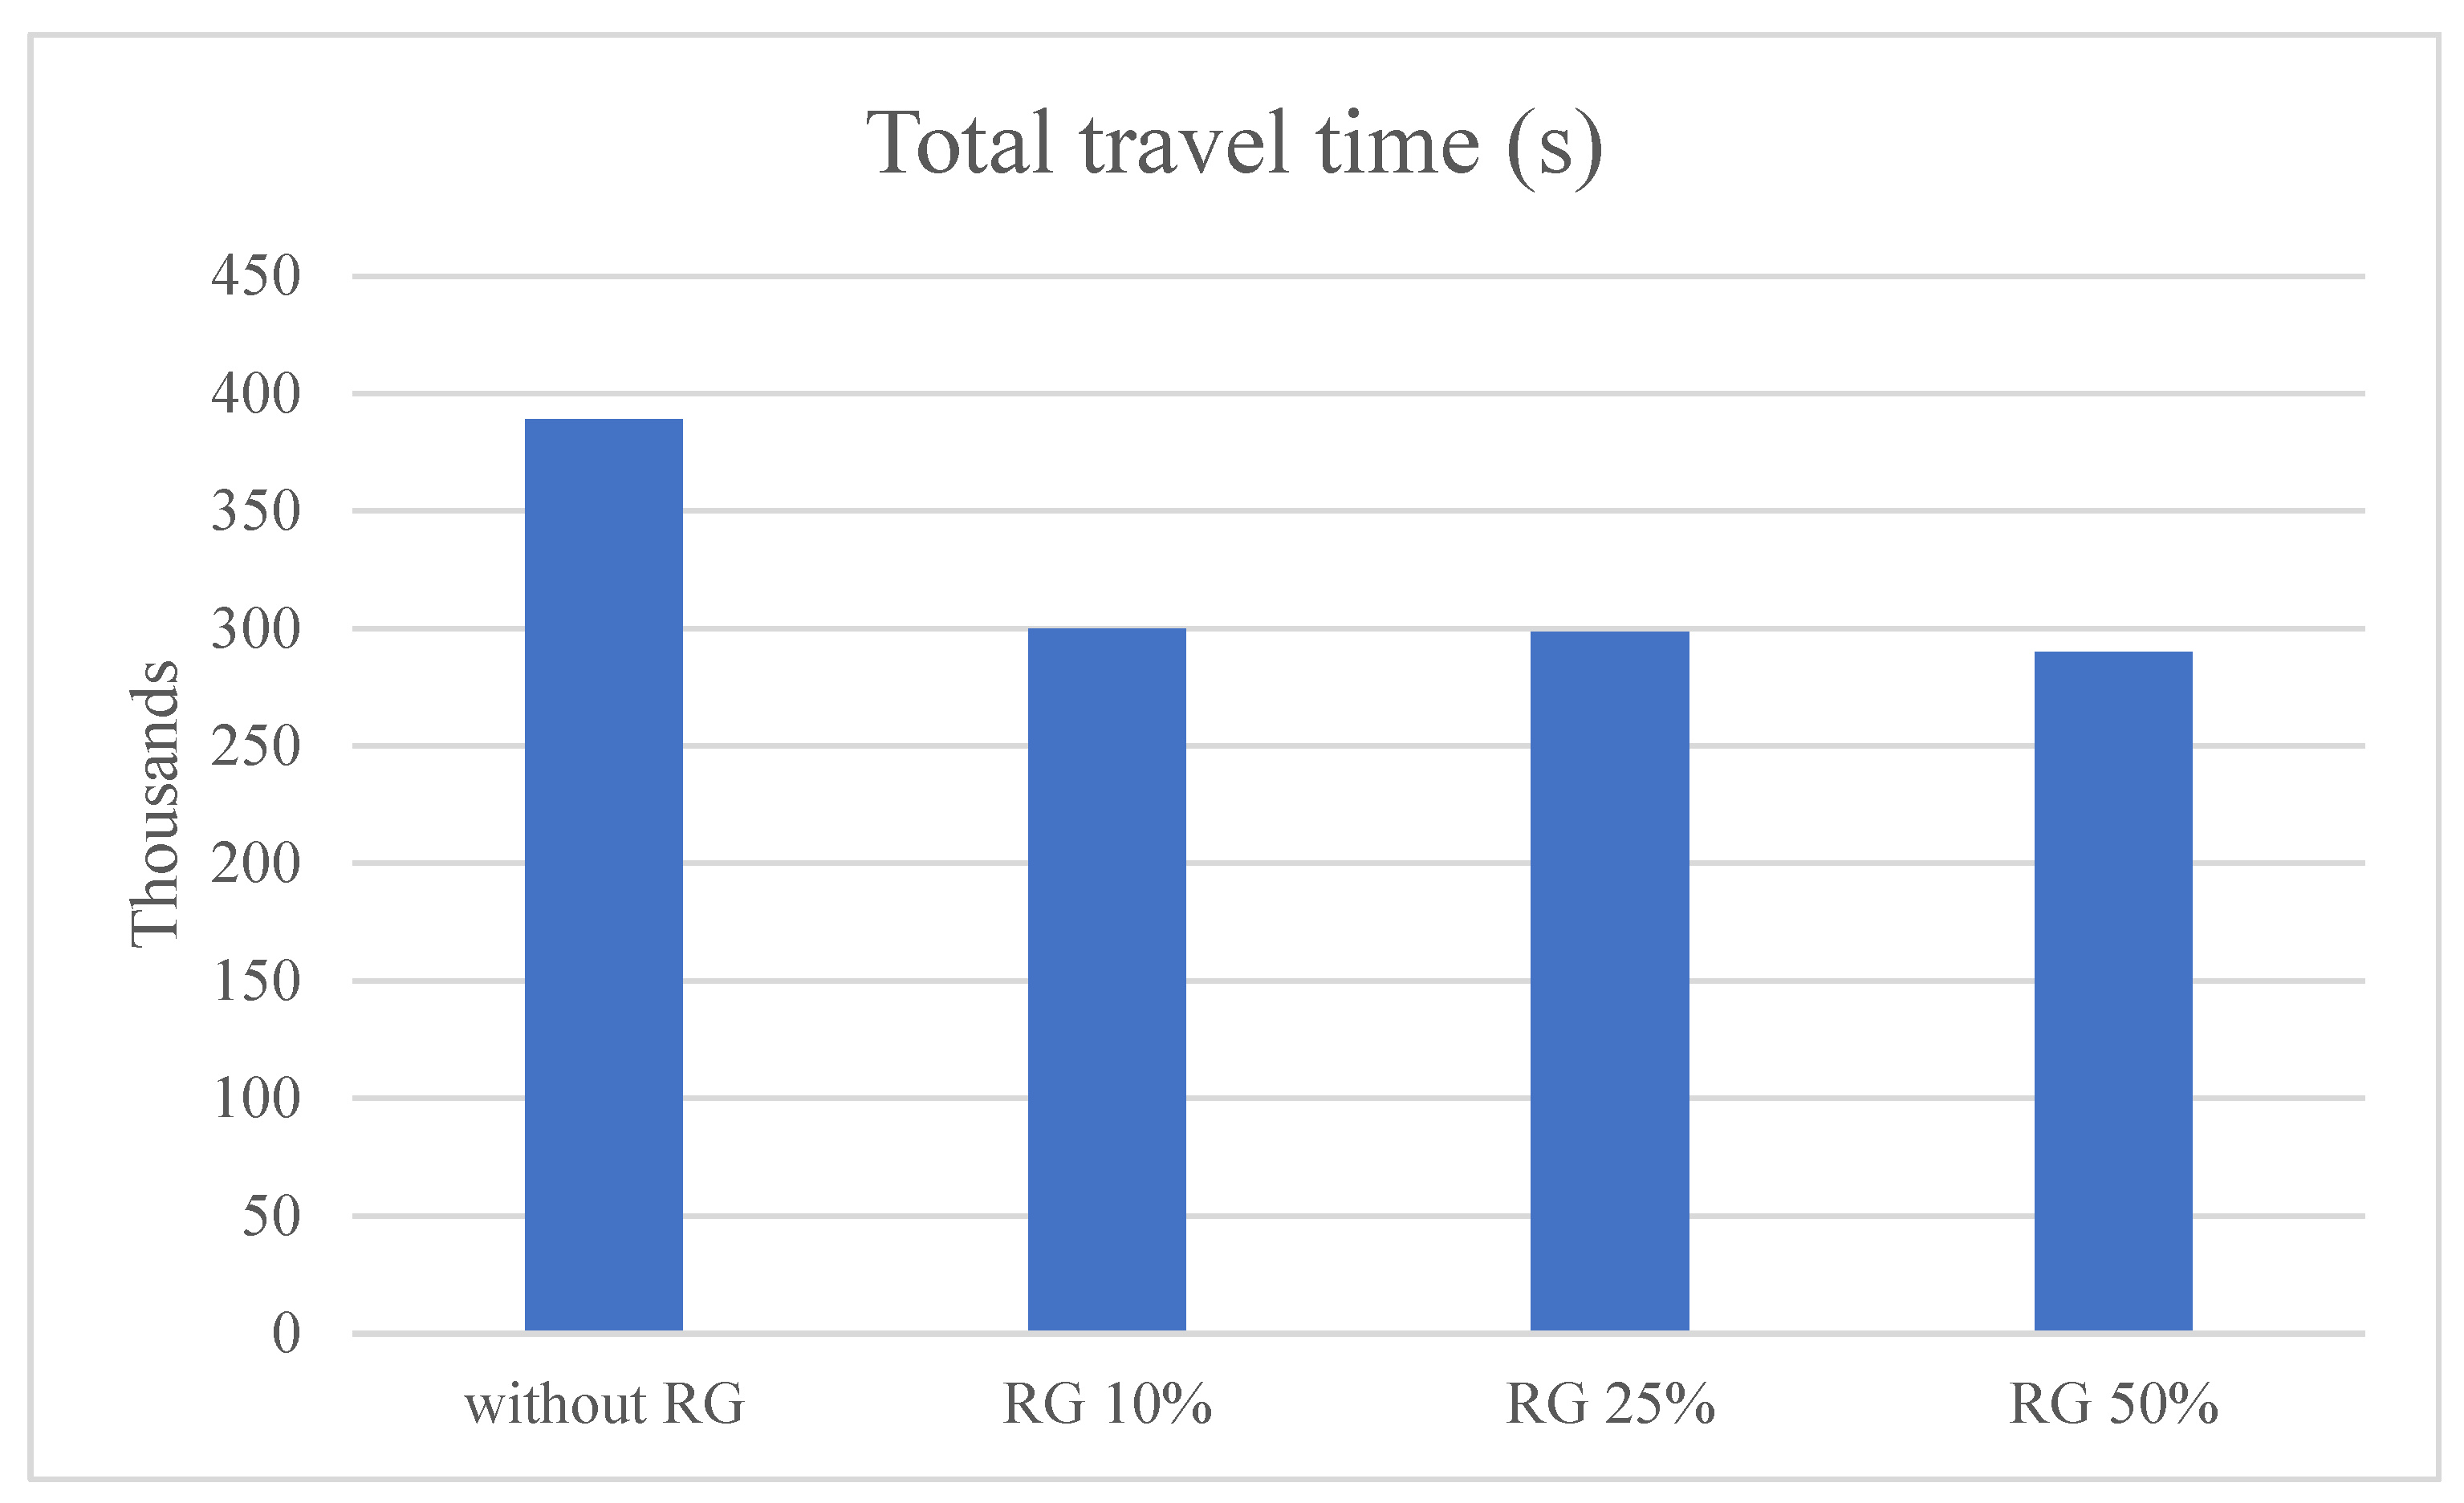
Table 4. The reduction in total travel time has an indirect effect on reducing congestion in urban areas. It also affects reducing fuel consumption and pollutant emissions, increasing road safety, reducing noise and stress, and ultimately reducing travel costs.
Figure 8 shows the efficiency of a referral system based on the proportion of RG vehicles compared to the total travel time. The x-axis may represent the proportion of RG vehicles, while the y-axis represents the efficiency of the referral system in terms of total travel time.
Figure 8 shows that vehicles without RG spend the most time on their journeys compared to vehicles that use RG.
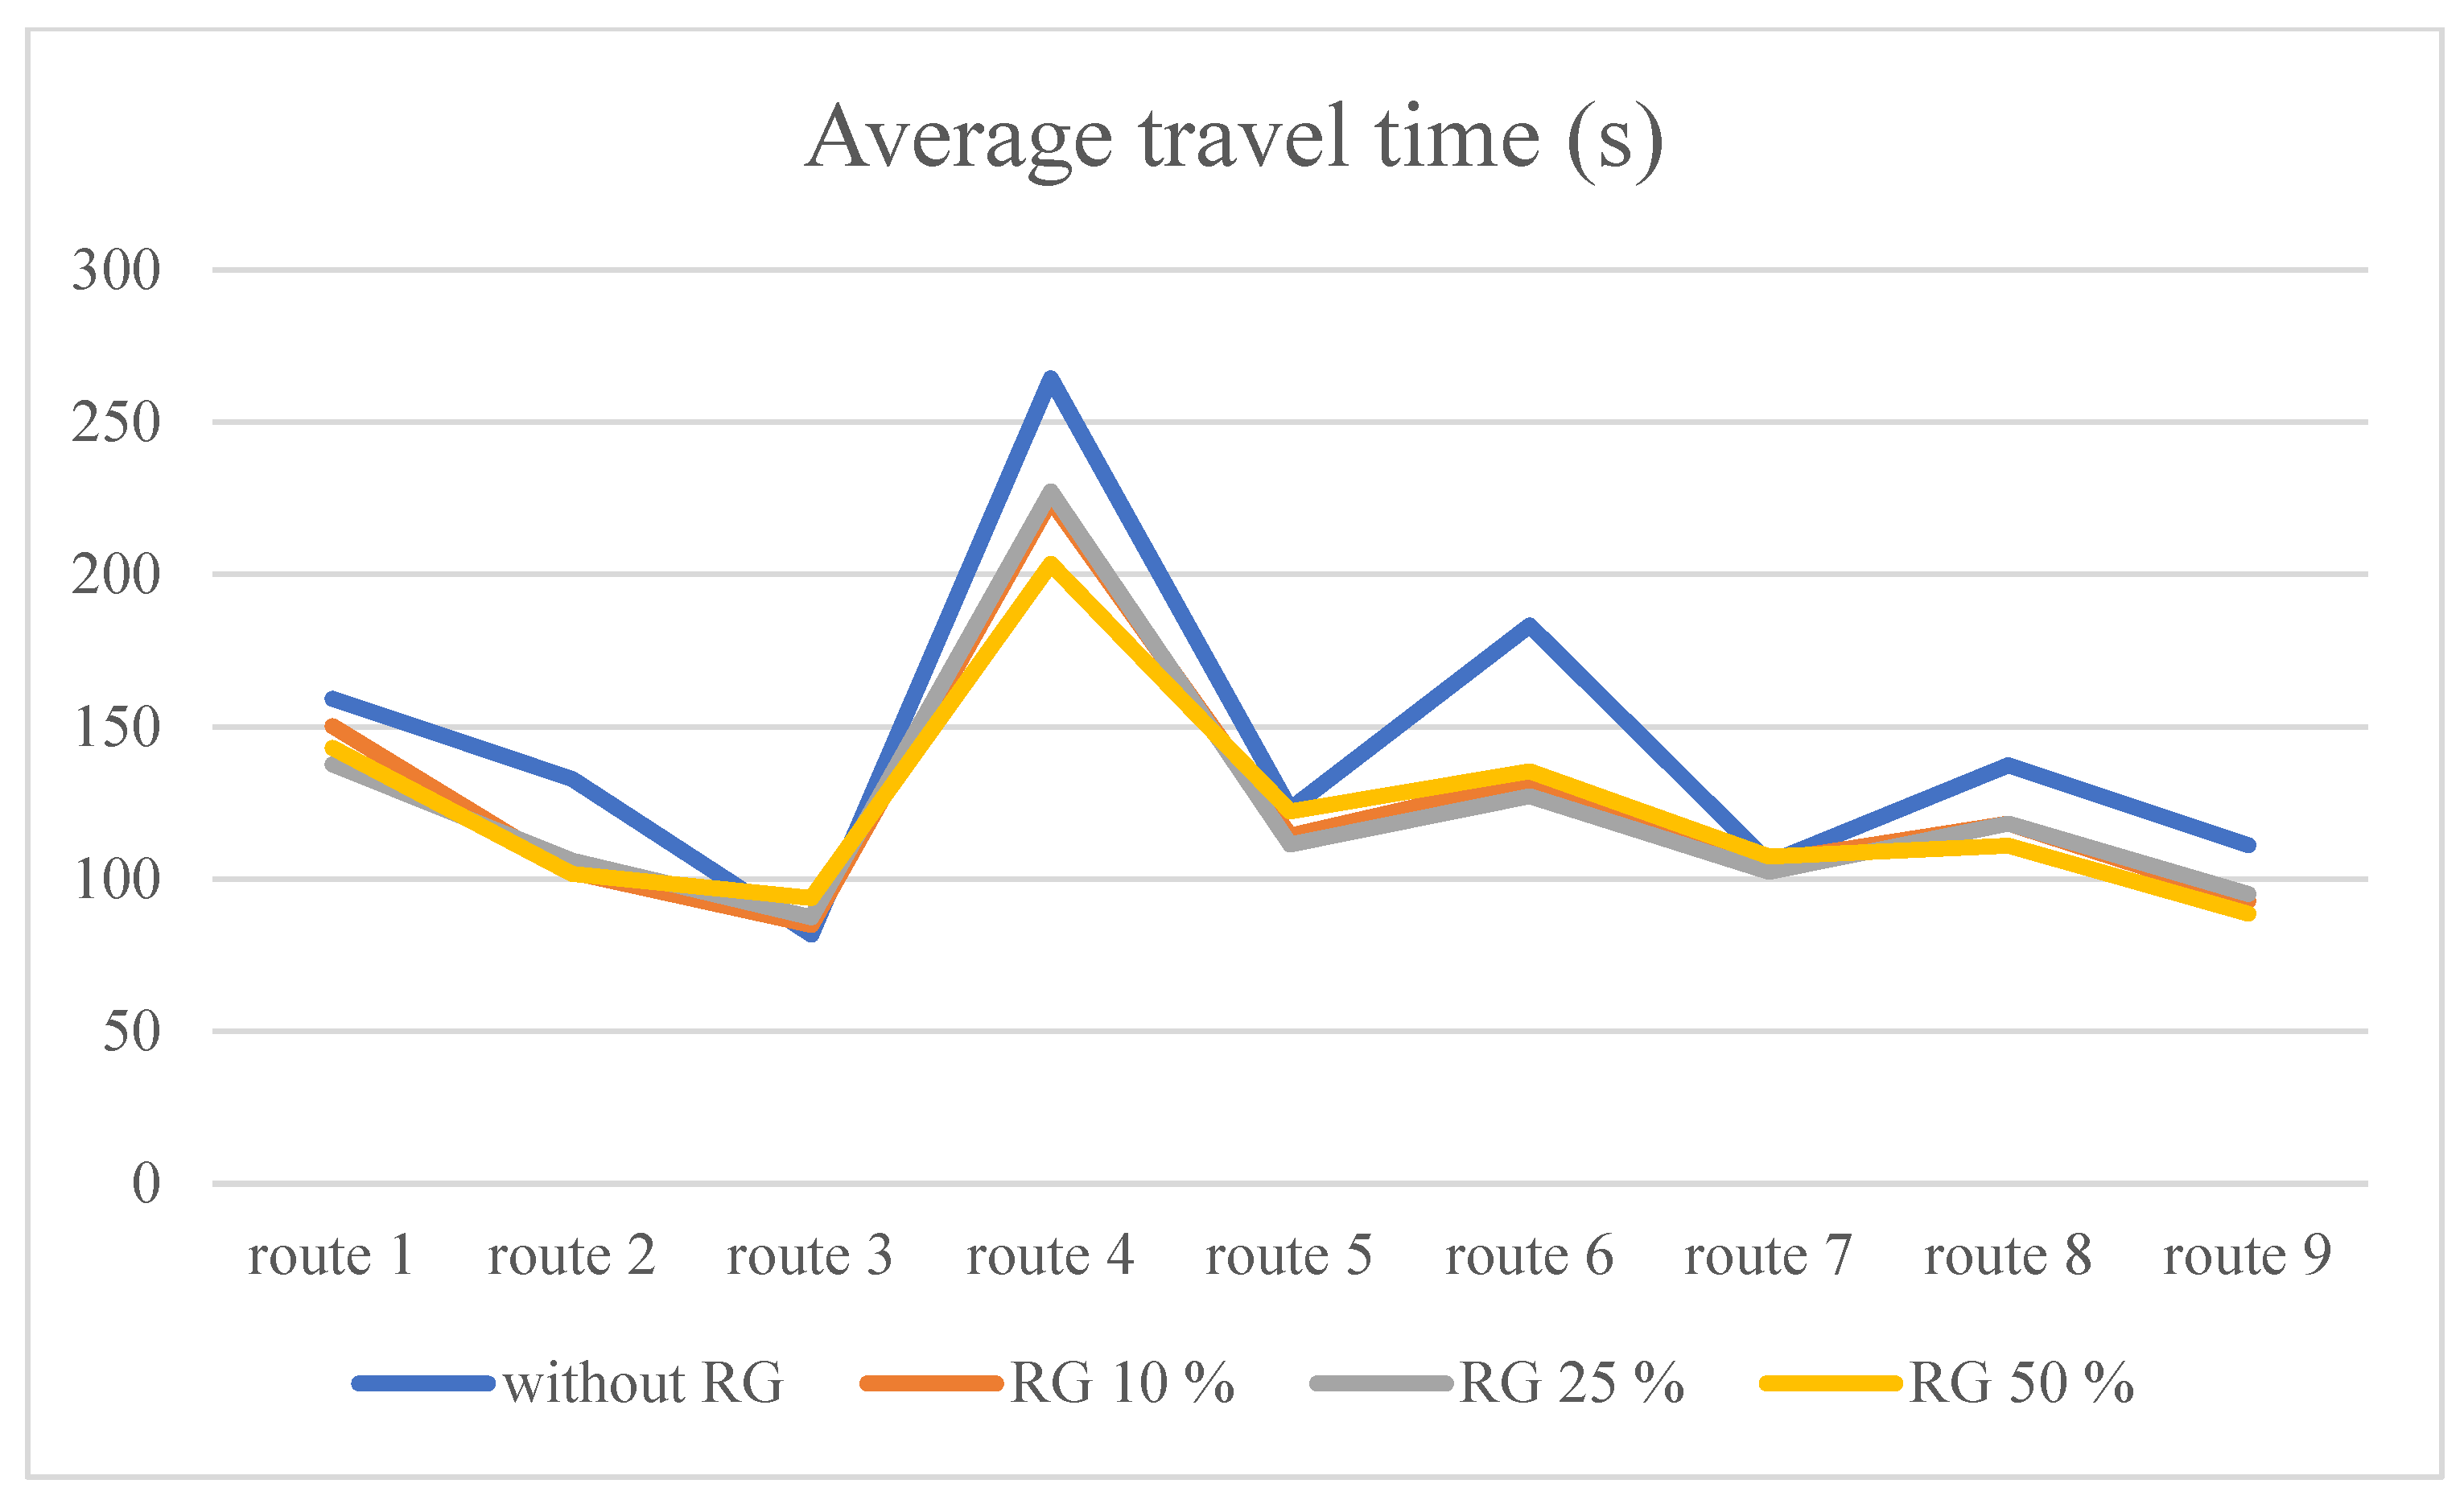
Figure 9 shows the travel times for different traffic directions. The X-axis represents the traffic routes, labeled as 1 through 9. The Y-axis shows the travel time in seconds. Each bar on this figure (graph) represents the travel time for a particular traffic route. The bars are color coded to distinguish between different types of vehicles, including vehicles without navigation systems, vehicles with 10%, vehicles with 25% navigation systems, and vehicles with 50% navigation systems.
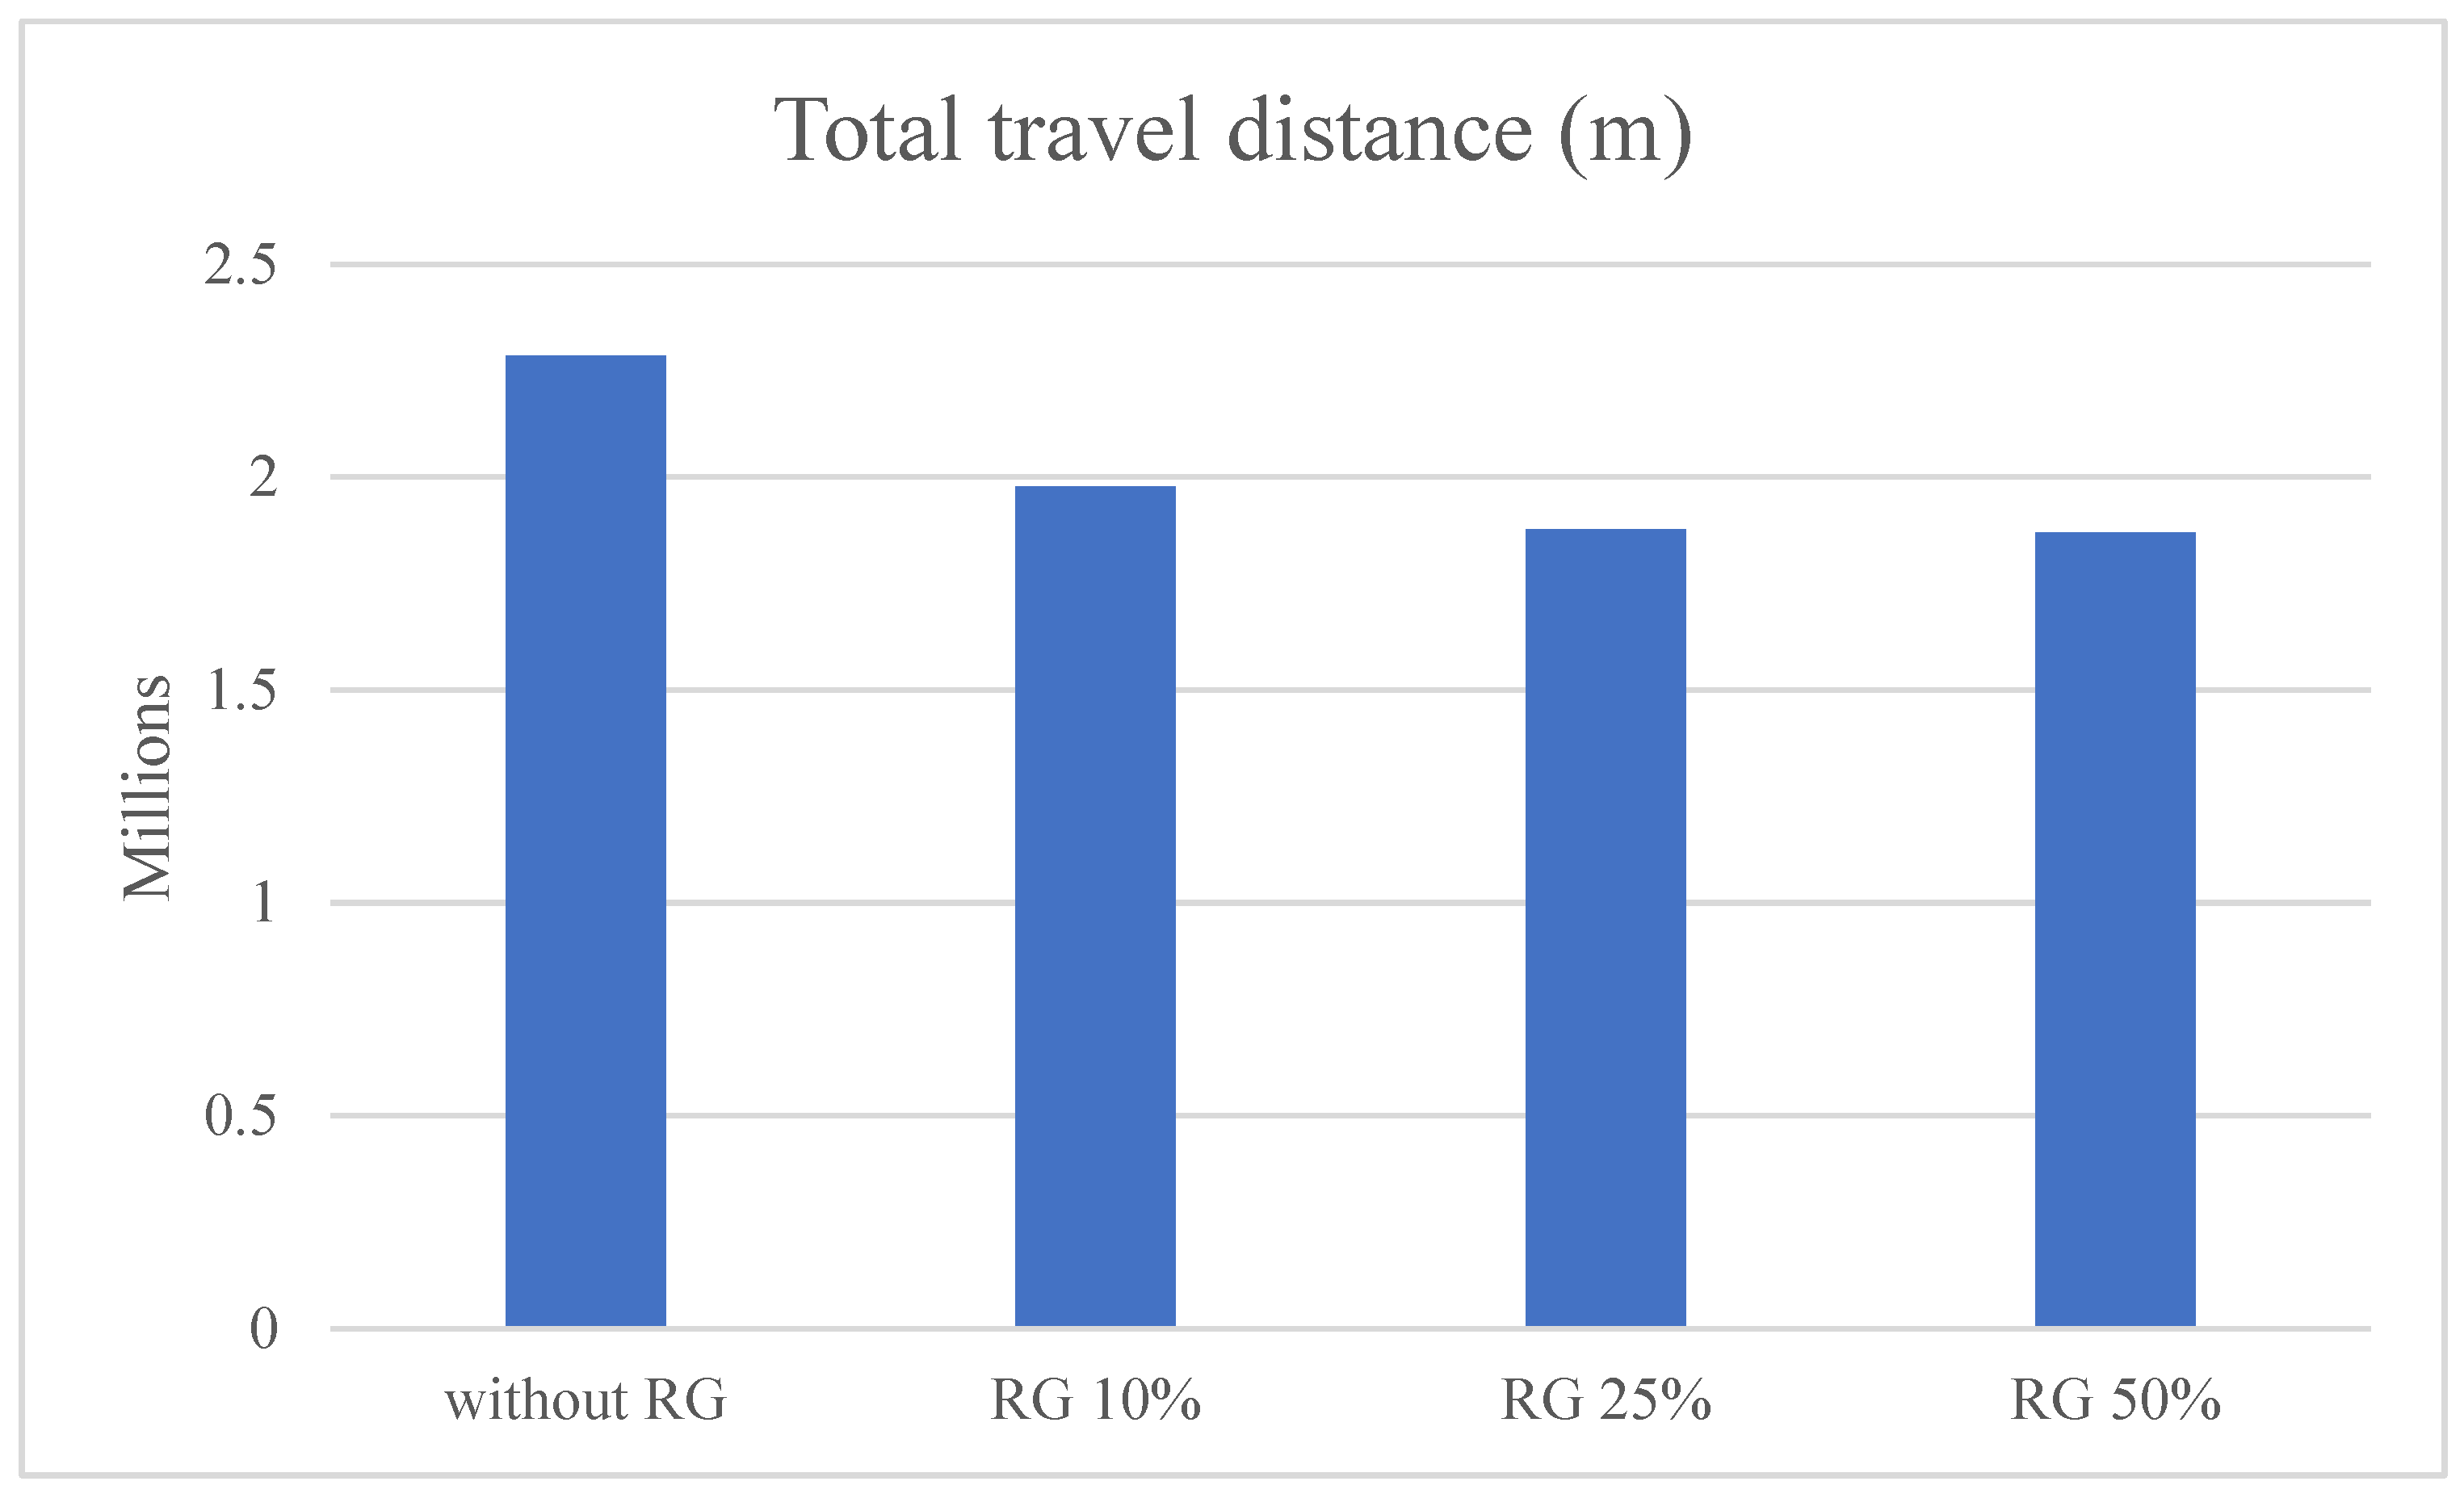
Figure 10 shows a comparison of the efficiency of guidance systems based on the proportion of vehicles with and without RG concerning the total distance traveled.
Figure 10 has two lines representing two different types of guidance systems. The x-axis shows the proportion of vehicles with and without RG, while the y-axis shows the efficiency of the system in terms of distance traveled. The efficiency of the guidance system is measured in meters (m).
Figure 10 shows that vehicles with a higher proportion of RG travel a lesser distance than vehicles without RG or vehicles with a lower proportion of RG.
The small difference between 25% and 50% parking regulation is due to parking demand and the distribution of departures from parking lots (vehicles remaining parked). Vehicles entering the network can be categorized as those passing through the network and those intending to park, but there must be an available parking space at that moment (in the case of parking regulation), or they will leave the zone (if they know such a space does not exist). Ultimately, these vehicles can be considered as the first category passing through the zone, regardless of the level of parking regulation. Changing the initial parameters could yield different values, but our aim was to achieve a situation as realistic as possible, reflecting the current conditions in the city of Zagreb.
Based on the information provided, it seems that an abstract model was used to analyze the travel time and distance traveled by vehicles equipped with a guidance system. The results of the model indicate that the travel time between these vehicles varies between 22% and 25%, meaning that vehicles with a guidance system can navigate parking areas more efficiently and therefore spend less time traveling. Moreover, according to the model, there is a reduction in the overall distance traveled, ranging from 13% to 18%. This finding holds significant implications for cost savings, encompassing reduced fuel consumption and vehicle maintenance expenses, while also positively affecting the environment and enhancing traffic safety.
Overall, the findings suggest that implementing guidance systems in vehicles can result in significant benefits in terms of reducing travel time, distance traveled, and risk of a traffic collision. This could be particularly beneficial in congested urban areas where parking can be a major challenge, and where reducing travel time and distance traveled could have a positive impact on traffic flow and overall efficiency.
7. Discussion
Parking guidance systems have the potential to significantly improve traffic efficiency and reduce congestion in urban areas. A cooperative approach using real-time data from other vehicles can efficiently navigate vehicles to available parking spots. This could be more efficient than the standard parking method because it can consider the current availability of parking spots across a city. Real-time parking availability information can also help drivers find a parking spot more quickly and avoid unnecessary circling. These data can be collected from various sources, such as sensors in parking lots, satellite data, or data from other vehicles. Integrating parking systems with other traffic management systems can further improve traffic flow. For instance, parking systems can be integrated with traffic signal control systems to ensure that vehicles are directed to parking spots closest to their desired destination. Promoting the use of parking systems can encourage drivers to utilize them more frequently. This can be achieved by creating user-friendly mobile applications for smartphones that provide real-time guidance to parking spots or offering incentives to drivers who use parking systems. However, these approaches are more complex and expensive to implement, and they are also sensitive to data accuracy and driver adoption. The implementation can be complex and costly because it requires integrating various systems and technologies. Real-time parking availability information accuracy can be low if data is not collected accurately and promptly. Drivers may be reluctant to utilize parking systems if they are not user-friendly or if they do not provide clear benefits. Despite these challenges, these approaches have the potential to improve traffic efficiency significantly and alleviate congestion in urban areas. To successfully implement these approaches, it is necessary to consider the challenges and take steps to mitigate them.
Here are some examples of how these approaches can be applied:
Cooperative approach: Vehicles can exchange parking availability data using a mobile app or other system.
Real-time parking availability information: Sensors in parking lots can be used to collect data on parking availability. This information can be presented to drivers via mobile apps or signage on the road.
Integration with other traffic management systems: Parking systems can be integrated with traffic signal control systems to ensure that vehicles are routed to parking spots closest to their destination.
Promotion of parking system usage: Cities can develop user-friendly mobile apps for smartphones that provide real-time guidance to parking spots. They can also offer incentives to drivers who use parking systems, such as free parking hours or discounts on public transportation.
8. Conclusions
In conclusion, the exceptional importance of developing innovative approaches to address the challenges related to finding available parking spaces in urban areas is underscored by this paper. Through an analysis of the effectiveness of a cooperative approach to guiding vehicles to available parking spaces compared to the traditional model of searching for parking spaces, key advantages of integrating intelligent transportation systems into urban environments are highlighted.
The focus is on Intelligent Cooperative Sensing for Improved Traffic Efficiency (ICSI) in collaboration with a parking guidance system, emphasizing its potential to enhance traffic efficiency and parking guidance in urban settings. By employing advanced sensing technologies, cooperative communication, and intelligent data analysis, ICSI collects real-time data and dynamically adjusts routing strategies, provides dynamic parking guidance, and optimizes resource allocation. This integrated approach shows great promise in revolutionizing urban mobility and effectively addressing the challenges of traffic congestion and parking difficulties.
Driver-centric personalizing route guidance in urban areas is of paramount importance for several reasons. As cities grow and become more congested, the need for efficient and personalized navigation solutions becomes increasingly critical. It is vital for addressing the complex challenges of urban mobility. It not only benefits individual drivers but also has far-reaching positive effects on traffic management, environmental sustainability, public safety, and the overall quality of life in urban areas. The personalization approach in driver navigation contributes to safer, more efficient, and less stressful journeys. It aligns navigation systems with individual preferences and needs, making driving more enjoyable and user centric. As technology continues to advance, personalized navigation will likely become even more integral to the future of transportation.
The efficiency of the cooperative approach in reducing travel time and distance in the search for parking spaces has been confirmed by the research results. Existing systems, especially for on-street parking, are reaching their limits, necessitating a cooperative approach that utilizes advanced sensors and communication technologies. The key advantage of using a route guidance system for parking is a significant reduction in travel time. Drivers can simply follow the system’s directions to an available parking space instead of driving around the block in search of one, saving time and reducing the frustration and stress associated with finding parking. Moreover, because the system is constantly updated in real time, drivers can be assured of the accuracy and currency of the provided information.
The proposed model encompasses all available parking capacities in a given area and utilizes a cooperative approach to select optimal routes and corresponding parking spaces. The research results confirm the hypothesis that the proposed system effectively reduces travel time and distance traveled. The dynamic simulation model of the study confirms the system’s effectiveness in reducing the negative impact of traffic congestion and improving overall traffic safety. The cooperative approach of the system, along with the integration of collected data and sensory information, enables the proposal of optimal solutions to interested users. The research contribution includes testing and verification of an advanced model for finding available parking spaces using a route guidance system.
The proposed solution of guiding vehicles to available parking spaces using a cooperative approach has the potential to be applied in practice. The use of advanced sensing technologies, cooperative communication, and intelligent data analysis allows the system to collect and process real-time data on parking availability, traffic conditions, and driver preferences. This information is then used to dynamically adjust routing strategies, provide real-time parking guidance, and optimize resource allocation. The system has been shown to be effective in reducing travel time, distance, and fuel consumption, while also improving traffic flow and safety.
Overall, the proposed solution is a promising approach to addressing the challenges of finding available parking spaces in urban areas. The system has the potential to improve traffic efficiency, reduce congestion, and improve the overall quality of life in urban areas. As the development of ITS continues, the proposed solution is likely to become even more widely adopted.
With the expected increase in the development of telematics systems in vehicles, the proposed system could potentially solve some congestion and parking problems in urban centers. As more cities grow, these systems are likely to become even more widespread and essential for drivers in urban areas.
In the final analysis, this research contributes valuable insights into the cooperative approach to guiding vehicles to available parking spaces and the broader context of route guidance personalization in urban environments. The obtained results underscore the potential of intelligent transportation systems to transform urban mobility, improve traffic efficiency, and enhance the overall urban quality of life.


